Abstract
The need for effective and reliable damage detection and localization systems is growing in several engineering fields, in particular in water impact problems characterized by impulsive loading conditions, high amplitude vibrations and large local deformations. In this paper, we further develop the approach presented in previous works to detect damage of water-impacting structures. Specifically, we provide a set of experimental tests on a flexible plastic cylinder impacting the water after a 50 cm free fall. The cylindrical specimen is artificially damaged in a known position. Strain measurements are performed through a set of nine fiber Bragg gratings distributed along the circumference of a cylinder section. We show that strain sensors can be used as reference sensors, for structure displacements reconstruction, and control sensors, for damage detection purposes, and the computation of the difference between measured and expected deformation may allow damage detection. Moreover, we investigate how exchanging control and reference sensors in the same sensor arrangement affect damage detection and localization.
1. Introduction
Fluid structure interaction (FSI) in free surface fluids is an important field of study in naval, civil and mechanical engineering and a large scientific literature is available on this topic [1,2,3,4,5,6,7,8,9,10,11,12,13,14,15,16,17,18]. Among the others, one relevant problem in this field is represented by so-called hull slamming, occurring when solid bodies impact the free surface of a fluid, usually water: large forces emerge for short time durations inducing vibrations and, possibly, structural damage, from local buckling and deformations to structural breaks [1,2,3]. Therefore, the understanding of this phenomenon is of crucial importance for the design of all those structures that interact with the free surface of the water, such as ships (which are forced to lower their speed to reduce or avoid the effects of hull slamming), marine structures, aircraft fuselages, rockets [1,5,14]. Moreover, the development of monitoring systems able to measure impulsive forces or consequent damages is of paramount importance for many engineering structures (e.g., ships, vessel, hydraulic structures) and still far from being industrialized [19].
Although several numerical and experimental studies have been carried out in this field, the evolution of such impulsive loading is not completely understood and the monitoring of the possible damage is a complex task, largely unexplored, so far.
The development of a sensing technology for the live monitoring of structures undergoing impact events has been investigated by some of the authors in previous papers [17,18,19,20]. An experimental methodology for deformed shape reconstruction in compliant bodies impacting a free surface has been developed by measuring strain in discrete locations through distributed fiber Bragg grating (FBG) strain measurements [17,18,19]. Moreover, a new framework for applying this method for damage detection has been proposed in [20], where a numerical study considering different delamination damages affecting a cylindrical body has been performed. In [21,22,23] subsequent numerical studies have been performed on different body shapes. The results obtained demonstrate the potential of the methodology for identifying local damages, including those related to localized, repeated slamming events, such as in the bow bulb, or structural failures that may happen during a cruise (e.g., due to collisions and/or cargo misplacement in the presence of bad weather/sea conditions) and may become worse because of hull slamming.
In this paper we focus on the development of a tool for detecting structural damage that modifies modal shapes, applicable to any problem in which time-variant strains can be measured. Specifically, we present a set of experimental tests and comment on the possible application of FBGs to detect damages in compliant cylindrical structures. Cylinder impact on a water free surface has been extensively studied in literature numerically, analytically and experimentally [24,25,26,27,28,29,30,31,32] with the emphasis on vertical drag and evolution of the free surface, including the pile-up. However, only a few papers are focused on flexible cylinders and none on damage detection.
Here, we further develop the approach proposed in [20] using reference sensors to reconstruct the displacements of the structures and control sensors in order to evaluate the difference between measured and expected deformation (i.e., in the undamaged healthy state). We focus on the possibility of changing the choice of reference and control sensors in the analysis layout within the same FBGs network configuration and on the effect of the chosen layout on damage detection and localization.
2. Experimental Setup
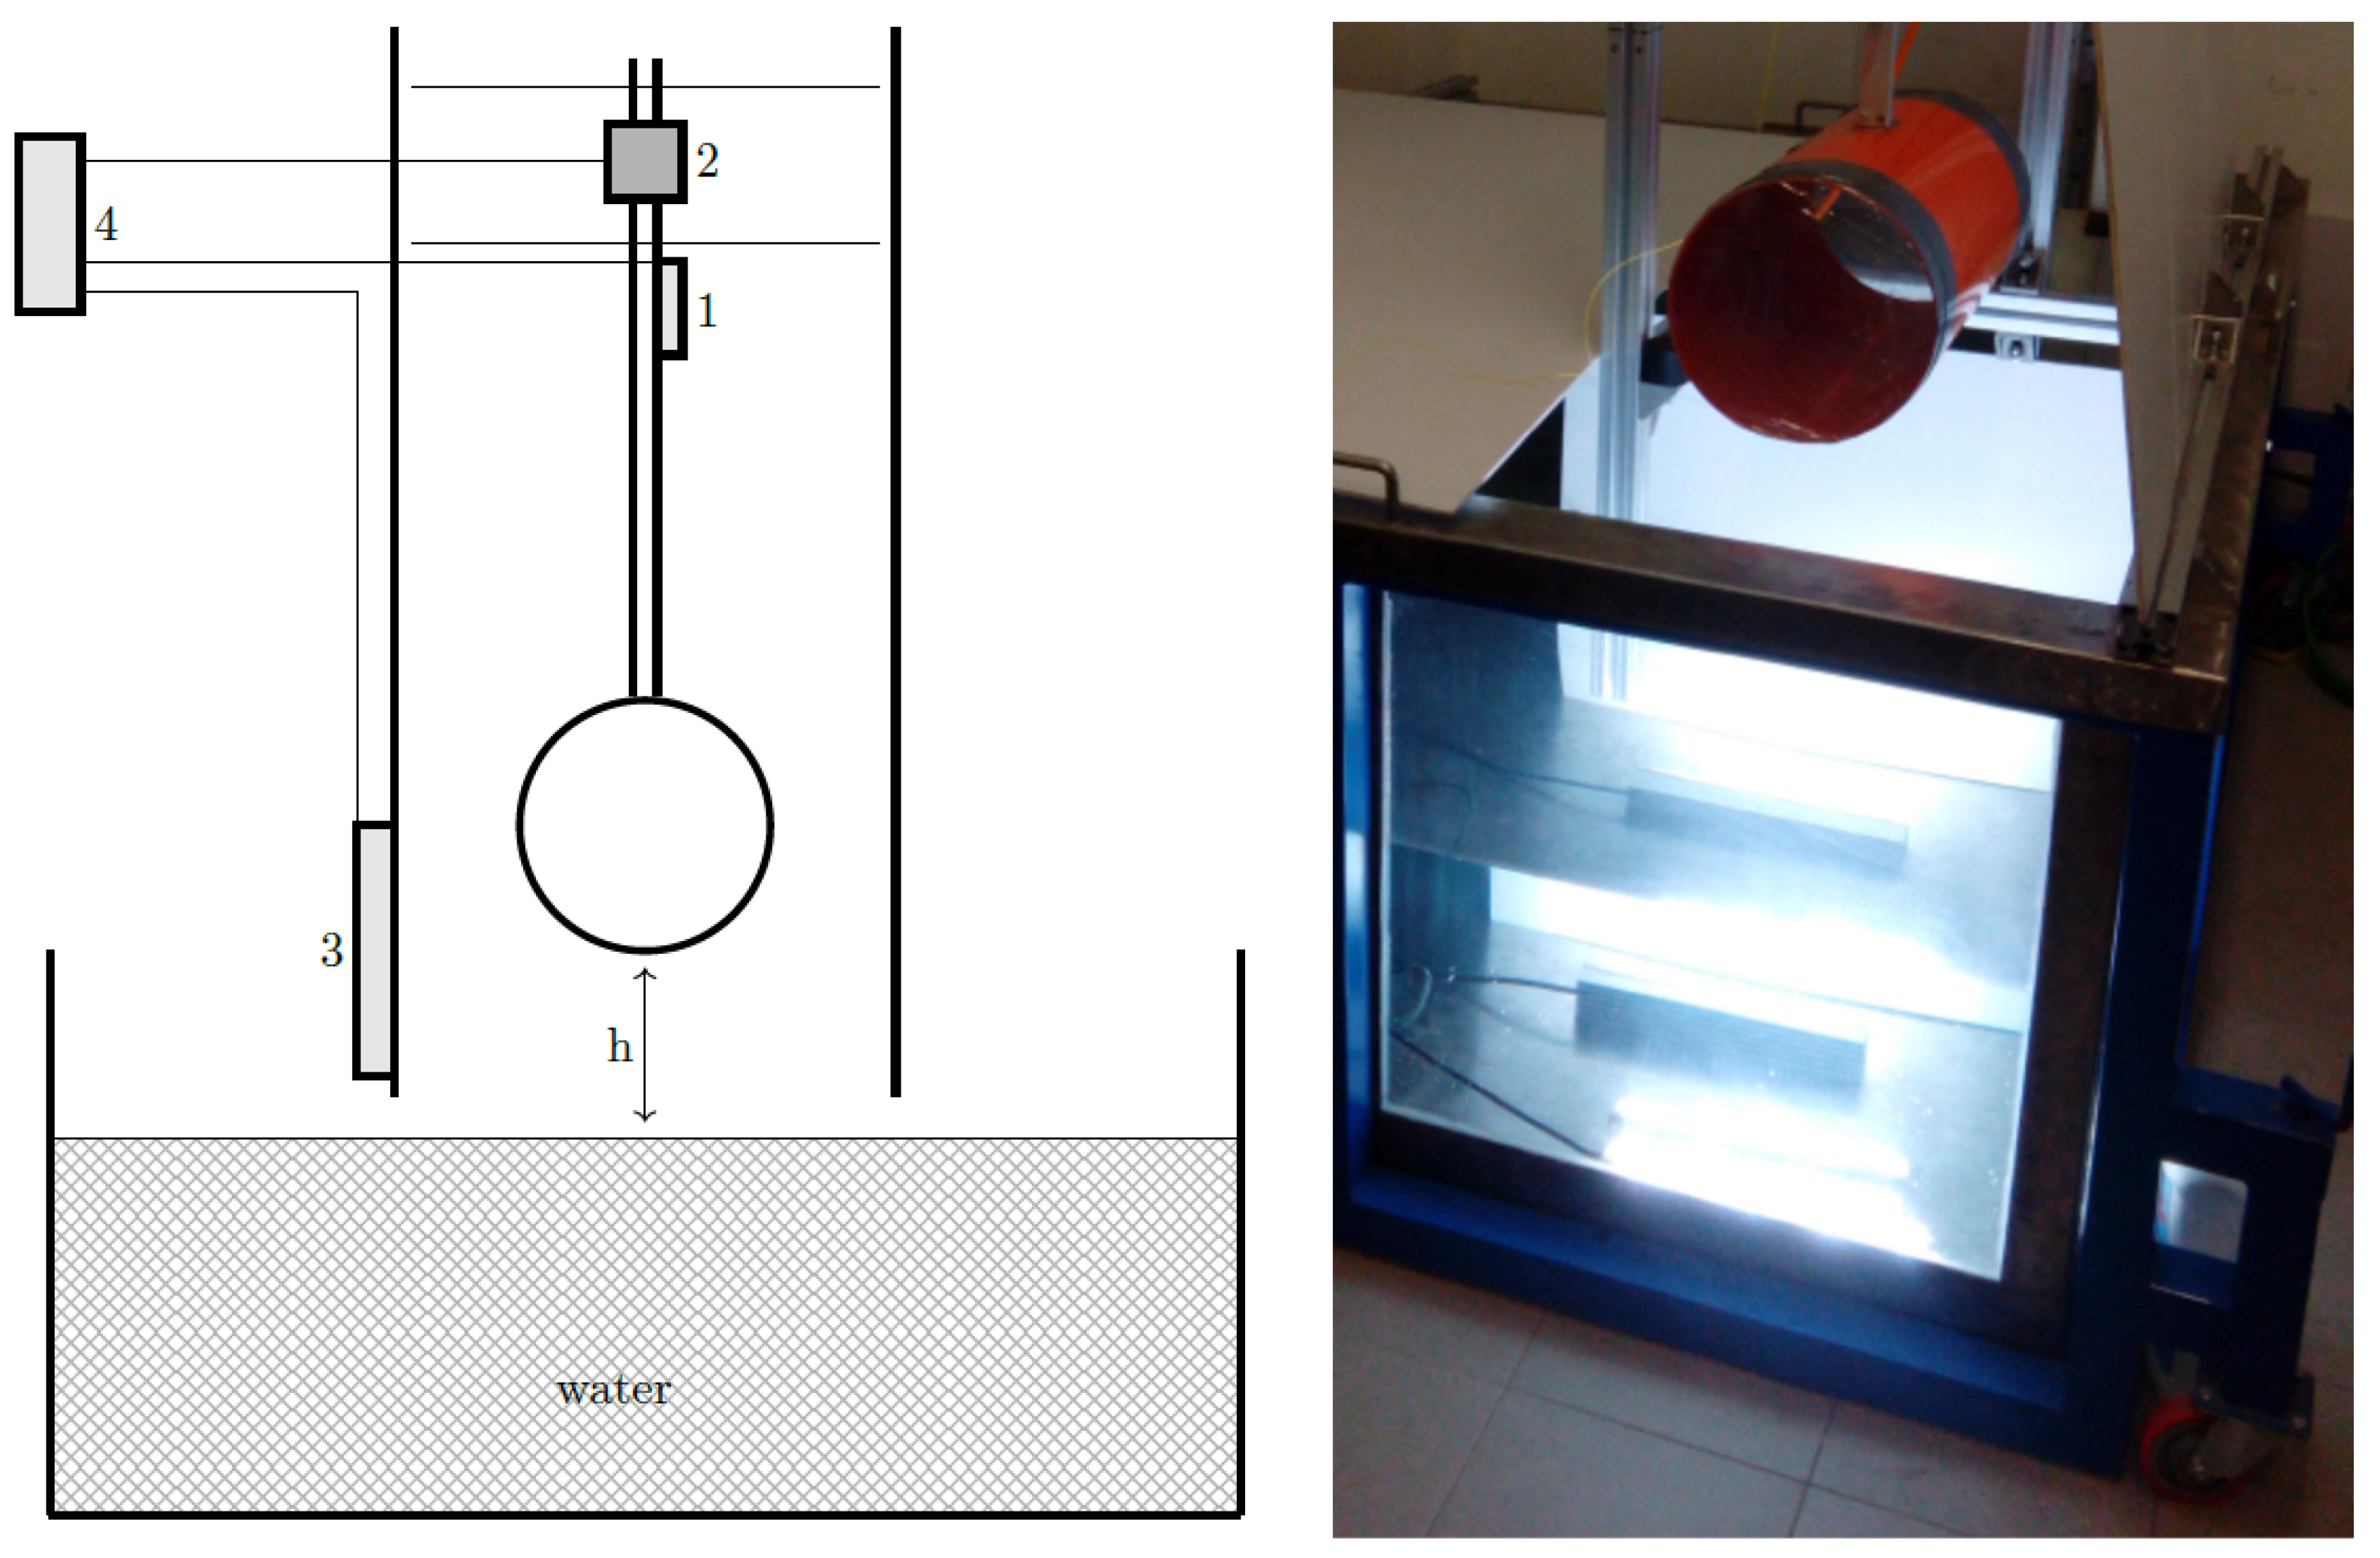
Free fall impact tests of the flexible cylinder on a quiescent water free surface are carried out in a water tank, made up of stainless steel and plexiglass, 1.85 m long, 1.50 m wide and 1.00 m high. The tank is filled with water up to a height of 0.6 m and a sledge of aluminum running along two vertical rails allows the cylinder to be left to free-fall under the gravity effect from a height up to 0.5 m above the water level. The mass of the impacting body, which includes the cylinder, the sledge and the sensors, is 4.26 kg. The scheme and a picture of the experimental setup are shown in Figure 1. An IP55 box linked to the sledge contains two accelerometers measuring body acceleration during the free fall and the impact: a triaxial capacitive accelerometer Adafruit® ADXL-335-5V (Adafruit Industries, New York, NY, USA) and a piezoelectric accelerometer Measurement Specialties® MOD.805M1 (Measurement Specialties, Hampton, VA, USA). These accelerometers have been used to verify the repeatability of the experimental tests.
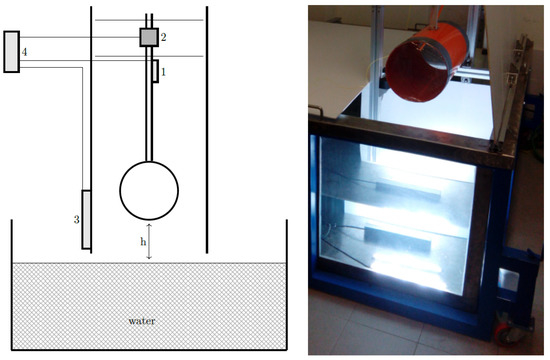
Figure 1.
Scheme of the experimental setup (left): 1—Fiber Bragg grating (FBG) connector, 2—Accelerometer, 3—Linear transducer, 4—Data acquisition system. Picture of the experimental setup (right).
The vertical position of the cylinder is measured through three SpectraSymbol® Thinpot® (SpectraSymbol, Salt Lake City, UT, USA) linear potentiometers, which are positioned in series along the rails.
Digital images are acquired using a high-speed Phantom® Miro 110 camera (Vision Research, Inc., Wayne, NJ, USA), positioned in front of one of the transparent sides of the tank; the camera itself is monochromatic and features a CMOS (Complementary metal–oxide–semiconductor) sensor of 1280 × 800 pixels. The acquisition speed ranges from 1600 fps at full resolution to 400,000 fps at reduced resolution; in the here-described experimental campaign, we chose a 2000 fps acquisition, with a maximum definition of 1152 × 720 pixels. Triggering is preformed through a Markteck Optoelectronics® MTRS4720D photodiode (Markteck Optoelectronics, Latham, NY, USA); the analog signals are synchronously acquired using a National Instruments® NI-USB-6009 (National Instruments, Austin, TX, USA).
Strains are measured through FBGs, whose measuring principle is based on the variation of the wavelength due to the deformation transmitted to the grating by the structure [33]. These sensors are suitable for structural health monitoring (SHM) in rapidly varying strain fields, such as those occurring in impulsive events [34,35]. They are small, light and flexible, thus avoiding any influence on the mass, stiffness and strength of the monitored object, can be embedded in the structures, and arrays of several sensors can be built on a single optic fiber with the possibility of performing synchronous data acquisition in different locations. Moreover, they are non-intrusive and almost insensitive to water and electromagnetic noise, which makes them very effective for water entry problems [33,34,35,36,37,38].
The FBG interrogation system features a laser source with an average optical power output of 3 mW and a wavelength bandwidth of 80 nm. The repeatability is ±3 pm and the strain resolution is around 1 pm. The maximum sampling frequency is 3 kHz.
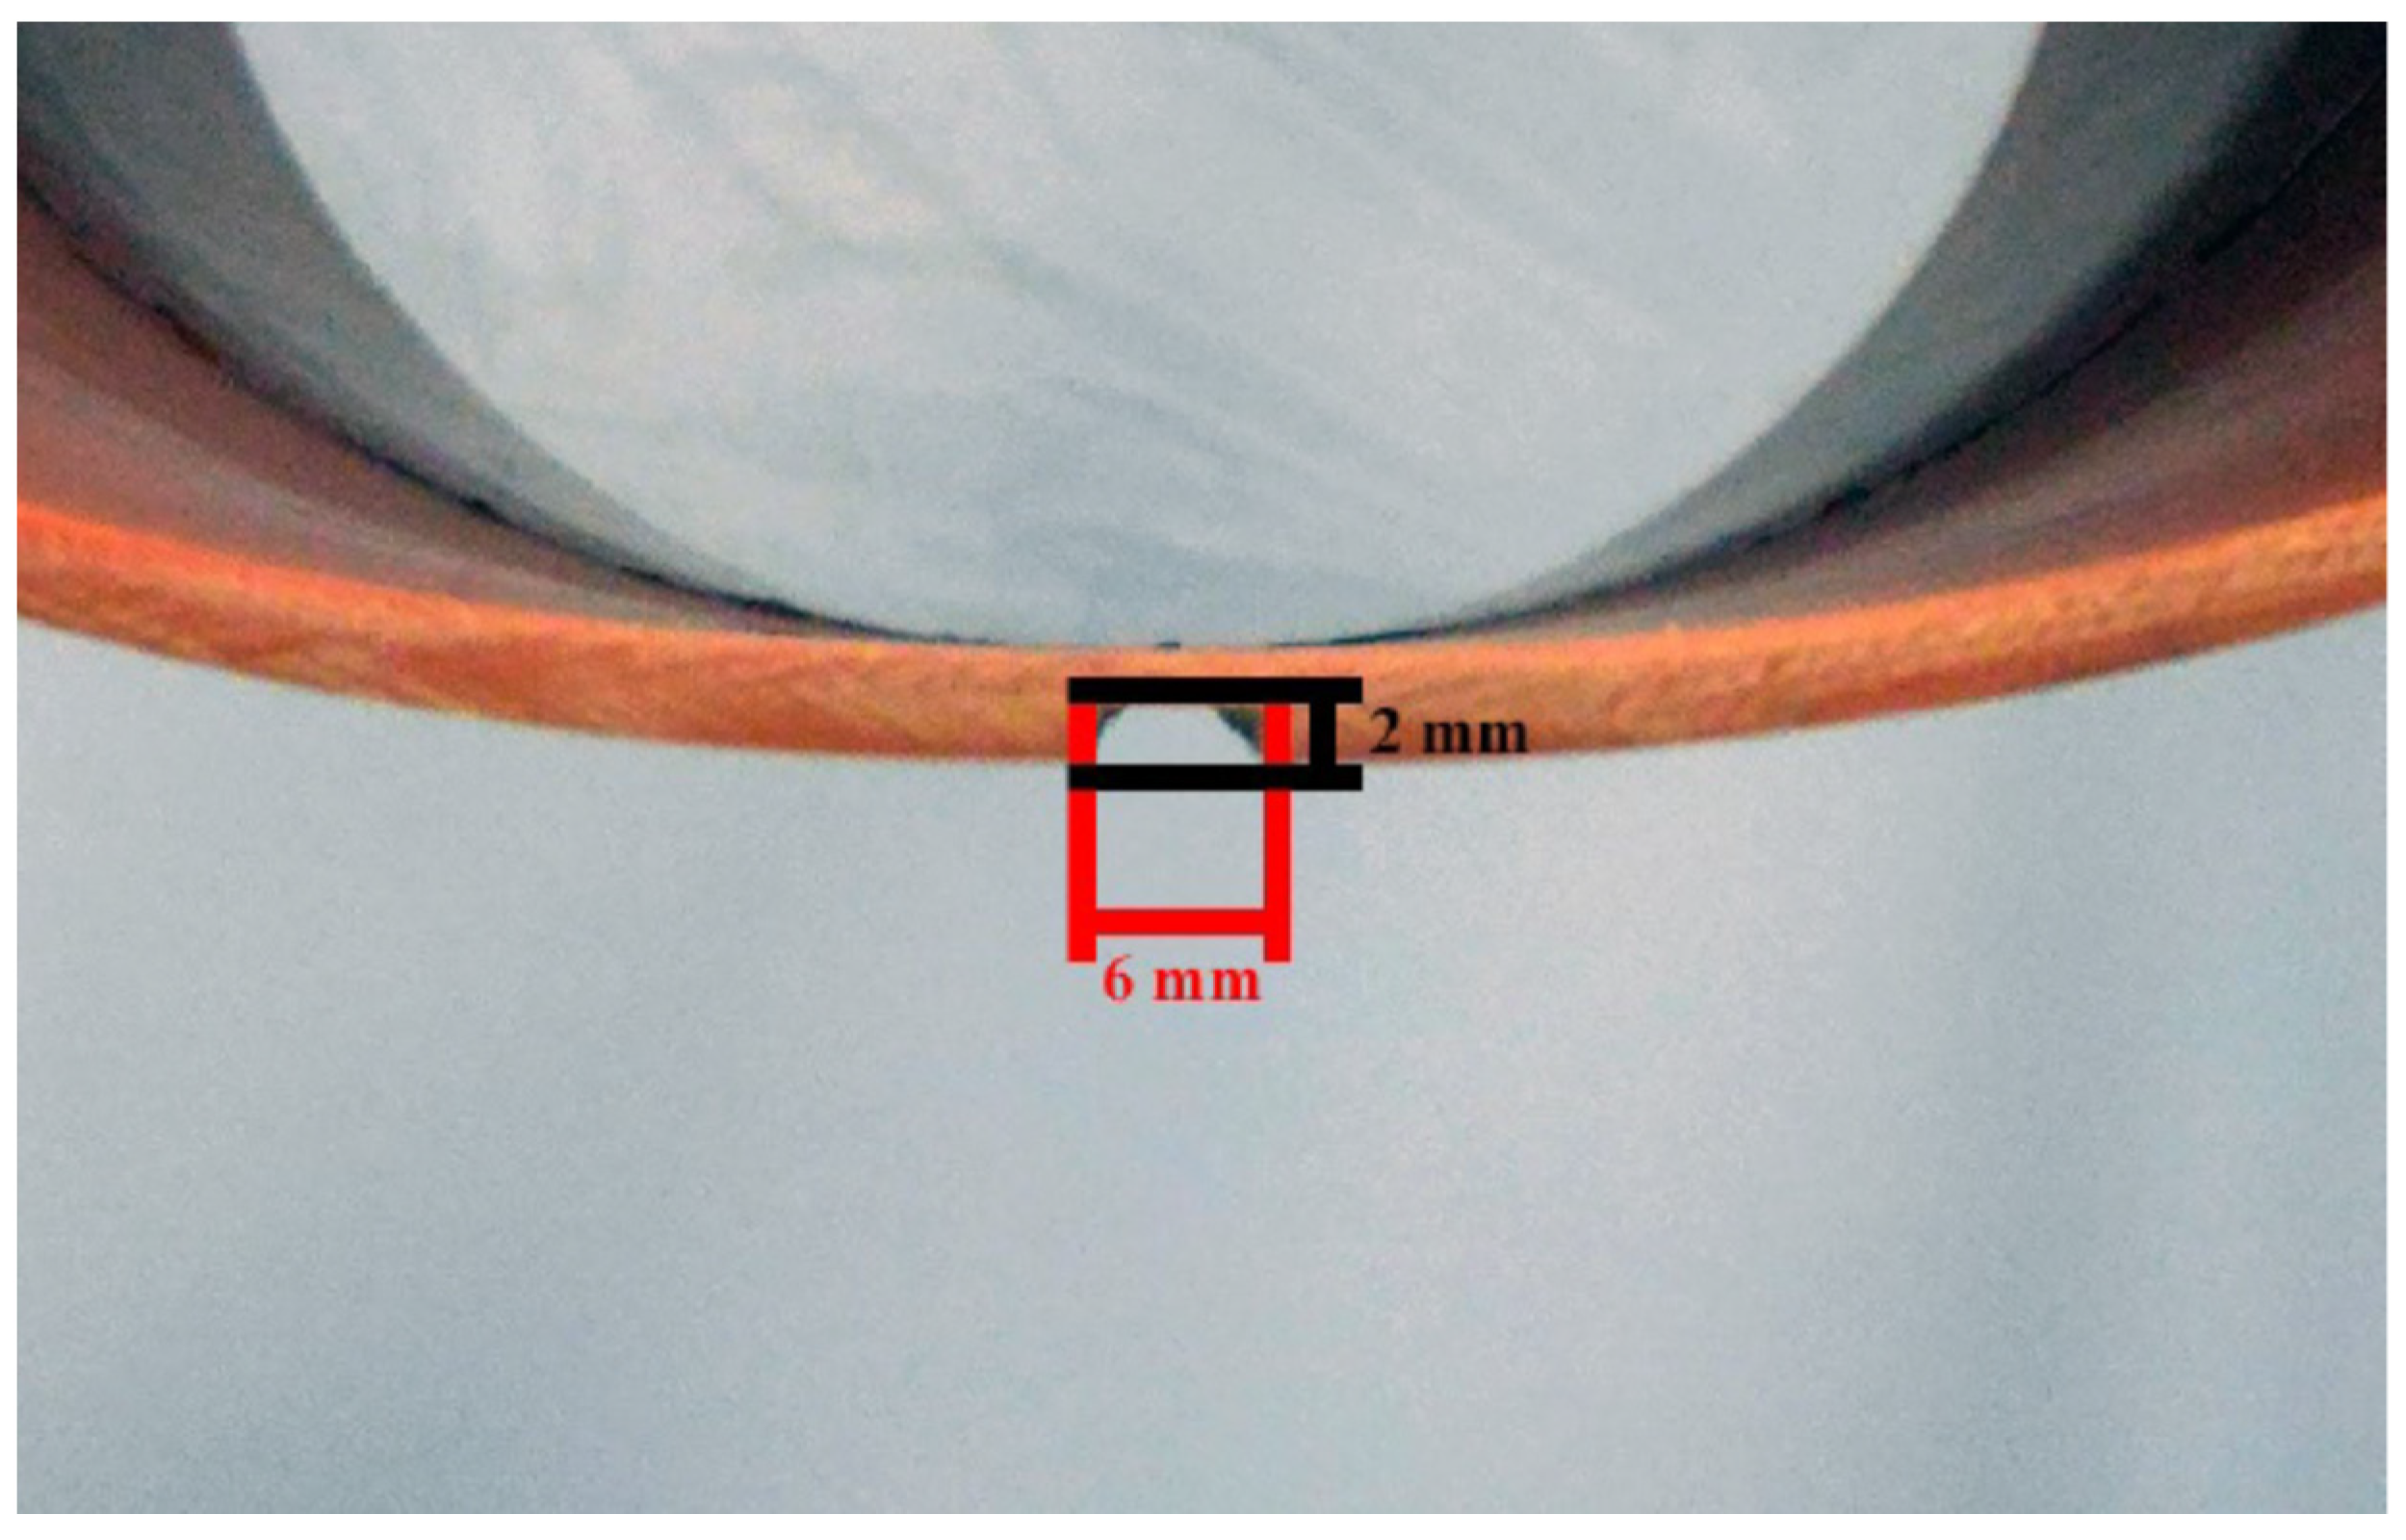
The specimen chosen for this experimental campaign is a PVC (Polyvinylchloride, modulus of elasticity (E) 2.84 GPa, Poisson ratio (ν) 0.40, density (ρ) 1380 kg/m3) cylinder with an internal diameter of 239 mm, an external diameter of 247 mm and a length of 520 mm. In order to study the development of a damage detection system, the specimen was modified by making a 2 mm × 6 mm reduction of the cylinder thickness at 180° starting from the cylinder attachment point, as shown in Figure 2. Moreover, the cylinder was placed in order to avoid any disturbance from the walls by fixing the distance from the front wall (the transparent one) to 1D and the distance from the side wall to 3D.
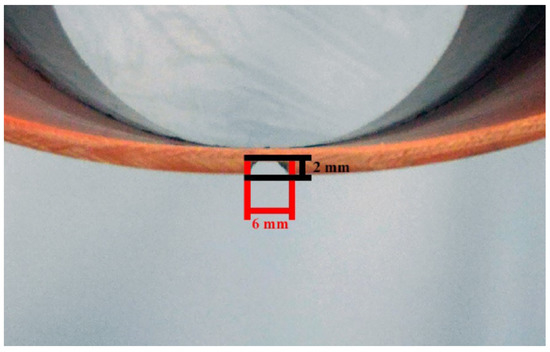
Figure 2.
Damage made on the cylindrical specimen at 180° starting from the cylinder attachment point.
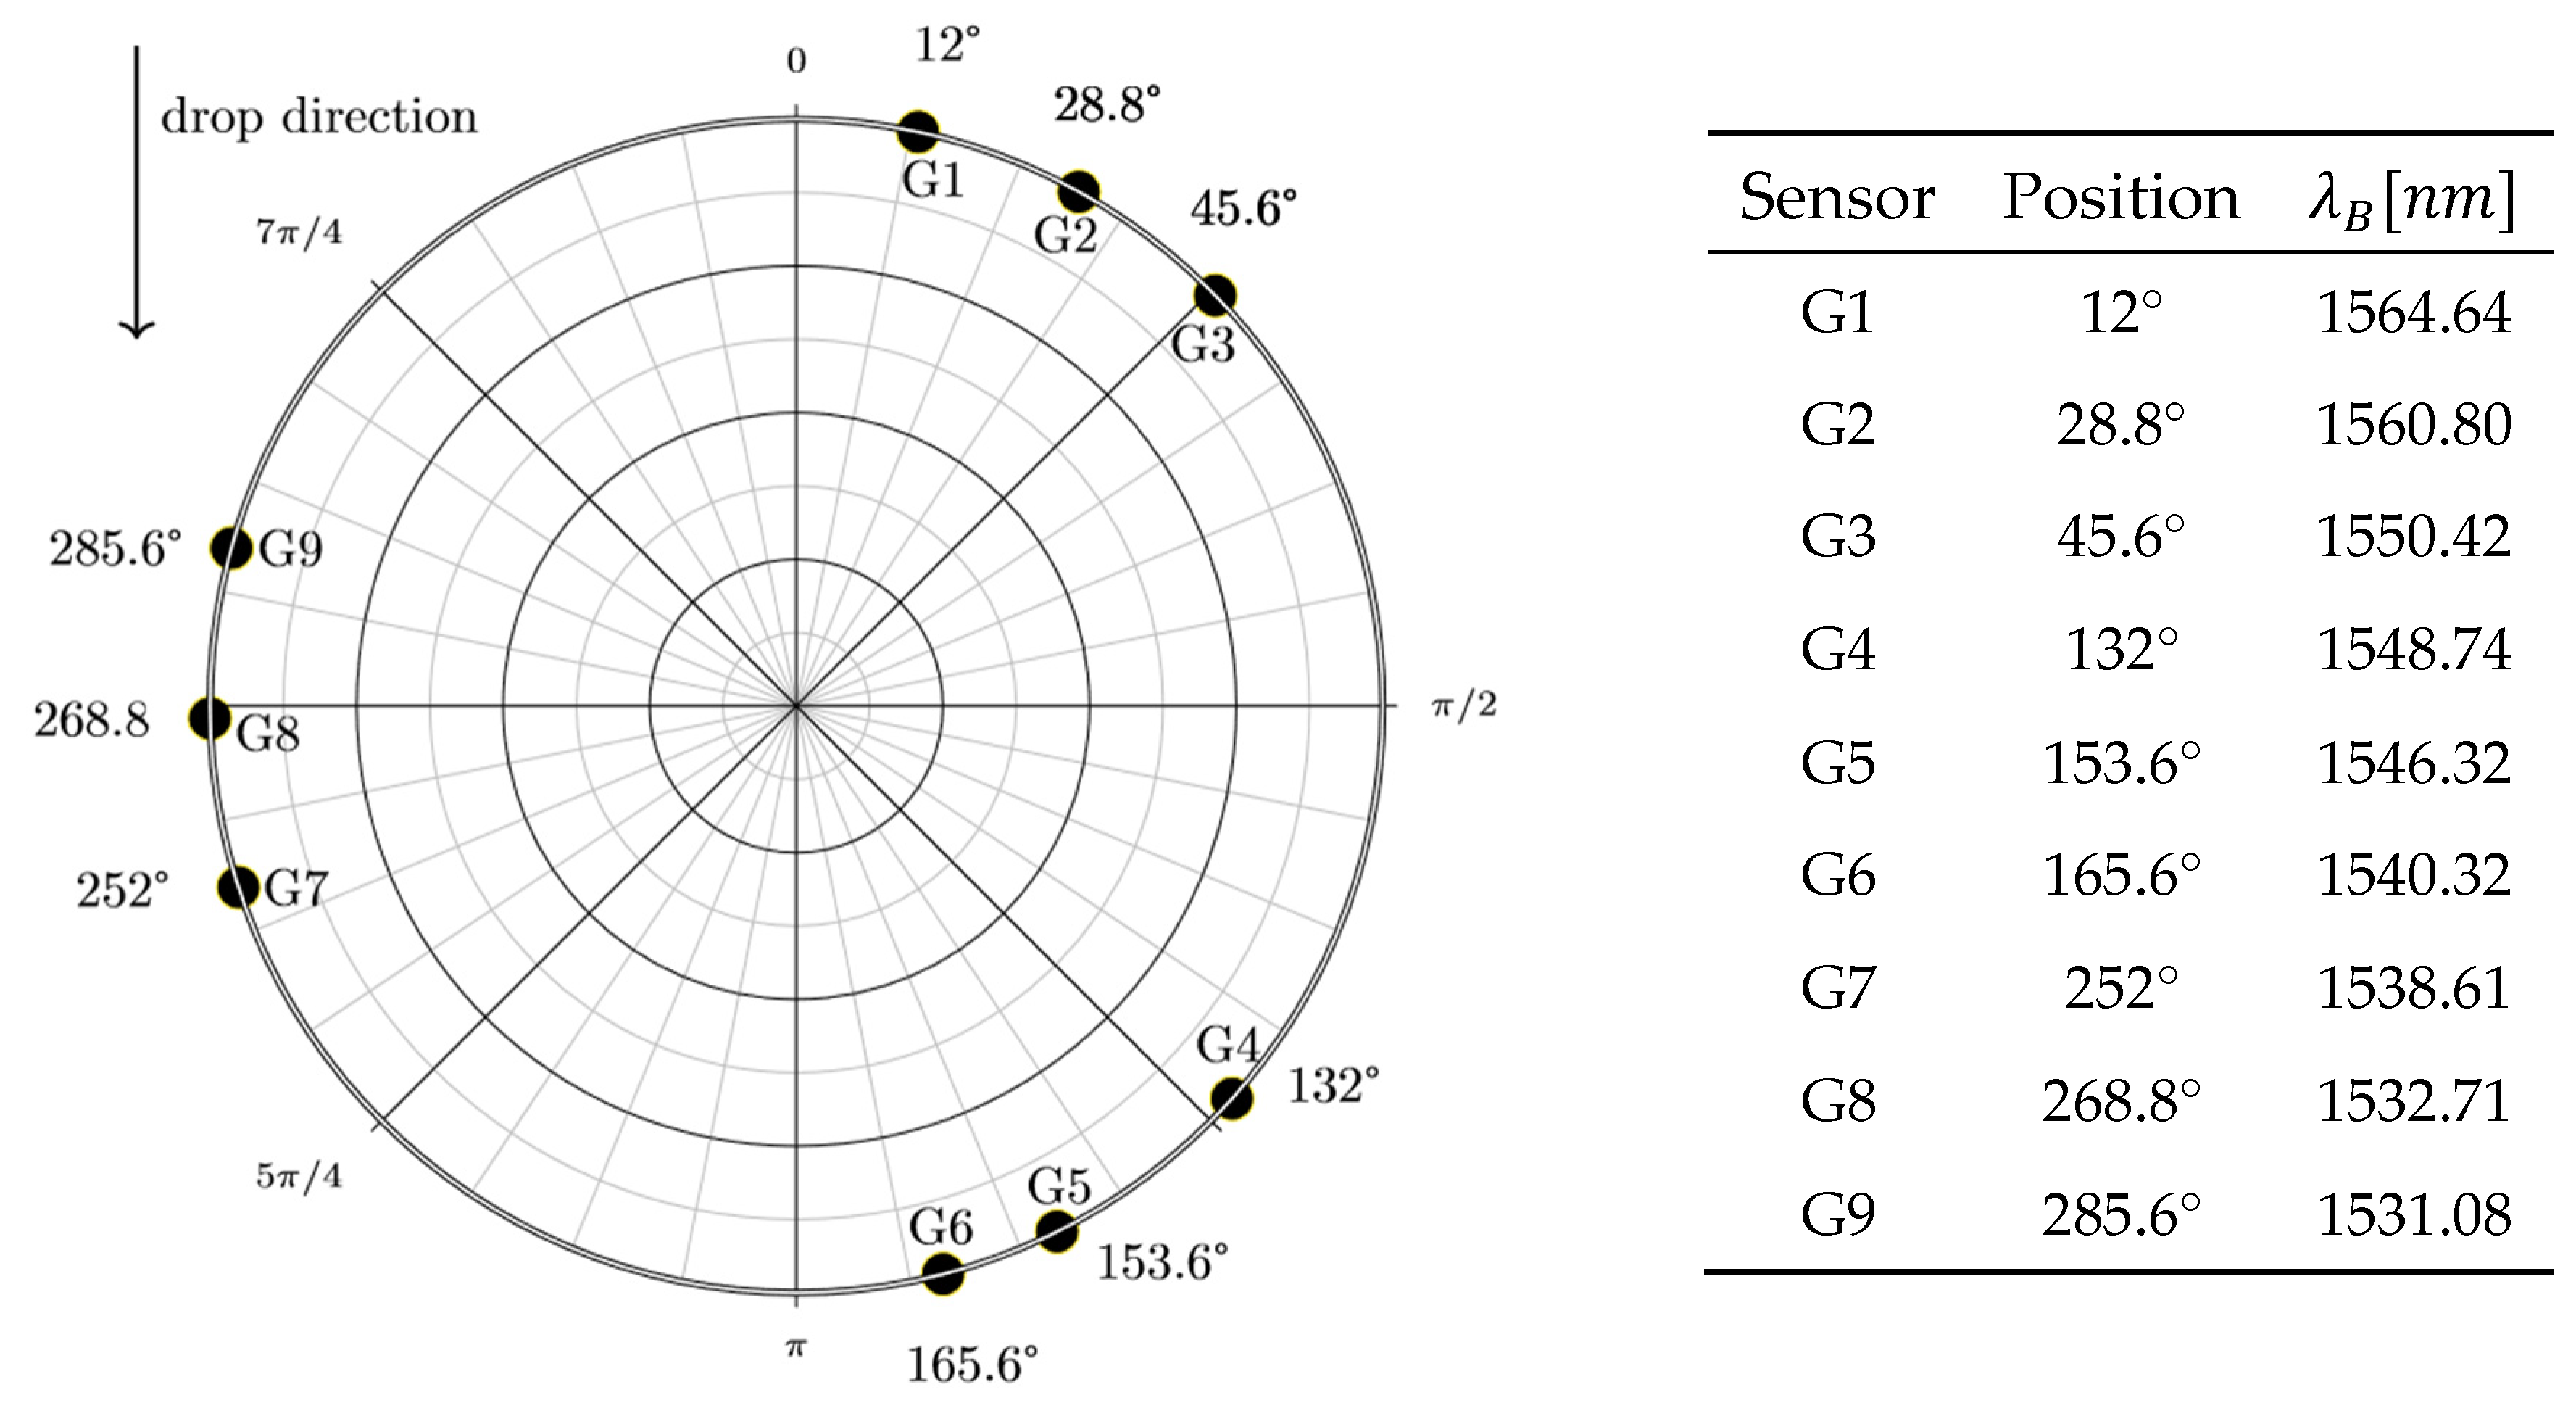
The optical fiber network was composed of 9 FBG sensors, attached to the cylinder’s internal surface through epoxy glue on the half-length section (i.e., 260 mm from both bases of the cylinder). The radial positions of the strain sensors and the Bragg wavelengths of each sensor are represented in Figure 3. In the following sensors (marked as G, grating) are number from 1 to 9 following the radial coordinate from 12° to 285.6°.
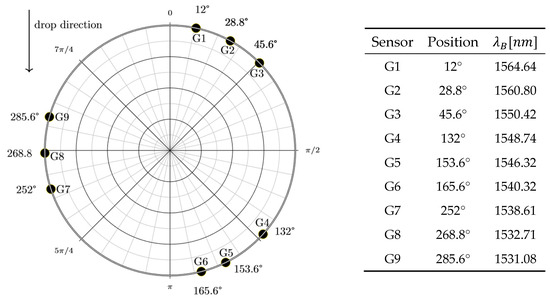
Figure 3.
FBGs’ positions on the cylinder surface (graph on the left) and wavelengths (table on the right). Sensors are numbered from 1 to 9 following the radial coordinate from 12° to 285.6°.
3. Shape Reconstruction Methodology
The cylinder reconstruction is made through modal decomposition employing a slightly modified version of the analytical procedure addressed in previous papers by some of the authors [17,19,20,21,22].
The deformation of the body is approximated with the combination of a finite number of mode shapes and the elastic response of the cylindrical structure is calculated in terms of modal coordinates μ(t). The general relation between strain/displacement vectors, indicated with ε(t) and w(t), respectively, and modal coordinates can be written as:
where w(t) and ε(t) are vectors containing displacements and strains as functions of time (t) at the measurement location n, Φ and Ψ are N × M matrices, being N the number of measurement points and M the number of mode shapes, gathering the normalized modal displacement and modal strain components at the measurement locations.
w(t) = Φ μ(t)
ε(t) = Ψ μ(t)
The main advantage of the proposed method, especially for real time structural health monitoring, is that such matrices are characteristics of the structure under investigation and may be determined (analytically, numerically, or experimentally), once, before monitoring and without requiring any further updating.
During the monitoring, at each time instant, the strain values are read from the FBG sensors and the modal coordinates are computed:
where μ(t) is the time-varying modal coordinates vector collecting the of each mode.
μ(t) = (ΨT Ψ)−1ΨTε(t)
Assuming that the mode shapes are known in every point of the body, it is possible to reconstruct the overall deformation by replacing matrix with a matrix φ collecting the normalized modal displacements at the points of interest. Considering the cylinder, matrix φ gathers modal components , in which is the polar coordinate and expresses the order of the mode.
Substituting Equation (3) in Equations (1) and (2), displacements and strains at any angular position are expressed as:
wθ(t) = φ (ΨT Ψ)−1 ΨT ε(t)
εθ(t) = ψ (ΨT Ψ)−1 ΨT ε(t)
In this specific problem, the normalized radial displacement and circumferential strain for every mode shape are determined through the theory of thin walled cylinders as follows:
where z represents the distance from the neutral surface of the structure along the thickness of the shell.
φθ,m = cos(m θ)
ψθ,m = (1 − m2) z cos(m θ)/R2
Equation (7) can be obtained from the general formulation of circumferential strain for thin walled cylinders as follows:
where χ is the change of curvature and ε0 is the elongation of the middle surface. We note that ε0 has been eliminated in the strain calculation, under the assumption that, in the absence of axial symmetrical loading conditions with respect to the revolution axis of the cylinder, membrane stresses can be neglected. The expression proposed in [17] has been used to compute χ, because it is more accurate than others in the case of inextensible deformation.
ε (t) = ε0 − zχ
4. Results and Discussion
The experimental tests are carried out to analyze different set of reference and control sensors, with the aim of studying the effectiveness of the method for deformed shape reconstruction and damage detection presented here. In all the tests the falling height is set to 50 cm.
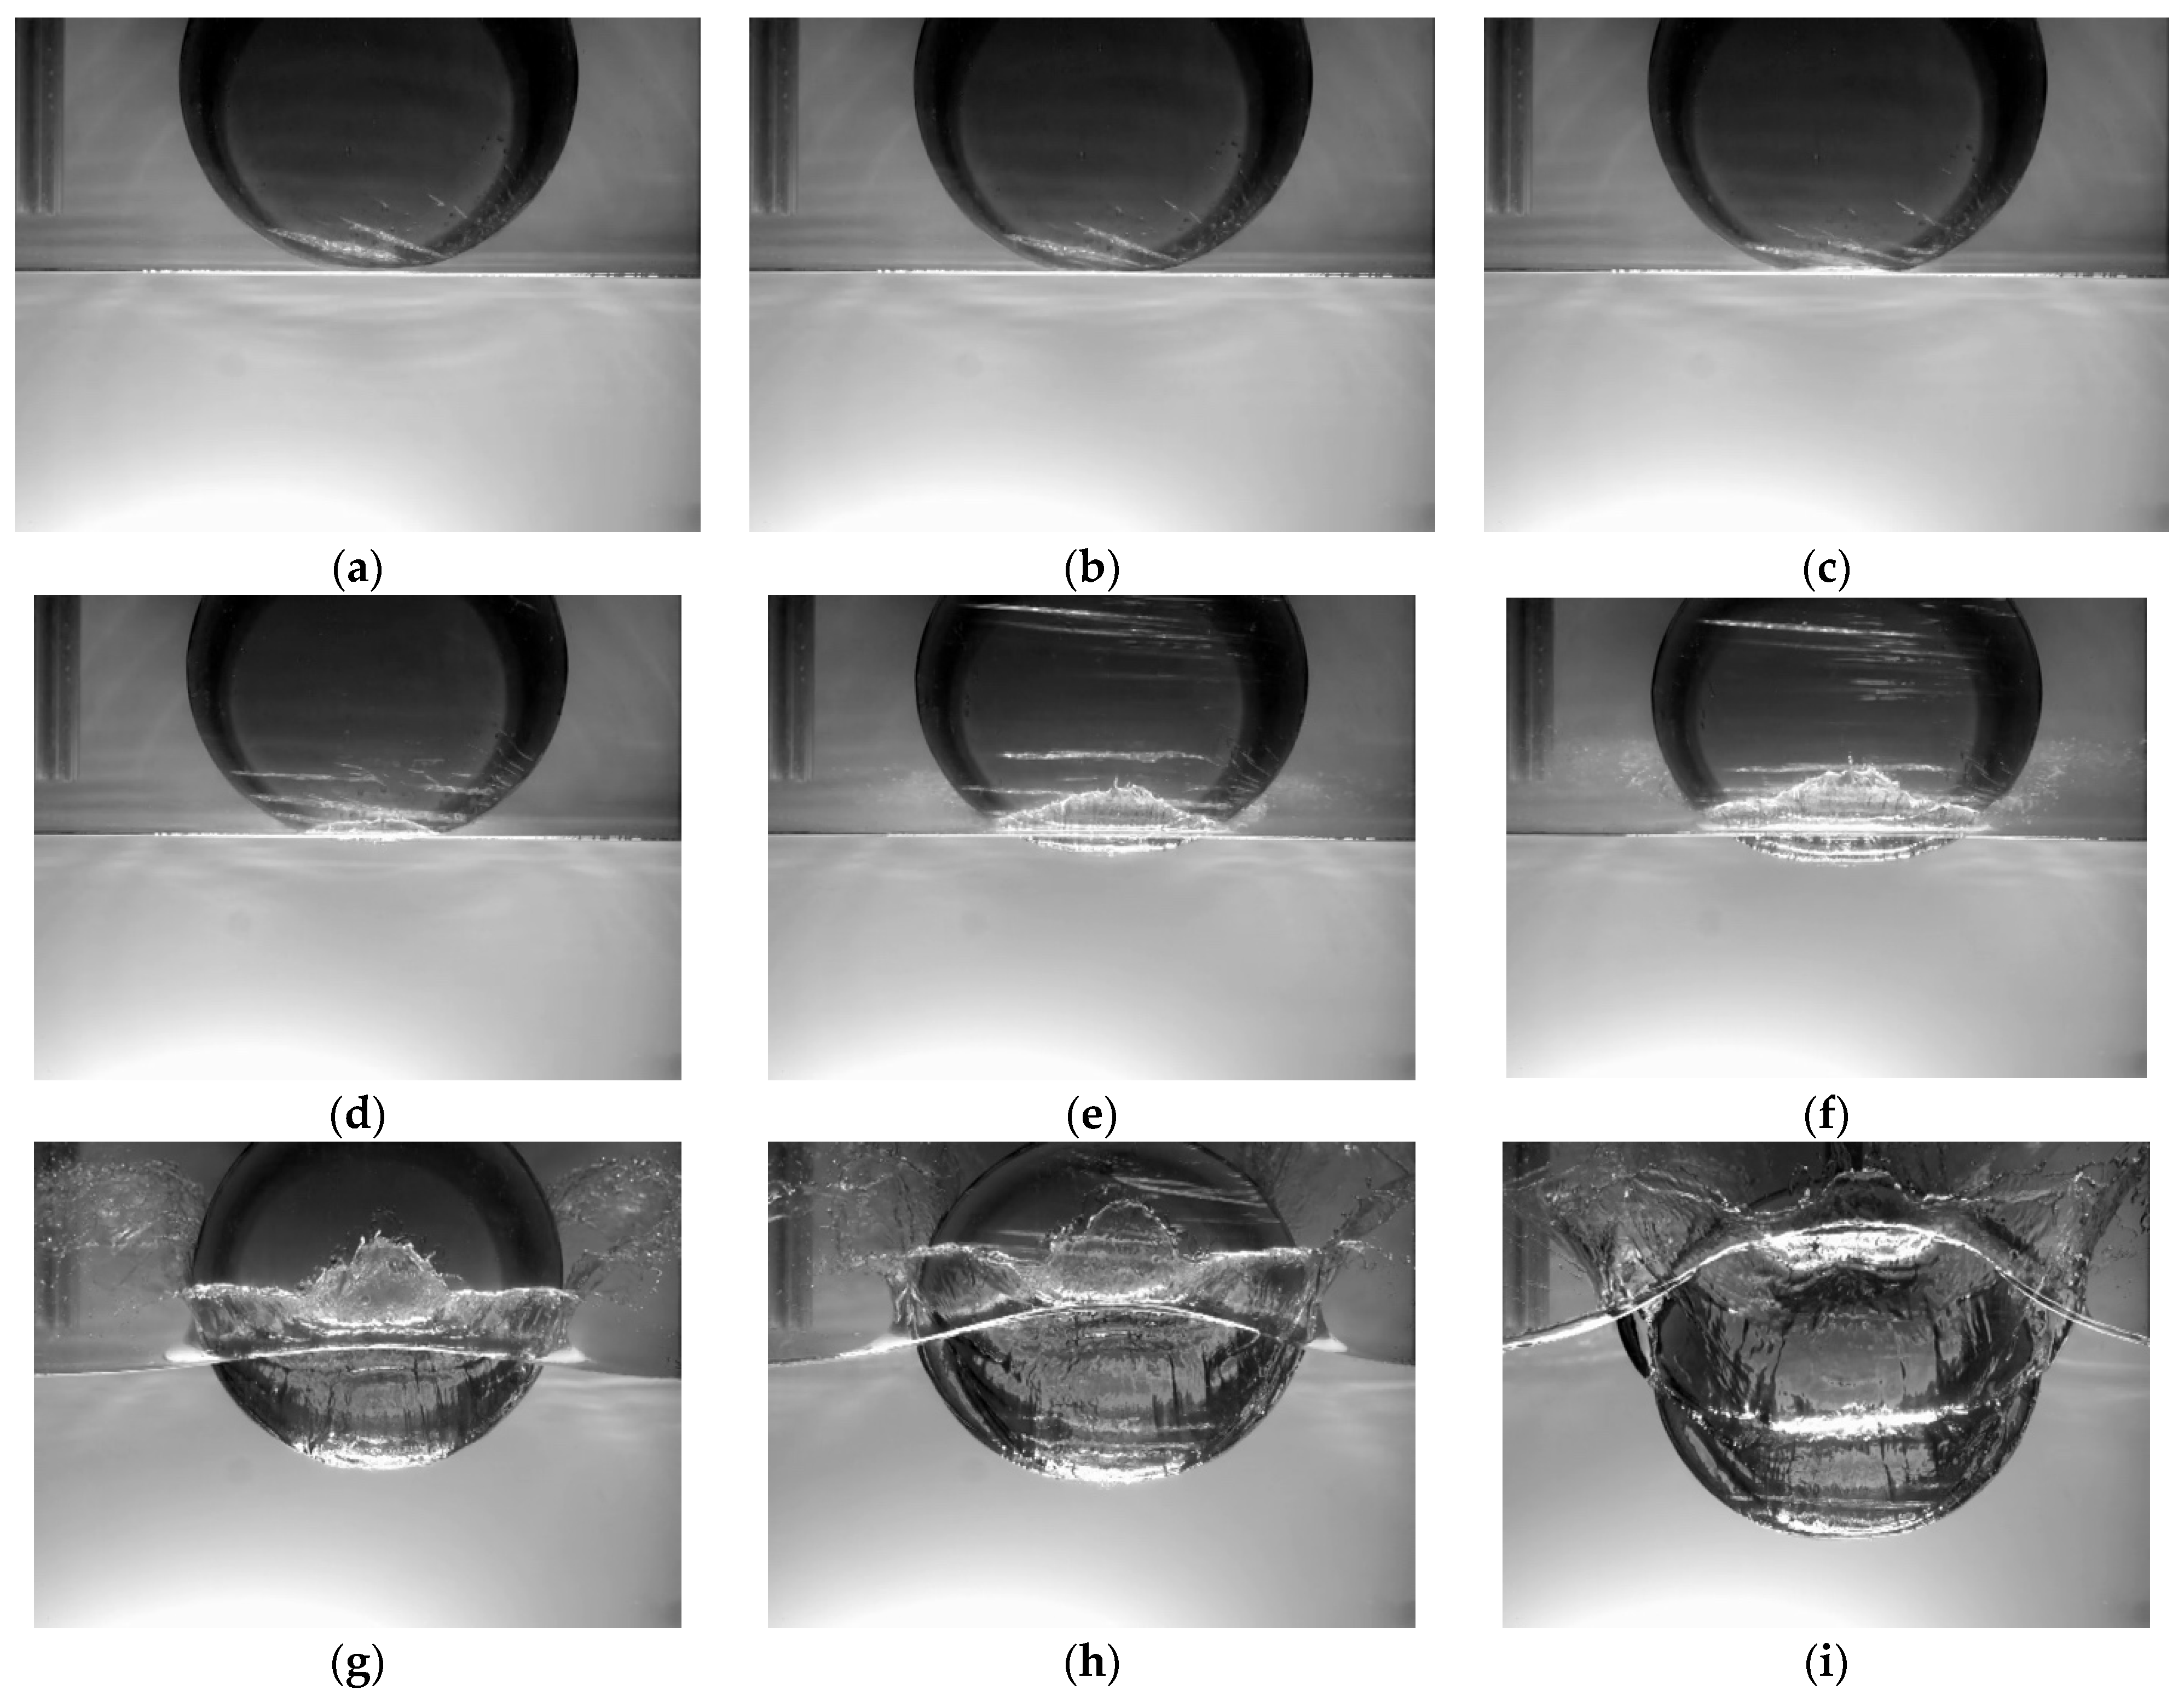
Figure 4 reports the evolution in time of the cylinder impact and penetration through the water free surface. As shown in the panels, three phases can be identified: first, the cylinder impacts the free surface and deforms, due to the impulsive loading (Figure 4a–c); then, it penetrates the water free surface and the pile-up forms on the sides of the compliant structure (Figure 4d–f), eventually leading to water jet formation (Figure 4f). The last phase is represented by Figure 4g–i: for larger penetrations, a water cavity is formed, as reported in [25], as well: the water detaches from the structure and air is entrained around the cylinder.
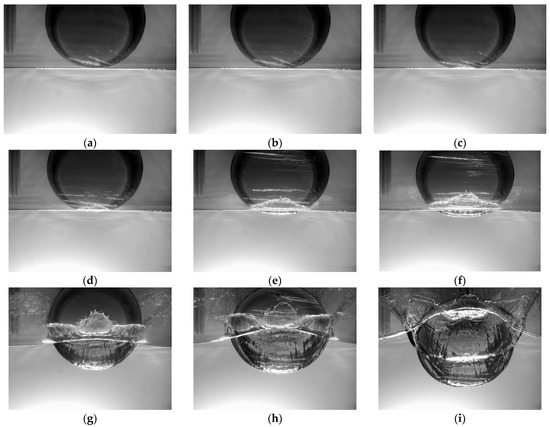
Figure 4.
Evolution of cylinder water impact. The frames are acquired through the Phantom® Miro 110 high speed camera. The panel is grouped according to the three phases of cylinder penetration through the free surface: frames (a–c): water impact and initial stages of cylinder deformation; frames (d–f): macroscopic deformation of the cylinder, during free surface penetration; pile-up and water jet formation [25]; frames (g–i): formation of the water-cavity [25]. Cylinder water impact video is available online (see Supplementary Materials Video S1).
During the water impact, cylinder local strain values are measured through FBGs sensors. As a reference of the water impact event, Table 1 reports the maximum absolute strain values recorded during the experimental tests.

Table 1.
Maximum absolute strain values for each sensor installed onto the specimen.
The nine sensors included in the measurement network are divided into two categories: reference sensors and control sensors. The reference sensors are used for the reconstruction of the strain and displacement fields. The control sensors are used for the calculation of the normalized error, defined as follows:
where and are the reconstructed and measured strains at the k-th time sample of the sensor n, respectively, and K is the total number of samples along the duration of the whole strain signal from FBG sensors.
Therefore, after the choice of a set of reference sensors, the difference between the measured strain values and the reconstructed ones is calculated in each experimental test through .
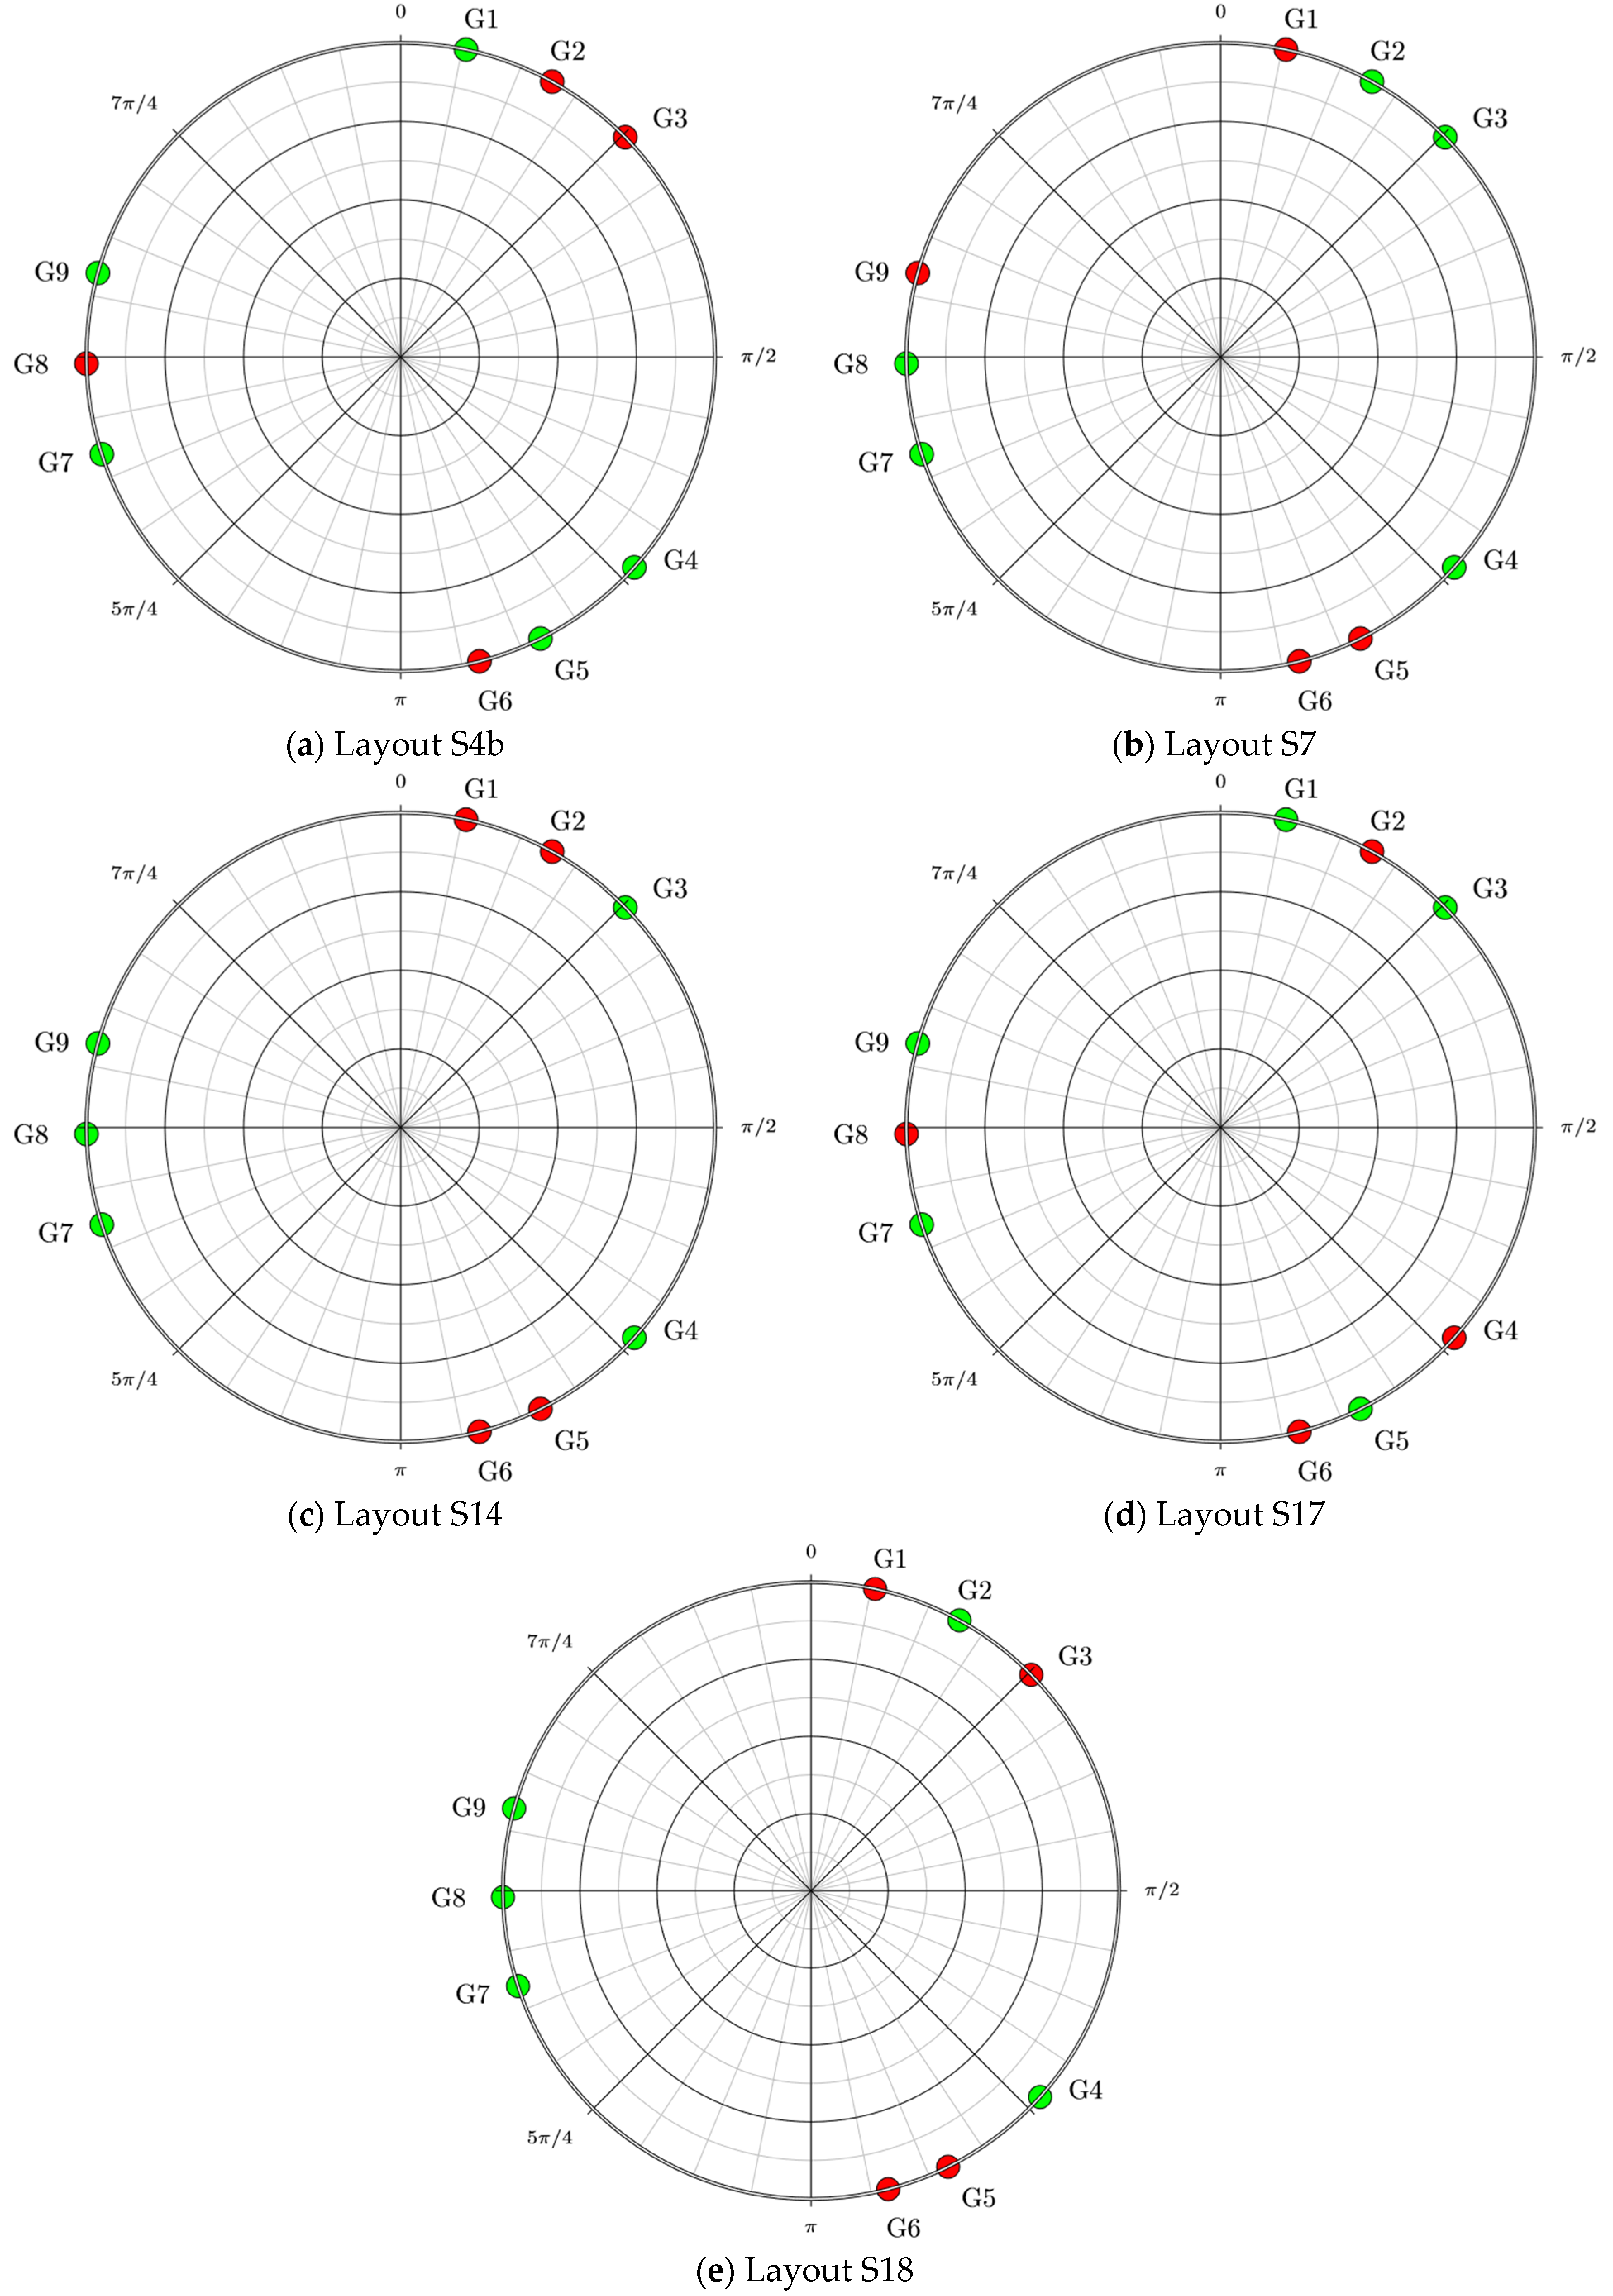
By changing the choice of reference and control sensors, we obtain five different layouts, each one with four control sensors and five reference sensors, as depicted in Figure 5. The first five mode shapes of the cylinder are considered, taking into account that every mode shape has different nodes (location in which the value of the displacement is zero) which should be avoided in reconstruction. Moreover, considering the cylinder deformation under impacting loads, points at angular coordinates which are symmetrical to the vertical plane are assumed to have the same displacement.
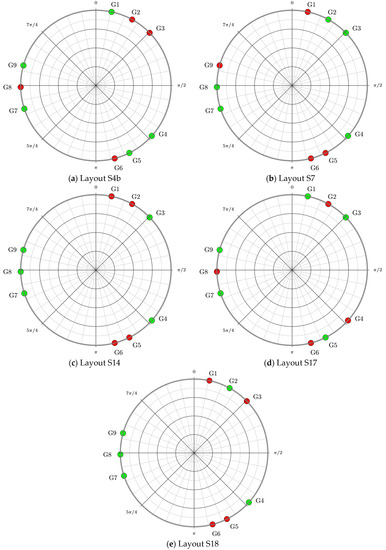
Figure 5.
Analyzed layouts. Red points identify the position of control sensors while green points those of reference sensors.
Considering all the possible combinations, five layouts have been chosen. Layout S4b (Figure 5a) has the advantage of avoiding sensors located close to the nodes of the first mode shapes for reconstruction. Therefore, sensor positions near to 45°, 135°, 225° and 315° (nodes of the first mode shape) and near to 30°, 90°, 150°, 210°, 270° and 330° (nodes of the second mode shape) were avoided. Layout S7 (Figure 5b) is chosen considering that the sensor locations are nodes for some mode shapes, but also points of maximum displacement for other modes. Moreover, the incidence of the fourth and fifth mode shapes into the impact reconstruction is considered. Layout S14 (Figure 5c) is similar to that used in [20] and has reference sensors as far as possible from the damage (180°) and the attachment point (0°). Layout S17 (Figure 5d) presents a constant angular distance between adjacent reference sensors of 30°, except for the distance between the fourth and the fifth reference sensor, which is of about 45°. These values are related to the periodic angular distance between maximum values on the second and third mode shapes. Finally, in Layout S18 (Figure 5e) three couples of close sensors present an angular distance of 15°, which can be related to the periodic distance of maximum values in the third mode shape.
Results, in terms of normalized errors, are listed in Table 2.

Table 2.
Normalized errors on control sensors for each reconstruction layout.
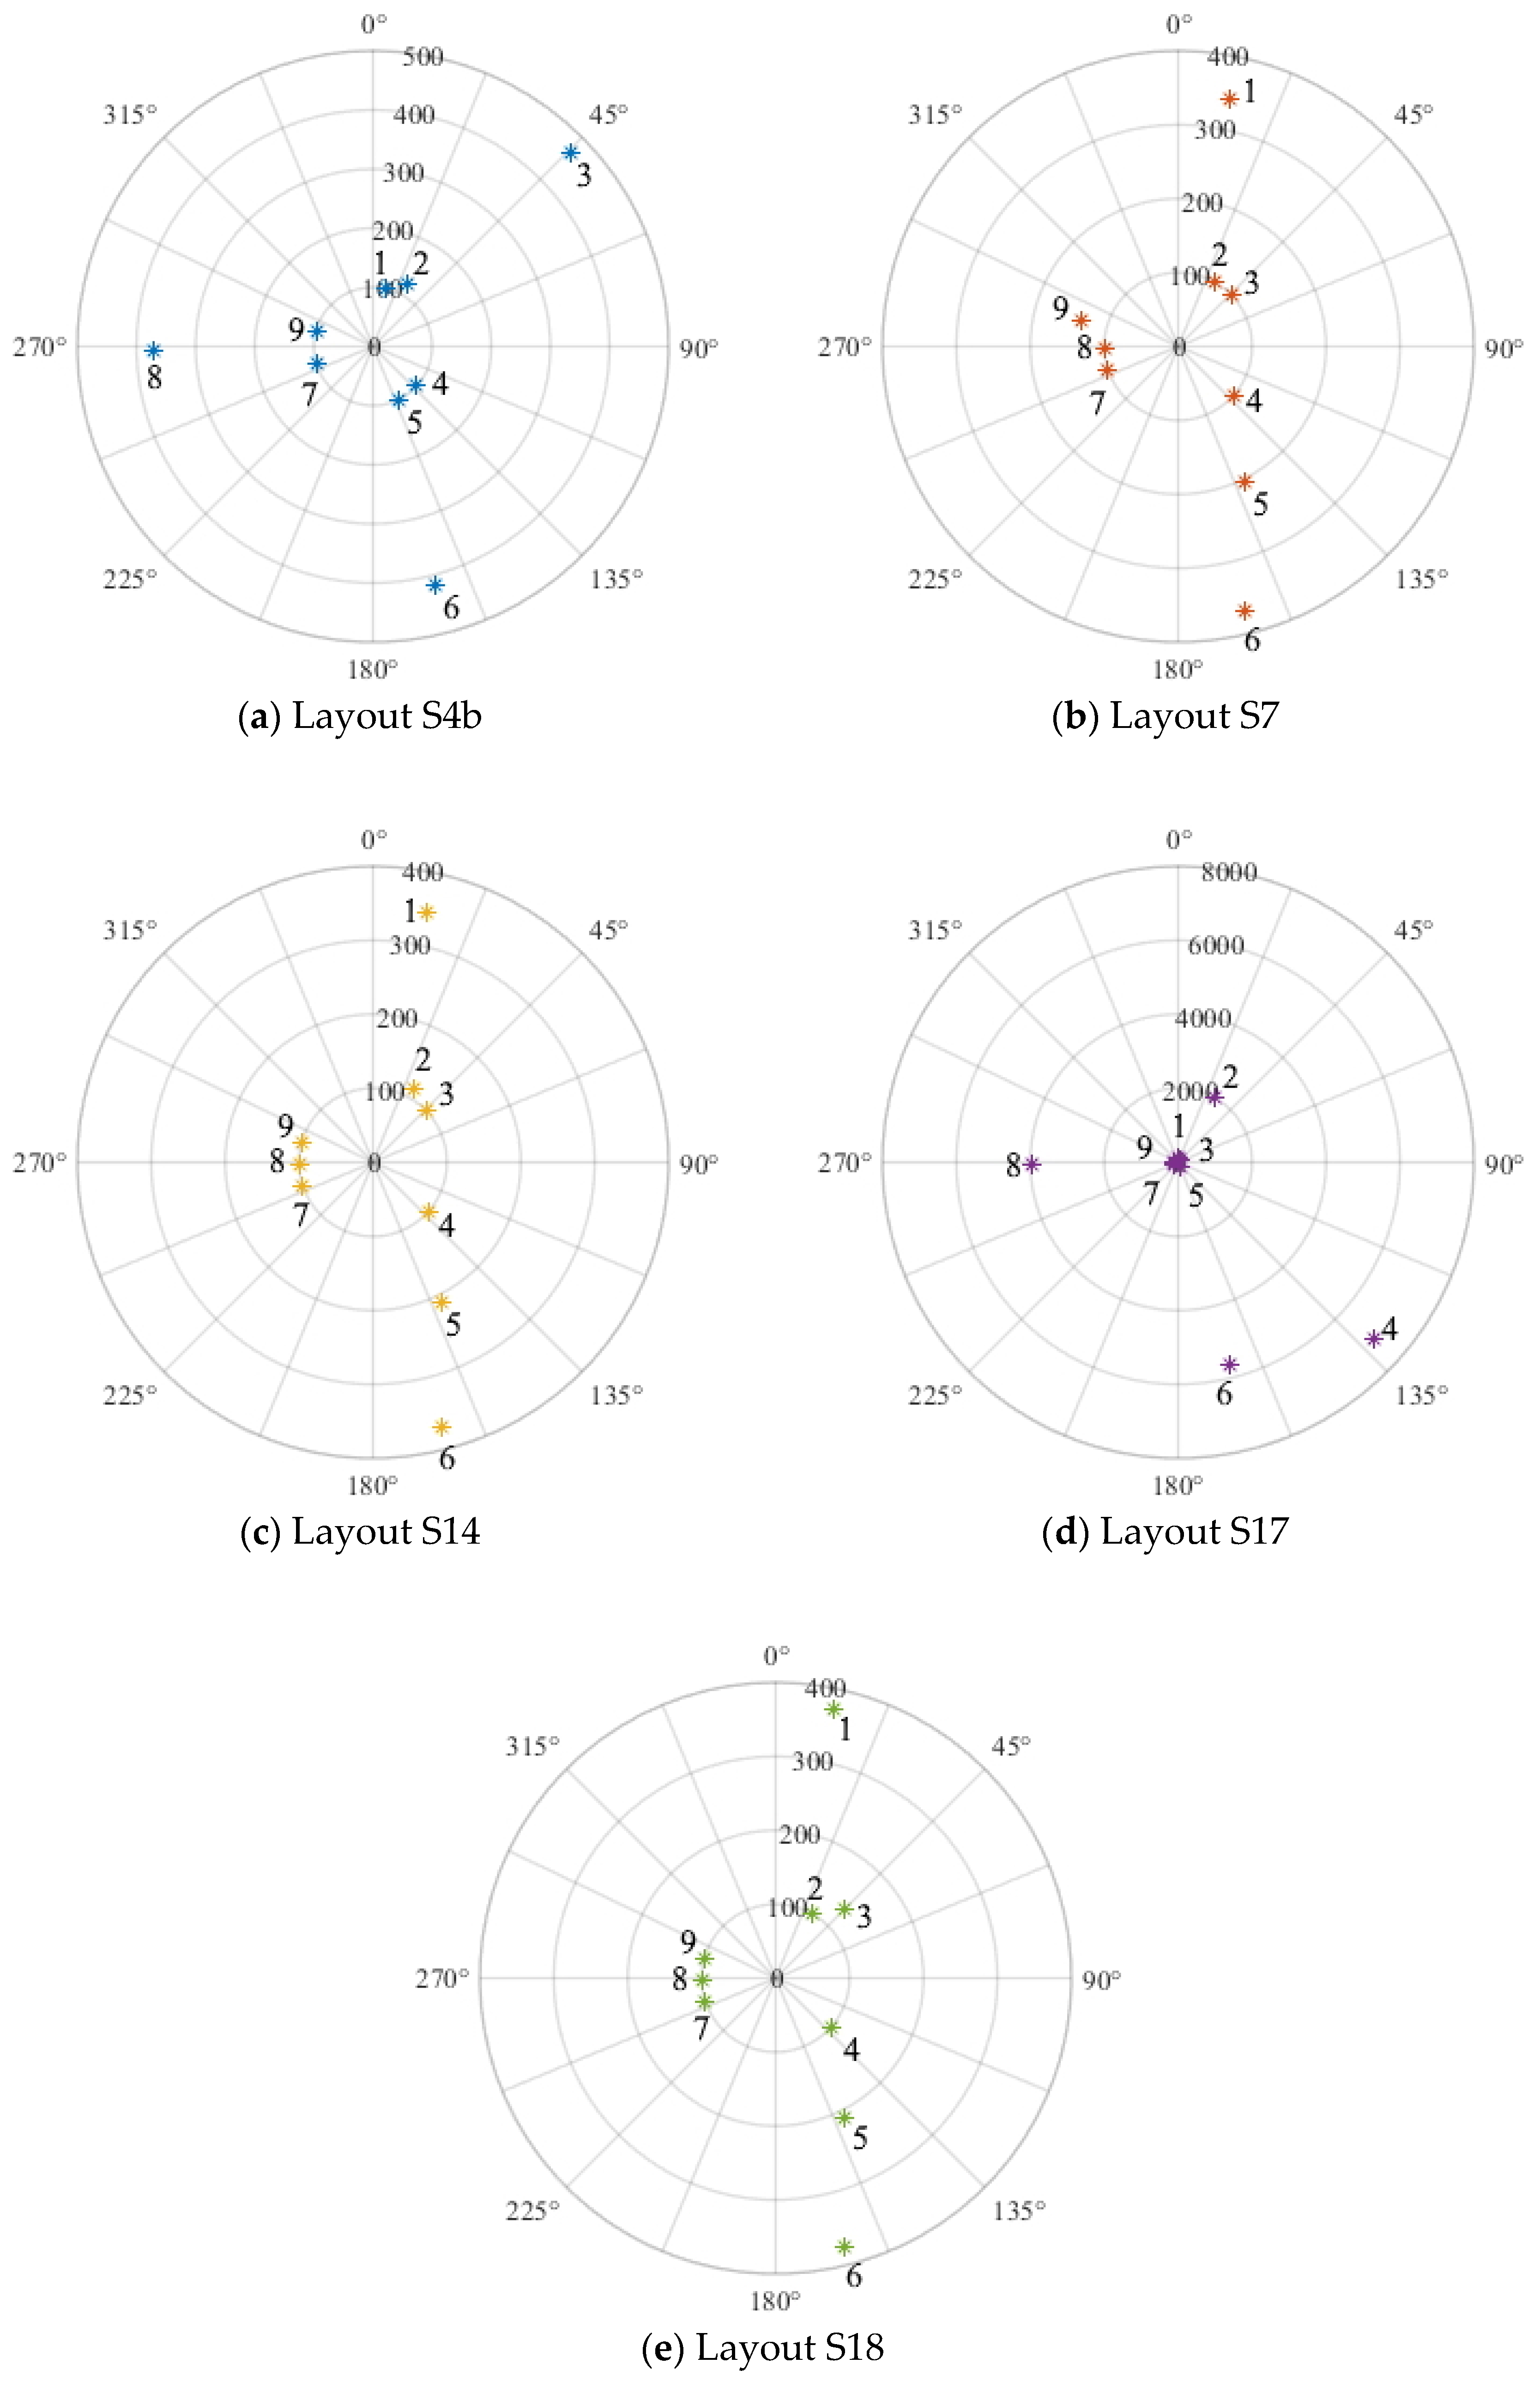
Considering that reconstruction is made on the hypothesis of undamaged structure, we first observe that the presence of the damage does not necessarily lead to remarkable errors in the reconstruction. Therefore, damage detection and localization cannot be accomplished without a more detailed analysis of the measurements of the single sensors. Moreover, the difference between the measured strain values and the reconstructed ones significantly depends on the spatial layout of the FBG sensors. The average reconstruction errors related to layouts S4b, S7 and S14 are in the order of 10-2, while larger differences are observed for layouts S17 and S18, of the order of 102 and 10, respectively. The significant errors observed for Layout S17 cannot be attributed only to the presence of a localized damage and are probably due to both the employment of sensor 5 (which is close to the damage) for the reconstruction and the closeness of all the reference sensors to the first mode shapes node.
For a further evaluation of the potential of using the proposed strain and displacement reconstruction technique for damage detection and localization, we use the strain deviation, Iε, that measures the deviation between measured and reconstructed strain at control sensors:
where is the L2 norm of a generic function of time, C indicates control sensors, β is the angular variable and t is time. We note that, for all considered sets of reference sensors, 5 modes are used for strain and displacement reconstruction, as in the proposed methodology the number of reference sensors and the number of modes must be at least the same [19].
In carrying out the method evaluation, the variation of Iε along with the angular coordinate is considered. Given that the reconstruction of the strain field on the cylindrical specimen is based on the undamaged configuration, the effective strain deviation on control sensors depends on the difference between the effective measured strain field and the incorrect reconstructed strain field.
If the method is suited for damage detection and localization, we expect a low value of the strain deviation on control sensors far from the damage and a higher value close to the damage.
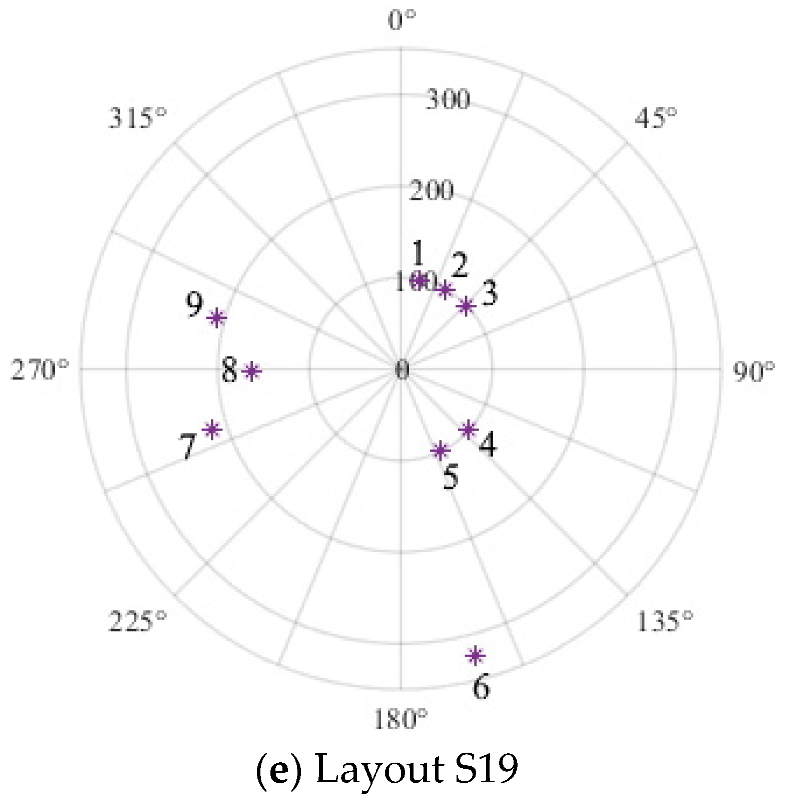
Iε values for each layout are represented in polar plots in Figure 6, where the strain deviation is calculated in both control and reference sensors. As the strain deviation on reference sensors is obviously null, to allow a clear graphical representation of Iε along the cylinder, each value of the Iε vector was increased by 100. The representation of Iε allows an immediate understanding of layouts effectiveness for damage detection. In particular, a radial coordinate near to 100, which means a small reconstruction error, should be an indication that the control sensor is far from the damage. As the position of the control sensor approaches damage, the value of Iε should increase. With the proposed measurement set, a good damage detection layout presents the higher values of Iε on sensor 6, which is the closest to the damage and is always used as a control sensor, and sensor 5, for those layouts where it is used as a control sensor.
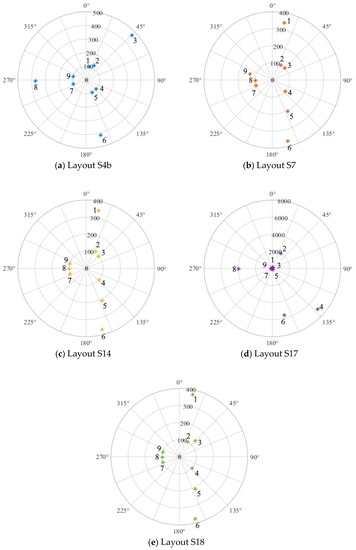
Figure 6.
Representation of the Iε values on the different sensors for the different layouts. To allow a clear graphical representation of Iε along the cylinder, each value of the Iε vector was increased by 100.
Figure 6 clearly shows that sensor 6 has the highest value of Iε in all the reconstructions, with the exception of layout S17, due the incorrect reconstruction (see Table 2). A deep focus on the polar plots, allows further considerations. Layout S4b, which shows a high Iε in sensor 6 but also in sensors 3 and 8, could give a good performance in terms of damage detection, but seems inadequate for damage localization. Distributed high Iε values are due to the presence of sensor 1 in the reference sensors set. Sensor 1 is near to the connection of the specimen to the sledge that slightly affects the real modal shapes, leading to an approximated strain reconstruction. By contrast, when sensor 1 is not a reference one, for example in Layout S7, the algorithm shows an effectiveness both for damage detection and localization, as the highest value of Iε is observed in sensors 5 and 6, which are the closest to damage. The high value of Iε in sensor 1 (used here as control sensor) confirms that real modal shapes are locally slightly different from ideal ones. Also Layouts S18 and S14 provide results similar to Layout S7.
In order to have a synthetic identification of the best layout for damage detection and localization, we define the following parameter:
where is the value of the deviation of the k-th sensor, the closest to the damage (i.e., sensor 6 in the present study) and is the mean deviation of the control sensors, being the k-th sensor excluded from the mean calculation.
With the aim of assessing the repeatability of the experimental tests, we repeated the same free falling test three times. The results summarized in Table 3 clearly show that the results observed in the first experimental test are confirmed in the other two tests. Moreover, with the exception of the results for layout 17, which are clearly related to the incorrect reconstruction, the higher is γ, the more effective is the reference and control sensors layout in damage detection and localization.

Table 3.
Values of γ for the different layouts in three repeated experimental tests.
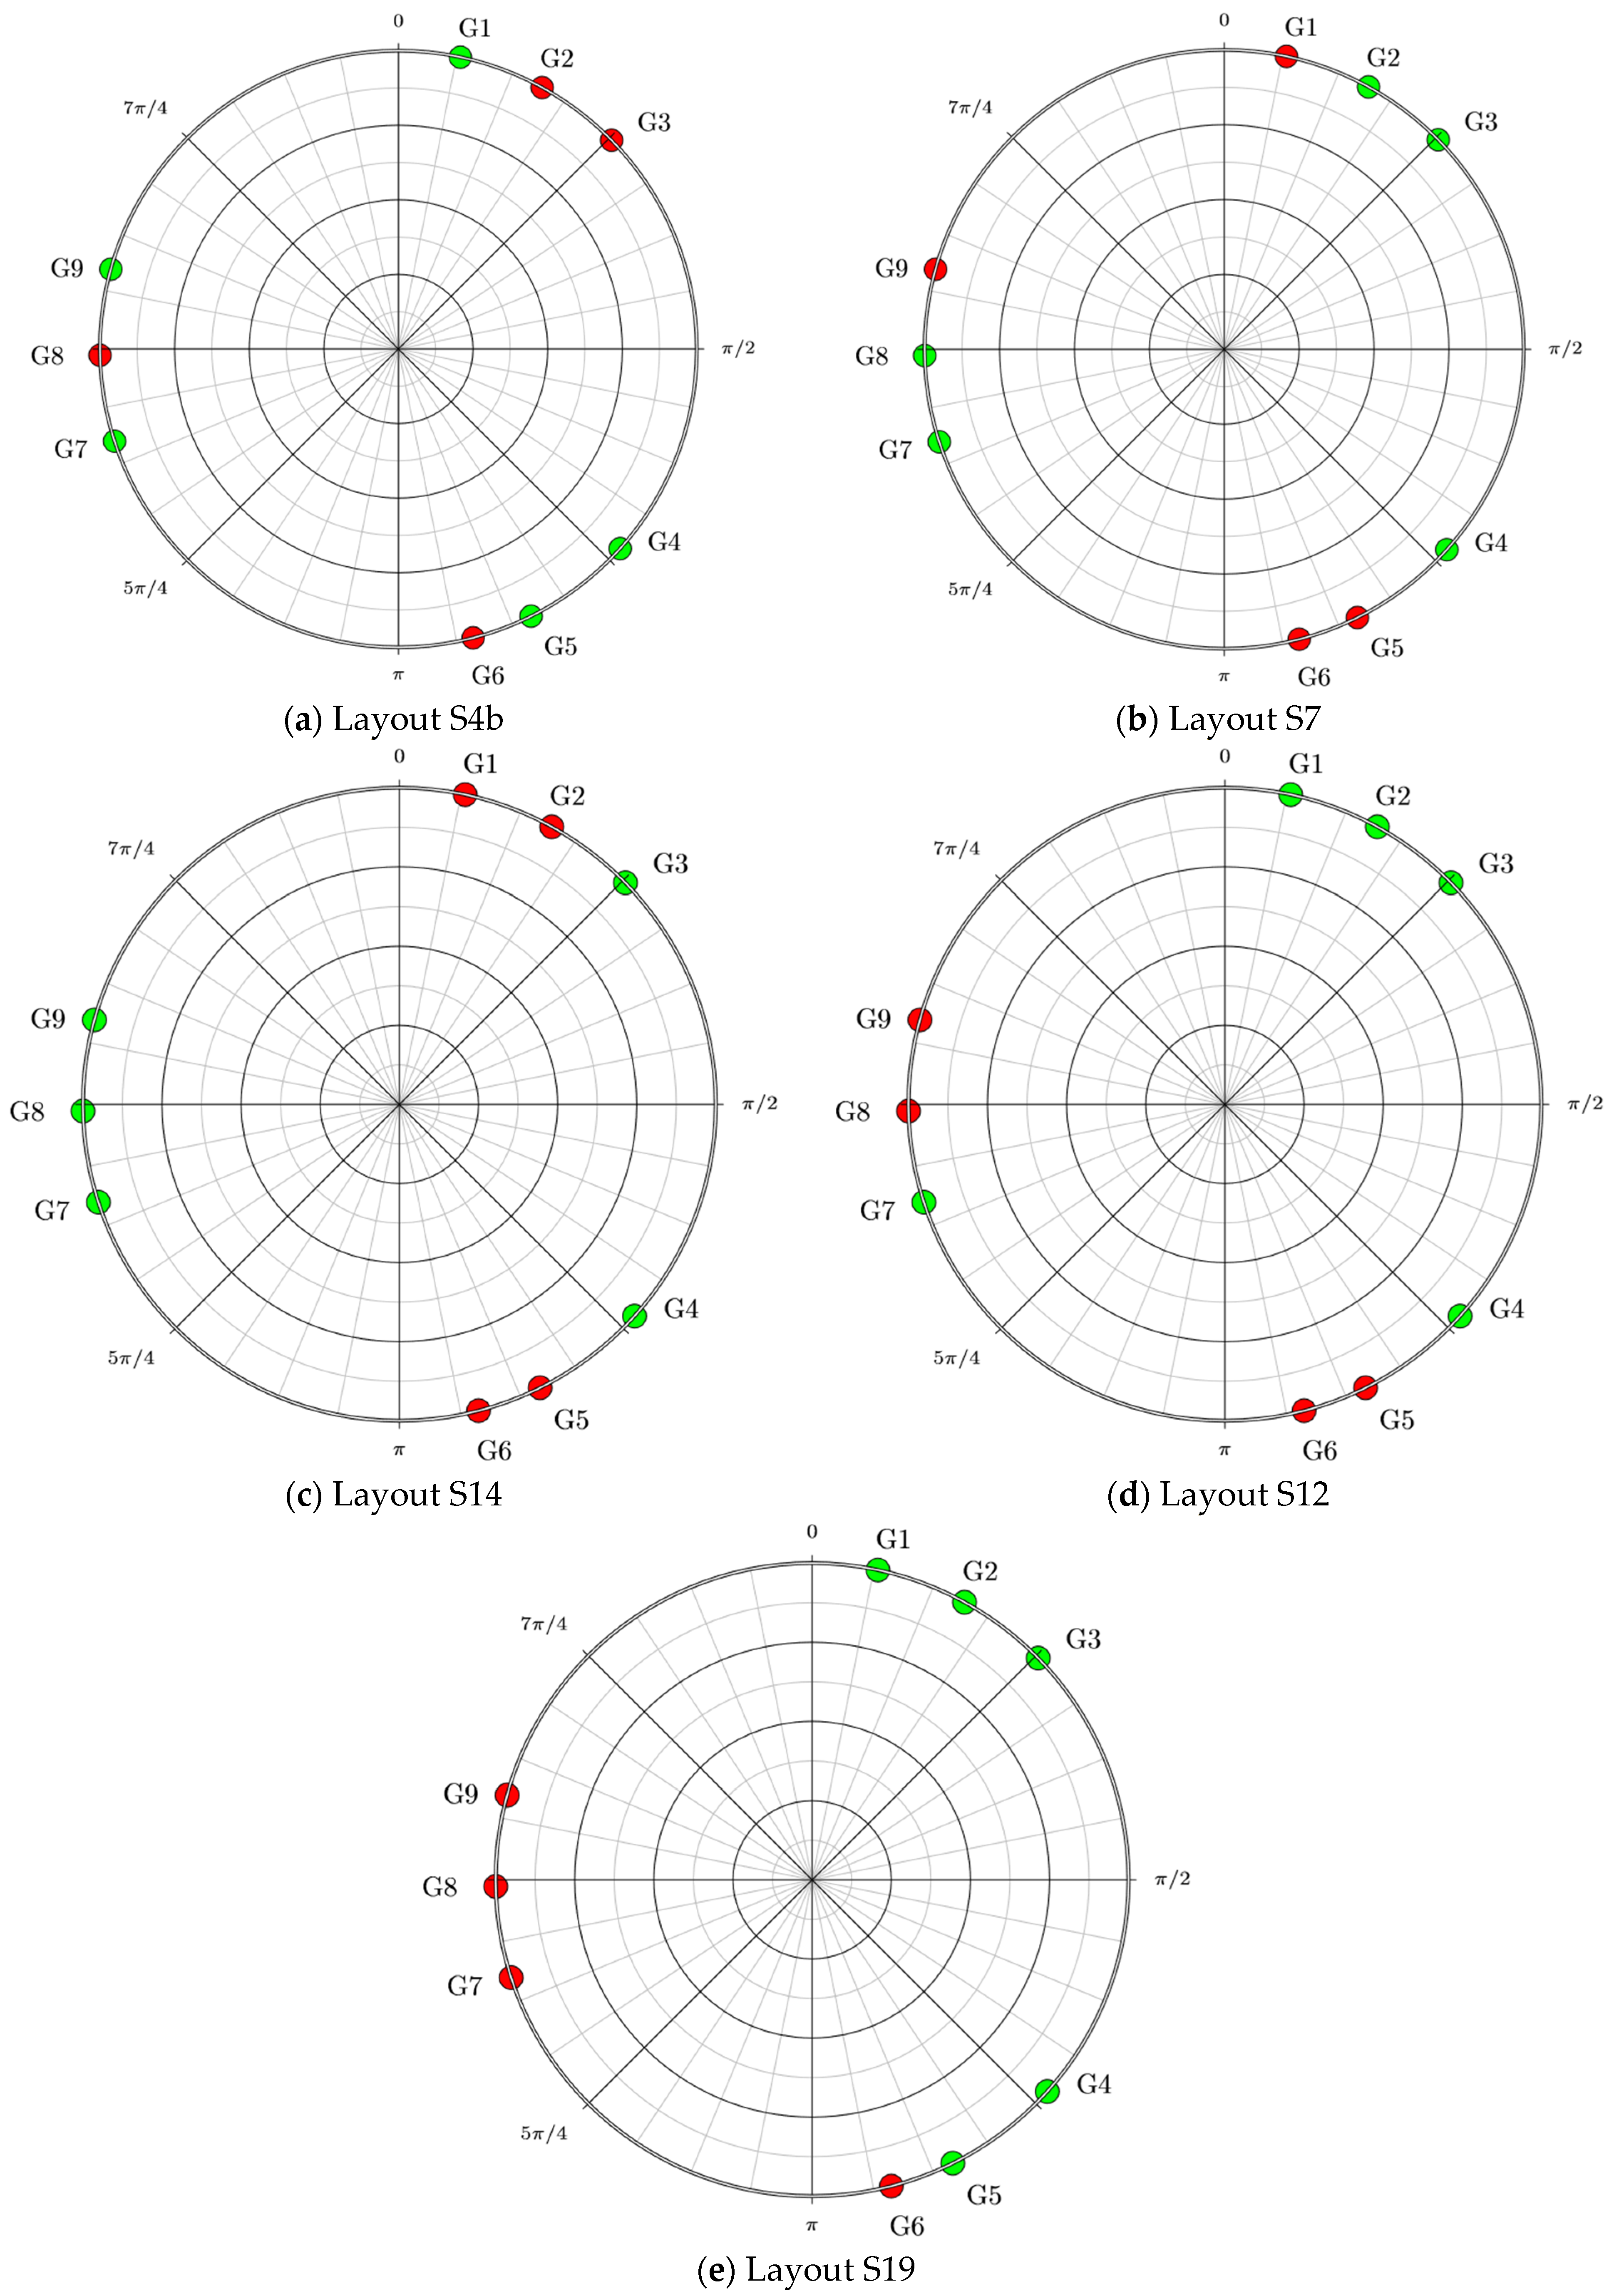
Experimental tests have been repeated increasing the sampling frequency from 683 to 859.1 Hz and changing layouts. The new set of analyzed layouts is represented in Figure 7 and the resulting reconstruction errors are shown in Table 4.
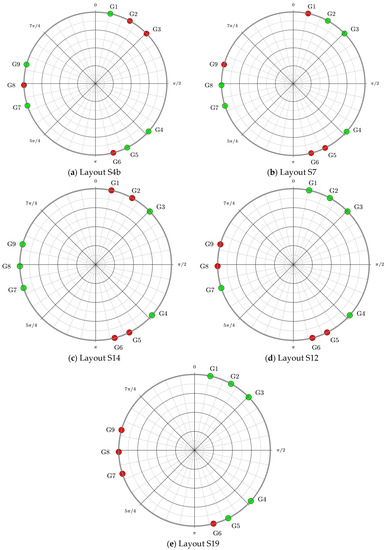
Figure 7.
Second set of analyzed layouts. Red points identify the position of control sensors while green points those of reference sensors.

Table 4.
Normalized errors on control sensors for each reconstruction layout.
In this case all the layouts result in deviations of the order of 10−3–10−2, with the exception of layout S14, whose errors are close to 0.15. Contrarily to the case of the S17 layout in the first experimental campaign, the difference between measured and reconstructed fields for layout S14 can be attributed to the presence of the damage and, therefore, we expect that also layout S14 may be suitable for damage detection and localization.
Table 5 summarizes the values of the parameter γ for eight repeated tests, clearly assessing the repeatability of the tests.

Table 5.
Values of γ for the different layouts in eight repeated experimental tests for the second experimental campaign.
Moreover, almost all layouts behave similarly and the increase in sampling frequency has a positive effect on damage detection. Layout S19 gives the lowest values of the whole set of layouts, probably because it exploits the fifth sensor, which is close to the damage, for the reconstruction. Layouts S7, S14 and S14b are all effective in damage detection.
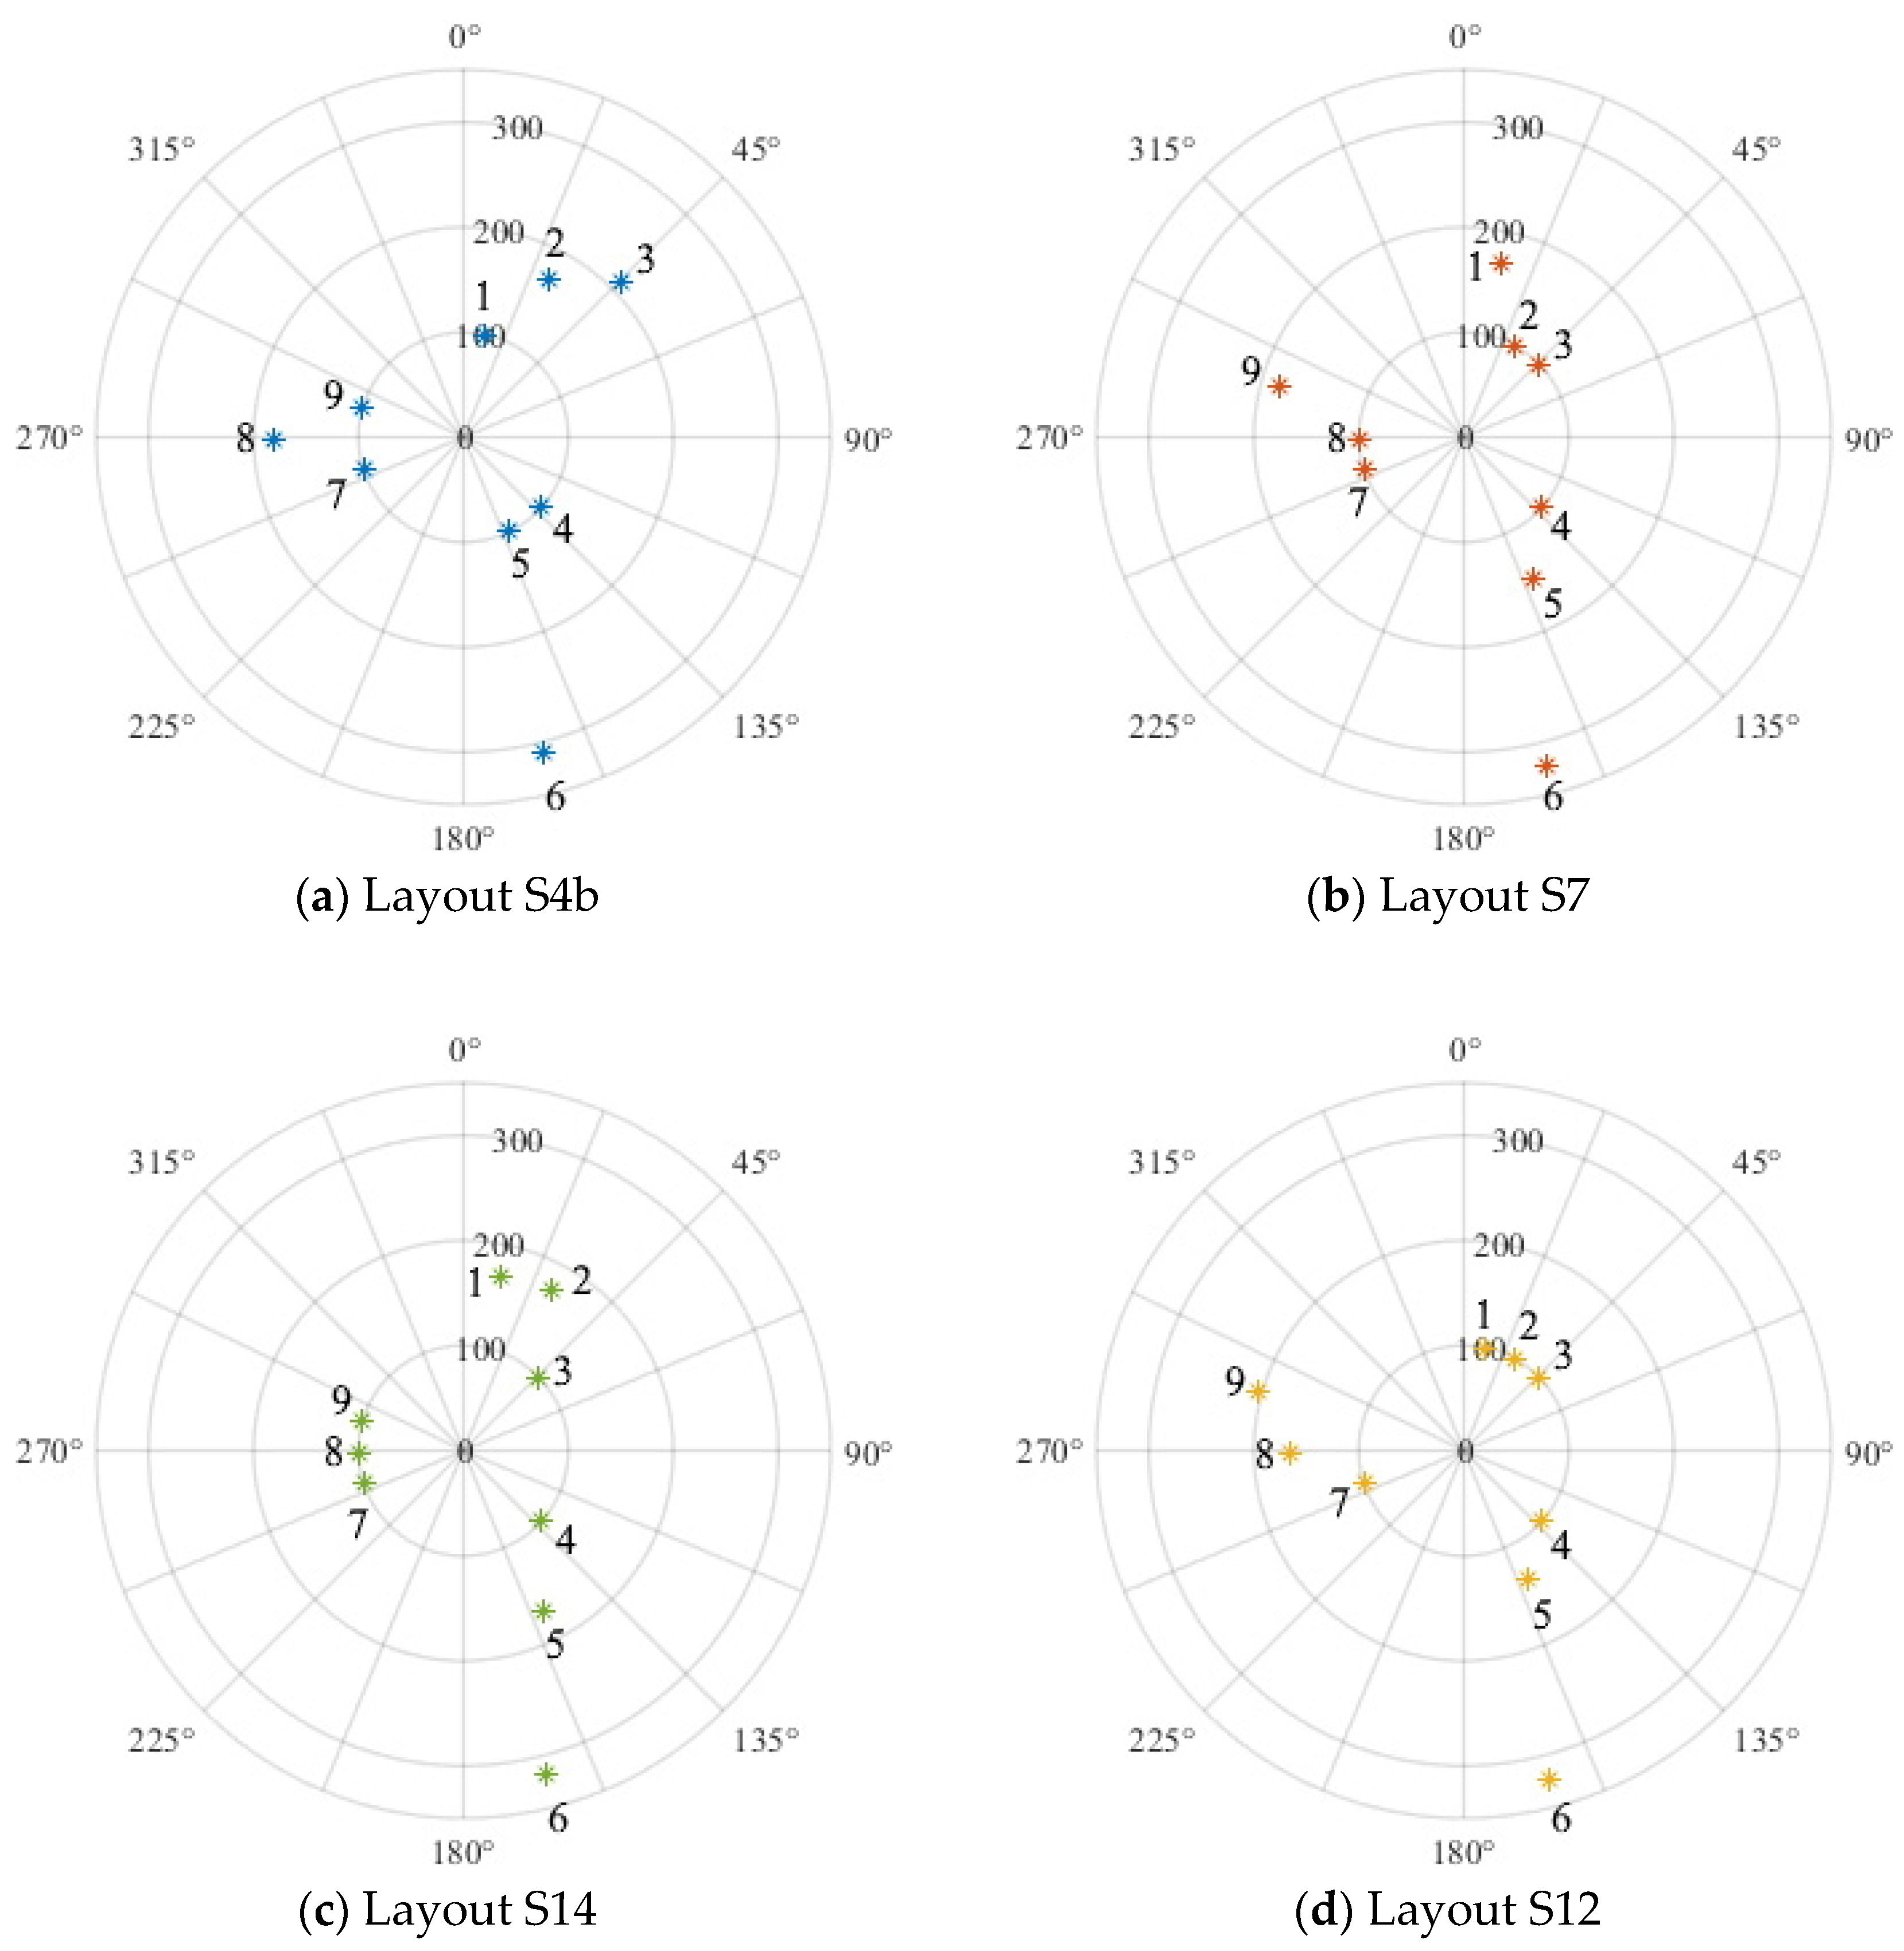
Figure 8 shows the Iε computed in the nine sensors for the different layouts. Again, as expected, the highest values of Iε are observed on sensor 6, which is the closest to the damage, and all the layouts show a sufficient damage detection and localization potential. The effectiveness of Layout S7 in damage localization is not fully satisfactory as Iε in sensors 1 and 9 is comparable to that in sensor 6. The same applies to Layout 12 which shows similar Iε for sensors 6 and 9. Layout S14 seems to be the best in damage detection and localization as Iε in sensor 6 is much higher than that in the other control sensors. Layout S19 provides the worst results Iε is similar in all the control sensors. This is probably related to a reconstruction based on the first five sensors of the measurement network, including the fifth sensors which are close to the damage.
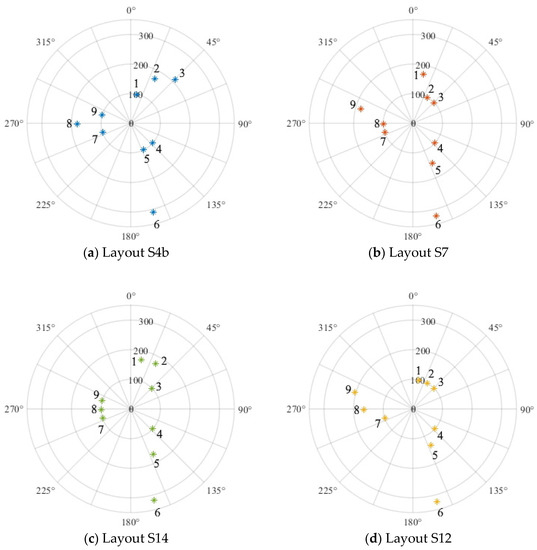
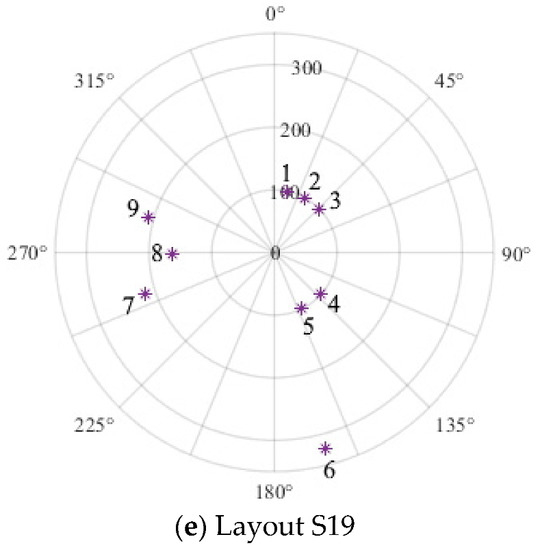
Figure 8.
Representation of the Iε values on the different sensors for the different layouts in the second experimental campaign. To allow a clear graphical representation of Iε along the cylinder, each value of the Iε vector was increased by 100.
5. Conclusions
The proposed reconstruction method, which represents an enhancement of previous works on local strain measurements, has been tested to evaluate both its effectiveness in strain and displacement fields reconstruction and its suitability for damage detection and localization. This application is based on the local strain data from FBG sensors, which can be used for reconstruction purposes (reference sensors) or damage detection (control sensors). Considering that strain and displacement reconstruction methods assume the structure to be in sound condition, the damage is expected to lead to inaccurate reconstructions. This could be exploited for an application for structural health monitoring and, in particular, for the real-time detection of damages.
An experimental campaign for the validation of the proposed methodology has been accomplished. Experimental tests have been carried out on a compliant cylinder with a small localized damage impacting the water after a free fall from 50 cm. Strain measurements are performed through nine FBGs and the analysis has been performed at two different sampling frequencies, 683 and 859.1 Hz.
First, the most suitable reconstruction layouts for the strain sensors have been identified, thanks to a deep focus on the characteristics of mode shapes, which represent the core of this method. Then, the aforementioned layouts have been analyzed in terms of errors in reconstruction and sensitivity to the presence of damage on the structure.
The nine sensors included in the measurement network have been divided into reference sensors, used for the reconstruction of the strain and displacement fields, and control sensors, employed for the calculation of a normalized error between reconstructed and measured strains, Iε. The same measurement of a single set of FBGs has been used for multiple analyses: by changing the choice of reference and control sensors, different layouts, each one with four control sensors and five reference sensors, are obtained. Given that the effective strain deviation on control sensors depends on the difference between the effective measured strain field and the incorrect reconstructed strain field, we observe a low value of the strain deviation on control sensors far from the damage and a higher value close to the damage. Moreover, to have an identification of the best layout for damage detection and localization, we defined a synthetic parameter, γ, which is the difference between the deviation of the k-th sensor, the closest to the damage and the mean deviation of the control sensors. We observed that the higher is γ, the more effective is the reference and control sensors layout in damage detection and localization.
It is worth noting that this result can be generalized to different and more complex geometries, as we demonstrated that given a set of strain sensors in a SHM system, possible damage could be detected by computing the same measurement multiple times exchanging control and reference sensors.
According to the results obtained, the proposed methodology has also shown its reliability in terms of damage reconstruction and localization, thus providing a novel, robust and validated tool for structural health monitoring purposes. Specifically, the small and localized damage considered in this paper is particularly challenging for damage detection. Local damage, in fact, slightly affects the modal shapes on which the monitoring procedure is based. The fact that the procedure succeeded in so challenging a case is promising for a broader application, i.e., other problems in which larger and more global damage is present. Future works will be aimed at extending the present experimental campaign to bodies of different and more complex shapes, with other types of damage.
Supplementary Materials
The following are available online at https://www.mdpi.com/2311-5521/6/2/58/s1, Video S1: Cylinder falling from a height of 50 cm above the free surface and impacting the water.
Author Contributions
Conceptualization, S.U., P.F.; E.J. and C.B.; methodology, P.F. and G.F.; software, P.F. and A.M.; investigation, G.F. and A.M.; writing—original draft preparation, A.M. and C.B.; writing—review and editing, all authors; supervision, E.J. and S.U.; project administration, C.B.; funding acquisition, C.B., P.F. and G.F. All authors have read and agreed to the published version of the manuscript.
Funding
This research has been supported by the Italian Ministry Program PRIN, grant n. 20154EHYW9 “Combined numerical and experimental methodology for fluid structure interaction in free surface flows under impulsive loading”, with Chiara Biscarini as the Principal Investigator.
Conflicts of Interest
The authors declare no conflict of interest.
References
- Abrate, S. Hull slamming. Appl. Mech. Rev. 2011, 64, 060803. [Google Scholar] [CrossRef]
- Faltinsen, O.M.; Landrini, M.; Greco, M. Slamming in marine applications. J. Eng. Math. 2004, 48, 187–217. [Google Scholar] [CrossRef]
- Russo, S.; Jalalisendi, M.; Falcucci, G.; Porfiri, M. Experimental characterization of oblique and asymmetric water entry. Exp. Therm. Fluid Sci. 2018, 92, 141–161. [Google Scholar] [CrossRef]
- Cha, Y.; Phan, C.; Porfiri, M. Energy exchange during slamming impact of an ionic polymer metal composite. Appl. Phys. Lett. 2012, 101, 094103. [Google Scholar] [CrossRef]
- Charca, S.; Shafiq, B.; Just, F. Repeated slamming of sandwich composite panels on water. J. Sandw. Struct. Mater. 2009, 11, 409–424. [Google Scholar] [CrossRef]
- Biscarini, C. Computational fluid dynamics modelling of landslide generated water waves. Landslides 2010, 7, 117–124. [Google Scholar] [CrossRef]
- Formaggia, L.; Miglio, E.; Mola, A.; Parolini, N. Fluid–structure interaction problems in free surface flows: Application to boat dynamics. Int. J. Numer. Methods Fluids 2008, 56, 965–978. [Google Scholar] [CrossRef]
- Kankanamge, S.L.; Mendis, P.; Ngo, T. Use of fluid structure interaction technique for flash flood impact assessment of structural components. J. Flood Risk Manag. 2020, 13, e12581. [Google Scholar] [CrossRef]
- Wu, M.; Moan, T. Numerical prediction of wave-induced long-term extreme load effects in a flexible high-speed pentamaran. J. Mar. Sci. Technol. 2006, 11, 39–51. [Google Scholar] [CrossRef]
- Zhao, X.; Gao, Y.; Cao, F.; Wang, X. Numerical modeling of wave interactions with coastal structures by a constrained interpolation profile/immersed boundary method. Int. J. Numer. Methods Fluids 2016, 81, 265–283. [Google Scholar] [CrossRef]
- Wang, S.; Soares, C.G. Review of ship slamming loads and responses. J. Mar. Sci. Appl. 2017, 16, 427–445. [Google Scholar] [CrossRef]
- Mousaviraad, S.M.; Wang, Z.; Stern, F. URANS studies of hydrodynamic performance and slamming loads on high-speed planing hulls in calm water and waves for deep and shallow conditions. Appl. Ocean Res. 2015, 51, 222–240. [Google Scholar] [CrossRef]
- Facci, A.L.; Falcucci, G.; Agresta, A.; Biscarini, C.; Jannelli, E.; Ubertini, S. Fluid Structure Interaction of Buoyant Bodies with Free Surface Flows: Computational Modelling and Experimental Validation. Water 2019, 11, 1048. [Google Scholar] [CrossRef]
- Yamamoto, Y.; Iida, K.; Fukasawa, T.; Murakami, T.; Arai, M. Ando A Structural damage analysis of a fast ship due to bow flare slamming. Int. Shipbuild. Prog. 1985, 32, 124–136. [Google Scholar] [CrossRef]
- Cavalagli, N.; Biscarini, C.; Facci, A.L.; Ubertini, F.; Manciola, P. Experimental analysis on slamming reduction in rectangular liquid tanks subjected to harmonic motion. In Proceedings of the AIP Conference Proceedings, Maharashtra, India, 5–6 July 2018; AIP Publishing LLC.: Melville, NY, USA, 2018; Volume 1978, p. 420006. [Google Scholar]
- Cavalagli, N.; Biscarini, C.; Facci, A.L.; Ubertini, F.; Ubertini, S. Experimental and numerical analysis of energy dissipation in a sloshing absorber. J. Fluids Struct. 2017, 68, 466–481. [Google Scholar] [CrossRef]
- Panciroli, R.; Ubertini, S.; Minak, G.; Jannelli, E. Experiments on the dynamics of flexible cylindrical shells impacting on a water surface. Exp. Mech. 2015, 55, 1537–1550. [Google Scholar] [CrossRef]
- Panciroli, R.; Biscarini, C.; Falcucci, G.; Jannelli, E.; Ubertini, S. Live monitoring of the distributed strain field in impulsive events through fiber Bragg gratings. J. Fluids Struct. 2016, 61, 60–75. [Google Scholar] [CrossRef]
- Panciroli, R.; Biscarini, C.; Jannelli, E.; Ubertini, F.; Ubertini, S. Dynamic monitoring of compliant bodies impacting the water surface through local strain measurements. In Proceedings of the Sensors and Smart Structures Technologies for Civil, Mechanical, and Aerospace Systems, San Diego, CA, USA, 21–24 March 2016; International Society for Optics and Photonics: Bellingham, WA, USA, 2016; Volume 9803, p. 980335. [Google Scholar]
- Fanelli, P.; Biscarini, C.; Jannelli, E.; Ubertini, F.; Ubertini, S. Structural health monitoring of cylindrical bodies under impulsive hydrodynamic loading by distributed FBG strain measurements. Meas. Sci. Technol. 2017, 28, 024006. [Google Scholar] [CrossRef]
- Fanelli, P.; Facci, A.L.; Russo, S. Influence of sensors layout in damage monitoring of cylindrical bodies under impulsive hydrodynamic loading. In Proceedings of the International Conference of Numerical Analysis and Applied Mathematics, Rhodes, Greece, 13–18 September 2018; AIP Publishing: Melville, NY, USA, 2018; Volume 1978, p. 420009. [Google Scholar]
- Fanelli, P.; Facci, A.L.; Jannelli, E. Live crack damage detection with local strain measurement on solid bodies subjected to hydrodynamic loading. Procedia Struct. Integr. 2018, 8, 539–551. [Google Scholar] [CrossRef]
- Fanelli, P.; Trupiano, S.; Belardi, V.G.; Vivio, F.; Jannelli, E. Structural health monitoring algorithm application to a powerboat model impacting on water surface. Procedia Struct. Integr. 2019, 24, 926–938. [Google Scholar] [CrossRef]
- Fanelli, P.; Mercuri, A.; Trupiano, S.; Falcucci, G.; Jannelli, E. Live reconstruction of global loads on a powerboat using local strain FBG measurements. Procedia Struct. Integr. 2019, 24, 949–960. [Google Scholar] [CrossRef]
- Russo, S.; Biscarini, C.; Facci, A.L.; Falcucci, G.; Jannelli, E.; Ubertini, S. Experimental assessment of buoyant cylinder impacts through high-speed image acquisition. J. Mar. Sci. Technol. 2018, 23, 67–80. [Google Scholar] [CrossRef]
- Faltinsen, O.; Kjaerland, O.; Nøttveit, A.; Vinje, T. Water impact loads and dynamic response of horizontal circular cylinders in offshore structures. In Proceedings of the Offshore Technology Conference, Houston, TX, USA, 2–5 May 1977. [Google Scholar]
- Khabakhpasheva, T.I. Fluid–structure interaction during the impact of a cylindrical shell on a thin layer of water. J. Fluids Struct. 2009, 25, 431–444. [Google Scholar] [CrossRef]
- Lin, M.C.; Shieh, L.D. Flow visualization and pressure characteristics of a cylinder for water impact. Appl. Ocean Res. 1977, 19, 101–112. [Google Scholar] [CrossRef]
- Sun, H.; Faltinsen, O.M. Water impact of horizontal circular cylinders and cylindrical shells. Appl. Ocean Res. 2006, 28, 299–311. [Google Scholar] [CrossRef]
- Van Nuffel, D.; Vepa, K.S.; de Baere, I.; Lava, P.; Kersemans, M.; Degrieck, J.; de Rouck, J.; van Paepegem, W. A comparison between the experimental and theoretical impact pressures acting on a horizontal quasi-rigid cylinder during vertical water entry. Ocean Eng. 2014, 77, 42–54. [Google Scholar] [CrossRef]
- Wei, Z.; Hu, C. An experimental study on water entry of horizontal cylinders. J. Mar. Sci. Technol. 2014, 19, 338–350. [Google Scholar] [CrossRef]
- Wei, Z.; Hu, C. Experimental study on water entry of circular cylinders with inclined angles. J. Mar. Sci. Technol. 2015, 20, 722–738. [Google Scholar] [CrossRef]
- Kashyap, R. Fiber Bragg Gratings; Academic Press: Cambridge, MA, USA, 2009. [Google Scholar]
- Grattan, K.T.V.; Sun, T. Fiber optic sensor technology: An overview. Sens. Actuators A Phys. 2000, 82, 40–61. [Google Scholar] [CrossRef]
- Silva-Munoz, R.A.; Lopez-Anido, R.A. Structural health monitoring of marine composite structural joints using embedded fiber Bragg grating strain sensors. Compos. Struct. 2009, 89, 224–234. [Google Scholar] [CrossRef]
- Kuang, K.; Kenny, R.; Whelan, M.P.; Cantwell, W.J.; Chalker, P.R. Embedded fibre Bragg grating sensors in advanced composite materials. Compos. Sci. Technol. 2001, 61, 1379–1387. [Google Scholar] [CrossRef]
- Guemes, J.A.; Menéndez, J.M. Response of Bragg grating fiber-optic sensors when embedded in composite laminates. Compos. Sci. Technol. 2002, 62, 959–966. [Google Scholar] [CrossRef]
- Kuang, K.S.C.; Cantwell, W.J. Use of conventional optical fibers and fiber Bragg gratings for damage detection in advanced composite. Appl. Mech. Rev. 2003, 56, 493–513. [Google Scholar] [CrossRef]
Publisher’s Note: MDPI stays neutral with regard to jurisdictional claims in published maps and institutional affiliations. |
© 2021 by the authors. Licensee MDPI, Basel, Switzerland. This article is an open access article distributed under the terms and conditions of the Creative Commons Attribution (CC BY) license (http://creativecommons.org/licenses/by/4.0/).

