Article

Mechanical and Dynamic Maps of Disc Brakes under Different Operating Conditions

by
R. A. García-León
*,
N. Afanador-García
and
J. A. Gómez-Camperos
Facultad de Ingeniería, Universidad Francisco de Paula Santander Ocaña, Ocaña CP 546552, Colombia
*
Author to whom correspondence should be addressed.
Fluids 2021, 6(10), 363; https://doi.org/10.3390/fluids6100363
Submission received: 18 August 2021 / Revised: 4 October 2021 / Accepted: 5 October 2021 / Published: 13 October 2021
(This article belongs to the Collection Challenges and Advances in Heat and Mass Transfer)

Abstract

:
The operating conditions during the braking process in an automobile affect the tribological contact between the pad and disc brake, thus, influencing the times and distances of braking and, in a more significant way, the safety of the braking process. This mathematical work aimed to provide a general visualization of the disc brake’s mechanical, dynamic, and thermal behavior under different operating conditions through 2D maps of the power dissipated, braking time, and braking distance of a disc brake with a ventilation blade N- 38 type. However, the dissipated energy on the disc brake in terms of temperature was analyzed considering Newton’s cooling law and mathematical calculations through classical theories of the dynamic and mechanical behavior of the disc brakes. For this purpose, the Response Surface Methodology (RSM) and Distance Weighted Least Squares (DWLS) fitting model considered different operating conditions of the disc brake. The results demonstrate that the disc brakes can be used effectively in severe operational requirements with a speed of 100 km/h and an ambient temperature of 27 °C, without affecting the occupant’s safety or the braking system and the pad. For the different conditions evaluated, the instantaneous temperature reaches values of 182.48 and 82.94 °C, where the high value was found for a total deceleration to 100 km/h to 0, which represent a total braking distance of around 44.20 to 114.96 m depending on the inclination angle (θ). Furthermore, the energy dissipation in the disc brakes depends strongly on the disc, blades and pad geometry, the type of material, parameters, and the vehicle operating conditions, as can be verified with mathematical calculation to validate the contribution of the effectiveness of the braking process during its real operation.

Graphical Abstract

1. Introduction

Disc brakes are fundamental elements to maintain maneuverability and, above all, safety in any vehicle, whether rotary or linear and that of its occupants. Braking systems work by taking advantage of friction to slow down the moving vehicle through mechanical contact between two surfaces (pad and disc brake). Depending on the application, there are currently different brake types, which are drum, band, disc, and conical. In particular, for the automotive sector, the most common is the disc auto-ventilated type at the front part and the drum type at the rear part [1,2]. Disc brakes differ from other types in that the applied force is normal to the disc herd and not radial, as in drum and band brakes, the friction moment does not help the actuation moment (self-energizing effect), as occurs in drum and band brakes. This behavior allows slight changes in the friction coefficient not to affect the braking force required to stop the car [3,4].
During the braking process, different factors are involved in the effectiveness of this process, resulting in an interest in knowing the influence of parameters/factors such as deceleration, kinetic energy, execution force, braking force, vehicle weight, surface in contact, the friction coefficient, adhesion coefficient, vehicle aerodynamics, maximum braking force, road incline, distance, and braking time, mainly by applying mathematical calculations or simulation [5,6,7].
To provide a broader perspective on the behavior of the disc brakes, García-León [8] selected three classes of commonly used disc brakes to perform mathematical calculations and simulations for evaluating the behavior of each disc geometry. The results showed that the discs with a superficial temperature higher than 80 °C could dissipate the heat in 40–60 min through natural convection and airspeed air in the surroundings equal to zero. Likewise, García and Flórez [9] studied the dynamics and kinetics of the brake system, outset with the mathematical calculation of the pedal to simulate the behavior through Finite Element Analysis (FEA) with the aid of the Solidworks simulation software. The results of their simulations showed that the geometry of the ventilation blades is an essential point for the design of disc brakes. García and Flórez [10] analyzed, under different theories of heat transfer, the evacuation of the heat to the surroundings (air) for three different disc brakes. The results show that by using CFD in the Solidworks simulation software, the distribution of heat transfers by convection in a disc rotating at high temperature through a horizontal airflow duct was studied, obtaining the behavior of the speed and temperature inside the ventilation blades, along with the geometry of the three-disc brakes. Baron et al. [11] investigated different disc brakes to evaluate the efficiency and performance using the Finite Element Method (FEM) under extreme operating conditions. The results indicate that the disc-assessed brakes can be used in severe conditions, consistently providing high safety levels under FEM or FEA simulations. Riva et al. [12] developed mechanical modeling approaches to know the wear and emission dependence considering the contact pressure and sliding speed during motion and found good results from the measured variables.
On the other hand, García-León et al. [13] proposed a new geometric arrangement to improve airflow in a common vehicular disc brake, considering the ventilation blades based on NACA 66-209 type aerodynamic profiles; this purpose was used particle image velocimetry (PIV) technique. The results indicate that a configuration of 20 blades improves heat dissipation [14,15]. A similar study proposes a new geometric arrangement to enhance the airflow in a vehicular disc brake, considering the ventilation pillars based on N-38 type aerodynamic profiles. It was evidenced that as the speed of the vehicle increases, the suction force is greater; that is, the test length is shorter for each one. Moreover, for a higher speed, the airflow counteracts the amount of heat generated at the moment of braking, as there is more energy to reduce [16]. García-León et al. [17] evaluated five different geometries of disc brake to design a new disc with improved heat transfer properties using N-38 type blades. With these blades, the temperature dissipation was around 23.8%, related to the others studied through CFD analysis using ANSYS. The results indicated that the heat dissipation depends on the geometry of the disc and the blades, the material from which it is manufactured, the pad’s material, the weight of the vehicle, and the operating conditions.
Different authors have developed maps to evaluate different operating conditions on disc brakes. Wahlström et al. [18] reported contact pressures and sliding speed maps of the friction wear and debris promoted as a product of mechanical contact. The results indicated that 2D maps are a useful tool for understanding the material’s behavior under different experimental conditions. Candeo et al. [19] developed frictional maps of material without Cu to evaluate the performance of the disc brake considering the maximum disc temperature and deceleration. The results indicate that decelerations increased strongly with the contact pressure and decreased slightly when the sliding speed increased.
The present study aims to provide a general visualization of the mechanical, dynamic, and thermal behavior on the performance of a disc brake with N-38 type blades. This is because, in the open literature, no studies have recently developed 2D maps using the RSM and DWSL fitting model considering different operating conditions of a disc brake. For this purpose, mechanic, dynamic and thermal laws in a mathematical way were taking into account in this study.

2. Materials and Methods

The disc brake is the element attached to the wheel hub rotating simultaneously with the vehicle’s speed, forming the mobile element of the braking system. Against the surface or friction area of the disc brake, the pads interact with is performed to the vehicle is stopped thanks to the continuous friction that is established between the pads and the disc. Notice that during this process, the transformation of kinetic energy into thermal energy is generated, which in many cases produces an increased temperature in the braking system [20,21,22]. The use of self-ventilated disc brakes (with ventilation channels) is widespread today for all four vehicle wheels. Figure 1a shows a 3D view and parts of a common ventilated disc brake.
The mechanical, physical, and thermal properties of nodular gray cast iron of laminar graphite (main material used to manufacturing disc brakes) are summarized in Table 1, obtained from different references to develop mathematical calculations. For the case of properties with range values, the maximum value was considered to estimate the severe operational condition of the disc brake.

2.1. Disc Brake Geometry

The N-38 type ventilation blade geometry improves heat dissipation during the braking process is proposed after analyzing the previous results in other studies. According to [13], an increase in the number of blades on the disc brake geometry with the block effect design does not promote low speed and provides better performance on the heat dissipation. Figure 1 shows the disc brake used: (a) 3D view, (b) transparent view, and (c) blade geometry. The disc brake analyzed had the following considerations: DExternal = 0.350 m, DInner = 0.200 m, DBell = 0.080 m, and NBlade = 12, for a rim designation 275/30/R-19. On the other hand, the contact area between the disc brake and pad is calculated with the following expression A contact = 2 × π × ( r ext 2 r int 2 ) , where a value of 0.5183 m2 was obtained considering the assumptions from Figure 1 (rext = 0.350 m and rint = 0.200 m) for the overall mathematical calculations developed to the dynamic maps obtained.

2.2. Mathematical Equations Applied to Disc Brakes

The braking force is the driver’s pressure on the brake pedal to execute the braking process. Depending on the force applied to the pedal, the higher efficiency of the process is obtained. On the other hand, the conditions of mathematical calculations are considered suitable concerning experimental and numerical calculations [17,29]. The mathematical analysis of the brake system is associated with braking force, resistance coefficient, rolling coefficient, deceleration, pedal force, peripheral speed, dissipated energy, braking deceleration, and dissipated power that aid to obtain the thermal calculations such as rise in temperature, surface temperature, and instantaneous temperature applying Newton’s cooling law. Therefore, considering the above mathematical calculations, dynamic mathematical equations had a place in analyzing the in-depth way the performance of the braking process in terms of braking time and braking distance under different operating conditions in everyday life, thus obtain the 2D maps with DWSL fitting model. Notice that the calculations are related to particles in motion, and in this way, the operating conditions of the brake system can be obtained mathematically.
All equations were obtained from [1,17,30] from different bibliographic sources. The disc brake characteristics considered in this study depend on the vehicle and disc brake capacity with the geometry detailed in Figure 1. Thus, a disc brake of 4.5 kg for a vehicle mass of 2,000 kg was analyzed to provide a general visualization of the physical, mechanical, and thermal behavior of the disc brakes under different operating conditions. Notice that a sliding speed of 100 km/h (27.77 m/s) and 27 °C of environmental temperature were taken into account for mathematical calculations. However, Table 2 summarized the different speeds in km/h considered to develop the mathematical calculations for the braking distance and braking time with the aim to simplify understanding of the mechanical, dynamic, and thermal calculations in the following section.
Mathematical calculations (mechanical, dynamic and, thermal) were developed considering the assumptions proposed by [17], and the equations used are summarized in Table 3. Notice that this calculation is consecutive of each of these, which means that in order to use Equation (7), it is necessary to have calculated Equation (1). The main objective of using these equations is to provide a general way to analyze the performance of the braking process and thus develop different assumptions, considerations, and improvements for the analysis of this kind of automotive system.
Equation (11) was used to obtain the energy of the disc brake (heat dissipation), and therefore it must be dissipated as quickly as possible to avoid overheating, thus maintaining the braking system’s safety. The energy behavior depends strongly on the disc, blades, and pad geometry, the type of material of the disc brake and pad, functional parameters, and the vehicle operating conditions. Firstly, for this calculation, it is considered that the motor does not act as a disc brake, then the safety coefficient is increased. As a general rule, in the event of any emergency on the road, it is advised to perform a dry braking act not only on the brake but also on the clutch since the rotating masses of the vehicle’s transmission system are disarticulated. Secondly, to calculate the friction force between the disc and the pad, it is necessary to apply the adhesion factor between the road and the tire equal to 0.85 under dry road conditions [32].
The heat dissipation of the disc brake is mainly attributable to the action of the convection coefficient. The equations used for this calculation are summarized in Table 4. When temperatures of at least 300 °C are generated in the braking process, the radiation coefficient acts as dissipating the heat. The calculations developed at 100 Km/h do not generate enough heat for the radiation to affect the braking area. This also depends on the material properties of the disc brake [33,34]. Moreover, the dynamic equations are summarized in Table 5.

2.3. Response Surface Maps

The Response Surface Methodology (RSM) and the Distance Weighted Least Squares (DWLS) fitting model were used with the aid of statistical software to plot the behavior of the different mechanical and dynamic parameters such as speed, inclination angle on the response variable as power dissipated by the braking system, braking time, and braking distance [35]. The aim of surface plots (2D maps) is to describe the behavior of a response variable in a function of different parameters. The contour lines, or isolines, represent the points and combinations between the factors X and Y without adjusting the data based on a statistical model [36]. The DWLS model functions perfectly to expose the real behavior of the measurement variables when there are fewer than five samples on the experimental design. Notice that this model does not adjust a statistical method to approach the data’s behavior, only to make a representative plot of the experimental data [37]. 2D maps obtained showed a color scale where green has fewer values, and red is high; additionally, blue dots on the maps are the calculated value for the assumed mathematical conditions. Moreover, the 2D maps provide information about the contour plots with the maximum-minimum value according to the color on the map.

3. Results and Discussions

3.1. Mechanical and Dynamic Results

Table 6 presents the most relevant parameters and dimensions of the disc brake analyzed, such as rolling coefficient, rolling resistance, maximum braking deceleration, braking force, pedal force, peripheral disc speed, the contact area between the pad and disc, and braking performance. Notice that the deceleration is constant for the disc analyzed concerning the speed for each angle of descent (θ, theta). It was observed that the vehicle braking deceleration as to the angle of descent increases, the decelerations increase because the gravitational resistance increases, considering that, in this particular case, it is also a propelling force. It is important to mention that the results of the Equations presented in Table 6 were used to develop 2D maps, considering Equations (13), (17), and (18) under different braking operating conditions.
Currently, in many cases, the driver could not exert enough force to stop the vehicle at the ideal distance; therefore, the force is multiplied using levers or hydraulic circuits, thus obtaining a greater friction force. During real braking conditions, the maximum braking force on all four wheels of the vehicle is difficult to achieve simultaneously due to the weight distribution on the vehicle (passengers, road incline, undulations) being variable. This action determines its limit of adhesion, which varies dynamically during the braking process. The weight distribution on the wheels is too variable, and the operating conditions change every fraction of a second.
Notice that maximum deceleration (aMax) for a vehicle inclination angle of θ = 0 is equal to 8.3385, where, compared with the calculating in Equation (12), there is a difference of 0.981 when it is determined that the deceleration fulfills each condition of descent during the sliding. The value of aMax is exceeded when the angle reaches a value of the inclination angle of θ = 10, considering that it is the negative variation in the speed; that is, the physical magnitude that expresses the passage of a moving body from one speed to another with lower speed, always following the same path. These results are similar to those reported by [38]. However, it is possible to determine the adhesion coefficient (μ) mathematically for a dry road with an average speed of 100 km/h at 27 °C, where for a new tire under dry and wet conditions, the μ value will be 0.80. On the other hand, it was observed that the braking force of a braking system for a vehicle that circulates on a dry concrete or asphalt surface, at different masses, and with a rolling resistance coefficient of 0.015.
The braking efficiency is the magnitude of the braking system performance, where the vehicle must stop at a required time and distance, according to the operating conditions and the force applied on the brake pedal; in this way, the effectiveness of the braking system is considered to reach 100% when the measured deceleration is equal to the acceleration due to gravity. From Figure 2, it was observed that when the inclination angle and speed difference increased, the braking system required more energy power to be dissipated (red areas), with values around 930,003.35 to 510,794.44 W. On the other hand, lesser H values were found for speed difference values of 5 m/s for all ranges of inclination angles with values around 102,085.31 to 185,866.71 W product, with less energy to dissipate according to the speed that the vehicle had (green areas). Notice that a light increase is evidenced when the inclination degree is more than 10, with severe power dissipating energy at a high sliding speed of the vehicle as a product of the kinetic energy.
As is observed in Figure 3, considering the calculations developed using Equation (17), the braking time increased with speed and decreased with the angle of descent, with present values around 0.65 to 1.73 s. However, high values were found at high speed and high inclination angle with values around 4.72 to 8.67 s. This behavior is due to more inclination angle; the vehicle needs more energy to dissipate the energy that generates during movement. Therefore, for this calculation, the reaction time of the driver tRC is not considered, which is the time that arises from when there is an unforeseen circumstance until the driver acts on the brake pedal; the value varies between 0.5 and 2.0 s. In addition, the reaction time of the tRS system is not considered, which is the time that elapses from when the brake pedal is actuated until the required force is achieved; this is an approximate value of 3 s. On the other hand, the aerodynamic actions are not considered since the aerodynamic resistance affects the vehicle from more than 90–100 km/h.
The braking distance is an important parameter to design brake discs due to the safety and performance during the braking process. This dynamic parameter is the time that the driver delays when performing this process (this assumption was not considered in the calculation). The drivers should always maintain a safe distance between the front vehicle, considering that it may generate severe braking. To calculate this dynamic parameter is important to consider the speed during the vehicle motion, which depends on many parameters such as vehicle mass, road condition, tires quality, disc brake type, pad type, and others. According to [38], the phase of effective braking occurs during the phase of settled braking without wheels locked, resulting in high deceleration values at the constant braking phase and the end, where at the same time, this variable increases with the initial sliding speed of the vehicle. However, the results from the mathematical calculations in this study indicated that inclination angle exhibits deceleration values from 7.358 to 10.712 for 0 and 20 theta (θ) degrees, respectively, which is influenced mainly by the braking force and vehicle mass. These results are similar to those reported by [9,39].
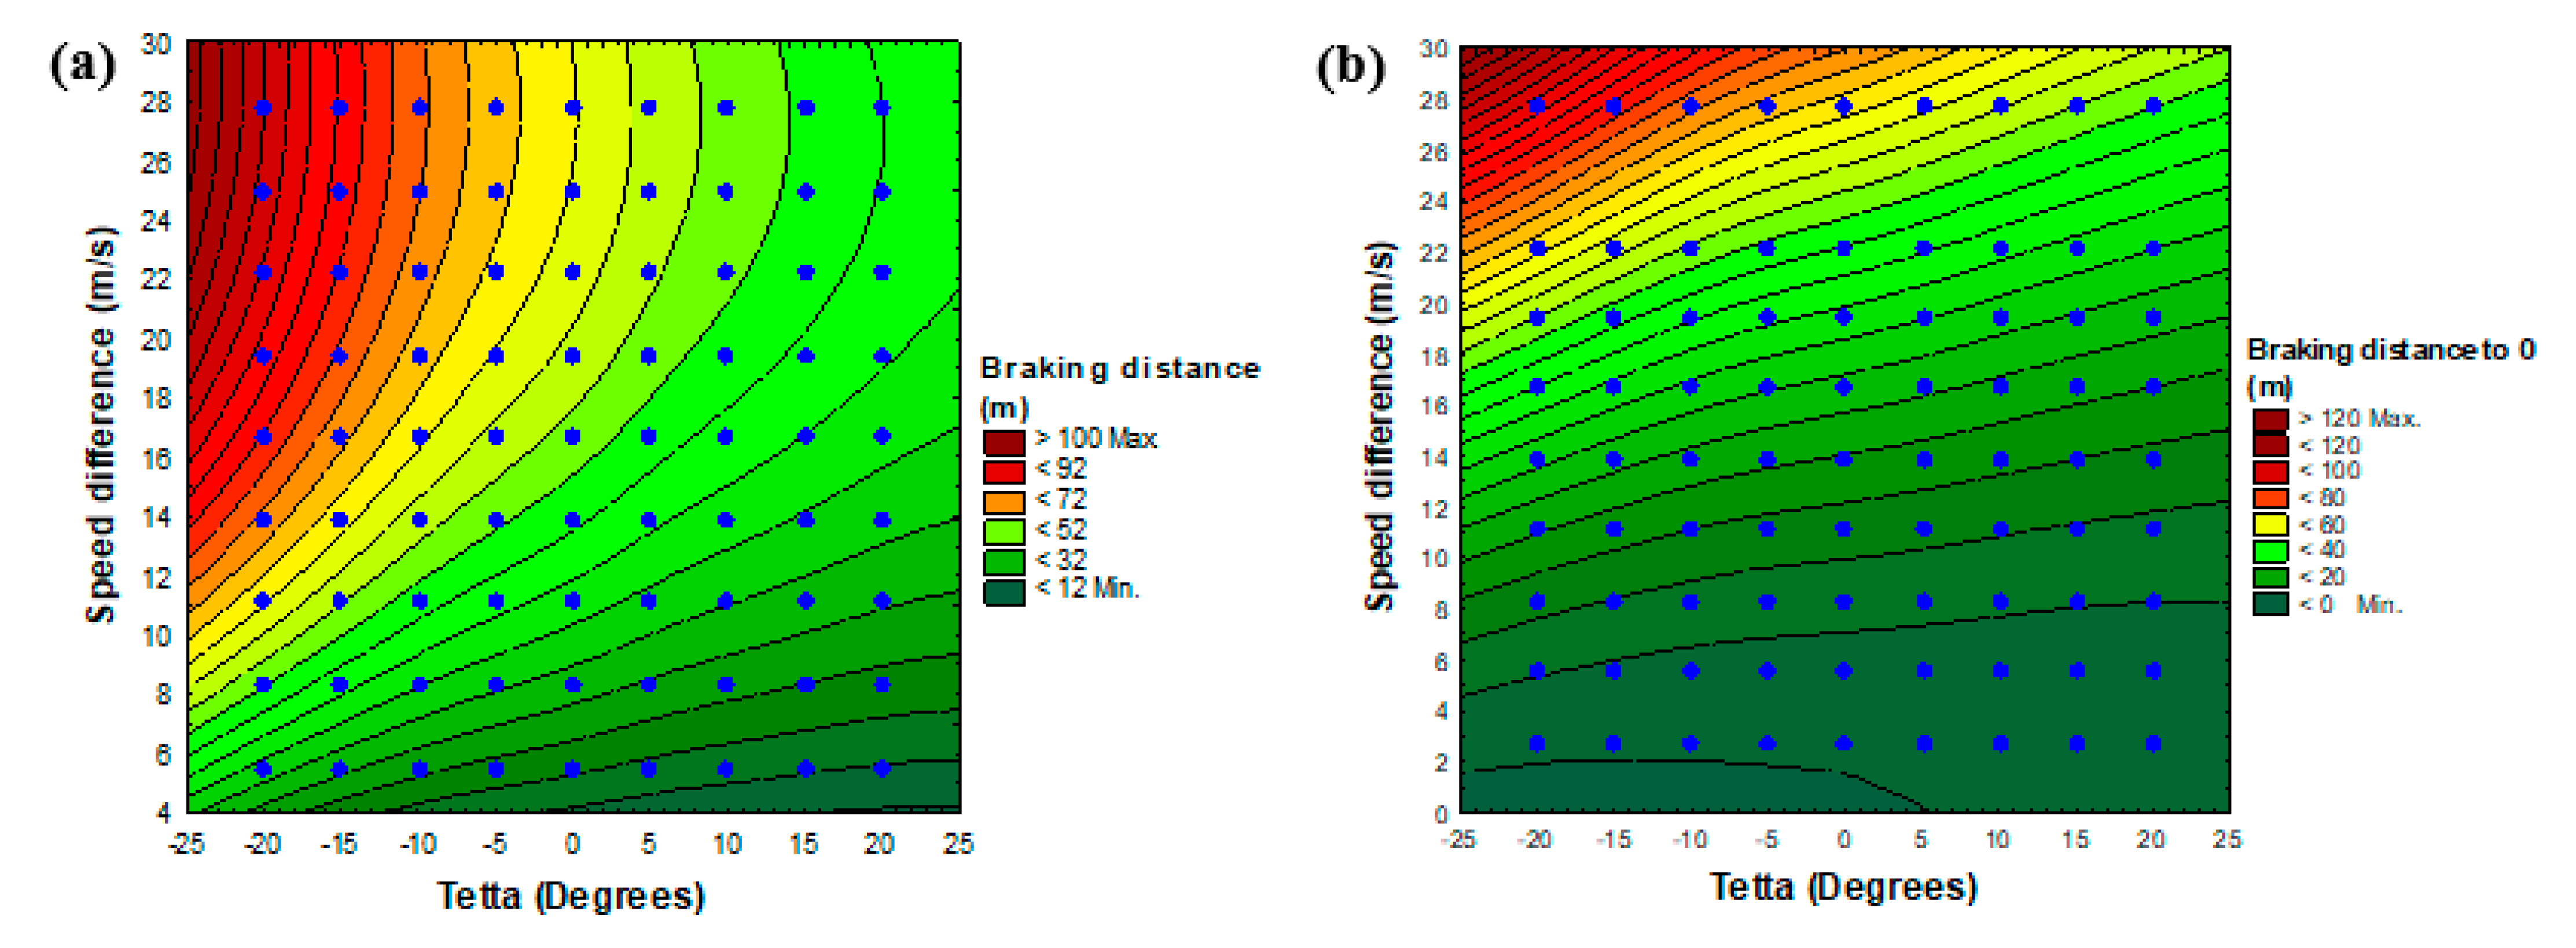
The braking distance was calculated, as is shown in Figure 4 using Equation (18). Figure 4a shows a high pronunciation value of braking distance when the inclination angle increases in a negative way (0 to −20) influenced by the increase in the speed difference of more than 10 m/s that change with positive values of inclination angle, thus obtaining a total braking distance of around 63.85 to 114.96 m (red areas) and 40.15 to 22.60 m (green areas). Figure 4b shows the behavior of the braking distance to decelerate the vehicle until cero. Notice that the braking distance behavior is less than a gradual with speed difference, where a maximum braking distance reach values of around 44.20 to 114.96 m (red areas), which appears from a speed difference of more than 22 m/s for the inclination angles in a negative way (0 to −20), for the remaining 2D map green areas dominate with values around 0.45 to 31.70 m. Moreover, from Figure 4b, blue mathematical points calculated are not presented for 25 m/s because of the assumptions shown in Table 2 for the operating conditions of the disc brake.
The braking progression is a mechanical process where the physical and kinetic energy act considering the mass and speed with the vehicle moves. When braking in a progressive way, the energy turns into heat and disappears by the braking action. In the opposite case, when severely braking, the energy is absorbed by the vehicle and the occupants; thus, the bodily injury gravity increase by the speed when the braking.

3.2. Thermal Results

Table 7 summarized the main thermal variables calculated in terms of energy for the disc brake with N-38 type ventilation blades, obtaining values similar to those reported by [40,41]. By considering Equation (15), it was possible to obtain the instantaneous temperature on the surface of the disc brake; thus, Equation (16) was used to obtain the cooling time considering Newton’s law under natural convection (that is, the air in the environment must have a speed equal to zero [1,15,42]) under intervals of 100 s. Notice that natural convection during cooling is the addition of the convection in the bell and the periphery of the disc brake, considering the assumptions previously mentioned for the mathematical calculations. It is important to mention that the dissipation heat is influenced by the geometry and material of the disc brake (a big disc brake provides quick heat dissipation and performance of the braking process). Different operating conditions (mass, speed, and roadway conditions) of the vehicle affect the braking system’s performance, and thus energy and temperature values of the disc brake [
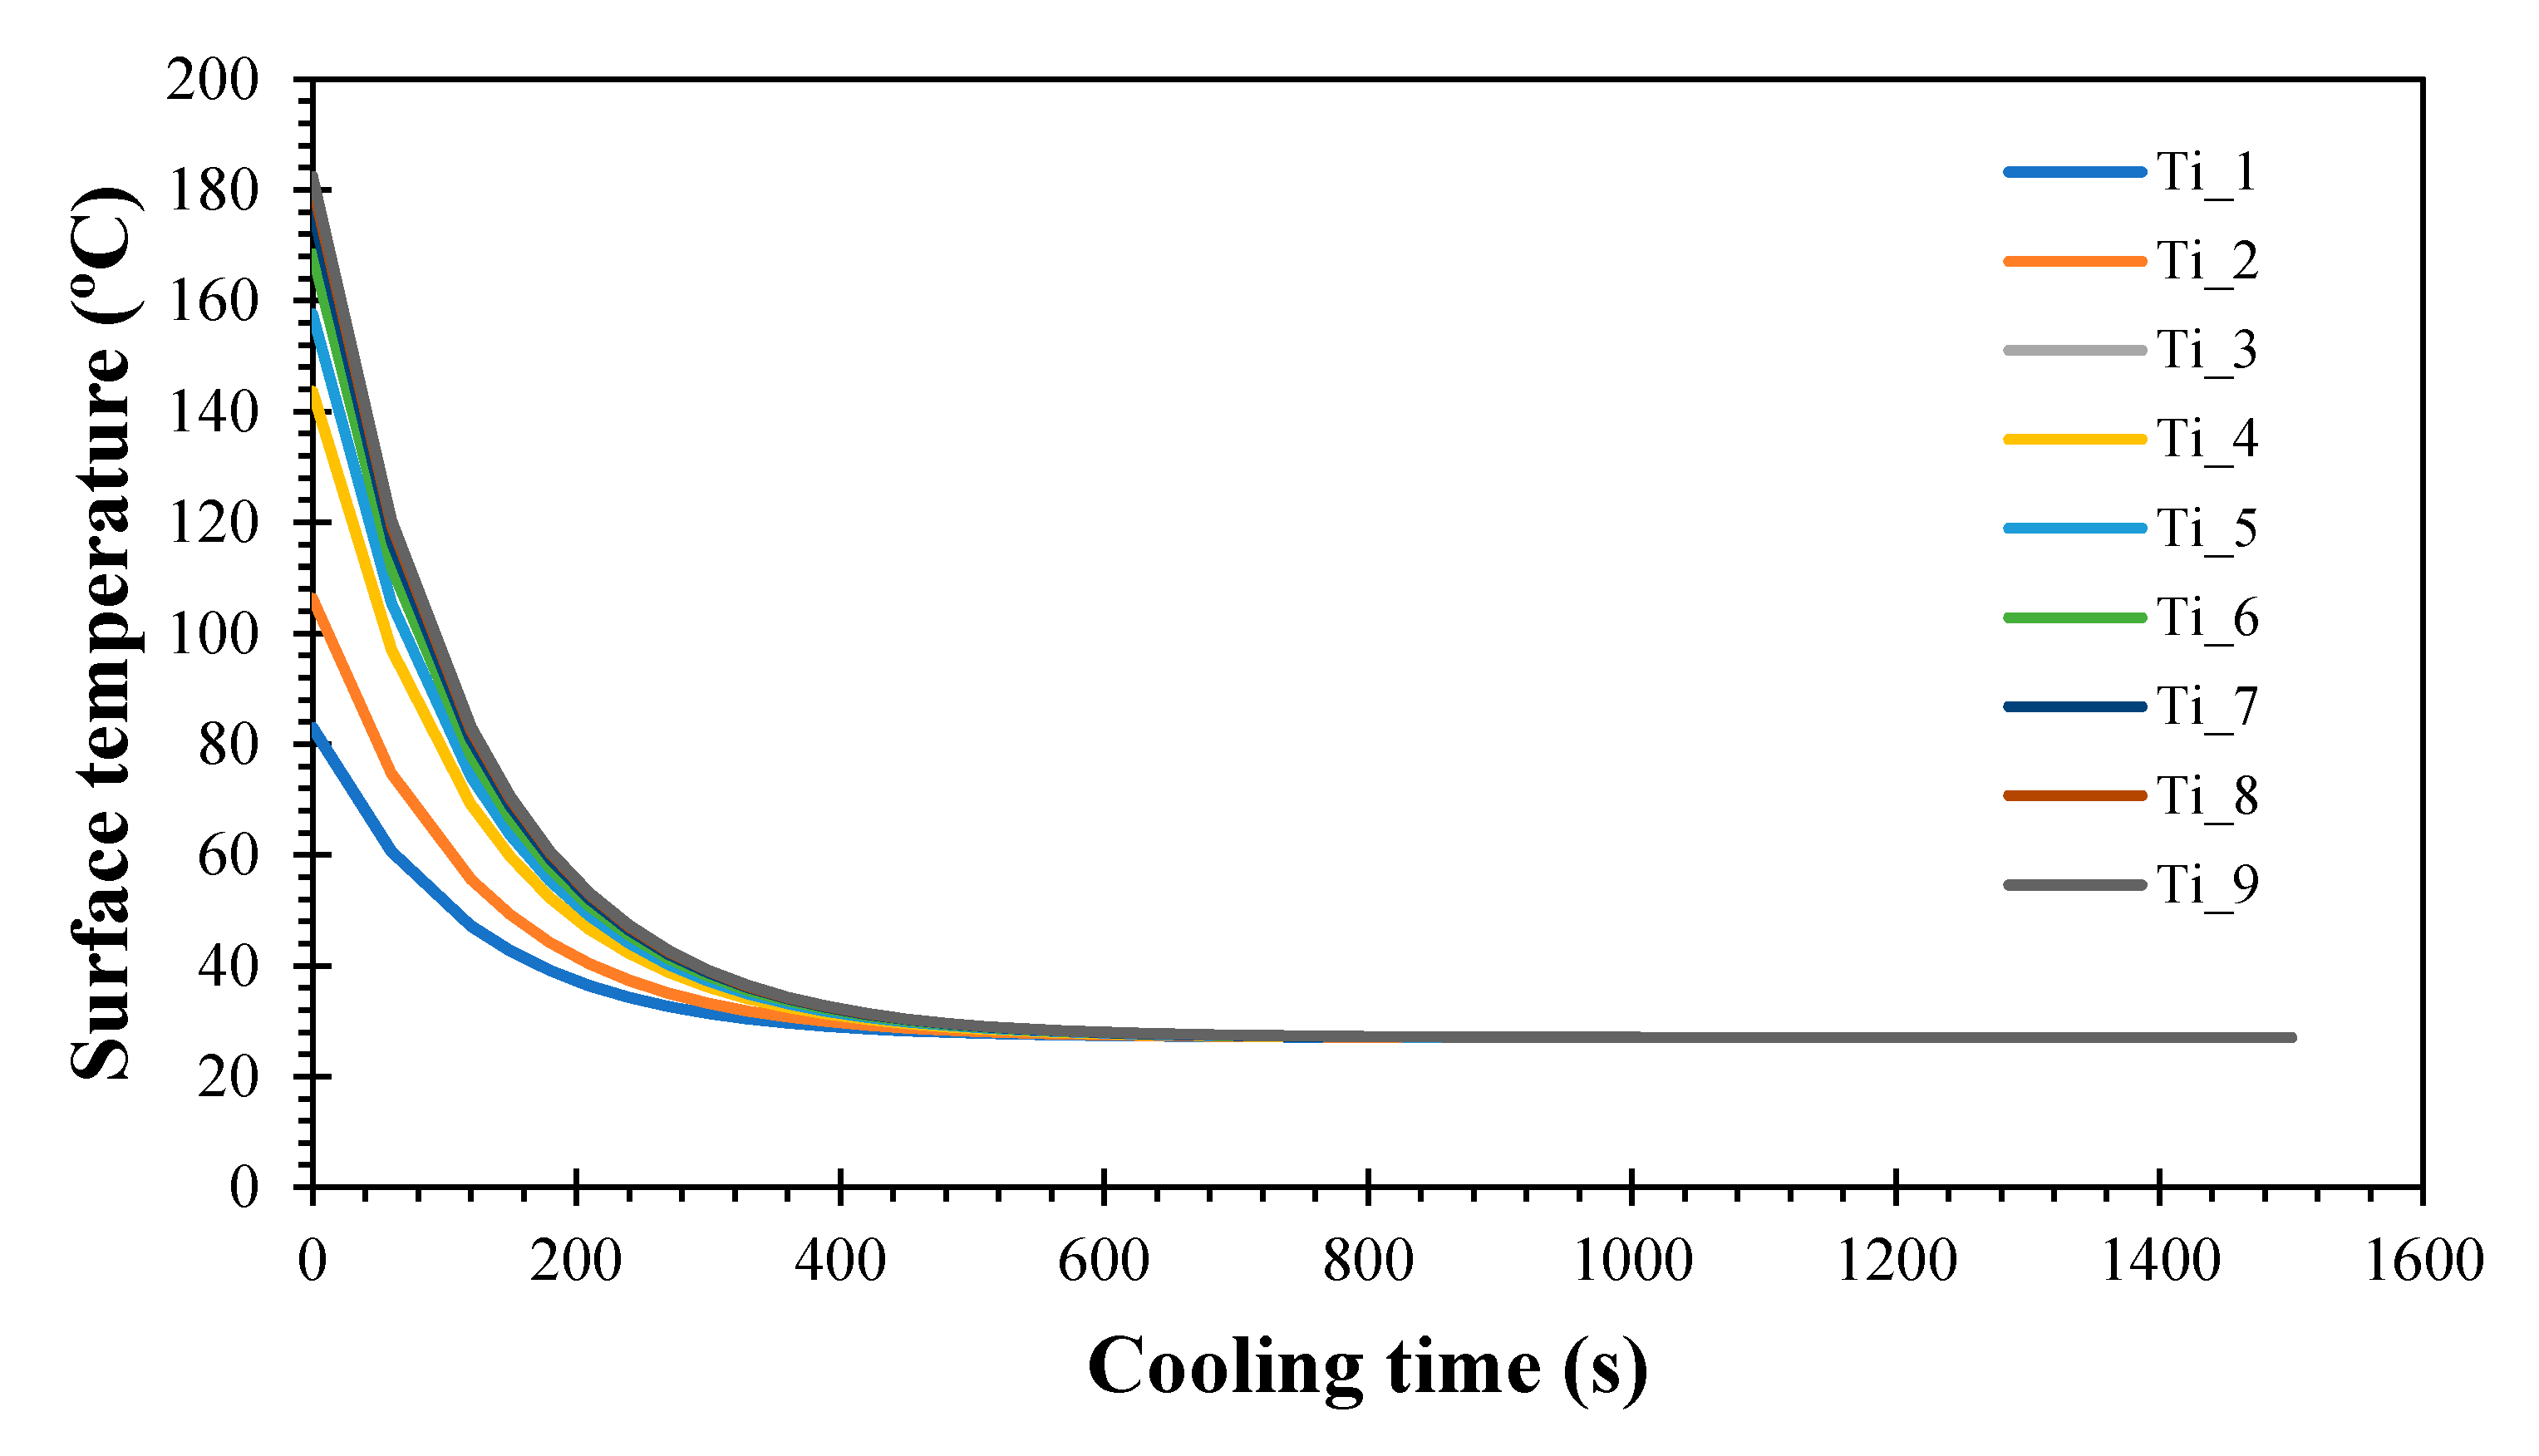
34]. Notice that the instantaneous temperature increases (182.48 °C) according to the speed difference increase due to the braking system’s need to dissipate kinetic energy in heat (tribological behavior). This behavior causes an increase in the temperature in contrast when the deceleration is minor (82.94 °C) relative to the speed difference.
The disc brake reaches an ambient temperature of 27 °C in around 10 min (800 s) after being subjected to the different temperatures on the surface of the braking track during the friction process between the disc and the pad (See Figure 5). In most cases, the heat dissipation is more pronounced according to the surface temperature; thus, the sliding speed provides a significant influence on the disc brake temperature on the surface by tribological contact. When the temperature differential increases, the surface temperature also increases. Therefore, the final shock generated on the disc’s surface is greater, so performance is compromised during the braking process due to abrupt temperature changes when disc brake cooling is carried out in less than 800 s. According to [19], the temperature on the disc increase conforms to an increase in the vehicle’s sliding motion.
The speed of the vehicle influences the kinetic energy that is generated during the movement. It does not affect it linearly but increases its value exponentially. This means that a vehicle of the same weight but twice the speed of another vehicle does not require double braking force to stop the vehicle, but rather it requires four times more force. Therefore, the stopping distance will be longer, as long as the vehicle rides on a flat road [43,44]. On the other hand, the material of the brake pad influences the thermodynamic properties of the disc brake and thus causes an increase in temperature. However, the disc brake material, geometry, and the configuration of the blades are relevant factors in the heat dissipation to the environment; they affect the useful life of the brake pads components of the braking system [30].

4. Conclusions

In this study, 2D mathematical maps on an auto-ventilated disc brake with N-38 type blades were investigated, and the main conclusions are summarized as follows:
  • Mathematical calculations allowed corroboration of the behavior of the data obtained for the disc brake considered. The mechanical, dynamic, and thermal calculations were carried out, considering different speed values with a maximum value of 100 km/h in the cities at an ambient temperature of 27 °C. Therefore, the disc brake performance depends on some mechanical, physical, and chemical properties of the material which this automotive component is fabricated.
  • 2D maps of the braking time, distance, and power dissipation evidenced that the inclination angle provides a great variable to evaluate due to the difference in the behavior during the braking process, which, in many cases, affect the performance of the disc brake. Besides, the temperature in the braking track is mainly influenced by the pressure exerted during braking, as well as the time in which this action is executed; it also is influenced by the speed difference as the driver decelerated the vehicle according to the queries as was observed from the cooling process analyzed by Newton’s law. On the other hand, the wear of the brake pad is influenced by the braking actuation time and thus by the mechanical properties of the brake pad and the disc brake materials.
  • The disc brake reaches an ambient temperature of 27 °C in around 10 min (800 s) after it is subjected to the different temperatures on the surface of the braking track during the friction process between the disc and the pad. For the different conditions evaluated, the instantaneous temperature reaches values of 182.48 and 82.94 °C, where the high value was found for a total deceleration to 100 km/h to 0, which represent a total braking distance of around 44.20 to 114.96 m depending on the inclination angle (θ).

Author Contributions

Supervision, R.A.G.-L.; project administration, R.A.G.-L.; sources, R.A.G.-L.; conceptualization, R.A.G.-L.; methodology, R.A.G.-L.; formal analysis, R.A.G.-L.; writing—original draft preparation, R.A.G.-L.; and writing—review and editing, R.A.G.-L.; Formal analysis, N.A.-G. and J.A.G.-C.; sources, N.A.-G. and J.A.G.-C.; visualization, N.A.-G. and J.A.G.-C.; validation, N.A.-G. and J.A.G.-C. All authors have read and agreed to the published version of the manuscript.

Funding

This research received no external funding.

Institutional Review Board Statement

Not applicable.

Informed Consent Statement

Not applicable.

Data Availability Statement

Not applicable.

Acknowledgments

This work was supported by the Universidad Francisco de Paula Santander Ocaña, Colombia.

Conflicts of Interest

The authors declare no conflict of interest.

Nomenclature

aDeceleration (m/s2)
AHeat transfer area (m2)
aMaxMaximum deceleration of braking (m/s2)
CAerodynamic constant (1 Dimensionless)
CPSpecific heat of the material (J/Kg×°C)
DDisc brake diameter (m)
DBellDisc brake bell diameter (m)
DExternalDisc brake outer diameter (m)
DInnerDisc brake inner diameter (m)
EDisc BrakeDisc brake energy (J)
EEach DiscEnergy in each disc brake (J)
EfEnergy to dissipate by the braking system (J)
EFront axleFront axle energy (J)
EPadEnergy in the pad (J)
ETotal in DiscTotal energy in the disc brake (J)
FCForce in cylinder (5.0 N)
FfBraking force (N)
FPTorque force on pedal (4.5 N)
FPedalPedal force (N)
frRolling resistance (Dimensionless)
FSForce produced by the brake booster (8.5 N)
gAcceleration of gravity (9.81 m/s2)
HPower dissipated by the brake system (W)
HBBrinell Hardness (Dimensionless)
KThermal conductivity (W/m × °C or J/s × m × °C)
L(V1-V2)Distancia total de frenado recorrida entre dos velocidades (m)
m = mvVehicle mass (2000 Kg)
mDDisc brake mass (4.5 Kg)
NBladesNumber of blades (N)
NuNusselt number (Dimensionless)
Q Heat generated during disc braking (W/m2)
RrRolling resistance (N)
tNewton cooling time (s)
t(V1-V2)Braking time (s)
TEnvironment temperature (27 °C)
TiInstantaneous temperature at all times (°C)
TPDisc periphery temperature (m)
UCoefficient of surface thermal transmission of the material (J/s × m2 × °C)
VVehicle speed (km/h or m/s)
VF or V2Final vehicle speed (m/s)
Vi or V1 Initial vehicle speed (m/s)
VPPeripheral speed of the disc (m/s)
WVehicle weight (Kg or N)
XPercentage of adherence (%)
αThermal diffusivity (m2/s)
γFRotating mass coefficient (1.25, Dimensionless)
ΔTTemperature differential between the disc brake and the environment (°C)
ηfBraking performance (Dimensionless)
θ Descent angle (Degrees).
μCoefficient of adhesion between tire and road (μ = aMax/g or 0.85, Dimensionless)
μMáxMaximum coefficient of adhesion between tire and road (Dimensionless)
ΡMaterial density (Kg/m3)
υFluid cinematic viscosity (m2/s)
ωangular speed (Rad/s)

References

  1. García-León, R.A.; Flórez-Solano, E.; Acevedo-Peñaloza, C. Análisis Termodinámico en Frenos de Disco; ECOE Ediciones: Bogota, Colombia, 2018. [Google Scholar]
  2. Rashid, A. Overview of disc brakes and related phenomena-A review. Int. J. Veh. Noise Vib. 2014, 10, 257. [Google Scholar] [CrossRef] [Green Version]
  3. Wahlström, J. A Study of Airborne Wear Particles from Automotive Disc Brakes. Ph.D. Thesis, KTH Royal Institute of Technology, Stockholm, Sweden, 2011. [Google Scholar]
  4. Blau, P.J. Compositions, Functions, and Testing of Friction Brake Materials and Their Additives. Compos. Funct. Test. Frict. Brake Mater. Addit. 2001, 27, 1–38. [Google Scholar]
  5. SN, Descripción y eficacia del sistema de frenado, Kashima University. 2020. Available online: http://kashima.campuseina.com/mod/book/view.php?id=7679 (accessed on 10 July 2021).
  6. García-León, R.; Flórez-Solano, E.; Suárez-Quiñones, Á. Brake Discs: A Technological Review from Its Analysis and Assessment. Informador. Técnico 2019, 83, 217–234. [Google Scholar] [CrossRef]
  7. Klapp, J.; Sigalotti, L.D.G.; Medina, A.; López, A.; Ruiz-Chavarría, G. Recent Advances in Fluid Dynamics with Environmental Applications; Springer International Publishing: Cham, Switzerland, 2016. [Google Scholar]
  8. García-León, R.A. “Evaluación del comportamiento de los frenos de disco de los vehículos a partir del análisis de la aceleración del proceso de corrosión.”. Tesis de pregrado en ingeniería Mecánica, Universidad Francisco de Paula Santander, Ocaña, Colombia, 2014. [Google Scholar]
  9. García-León, R.A.; Flórez, E. Dynamic analysis of three autoventilated disc brakes. Ing. Investig. 2017, 37, 102–114. [Google Scholar] [CrossRef] [Green Version]
  10. García-León, R.A.; Solano, E.F. Estudio analítico de la transferencia de calor por convección que afectan los frenos de disco ventilados. Tecnura 2016, 20, 15–30. [Google Scholar]
  11. Saiz, C.B.; Ingrassia, T.; Nigrelli, V.; Ricotta, V. Thermal stress analysis of different full and ventilated disc brakes. Frat. Integrità Strutt. 2015, 9, 608–621. [Google Scholar]
  12. Riva, G.; Valota, G.; Perricone, G.; Wahlström, J. An FEA approach to simulate disc brake wear and airborne particle emissions. Tribol. Int. 2019, 138, 90–98. [Google Scholar] [CrossRef]
  13. García-León, R.A.; Rivera-López, J.E.; Quintero-Orozco, A.; Gutiérrez-Paredes, G.J. Análisis del caudal en un disco de freno automotriz con alabes de ventilación tipo NACA66-209, utilizando velocimetría de imagen de partículas. Inf. Technol. 2019, 83, 10–24. [Google Scholar]
  14. Rivera-López, J.E.; García-León, R.A.; Quintero-Orozco, A.; Diaz-Torrez, E.J.; Gutiérrez-Paredes, G.J.; Echavez-Diaz, R.; Arévalo-Ruedas, J.H. Thermal and fluid-dynamic analysis of an automotive disc brake with ventilation pillars aerodynamic type. J. Phys. Conf. Ser. 2019, 1386, 012112. [Google Scholar] [CrossRef]
  15. García-León, R.A.; Echavez-Díaz, R.D.; Flórez-Solano, E. Análisis termodinámico de un disco de freno automotriz con pilares de ventilación tipo NACA 66-209. Inge Cuc 2018, 14, 9–18. [Google Scholar] [CrossRef] [Green Version]
  16. García-León, R.A.; Acevedo-Peñaloza, C.H.; Rodríguez-Castilla, M.M. Análisis del caudal de aire en un disco de freno automotriz con alabes de ventilación tipo N-38. Sci. Technol. 2019, 24, 385–389. [Google Scholar] [CrossRef]
  17. García-León, R.; Afanador-García, N.; Gómez-Camperos, J. Numerical Study of Heat Transfer and Speed Air Flow on Performance of an Auto-Ventilated Disc Brake. Fluids 2021, 6, 160. [Google Scholar] [CrossRef]
  18. Wahlström, J.; Matejka, V.; Lyu, Y.; Söderberg, A. Contact Pressure and Sliding Velocity Maps of the Friction, Wear and Emission from a Low-Metallic/Cast-Iron Disc Brake Contact Pair. Tribol. Ind. 2017, 39, 460–470. [Google Scholar] [CrossRef] [Green Version]
  19. Candeo, S.; Federici, M.; Leonardi, M.; Straffelini, G. Brake Performance Maps for a Cu-Free Friction Material with Different Scorching Conditions. Tribol. Trans. 2021, 64, 540–550. [Google Scholar] [CrossRef]
  20. Reddy, S.M.; Mallikarjuna, J.M.; Ganesan, V. Flow and Heat Transfer Analysis of a Ventilated Disc Brake Rotor Using CFD. SAE Tech. Pap. Ser. 2008, 12. [Google Scholar] [CrossRef]
  21. García, C.A.J.; Paredes, G.J.G.; López, J.E.R.; Villa, A.L.; Navarrete, J.M.C. Flow Measurement at the Inlet and Outlet Zones of an Automotive Brake Disc with Ventilation Post Pillars, Using Particle Image Velocimetry Technique. In Environmental Science and Engineering; Kluwer Academic Publishers: Mexico City, Mexico, 2016; pp. 323–332. [Google Scholar]
  22. Belhocine, A.; Bouchetara, M. Thermomechanical behavior of dry contacts in disc brake rotor with a grey cast iron composition. Therm. Sci. 2013, 17, 599–609. [Google Scholar] [CrossRef]
  23. Airfoill Tools. Tools to Search, Compare and Plot Airfoils 2017. Available online: http://airfoiltools.com/ (accessed on 21 July 2021).
  24. Belhocine, A.; Afzal, A. FEA Analysis of coupled thermo-mechanical response of grey cast iron material used in brake discs. Rev. Científica 2019, 3, 280–296. [Google Scholar] [CrossRef]
  25. Ibhadode, A.O.A.; Dagwa, I.M. Development of asbestos-free friction lining material from palm kernel shell. J. Braz. Soc. Mech. Sci. Eng. 2008, 30, 166–173. [Google Scholar] [CrossRef] [Green Version]
  26. Cengel, Y.A.; Boles, M.E. Termodinamica-Cengel 7th; McGraw Hill: Mexico City, Mexico, 2011. [Google Scholar]
  27. García-León, R.A.; Florez, E.; Rodriguez-Castilla, M. Thermo-mechanical assessment in three auto-ventilated disc brake by implementing finite elements. J. Phys. Conf. Ser. 2019, 1257, 012019. [Google Scholar] [CrossRef]
  28. Cengel, Y. Tranferencia de Calor y Masa Tercera Edicion; McGraw Hill: Mexico City, Mexico, 2007. [Google Scholar]
  29. García-León, R.A.; Guerrero-Gómez, G.; Afanador-García, N. Experimental analysis of the heat transfer generated during the operation of an automotive disc brake. Aust. J. Mech. Eng. 2021, 1–12. [Google Scholar] [CrossRef]
  30. Leon, R.A.G. Estudio térmico en tres frenos de disco ventilados, utilizando el análisis de elementos finitos. DYNA 2017, 84, 19–27. [Google Scholar] [CrossRef]
  31. Riley, W.F.; Sturges, L.D. Engineering Mechanics, Dynamics; Reverte S.A.: Barcelona, Spain, 2005. [Google Scholar]
  32. Stachowiak, G.W. Wear: Materials, Mechanisms and Practice; Wiley: Oxford, UK, 2005. [Google Scholar]
  33. Naga-Vamsi, K.; Thuppal, V.S. Heat transient transfer analysis of brake disc/pad system. Master of Science in Mechanical Engineering, Blekinge Institute of Technology, Karlskrona, Switzerland, 2016. [Google Scholar]
  34. Lakkam, S.; Puangcharoenchai, P.; Suwantaroj, K. A Study of Heat Transfer on Front and Back Vented Brake Disc Effect on Vibration. Eng. J. 2017, 21, 169–180. [Google Scholar] [CrossRef]
  35. García-León, R.; Martínez-Trinidad, J.; Zepeda-Bautista, R.; Campos-Silva, I.; Guevara-Morales, A.; Martínez-Londoño, J.; Barbosa-Saldaña, J. Dry sliding wear test on borided AISI 316L stainless steel under ball-on-flat configuration: A statistical analysis. Tribol. Int. 2021, 157, 106885. [Google Scholar] [CrossRef]
  36. Pulido, H.G.; Salazar, R.D. Análisis y Diseño de Experimentos; McGraw-Hil: Mexico City, Mexico, 2015. [Google Scholar]
  37. StatSoft, Inc. Statistica (Data Analysis Software System), Version 13. Available online: http://www.statsoft.com/ (accessed on 20 July 2020).
  38. Kudarauskas, N. Analysis of Emergency Braking of a Vehicle. Transport 2007, 22, 154–159. [Google Scholar] [CrossRef] [Green Version]
  39. Zamzamzadeh, M.; Saifizul, A.; Ramli, R.; Soong, M. Dynamic simulation of brake pedal force effect on heavy vehicle braking distance under wet road conditions. Int. J. Automot. Mech. Eng. 2016, 13, 3555–3563. [Google Scholar] [CrossRef]
  40. Voller, G.P.; Tirovic, M.; Morris, R.; Gibbens, P. Analysis of automotive disc brake cooling characteristics. Proc. Inst. Mech. Eng. Part D J. Automob. Eng. 2003, 217, 657–666. [Google Scholar] [CrossRef]
  41. Yevtushenko, A.; Grzes, P. Finite Element Analysis of Heat Partition in a Pad/Disc Brake System. Numer. Heat Transf. Part A Appl. 2011, 59, 521–542. [Google Scholar] [CrossRef]
  42. Talati, F.; Jalalifar, S. Analysis of heat conduction in a disk brake system. Heat Mass Transf. 2009, 45, 1047–1059. [Google Scholar] [CrossRef]
  43. García-León, R.A.; Quintero-Quintero, W.; Gomez-Camperos, J.A. Mathematical analysis of the dynamic behavior three motorcycle disc brakes. J. Phys. Conf. Ser. 2020, 1708, 012025. [Google Scholar]
  44. García-León, R.A.; Acevedo-Peñaloza, C.H.; Rojas-Suarez, J. Análisis Metalográfico y Materiales de Los Frenos de Disco; ECOE: Bogota, Colombia, 2019. [Google Scholar]
Figure 1. Disc brake used. (a) 3D view, (b) transparent view, and (c) Geometry of the N-38 single type ventilation blades. Source: [17,23].
Fluids 06 00363 g001
Figure 2. 2D Contour plot of power dissipated by the braking system against inclination angle and speed difference (m/s). Source: Own elaboration.
Fluids 06 00363 g002
Figure 3. 2D Contour Plot of Braking time against inclination angle and speed difference. Source: Own elaboration.
Fluids 06 00363 g003
Figure 4. 2D Contour Plot of Braking distance against inclination angle and speed difference. (a) Gradual stop, (b) Total stop. Source: Own elaboration.
Fluids 06 00363 g004
Figure 5. Cooling time for different temperatures. Source: Own elaboration.
Fluids 06 00363 g005
Table 1. Main mechanical, physical, and thermal properties of nodular gray cast iron.
PropertySymbolValue
Brinell hardness/170–250 HB
Young modulusE130-140 GPa
Shear strengthG151 MPa
Impact resistanceJ2.0 J/mm2
Friction coefficientµ0.30–0.50 (Dimensionless)
Thermal conductivityk41–57 W/m × K
Thermic dilatation coefficient/10.5 µm/m between 0 and 100 °C13 µm/m between 0 and 500 °C
Melting pointP1130 °C–1250 °C
Specific heatCp434–460 J/Kg °C
Volumetric mass densityρ7250–8131 Kg/m3
Thermal diffusivityα11.60 × 10 6 m2/s
Thermal transmission coefficientU32 J m 2 × s × ° C
Source: [24,25,26,27,28].
Table 2. Sliding speeds assumed for mathematical calculations.
Braking DistanceBraking Time
V1 V2∆VV1 V2V1 V2
(Km/h) (Km/h)
100to8020100to80100to0
70307080
60406070
50505060
40604050
30703040
20802030
10901020
0100010
Source: Own elaboration.
Table 3. First stage, mechanical, mathematical calculations.
Details and ConsiderationsEquationNumber
Braking force. The vehicle braking force is developed on the surface of the tire-roadway; this force is also limited to two factors (roadblock and brake system), with the surface’s adhesion. F f = W × ( a g   F r ) = ( m v × g ) ( μ     f r ) Equation (1)
Resistance coefficient. This variable is defined as the force opposite to the advancement of the tire in the longitudinal direction. R r = F r × W Equation (2)
Rolling coefficient. This variable is the rolling resistance coefficient, related to the contact between the tire and the surface. F r = 0.01 × ( 1 + V 160 ) Equation (3)
Deceleration, considering a constant value of 0.015 of rolling resistance for particle vehicles that circulate on a concrete or asphalt surface [9]. μ = 0.75 and μ = 0.55 for dry and wet, respectively, and a new tire is assumed [31]. a M á x = W × μ W g = μ × g Equation (4)
Pedal force. This is the necessary force to be applied to the pedal to develop the braking process. F Pedal = F f F P × F S × F C Equation (5)
Peripheral speed. An adherence of 80% is assumed, and the variable is obtained V P . X = ( V i V P ) V P × 100 Equation (6)
Dissipated energy. The correction factor γF = 1.25 for rolling masses, and the vehicle speed at the moment of braking initiation 100 km/h or 27.27 m/s E f = γ F × m v × ( V i 2 V f 2 ) 2 Equation (7)
Energy dissipated in the front of the disc brake. Thus, the total energy is distributed between 70 and 80% on the front axle. E Front   axle =   E f × 0.70 Equation (8)
Total energy absorbed in the front axle. Ninety percent is dissipated in the disc brake and the remaining 10% in the pad E Disc = E Front   axle × 0.9 Equation (9)
E Pad = E Front   axle × 0.1 Equation (10)
Dissipated energy. This is the amount of kinetic energy transformed in heat by the interaction of the pad and the disc brake, which produces the deceleration of the vehicle. E = E Disc   Brake 2 Equation (11)
Braking deceleration. In this calculation, as Equation (13), Sin θ is related to the inclination angle of the road. a = F f + ( m × g × Sin   θ ) + ( m × g × f r ) m Equation (12)
Dissipated power. This is the amount of energy dissipated to the environment by the heat convection process. H = [ ( γ F × m × a ) + ( m × g × Sin   θ ) ] × V Equation (13)
Source: Own elaboration.
Table 4. Second stage, thermal mathematical calculations.
Name and ConsiderationsEquationNumber
Rise in temperature. This is calculated considering the disc energy, the disc mass, and the material’s specific heat (Gray cast iron). Δ T = E Disc   Brake m D × C p Equation (14)
Surface temperature. This is the real temperature on the surface of the disc that is dissipated to the environment. T i T = Δ T Equation (15)
Instantaneous temperature. Newton’s cooling law T i T = ( T i T ) × e A × U m × C p × t Equation (16)
Source: Own elaboration.
Table 5. Third stage, dynamic mathematical calculations.
Name and ConsiderationsEquationNumber
Braking time (s). This is the need time to stop partial or the movement of the vehicle. In this calculation, as Equation (18), sin θ is related to the inclination angle of the road. t V 1   V 2 = m × γ F × 1 F f + ( m × g × Sin   θ ) + ( m × g × F r ) × ( V 1   V 2 ) Equation (17)
Braking distance to reduce speed (m). This is the total distance recorded until the automobile decelerates related to braking time. L V 1   V 2 = W × γ F 2 × g × C × Ln [ F f + ( W × Sin   θ ) + ( W × f r ) + ( C × V 1 2 ) F f + ( W × Sin   θ ) + ( W × f r ) + ( C × V 2 2 ) ] Equation (18)
Braking performance (%). This variable is the quality as the braking process is developed η f = a Máx μ Máx × g Equation (19)
Source: Own elaboration.
Table 6. Main mechanical and dynamic variables calculated for the disc brake.
ParameterValueUnitsNote
Fr0.01625//
Rr318.83N/
aMax8.34m/s2/
Ff14,396.18NDry
10,472.18NWet
FPedal75.17NDry
54.76NWet
VP15.428mm/s/
AContact0.5183m2/
ηf1.13%Dry
1.55%Wet
Source: Own elaboration.
Table 7. Main thermal variables calculated for the disc brake.
ViVfEfEfront axleEDiscEPadETotal in discΔTTiID
(m/s)(J)(°C)
27.7722.22346,805.60242,763.94218,487.5424,276.39109,243.7755.9482.94Ti_1
19.44491,574.10344,101.89309,691.7034,410.19154,845.8579.29106.29Ti_2
16.66617,021.60431,915.14388,723.6243,191.51194,361.8199.52126.52Ti_3
13.88723,148.10506,203.69455,583.3250,620.37227,791.66116.64143.64Ti_4
11.11809,676.00566,773.20510,095.8856,677.32255,047.94130.59157.59Ti_5
8.33877,230.00614,061.00552,654.9061,406.10276,327.45141.49168.49Ti_6
5.55925,463.00647,824.10583,041.6964,782.41291,520.85149.27176.27Ti_7
2.77954,375.00668,062.50601,256.2566,806.25300,628.13153.93180.93Ti_8
0963,966.10674,776.29607,298.6667,477.63303,649.33155.48182.48Ti_9
Source: Own elaboration.
Publisher’s Note: MDPI stays neutral with regard to jurisdictional claims in published maps and institutional affiliations.

