Abstract
Aerodynamics has identified remarkable development in the improvement of fuel efficiency, reducing wind noise and increasing engine cooling. Moving body profile controls fuel the consumption rate. This paper discusses a novel car profile consisting of two airfoils Roncz (car profile) and National Advisory Committee for Aeronautics NACA 10 (car sides). They are used to create a streamlined body. Three-Dimensional numerical simulations of the full scale model (half domain) are performed to examine the effect of car profile on the drag coefficient and thus fuel consumption. Simulations are considered over a range of air flow velocities, from 20 to 45 km/h in a step of 5 km/h. The ahmed body is used to validate the results. Results are shown graphically for coefficients of drag and lift and pressure and velocity contours. They show that the design of the car profile is effective.
1. Introduction
Aerodynamics is the most important factor when it comes to resistive forces [1]. Reducing the aerodynamic drag will not only open the door for higher top speed, but will also reduce the overall fuel consumption of the vehicle and increase comfort. The fuel consumption rate can be controlled by profiles of high-speed trains, real cars and racecars. Streamlined profiles can reduce fuel consumption dramatically.
Starting with Airplanes, they have a major role in aerodynamics research. Recently, Prasad and Rose [2] completed an experimental and computational study of ice accretion effects on aerodynamic performance. Ice accumulation changes the shapes of local airfoil sections and consequently affects the aerodynamic performance characteristics of the considered National Advisory Committee for Aeronautics (NACA 23012) profile.
In competition with airplanes, the recent development of high-speed trains led to a growing interest in aerodynamics. Tan et al. [3] conducted transient numerical simulations of maglev trains of different lengths. Luo et al. [4] established a slide rail high-speed train model by combining the aerodynamic experiments with a standard k-ε numerical simulation. Their simulations were able to predict the behavior of compression waves and to validate the model at a low cost. Liang et al. [5] reported aerodynamic loads on the overhead bridge bottom surface as a result of the train passing.
Studying air flow around ground vehicles is of great importance in the automobile industry. Implementing good aerodynamic design under technical constraints requires a broad understanding of the flow phenomena, especially how the aerodynamics is influenced by changes in body shape. Consequently, vehicle optimization occurs as a part of the design process, typically in an effort to enhance desirable aerodynamic characteristics. One obvious way to improve fuel economy for vehicles is to reduce aerodynamic drag by optimizing body shape. Ahmad et al. [6] proposed a mesh optimization strategy for accurately estimating the drag of a ground vehicle. They examined the effect of different mesh parameters. Their study was extended to take into account the effect of model size. Scaling the optimized mesh size with the length of car model was successfully used to predict the drag of the other car sizes with reasonable accuracy. Aljure et al. [7] carried out numerical simulations on the flow over a realistic generic fastback car. Pure Large Eddy Simulations (LES) and Wall-Modeled Large Eddy Simulations (WMLES) were used and compared to numerical and experimental results to assess the validity of these approaches when solving the flow field around complex automotive geometries. Their investigation showed how WMLES helped reduce computing cost and response versus pure LES, while providing high-quality unsteady data, although computational cost remained high. Fu et al. [8] Introduced turbulence modeling effects on Reynolds-averaged Navier–Stokes (RANS) Computational Fluid Dynamics (CFD) simulations of a full-scale “NASCAR Gen 6 Cup” car using one of the latest low Reynolds k-ε model, i.e., the one developed by Abe-Nagano-Kondoh (AKN), realizable k-ε and SST k-ω. Their simulation results suggested that the turbulence modeling effects were mainly marked in the recirculation and separated regions. Clearly, more exact simulations of the wake flow and of the separation process were essential for the accuracy of drag predictions. In general, AKN model appeared to be superior to the other two models. Its results better aligned with wind tunnel data in terms of drag, total downforce and front-to-rear vehicle balance. Moreover, Thangadurai et al. [9] examined the effect of added surfaces such as NACA 2412 wings and wedge type spoiler at the rear end of a sports car in detail using three-dimensional realizable k-ε turbulence model numerical simulations validated with lab scale experiments. Czyż et al. [10] performed numerical calculations using Ansys to identify the magnitude of the aerodynamic drag force generated on individual elements of a high energy efficiency vehicle body. Mariani et al. [11] investigated using CFD in the racecar from the University of Perugia.
At the Shell Eco-marathon competition [12], competitors demonstrated the variation in wake flow field of vehicles with different added surfaces using pressure and velocity contours, velocity vectors at the rear end and the turbulent kinetic energy distribution plots. Their simulations results were validated by experiments. Arpino et al. [13] designed their car with detailed 3D CFD modeling and then confirmed it against experiments. A model of the car was examined in an open wind tunnel. They evaluated the wake flow structures and estimated the drag coefficient. Cieslinski et al. [14] focused on optimizing their car body profile. They presented a numerical aerodynamic study of a number of vehicle shapes with fairing around its wheels inspired by the winning models. Ambarita et al. [15] numerically designed a prototype to participate in the energy-efficient competition. In their results, drag and lift coefficients were determined and velocity and pressure distributions were provided. Abo-Serie et al. [16] numerically proposed a low drag concept car with a non-rotating wheel using a modified “tear drop” shape.
New methods have appeared to minimize drag; active and passive flow controls are a promising way of drag reduction. Brunn et al. [17] tested two different configurations that had separate control approaches experimentally and numerically. Their results showed that targeted excitation of the dominant structures in the wake region leads to their effective attenuation. Fourrie’ et al. [18] experimentally studied passive flow control on a generic car model. Their control consisted of a deflector placed on the upper edge of the model rear window. The aerodynamic drag was measured using an external balance and calculated using a wake survey method. Drag reductions up to 9% were obtained depending on the deflector angle.
More than that, Dawi and Akkermans studied direct noise of two square cylinders [19], for automotive applications [20] and of a generic vehicle [21]. They [19] presented a comparison between two different approaches to calculate the far-field noise of two square cylinders in tandem arrangement. Then they [20] used a compressible flow solver for low Mach-number flows utilized with an IDDES approach for turbulence modeling. Furthermore, they [21] demonstrated the applicability of a finite volume method for the direct noise computation of road vehicles.
To meet the high records expectations of the competition, it’s decided to improve the car profile. The aim of this study is to reach the lowest coefficient of drag by using the chosen profile of the two airfoils (Roncz and NACA 10). The reason to choose these two airfoils is to minimize the drag and hence fuel consumption and to reach a higher CL/CD ratio. Based on that, numerical simulations are used to show the distribution of pressure and velocity and coefficients of lift and drag of the tested shape.
2. Physical Model
The car is designed using two airfoils (Roncz and NACA 10 [22]), shown in Figure 1 and Figure 2. Table 1 and Table 2 show the geometrical properties of Roncz and NACA10, respectively. Roncz is used to design the top section, Figure 3. Only the front part of this airfoil is used to give the driver a comfortable and enough space to be able to drive the car. Moreover, NACA 10 Airfoil is used to design the side sections, Figure 4. This combination of the two airfoils avoids any discontinuity; hopefully, it reduces the coefficient of drag.
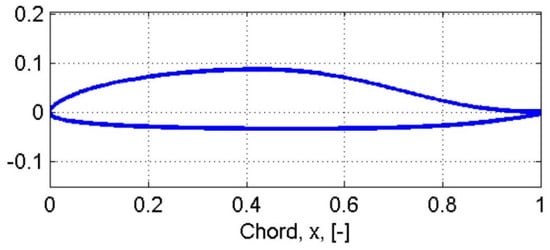
Figure 1.
Roncz Airfoil [22].
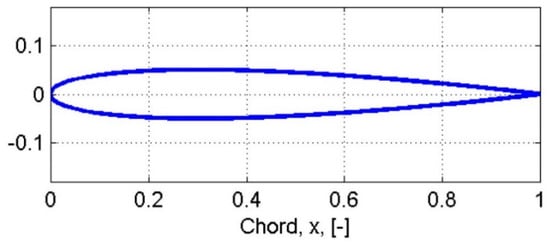
Figure 2.
NACA 10 Airfoil [22].

Table 1.
Roncz geometrical properties [22].

Table 2.
NACA10 geometrical properties [22].

Figure 3.
Car side view corresponding to Roncz Airfoil.

Figure 4.
Car plan view corresponding to NACA 10 Airfoil.
The car design, shown in Figure 5, is a Computer Aided Design (CAD) drawing model. Its front tires are covered with fairing. This made the car body more streamlined. The car has only three tires (two at front and one at rear) to decrease friction losses.
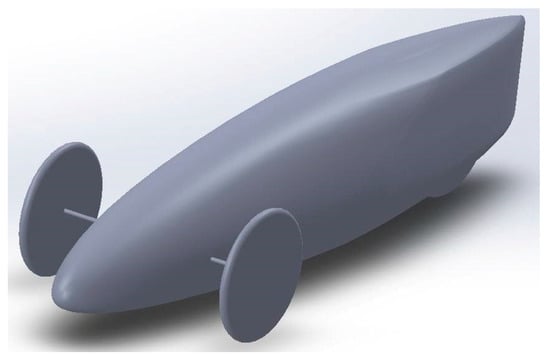
Figure 5.
Car design with the front tires outside.
Figure 6 shows front and side views of the designed car. It has a maximum width, length and height of 907, 2906 and 630 mm, respectively. This car design has a frontal area = 0.2855 m2.

Figure 6.
Car dimensions in mm (a) Front View. (b) Side View.
Drag force is one of the aerodynamic forces. It is the resistance force applied along the velocity vector, Figure 7. Lift force performs perpendicular to the velocity vector, see Figure 7.
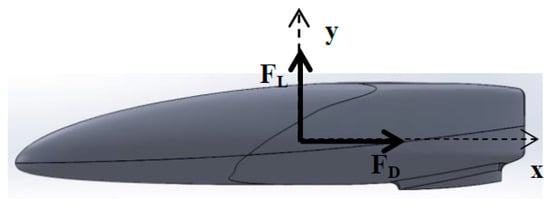
Figure 7.
Aerodynamic Forces.
The coefficients of drag (CD), lift (CL) and pressure (CP) are given by the following equations:
Aerodynamic drag created on the car body affects fuel consumption [23,24,25]. Modifications of car’s geometry can improve the flow around the car and reduce the aerodynamic drag. A relation between change in fuel consumption and change in drag coefficient is shown as follows [26]:
3. Numerical Model
Test conditions are set as similar to real working conditions. Simulations of air flow (an ideal gas) around the car model are conducted using Ansys. The car wheel is assumed to be fixed in this study.
While all flows are compressible, flows are usually treated as incompressible when the Mach number (the ratio of the speed of the flow to the speed of sound) is smaller than 0.3 (since the density change due to velocity is about 5% in that case) [27]. For compressible flows, if the Mach number is less than 0.3, the flows are usually treated as incompressible since the density change due to the velocity is about 5%. However, for standard air at a temperature of 15C, the speed of sound is 340 m/s. For a Mach number of 0.3, the flow velocity will be 102 m/s. The studied velocity ranges from 20 to 45 km/h (5.6 to 12.5 m/s). However, this is assuming that the incompressible flow is valid.
3.1. Domain Dimensions
The numerical domain is included in the Wind Tunnel space, excluding the car, as shown in Figure 8. Due to the symmetry of the car, it was assumed that the flow on both sides was identical and only half of the model was to be used for the simulation. That assumption had a great impact on the mesh size, simulation time and computational domain shape. The upstream, downstream, height and width dimensions are 1CL, 16CL, 3.5CH and 3CW, respectively, as CL, CH and CW are the car length, height and width. The domain overall dimensions have not been tested; they were taken from references [14,15,16]. However, the dimensions effect is minimized if a distance three times the car height is allowed above and on the two sides of the car [16].
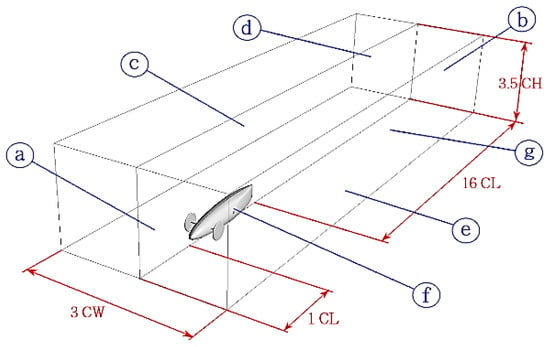
Figure 8.
Domain dimensions and Boundary conditions.
3.2. Boundary Conditions
Boundary conditions are shown in Figure 8 and Table 3. The left boundary is defined as the inlet. The air flow has a range of velocities from 20 to 45 km/h in a step of 5 km/h. An outlet pressure boundary condition is assumed at the right side and at the top boundaries. The mid-vertical plane is assumed as a symmetry boundary condition. Other boundaries, including the car, are considered as walls.

Table 3.
Boundaries names and conditions.
3.3. Domain Meshing
Polyhedral mesh [6] is used to provide better resolution than other mesh types. It can capture the flow in the wake region with fewer cells, however less computational time and memory is needed. Having a fine mesh around the vehicle could capture flow features and use less memory and time than having a fine mesh all over the domain. To ensure a mesh size that does not affect the final results, a mesh independency study has been carried out. Figure 9 shows the relation between the coefficient of drag and number of elements at a velocity of 35 km/h. The number of elements 3 × 10⁶, 6.5 × 10⁶ and 8 × 10⁶ are used. Numbers of elements of 6.5 × 10⁶ and 8 × 10⁶ almost have the same coefficient of drag.
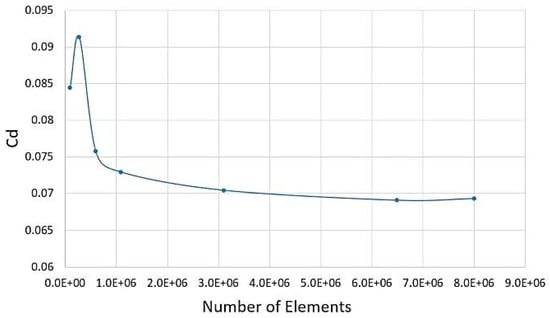
Figure 9.
Relation between coefficient of drag to the number of elements at a velocity of 35 km/h.
To be more accurate, velocity and pressure profiles are considered at the back of the car at X/CL = 1.03, see Figure 10a, for the same numbers of elements 3 × 10⁶, 6.5 × 10⁶ and 8 × 10⁶. Figure 10b,c shows the relation between velocity and pressure profiles and the number of elements at a velocity of 35 km/h. Moreover, the number of elements of 6.5 × 10⁶ and 8 × 10⁶ have almost the same velocity and pressure profiles. Based on that, the number of elements 6.5 × 10⁶ is used as iterations have residuals less than 10−4.
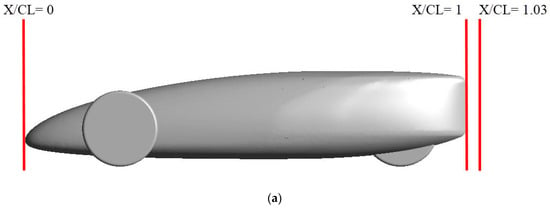
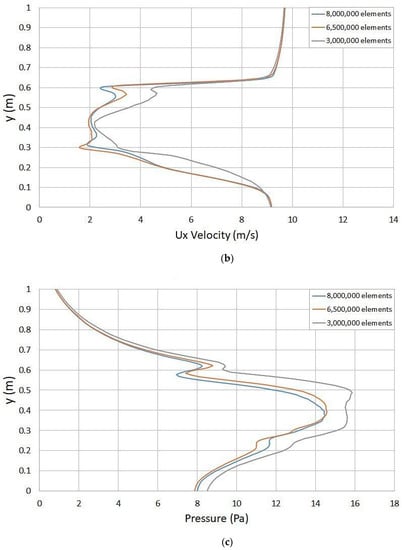
Figure 10.
At (a) X/CL = 1.03, relation between (b) velocity in x-direction and (c) pressure profiles and the number of elements at a velocity of 35 km/h.
Meshing is an important part of the CFD set up in order to capture the flow details, as shown in Figure 11 and Figure 12. Two regions within the computation domain are defined (hybrid mesh), as shown in Table 4 and Figure 13 and Figure 14. Quad elements are layered at the car walls to reach the required y+ value. The far-field mesh was set to be unstructured polyhedral elements. A polyhedral mesh is applied to the airflow domain as it can easily fit with different geometries, as shown in Figure 15.
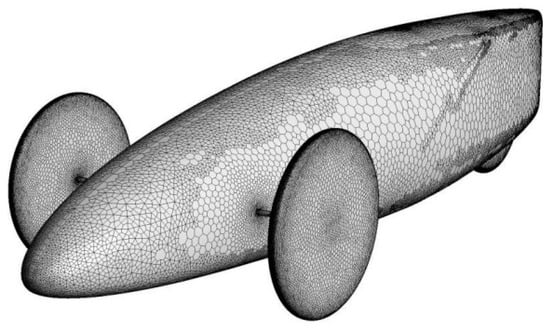
Figure 11.
Mesh of the car surface.
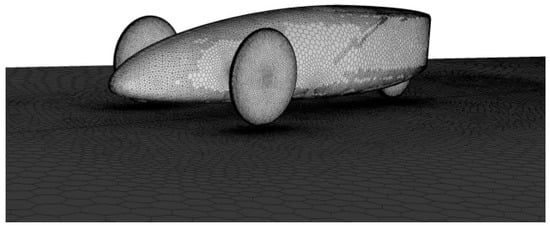
Figure 12.
Mesh of the car and road surfaces.

Table 4.
Properties of the domain’s mesh.
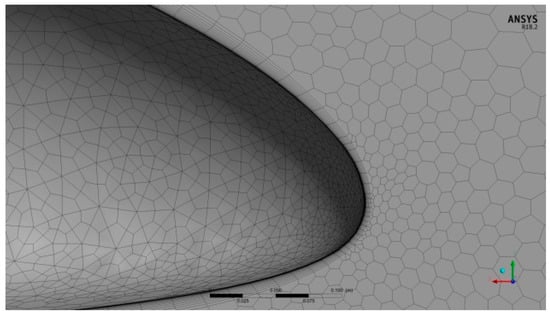
Figure 13.
Inflation method near the car surface.
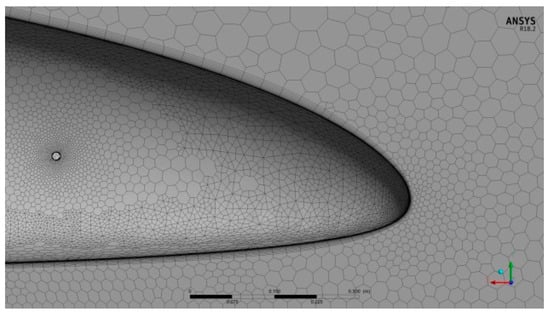
Figure 14.
Inflation method near the car surface and the circular hole in the car body.
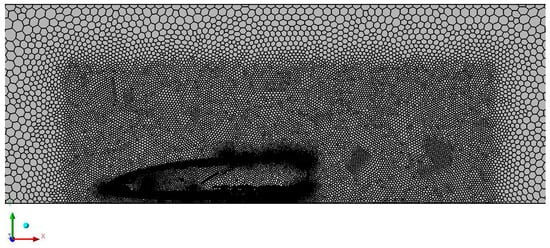
Figure 15.
Cross-section of the car domain mesh.
Table 4 describes the properties of domain’s mesh. The used meshing method is a hybrid of polyhedron mesh and inflating prisms around the airfoils. A good mesh is achieved with a maximum skewness of 0.67 and a maximum aspect ratio of 286.
First layer thickness of 0.01 mm can be calculated from y+ of 1 using Equation (5) [28].
3.4. Shear-Stress Transport (SST k-ω) Model
Computational Fluid Dynamics techniques are used to numerically solve the governing equations of a flow field to estimate flow variables. It is essential to define two equation sets: Navier-Stokes momentum and mass conservation equations, hereafter, introducing the problem of turbulence modeling. Once these models are defined, they are solved by ANSYS FLUENT [29]. All the simulations are configured in steady state and with an incompressible model. As demonstrated by the specialized literature [30,31,32] and among the various models tested, SST k-ω is supreme for capturing complex turbulent phenomena in terms of displacement from experimental evidence.
The k-ε model [30,31] is one of the most widely used turbulence models. It is a two-equation model; it includes two transport equations that represent the turbulent properties of the flow. The two equations take into account both the convective effect and the diffusion effect associated with the turbulent energy. The first transported variable is the turbulent kinetic energy k, which governs the energy in turbulence, while the second variable is the specific dissipation ε, which governs the scale of the turbulence.
SST k-ω turbulence model is a two-equation eddy-viscosity model. Shear Stress Transport (SST) formulation merges the best of the two models. The use of a k-ω formulation in the internal parts of the boundary layer creates a usable model at the wall through the viscous sub-layer. Hereafter, it is used as a Low-Re turbulence model without adding any additional damping functions. Moreover, SST formulation changes a k-ε behavior in the free-stream and avoids the sensitivity of k-ω model to the inlet free-stream turbulence properties. This approach effectively blends the far-field K-ε model with the near-wall K-ω model. Finally, SST k-ω model has good behavior in adverse pressure gradients and in separating flow conditions. The transport equations [33] for SST k-ω model are:
Turbulence kinetic energy equation:
Specific dissipation rate equation:
Kinematic eddy viscosity equation:
The chosen fluid model for computation comprises air at 15C and a pressure of one atmosphere, isothermal heat transfer, and turbulent flow model.
4. Numerical Validation
For this turbulent steady flow, simulation run about 1000 iterations to reach steady state conditions and the residuals reach a value less than 10−4, as shown in Figure 16.
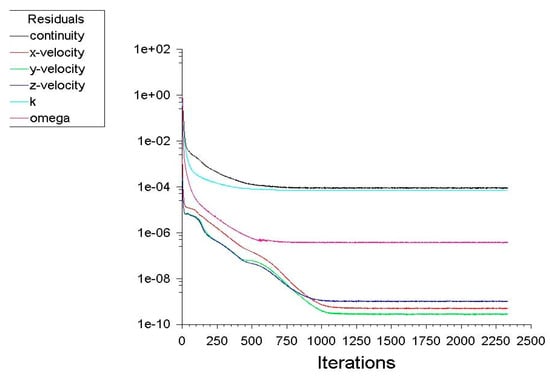
Figure 16.
Relation between residuals and the number of iterations.
In the present work, Ahmed body (of the same size) is used as a reference to validate the present numerical simulation. The Ahmed body has a very simple shape that allows capturing characteristic features that are relevant to bodies in the automobile industry. The present model is used to compute drag coefficients of the Ahmed Body and drag coefficient of the present model. Table 5 shows the coefficient of drag for the Ahmed body from previous and present studies. The results of the present numerical method agree well with previous work. To check the results, discrepancy can be calculated from the following equation:

Table 5.
Comparison between coefficient of drag for the Ahmed body from previous (Experimental and Simulation) and present studies.
The discrepancy to the experimental work is only 3.52%. Thus, the present method will perform an efficient numerical analysis.
5. Results
Numerical simulation results provide parameters; coefficients of drag, lift and pressure and distributions of velocity and pressure, to declare whether the car profile is efficient or not.
Drag coefficient is calculated based on integration of pressure and shear stress on the car surface. Relation between coefficient of drag and car speed in km/h is shown in Figure 17. Coefficient of drag decreases slightly from 0.073 to 0.066 as the car speed increases over the range of velocity. The decrease in coefficient of drag is mostly due to low frontal length and the flow is always associated with the car body.
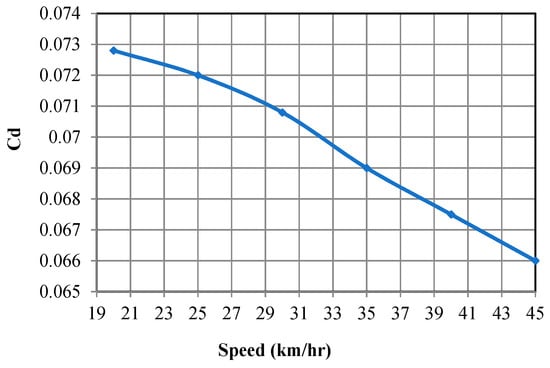
Figure 17.
Relation between coefficient of drag and car speed in km/h.
Relation between coefficient of lift and car speed in km/h is shown in Figure 18. The coefficient of lift increases as the car speed increases from 20 to 30 km/h and then decreases from 30 to 40 km/h. CL is a measure of the difference in pressure created above and below a car’s body as it moves through the surrounding viscous air. The slight change in the coefficient of lift value from −0.0733 to −0.0715 is due to small viscous effects of air.
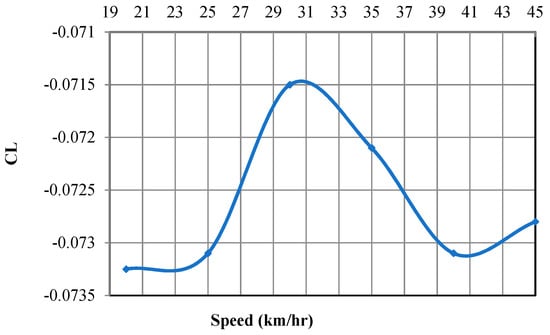
Figure 18.
Relation between coefficient of lift and car speed in km/h.
Lift to drag ratio, in aerodynamics, is the amount of lift produced by a vehicle divided by the drag created by movement through the air. As shown in Figure 19, Cl/Cd is almost unified until the car reaches a speed of 30 km/h, after which the ratio increases linearly. This may be due to an almost constant coefficient of lift and increases the coefficient of drag.
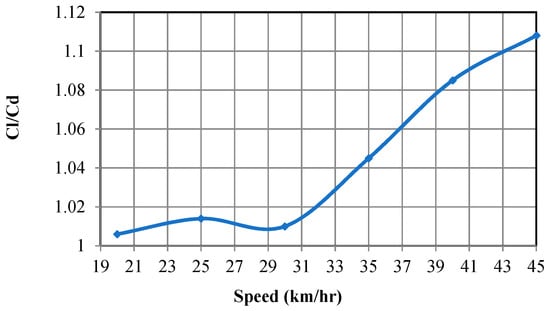
Figure 19.
Lift to drag ratio.
Figure 20 shows the pressure coefficient distribution at the middle vertical (x-y) plane of the car. The upper curve represents the bottom surface of the car and the lower curve represents the top one. Sudden changes in pressure are detected on the rear of the car. It can be observed that the positive pressure in front of the car is larger than that at the rear of the car due to some losses.
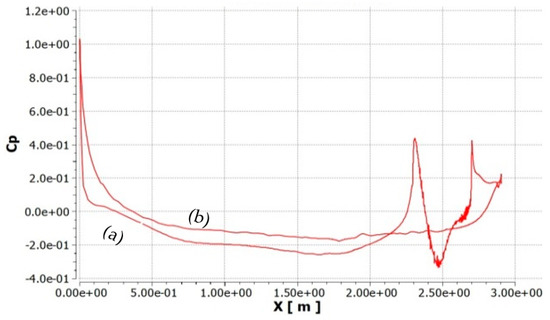
Figure 20.
Distribution of the pressure coefficient at mid-vertical plane of the car at velocity of 35 km/h (a) Pressure at top car surface. (b) Pressure at bottom car surface.
Air flow velocity and Pressure distributions on the car surface allow for the identification of the largest flow disturbances and the location of the highest pressure. Results of air velocity and pressure contours at a speed of 35 km/h (equals to 9.72 m/s) are shown in Figure 21, Figure 22, Figure 23, Figure 24 and Figure 25.
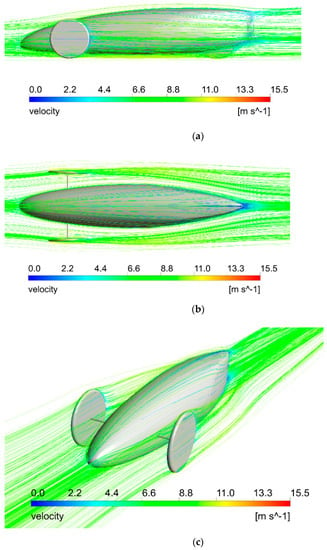
Figure 21.
Air flow velocity streamlines around the car at velocity of 35 km/h (a) Side View; (b) Plan View; (c) Isometric View.
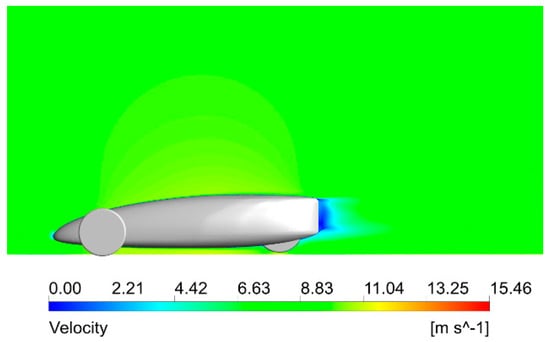
Figure 22.
Air flow velocity distribution around the side view of the car at a velocity of 35 km/h.
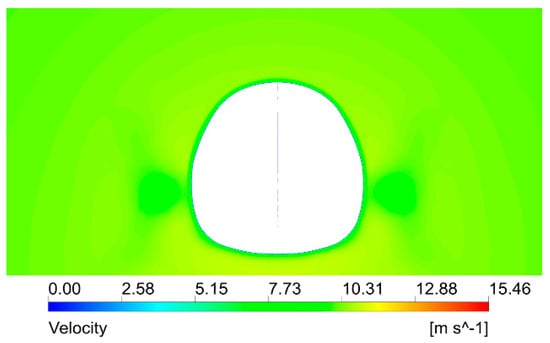
Figure 23.
Air flow velocity distribution around the rear view at a distance 1.5 m from the front of the car at a velocity of 35 km/h.
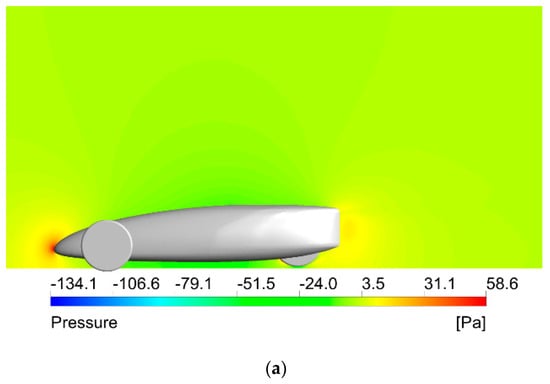
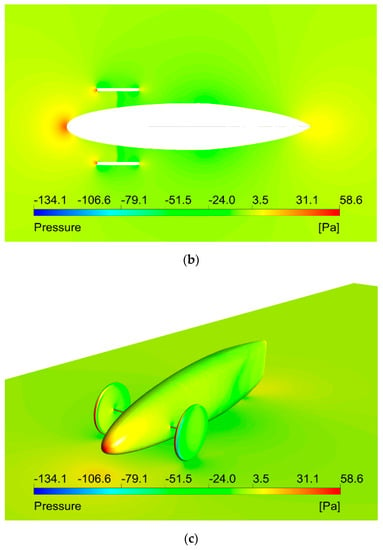
Figure 24.
Pressure distribution on the car surface at velocity of 35 km/h h (a) Side View; (b) Plan View; (c) Isometric View.
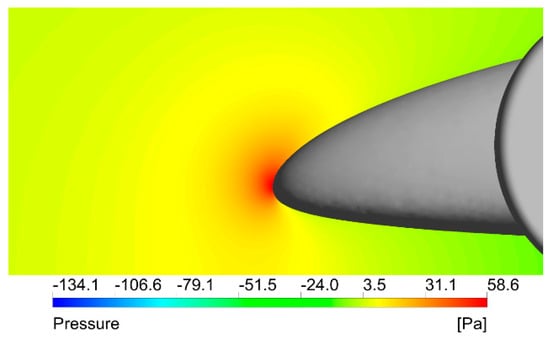
Figure 25.
Maximum pressure on the car front at a velocity of 35 km/h.
Figure 21, Figure 22 and Figure 23 display air flow velocity distribution around the car. A quite clean pattern appears and smooth velocity distribution lines are successfully achieved. It shows a good aerodynamic performance. The color of the streamlines shows a typical expected increase in speed as it passes on the top of the car surface. The airflow pattern on the side of the car also shows no evidence of flow separation on a large scale. At the rear of the car, the airflow is smoothly attached to the car body and joins the main airflow stream, eliminating the flow separation zone. The flow shows no separation throughout the car body.
6. Comparison with Previous Work
Cieslinski et al. [12] compared three different car body prototypes with fairing with their “Eco–Arrow” Figure 26.

Figure 26.
Car body shapes with fairings: (a) Eco-Arrow; (b) Prototype 1; (c) Prototype 2; (d) Prototype 3 [12].
Figure 27 and Table 6 show the relation between the present design and those from Reference [12]. Along the speed range, 20 to 45 km, the present car design shows the lowest coefficient of drag.
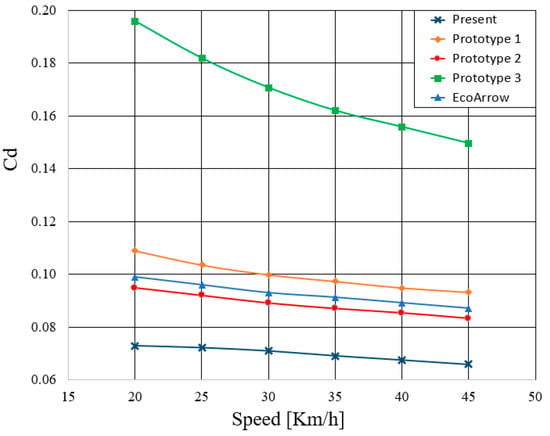
Figure 27.
Relation between coefficient of drag and car speed in km/h for the present car design and those from Reference [12].

Table 6.
Comparison between coefficient of drag, area of drag, coefficient of lift and drag force for present car design and those from Reference [12] at a velocity of 25 km/h.
Moreover, Table 7 shows a comparison between the coefficient of drag for Shell Eco-Marathon cars from previous (Experimental and Simulation) and present studies. The average drag coefficients of “Horas Mesin USU” and commercial city car “Ford-Fiesta” were 0.24320 and 0.29598, respectively [13]. Abo-Serie et al. [14] numerically proposed a low drag concept car with a tear drop shape and a non-rotating wheel with a coefficient of drag of 0.127.

Table 7.
Comparison between coefficient of drag for Shell Eco-Marathon cars from previous (Experimental and Numerical) and present studies at a velocity of 25 km/h.
Finally, the obtained coefficient of drag has a value lower than those of the best competition designs, which reaches a value as low as 0.075 [28]. The present car profile seems to be aerodynamically superior to others.
7. Conclusions
Using numerical analysis helps to investigate the aerodynamic properties of the present car model (shell eco-marathon car with Roncz and NACA 10 airfoils body profile) with non-rotating fairing wheels outside the car body. The numerical method is the first to be validated with previous experimental and numerical works on the Ahmed Body. The current numerical method shows an acceptable discrepancy. Using the validated method, a numerical study is performed and conclusions are as follows:
- The averaged drag coefficient is 0.069 (minimum value of all previous studies).
- The velocity vector shows a streamlined body.
- Pressure distribution shows the maximum pressure on the car front at a value of 58.6 Pa.
This fact indicates that the car design with Roncz and NACA 10 airfoils body profile is effective.
Author Contributions
Conceptualization, H.M., R.A. and O.K.; methodology, H.M., R.A. and O.K.; software, H.M., R.A. and O.K.; validation, H.M. and R.A.; formal analysis, H.M. and R.A.; investigation, H.M. and R.A.; resources, H.M. and R.A.; writing—original draft preparation, H.M. and R.A.; writing—review and editing, H.M. and R.A.; visualization, H.M. and R.A. All authors have read and agreed to the published version of the manuscript.
Funding
This research received no external funding.
Institutional Review Board Statement
Not applicable.
Informed Consent Statement
Not applicable.
Data Availability Statement
Not applicable.
Conflicts of Interest
The authors declare no conflict of interest.
Nomenclature
| Drag Force [N] | |
| Lift Force [N] | |
| ρ | fluid density [kg/] |
| V | flow velocity [m/s] |
| frontal area of lift force [] | |
| frontal area of lift force [] | |
| Drag coefficient | |
| Lift coefficient | |
| pressure coefficient | |
| ν | the local kinematic viscosity of the fluid [m/s] |
| Coefficient of drag for the experimental study of Ahmed model | |
| ΔP | Pressure difference [Pa] |
| FC | Fuel consumption |
| H | car driving property (0.5 to 0.7 for car driving at highway speed) |
| cross section of vehicle [] | |
| the speed of the vehicle in x direction [m/s] | |
| CL | car length [m] |
| CW | car width [m] |
| CH | car height [m] |
| the non–dimensional wall distance for a wall–bounded flow | |
| y | the distance to the nearest wall [m] |
| the friction velocity at the nearest wall [m/s] | |
| Coefficient of drag for the present study of Ahmed model. |
References
- Sarkar, S.; Thummar, K.; Shah, N.; Vagrecha, V. A Review paper on Aerodynamic Drag Reduction and CFD Analysis of Vehicles. Int. Res. J. Eng. Technol. (IRJET) 2019, 6, 231–235. [Google Scholar]
- Prasad, G.; Rose, J.B.R. Experimental and computational study of ice accretion effects on aerodynamic performance. Aircr. Eng. Aerosp. Technol. 2020, 92, 827–836. [Google Scholar]
- Tan, C.; Zhou, D.; Chen, G.; Sheridan, J.; Krajnovic, S. Influences of marshalling length on the flow structure of a maglev train. Int. J. Heat Fluid Flow 2020, 85, 108604. [Google Scholar] [CrossRef]
- Luo, J.; Li, Z.; Wang, L.; Zhang, D.; Wu, Y. Aerodynamic effect of cross passages at the entrance section of a high-speed railway tunnel in a region with mountains and canyons. J. Wind Eng. Ind. Aerodyn. 2020, 204, 104268. [Google Scholar] [CrossRef]
- Liang, X.; Li, X.; Chen, G.; Sun, B.; Wang, Z.; Xiong, X.; Yin, J.; Tang, M.; Li, X.; Krajnovic, S. On the aerodynamic loads when a high speed train passes under an overhead bridge. J. Wind Eng. Ind. Aerodyn. 2020, 202, 104208. [Google Scholar] [CrossRef]
- Ahmad, N.E.; Abo-Serie, E.; Gaylard, A. Mesh Optimization for Ground Vehicle Aerodynamics. CFD Lett. 2010, 2, 54–65. [Google Scholar]
- Aljure, D.E.; Calafell, J.; Baez, A.; Oliva, A. Flow over a realistic car model: Wall modeled large eddy simulations assessment and unsteady effects. J. Wind Eng. Ind. Aerodyn. 2018, 174, 225–240. [Google Scholar] [CrossRef]
- Fu, C.; Uddin, M.; Robinson, A.C. Turbulence modeling effects on the CFD predictions of flow over a NASCAR Gen 6 racecar. J. Wind Eng. Ind. Aerodyn. 2018, 176, 98–111. [Google Scholar] [CrossRef]
- Thangadurai, M.; Kumar, R.; Rana, S.C.; Chatterjee, D. Aerodynamic Influence of Added Surfaces on the Performance Characteristics of a Sports Car. J. Inst. Eng. Ser. C 2019, 100, 411–421. [Google Scholar] [CrossRef]
- Mariani, F.; Poggiani, C.; Risi, F.; Scappaticci, L. Formula-SAE Racing car: Experimental and Numerical Analysis of the External Aerodynamics. Energy Procedia 2015, 81, 1013–1029. [Google Scholar] [CrossRef]
- Czyż, Z.; Karpiński, P.; Koçak, S. Numerical Analysis of the Influence of Particular Parts of the High Efficient Electric Vehicle on the Aerodynamic Forces. Adv. Sci. Technol. Res. J. 2019, 13, 1–7. [Google Scholar] [CrossRef]
- Shell Eco-Marathon. Available online: https://www.shell.com/make-the-future/shell-ecomarathon/asia/for-asia-participants.html (accessed on 15 November 2020).
- Arpino, F.; Cortellessa, G.; Frattolillo, A.; Iannetta, F.; Scungio, M. Numerical and experimental investigation of the flow over a car prototype for the Shell Eco Marathon. J. Appl. Fluid Mech. 2019, 12, 207–218. [Google Scholar] [CrossRef]
- Cieslinski, A.; Prym, W.; Stajuda, M.; Witkowski, D. Investigation on Aerodynamics of Super–Effective Car for Drag Reduction. Mech. Mech. Eng. 2016, 20, 295–308. [Google Scholar]
- Ambarita, H.; Siregar, M.R.; Kawai, H. Study on aerodynamics characteristics on urban concept car for energy-efficient race. In IOP Conference Series: Materials Science and Engineering; IOP Publishing: Bristol, UK, 2018; Volume 343, p. 012025. [Google Scholar] [CrossRef]
- Abo-Serie, E.; Oran, E.; Utcu, O. Aerodynamics assessment using CFD for a low drag Shell Eco-Marathon car. J. Therm. Eng. 2017, 3, 1527–1536. [Google Scholar] [CrossRef]
- Brunn, A.; Wassen, E.; Sperber, D.; Nitsche, W.; Thiele, F. Active Drag Control for a Generic Car Model. In Active Flow Control; King, R., Ed.; Springer: Berlin/Heidelberg, Germany, 2007; pp. 247–259. [Google Scholar]
- Fourrie´, G.; Keirsbulck, L.; Labraga, L.; Gillie´ron, P. Bluff-body drag reduction using a deflector. Exp. Fluids 2011, 50, 385–395. [Google Scholar] [CrossRef]
- Dawi, A.H.; Akkermans, R.A.D. Direct and integral noise computation of two square cylinders in tandem arrangement. J. Sound Vib. 2018, 436, 138–154. [Google Scholar] [CrossRef]
- Dawi, A.H.; Akkermans, R.A.D. Spurious noise in direct noise computation with a finite volume method for automotive applications. Int. J. Heat Fluid Flow 2018, 72, 243–256. [Google Scholar] [CrossRef]
- Dawi, A.H.; Akkermans, R.A.D. Direct noise computation of a generic vehicle model using a finite volume method. Comput. Fluids 2019, 191, 104243. [Google Scholar] [CrossRef]
- Melin, T. Parametric Airfoil Catalog; Linköping University: Linköping, Sweden, 2013; ISBN 978-91-7519-656-5. [Google Scholar]
- Barnard, R.H. Road Vehicle Aerodynamic Design: An Introduction; Pearson Higher Education: London, England, 1996. [Google Scholar]
- Bhave, A.; Taherian, H. Aerodynamics of IntercityBus and Its Impact on CO2 Reductions. In Proceedings of the Fourteenth Annual Early Career Technical Conference, the University of Alabama, Birmingham ECTC 2014, Birmingham, AL, USA, 1–2 November 2014; pp. 165–172. [Google Scholar]
- Lienhart, H.; Stoots, C.; Becker, S. Flow and Turbulence Structures in the Wake of a Simplified Car Model (Ahmed Modell). In New Results in Numerical and Experimental Fluid Mechanics III, Notes on Numerical Fluid Mechanics (NNFM); Springer: Berlin, Germany, 2002; Volume 77, pp. 323–330. [Google Scholar]
- Gurunathan, S.; Parammasivam, M.K.; Gunasekar, S. Reduction of Aerodynamic Drag Force for Reducing Fuel Consumption in Road Vehicle using Basebleed. J. Appl. Fluid Mech. 2018, 11, 1489–1495. [Google Scholar]
- Anderson, J.D. Fundamentals of Aerodynamics, 4th ed.; McGraw-Hill: New York, NY, USA, 2007. [Google Scholar]
- CFD Online. Available online: http://www.cfd-online.com/Wiki/Dimensionlesswalldistance%28yplus%29 (accessed on 15 November 2020).
- Wilcox, D.C. Turbulence Modeling for CFD, 2nd ed.; DCW Industries: New York, NY, USA, 1998; pp. 73–95. ISBN 0-9636051-5-1. [Google Scholar]
- Menter, F.R. Zonal Two Equation k-ω Turbulence Models for Aerodynamic Flows. In Proceedings of the AIAA 93-2906, 24th Fluid Dynamics Conference, Orlando, FL, USA, 6–9 July 1993. [Google Scholar]
- Menter, F.R. Two-Equation Eddy-Viscosity Turbulence Models for Engineering Applications. AIAA J. 1994, 32, 1598–1605. [Google Scholar] [CrossRef]
- Menter, F.R.; Kuntz, M.; Langtry, R. Ten years of Industrial Experience with the SST Turbulence Model. In Proceedings of the Fourth International Symposium on Turbulence, Heat and Mass Transfer, Antalya, Turkey, 12–17 October 2003; Hanjalić, K., Ed.; Begell House: New York, NY, USA, 2003. [Google Scholar]
- Blazek, J. Computational Fluid Dynamics: Principles and Applications, 1st ed.; Elsevier Science Ltd.: The Boulevard, Langford Lane, UK, 2001; pp. 56–75. ISBN 0080430090. [Google Scholar]
- Franck, G.; Nigro, N.; Storti, M.; D’Elia, J. Numerical Simulation of the Flow around the Ahmed Vehicle Model. Lat. Am. Appl. Res. 2009, 39, 295–306. [Google Scholar]
- Santin, J.J.; Onder, C.H.; Bernard, J.; Isler, D.; Kobler, P.; Kolb, F.; Weidmann, N.; Guzzella, L. The World’s Most Fuel Efficient Vehicle: Design and Development of PAC-CAR II; Zurich/Singen: London, UK, 2007. [Google Scholar]
Publisher’s Note: MDPI stays neutral with regard to jurisdictional claims in published maps and institutional affiliations. |
© 2020 by the authors. Licensee MDPI, Basel, Switzerland. This article is an open access article distributed under the terms and conditions of the Creative Commons Attribution (CC BY) license (http://creativecommons.org/licenses/by/4.0/).