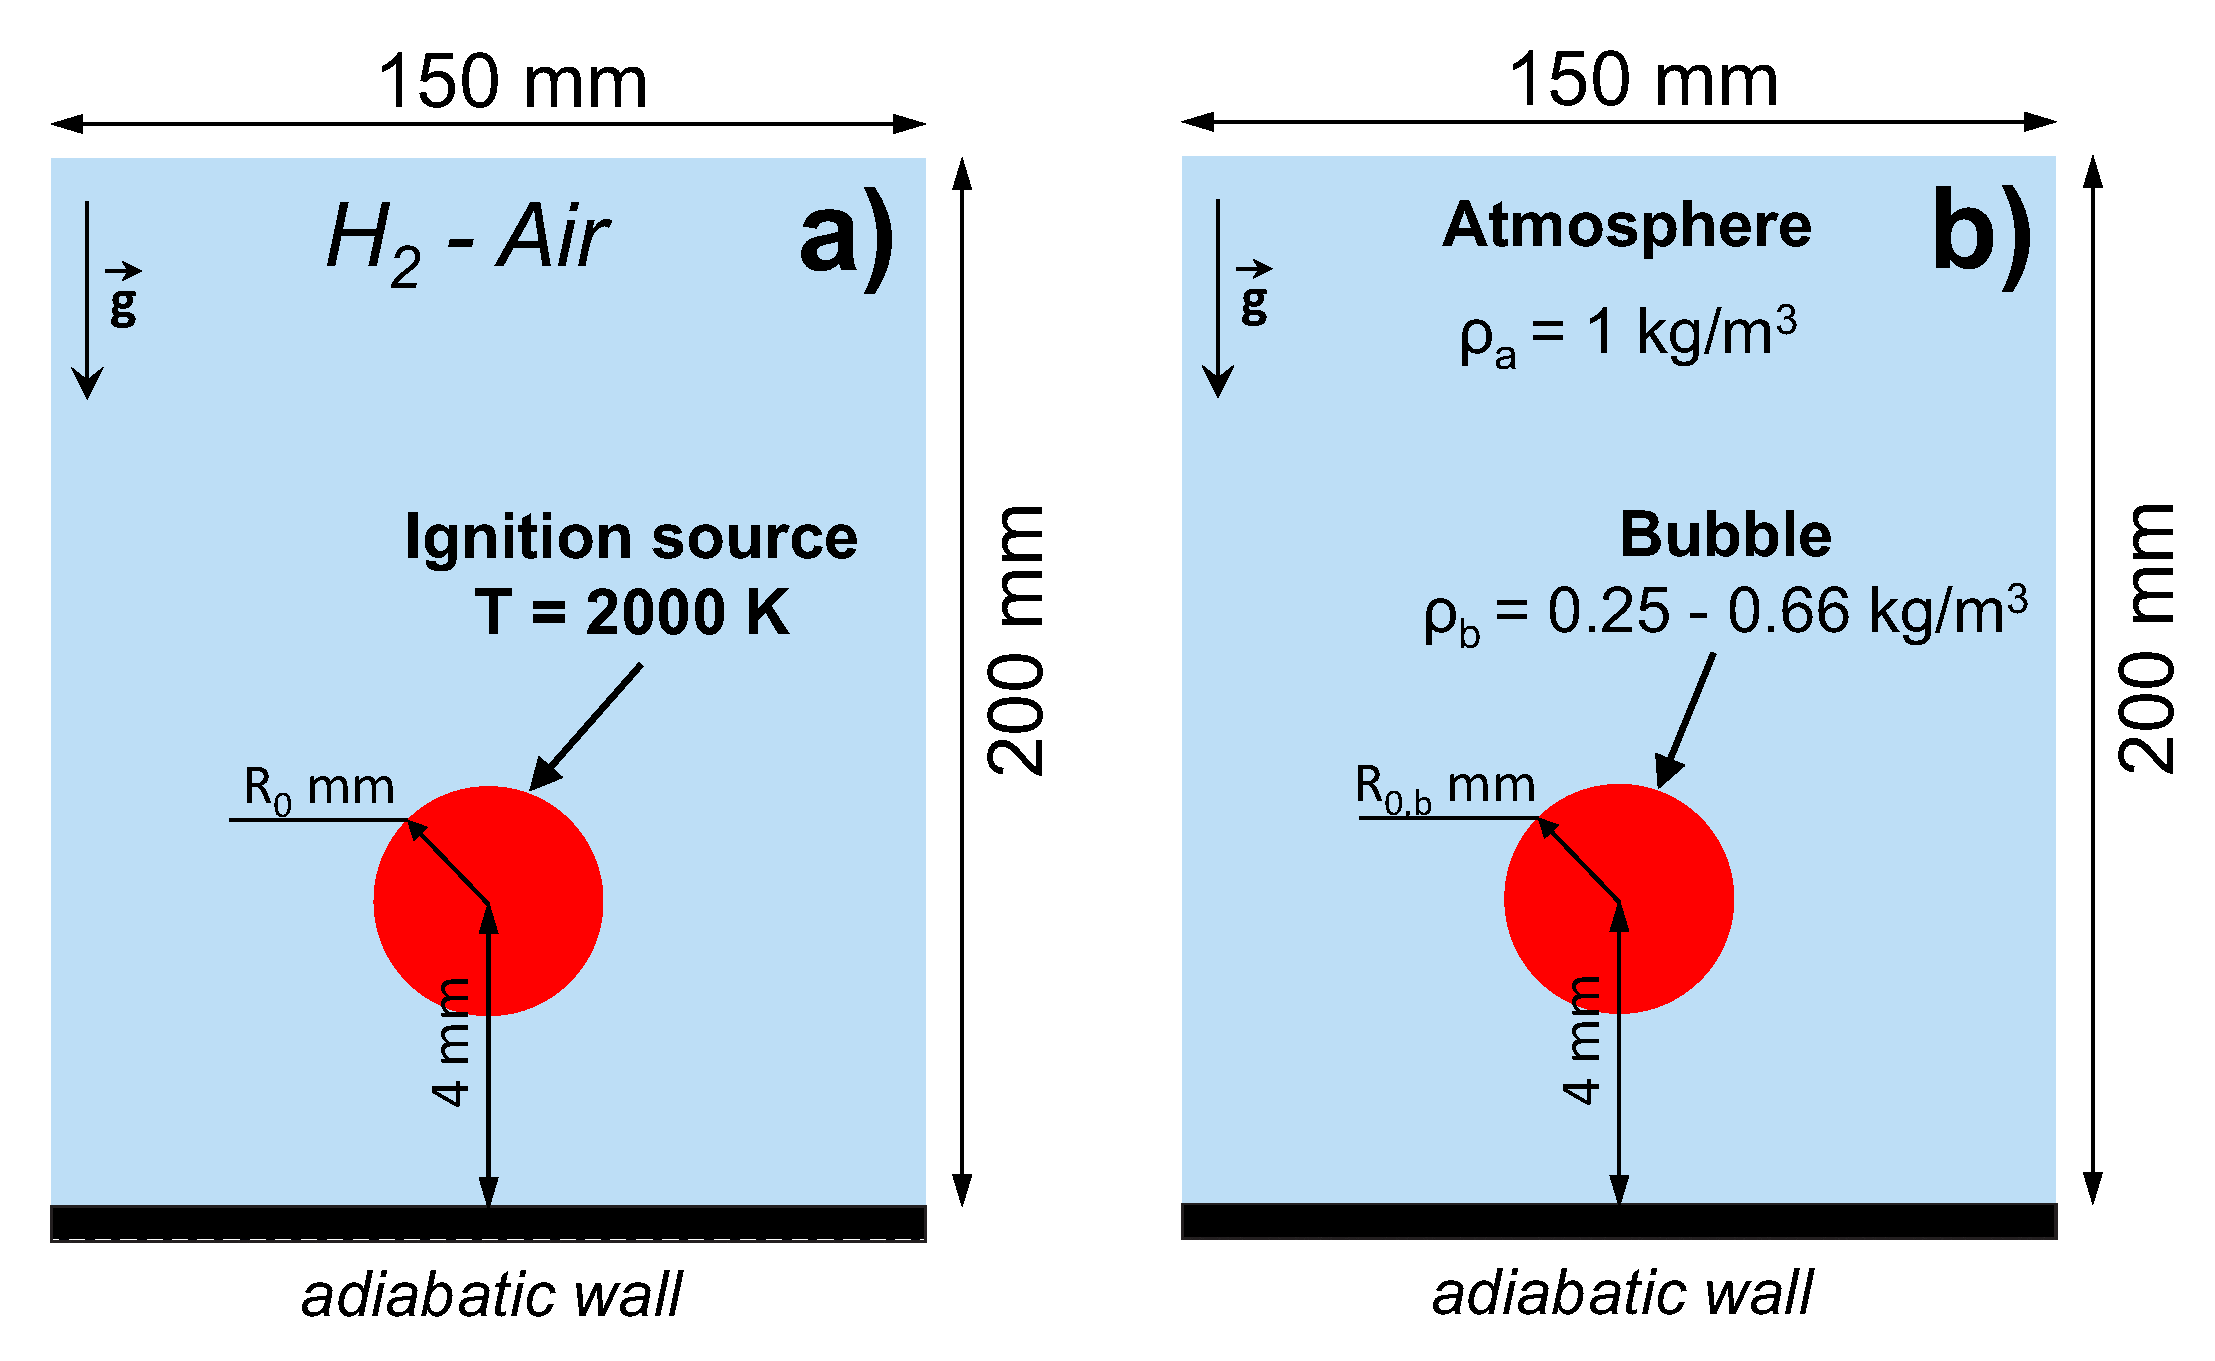
1. Introduction
Even today, fire and explosion safety remains a relevant problem for energy, technology, and industrial applications. Among the most acute issues is the determination of conditions and mechanisms of non-stationary flame propagation, flame acceleration, and transition to fast subsonic and supersonic flame propagation regimes, including detonations. Another critical problem is related to the assessment of flammability limits and, in particular, to the investigation of combustion modes in lean and ultra-lean flammable gaseous mixtures. It is widely accepted that the most dangerous and devastating accidents are related to the occurrence of fast flames and detonations, so the problem of flame non-stationary development was a focus of intense studies worldwide [
1]. In past decades, through real experimental studies and numerical analysis, many significant results have been obtained crucial for understanding non-stationary flame acceleration in confined vessels and combustion chambers filled with reactive gaseous mixtures. However, fast flame development, first of all, is observed in highly active mixtures with the composition near stoichiometric one. In the conditions intrinsic to the real technical systems and energy facilities operation, the formation and explosion of stoichiometric gaseous compounds are uncommon. When considering the scenarios related to the explosion safety, in most cases, combustible gases are gradually released as a result of decompression of fuel tanks or chemical generation of the reactive component. In large volumes characteristic for the real technical environments, very intense release and long periods are required for a flammable gas to mix with the oxidizer atmosphere and form a highly active gaseous mixture with nearly stoichiometric composition. In the real case scenario, the presence of venting also efficiently reduces the concentration of combustible components in the gaseous mixture inside of the volume. Besides, the mixture possesses a vertical concentration gradient due to natural convection. If the reactive component is heavier than the atmospheric air, then the composition near the floor is richer than near the ceiling and vice versa for the light fuels such as hydrogen. Thus, the problem of precise determination of the lean flammability limits and the evolution of the flame in near-limit gaseous mixtures is of primary importance for the safety analysis of real facilities. The problem of assessment of lean flammability limit is one of the fundamental ones and was thoroughly studied. For now, a large amount of experimental data is available on concentration limits for a wide range of combustible compounds and conditions. However, the dynamics of near-limit flames and physical mechanisms determining the development of combustion in real large-scale environments under terrestrial gravity conditions are still poorly understood.
Flame structures developing in ultra-lean premixed combustible mixtures with scarce fuel content possess a set of peculiar features. Theoretical analysis of the ultra-lean flame in zero gravity conditions have shown that the key mechanism of the combustion stability is the diffusion of the deficient reactant to the reaction zone [
2]. In contrast, for the deflagrative combustion intrinsic to the more chemically active mixtures, the main mechanisms of flame propagation are heat transfer and diffusion of radicals [
3]. Experimental evidence of stable ultra-lean kernels, so-called “flame-balls”, was obtained for the first time in microgravity experiments [
4,
5,
6]. Stable ultra-lean flame kernels were also experimentally observed and numerically investigated in the co-flow setup at terrestrial gravity conditions [
7]. The evolution of ultra-lean flames in large-scale volumes at terrestrial gravity conditions that is of paramount interest for real technical applications is little discussed in the literature. In classical papers by Bohm an Clusius [
8] and Babkin et al. [
9], the formation of rising cap-shaped flames and more complex flame structures in flammability tubes filled with the lean mixtures of the near limit compositions were experimentally observed. In recent papers [
10,
11], it was shown that the non-confined flame in the ultra-lean mixture evolves into a complex multi-kernel structure after ignition due to the influence of buoyancy forces and gas-dynamical flows associated with hot products upward motion. Herewith, gas-dynamic flows formed on the initial stages of the flame development may cause the breakup of the flame structure that defines the formation of small-scale flame kernels that are not able to sustain stable combustion and tend to extinguish [
12]. Thus, it is of importance to take into account buoyancy-driven flows associated with the flame kernel rise to determine flammability limits in the terrestrial gravity conditions.
Ultra-lean flame kernel dynamics is very similar to the one of gaseous bubble rising in liquid or dynamics of liquid drops in immiscible fluids [
13]. Along with the features of the upward motion, such as the character of rising velocity change with time and the tendency to approach the terminal velocity value, the flame kernel also possesses similar structural behavior to the propagating gaseous bubbles or liquid drops in immiscible fluids [
14,
15]. The flame-bubble analogy was fruitfully adopted by V. Bychkov to analyze curved flames propagation and associated Rayleigh–Taylor instability development in horizontal tubes [
16,
17] and astrophysical flames [
18].
In the present paper, we aim to study the ultra-lean flames by means of numerical modeling and classify the flame structure by employing flame-bubble analogy. Here, the large-scale structure of the ultra-lean flame in terrestrial gravity conditions is analyzed numerically in a range of near-limit compositions. For the first time, the flame-bubble analogy is extended to describe spatial flame structure and stability by means of correlation diagrams commonly used for the classification of bubbles and droplets [
19].
3. Numerical Methods
The governing equations represent the full Navier-Stokes model with account of thermal conductivity, multicomponent diffusion, energy release associated with the chemical transformations, and gravity forces. Due to the low intensity of the process of near-limit combustion, it is reasonable to use low-Mach approximation to avoid strict limitations on the time step of numerical integration. The following equations constitute the mathematical model of the considered process [
20]:
here
is the mass density,
is the mass velocity,
are the mass velocity vector components,
is the mass fraction of
k-th component of gaseous mixture,
is the molecular weight of
k-th component of gaseous mixture,
is the dynamic component of pressure fluctuations, which is much smaller by the order of magnitude compare with thermodynamic pressure
and
,
is the viscous stresses tensor,
are the components of the viscous stresses tensor,
is the stagnation energy per unit mass,
is the vorticity vector,
is the acceleration of gravity,
is the specific enthalpy of the mixture,
is the specific enthalpy of
k-th component of gaseous mixture,
T is the temperature,
is the thermal conductivity coefficient,
is the viscosity coefficient,
is the specific enthalpy of formation of
k-th component of the gaseous mixture,
is the diffusion velocity vector component of
k-th specie,
is the specific heat capacity at constant pressure of the mixture. Term
represents the change in mass fraction of
k-th specie due to the chemical reactions.
Data form the JANAF tables [
21] was used to calculate specific heat capacities and enthalpies of formation. Diffusion was modeled in the zeroth-order Hirshfelder-Curtiss approximation [
22]. Mixture averaged transport coefficients were obtained from the first principles of the gas kinetics theory [
23]. Correction velocity approach proposed in [
24] was implemented to calculate diffusion velocities. Chemical kinetics of the hydrogen-air mixture oxidation was modeled via detailed oxidation scheme with 21 elemental reaction and 9 species [
25].
The governing Equations (
1)–(
7) were integrated via the second-order predictor/corrector method described in [
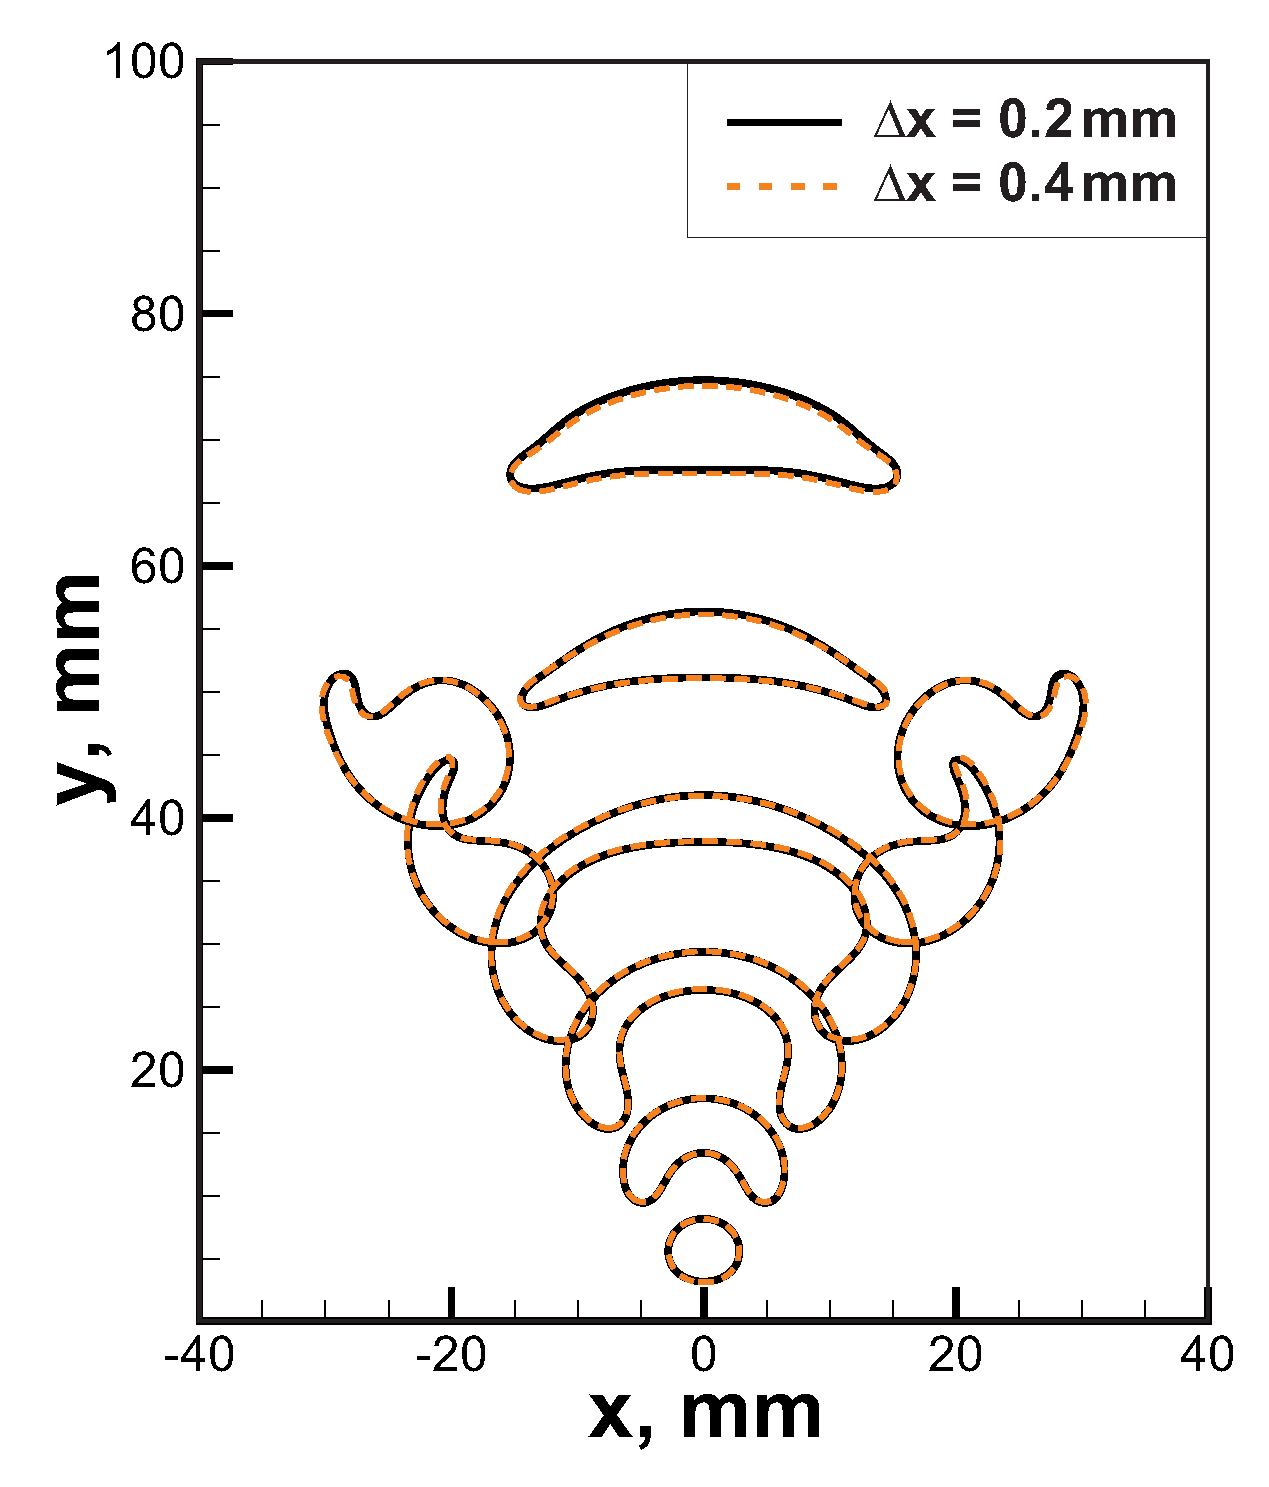
26]. Computational cell size was equal
mm that allows obtaining convergent solution (see comparison between solutions obtained in computational domains with cells
mm and
mm in
Figure 2). Flame thickness for the 6% H
-Air mixture, which is the most reactive mixture among the considered ones, is about 10 mm. Thus, the spatial flame front structure is resolved with at least 25 cells for the cell size
mm that is sufficient for the convergence.
4. Results and Discussion
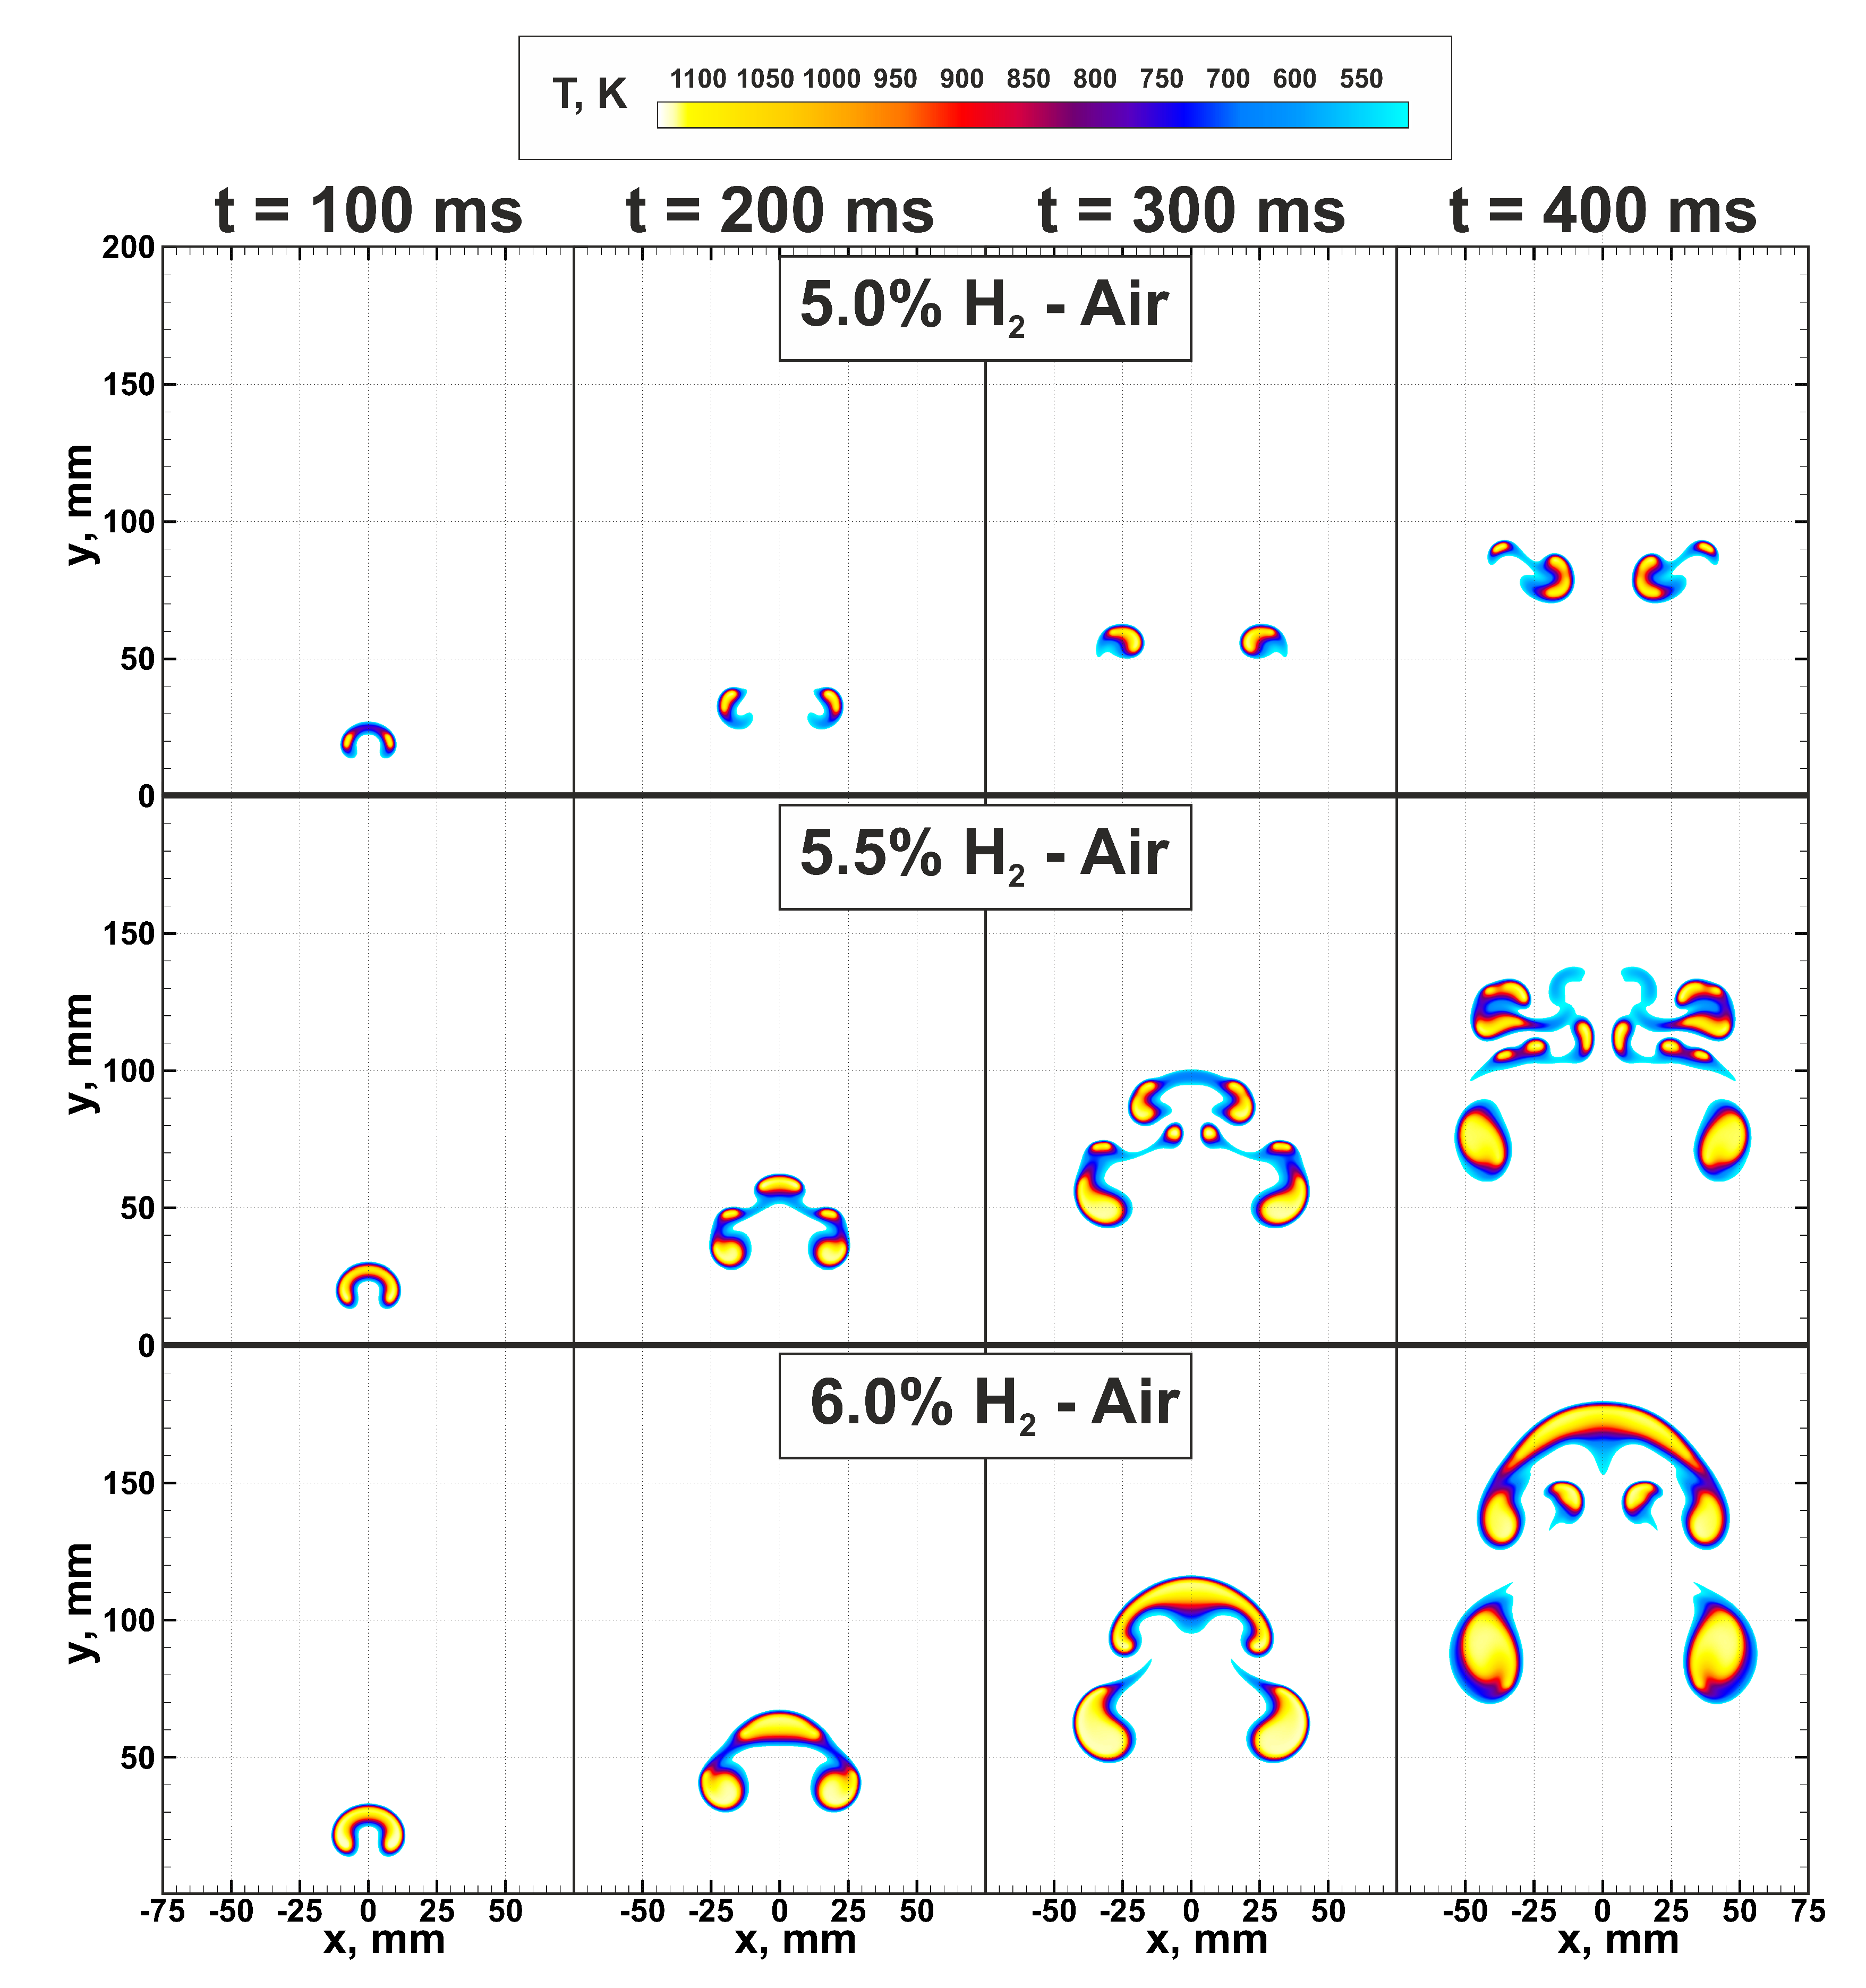
At first, let us consider the flame structures and dynamics of flame kernels in near-limit hydrogen-air mixtures. In
Figure 3 spatial flame structures formed in the mixtures with compositions
% H
and ignited by the heated region with
mm radius are presented. One can see that a small variation of the composition, less than 2% of hydrogen content in the mixture, leads to the drastic change in the ultra-lean flame structure. For the mixture with 4.5% hydrogen content in the air, successful flame propagation was not observed in the case of ignition via the heated region with
mm. In the compound with 5% hydrogen content, a cap-shaped flame structure, formed on the early stage of the flame evolution, is almost immediately being broken up by the vortical flows generated by the rising combustion products [
12]. That leads to the formation of two separate flame kernels, which continue to propagate upward under the buoyancy effect, and the combustion area only slightly expands with time. Increasing hydrogen content up to 5.5% results in a more complex flame structure. Here, similarly to the case of 5% H
in air, the initially formed cap-shaped flame is subjected to the stretching forces determined by the vortical flows. Here flame is broken up as well. However, the combustion intensity is high enough to produce a larger amount of combustion products and to maintain three separate combustion zones—on the leading tip of the cap and the periphery. The middle kernel demonstrates similar behavior as after the ignition. Its upward motion generates vortical flow in the wake. As a result, the secondary break-up proceeds in the leading flame kernel. This time the volume of the accumulated combustion products is not enough, and the flame breaks up in a similar scenario as in the 5% H
mixture. The overall evolution of the flame is very sensitive to gas-dynamics. Emerging gas flows stretch and easily tear apart the flame surface into smaller flame kernels. Nevertheless, due to higher burning rate, such break-up events do not cause the global quenching of the flame, and it continues to rise upward in the form of a separated multi-kernel structure. Exactly this multi-kernel combustion was presumably registered in [
8]. Finally, the stable cap-shaped flame structure is formed in the hydrogen-air mixture with 6% hydrogen content. Here one can also observe break-up events, although they happen only on the periphery of the cap-shaped flame. Detailed analysis of this combustion mode was carried out in [
10].
Analysis of the ultra-lean combustion dynamics under terrestrial gravity conditions allows concluding that gas-dynamical flows associated with natural convection and buoyancy of hot combustion products in cold fresh mixture atmosphere can inhibit flame propagation. The inhibition mechanism here is similar to that of the turbulent flows, where the excessive flow-induced stretch leads to the flame quenching [
27]. However, turbulence can also cause flame intensification, especially in the mixtures with a pronounced preferential diffusion effects [
28]. Thus, in ultra-lean hydrogen mixtures with Lewis number sufficiently lower than 1, one can expect an increase in burning velocity due to flame stretch and flame surface break-up.
Let us continue with the analysis of the ignition effect on the ultra-lean flame dynamics. In
Figure 4, the comparison between flame dynamics in a 6% hydrogen-air mixture initiated by three different ignition modes (
mm) is demonstrated. One can see that general trends are quite similar. In all the cases the maximal temperature of the flame approaches super adiabatic value
K. Additional 1D calculations in spherical symmetry provide value of maximal flame temperature
K. Maximal flame temperature in two-dimensional flame can exceed values obtained in 1D setup due to gas-dynamical stretch and curvature of the flame front. The burning velocity can be assessed as the time derivative of the radius of the circular area equivalent to the area of the combustion products
. This evaluation provides an almost identical time history of the burning velocity throughout the process in each case. It can be noted that after ignition burning velocity tends to the value of ≈30 mm/s that is close to the normal burning velocity obtained in 1D simulations. However, after peripheral break-up and formation of additional small kernels, burning velocity increases. That is associated with the positive effect of curvature due to preferential diffusion. The main difference between three ignition modes is related to the initial cooling rate of the flame kernel and the initial value of the equivalent radius. The higher amount of the initially heated gas cools down slower and supports the increased rate of combustion for a longer time. That results in higher starting values of
. In the case of a 6% H
-air mixture that mechanism does not play a significant role. The situation changes dramatically closer to limit compositions. The mixture with 4.5% H
content, which is not flammable by the ignition source with
mm, occurs to be able to burn when the area of ignition is increased. In
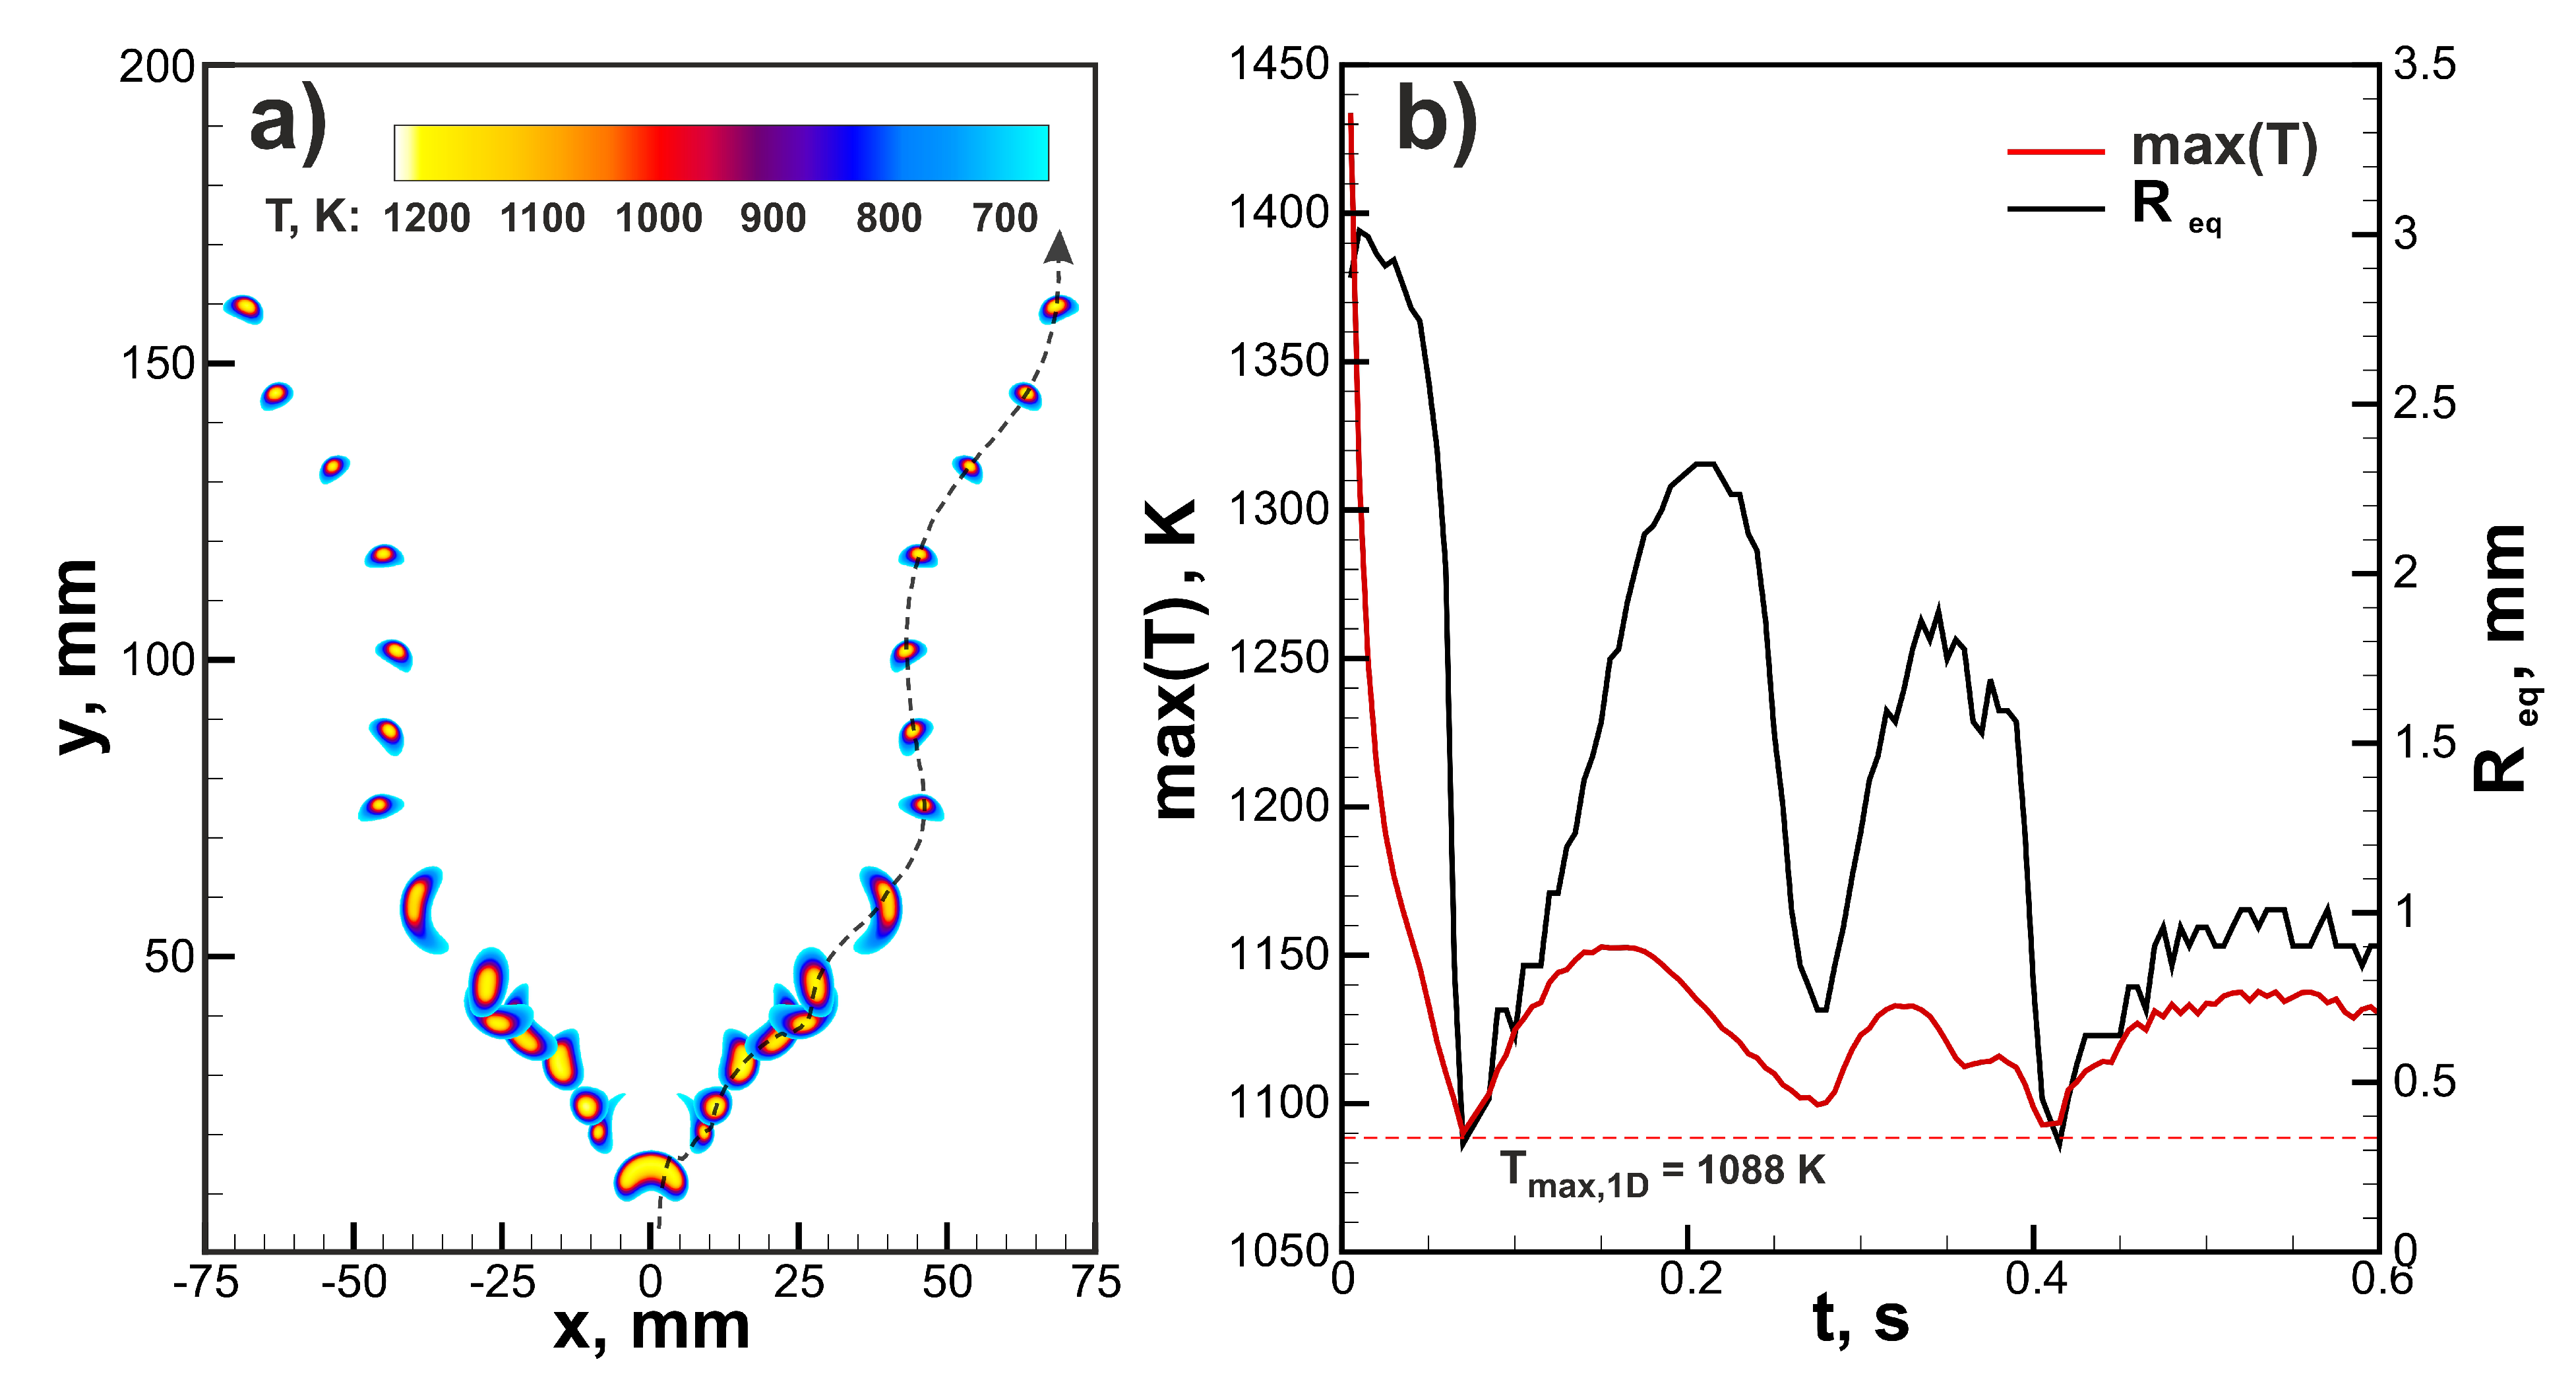
Figure 5a, the flame structure in the 4.5% H
-air mixture is demonstrated. The flame consists of two separate kernels that do not grow in time but travel upwards in a zigzagging trajectory. Such rising mode can be also observed in case of small gaseous bubbles [
29]. In
Figure 5b, time histories of the maximum flame temperature and
are depicted. One can see that flame temperature changes in an oscillating way, approaching the maximal temperature obtained in 1D spherical calculations (
) in the lowest position.
shows similar behavior and oscillates near the average value of ≈1.5 mm. The excessive amount of combustion products generated in the early stage of the flame development due to the increased ignition region allows sustaining combustion in the 4.5% H
-air mixture.
To analyze flame dynamics from the flame-bubble analogy point of view, we performed calculations of two dimensionless factors, namely Reynolds number
and Froude number
. The Reynolds number reflects the effect of inertial and viscous forces, while the Froude number indicates the ratio of inertial and gravity forces. Such a set of dimensionless parameters is commonly used for the analysis of bubble dynamics in liquid [
14]. Characteristic velocity
U was calculated as a difference between the rising velocity
and burning velocity estimated as
. For bubbles, characteristic velocity was equal to the rising velocity of the bubble. In
Figure 6, the diagrams obtained in the Re-Fr plane are given. At first, we performed calculations of dimensionless quantities for bubbles with different initial radii
and density ratios
. It occurs that the trajectory of the bubble in the Re-Fr plane represents a line segment during the initial accelerated upward motion (see
Figure 6a). Convective mixing smooths out the density gradient, and the bubble area decreases until it ceases to be distinguishable. A convective decrease in bubble area results in a deviation from the linear trajectory in the Re-Fr plane as the Reynolds number increases with the bubble area, while the Froude number, on the contrary, decreases. That process is inevitable due to the absence of surface tension. Convective mixing is more pronounced with
increased, as the density ratio defines the initial buoyant acceleration of the bubble. Thus, the length of the linear segment decreases with increasing
. At
, linear segment ceases to exist as the convective mixing starts to dominate the structure of the bubble. Therefore, we plotted linear segments of the initial bubble dynamics for density ratios
. Linear segments of bubbles with the same initial radius
occur to have the same slope, while density ratio defines the starting point of the linear segment and its length. All the bubbles with the same initial radius
develop similar spatial structures that allowed us to divide the Re-Fr plane into areas defined by the slopes of linear segments (see
Figure 6) where one expects to observe one or another structure of the bubble. The obtained diagram can be used to predict and classify the spatial structure of bubbles and gaseous flame kernels. Comparing flame structures in
Figure 3 and bubble structures in
Figure 6b, one can note a clear resemblance. In the region near the
mm line, bubbles loose connectivity and acquire a two-kernel structure, similar to the flame modes observed in 5.0% and 4.5% H
-Air mixtures. On the other hand, line
mm defines the region with stable cap-shaped bubbles. Lines
mm and
mm correspond to unstable bubbles susceptible to the development of Rayleigh-Taylor instability on the interface [
30].
For the flame kernels, trajectories on the Re-Fr plane are not linear (see arrows in
Figure 6b). Flame trajectories possess two distinct attraction limits, namely low
and high
and high
and low
. The low value of the Froude number
is characteristic to stable modes of flame kernel evolution insusceptible to Rayleigh-Taylor instability development in terrestrial gravity conditions such as multi-kernel (5.5% H
-Air) or cap-shaped (6.0% H
-Air) flames. For that kind of flame, effective combustion area rises together with the rising velocity, and rising velocity increases slower or with the same increment as the square of combustion products area. Apparently, that is the case for the mixtures with high burning velocity. On the other hand, the second limit of high
and low
attracts flames of leaner compositions characterized by modes with small kernels (5.0% H
-Air and 4.5% H
-Air with
mm). In such flames, convection causes a strong quenching effect. Therefore, each break-up event results in a major loss in the effective flame area. So the equivalent radius of the flame rapidly reduces, and the Froude number increases. It is interesting to note that the combustion process in 5.5% H
-Air has a loop in trajectory in the Re-Fr plane. The trajectory enters the region with the possibility of flame break-up due to Rayleigh-Taylor instability. That behavior reflects the formation of a multi-kernel structure on the initial stages of flame evolution, during which the convective quenching effect is manifested most strongly, and the effective combustion area substantially decreases. After the initial impact, the flame recovers and proceeds the propagation without significant opposition.
It should be noted that the rising velocity of the flame kernel is determined by the expansion ratio of the flame, which is almost constant in the considered range of hydrogen content. Thus, it is the burning velocity and the ability to withstand convective cooling during the break-up events that determine the difference in trajectories in the Re-Fr plane for different mixtures. That explains the shift in the flammability limit with the increase of the initial radius of the ignition area . The higher flame area is less affected by the convective cooling during the initial break-up of the flame in 4.5% hydrogen-air mixture. Therefore, combustion is still possible after the break-up. The same effect can be obtained with the increase of ignition temperature (intensity of the ignition source) instead of enlargement of the area of the ignition zone.


