1. Introduction
Traditionally, the organization of the electricity sector was based on vertically integrated electric power companies, which produced, transported and distributed electrical energy without competition. Liberalization began in the earlier nineties and led to both wholesale markets, where producers provide energy to retailers, and retail markets, where retailers guarantee the delivery of energy to end-use customers (see [
1,
2]). Three major market models are often distinguished [
3]: pools, bilateral contracts and hybrids models. A pool is defined as a centralized marketplace that clears the market for sellers and buyers. Bilateral contracts are tradable arrangements of power between two parties. Such contracts have the advantage of price predictability (in comparison with uncertain pool prices). The hybrid model combines several characteristics of the previous two models. In this way, market participants can either trade power through pools or negotiate bilateral power supply agreements.
Recently, the European Union presented a new package of measures to facilitate the clean energy transition and the operation of the European internal market of electricity (see [
4,
5]). Additionally, the European Governments have already started to incentive producers to invest in the production of variable renewable energy (VRE) without considering feed-in tariffs or other similar incentives. Variable renewable energy, such as solar and wind power, has near-zero marginal cost, but depends heavily on meteorological conditions, bringing uncertainty and variability to the markets, and largely affecting their outcomes [
6].
Most current market designs were developed by taking into account dispatchable power plants, meaning that they may not be adequate to consider large levels of renewable generation. VRE producers typically submit bids to day-ahead markets at a near-zero price, contributing to a reduction in the market-clearing price (see [
7]). Also, VRE producers may need to make adjustments to their production commitments in balancing markets, thus paying substantial penalties (see [
8]).
Hydroelectric power producers (HPPs) are often considered market players that take direct advantage of increasing levels of VRE. Hydro plants are able to provide fast responses and HPPs can make use of the periods of time with low energy prices to pump, and the periods with high energy prices to produce electricity (see [
9,
10]). Such plants are ‘’simple” to control and operate. They have turbines to convert the kinetic energy of waterfalls to mechanical energy which, in turn, can be converted to electrical energy by generators. They can also work as mechanical engines, allowing turbines to pump water.
HPPs use complex methods to determine the quantities to produce or pump. A key parameter associated with this process is the volume of the reservoir, which influences the economic value of water, and consequently the price to consider in the bids to submit to the market. Other important parameters are the (actual) flow of water, which affects the output of the performance curves, and the (future) flow of water, which also influences the economic value of water. In addition to these aspects, the process of optimizing the operation of hydro power plants takes into account the forecast of both market prices and demand, to strategically determine the best tasks to perform—that is, to produce energy or to pump (see [
11,
12]).
Power systems with large levels of renewable generation need flexibility, such as the flexibility provided by energy storage systems and demand response technologies [
13]. In case they do not include pumped hydroelectric storage (PHS) or other storage capabilities, they need to consider the potential flexibility from the demand-side to respond to the variability and uncertainty of renewable generation. However, such flexibility is not straightforward, meaning that a simple and interesting solution seems to be the strategic operation of hydro power plants. Clearly, in the actual power systems, the production of hydro plants may be considered regular and consistent, while (some) thermal power plants are increasingly reducing their production.
Energy markets do not traditionally allow joint offers related to two or more power plants in the same balancing zone [
14]. Such offers can be used to compensate the variability and uncertainty of VRE by making use of complementary and coordination techniques (see [
15,
16]). The European Union is paying attention to this aspect, meaning that market participation shall be enabled by the aggregation of generation from multiple power-generating facilities to provide joint offers on the electricity market, in accordance with the Union competition law [
4,
5].
Now, theorists and practitioners have paid some attention to hydro plants, wind plants and energy markets generally, and a number of models and studies exist in the literature (see [
17,
18] for reviews). In [
11], for instance, the authors present a model for self-scheduling a set of HPPs that participate in the spot market. They compute the optimal power to produce by taking into account the real-time water discharge of each hydro plant. Additionally, they compute a forecast of the market prices to determine the expected remuneration of each HPP. In [
19], the authors present a similar model, but consider a generation company that manages both wind and hydro power plants. The main goal of this piece of work consists in maximizing the expected return of the generation company, taking into account risk constraints, as well as the wind generation uncertainty and the volatility of market prices. In [
20], the authors compare the performance of a system composed by hydro and wind plants by considering both variable and fixed speed hydro plants. They conclude that variable speed plants (together with wind plants) lead to higher benefits at both technical and operational levels (when compared to fixed speed plants). In [
21], the authors present a short-term optimization model for hydro power plants (considering a time horizon from one day to one week previous to real-time operation). Overall, the majority of studies focus on the operational level of hydroelectric power plants and to a large extent ignore the strategic behavior of HPPs and its impact on market prices.
In our previous work [
22], we performed a preliminary analysis of the hydro-wind balance in the Portuguese electric system. Specifically, we conducted a simulation-based study and confirmed the (well-known) conclusions that HPPs consider the hours with low market prices (normally involving a high wind power level and/or a low demand) to pump, and the hours with high market prices (normally peak hours with a high demand) to produce energy. However, the study did not consider the strategic behavior of HPPs—that is, the energy quantity and the economic and pumping values of water were pre-defined, independent of the water content of the reservoir.
Against this background, the purpose of this paper is twofold:
To present a model for hydro power plants that considers the economic and pumping values of water, and also accounts for unit performance curves.
To present a study to ”test” the model and analyze the hydro-wind balance in a real-world setting.
The study involves a power system with a relevant penetration of hydro and wind power (more than 50%) and is conducted with the help of the energy management tool called MATREM [
23,
24].
The remainder of the paper is structured as follows:
Section 2 gives an overview of energy markets and reserve products.
Section 3 describes the trading behavior of wind power producers and analyses the typical operation of hydro plants.
Section 4 presents a model for hydroelectric power plants.
Section 5 presents an overview of the MATREM system.
Section 6 presents a case study and discusses the simulation results. Finally,
Section 7 states the conclusions and outlines avenues for future work.
2. Energy Markets and Reserve Products
The main European markets are Nordpool [
25], EPEX Spot [
26] and MIBEL [
27]. These markets close at 12 noon (CET), 12 to 36 h before physical delivery in central Europe, and 13 to 37 h in Great Britain, Ireland and Portugal [
28,
29]. The day-ahead markets (DAMs) are the biggest and most liquid physical markets. The trading occurs through an implicit auction where price and quantity are computed for every hour of the next day, using EUPHEMIA, a hybrid algorithm currently used in the European Price Coupling Region. EUPHEMIA uses the system marginal pricing theory [
30]. Intra-day markets (IDMs) may involve auctions (such as DAMs, but with several sessions), or operate continuously, using the pay-as-bid scheme or bilateral contracts.
Transmission system operators (TSOs) consider the market results of both day-ahead and intra-day markets for preparing the real-time operation of power systems. Deviations from schedules need to be balanced in balancing markets (BMs), and the market participants that originate such deviations should pay (or receive) the imbalance price. Balancing markets are required and imposed by the European network of transmission system operators (ENTSO-E). Operationally, TSOs have the responsibility of ensuring the power reserve values for balancing markets, within their zone of control, and based on ENTSO-E requirements.
In Europe, there are three key types of load-frequency control products traded in balancing markets. During real-time operation, primary or frequency controlled reserve (FCR) is the first to be activated, after grid disturbances, incidents or imbalances between production and consumption, that results in frequency oscillations. It needs to be activated for up to 15 s and the disturbances should disappear within 30 s. Secondary or automatic-activated frequency restoration reserve (aFRR) should be activated within 30 s, taking a maximum of 15 min to be completed, replacing FCR. Tertiary or manually-activated FRR (mFRR) should be fully activated in 15 min, and can continue active for hours, freeing up FCR and aFRR (see [
31,
32]).
Derivatives markets allow participants to trade financial instruments, such as forwards, futures, options and swaps. These instruments are essentially contracts to buy or sell a specific amount of electricity at a certain future time for a specific price. They are often used to hedge against pool price volatility. However, if inappropriately chosen, they may actually worsen the benefit of market participants, since the market-clearing price—that is, the day-ahead price—may be either too high or too low when compared with the contract price [
33,
34]. In retail markets, consumers and retailers can negotiate private bilateral contracts, setting the terms of those contracts [
35].
3. Wind and Hydroelectric Power Plants
3.1. Wind Power Plants
The trading behavior of wind power producers (WPPs) takes into consideration the most reliable meteorological data to minimize deviations. Let d be a particular day of operation. Wind power producers submit bids to the day-ahead market during day , and make commitments to produce specific quantities of energy for day d. Such bids are based on wind power forecasts, meaning that an effective participation of WPPs in the market needs an efficient method to forecast the production of wind energy. After participating in the day-ahead market, WPPs take into account the meteorological updates, as well as the operational time needed to manipulate the meteorological data, and determine the deviations in relation to the commitments made in the market. Following this, WPPs may compensate such deviations in the various sessions of the intra-day market. Finally, near real-time operation, wind power producers should compensate any remaining deviations in the balancing market.
The literature presents a number of models to forecast wind power, including numerical weather prediction (NWP) models (see [
36]). However, these models present systematic errors (phase and amplitude), which can be explained by a failure to solve sub-grid scale phenomena, as well as the initial and boundary meteorological conditions and poor representations of the physics due to the physical parametrization of the models [
37,
38]. To reduce the uncertainties related to these models, statistical techniques are usually coupled to their outcomes to obtain wind power forecasts. In this way, and in order to substantially reduce forecast errors, we consider an aggregation of wind power producers, meaning that the bids to submit to the market result from the (expected) production of a group of WPPs. Additionally, such bids include a quantity and a price. The price is assumed to be 0
/MWh.
3.2. Hydroelectric Power Plants
Figure 1 illustrates the typical operation of a hydro power plant that has a reservoir. As noted, HPPs typically consider the periods of the day with low energy prices for pumping, and the other periods of the day (with high prices) for producing energy. As producers, they operate in the supply-side, using the turbines to produce electricity, and as consumers, they act on the demand-side, using the turbines as engines to pump water.
The bids of hydroelectric power producers are very important and should be defined as rigorously as possible. To this end, players should take into account the content of the reservoir as well as future water inflows (e.g., rain and pumping) and outflows (e.g., energy production). In this work, we consider the aggregation of all HPPs that have reservoir, and the bids of the resulting player are obtained by taking into account the value of water (see below).
4. A Model for Hydroelectric Power Plants
Hydroelectric power plants that have a reservoir and pumped hydroelectric storage are key power plants technically capable of providing fast responses, thus having potential flexibility to compensate the variability and uncertainty of renewable generation. Such plants are easily controllable, notably when equipped with high capacity reservoirs.
For a particular day
d,
Figure 2 presents some important variables involved in the planning and operation of a hydroelectric power plant. Typically, in the day before the day of operation (i.e., day
), operators determine a forecast of the market prices for day
d, which in turn is computed by taking into account forecasts of both demand and VRE production, as well as commodity prices associated with the operation of other dispatchable power plants that are expected to participate in the market. Operators also consider the content of the reservoir and the water discharged. Such data allow agents to prepare a plan for the operation of hydro plants during the 24 h of day
d—that is, to produce energy, to pump water or simply to stay idle.
Now, let
be a time period (i.e., a set of hours
h).
Figure 3 depicts the strategic operation of a hydro plant during period
T. We use oval boxes to denote operational processes (or modules). Additionally, we use boldface to represent a vector (e.g.,
) in contrast to a scalar (e.g.,
), and a hat to represent uncertainty (e.g.,
or
).
For period T, let be a prediction of the electricity load, a prediction of the electricity generated from renewable energy sources, and a prediction of the variable costs associated with the operation of different dispatchable power plants that are expected to participate in the market. The ‘Price Forecast Process’ takes , and as input, and returns a prediction of the market price.
Let be the initial water content of the reservoir and the initial water discharge (i.e., the content of the reservoir and the water discharge at any given hour before ). For period T, the ‘’Strategic and Operational Process” computes the bids to submit to the market through an iterative procedure. In the first iteration, it takes and as input, determines predictions of the water content of the reservoir and the water discharge , and computes the price and the energy quantity to submit to the market at . In the iteration (), it takes and as inputs, determines and , and computes and . At the end, it returns the prices and the energy quantities for each hour of period T under consideration.
Notice that the content of the reservoir and the water discharged are important variables associated with the operation of hydro plants. In particular, the content of the reservoir is a central variable, since it allows us to compute the value of water, as well as the performance curves of hydro plants. The value of water is very important to determine the price to consider in the bids to submit to the day-ahead market. The performance curves are essential to compute the quantity of energy to consider in such bids.
4.1. The Value of Water
The (economic) value of water,
, may be considered the value that pushes out of the market the more expensive power plants [
10]. In this work, it is estimated by the following family of exponential functions:
where
is the price cap of the market,
is a parameter,
is a function that computes the water content of the reservoir,
is the maximum content of the reservoir, and
is the maximum marginal cost of the plants served by the reference technology. The family of functions is parametrized by a value
that determines the convexity degree of the curve—that is, a number of functions can be defined simply by varying the value of
(see
Figure 4).
The (pumping) value of water,
, can be considered the strategic value that increases the water stored in the reservoir. It is also estimated by a family of exponential functions:
where
is a parameter and
is the maximum marginal cost of the plants served by the base load technology (i.e., the plants whose bids enter the supply curve at the very bottom due to their low marginal cost). Again, this family of functions is parametrized by a value
(i.e., a wide range of functions can be defined by varying
, as shown in
Figure 4).
The value of water is essential to model the behavior of hydro plants—that is, the possibility to strategically behave like producers or consumers depending on the circumstances. Specifically, HPPs operate as producers (and sell energy) when the market price is higher than the (economic) value of water. Additionally, they operate as consumers (and pump water) when the market price is lower than the (pumping) value of water. They also stay idle when the market price falls between the two values. For a particular hour
, this strategic behavior is formalized by the following function:
The value of water is also essential for defining the price to consider in either the bids to sell (energy) or the offers to buy (energy) that hydro plants submit to the market. Specifically, the (economic) value of water is used to define the price to consider in the bids to sell energy. Likewise, the (pumping) value of water is used to define the price to consider in the offers to buy energy—that is, the price that HPPs are willing to pay to increase the level of water in the reservoir.
The (economic) value of water is typically lower than the (pumping) value of water. In very wet years, the (economic) value is frequently higher than the marginal cost of combined-cycle gas turbine (CCGT) plants. The (pumping) value is also very high. In common wet years, the (economic) value is frequently higher than the marginal cost of nuclear power plants, although it can be lower than the marginal cost of coal-fired plants. The (pumping) value can fall below the marginal cost of nuclear plants. In (very) dry years, both the (economic) value and the (pumping) value are low, although the former tends toward the marginal cost of nuclear plants, and the latter to the marginal cost of the electricity produced from renewable sources. Clearly, hydro power producers that own plants with multiple turbines can both produce energy and pump water during a particular hour of operation h. However, this dual behavior should be adopted in emergency cases only, since HPPs would then be able to sell and buy electrical energy at the same price, thus ignoring the possibility of taking advantage of the hours with low market prices to pump water.
4.2. Performance Curves
Now, after formalizing the price to consider in the bids/offers, there is a need to define the quantity of energy to submit to the market. To this end, the model should account for the relationship between the head of the reservoir, the water discharged, and the power generated. This relationship is typically represented as a family of nonlinear and nonconcave curves (referred to as unit performance curves).
The literature presents a number of models to approximate the performance curves. In particular, several authors consider concave piecewise linear approximations (e.g., [
39,
40]). Other authors adopt the so-called best local efficiency points [
41,
42]). These and other existing pieces of work neglect the effect of the variation of the head to avoid nonlinearities. This effect in conjunction with start-up costs for hydro units is considered; however, in the work presented in [
11]. The authors formulate the self-scheduling problem for hydro plants as a 0/1 mixed-integer linear problem. The number of performance curves needed to represent accurately the head variation is usually small (below 5), and therefore, the associated computational burden is moderate. Accordingly, this approach is adopted in this work.
Let
be the maximum water discharge (the maximum volume of water that a turbine can handle without compromising security). Likewise, let
be the minimum water discharge (the minimum value that a turbine requires to efficiently start operating). Let
and
be the maximum and minimum contents of the reservoir, respectively. Additionally, let
and
be the upper and lower levels of the content of the reservoir, respectively.
Figure 5 illustrates three representative performance curves.
is the minimum power output for performance curve 1 (lower interval of water content),
the minimum power output for curve 2 (intermediate interval of water content), and
the minimum power output for curve 3 (higher interval of water content). The first performance curve (curve 1) represents the worst scenario where the content of the reservoir in a given period is below the lower level. The second curve represents the intermediate scenario where the content of the reservoir is between the lower and upper levels. The third curve represents the best scenario where the stored water in a given period is above the upper level. The generalization to any number of performance curves can be considered to be straightforward.
Notice that the start-up costs of hydroelectric power plants represent different types of losses during operation, notably costs due to wear and tear of the windings, malfunctions in the control equipment, loss of water during maintenance, wear and tear of the mechanical equipment, and loss of water during the start-up. From all of these causes, the first two are often considered the most important.
4.3. Operation of Hydro Power Plants
Let
d be a given day of operation. As mentioned at the beginning of this section, and illustrated in
Figure 2, operators determine forecasts of market prices for day
d during day
(i.e., the day before the operating day). Recall the ‘’Price Forecast Process”, that takes as input load predictions
, predictions of the energy generated from renewable energy sources
, and predictions of the variable costs related to dispatchable power plants
. Additionally, recall the ‘’Strategic and Operational Process”, that computes the bids to submit to the market through an iterative procedure. For a given hour
h of day
d, this process takes
and
as input, determines
and
, and computes
and
. The economic and pumping values of water are essential to determine
, as well as to define the strategic behavior of hydro plants, namely to decide when to produce energy or to pump. Likewise, the unit performance curves are essential to determine
.
Now, the main goal of the participants in the energy market is to maximize profit, which is normally determined by the difference between the revenues and the total operating costs (production costs and start-up costs). In the case of hydro units, the production costs are negligible [
11]. The start-up costs are, however, relevant, and are indirectly considered in this work by adopting the aforementioned performance curves. Accordingly, for a given hour
h, considering function
S, the benefit
of HPPs is formalized by the following function:
For a given period
T, the total benefit (of the period) is formalized by the following function:
5. The MATREM System: Overview of the Simulated Markets
MATREM (acronym for Multi-Agent TRading in Electricity Markets) is an agent-based system to help manage both the complexity of wholesale markets and the key challenges of bilateral contracting in retail markets The system operationalizes a power exchange, comprising a day-ahead market and an intra-day-market, a derivatives exchange, comprising a futures market, a balancing market, and a bilateral marketplace for negotiating tailored (or customized) contracts. Market entities (e.g., generating companies, retailers, aggregators, and market operators) are modeled as software agents capable of flexible action and able to interact with other agents to meet their design objectives (see [
23] for a detailed description of the system, and [
24] for its classification according to a number of dimensions related to both competitive energy markets and software agents).
The day-ahead market is a central market where generation and demand can be traded on an hourly basis (see [
43]). The intra-day market is a short-term market to make adjustments in the positions of participants as delivery time approaches (such as managing forecast errors related to renewable generation). The pricing mechanism of both markets is based on the marginal pricing theory—MATREM supports the system marginal pricing (typical of European markets) and the locational marginal pricing (typical of North American markets).
The futures market is an organized market for both financial and physical products to allow participants to hedge against the price volatility inherent to day-ahead and intra-day markets. An electronic trading platform continuously matches the bids to sell and buy energy likely to interfere with each other. The balancing market is a market for providing system services. The system operator defines the needs of the power system, collects the bids from the participants, and determines the prices by considering a simplified version of the marginal pricing algorithm (see [
8]). The bilateral marketplace allows participants to negotiate the details of two different types of contracts, namely forward contracts and contracts for difference (see [
44,
45]). Finally, and especially noteworthy, is the possibility to use the system to conduct different studies on market design (see [
46]).
6. A Case-Study
The study considers a simplified version of the Portuguese electric system, involving six generating companies (GenCos) and five retailers (RetailCos). The system is characterized by a substantial number of coal power plants (base power), working at full power with a yearly penetration around 20%. Coal is, therefore, the dominant technology of the market, with a marginal cost around 45 /MWh. The time period of the study has the duration of two years (2009–2010).
The study is conducted with the help of the MATREM system, meaning that all market players are modeled as software agents. Several key features of the GenCo agents are shown in
Table 1, including the generation technology, the maximum capacity and the production cost. The ‘’GenCo HydroPower” agent submits bids to sell or buy energy in the day-ahead market (DAM), by considering a maximum quantity of 3000 MW (taking into account the performance curves), and a price computed from the economic and pumping values of water. For convenience, we consider a ‘’GenCo HydroPower” agent that aggregates all hydro plants. Additionally, to get meaningful differences in the bidding price, we consider a reservoir with the (hypothetical) capacity of 120,000 MWh, which can be considered sufficient for a full operation of the agent for 40 h without water inflows, but is lower than the real storage capacity of the Portuguese hydro plants. Furthermore, we consider that the actual content of the reservoir is 72,000 MWh (60% of full capacity) and the price cap is 180.3
/MWh (the Iberian market price cap).
The ‘’GenCo WindPower” agent represents a set of wind parks located in Portugal with an installed capacity of 249 MW. To get meaningful results, the installed capacity from these wind parks is up-scaled to 3000 MW, with an yearly capacity factor around 30%. Thus, during the period of the study, the hourly average production corresponds to 900 MWh. When the ‘’GenCo WindPower” agent produces energy, it can surpass the Portuguese demand in off-peak hours. In this way, and taking into account that coal power plants are slow plants (i.e., they have slow ramp rates and typically experience some difficulties in compensating the uncertainty associated with wind power generation), the hydroelectric power plants are the ones that compensate the excess of production of wind power.
The method considered in the study involves the adoption of a clustering method (the k-medoids technique) to statistically identify the optimal number of representative (wind power) daily profiles during the years 2009 and 2010 [
47]. This is done by taking into consideration the “GenCo WindPower” agent portfolio. A representative day can be considered the best day that statistically represents a set of days in a given wind power profile. This approach allows us to identify seven profiles. Among these, five of them involve significant (up and down) power ramps, with a frequency of occurrence around 63%.
Table 2 presents the buyer agents and the data related to the corresponding offers to buy energy—that is, the minimum and maximum energy quantities and the energy prices. Additionally, for illustrative purposes,
Figure 6 presents the hourly wind power data of a representative day of a typical daily profile (with a frequency of occurrence of 11%), together with the wind power forecast. The selected profile corresponds to the profile with the highest down ramp. The figure also shows the difference between the forecast values obtained at hour 6 (between 17 and 41 h prior to real production) and the real production (see the dashed blue area).
The purpose of the study is to confirm (and rebut) the typical behavior of hydro power producers. Specifically, and as noted earlier, HPPs usually use the periods of the day with high VRE production and/or low market prices for pumping, and the periods with high market prices to produce energy. The agents (sellers and buyers) participate in the day-ahead market (DAM) by submitting bids and offers. This market is simulated with the help of the MATREM system.
6.1. Market Results
Figure 7 presents the simulation results from the point of view of the market, namely the market-clearing prices and the power commitments. In the period between the third and the fifth hour, the market prices are low. Additionally, the demand is low and satisfied by wind power only (green color in the figure). There is, therefore, the possibility for the ‘’GenCo HydroPower” agent to pump—specifically, 62.73 MWh at the third hour, 216.54 MWh at the fourth hour, and 240.78 MWh at the fifth hour. In the period between the 10th and the 24th hour, the market prices are high. The demand increases substantially and the wind power production decreases. The ’‘GenCo HydroPower” agent produces a considerable quantity of energy, ranging between 693.63 and 2418.44 MWh.
Figure 7 also illustrates, at least to some extent, the hydro-wind balance. In the periods of time characterized by an excess of renewable generation, hydro plants may take into consideration such excess, and strategically adopt a pumping behavior. Accordingly, from 3 to 5 h, the ‘’GenCo HydroPower” agent pumps around 520 MWh (at low prices). In the periods of time when renewable generation is low, hydro plants may strategically produce energy (in order to be remunerated at high prices). Thus, from 10 to 24 h, the production of the ”GenCo HydroPower” agent increases substantially. Notice that the economic value of water can be considered lower than the marginal price of the CCGT plants, meaning that the latter are pushed out of the market.
6.2. Wind Power Results
The bids that the ”GenCo WindPower” agent submits to the day-ahead market are limited to wind energy forecasts (since the time horizon between the gate closure of the market and the real-time operation is significant). From
Figure 7, and as discussed in the previous subsection, during the period ranging from 3 to 5 h, there is an excess of wind energy in the system, meaning that the ‘’GenCo HydroPower” agent pumps water at low prices. This procedure is important to the system, avoiding curtailment (of VRE) and to some extent contributing to an increase in the market price [
48,
49].
After participating in the day-ahead market, the ‘’GenCo WindPower” agent may adjust the commitments made in the DAM by participating in the intra-day market (IDM). The IDM is a market closer to real-time operation, and therefore the ‘’GenCo WindPower” agent has the possibility to prepare new bids that take into account more reliable meteorological data, leading to better results (better forecasts).
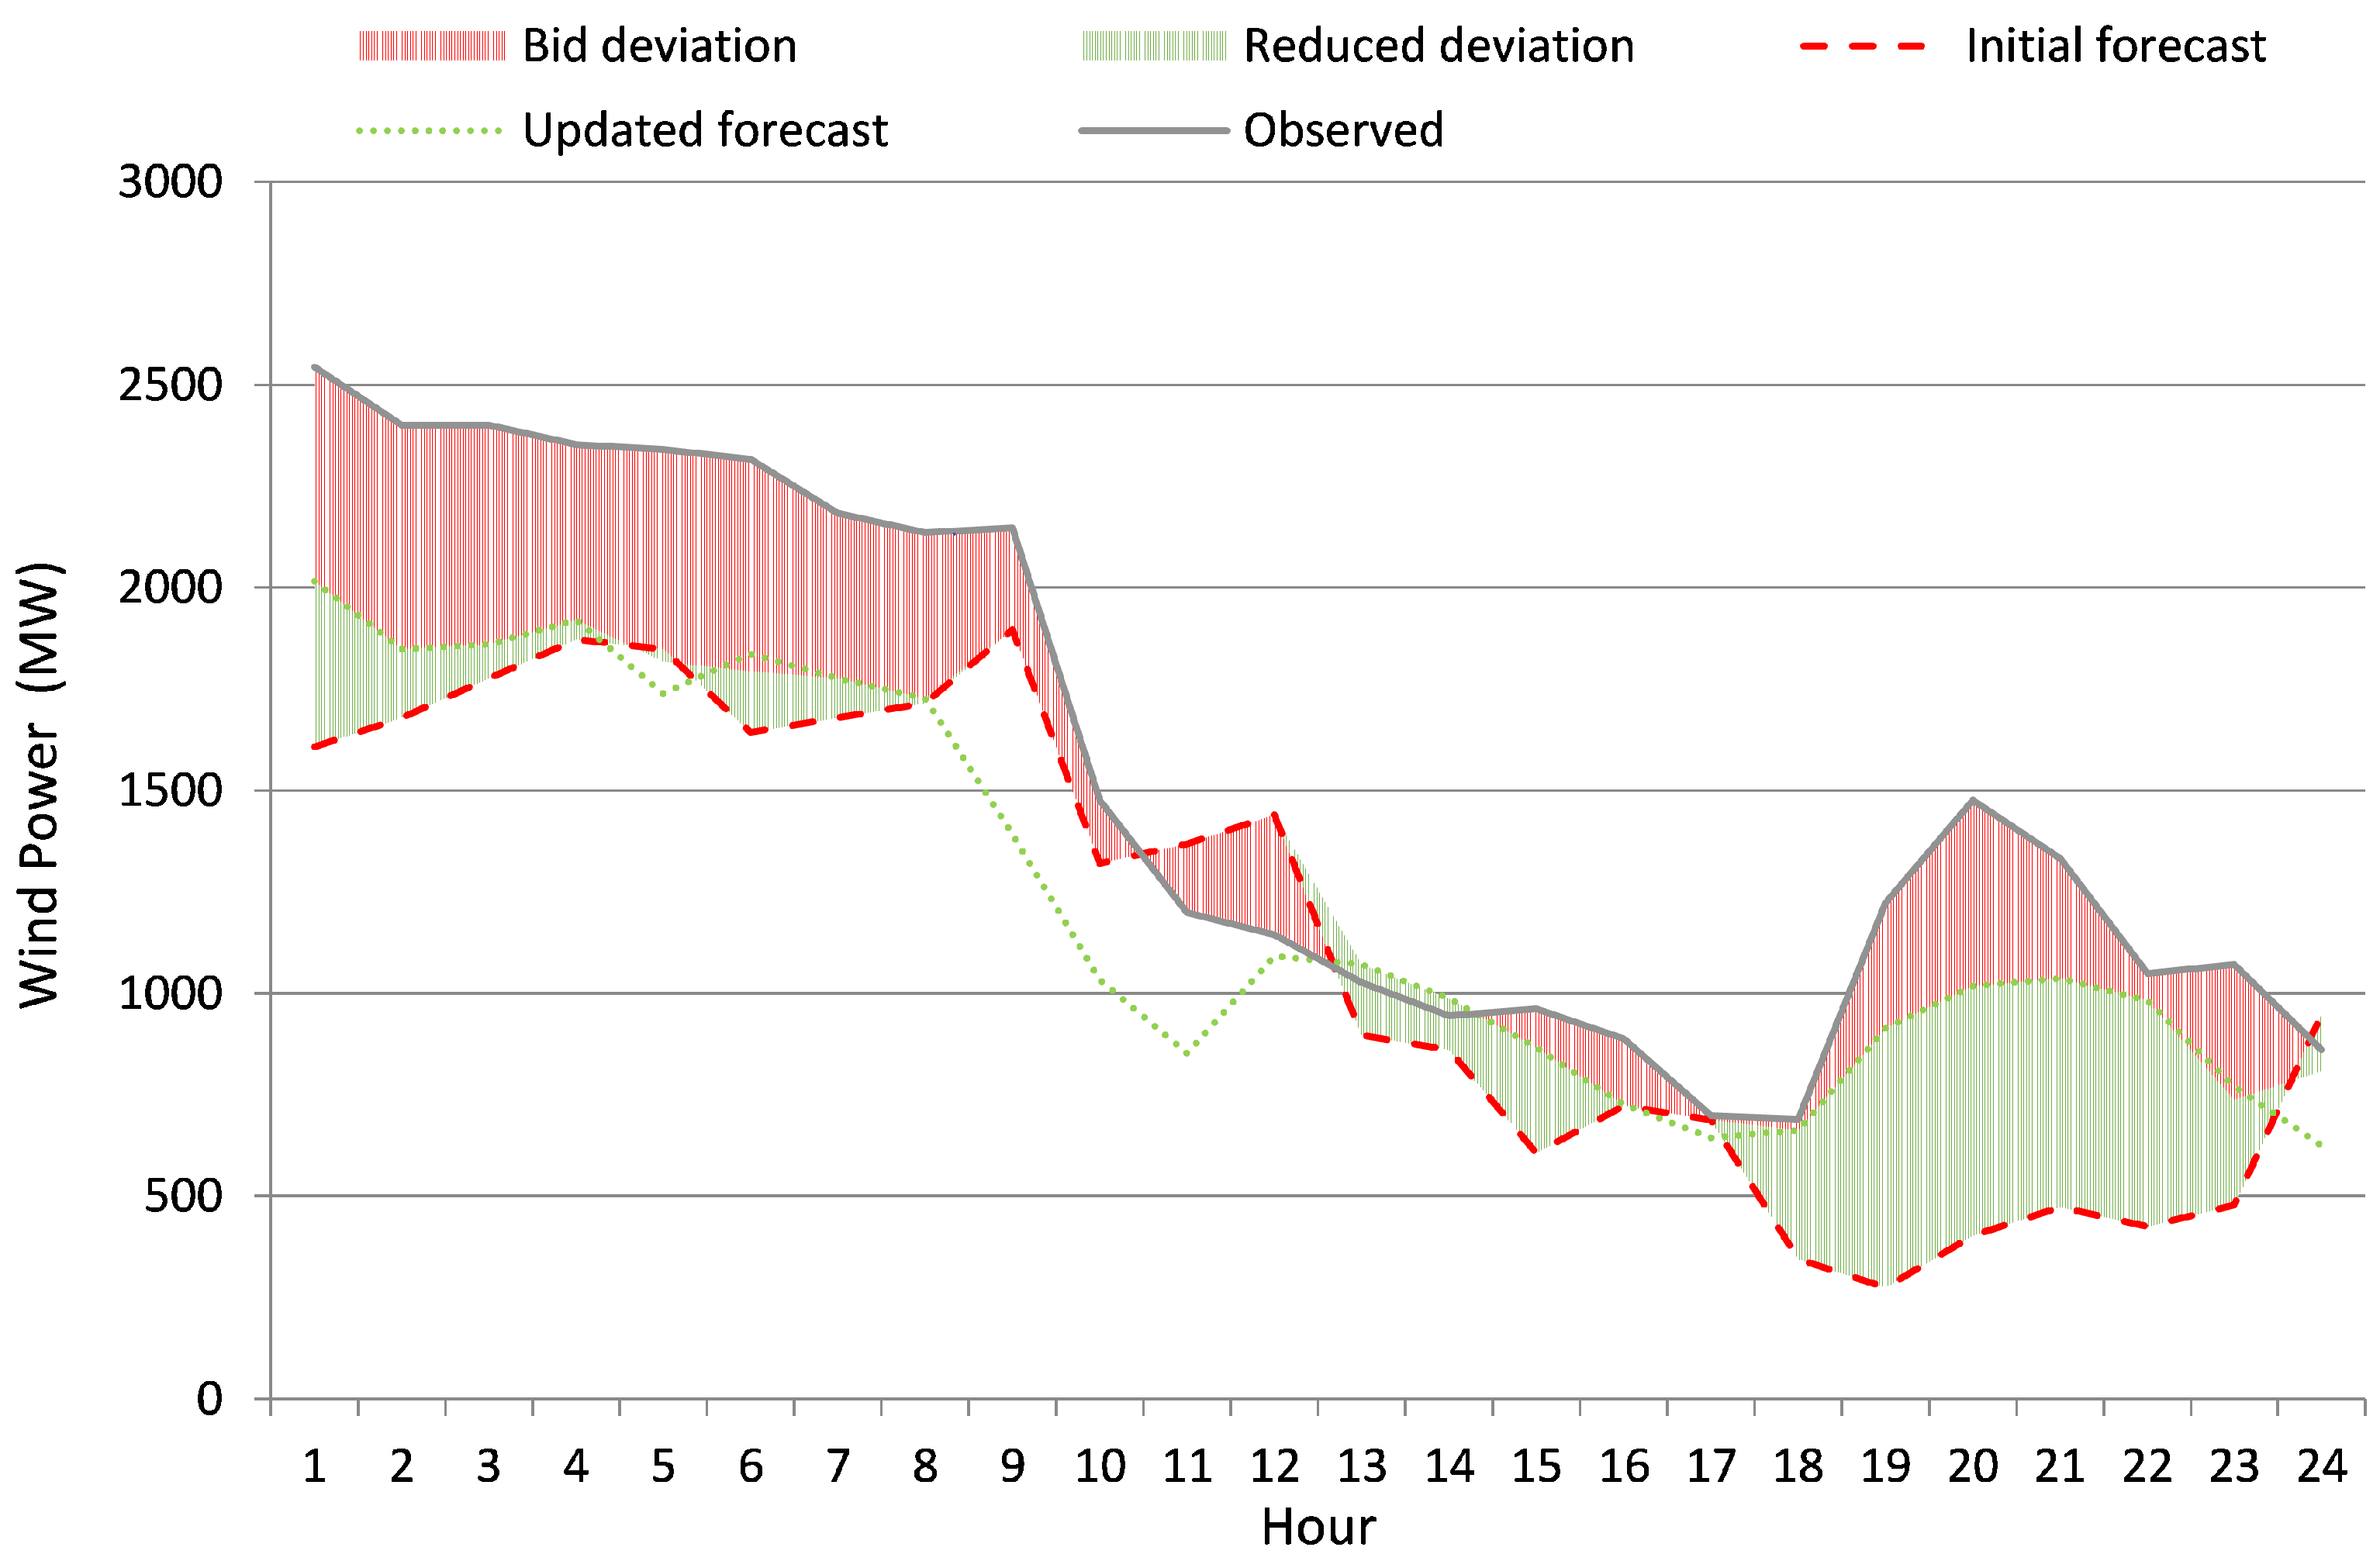
Figure 8 presents the forecast used to compute the bids to submit to both the DAM (dashed red line) and the IDM (dotted green line), as well as the forecast deviation (red area) and the difference between the initial and updated forecasts (green area). The bids submitted to the IDM are computed from the difference between the two forecasts, for the specific periods when the updated forecast is better than the initial one.
6.3. Hydroelectric Power Results
Figure 9 presents the curves of the economic and pumping values of water for the ’‘GenCo HydroPower” agent. Both curves were obtained by considering the typical behavior of the Portuguese hydro plants. The analysis of the figure, namely the curve corresponding to the economic value of water, together with the prices presented in
Table 2, allows us to conclude that coal power plants may be pushed out of the market only when both renewable generation and hydro plants that have a reservoir content greater than 75% of full capacity are sufficient to supply demand. On the contrary, when the reservoir content is lower than 35% of full capacity, CCGT plants can surpass hydro plants in merit order.
The pumping value of water takes into account that the main power plants of the simplified system under consideration are wind parks and coal plants. Accordingly, when the content of the reservoir is near full capacity, the ‘’GenCo HydroPower” agent buys energy to pump from wind parks only. When such content is lower than 50% of full capacity, the ‘’GenCo HydroPower” agent starts buying energy in case coal becomes the marginal technology. When the content is lower than 20% of full capacity, this agent starts buying energy in case the CCGT plants become marginal.
Figure 10 illustrates the strategic operation of the ‘GenCo HydroPower’ (to produce energy, to pump or to stay idle). The analysis of both
Figure 7 and
Figure 10 allow us to conclude that a reduction in the content of the reservoir corresponds to an increase in the market price, which is probably due to an increase in the economic value of water.
Figure 11 illustrates the effect of the content of reservoir over the economic and pumping values of water. Naturally, when this content decreases, the economic and pumping values of water increase. When the market price is equal or greater than the economic value of water, the ‘’GenCo HydroPower” agent produces energy. Additionally, when this price is lower than the pumping value of water, this agent pumps water. In the case that the price stands between the two values, the ‘GenCo HydroPower’ stays idle.
7. Conclusions
This article presented a strategic model for hydroelectric power plants, enabling them to plan at both short-term and long-term. The model defines the periods of time when hydro plants should produce energy, pump water or stay idle. It also indicates the quantities of energy and the prices to consider in the bids to submit to the market, which are computed by considering the performance curves and the economic and pumping values of water.
During real-time operation, hydro plants can respond to wind power variations (increase or decrease), thus compensating them and keeping power systems balanced. Potential alternatives are storage technologies, such as batteries, and demand response, normally dependent on the behavior of consumers. Additionally, dispatchable power plants with fast response ramps, such as CCGT and fuel-oil power plants, can be considered in the case of reductions in renewable generation, but they have high marginal costs and lead to high CO emissions.
The article also described a case-study to ”test” the model in a simplified real-world setting, namely a simplified version of the Portuguese power system, involving a relevant penetration of hydro and wind power (more than 50%). The results confirm (and rebut) the typical strategic behavior of hydro plants in markets with high penetrations of renewable generation (i.e., producing energy, pumping water, or staying idle).
As a final remark, secure and efficient power systems with high penetrations of renewables (towards 100%) should be composed by hydro plants that have reservoirs. Additionally, such systems should make incentives for the active participation of demand-response technologies to provide the flexibility needed to compensate the variability and uncertainty of VRE, thus avoiding curtailments and investments in expensive storage solutions.


