Abstract
Vertical-axis wind turbines (VAWTs) have drawn increased attention for off-grid and off-shore power generation due to inherent advantages over the more popular horizontal-axis wind turbines (HAWTs). Among these advantages are generator locale, omni-directionality and simplistic design. However, one major disadvantage is lower efficiency, which can be alleviated through blade pitching. Since each blade must transit both up- and down-stream each revolution, VAWT blade pitching techniques are not yet commonplace due to increased complexity and cost. Utilizing passively-morphing flexible blades can offer similar results as active pitching, requiring no sensors or actuators, and has shown promise in increasing VAWT performance in select cases. In this study, wind tunnel tests have been conducted with flexible and rigid-bladed NACA 0012 airfoils, in order to provide necessary input data for a Double-Multiple Stream-Tube (DMST) model. The results from this study indicate that a passively-morphing VAWT can achieve a maximum power coefficient () far exceeding that for a rigid-bladed VAWT (18.9% vs. 10%) with reduced normal force fluctuations as much as 6.9%. Operational range of tip-speed ratio also is observed to increase by a maximum of 40.3%.
1. Introduction
Wind energy has enjoyed a dramatic increase in worldwide capacity in the past few decades. Much research has been devoted to improving efficiency and operational characteristics of these energy harvesting devices in order to maximize energy capture at minimal cost. A rapid growth in the clean/renewable energy market, especially in the recent past, has expanded investment in non-fossil-fuel energy generation (from USD 96 bn in 2006 to USD 282 bn in 2019 globally), with wind energy as one of the primary targets (from 34% of global clean energy investment in 2006 to 48% in 2019) [1]. As a result, wind power capacity has grown worldwide from 23,900 megawatts (2001) to 539,581 megawatts (2017) [2]. At the same time, the annual cost of wind energy has decreased dramatically (40% since 2008) [3]. Awareness of governments around the world and support from corporations and the public alike have made it possible to cut down clean energy costs over the years. The maturity of the industry has grown along with market competitiveness, well-established supply chains and has driven down system costs [4]. For example, in the US, there were zero wind turbines with greater than 100 m diameter before 2008; today, the average diameter installed in the US is 116 m [5].
Wind turbines generally can be categorized into two major types: horizontal-axis wind turbines (HAWTs) and vertical-axis wind turbines (VAWTs) [6]. The HAWT has enjoyed substantially more attention in terms of design, but requires expensive yaw, pitching and torque control mechanisms in order to face directly into the wind flow and regulate power [7]. Other major drawbacks include noise pollution attributed to large tip-speed ratios, costly installation and maintenance because of generator locale (high up in the air), and expensive structural costs due to high center of gravity [7]. Blades rotate continuously through a high gradient of wind shear and turbulence in a HAWT’s 20–25 year lifetime [8]. For example, a typical multi-megawatt wind turbine at about 20 rpm, will perform about 100 million revolutions in its design lifetime [9]. Therefore, design optimization of HAWT for fatigue is also challenging.
On the contrary, VAWTs can be simpler in design and lower in maintenance cost due to generator and gearbox location (ground) [10]. Due to a lower center of gravity, better stability and lower gravitational fatigue loads are realized. They can also handle wind from any direction, and are easier to design from an aerodynamic perspective since relative wind velocities do not change as drastically along the span as in HAWT types. VAWTs can be further categorized as lift-based (Darrieus-type) and drag-based (Savonius-type), based on the type of aerodynamic forces imparting torque to the rotor. In terms of efficiency, Darrieus (lift) types perform better but experience high centrifugal forces at high tip-speed ratios, while Savonious (lift) types have lower rotational speed which in turn generate less noise, require more material in manufacturing but are often able to self-start. Because of the self-starting capability, Savonious-types are gaining traction for research recently [11] especially for use in off-grid, low power applications. Regardless, they provide little promise in large-scale electricity generation due to their poor efficiency as compared to VAWTs or state-of-the-art HAWTs.
The Darrieus VAWT, being the more appropriate VAWT for power generation due to higher efficiency and lighter weight design [12], has obvious problems that require addressing to achieve any notable capacity in grid-installed power generation. These include low starting torque [13], dynamic stall, and issues originating from continuously changing angle of attack () [14]. The latter is a fundamental problem with VAWTs that needs attention, since airfoil will vary wildly from positive-to-negative and often ventures beyond the airfoil stall point. This can cause both leading- and trailing-edge vortices to form and boundary layer separation on its suction side. Compounding the problem, blades can interact with their own wakes during the downstream-pass [15]. As a result, torque and normal-forces oscillate, causing vibration that increases fatigue load. Furthermore, overall efficiency suffers, and is generally lower than that of today’s HAWT designs [16].
For larger wind turbines, wind regimes are divided into four parts: below cut-in speed, below rated operation, rated operation and above cut-out speed. For both HAWTs and VAWTs, the turbines do not operate below cut-in speed, since wind speeds are so low that no useful (net) shaft power may be developed. Below rated operation begins at the cut-in speed and continues until the rated wind speed. In this regime, torque control ensures that the maximal efficiency may be obtained in both HAWT and VAWT settings. The main difference in operation between HAWT and VAWT occurs in the above-rated wind speeds and how they handle power shedding. In order to protect the generator and gearbox from over-loading, HAWTs use pitch-control techniques to decrease lift and rotor torque, keeping shaft speed constant, as wind speed increases. For VAWTs, no such technique exists so the shaft itself is braked, increasing rotor torque but decreasing shaft speed, keeping power output constant [17]. Above dangerous cut-out speeds, both HAWT and VAWT do not operate.
There are several variants on the Darries VAWT that offer differing advantages. These include helical, straight and troposkein (i.e., egg beater) types, among others [7]. Helical VAWT suffers less oscillation of aerodynamic loads and hence, lower fatigue, than others but comes at an increased cost of manufacturing [18]. Troposkein VAWTs have a shape identical to an idealized rope geometry when spun at a specified angular velocity in the absence of gravity or aerodynamic drag. This gradual changing of radius ultimately produces less torque than its other counterparts but offers minimal stresses experienced by the blades themselves. Straight-bladed (or “H-rotor”) VAWTs are constructed of straight, constant cross-sectional blades and are the simplest Darrieus design. As a result, they can be more cost effective and are usually the subject of research due to a relative ease with respect to modeling.
As mentioned earlier, VAWT efficiency generally lags behind most HAWT designs. As such, improving VAWT efficiency and self-starting capabilities have been active research areas of interest [19,20,21,22]. For example, the effects of airfoil characteristics on VAWT efficiency has been studied thoroughly. Results from these studies indicate that, in general, symmetric airfoils perform better than asymmetric since the former can generate lift on both upstream and downstream passes [23]. Thinner airfoils have turned out to be more efficient than thicker at high tip speed ratios [24] and can operate at a wider range of flow conditions. Conversely, thicker airfoils have large power coefficients at low tip-speed ratios [25] and have a reduced operational range.
Addition of flaps to the traditional airfoil blades is a design modification that has been explored since early 1920s [26]. Flaps suppress boundary layer separation that dominates flow at high tip-speed ratios, thus improving lift forces [27]. Similar improvement in power coefficient have been found using slats [28,29]. These design modifications (both flaps and slats), however, are structurally challenging and add additional cost to manufacturing and maintenance.
Another approach, proven to be effective in improving efficiency and reducing aerodynamic oscillatory loading is applying some pitch control mechanism [30] which falls into one of two categories: active and passive pitch control. Active pitch control mechanisms force the blades to pitch to some scheduled angle as a function of azimuth angle (armature position) and wind direction with the help of sensors, servomotors, cams or gears, and push-rods, while passive mechanisms need no such controls. While effective, active pitch control strategies increase the overall cost of manufacturing, maintenance and installation. To date, most passive pitch controlled VAWTs respond to surrounding wind conditions with blade pivots on a pitch axis close to the leading edge. Passive pitching mechanisms have been shown to improve self-starting but have seen limited success in terms of maximal efficiency [31].
Recently, a different kind of pitch-control mechanism has been proposed for passive airfoil pitching making use of flexible or “morphing” materials [32,33,34]. Originally inspired by animal and fish locomotion [35], this mechanism has proven advantageous in terms of airfoil efficiency and in one case tested on VAWTs [36]. Significant increases in performance have been recorded in 2D fluid–structure interaction simulations [34] at part-load operation. However, these and other studies investigating flexible-bladed VAWTs consider a very small subset of design parameters, for example, a single flexible material in a single VAWT geometry, which does not lend itself well to understanding how material flexibility and geometry generally affect performance in such systems.
In this study, the first of its kind, a passively flexible VAWT is simulated using a double-multiple stream tube (DMST) model, described in Section 2.1. To achieve this feat, rigid and flexible NACA 0012 blades have been tested in a low-speed wind tunnel to obtain necessary data for model input. Using this DMST model, performance curves can be constructed across a wide range of turbine geometries and operational conditions to gain a better understanding of how passive shape-morphing might be leveraged to increase VAWT performance. This study is unique, in that the authors use experimental data from flexible airfoil experiments as input into a blade-element momentum (BEM) model for the purposes of VAWT analysis.
2. Methodology
VAWT performance can be estimated using a myriad of computational and/or analytical models in lieu of costly experiments. Some of the more popular are the blade element momentum (BEM) models, cascade models [37], vortex models [38], panel models [39], and computational fluid dynamics (CFD) models. A CFD model, becoming more commonplace today, is capable of generating a full (velocity, pressure, etc) approximation of field variables. Though computing power has increased dramatically in recent history, CFD analysis of VAWTs is still very computationally expensive [40], especially in three dimensions which is often required for adequately addressing turbulence. For example, Badshah et al. [41] performed a 3D FSI simulation of a horizontal tidal current turbine (TCT) using an 18-core Intel Xeon Processor (2.3 GHz) that required over 11 days to accurately predict performance for a single set of conditions. BEM simulations, such as those conducted herein, require only a few seconds or minutes to complete the same task. Although somewhat lacking in terms of flow-field predictions, BEM-type models are simpler, much faster, more reliable [42] and have been used extensively for design purposes. The drawback to BEM models is that they require a large set of aerodynamic performance data (i.e., lift and drag curves) across a wide range of Reynolds numbers (Re), which are often difficult to obtain. For this reason, the study described herein makes use of a BEM model, namely the double-multiple stream tube (DMST) [43] model, to estimate VAWT performance using airfoil data generated from experiments conducted solely for this purpose.
To begin with, the standard metric to evaluate wind turbine is the power coefficient, , defined as the ratio of power generated to the power available in the wind:
where U is the free stream wind speed, A is its swept area, is the air density and P is the generated power. Usually, performance characteristics of a wind turbine is presented by a plot of against a dimensionless rotor speed, the tip-speed ratio, , described as:
where is the angular velocity and R is the turbine radius. performance curves allow designers to identify the optimal operational conditions ( at optimal ) of the turbine. In this study, the performance of various rigid and flexible-bladed VAWTs are estimated using the DMST model [43]. The details of this model are widely available, and have been applied to HAWTs [44], troposkein VAWTs [45] and straight-bladed VAWTs [46]. A short description of the general DMST procedure follows.
2.1. Double Multiple Stream Tube Modeling
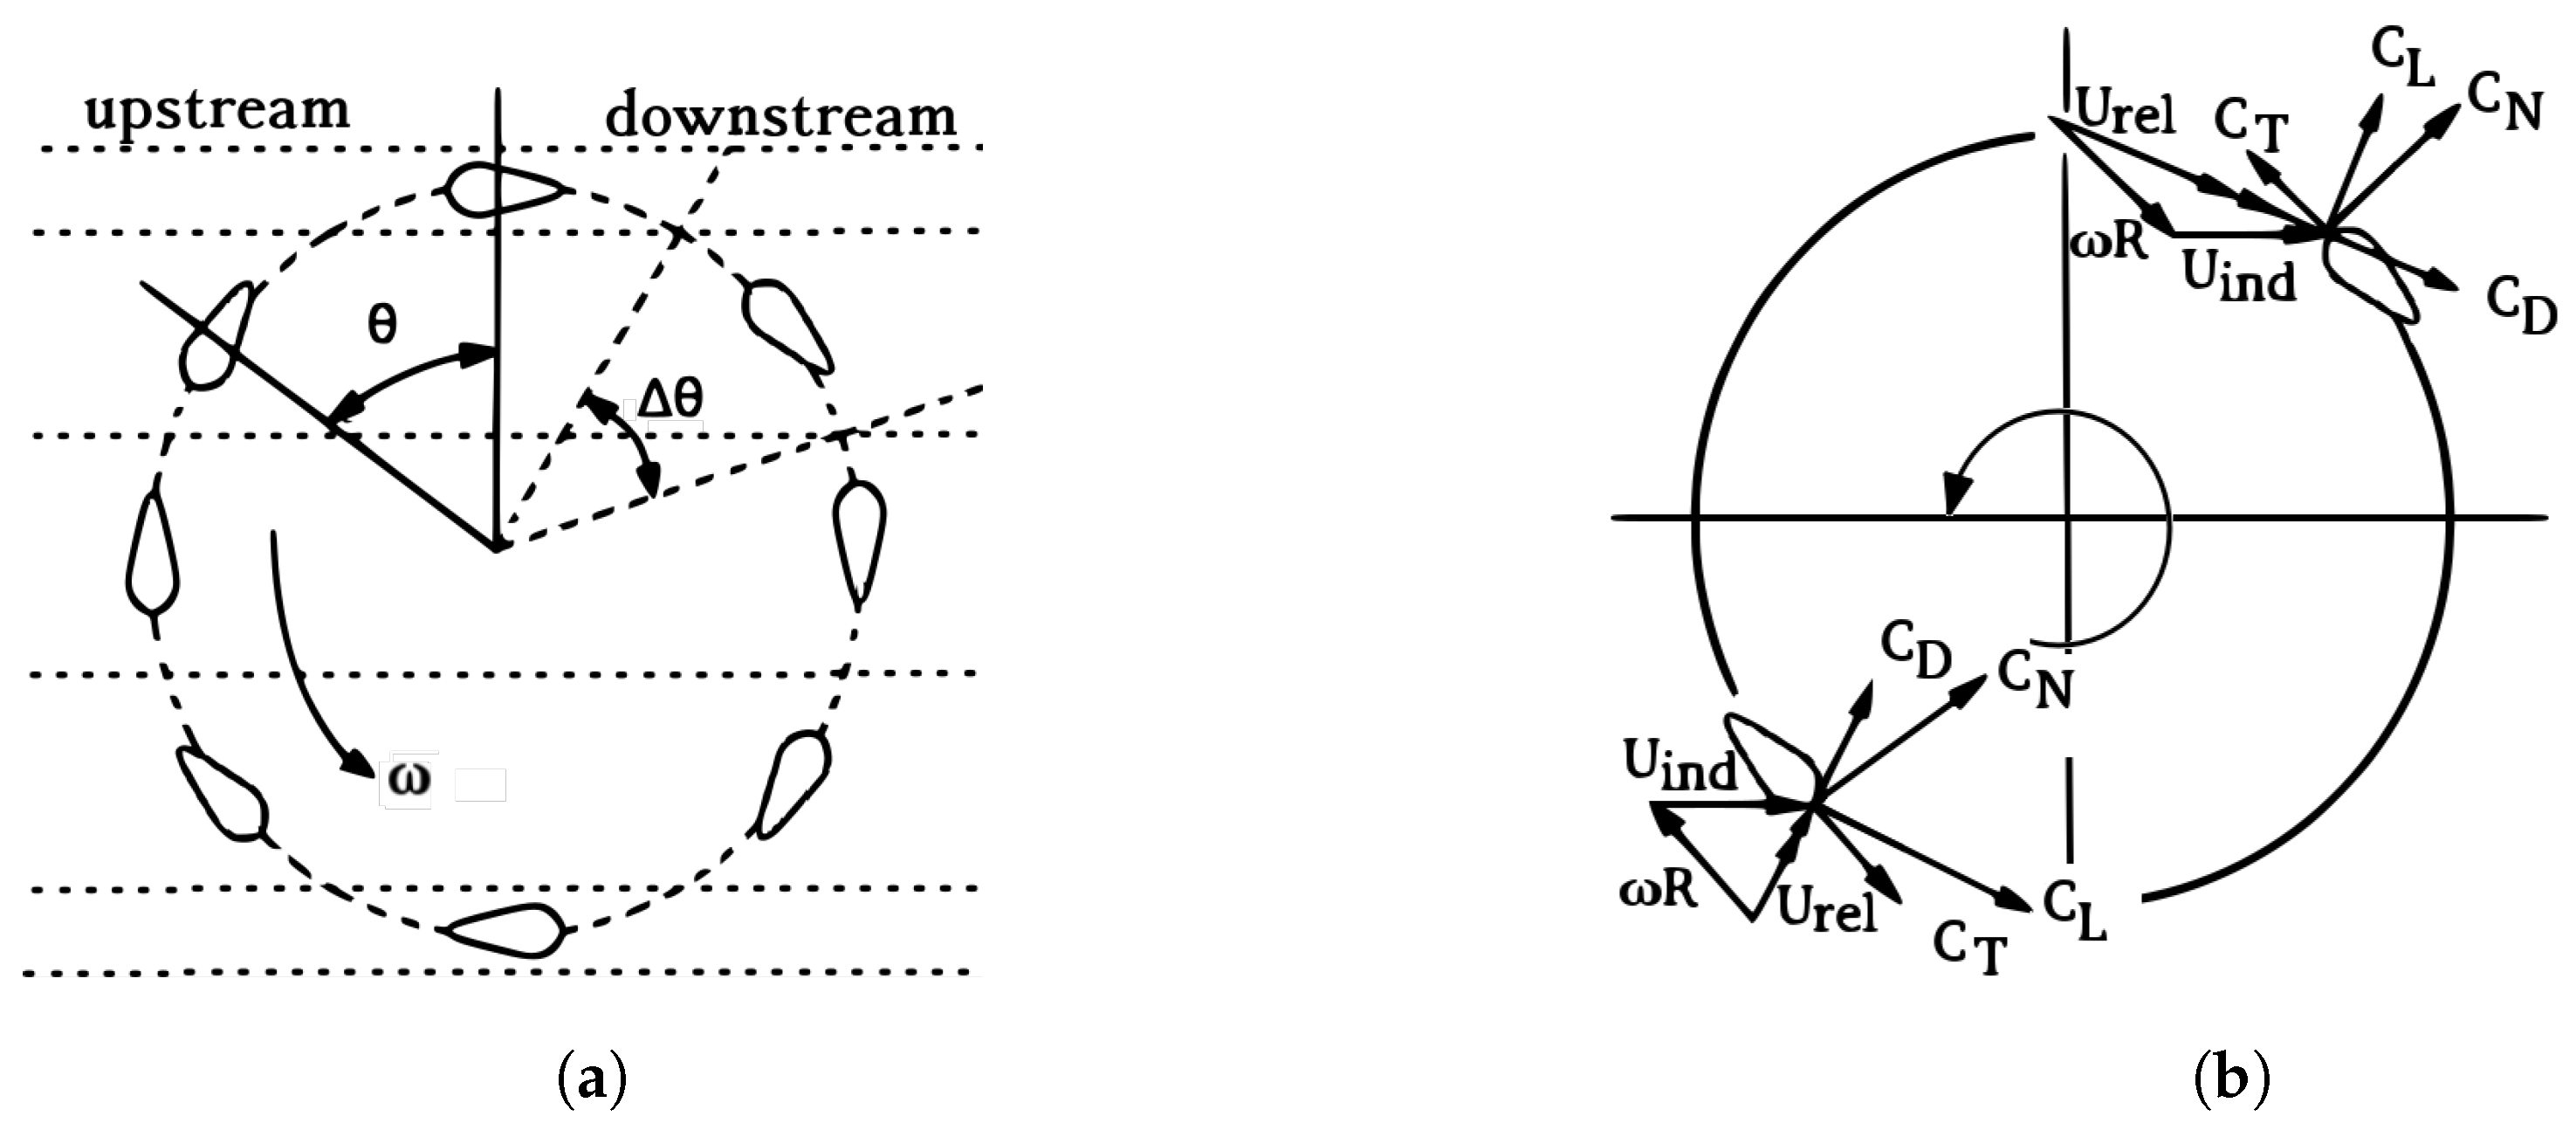
This approach combines the multiple stream tube model (based on the BEM method) and double actuator theory [47], where the region of a complete rotation of the turbine is divided into two parts by an imaginary straight line that runs through the hub and perpendicular to the wind flow. The part that encounters the incoming wind first is called the upstream side and the other part of the wake is called the downstream side. Computations take place in both of these sides separately. Each side is again split into several regions (represented by dashed lines in Figure 1a) parallel to the wind flow). The regions are called streamtubes. The width of a streamtube is measured by the angle, () created by the section of the circular path of blade rotation at the hub that fall under that streamtube (Figure 1a). The forces on the airfoil are calculated when it is at the center of each streamtube.
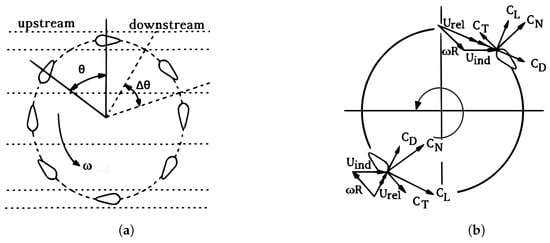
Figure 1.
(a) The DMST model divides the region of turbine rotation into two parts: upstream and downstream. Horizontal dashed lines split each region again into streamtubes. θ is the azimuthal position of the airfoil and Δθ is the central angle of the streamtube width. (b) Force coefficients acting on a rotating blade in both upstream and downstream. CD is parallel to the wind’s relative velocity, Urel and CL is perpendicular to it. These can be resolved into the normal (or radial) (CN) and tangential (CT) components.
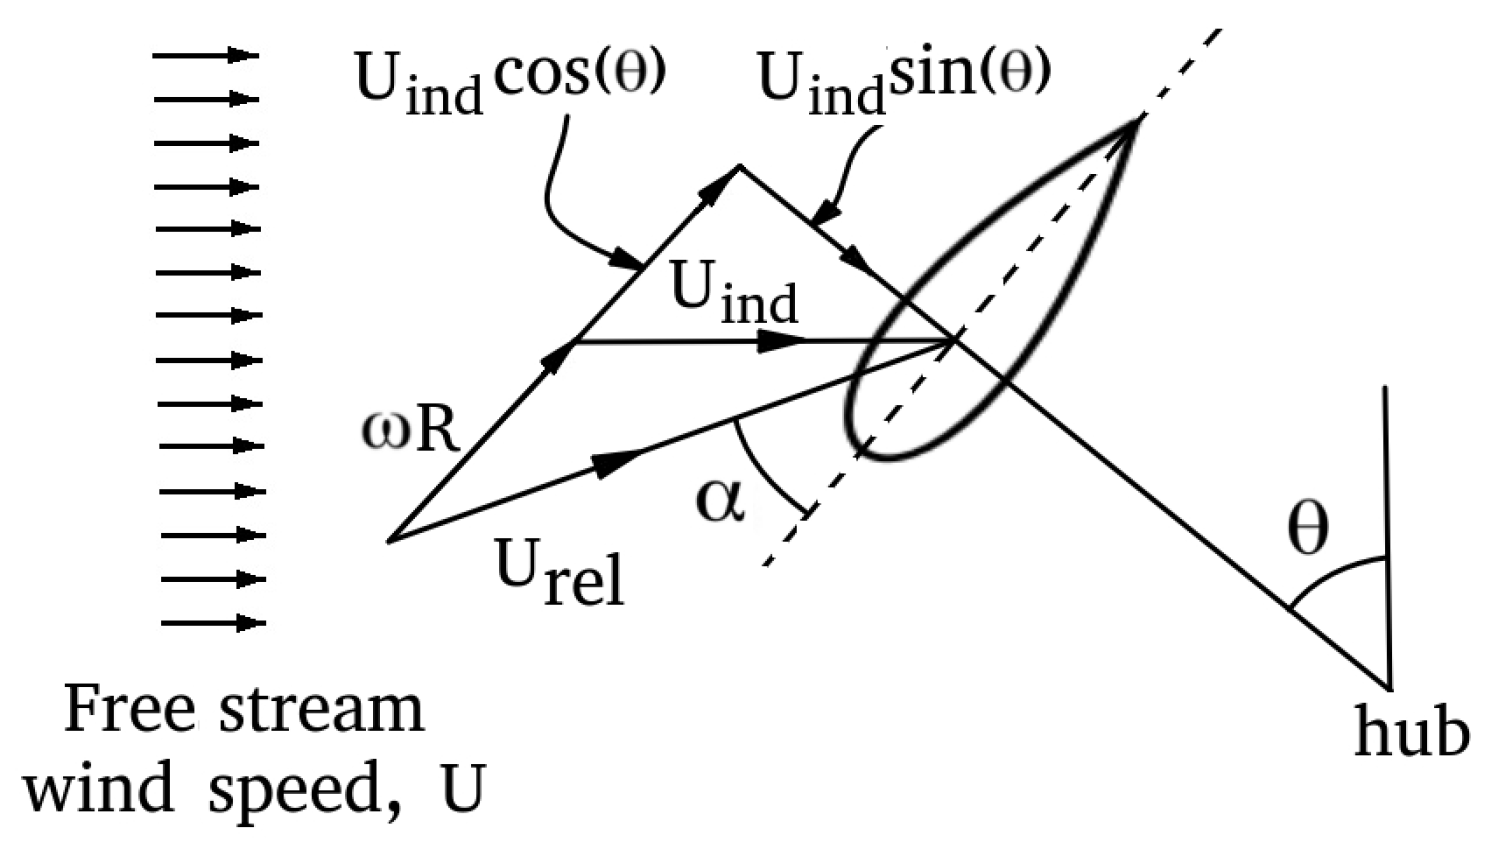
The resultant forces acting on airfoils at different azimuthal positions are demonstrated in Figure 1b and Figure 2. It is assumed that the wake generated by the interaction of the wind with the turbine blades during the upwind pass is expanded fully and the ultimate wake velocity is reached before the blade interacts with it during the downwind pass.
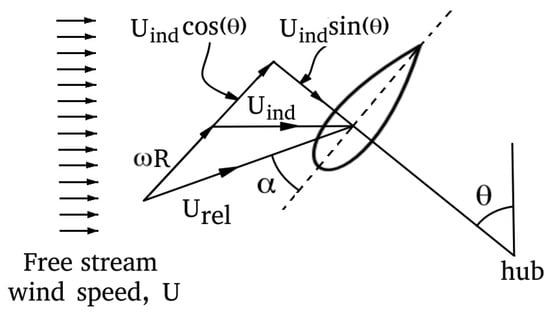
Figure 2.
Resultant forces acting on an airfoil in a DMST model configuration.
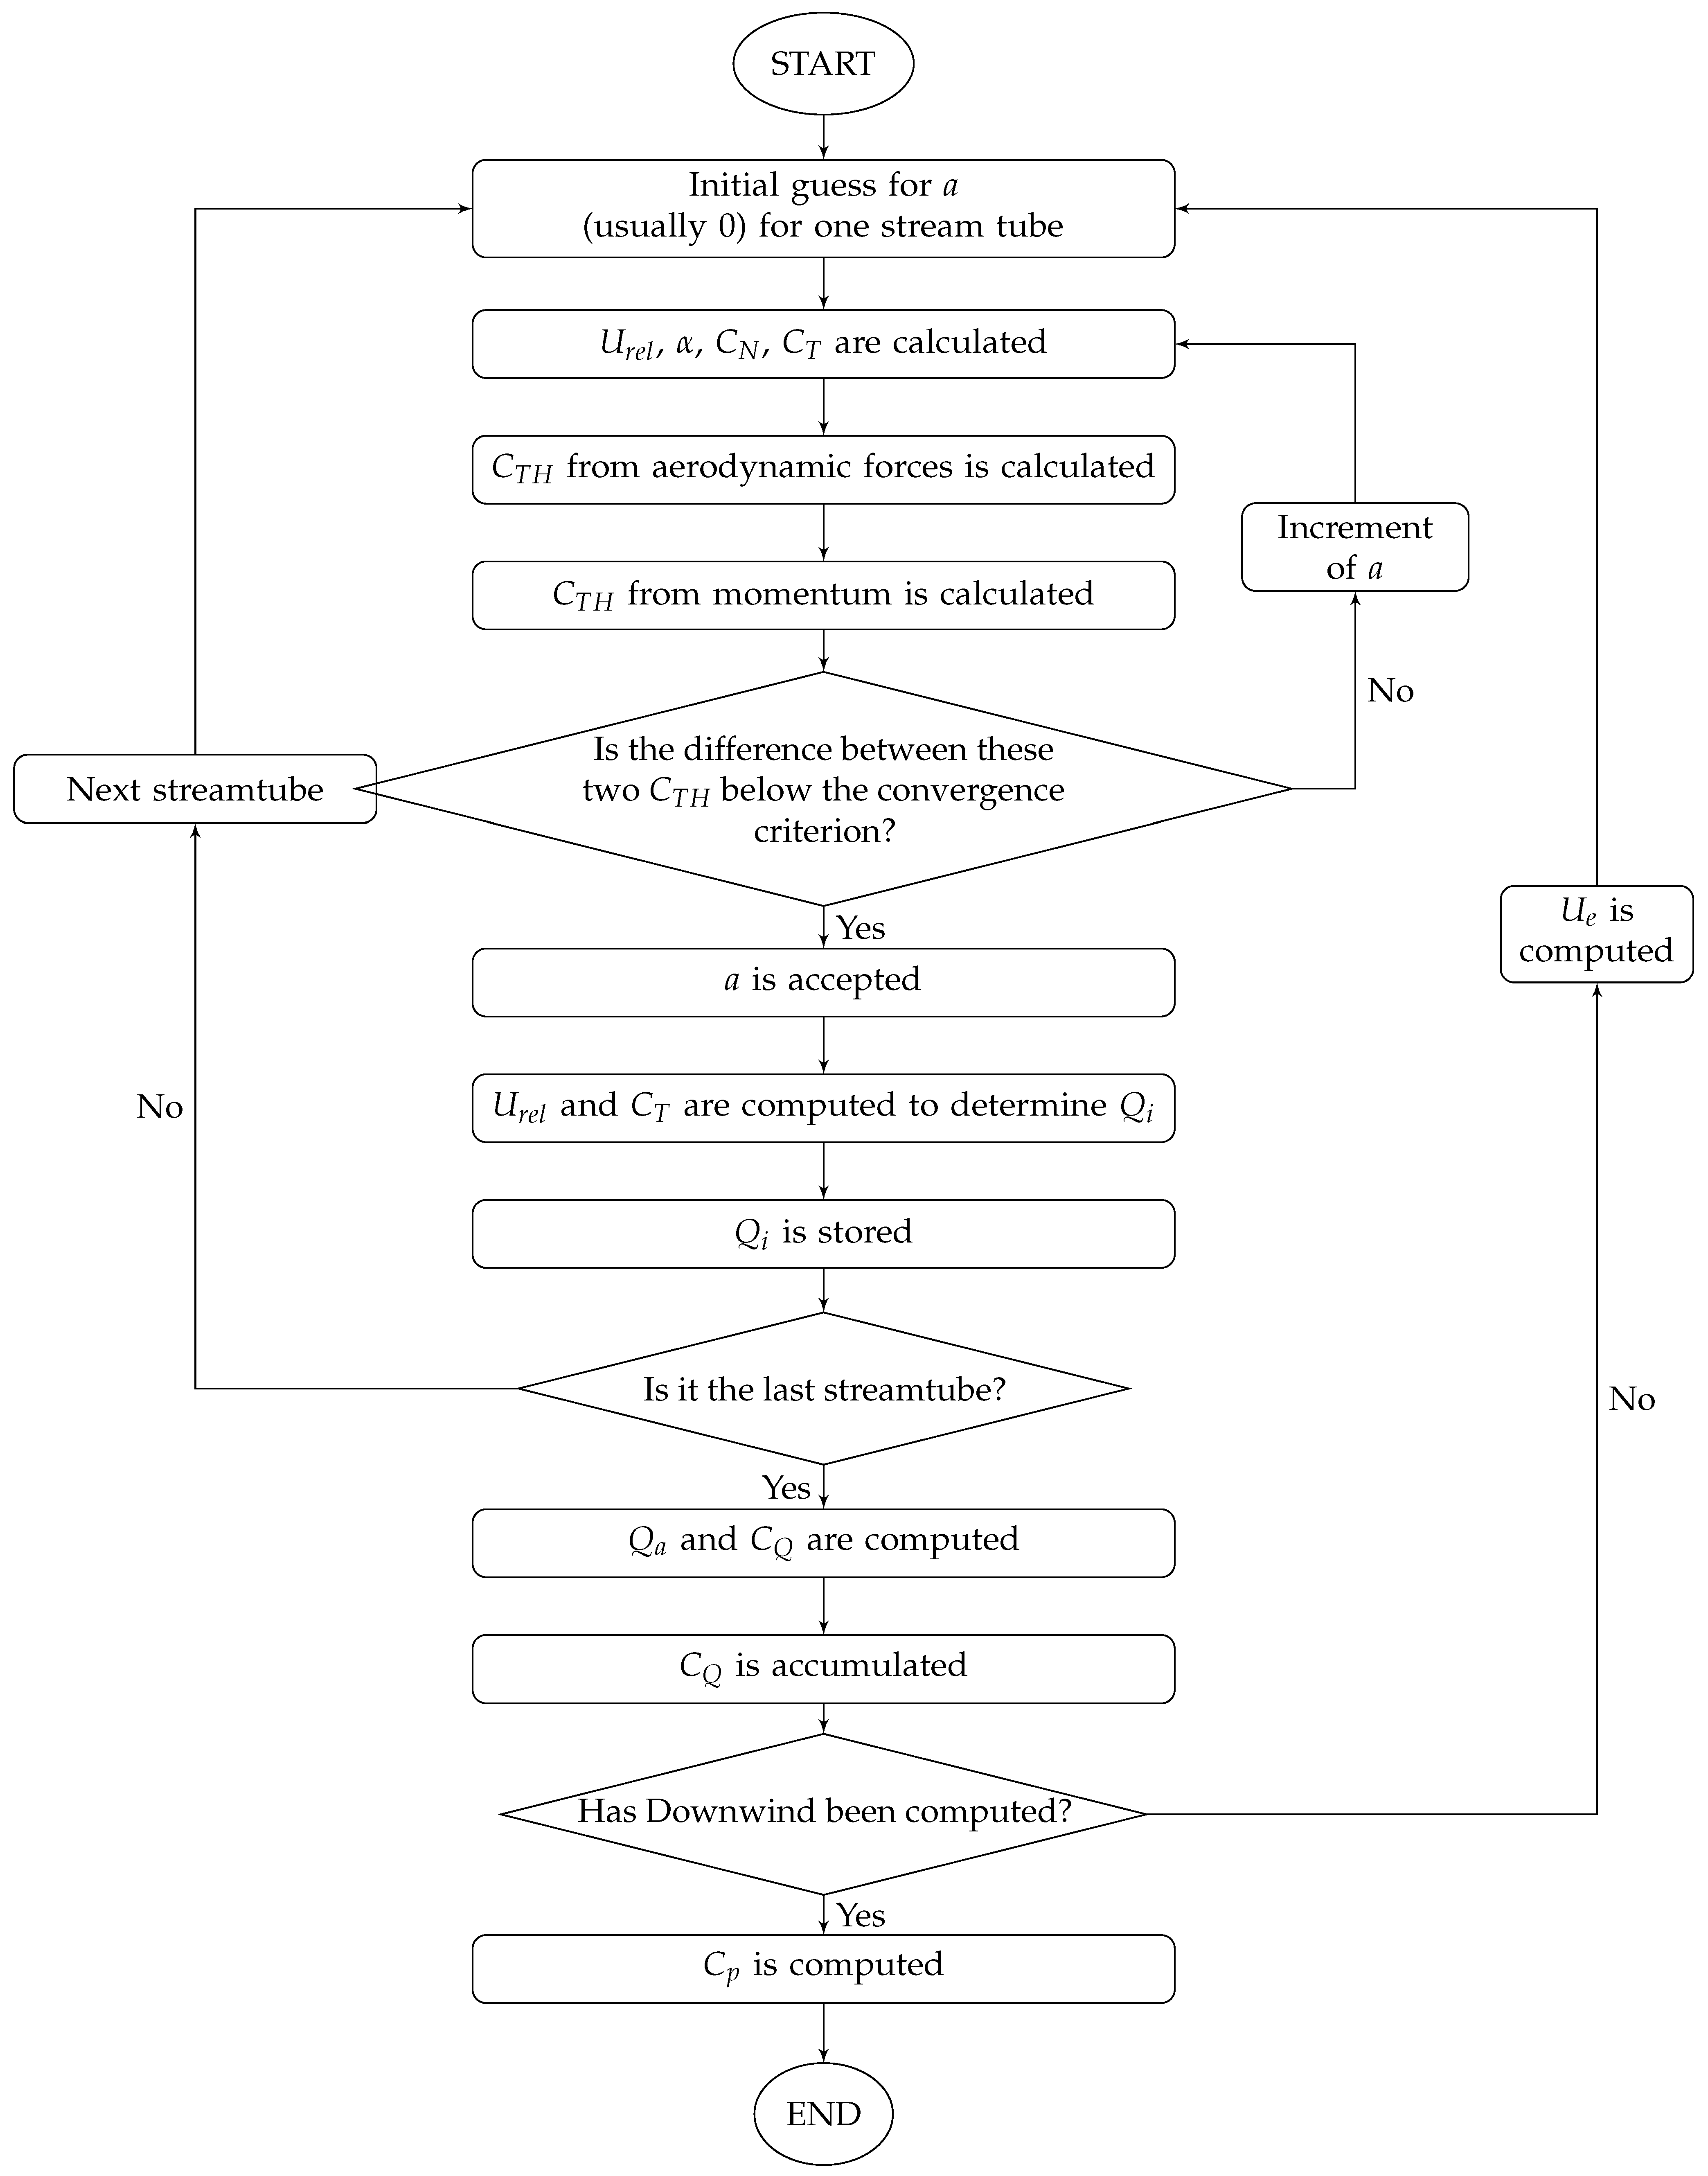
The forces computed in discrete streamtubes are integrated over the full rotations in order to yield performance parameters. The same set of equations in the DMST model is applied to both the upstream and downstream sides; however, the free stream wind velocity, U in the upstream is replaced by the wake velocity, in the downstream. The reader is referred to [44] for a description of the equations for the DMST model for H-rotor VAWTs which are adapted from Paraschivoiu’s model for troposkien VAWTs [45]. A flowchart of its working procedure is shown in Figure 3.
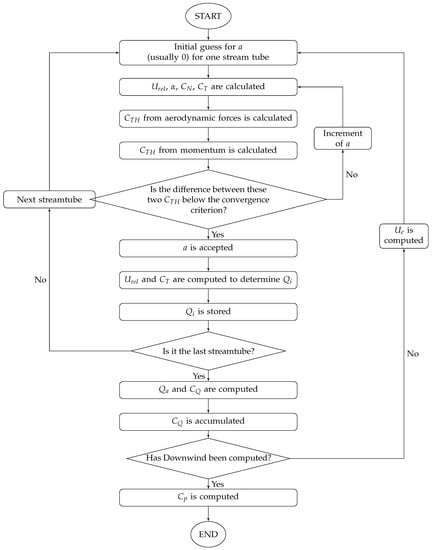
Figure 3.
Flow chart of the numerical procedure of DMST model.
2.1.1. Computation of Power Coefficient,
The rotating VAWT is modeled as a permeable disk (Rankine-Froude actuator disk theory [48]) that works as a drag device. It slows down U at the disk plane (i.e., its interaction with the blades) to and the wake velocity to . These reduced velocities are quantified by a non-dimensional quantity, known as induction factor, a. Their relationship with the free stream velocity are expressed as
The wind velocity is responsible for generating lift and drag forces on the blades and hence rotates the turbine. However, the relative wind velocity is that which is actually experienced by the blade (Figure 1b and Figure 2), given as follows:
Incorporating non-dimensional numbers (), the final form for the calculation of its magnitude is accomplished as follows:
where is the azimuthal position of the blade. The local or the blade Reynolds number, is computed using the as:
Here, c is the chord length and is the kinematic viscosity of the fluid (in this case, air, assumed 1.5 × 10⁻⁵ m2/s. The other important parameter that affects the lift and drag forces on the blades is their angle of attack, . The turbine blades’ azimuthal positions change continuously during its rotation and so does the attack angle, given as follows:
The lift and drag coefficients, and must be obtained via experimental or other measures at the blade Reynolds number, . Resultant force coefficient are then resolved into radial () and tangential () components. The radial (normal) force coefficient (, acting radially towards the hub) is formulated as:
The tangential force coefficient is given as follows:
These two force coefficients, if desired, may be resolved into x (thrust, parallel to the flow) and y (perpendicular to the flow) directions as follows:
Finally, the thrust coefficient, and instantaneous torque, (when airfoil is at the center of the streamtube) are calculated as follows, where H is the height (span) of the blade:
A similar set of equations for downstream is derived. The sole difference for the downstream side is that the free stream velocity which is no longer the same due to the the thrust generated during the upwind pass. The downstream equivalent velocity is the wake velocity, (Equation (4)).
Combining both downstream and upstream analyses allows for average torque calculations, summing over the number of streamtubes, N, as follows:
where B is the number of blades. The torque coefficient for the entire rotation of the turbine is then calculated as:
where D is the diameter of the VAWT and is the relative velocity in the ith streamtube. Finally, the power coefficient can be evaluated as follows:
2.1.2. Arm Drag Corrections
VAWTs use supporting arms (or struts) to support the blades which connect to the vertical shaft (hub). These arms, along with the rotor shaft, interact with the wake generated by the blades in the upstream pass and create their own wake for the downstream pass. Thus, they generate drag (called parasitic or arm drag) that reduces the output power significantly. Islam [49] has formulated an expression to quantify this reduction in power as follows:
where is the quantity of reduction in , is the total number of supporting arms, is the drag coefficient of the arm profile, b is the width of the arm and h is the span.
3. Data Acquisition
In order to implement the DMST model, a large set of airfoil lift and drag input data is required, along with some other VAWT design parameters such as span, radius and arm profiles. The lift and drag data are extracted numerically and/or experimentally for many airfoil profiles, over a wide range of Re and and can be found in many published articles and books. However, to ascertain flexible airfoil performance data, which is lacking in scientific literature, it is necessary to perform wind tunnel tests. Furthermore, to better compare rigid and flexible blades rigid bladed airfoils are also evaluated under the same conditions.
3.1. Preparation of Airfoils
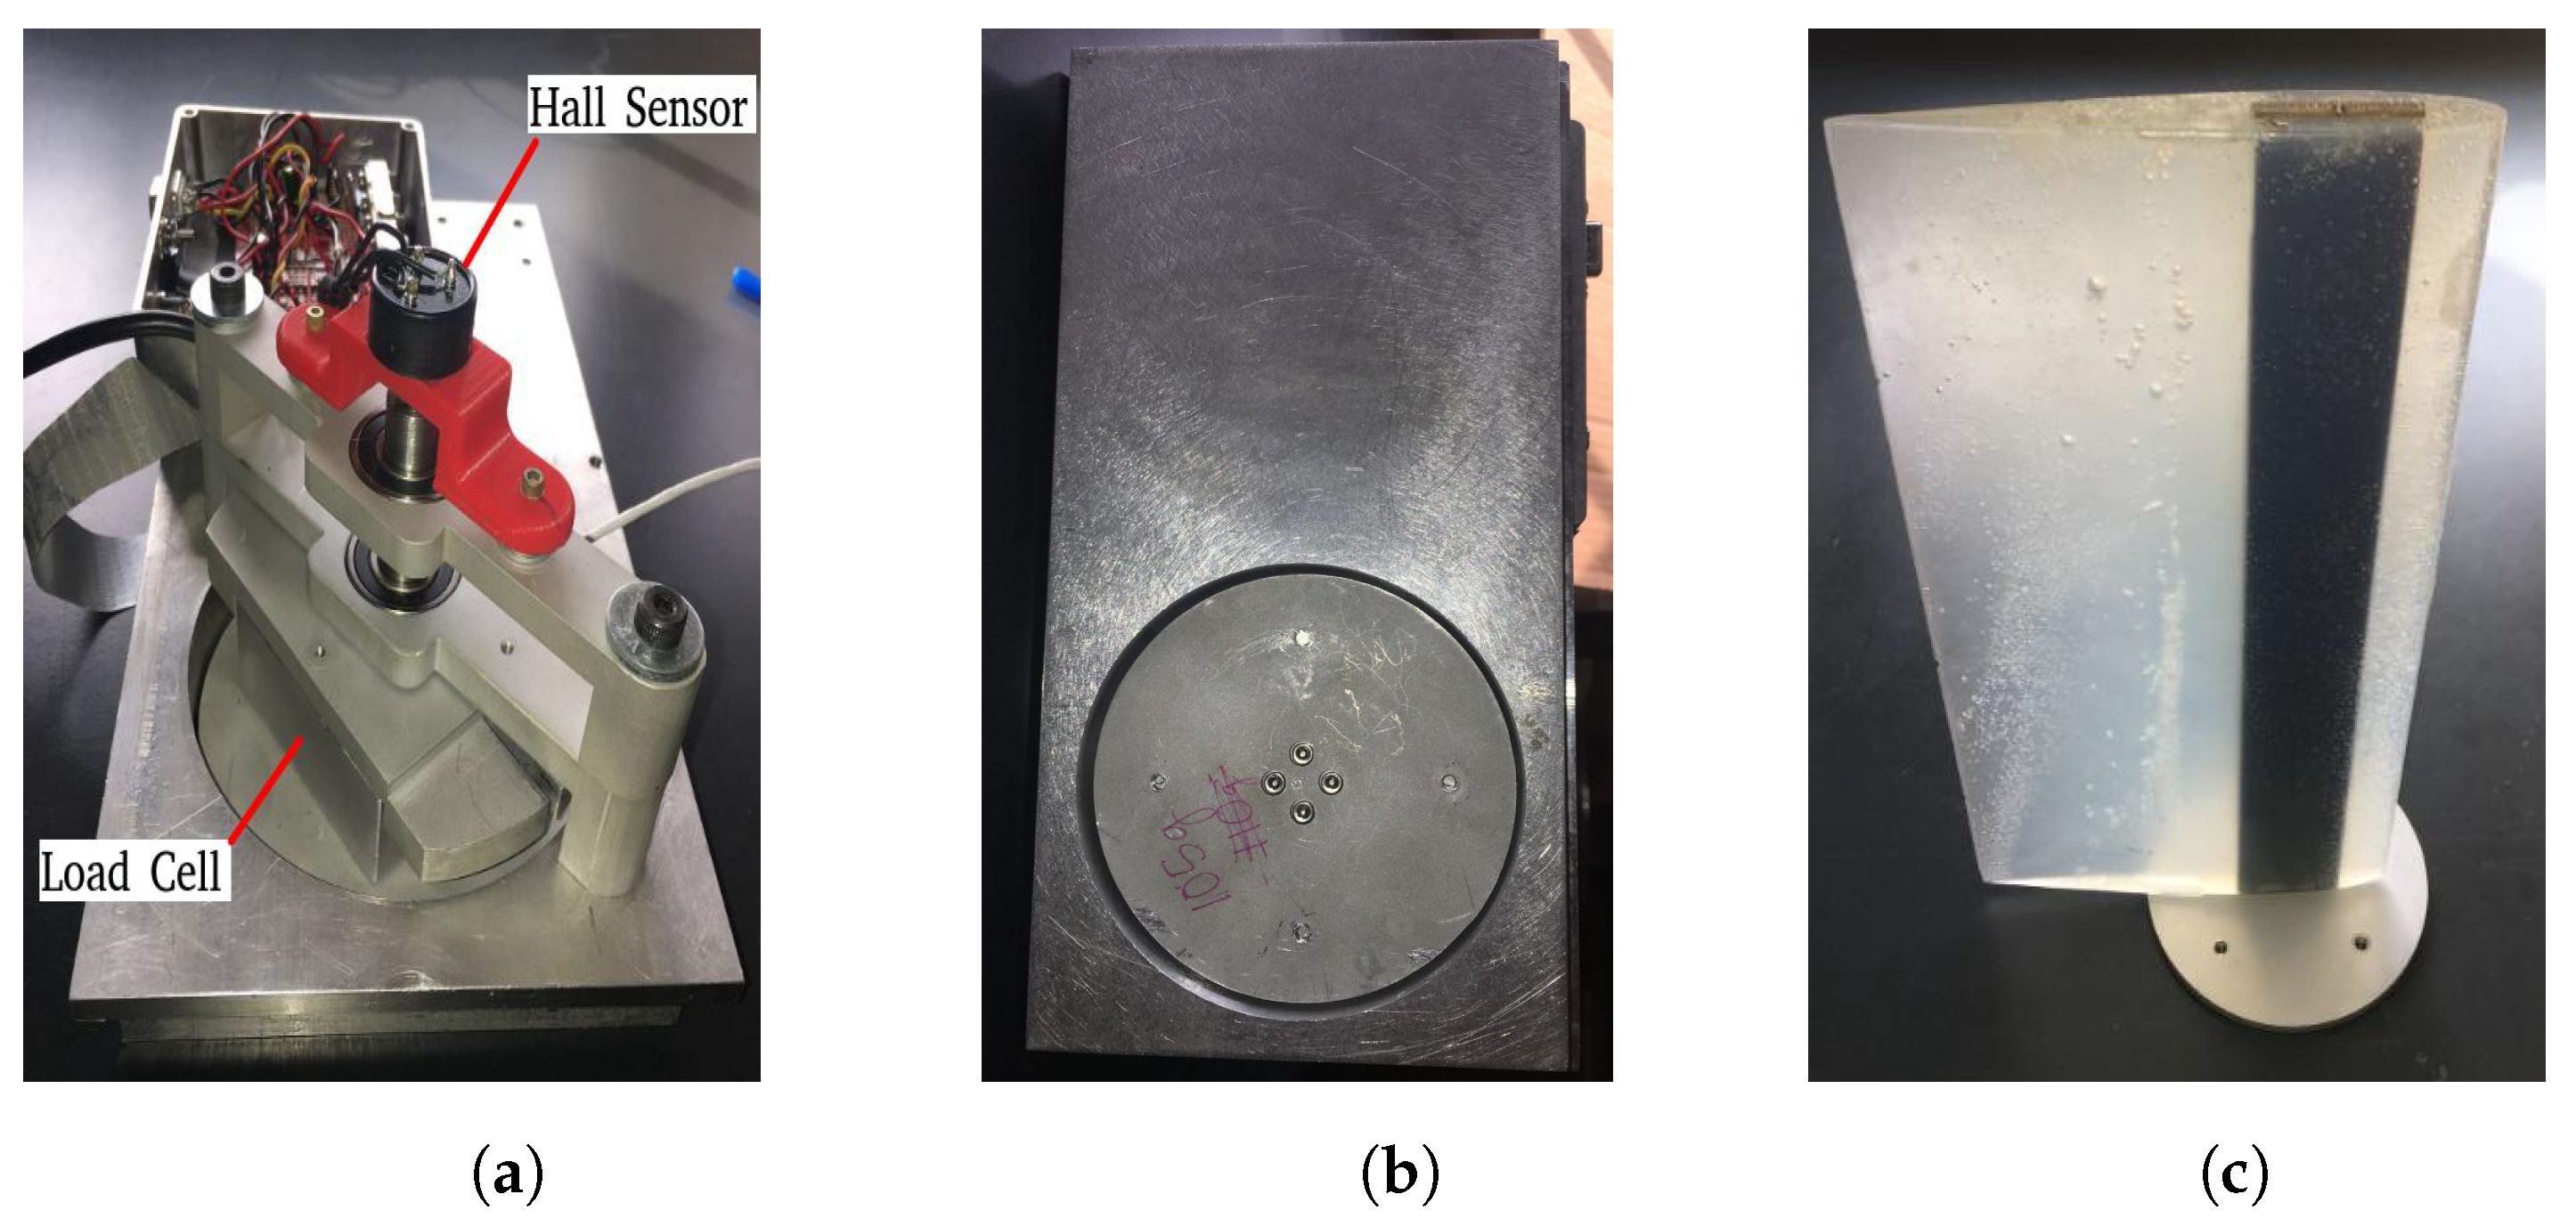
The chosen NACA0012 profiles were prepared in lab by a mold consisting of a pair of acrylic sheets. Both were carved by computer numerical controlled milling. These 2-inch sheets (i.e., a two-part mold) were then bolted together, inserted with a steel support structure, and injection molded with either a “rigid” or “flexible” material. The metal bar helps mount the airfoil vertically on the mounting apparatus (Figure 4a,b).
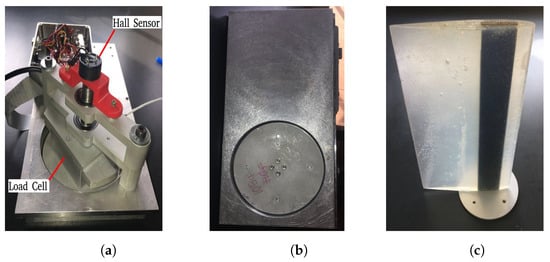
Figure 4.
Customized mounting apparatus (a) bottom view (b) top view and (c) flexible blade.
The rigid material is a two-part polyurethane mixture, which cures to a hardness which will not deflect in any appreciable manner. The flexible material, a translucent silicone rubber (see Figure 4c), has properties listed in Table 1.

Table 1.
Mechanical properties of flexible blade material.
The chord length, c, is 6 inches (0.1524 m) and its span is 12 inches (0.3048 m). The dimensions of the steel support bar are 1.5 inch width (in the chord-wise direction) by 0.25 inch thickness. The support is placed in a way so that its centroid coincides with the quarter chord of the airfoil.
3.2. Apparatus
The schematic diagram of the University of Alabama’s low-speed wind tunnel is given in Figure 5 to illustrate its inner structure and components. A customized mounting apparatus has been designed and constructed to house the load cell (to measure forces) and the sensor (to measure pitch angle) along with the mounted airfoil blade. These are visible in Figure 4a.

Figure 5.
Schematic of an open-circuit low-speed wind tunnel.
Measurements took place in a 1 ft × 3 ft section, with air supplied by a variable-speed centrifugal fan and straightened in a honeycomb lattice prior to the test section. Flow velocity was measured by a pitot tube firmly positioned along the centerline of the cross-section of the test area. Each airfoil was mounted vertically in the wind tunnel, fixed at one end by the measurement apparatus. This apparatus (Figure 4a,b) was designed to be flush with the bottom of the tunnel surface, to prevent any additional disturbances in the flow. The load cell is an Interface 3A60A 3-axis model, connected to the airfoil by a set of adapter plates. The plates are circular in shape (seen in Figure 4b). One of them is attached with a load cell directly and the other is attached with the airfoil (notice the circular plate at the base of the flexible airfoil in Figure 4c). The purpose of using these two plates is to allow the airfoil to rotate a desired pitch angle. In order to sense the pitch angle, a Hall-effect sensor has been mounted to the carrier shaft, and is accurate to within 0.5°. These base-plates allow the blade pitch angles to be controlled precisely. Force data were converted using a full bridge device, and are accurate to within 0.3% with total force of up to 50 N.
All analog sensor data was processed using a National Instruments data acquisition system using LabView.
3.3. Data Extrapolation
The force data collected from the wind tunnel consists of 300–500 data points at each attack angle (see Figure 6 for one example).

Figure 6.
Mean and standard deviations of (a) Lift and (b) Drag coefficients of the flexible blade at Re = 29,497.
The apparatus seen in Figure 4 unfortunately allows a maximum pitching angle of only 20 degrees, and the DMST model sometimes requires data beyond this range which can be achieved through extrapolation. There are several well established methods for this purpose: the Viterna–Corrigan Model [50], the Montgomerie Method [51], the Kirke Correlation [52], and the Beans and Jakubowski Correlation [53] are the most common. In this study, the Montogomerie Method is used as it includes advanced features enabling incorporation of the airfoil’s camber, skin friction and leading edge radius [54] which the authors will use in future studies. This method has been proven to be as good as others in predicting aerodynamic performance [55].
The Montgomerie method is based on the assumption that the flow behaves like potential flow around the airfoil near 0° and 180° angles of attack. At angles post stall and beyond experimental data, basic thin plate theory is assumed since flow separation takes place and the airfoil behaves more like a flat plate. A blending function (f in Equation (19)) is used to blend these two assumption near the stall. The reader is referred to [51] for a full description of the method.
The lift extrapolation function is expressed as:
where t represents the straight line tangent to the curve at ( = 0, = (0)) and s is the post-stall curve and f is the blending function that blends the pre-stall function (t) with the post-stall function (s) near the stall region.
Similarly, the drag extrapolation function, is given by
where is the pre-stall drag coefficient (computed from experiments) and is the post-stall drag coefficient that comes from thin plate theory.
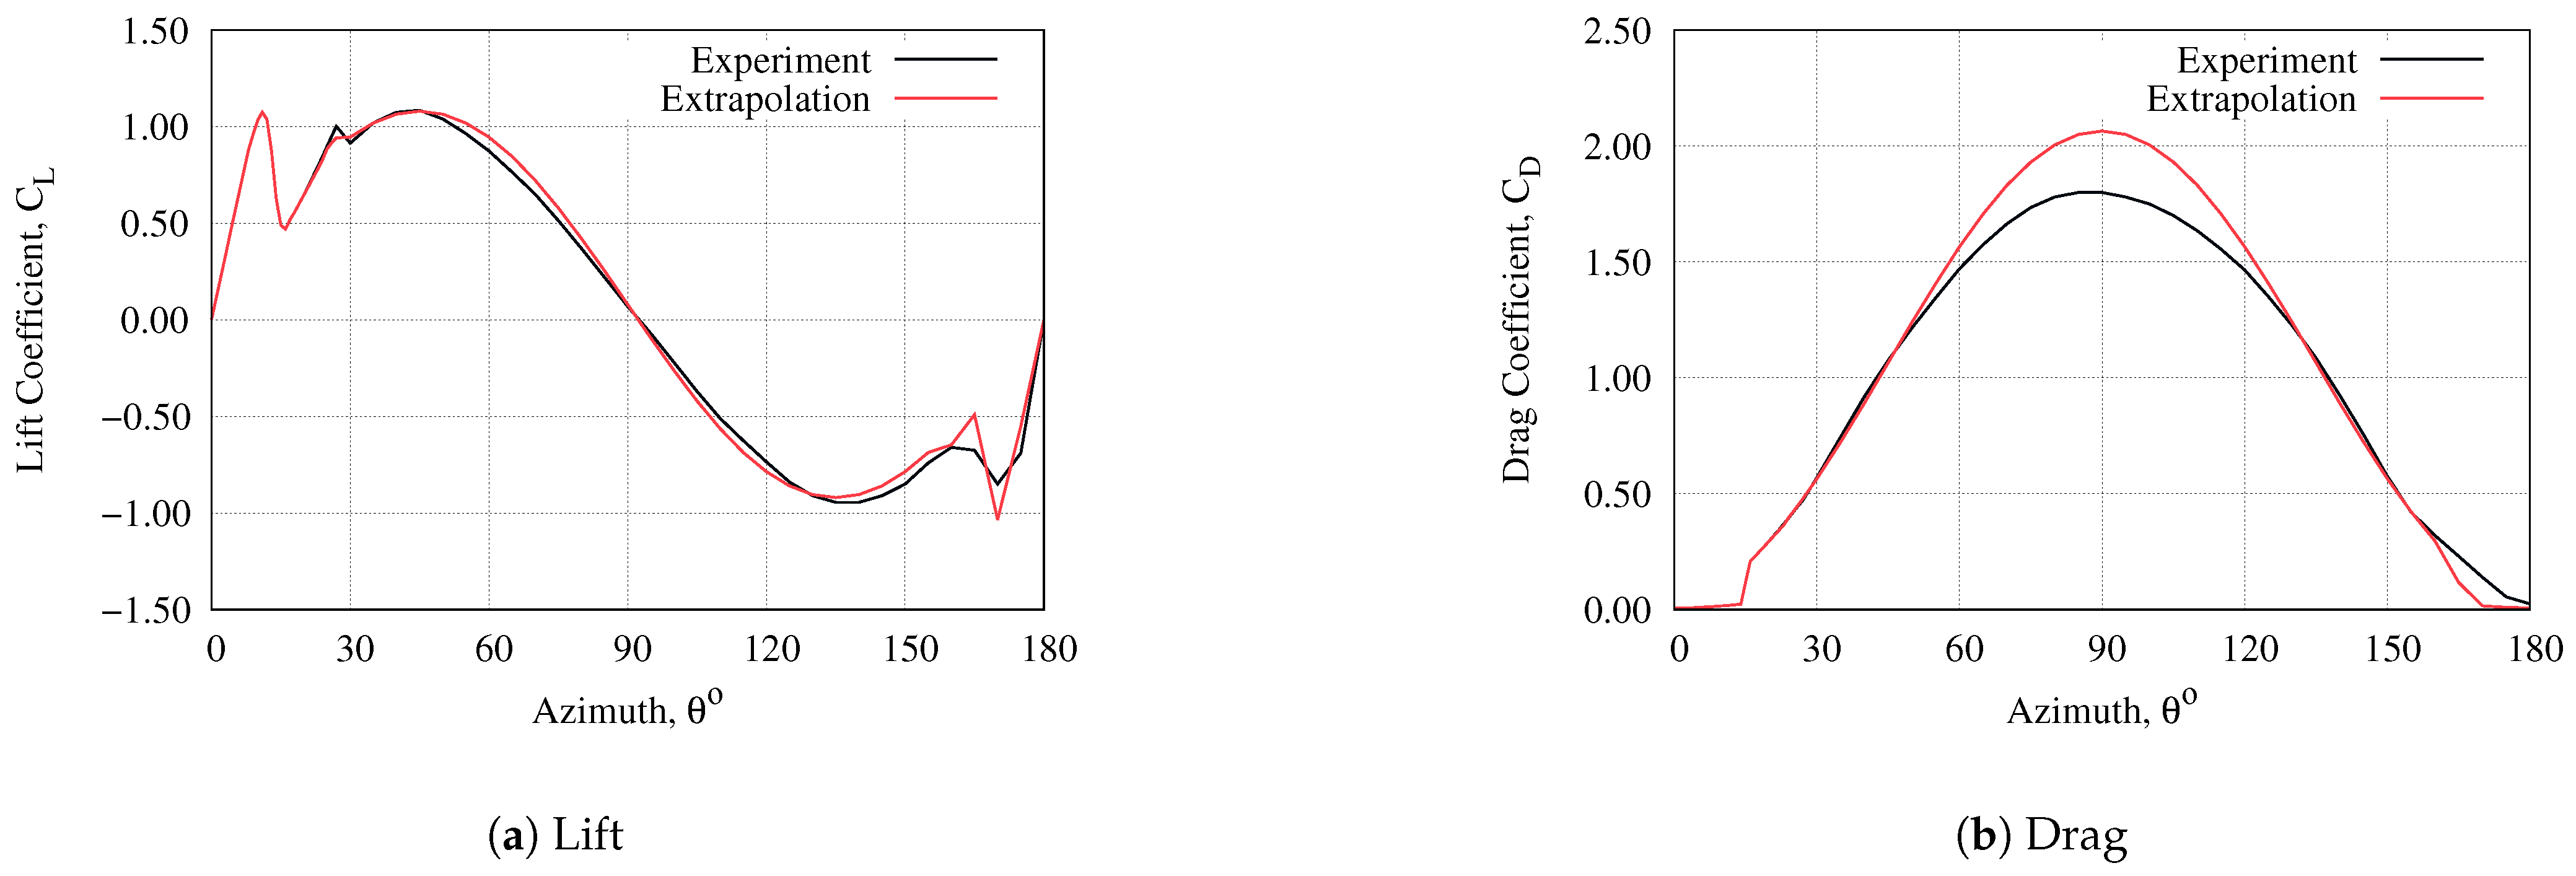
Figure 7a,b show the comparison between the experiments of Sheldahl and Klimas [56] and the extrapolation by Montgomerie’s model [51]. The model does not match the experimental data exactly in all cases: the lift coefficient overpredics around 60° and 120° and underpredicts at 150°. It also tends to predict relatively poorly in between 160° and 170°. Similarly, the prediction of drag coefficient exceeds the experiment near 90°. Despite these limitations, the model overall predicts well enough below 50° where virtually all VAWT operation is experienced.
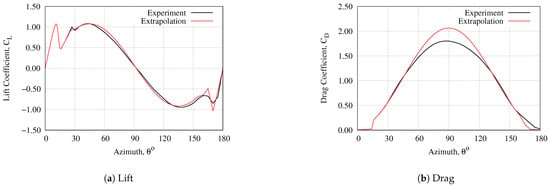
Figure 7.
Comparison of experimental data from Sandia Lab [56] with Montogomerie extrapolation [51].
3.4. Data Correction
The force coefficient data acquired from experiments and extrapolations need further corrections due to inherent three-dimensionality of the turbine as well as a wind-tunnel correction.
Two dimensional flow assumes infinite length of an airfoil blade which is safe near the central portion of the blade. However, the effect of three-dimensionality along the span increases near its ends since the the flow forms tip vortices. This tip vortex is associated with induced drag and reduced lift. The DMST model does not include any expression to incorporate tip vortices in its equations. Therefore, in order to make aerodynamic data more accurate, the blade’s finite length along with its three-dimensionality must be considered and incorporated by correcting the , and . These corrections [57] can be formulated as follows:
Here, is the effective (corrected) angle of attack, and is the blade aspect ratio (). The reduced (corrected) lift coefficient, is given by:
where is the slope of the curve at . The increased (corrected) drag coefficient, is computed by:
The raw data from the open-circuit wind tunnel requires slight correction as well, due to blockage factors and wake blockage effects. In the presence of the airfoil in the test section, the freestream velocity area is reduced (blocked), somewhat affecting results. Furthermore, wake blockage correction is for the wake that hinders the air flow. These corrections do not change the force coefficient appreciably for the majority of test cases since the wind tunnel is open circuit and the airfoil is very thin and stationary, i.e., ratio of their frontal areas to test area is low and within the acceptable range (<=0.05). Although they do not affect the results appreciably, a correction factor was used for all data herein for completeness, based on Thom’s [58] formula:
where is the solid blockage factor, equals 0.52 for a wing spanning the tunnel height and model volume is approximated as 0.7 × model thickness × model chord × model span [59].
Pope and Harper [60] have formulated the total blockage factor (solid blockage and wake blockage combined) as:
where and are the total and wake blockage factors, respectively. These have been used to correct VAWT parameters as follows:
4. Validation
The combination of experimental and predicted data must be validated before being used to predict performance. This is discussed by investigating the model’s independence from number of streamtubes (ensuring numerical solution is independent from this quantityt) as well as validating with experimental results.
4.1. Streamtube Independence Tests
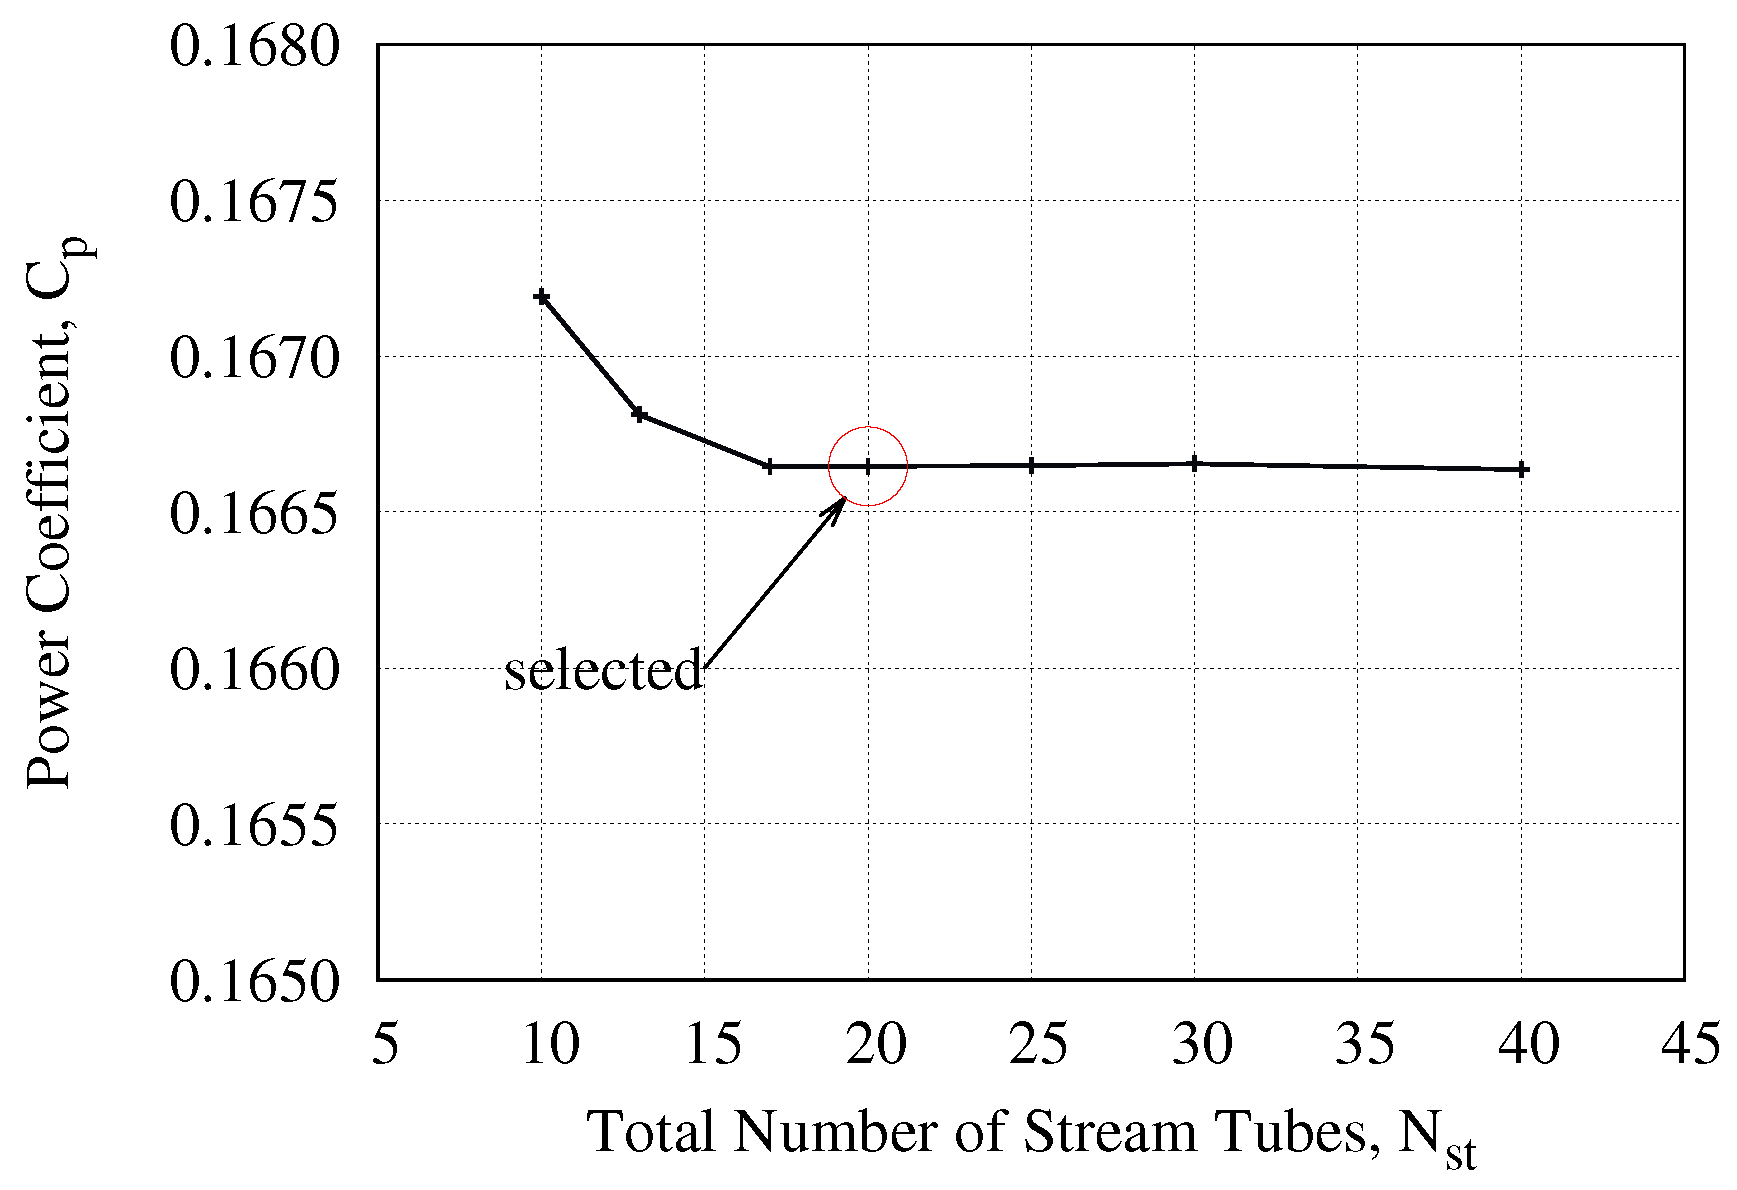
As mentioned previously, the region of VAWT’s full rotation is split into several streamtubes (N) and computations take place at their centers. Several simulations were conducted with one set of design parameters, and the resultant power coefficient monitored for varying N. Figure 8 demonstrates that the results do not very appreciably past the chosen number of streamtubes (20) which provides a good compromise between tractability and accuracy for the simulations conducted herein.
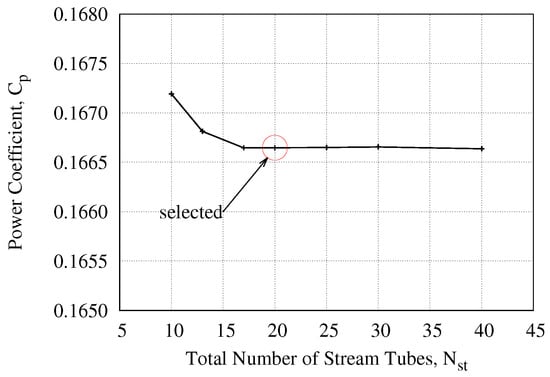
Figure 8.
Predicted power coefficient with varying number of streamtubes, N.
4.2. Experimental Validation
The performance predicted by the previously described DMST model is validated against experimental data obtained from a 12 kW VAWT by Kjellin et al. [61]. This rigid VAWT has a radius of 3 m, a height of 5 m and its blades are symmetric NACA 0021 airfoils with 25 cm chord length. The hub is situated 6 m above the ground, and each blade is connected to the rotor hub by 2 struts. The profiles of the struts (or arms) are inspired by NACA 0025 airfoils but are shortened at the trailing edges. The height of this trailing edge also varies along the length, i.e., 38 mm near the hub, 18 mm in the middle and 6 mm near the blade. Similarly, the struts’ chord lengths vary (320 mm near the hub, 280 mm in the middle and 200 mm near the blade). However, the struts are not twisted and are mounted at a constant ° with the horizontal plane. It is important to mention the design of the arms because the struts and hub together create parasitic drag adding to the wake from the upstream that reduces the power output of the turbine, discussed in more detail above.
For the purposes of validating this DMST model, together with extrapolations and corrections, with experimental data by [61], force coefficient data have been obtained from a Sandia lab report [56]. Fortunately, it provides for all from 0° to 180° so extrapolation was not necessary.
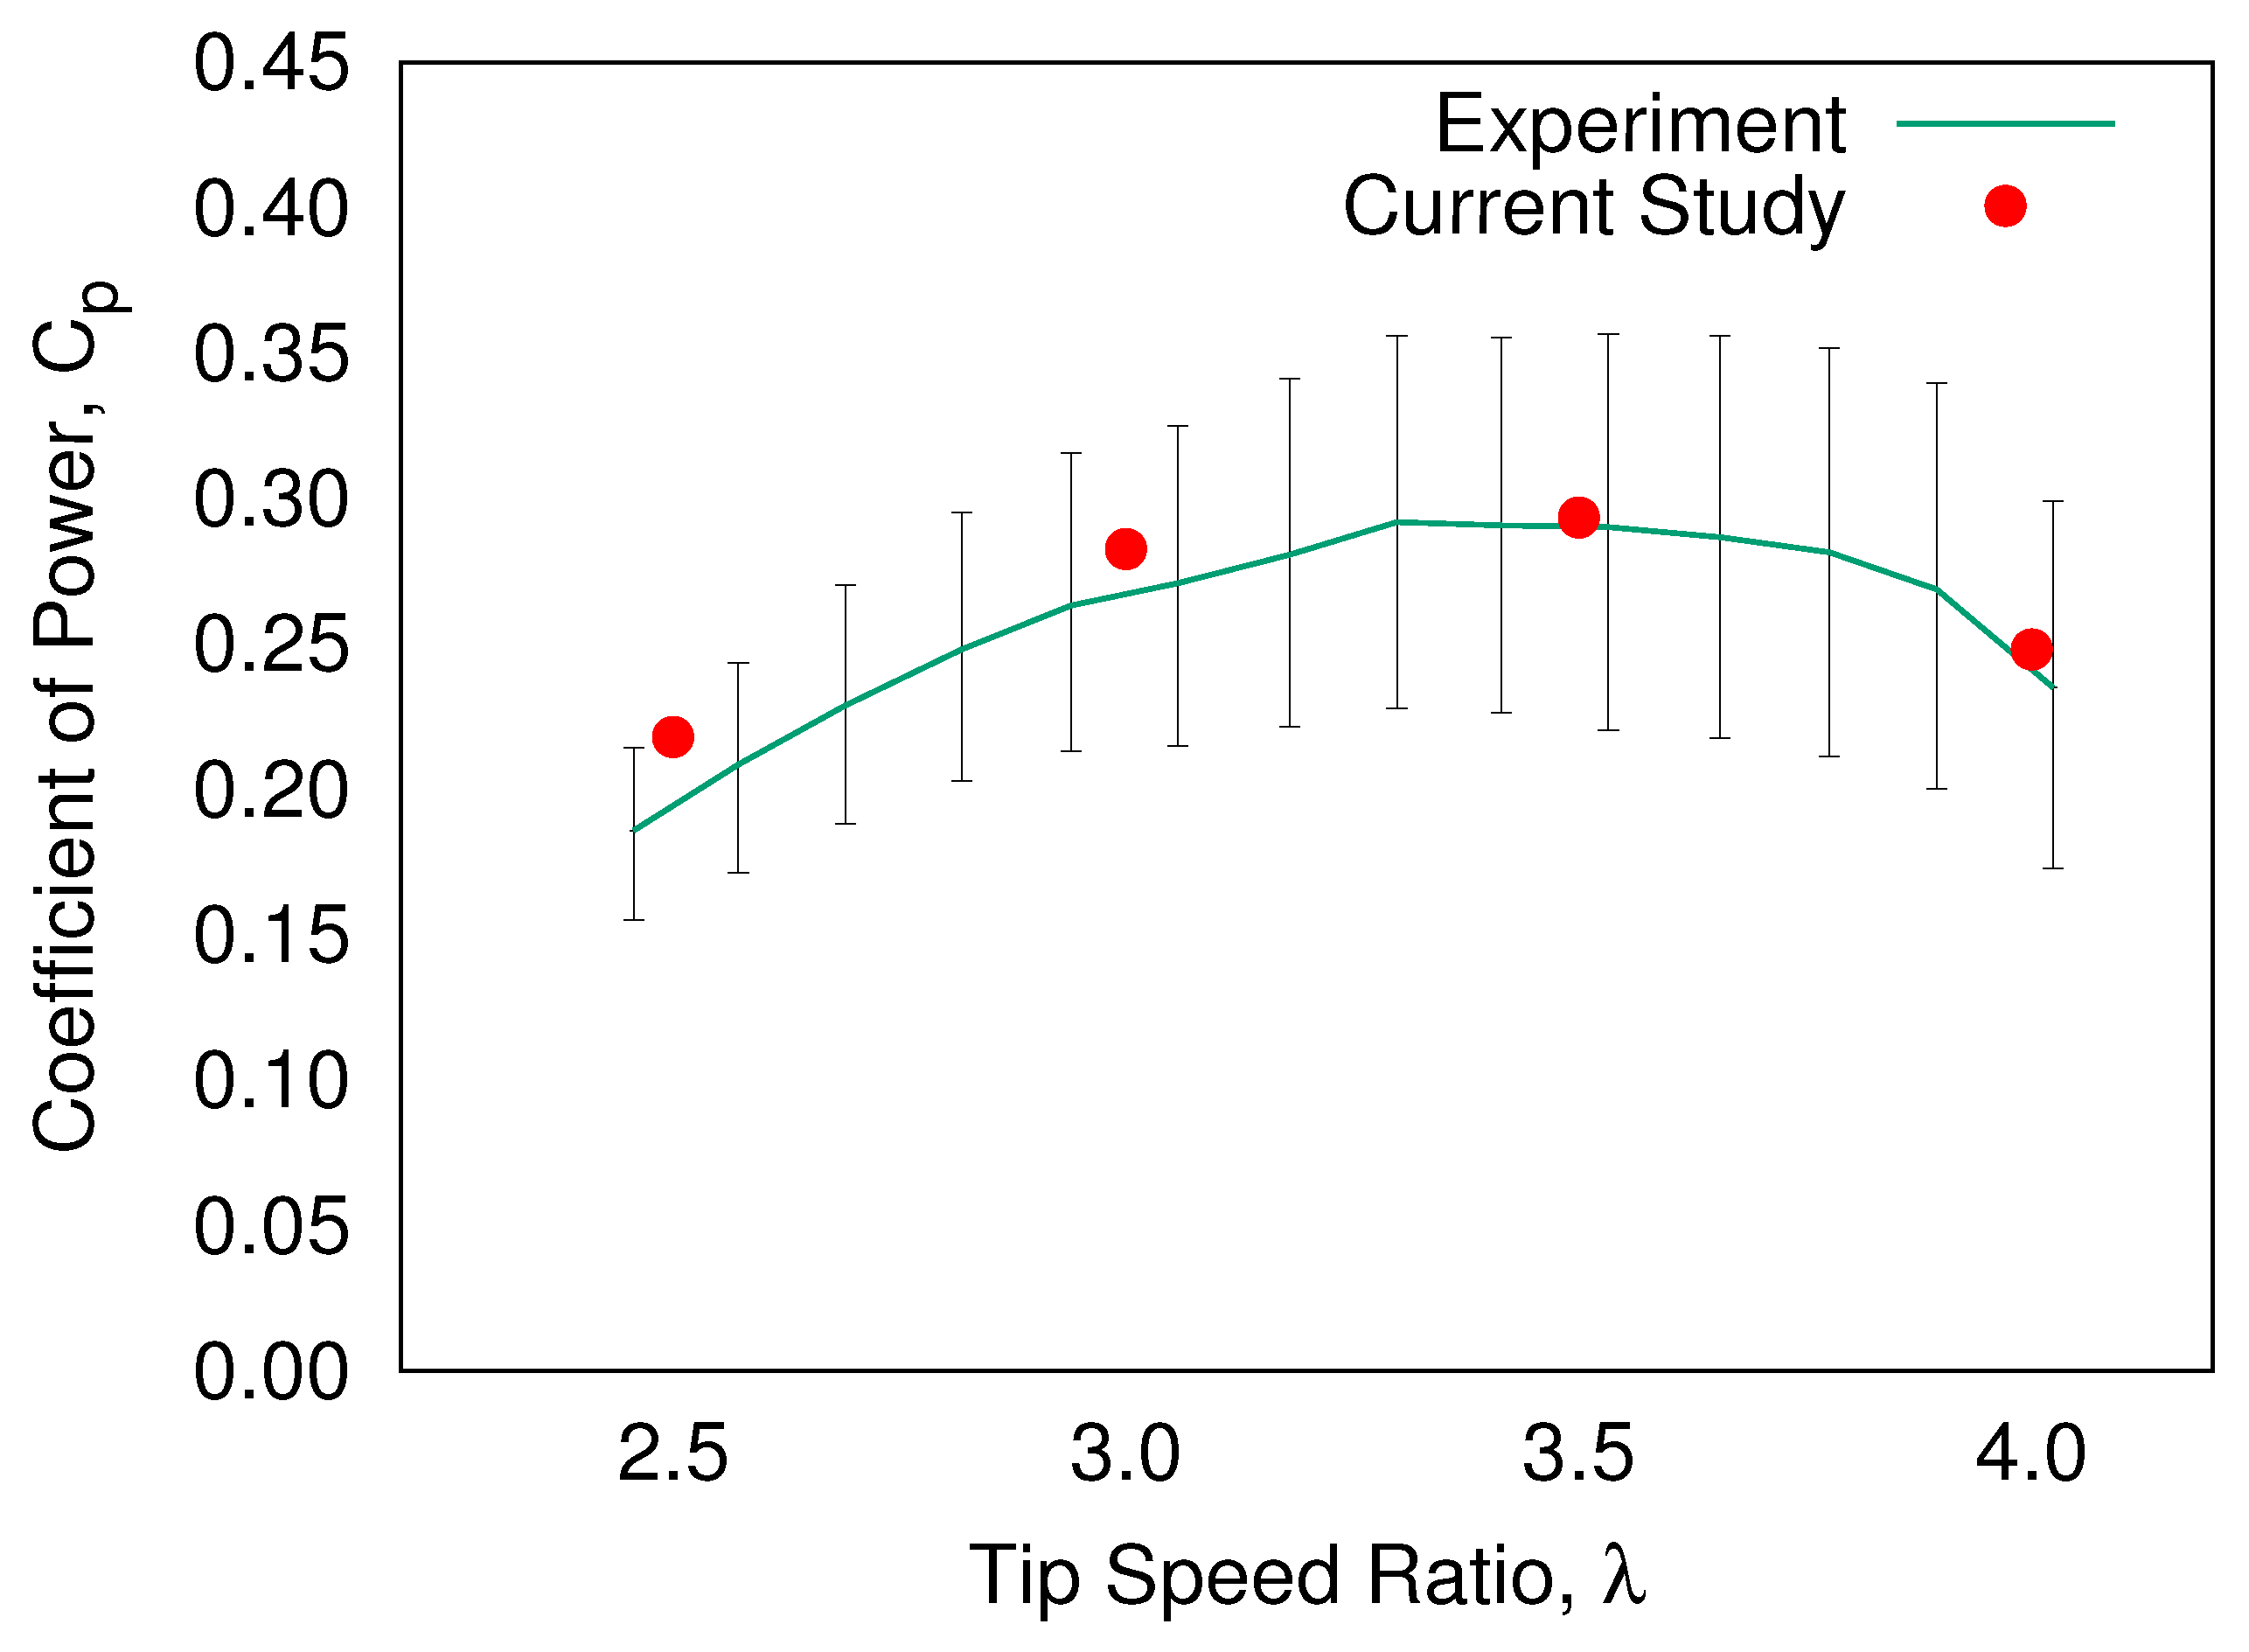
Figure 9 compares the power coefficient predicted by the aforementioned DMST model with the experiments in [61] near the peak tip-speed ratio. It is clear that the DMST model described herein predicts both the performance as well as the location of optimal tip-speed ratio well. Throughout this range the DMST model predictions remain within experimental uncertainty.
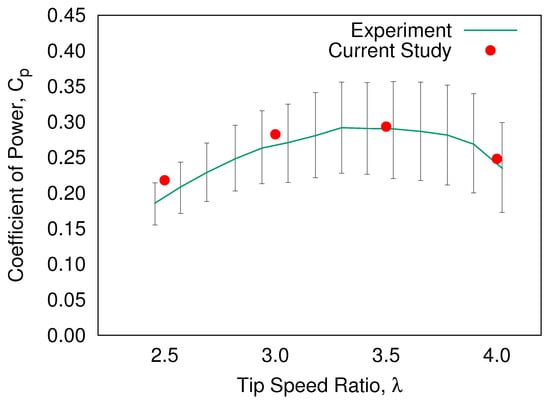
Figure 9.
Comparison between experiment [61] and DMST model.
5. Result and Discussion
Before discussing and comparing performance results between rigid and flexible VAWT rotors, an additional dimensionless parameter must be defined. This is done since the DMST model allows for incredible versatility in terms of geometric variability (radius, blade height, number of blades, chord length, and airfoil profile) and environmental conditions (wind velocity, air viscosity, air density, and rotational speed). The solidity, , relates the radius of the VAWT to its chord length and is defined by the ratio of the total projected area by all the blades to the area that the VAWT sweeps. Both areas are computed perpendicular to the direction of free stream wind flow:
5.1. Wind Tunnel Tests
As mentioned previously, the backbone of the DMST model is the lift and drag data, and as such, some discussion of the differences between flexible and rigid airfoil performance is warranted. Figure 10, Figure 11, Figure 12, Figure 13 and Figure 14 compare lift and drag coefficient experimental data for rigid and flexible airfoils across 5 Reynolds numbers spanning the operational range of the wind tunnel. It should be mentioned at this juncture that only chord-wise flexibility was observed with the flexible blades, and while displacements were impossible to photograph, the blade trailing edge deflected as expected in all cases toward the suction side.

Figure 10.
(a) Lift and (b) Drag coefficients for rigid and flexible blades for Re = 29,497.

Figure 11.
(a) Lift and (b) Drag coefficients for rigid and flexible blades for Re = 58,994.

Figure 12.
(a) Lift and (b) Drag coefficients for rigid and flexible blades for Re = 88,490.

Figure 13.
(a) Lift and (b) Drag coefficients for rigid and flexible blades for Re = 117,987.

Figure 14.
(a) Lift and (b) Drag coefficients for rigid and flexible blades for Re = 147,484.
Airfoil lift is largely generated as a result of pressure differences between the pressure (lower) and suction (upper) sides. However, flexible and rigid airfoils are fundamentally different: the flexible airfoil, due to the location and size of the solid support placement, effectively acts as a rigid airfoil for the leading half and undergoes deflection towards regions of low pressure along its trailing half. At small attack angles, the flexible blade does not appreciably bend due to the relatively low difference between suction and pressure traction forces, hence, they are expected to behave similar to rigid blades. As attack angle increases, pressure differences begin to be more pronounced, and ultimately flow separation occurs at or near the stall angle. At this point, the flexible airfoil is expected to bend more to the suction side, due to the greater difference in pressure resulting from airfoil stall. It is of no surprise, then, that the lift coefficients in Figure 10, Figure 11, Figure 12, Figure 13 and Figure 14 are very nearly identical for lower attack angles, and differ wildly for higher attack angles, with flexible airfoils enjoying a much higher lift coefficient at these conditions. These findings are supported by 2D computational studies of similar blades in [62].
Generally speaking, results from these wind tunnel tests suggests that a flexible airfoil delays stall as compared to a rigid counterpart. For the Reynolds numbers considered herein, the delay in stall is roughly 2° for all cases. Furthermore, at post-stall conditions, lift curves tend to resist performance drops more than the rigid blade. This is again a consequence of the flexible blade becoming more cambered, and moving blade material toward the separated boundary layer zone, thereby delaying the point of stall. Maximal lift coefficient, , which is found after the stall point of the rigid blade, was greater for each test scenario, with a maximal increase of up to 18% for the lowest Reynolds number tested, Figure 10. There are no discernible trends between flexible and rigid airfoils in terms of drag. Regardless, flexible-bladed drag is expected to be decreased in general as compared to rigid [62], which is generally the case for the larger Reynolds number test cases seen here.
5.2. DMST Results
For the purposes of comparing flexible and rigid-bladed VAWT rotors, a number of 3-bladed designs have been considered here with a blade height (H) of 2.5 m and with radii ranging from 1.0 m, 1.25 m and 1.5 m. The free stream wind speed is varied to obtain the range of tip-speed ratios necessary for adequate performance curves, while keeping the angular speed constant. Three separate angular velocities were considered in this study, corresponding to shaft speeds of 48 rpm, 54 rpm and 60 rpm. However, much of the discussion below considers only the 54 rpm cases, since this allowed for the greatest extent of free-stream velocity parameters, while keeping within experimental lift/drag data generated, and hence, provided more variation for discussion across a wide range of tip-speed ratios.
The chord length of the airfoil in the DMST model is kept as in wind-tunnel tests (0.1524 m). This chord length and blade height comply within acceptable design parameters (blade aspect ratio, ) of VAWTs [63]. This also keeps the solidity within acceptable ranges [43,49,52,63,64] for all VAWT radii considered. Changing the radius also affects the rotor aspect ratio, , which will vary between 0.78 and 1.136 in this study, again within recommended design parameter ranges () [63].
Obviously, required DMST data do not fall directly on experimental (discrete) data points. All required data for DMST calculations were linearly interpolated from experiments in terms of Reynolds numbers and relative attack angle.
To begin discussion of DMST results, the performance curves for all turbines considered herein are shown in Figure 15, Figure 16 and Figure 17.

Figure 15.
Performance curves for (a) rigid and (b) flexible VAWTs, with varying radii, for a shaft speed of 48 rpm.

Figure 16.
Performance curves for (a) rigid and (b) flexible VAWTs, with varying radii, for a shaft speed of 54 rpm.

Figure 17.
Performance curves for (a) rigid and (b) flexible VAWTs, with varying radii, for a shaft speed of 60 rpm.
As can be seen from the predicted dimensionless performance curves, it it quite apparent that in all cases, rigid and flexible blades behave somewhat similarly in terms of the maximum power coefficient and range of operational tip speed ratios but their magnitude differ considerably i.e., flexible blades experience higher power coefficients and wider range of tip speed ratios. To more succinctly describe the effect of blade flexibility on VAWT performance, the following discussion is limited to the median case, i.e., with a shaft speed of 54 rpm.
In Figure 16, both the rigid-bladed and flexible-bladed VAWTs behave somewhat similarly across all s and VAWT radii. Those VAWTs with larger radii are able to achieve positive power production (hence, ) over a wider range of s due to the decreased solidity, which affects axial induction factors. Maximal performance is relatively unchanged across varying radii.
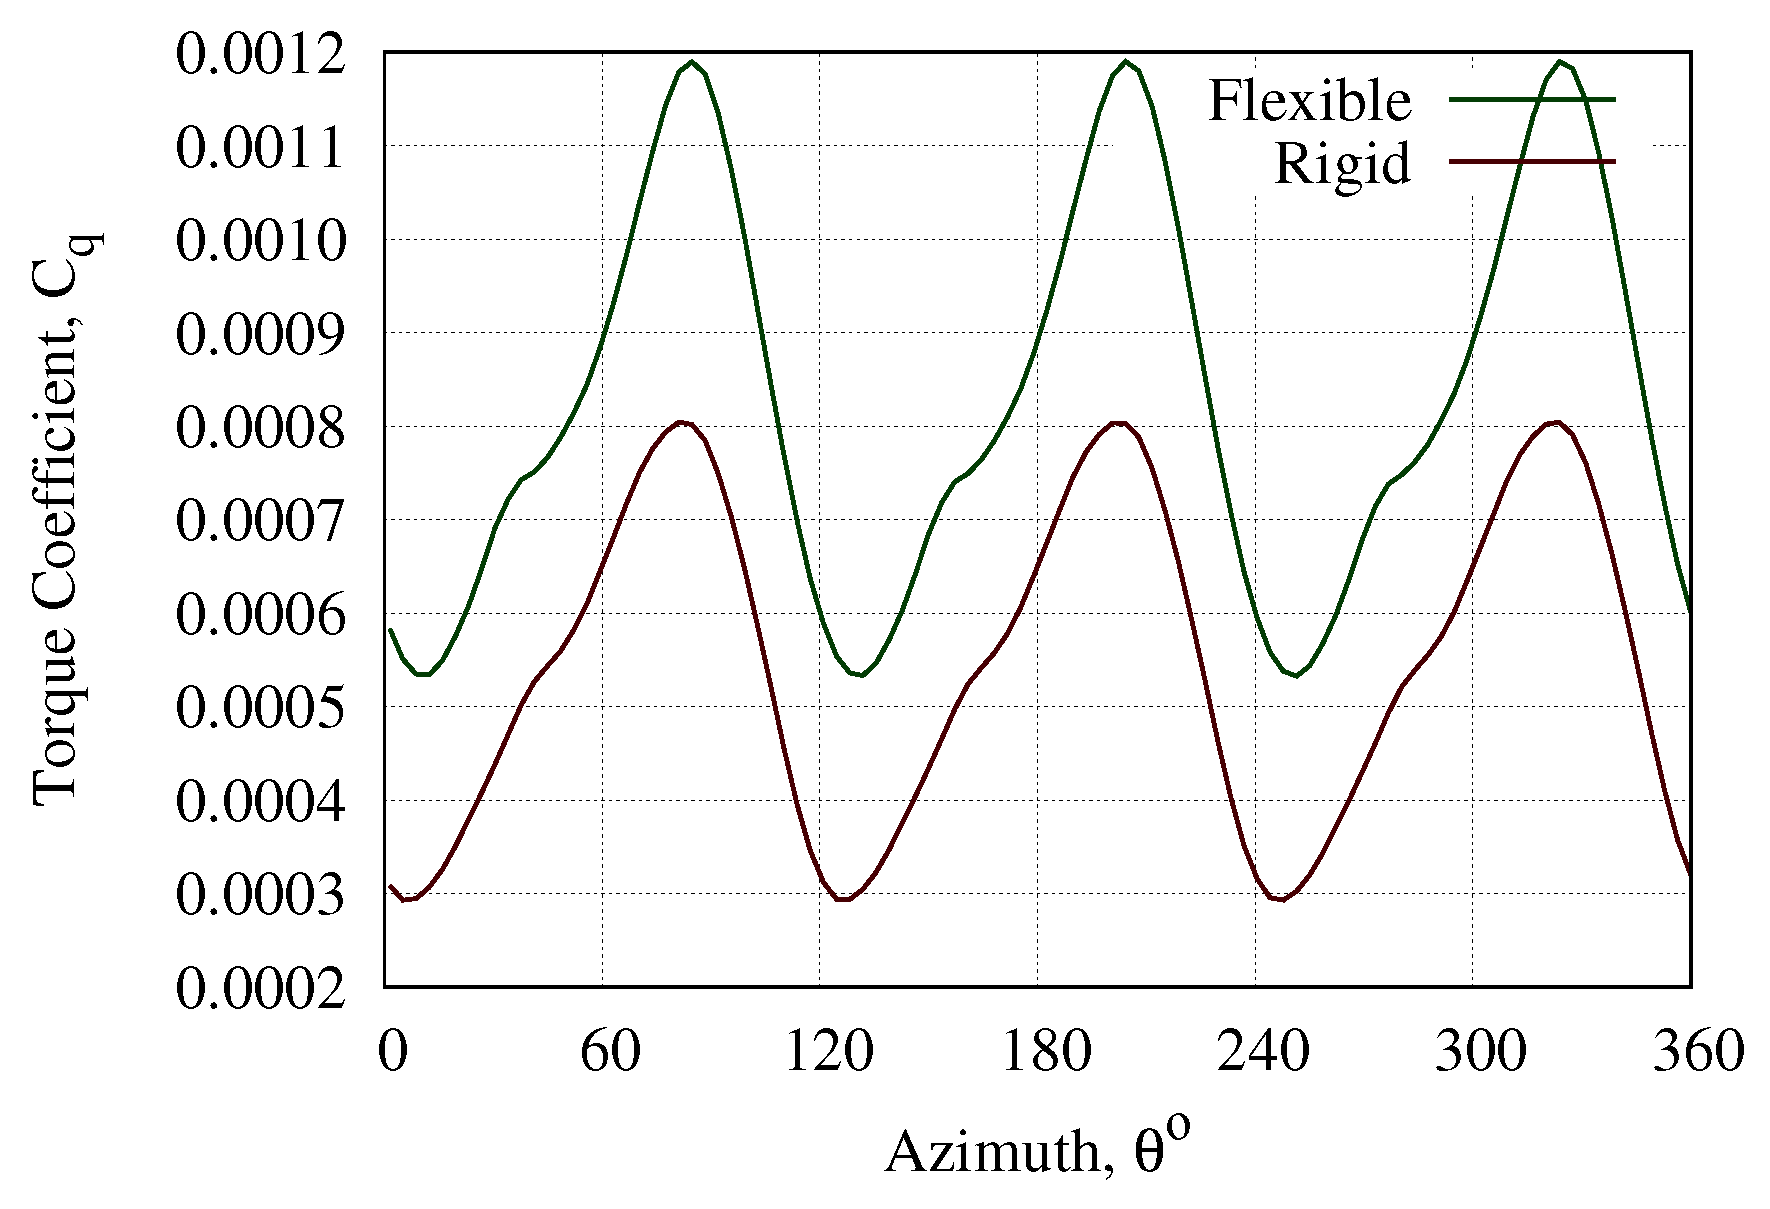
The gain in performance for flexible blades can be explained by viewing the torque coefficients of rigid and flexible VAWTs.
In order to better analyze rotor torque and efficiency characteristics, a VAWT radius of 1.25 m and angular speed of 54 rpm is chosen for both rigid and flexible rotors, with three different tip-speed ratios: optimal tip-speed ratio () as well as an equidistant neighboring at part and over-load (below and above , respectively).
Figure 18 shows the distribution of local attack angle, , of both rigid and flexible VAWT blades over a complete rotation. Since the airfoils are symmetric, = 0° at an azimuth position of 0 degrees. Then, increases until around 90° where incoming wind velocity is almost perpendicular to the blade’s linear velocity. It is observed that with increasing , decreases because the upstream wind velocity decreases.

Figure 18.
Local angle of attack of a VAWT blade of radius 1.25 m at angular velocity of 54 rpm through a complete rotation.
As the free stream wind approaches each blade, it speed decreases due to the induction factor, a (Figure 19). This factor determines the fraction of free stream speed that the wind loses on approach. When the blade airfoil aligns with the direction of wind, a is minimized; conversely, a is maximized at around 90° and 270°.

Figure 19.
Induction factor of a VAWT blade of radius 1.25 m at angular velocity of 54 rpm through a complete rotation.
Depending on the value of the a, the effective upcoming wind speed reduces (Equation (3)). This is the fraction of free stream wind speed in the upwind region and the wake velocity in the downwind. This induced velocity, , becomes higher when a is lower and vice versa, Figure 20. The minimum induced velocity in the downwind region is always lower than that in the upwind region simply because the wake velocity is lower in magnitude than the free stream velocity. Moreover, the free stream wind speed decreases with increasing as the angular velocity remains constant.

Figure 20.
Induced velocity of a VAWT blade of radius 1.25 m at angular velocity of 54 rpm through a complete rotation.
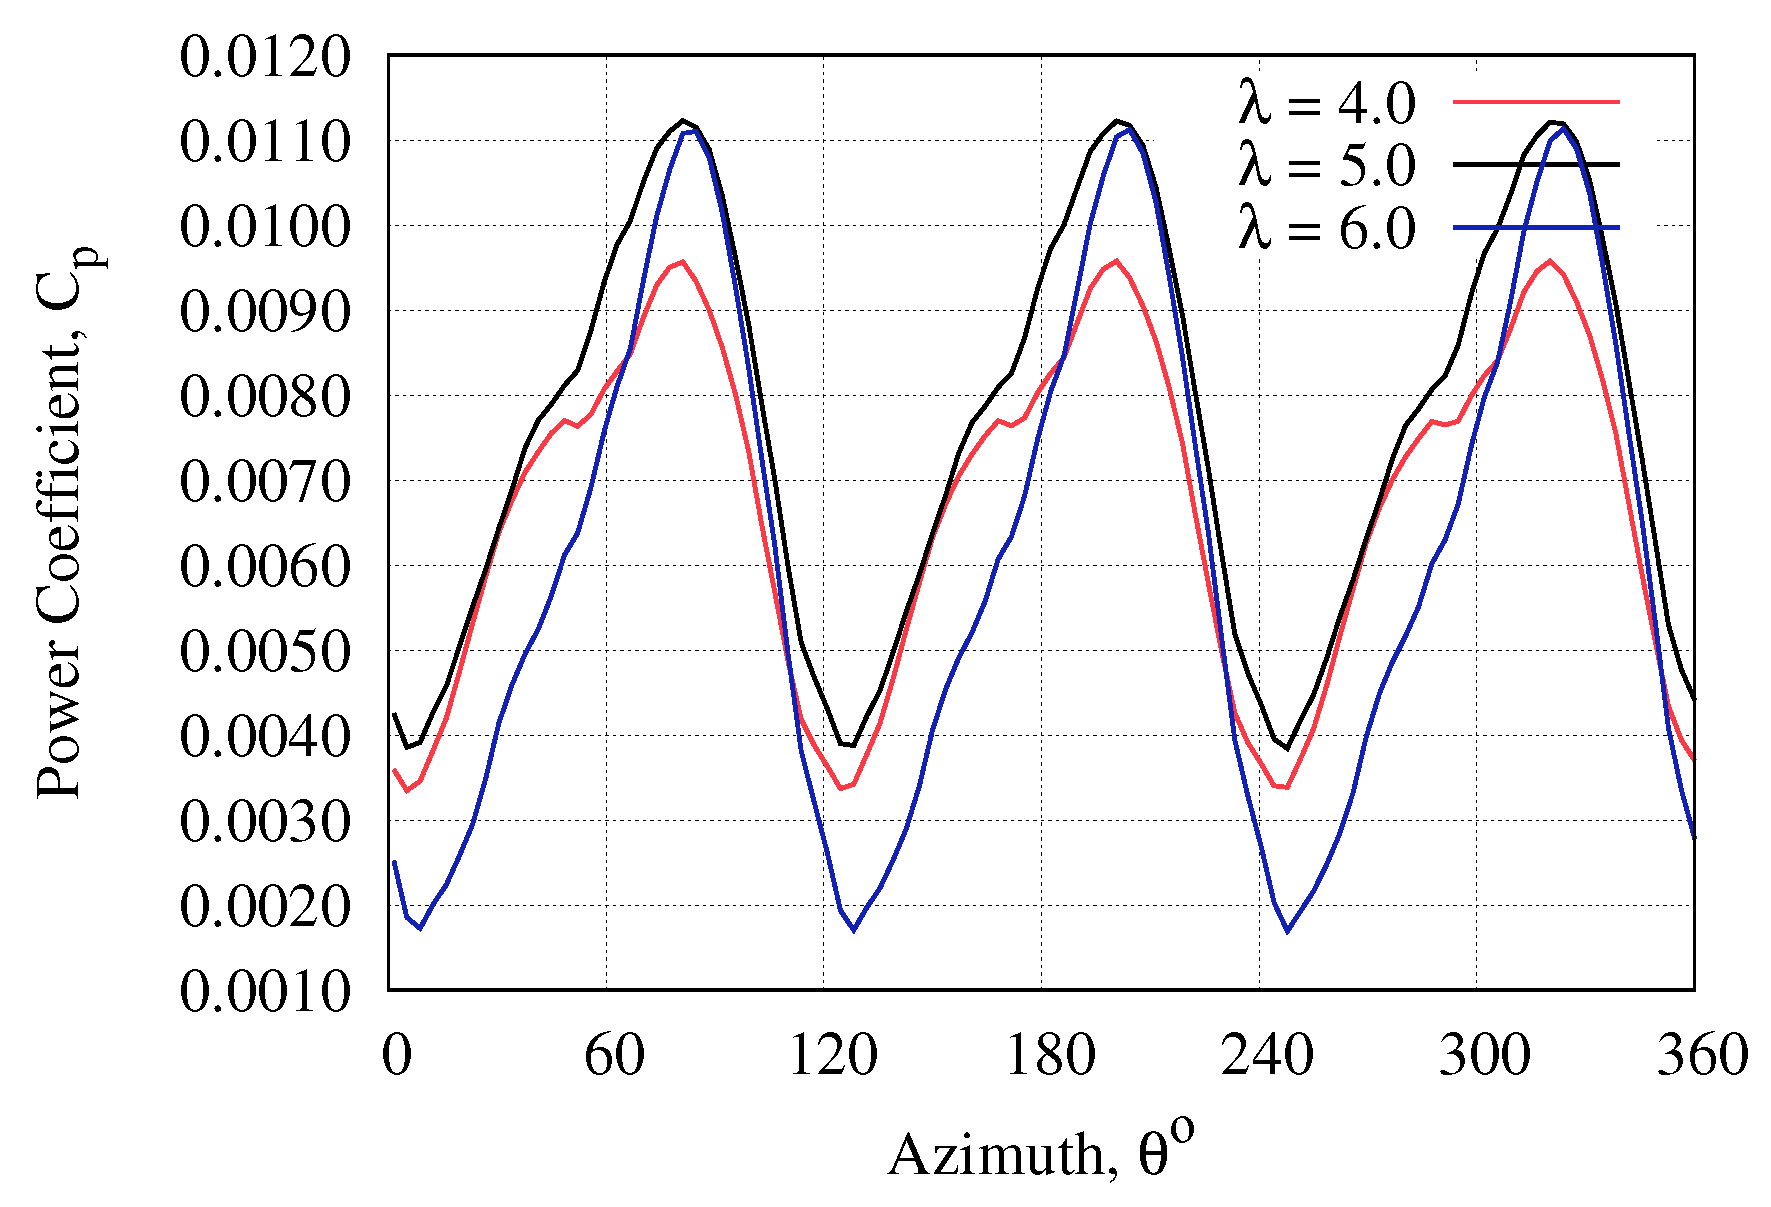
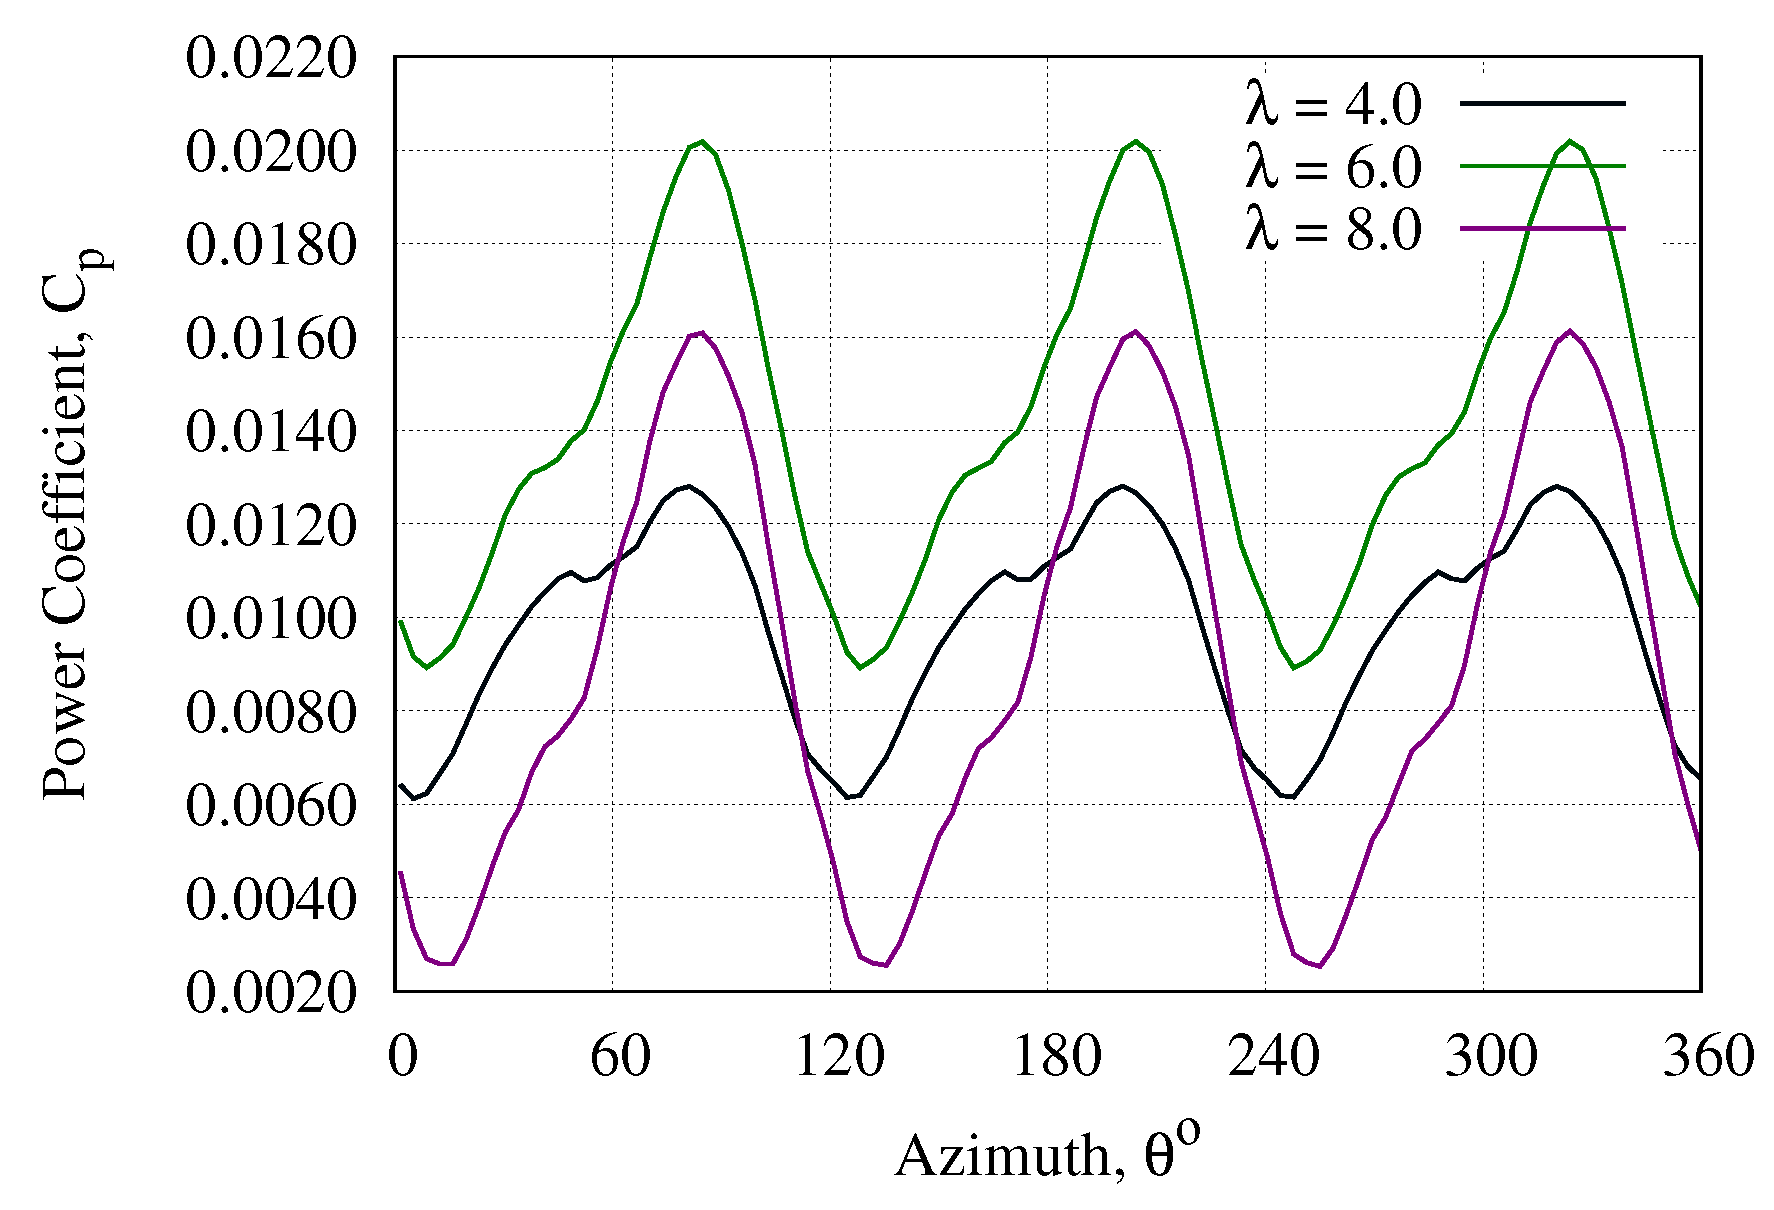
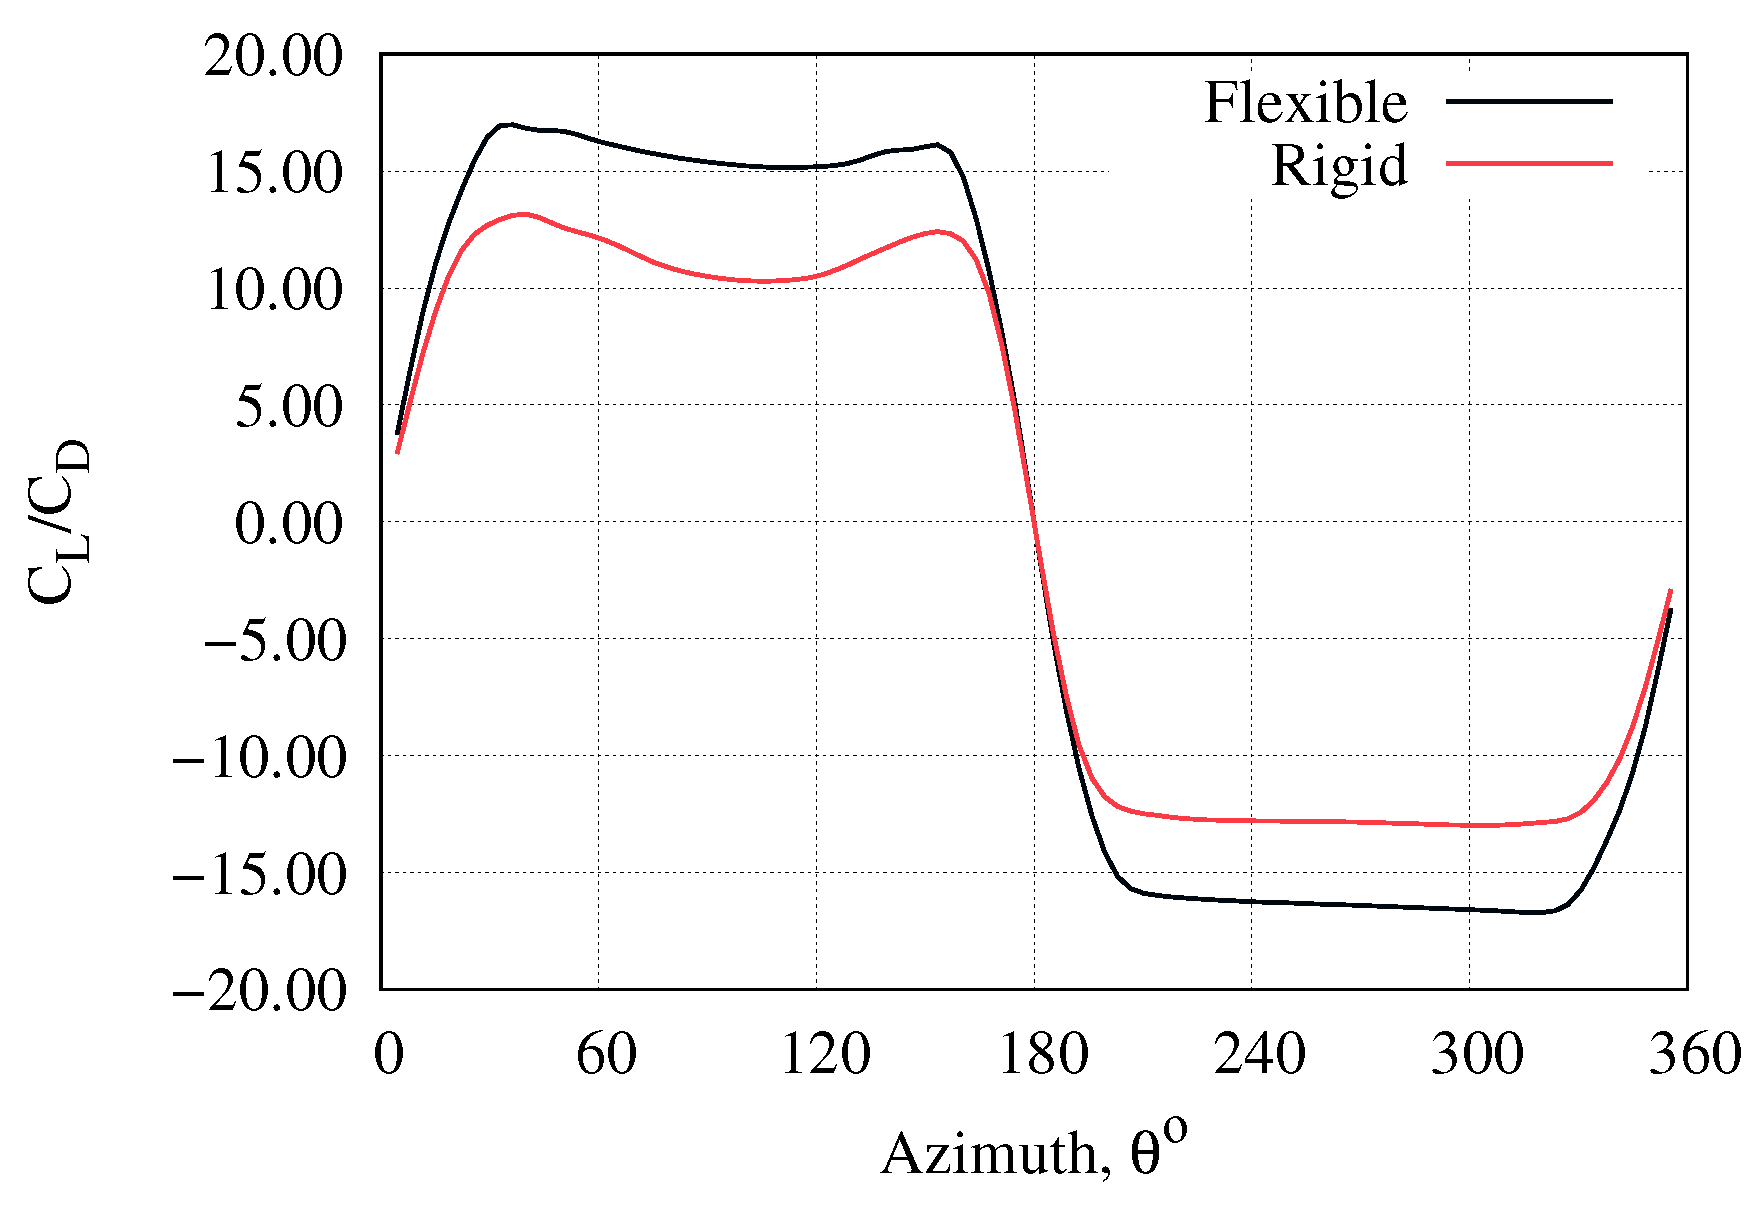
The lift and drag forces that the wind exerts on the blades can be resolved into tangential (contributes to power production) and normal (directed towards/away from the hub) force coefficients. Figure 21 shows the tangential coefficients () for rigid and flexible blades. For , in the rigid VAWT has been negative mostly in the upwind region (from 60° through 150°). It is observed that airfoils produce negative tangential forces when they are in parallel with the incoming wind (around 0°, 180°, 360°), hence is negative at these regions. Negative regions indicates that the blade experiences very low lift (Figure 22) and higher drag (Figure 23). The lift-to-drag ratio confirms this notion (Figure 24). However, the rigid VAWT still creates net positive torque since the combination of three blades results in a net positive tangential force coefficient, in turn positive ; see Figure 25 and Figure 26 for rigid and flexible bladed rotors, respectively. These two figures demonstrate the blades’ combined contribution to power at every angle of VAWT’s rotation. Here, it is obvious that the average torque at results in maximum generating power.

Figure 21.
Tangential force coefficient of a VAWT blade of radius 1.25 m at angular velocity of 54 rpm through a complete rotation.

Figure 22.
Lift coefficient of a VAWT blade of radius 1.25 m at angular velocity of 54 rpm through a complete rotation.

Figure 23.
Drag coefficient of a VAWT blade of radius 1.25 m at angular velocity of 54 rpm through a complete rotation.

Figure 24.
Lift-to-drag ratio of a VAWT blade of radius 1.25 m at angular velocity of 54 rpm through a complete rotation.
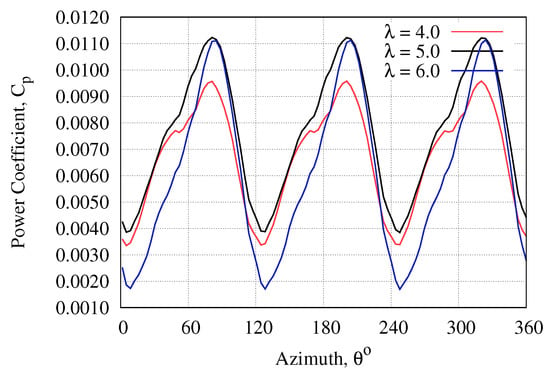
Figure 25.
Power coefficient of a rigid VAWT of radius 1.25 m at angular velocity of 54 rpm through a complete rotation.
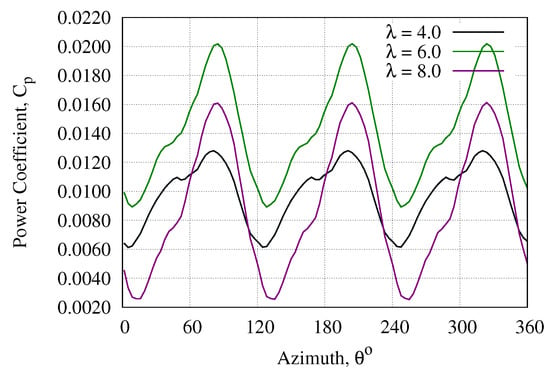
Figure 26.
Power coefficient of a flexible VAWT of radius 1.25 m at angular velocity of 54 rpm through a complete rotation.
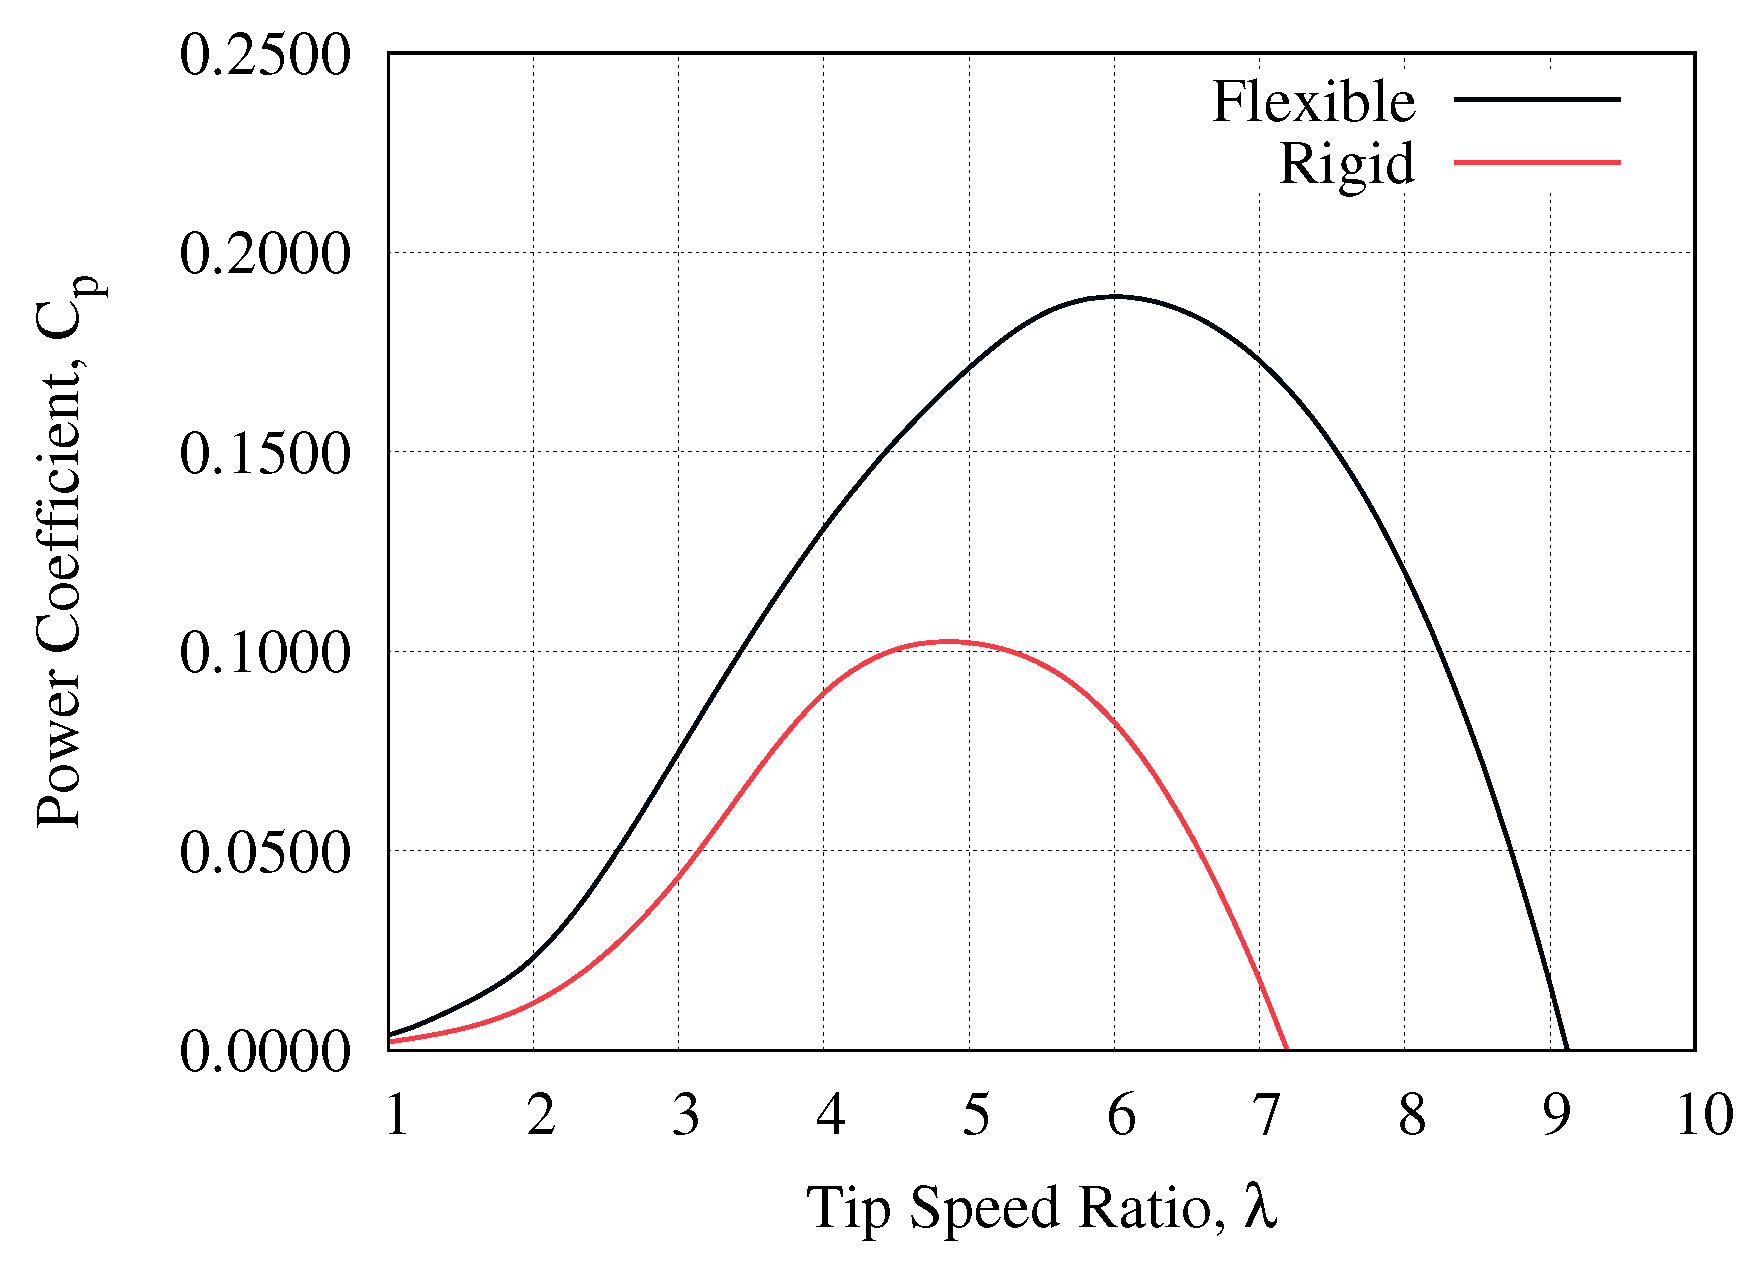
The performance of the flexible and rigid VAWTs are compared for a radius of 1.25 m at 54 rpm in Figure 27. Here, it can be seen that both the maximum power coefficient, and the range of operational tip-speed-ratios, , of the flexible VAWT are higher than that of the rigid VAWT.
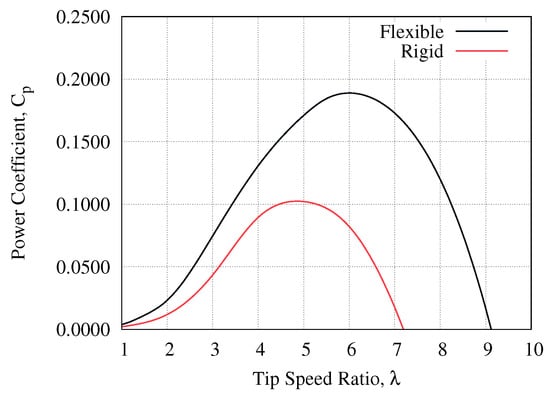
Figure 27.
Power coefficient for rigid and flexible VAWTs of radius 1.25 m at 54 rpm.
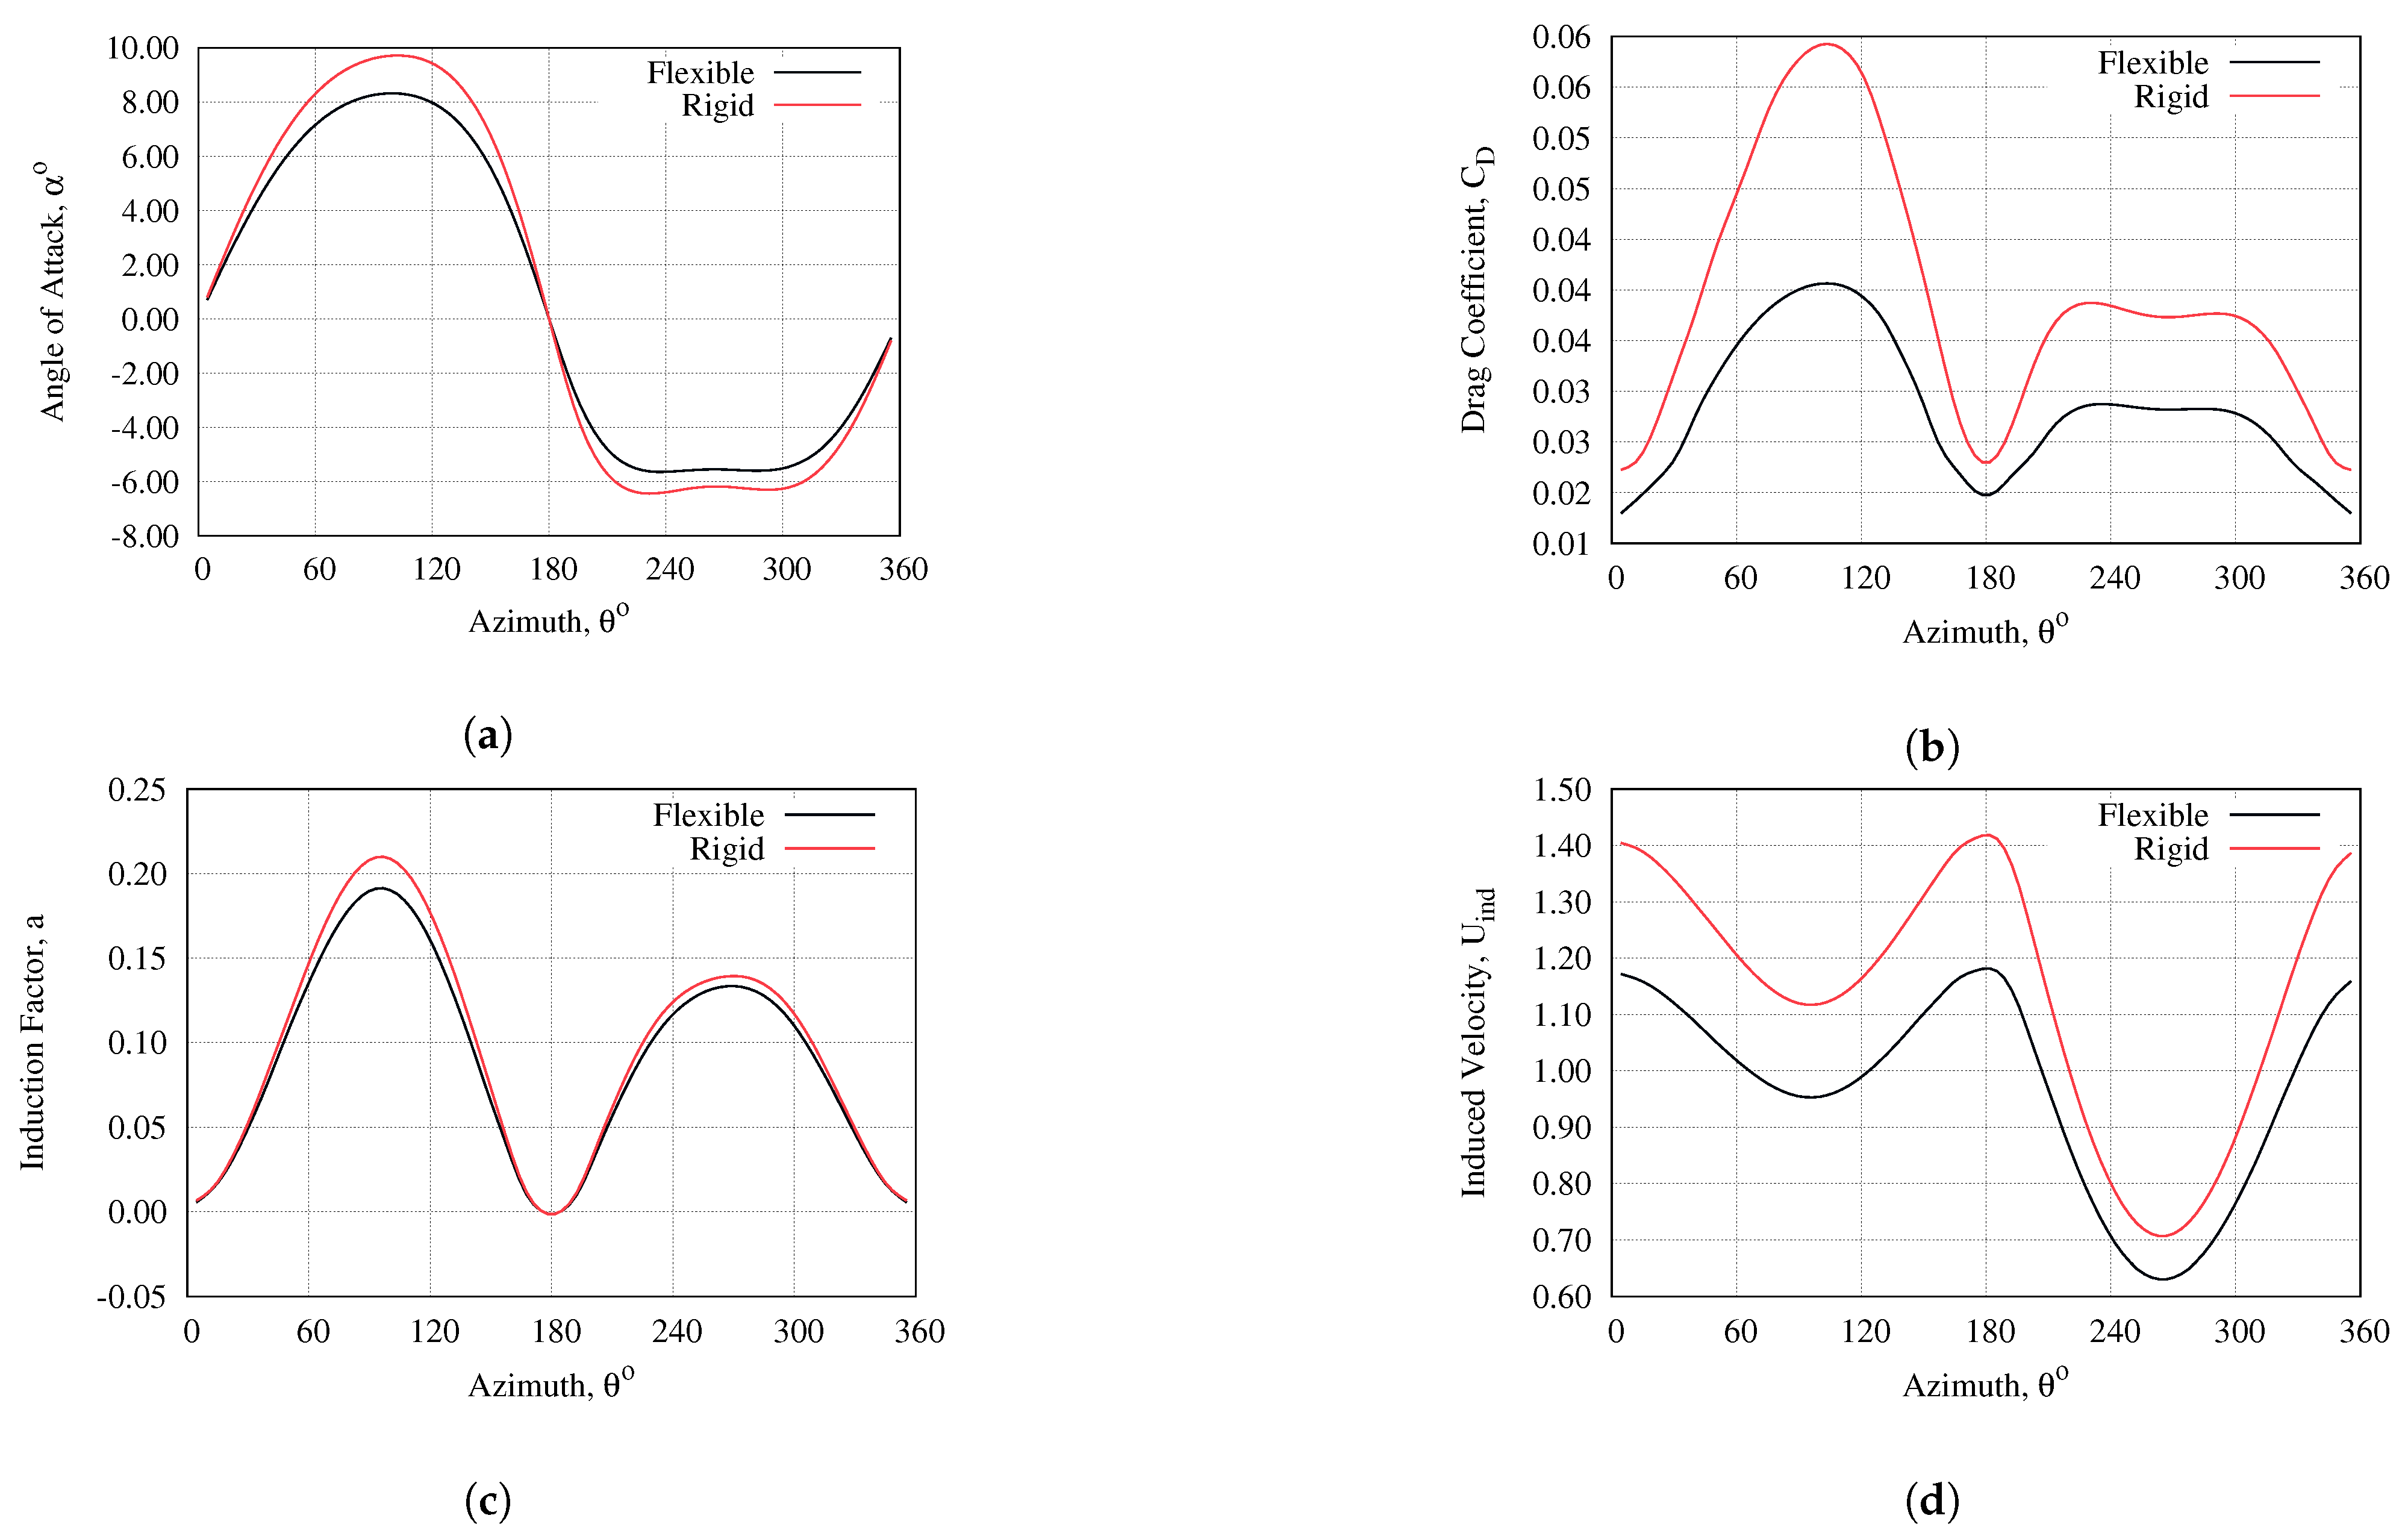
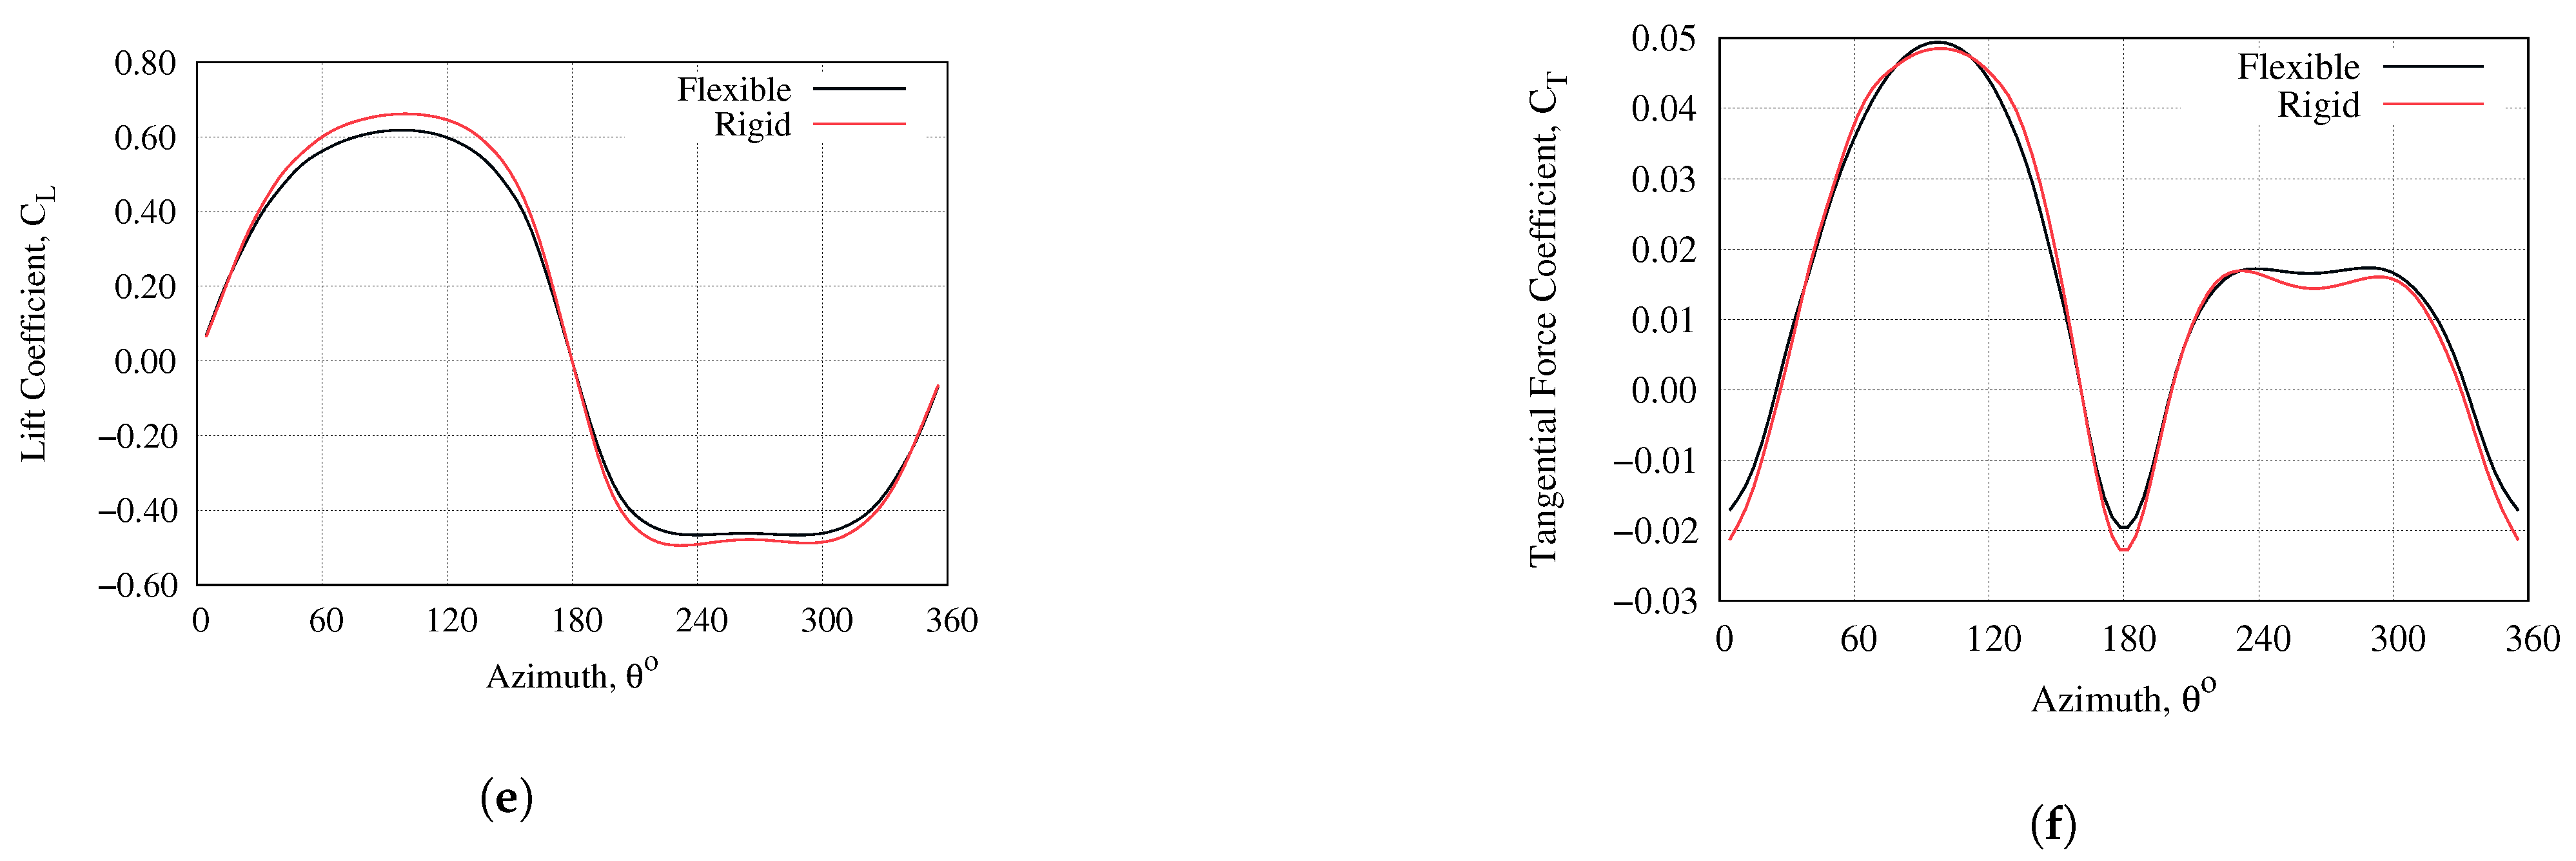
In Figure 28a, the rigid blade’s tends to fall in the stall region in between 90° and 130° based on airfoil lift and drag data, while the flexible blade’s does not. Therefore, the rigid bladed rotor incurs more drag as a drastic rise in for rigid blade can be seen in Figure 28b. The induction factor for the rigid blade is higher compared to the flexible (Figure 28c) meaning higher reduction in the upcoming wind speed during blade interaction. However, the induced velocity, , is still higher (Figure 28d) in the rigid VAWT since its is lower than that of the flexible VAWT. Similarly, the lift coefficient (Figure 28e) in the rigid blade is higher than in the flexible blade. However, the lift-to-drag ratio of flexible blade (Figure 29) surpasses that for the rigid blade; this can be attributed to higher torque (Figure 30) despite the fact that tangential force in the rigid and flexible VAWT are almost similar (Figure 28f).
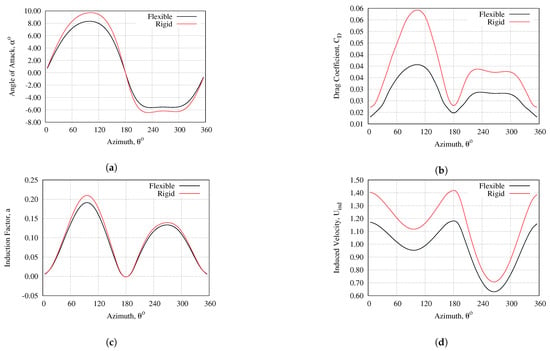
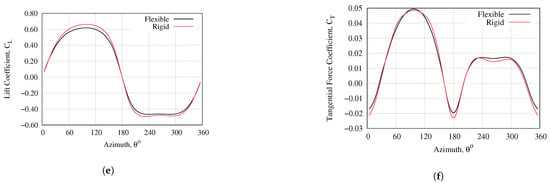
Figure 28.
Comparison of rigid and flexible VAWTs model parameters of radius 1.2 m at angular speed of 54 rpm at their optimal tip speed ratios (: 6.0 for flexible and 5.0 for rigid) for their complete rotation: (a) Angle of attack, (b) Drag coefficient, (c) Induction factor, (d) Induced velocity, (e) Lift coefficient, and (f) Tangential force coefficient.
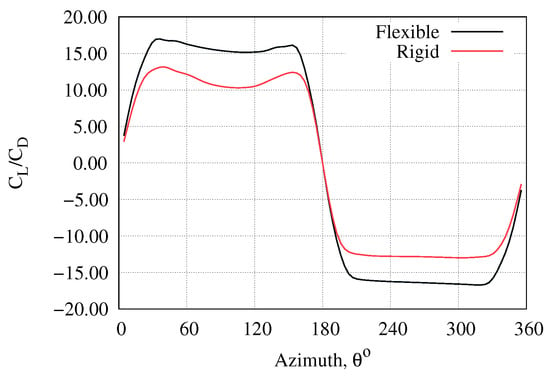
Figure 29.
Lift-to-drag ratio of rigid and flexible VAWTs of radius 1.25 m at an angular speed of 54 rpm at their optimal tip speed ratios (: 6.0 for flexible and 5.0 for rigid).
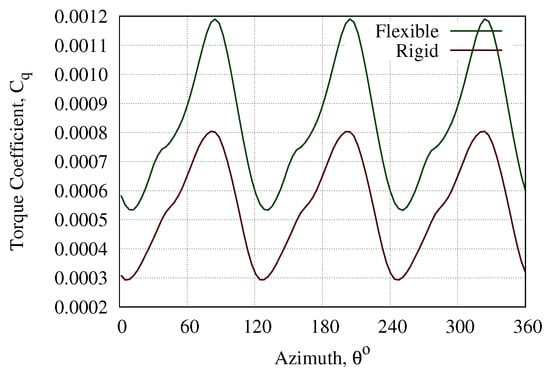
Figure 30.
Torque coefficients of rigid and flexible VAWTs of radius 1.25 m at an angular speed of 54 rpm at their optimal tip speed ratios (: 6.0 for flexible and 5.0 for rigid).
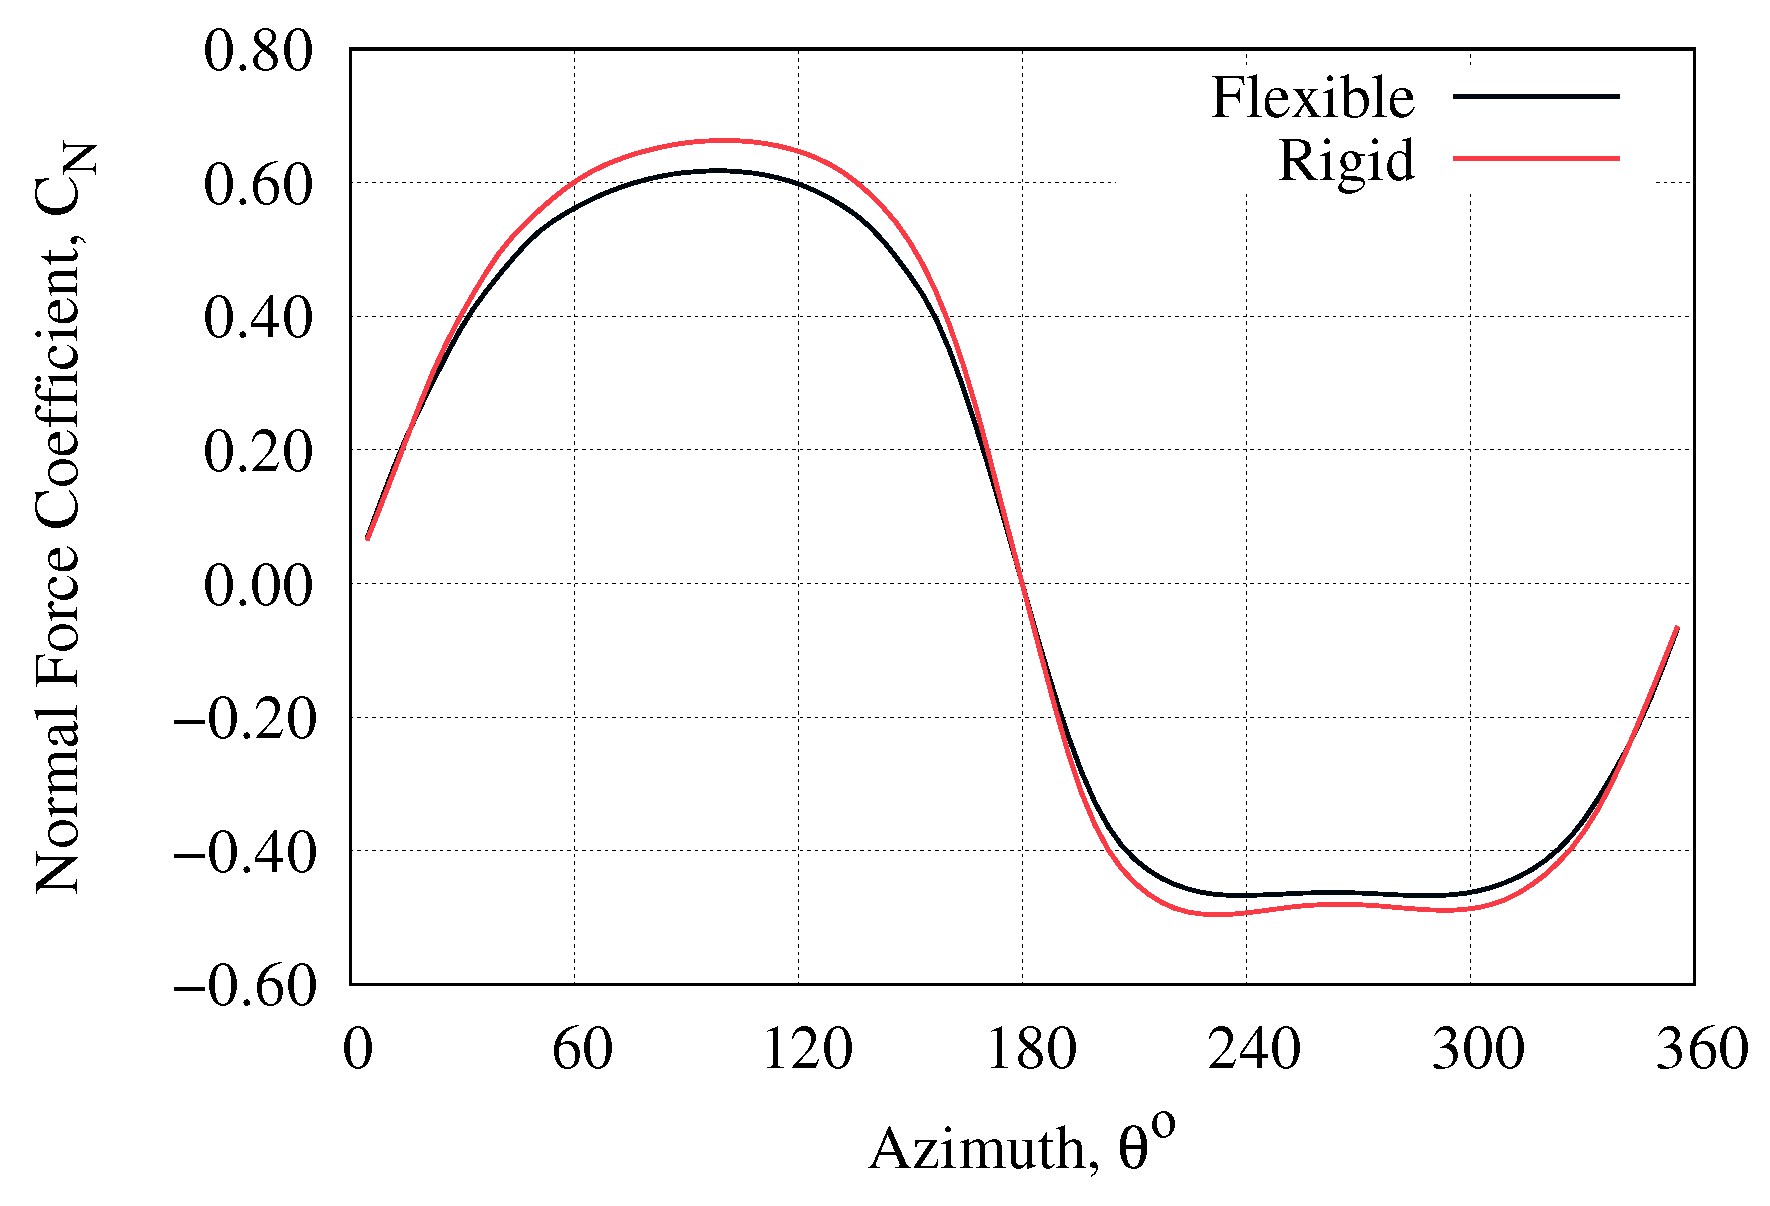
Another important consideration when evaluating VAWT performance is the normal forces experienced by the turbine. This is a known detriment since cyclic loading of the turbine causes fatigue and failure of components. The normal force coefficient is shown in Figure 31. Unsurprisingly, the flexible blade experiences less drastic changes in normal forces due to its ability to delay stall. As a result, the flexible VAWT produces more power and experiences less normal force fluctuation as compared to the rigid VAWT, which could promote longer lifespan of future flexible-bladed rotors. In fact, the variation in normal force coefficients in this case were reduced by 6.88%.
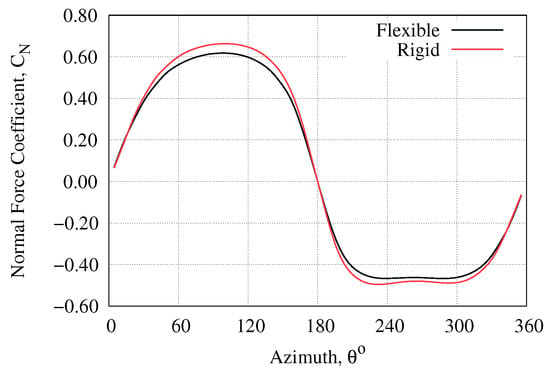
Figure 31.
Normal force coefficients for rigid and flexible VAWTs of radius 1.25 m at an angular speed of 54 rpm at their optimal tip speed ratios (: 6.0 for flexible and 5.0 for rigid).
The performance variation of both VAWTs with the change in radius (in turn, solidity) can be observed from Figure 15, Figure 16 and Figure 17. At low , the effective that the wind flow experiences becomes high (far beyond the stall angle) where high drag dominates. Since flexible blades can change shape chordwise to some extent, they delay the flow separation that takes place in the suction side resulting in a delay in stall. Moreover, the shape adjusts to the pressure difference between its opposite sides (pressure and suction) that decreases the effective drag and increases the lift. This phenomenon helps flexible VAWTs potentially perform better at low , which agrees with the findings from [36].
The performance of rigid VAWTs does not vary wildly with varying radii because of close dimensional similitude. However, flexible VAWTs of radii 1.0 m perform better with as high as 18.9%, in comparison to about 10% of rigid VAWT. Here, the flexible VAWT’s performance is almost twice that of the rigid (90% increase) along with 26.67% increase in operational .
6. Conclusions
This work investigates the performance of flexible and rigid VAWTs. To this end, double multiple stream tube (DMST) analysis has been adopted to quantify VAWT parameters and performance, which require airfoil performance data. Flexible and rigid NACA 0012 airfoils have been tested in an open circuit low-speed wind tunnel to acquire this data across a wide range of angle of attacks and Reynolds numbers. The results of these tests showed that flexible airfoils generally perform better than rigid blades in terms of lift near the stall angle. Additionally, the point of stall is delayed for flexible blades, by around 2° in most cases, and the maximum lift coefficient surpasses that in the rigid blades. This increased lift force is more pronounced for lower Reynolds numbers.
Using the aforementioned airfoil data, VAWTs of varying radii with both flexible and rigid blades are simulated, with varying angular speed and varying freestream velocity, to obtain dimensionless performance curves. Although three shaft speeds were investigated herein, data trends did not change appreciably between these three cases, and as such only the median simulated shaft speed is examined closely in this study. The main findings of this study were as follows:
- Flexible blades have been shown to perform better at high solidity (smaller radius) than rigid ones, at least, for the range of operational conditions possible with wind tunnel data generated herein.
- The operational range () that is, the range of tip-speed ratios where the turbine is expected to produce positive power, is greatly enhanced with the flexible-bladed design. In fact, the maximum operational range was found to be only around 7.2 for the rigid bladed simulations and 9.7 for the flexible-bladed simulations when the turbine radius is 1.5m. This suggests that is may be possible to increase operational tip-speed ratios by at least 40.3% by using flexible-bladed VAWTs.
- The power coefficient or efficiency of the flexible VAWTs was much higher for smaller turbine radius. In fact, for a radius of 1.0m, the rigid VAWT is simulated to have a maximum power coefficient of around only 10%, compared to 18.9% for the flexible VAWT. This results in an astounding 90% increase in efficiency.
- The flexible-bladed VAWTs generally experiences less drastic changes in normal force than rigid, which may contribute to less fatigue over the lifetime of the turbine.
This study is the first attempt in the scientific literature at investigating from a design aspect how flexible blades might be leveraged to increase efficiency or capacity factor for VAWTs. The authors plan to continue work in this facet to further elaborate on how larger VAWTs might benefit from flexible-bladed designs, which may require extensive use of computational fluid dynamics software (i.e., in three dimensions) to facilitate data generation for DMST model input.
Author Contributions
All model development and data generation for this study was performed by L.R., K.K. and R.M. designed experimental apparatus and collected experimental data, respectively. D.W.M. supervised the work and provided guidance. All authors have read and agreed to the published version of the manuscript.
Funding
This research received no external funding.
Conflicts of Interest
The authors declare no conflict of interest.
References
- BloombergNEF. Clean Energy Investment Trends, 2019; Bloomberg Finance L.P.: New York City, NY, USA, 2020. [Google Scholar]
- Fried, L. Global Wind Report; Global Wind Energy Council: Brussels, Belgium, 2018. [Google Scholar]
- Roy, L.; MacPhee, D. Meso-Scale CFD Simulation for Wind Resources: A Case Study of Complex Mountainous Terrain. Energies 2018, 11, 1366. [Google Scholar] [CrossRef]
- IRENA. Renewable Power Generation Costs in 2019; International Renewable Energy Agency: Abu Dhabi, United Arab Emirates, 2020. [Google Scholar]
- Timmer, J. Wind Power Prices Now Lower than the Cost of Natural Gas; ArsTechnica: New York City, NY, USA, 2019. [Google Scholar]
- Letcher, T.M. Wind Energy Engineering: A Handbook for Onshore and Offshore Wind Turbines; Academic Press: Cambridge, MA, USA, 2017. [Google Scholar]
- MacPhee, D.; Beyene, A. Recent advances design of vertical axis wind turbines. Wind Eng. 2012, 36, 647–665. [Google Scholar] [CrossRef]
- Jacobson, R. Where Do Wind Turbines Go to Die? Inside Energy: Denver, CO, USA, 2016. [Google Scholar]
- Veers, P. Fatigue loading of wind turbines. In Wind Energy Systems; Elsevier: Amsterdam, The Netherlands, 2011; pp. 130–158. [Google Scholar]
- Tjiu, W.; Marnoto, T.; Mat, S.; Ruslan, M.H.; Sopian, K. Darrieus vertical axis wind turbine for power generation I: Assessment of Darrieus VAWT configurations. Renew. Energy 2015, 75, 50–67. [Google Scholar] [CrossRef]
- Marinić-Kragić, I.; Vučina, D.; Milas, Z. Concept of flexible vertical-axis wind turbine with numerical simulation and shape optimization. Energy 2019, 167, 841–852. [Google Scholar] [CrossRef]
- Bhutta, M.M.A.; Hayat, N.; Farooq, A.U.; Ali, Z.; Jamil, S.R.; Hussain, Z. Vertical axis wind turbine—A review of various configurations and design techniques. Renew. Sustain. Energy Rev. 2012, 16, 1926–1939. [Google Scholar] [CrossRef]
- Kumar, R.; Raahemifar, K.; Fung, A.S. A critical review of vertical axis wind turbines for urban applications. Renew. Sustain. Energy Rev. 2018, 89, 281–291. [Google Scholar] [CrossRef]
- Amano, R.S. Review of wind turbine research in 21st century. J. Energy Resour. Technol. 2017, 139, 050801. [Google Scholar] [CrossRef]
- Scheurich, F.; Fletcher, T.M.; Brown, R.E. Simulating the aerodynamic performance and wake dynamics of a vertical-axis wind turbine. Wind Energy 2011, 14, 159–177. [Google Scholar] [CrossRef]
- Jha, A.R. Wind Energy Technology; Taylor & Francis: Abingdon, UK, 2011. [Google Scholar]
- Galinos, C.; Larsen, T.J.; Madsen, H.A.; Paulsen, U.S. Vertical axis wind turbine design load cases investigation and comparison with horizontal axis wind turbine. Energy Procedia 2016, 94, 319–328. [Google Scholar] [CrossRef]
- Scheurich, F.; Fletcher, T.; Brown, R. The influence of blade curvature and helical blade twist on the performance of a vertical-axis wind turbine. In Proceedings of the 48th AIAA Aerospace Sciences Meeting Including the New Horizons Forum and Aerospace Exposition, Orlando, FL, USA, 4–7 January 2010; p. 1579. [Google Scholar]
- Douak, M.; Aouachria, Z.; Rabehi, R.; Allam, N. Wind energy systems: Analysis of the self-starting physics of vertical axis wind turbine. Renew. Sustain. Energy Rev. 2018, 81, 1602–1610. [Google Scholar] [CrossRef]
- Du, L.; Ingram, G.; Dominy, R.G. Experimental study of the effects of turbine solidity, blade profile, pitch angle, surface roughness, and aspect ratio on the H-Darrieus wind turbine self-starting and overall performance. Energy Sci. Eng. 2019, 7, 2421–2436. [Google Scholar] [CrossRef]
- Ostos, I.; Ruiz, I.; Gajic, M.; Gómez, W.; Bonilla, A.; Collazos, C. A modified novel blade configuration proposal for a more efficient VAWT using CFD tools. Energy Convers. Manag. 2019, 180, 733–746. [Google Scholar] [CrossRef]
- Tian, W.; Mao, Z.; Ding, H. Numerical study of a passive-pitch shield for the efficiency improvement of vertical axis wind turbines. Energy Convers. Manag. 2019, 183, 732–745. [Google Scholar] [CrossRef]
- Mohamed, M. Performance investigation of H-rotor Darrieus turbine with new airfoil shapes. Energy 2012, 47, 522–530. [Google Scholar] [CrossRef]
- Danao, L.A.; Qin, N.; Howell, R. A numerical study of blade thickness and camber effects on vertical axis wind turbines. Proc. Inst. Mech. Eng. Part A J. Power Energy 2012, 226, 867–881. [Google Scholar] [CrossRef]
- Subramanian, A.; Yogesh, S.A.; Sivanandan, H.; Giri, A.; Vasudevan, M.; Mugundhan, V.; Velamati, R.K. Effect of airfoil and solidity on performance of small scale vertical axis wind turbine using three dimensional CFD model. Energy 2017, 133, 179–190. [Google Scholar] [CrossRef]
- Glauert, H. The Handley Page Slotted Wing; HM Stationery Office: London, UK, 1922. [Google Scholar]
- Xiao, Q.; Liu, W.; Incecik, A. Flow control for VATT by fixed and oscillating flap. Renew. Energy 2013, 51, 141–152. [Google Scholar] [CrossRef]
- Chougule, P.D.; Rosendahl, L.; Nielsen, S.R. Experimental study of the effect of a slat angle on double-element airfoil and application in vertical axis wind turbine. Ships Offshore Struct. 2015, 10, 176–182. [Google Scholar] [CrossRef]
- Smith, A.O. High-lift aerodynamics. J. Aircr. 1975, 12, 501–530. [Google Scholar] [CrossRef]
- Paraschivoiu, I.; Trifu, O.; Saeed, F. H-Darrieus wind turbine with blade pitch control. Int. J. Rotating Mach. 2009, 2009, 505343. [Google Scholar] [CrossRef]
- Bos, R. Self-Starting of Small Urban Darrieus Rotor. Ph.D. Thesis, Delft University of Technology, Delft, The Netherlands, 2012. [Google Scholar]
- Kincaid, K.C.; MacPhee, D.W. Numerical Fluid—Structure Interaction Analysis of a Wells Turbine With Flexible Blades. J. Energy Resour. Technol. 2020, 142, 081305. [Google Scholar] [CrossRef]
- MacPhee, D.W.; Beyene, A. Performance analysis of a small wind turbine equipped with flexible blades. Renew. Energy 2019, 132, 497–508. [Google Scholar] [CrossRef]
- MacPhee, D.W.; Beyene, A. Fluid–Structure interaction analysis of a morphing vertical axis wind turbine. J. Fluids Struct. 2016, 60, 143–159. [Google Scholar] [CrossRef]
- Hoogedoorn, E.; Jacobs, G.B.; Beyene, A. Aero-elastic behavior of a flexible blade for wind turbine application: A 2D computational study. Energy 2010, 35, 778–785. [Google Scholar] [CrossRef]
- Butbul, J.; MacPhee, D.; Beyene, A. The impact of inertial forces on morphing wind turbine blade in vertical axis configuration. Energy Convers. Manag. 2015, 91, 54–62. [Google Scholar] [CrossRef]
- Hirsch, I.H.; Mandal, A. A cascade theory for the aerodynamic performance of Darrieus wind turbines. Wind Eng. 1987, 11, 164–175. [Google Scholar]
- Strickland, J.H.; Webster, B.T.; Nguyen, T. A Vortex Model of the Darrieus Turbine: An Analytical and Experimental Study. J. Fluids Eng. 1979, 101, 500–505. [Google Scholar] [CrossRef]
- Dixon, K.; Simao Ferreira, C.; Hofemann, C.; Van Bussel, G.; Van Kuik, G. A 3D unsteady panel method for vertical axis wind turbines. In The Proceedings of the European Wind Energy Conference & Exhibition EWEC Brussels; European Wind Energy Association EWEA: Brussels, Belgium, 2008; pp. 1–10. [Google Scholar]
- Xu, Y.L.; He, J. Smart Civil Structures; CRC Press: Boca Raton, FL, USA, 2017. [Google Scholar]
- Badshah, M.; Badshah, S.; Jan, S. Comparison of computational fluid dynamics and fluid structure interaction models for the performance prediction of tidal current turbines. J. Ocean. Eng. Sci. 2020, 5, 164–172. [Google Scholar] [CrossRef]
- Moghimi, M.; Motawej, H. Developed DMST model for performance analysis and parametric evaluation of Gorlov vertical axis wind turbines. Sustain. Energy Technol. Assess. 2020, 37, 100616. [Google Scholar] [CrossRef]
- Paraschivoiu, I. Wind Turbine Design: With Emphasis on Darrieus Concept; Polytechnic International Press: Montréal, QC, Canada, 2002. [Google Scholar]
- Beri, H.; Yao, Y. Double Multiple Streamtube Model and Numerical Analysis of Vertical Axis Wind Turbine. Energy Power Eng. 2011, 3, 262. [Google Scholar] [CrossRef]
- Paraschivoiu, I. Double-Multiple Streamtube Model for Darrieus in Turbines; Hydro-Québec Research Institute: Montréal, QC, Canada, 1981. [Google Scholar]
- Attia, E.A.; Saber, H.; El Gamal, H. Performance and dynamic characteristics of a multi stages vertical axis wind turbine. J. Vibroeng. 2016, 18, 4015–4032. [Google Scholar] [CrossRef]
- Ayala, M.; Maldonado, J.; Paccha, E.; Riba, C. Wind power resource assessment in complex terrain: Villonaco case-study using computational fluid dynamics analysis. Energy Procedia 2017, 107, 41–48. [Google Scholar] [CrossRef]
- Glauert, H. Aerodynamic theory. Aeronaut. J. 1930, 34, 409–414. [Google Scholar] [CrossRef]
- Islam, M. Analysis of Fixed-Pitch Straight-Bladed VAWT with Asymmetric Airfoils. Ph.D. Thesis, University of Windsor, Windsor, ON, Canada, 2008. [Google Scholar]
- Viterna, L.A.; Janetzke, D.C. Theoretical and Experimental Power from Large Horizontal-Axis Wind Turbines; Technical Report; National Aeronautics and Space Administration: Cleveland, OH, USA, 1982.
- Montgomerie, B. Methods for Root Effects, Tip Effects and Extending the Angle of Attack Range to ±180 deg, with Application to Aerodynamics for Blades on Wind Turbines and Propellers; Report No. FOI; FOI, Swedish Defence Research Agency: Stockholm, Sweden, 2004.
- Kirke, B.K. Evaluation of Self-Starting Vertical Axis Wind Turbines for Stand-Alone Applications. Ph.D. Thesis, Griffith University Australia, Brisbane, Australia, 1998. [Google Scholar]
- Beans, E.W.; Jakubowski, G.S. Method for estimating the aerodynamic coefficients of wind turbine blades at high angles of attack. J. Energy 1983, 7, 747–749. [Google Scholar] [CrossRef]
- Bianchini, A.; Balduzzi, F.; Rainbird, J.M.; Peiro, J.; Graham, J.M.R.; Ferrara, G.; Ferrari, L. An Experimental and Numerical Assessment of Airfoil Polars for Use in Darrieus Wind Turbines—Part II: Post-Stall Data Extrapolation Methods. J. Eng. Gas Turbines Power 2016, 138, 032603. [Google Scholar] [CrossRef]
- Mahmuddin, F.; Klara, S.; Sitepu, H.; Hariyanto, S. Airfoil lift and drag extrapolation with viterna and montgomerie methods. Energy Procedia 2017, 105, 811–816. [Google Scholar] [CrossRef]
- Klimes, R.; Sheldahl, P. Aerodynamic Characteristics of Seven Symmetrical Airfoil Sections through 180 Degree Angle of Attack for Use in Aerodynamic Analysis of Vertical Axis Wind Turbines; Sandia National Laboratories: Albuquerque, NM, USA, 1981. [Google Scholar]
- Kashitani, M.; Miura, K.; Nakao, S.; Yamaguchi, Y. Effects of aspect ratio in a transonic shock tube airfoil flow. J. Therm. Sci. 2012, 21, 435–440. [Google Scholar] [CrossRef]
- Thom, A. Blockage Corrections in a Closed High-Speed Tunnel; ARC R&M No. 2033; Aeronautical Research Council: UK, 1943. [Google Scholar]
- Barlow, J.B.; Rae, J.W.H.; Pope, A. Low-Speed Wind Tunnel Testing; John Wiley & Sons: Hoboken, NJ, USA, 1999. [Google Scholar]
- Pope, A.; Harper, J.J. Low Speed Wind Tunnel Testing; John Wiley and Sons: New York, NY, USA, 1966. [Google Scholar]
- Kjellin, J.; Bülow, F.; Eriksson, S.; Deglaire, P.; Leijon, M.; Bernhoff, H. Power coefficient measurement on a 12 kW straight bladed vertical axis wind turbine. Renew. Energy 2011, 36, 3050–3053. [Google Scholar] [CrossRef]
- MacPhee, D.; Beyene, A. Fluid–structure interaction of a morphing symmetrical wind turbine blade subjected to variable load. Int. J. Energy Res. 2013, 37, 69–79. [Google Scholar] [CrossRef]
- Ahmadi-Baloutaki, M.; Carriveau, R.; Ting, D.S. Straight-bladed vertical axis wind turbi design guide based on aerodynamic performance and loading analysis. Proc. Inst. Mech. Eng. Part A J. Power Energy 2014, 228, 742–759. [Google Scholar] [CrossRef]
- Templin, R. Aerodynamic Performance Theory for the NRC Vertical-Axis Wind Turbine; NASA STI/RECON Technical Report No. N; National Aeronautical Establishment: Ottawa, ON, Canada, 1974; Volume 76. [Google Scholar]
Publisher’s Note: MDPI stays neutral with regard to jurisdictional claims in published maps and institutional affiliations. |
© 2021 by the authors. Licensee MDPI, Basel, Switzerland. This article is an open access article distributed under the terms and conditions of the Creative Commons Attribution (CC BY) license (http://creativecommons.org/licenses/by/4.0/).

