Article

CFD Modeling of Hydrocyclones—A Study of Efficiency of Hydrodynamic Reservoirs

by
Marvin Durango-Cogollo
1,
Jose Garcia-Bravo
2,
Brittany Newell
2 and
Andres Gonzalez-Mancera
1,*
1
Department of Mechanical Engineering, Universidad de Los Andes, 111711 Bogota, Colombia
2
School of Engineering Technology, Purdue University, West Lafayette, IN 47907, USA
*
Author to whom correspondence should be addressed.
Fluids 2020, 5(3), 118; https://doi.org/10.3390/fluids5030118
Submission received: 22 May 2020 / Revised: 11 July 2020 / Accepted: 12 July 2020 / Published: 21 July 2020
(This article belongs to the Special Issue Advances in Numerical Methods for Multiphase Flows)

Abstract

:
The dynamics of hydrocyclones is complex, because it is a multiphase flow problem that involves interaction between a discrete phase and multiple continuum phases. The performance of hydrocyclones is evaluated by using Computational Fluid Dynamics (CFD), and it is characterized by the pressure drop, split water ratio, and particle collection efficiency. In this paper, a computational model to improve and evaluate hydrocyclone performance is proposed. Four known computational turbulence models (renormalization group (RNG) k- ε , Reynolds stress model (RSM), and large-eddy simulation (LES)) are implemented, and the accuracy of each for predicting the hydrocyclone behavior is assessed. Four hydrocyclone configurations were analyzed using the RSM model. By analyzing the streamlines resulting from those simulations, it was found that the formation of some vortices and saddle points affect the separation efficiency. Furthermore, the effects of inlet width, cone length, and vortex finder diameter were found to be significant. The cut-size diameter was decreased by 33% compared to the Hsieh experimental hydrocyclone. An increase in the pressure drop leads to high values of cut-size and classification sharpness. If the pressure drop increases to twice its original value, the cut-size and the sharpness of classification are reduced to less than 63% and 55% of their initial values, respectively.

Graphical Abstract

1. Introduction

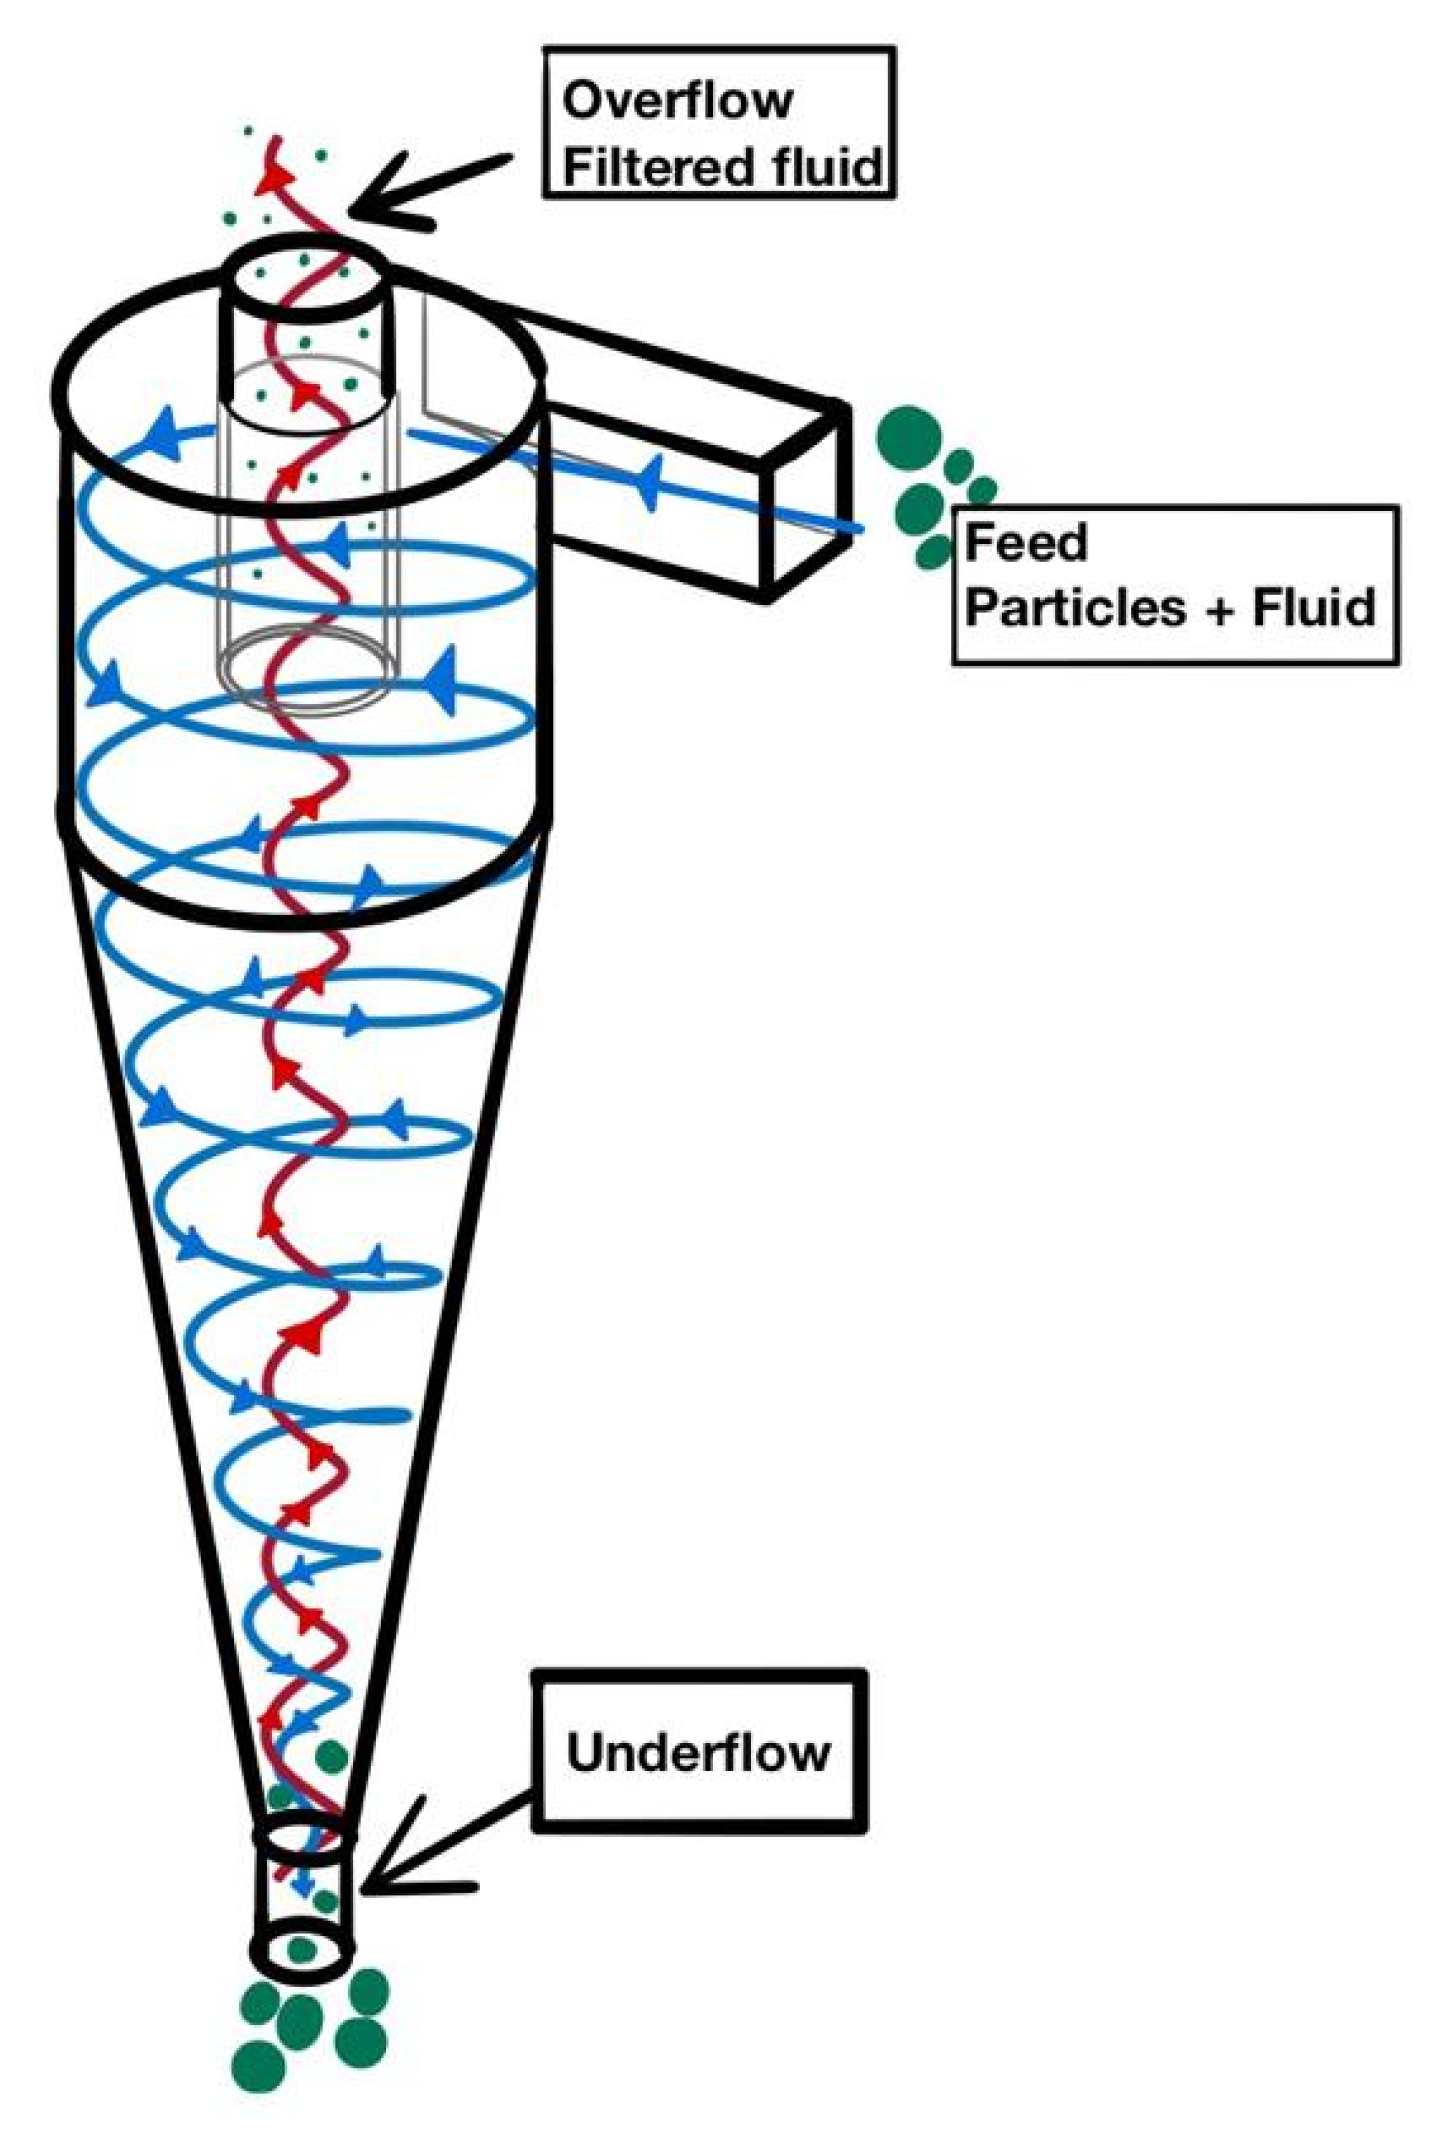
Hydrocyclones are useful devices for removing particles from liquids via a centrifugal field. In general, larger particles are mostly trapped in the underflow, while the lighter ones go to the overflow with most of the working fluid exiting, as can be observed in Figure 1. Some advantages of these devices are the low operation and maintenance cost and no moving parts. They also have widespread applications in the mining and oil industry. In the past decade, the main challenge for these devices has been to minimize the pressure drop and maximize the separation efficiency to improve hydrocyclone performance.
The d50 (cut size) parameter is a key factor in hydrocyclone performance. The cut size is defined as the size at which a particle has a 50% probability of leaving the hydrocyclone through either the underflow or overflow. This factor is correlated with the collection efficiency, which indicates the number of particles that move toward the underflow. Finally, another critical factor is the pressure drop, which is an indicator of how much energy the hydrocyclone wastes, as a measure of the main system’s loss.
The main assessment tools used to analyze hydrocyclone performance are laboratory measurements and numerical methods such as Computational Fluid Dynamics (CFD). Compared to experimental procedures, numerical methods cost less and save time. Moreover, CFD has proved to be a reliable tool when used with a suitable choice of turbulence models. The most accurate and frequently implemented models are renormalization group (RNG) k- ε [1], the Reynolds stress model (RSM) [2], and large-eddy simulation (LES) [1,3].
Hsieh [4] built a hydrocyclone prototype and proposed a computational model based on the finite difference method. This study is considered a benchmark for analyzing the role of pattern flows in particle classification, which makes it valuable for evaluating new work in this area. Later work such as that presented in [3,5,6] used Hsieh’s data for the validation of their numerical models. These studies concluded that only two turbulence models—RSM and LES—are able to model the anisotropy of the turbulent flow in hydrocyclones and thus accurately capture its flow dynamics. These two models, combined with the volume of fluid (VOF) multiphase model, can replicate the velocity profiles, air core diameter, and split water flow typically seen in a hydrocyclone. VOF tracks free surface or fluid interfaces. This technique is based on an Eulerian approach, and it is suitable not only for capturing the interface between the air core and the water in the hydrocyclone, but it is also less diffusive than other multiphase models such as the mixture model.
Despite multiple studies on hydrocyclone modeling, there is no unified methodology to evaluate the performance of these devices. In an attempt to create a standardized computational model and experimental method to characterize performance, numerous researchers have continued validating and testing new approaches to model hydrocyclone performance [1,7,8,9], However, the majority of the work has consisted of experimental procedures. Commercially available hydrocyclones are based on traditional models, such as the Rietema and the Bradley design [10,11]. These commercial designs propose relations between the inlet diameter, vortex finder diameter, and cone angle. Such relations have remained invariant over the last two decades. This has encouraged academics to explore whether these parameters are adequate to operate a hydrocyclone at its best efficiency point.
Tang et al. [12] showed that a decrease in the size of the inlet nozzle leads to an increase in separation efficiency and a decrease in d50, but with this change, there is an evident effect on the increase in pressure drop. A better separation efficiency results in higher pressure drop values. Sun et al. [13] performed a multi-objective optimization; the variables they optimized were the pressure drop and the collection efficiency. In that study, it was found that the inlet and vortex finder diameter were significant factors in hydrocyclone performance. This study showed that increasing the size of the vortex finder leads to a decrease in separation efficiency as well as an increase in pressure drop.
The work of Vakamalla et al. [1] proposed working with parabolic profiles instead of a conical section. In order to reduce the computational time in CFD simulations, the air core was replaced by a physical rod. This simplified the simulation by converging faster and therefore allowing more simulations to be performed. However, that approach led to inaccurate estimations of the velocity profiles, pressure drop, and separation efficiency.
From the literature reviewed, it was found that the amount of hydrocyclone parameters result in many configurations that need to be evaluated. It is necessary to understand the role of individual geometric dimensions and their interactions on hydrocyclone performance and hence, finding the optimal design for certain specific operating conditions. Using the preceding principles, the main goals of this paper are to: (1) develop a computational model that evaluates and potentially helps to improve the performance of hydrocyclones and (2) analyze how structures (saddle point and vortices) could affect the performance of hydrocyclones as they are evaluated in different geometrical configurations.

2. Methodology

2.1. Computational Fluid Dynamics

Since the flow in the hydrocyclone is turbulent, it is necessary to determine what turbulence model is suitable to replicate the hydrodynamic behavior within the device. RNG k-   ε , RSM, and LES are the turbulent models evaluated in the present work. To check their accuracy, the obtained results from those models are compared against the experimental data by Hsieh [4].
Based on Reynolds decomposition, it is possible to split the instantaneous velocity into an averaged velocity u i ¯ and the fluctuating component of the velocity u i . Hence, the momentum equation for an incompressible fluid can be written as follows:
u = u ¯ i + u i
ρ t + ( u i ) x i = 0
( ρ u i ¯ ) t + (   ρ u i ¯ u j ¯ ) x i = p ¯ x i +   x j ( μ u i ¯ x j ) + ( ρ   u i u j ¯ ) t + ρ g i .
The term ( ρ u i u j ¯ ) from Equation (3) is known as the Reynolds stress tensor, which leads to the turbulent closure problem. In consequence, in order to complete the equations, the tensor must be modeled.

2.1.1. RNG k- ε

RNG, also known as the renormalization group, is a variant of the original k- ε model that considers the effects of rotation in the closing equations of turbulence. Using this model, the authors of [5] and [1] have found that the predictive advantages of this model for modeling hydrocyclones are not sufficient to calculate the pressure gradient, velocity profiles, and air core formation accurately. However, RNG k- ε was found by the authors to be useful to initialize the flow in order to reduce the computational time the solution takes to converge in LES simulations.
It is well known that turbulence is affected by rotation. The CFD modeling software Ansys© (Fluent, 2006) [14] proposes that when using RNG k- ε to model swirling flows, the effective turbulent viscosity is calculated based on the rotational tensor, a swirl factor ( α ), and the turbulent viscosity ( μ t 0 ) . This modification takes the following form:
μ t = μ t 0 f ( α , k / ε ,   Ω ) .
The software documentation recommends values not greater than 0.07 for weakly to moderately swirling flows [14]. However, the hydrocyclone develops a strong swirling flow. For this case, the software suggests using a larger value, but it does not specify a value. As a consequence, the model in this study was calibrated using a trial and error process. After this process, it was found that the value of the constant α must be around 0.7; otherwise, there would not be a formation of the air core.
RNG k- ε is considered a two-equation model, where turbulent kinetic energy and the dissipation rate of energy are modeled as follows:
k t + u j ¯ k x j = ν T [ ( u i ¯ x j + u j ¯ x i ) u i ¯ x j ] ε + x j [ ( ν + v T σ k ) k x j ]  
ε t + u j ¯ ε x j = C ϵ , 1 ν T ε k [ ( u i ¯ x j + u j ¯ x i ) u i ¯ x j ] C ε , 2 ε 2 k + x j [ ( ν + v T σ k ) ε x j ] S ε .
The terms on the left of Equation (5) describe the accumulation and convection of dissipation energy. On the right side, the first three terms represent the production, dissipation, and diffusion of dissipation energy. The latter term is known as a source term and is described by the following expression:
S ε = c μ ( k ε 2 S i j S i j ) 2 ( 1 k ε 2 S i j S i j η 0 ) ε 1 + β ( k ε 2 S i j S i j ) 2 k   .
In Equation (7), the terms c μ   and   β are constant. This source term is unique for RNG k- ε . As Stendal [15] pointed out, the source term results in less disruption of ε (energy dissipation). Thus, less energy will be dissipated into heat. This implies that the RNG k- ε model is less dissipative than the other two-equation models. As a result of this phenomenon, this turbulence model is suitable to describe swirling pattern flows.

2.1.2. RSM—Transport Equation for Reynolds Stress Model

The accuracy of prediction of the RSM for hydrocyclones was demonstrated by [16]. The RSM model considers the anisotropic characteristic of the flow due to the fluid movement inside the hydrocyclone being highly turbulent. This turbulence model does not include the Boussinesq assumption. On the contrary, in this model, the term ( ρ u i u j ¯ ) is expressed by the transport equation below:
t ( ρ u i u j ¯ ) + x i (   ρ u k u i u j ¯ ) = D T , i j + P i j + ϕ i j + ε e + F i j .
The term on the right-hand side is:
Turbulence Diffusion
D T , i j   = x j [ ρ u i u j u k ¯ + p ( δ i j u i + δ i j u j ) ¯ ]
Stress Production
P i j = ρ ( u i u k ¯ u i x k + u j u k ¯ u i x k )  
Pressure Strain
ϕ i j = p   ( u i   x j + u j   x i )
Dissipation term
ε i j = 2 μ u i x j u j x i ¯
Rotation Production
F i j = 2 ρ Ω k ( u j u m ¯ ε i k m + u i u m ¯ ε j k m )
To determine the pressure strain term, the Quadratic Pressure–Strain model was enabled. In addition, the boundary condition at the walls was treated by the standard wall function [17].

2.1.3. Large-Eddy Simulation (LES)

In this model, the Navier–Stokes equations are computed directly without any approximation on the large turbulence scales; the smaller scales are modeled as described in Equations (14)–(17). LES is based on the principle that larger turbulence scales are those that carry most of the momentum. LES is expected to give more accurate results compared to any models of the RANS family since it involves less modeling.
The disadvantage of LES is its high computational cost compared to RANS models, as LES requires a much finer mesh. In theory, the size of the mesh elements ought to be equal or lower than the Kolmogorov [18] length scale. This is required, since the model filters the Navier–Stokes equations from a specific length scale, directly simulating the larger scales and modeling the smaller vortices.
The Navier–Stokes filtered equations are represented below:
Momentum:
( ρ u i ¯ ) t + (   ρ u i ¯ u j ¯ ) x i = p x i +   x j ( μ u i ¯ x j ) τ i j s g s x j + ρ g i .
LES requires a SGS (sub-grid-scale) model to calculate the momentum transfer of scales smaller than the mesh, as can be seen in Equation (14). In this work, the Smagorinsky Lilly SGS model was implemented, where the τ i j s g s is modeled as the product between the turbulent viscosity and the strain rate tensor, which is represented as:
τ i j s g s = μ t ( u i x j + u j x i ) .
The turbulent viscosity is determined algebraically by the following expression:
μ t = ρ L s | S i j | .
L s is usually calculated as the cubic root of the finite volume at each node of the mesh in the high turbulence regions. However, the Ansys© Fluent software recommends calculating it based on the minimum value between the distance from the nearest wall and by the local scale of the mesh, ∆.
L S = m i n ( k d ,   C s Δ 1 / 3 )
C s is the Smagorinsky calibration constant, with a value of 0.1 used in the present paper based on the work presented in [1,6]. However, in the study of DeSouza and Neto [19], the authors suggested that the value of this constant for hydrocyclones should be 0.15, but the tangential velocity profile is slightly overestimated. On the other hand, authors such as Saidi and Farhanieh [20,21] have managed to replicate flow characteristics in hydrocyclones with a dynamic version of the constant. In conclusion, there is no consensus in the literature for the value of the Smagorinksy constant. This implies that the Smagorinsky constant must be calibrated in order to resolve the smallest turbulence length scale accurately.
It is worth clarifying that it is beyond the scope of this study to deepen the understanding of the physical assumptions used for modeling the SGS tensor. The objective is to validate and compare the results for the different turbulence models as commonly reported in published works.

2.1.4. Multiphase Model

The development of the air core is a phenomenon that is part of the hydrocyclone dewatering process. For this work, the VOF (volume of fluid) multiphase model was implemented. In previous works [3,22] this model has been shown to correctly predict the shape and development of the air core. VOF is a technique based on a full Eulerian approach, where the purpose is to trace the interface between two continuous phases. The interface of air and water of the hydrocyclone studied is modeled using transport Equation (18).
α p t + α p u i x i = 0
where α p represents the volume fraction of the nth phase. The average density is described as follows:
ρ = α p ρ w a t e r + ( 1 α p ) ρ a i r .
The RANS–VOF simulation is achieved by Favre Decomposition, as shown in the work by Fan et al. [23], where a formulation for Equation (18) is obtained in terms of an average volume fraction. This formulation is not limited to a RANS turbulence model but can also be applied to LES.

2.1.5. Particle Tracking

When analyzing a hydrocyclone, several governing equations are necessary. The first is the governing equation of particles, and the other is related to the particle–fluid coupling. According to [24], the most prevalent forces in hydrocyclones are drag force, pressure gradient, and the Saffman lift. Hence, the motion equation of particles can be expressed by Equation (20)
d u p d t = ( 1 ρ f ρ p ) g + F D ( u u p ) + P ρ + F s .
F D ( u u p ) is the drag force per unit mass. This force balances with the centrifugal force. The smooth particles are simulated as small spheres, so the F D term can be written as:
F D = 18 μ ρ p d p 2 C D R e 24
where the Reynolds number is:
R e = ρ f d p | u p u | μ .
Then, the drag coefficient is calculated as follows:
C D = a 1 + a 2 R e p + a 3 R e p 2 .
The coefficients a1, a2, and a3 are described by the Morsi–Alexander drag law.
Finally, the Saffman Lift [25] Equation (20) is represented by the formulation:
F s = 9.69 ρ ( ν | d u d y | ) C L S ( u f u p )
where CLS is the Saffman Lift Coefficient [25].
On the other hand, due to particles moving in a fluctuating velocity field, the turbulence effect is considered by enabling the stochastic tracking model. In addition, the DRW (Discrete Random Walk) was implemented in order to calculate the instantaneous velocity field.
The instantaneous velocity is a function of a constant that obeys a Gaussian distribution and the root-mean-square velocity component, as seen in Equation (25).
u = ζ u 2 ¯  
The root-mean-square velocity component can be calculated as follows (assuming isotropic conditions):
u 2 ¯   = v 2 ¯ = w 2 ¯   = 2 k ε   .
In the case of the RSM model, the above expression is modified, so each component depends on the RMS value of the principal diagonal term of the Reynolds Stress tensor.
u = u 2 ¯  
v = v 2 ¯
w = w 2 ¯  
Finally, the interaction of small vortices and particles is considered by defining the lifetime scale of the eddies and the time integration trajectory of particles. The equations of those parameters are described below:
τ e = 2 T l
T l 0.30 k ε .
For LES, the lifetime is equivalent to the LES time scale.

2.2. Numerical Simulation

As mentioned before, hydrocyclones are complex devices that involve many different physical principles, which increase the level of complexity of a stable CFD simulation of them. Previous work [26] suggests a step-by-step methodology that guarantees not only numerical convergence but also enables a further computational model validation of simple to complex cases.
In this work, the steps followed to carry out the simulation are shown in Figure 2. The first step only considers the water phase, and the simulation is carried out in steady state. Once a negative gauge pressure core is developed, the air phase is enabled by setting backflow at both outlets of the hydrocyclone. In the second step, the simulation is allowed to run until it reaches stability. Once the simulation is stable, pressure drop, water separation, and velocity profiles were validated by comparing the results with data from Hsieh’s work. Finally, particles of different sizes are injected over the inlet surface and traced to the underflow. Due to the high computational cost of LES, calculations for this model are initialized using the stable solution obtained using RSM.

2.2.1. Mesh and Geometry

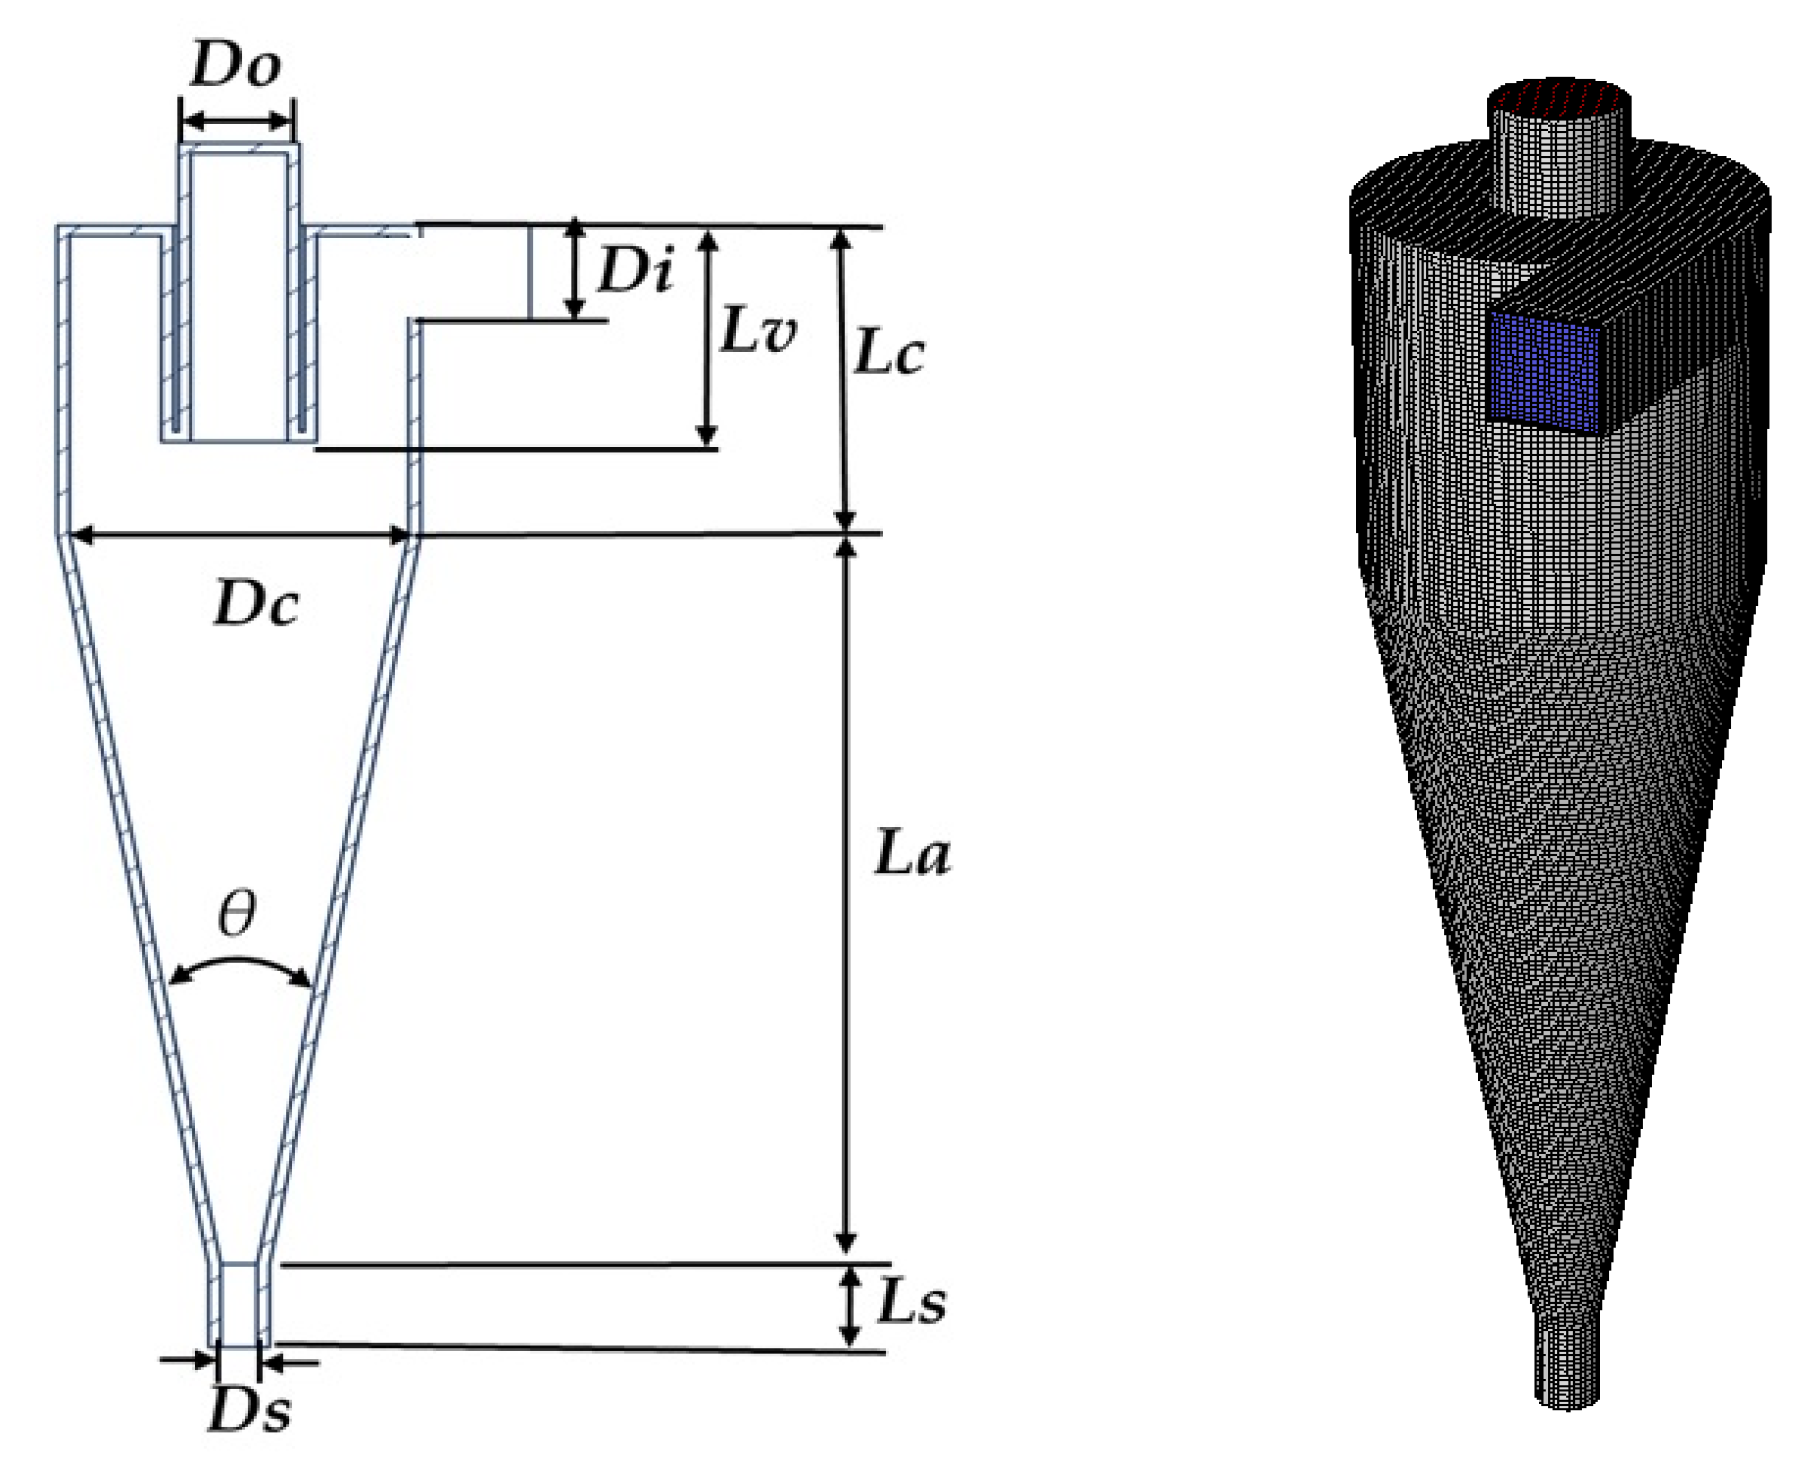
A 75-mm Hsieh hydrocyclone was simulated; the geometrical details are provided in Table 1.
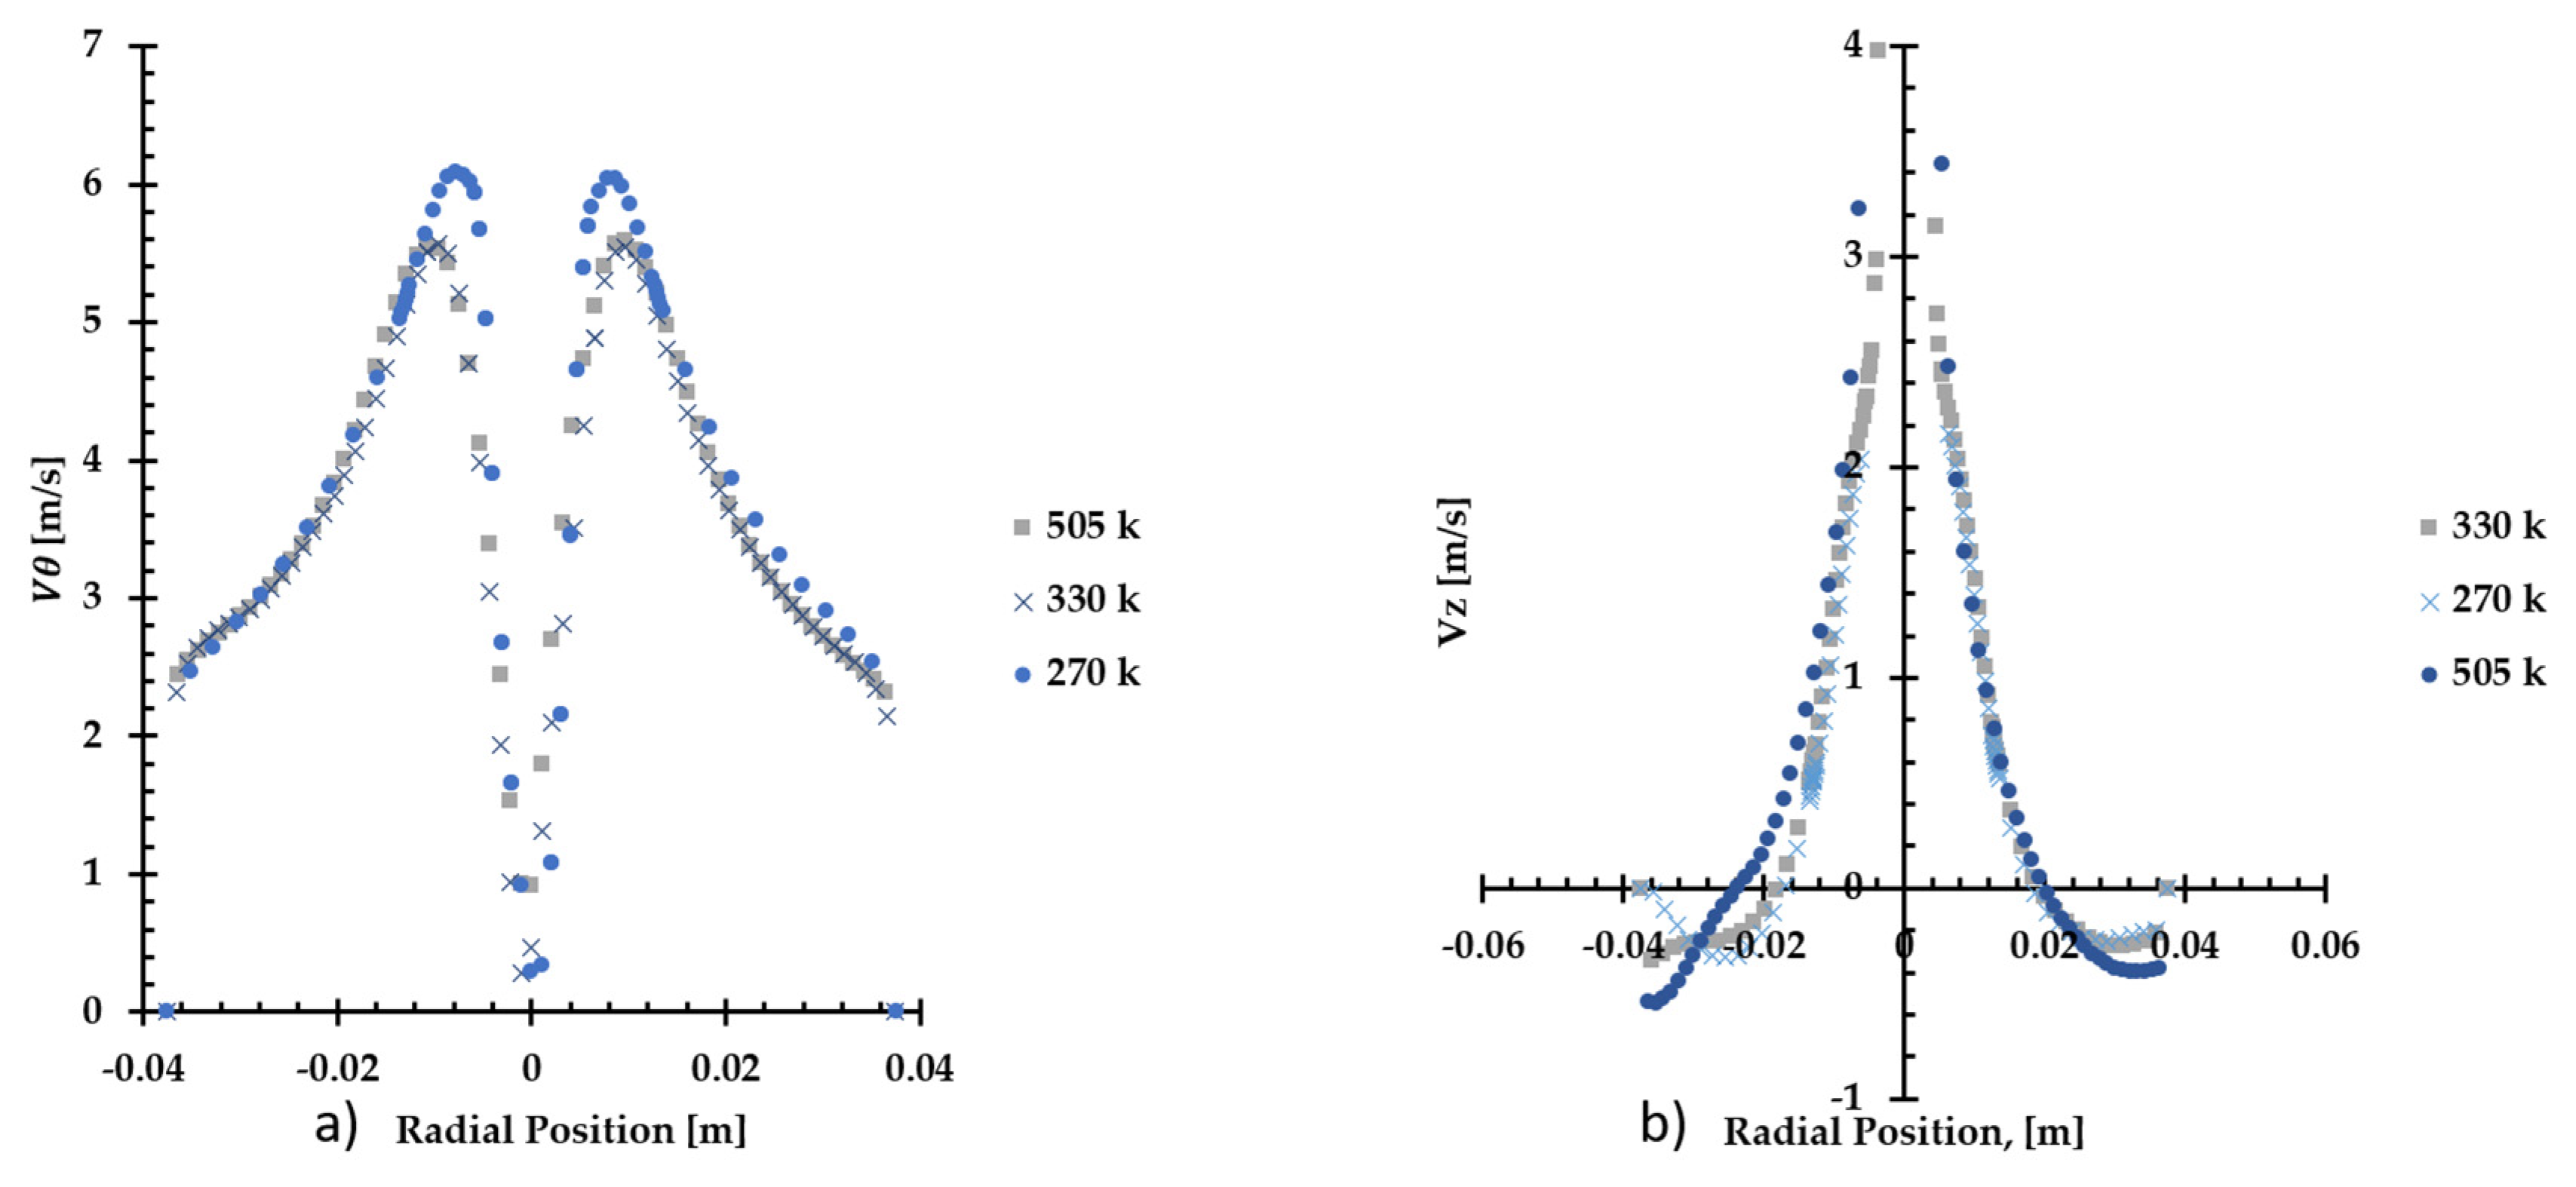
Figure 3 shows the structured mesh used in the simulations. A mesh convergence procedure was followed. Five meshes were evaluated, each mesh increasing 1.2 times the number of elements from the previous one. The tangential velocity profile was chosen as the convergence parameter, as seen in Figure 4. A mesh of 505,100 elements was ultimately selected due to the balance between good prediction accuracy and relatively low computational cost. Table 2 summarizes the quality criteria for the selected mesh.

2.2.2. Boundary Conditions and Setup

The inlet is set as “inlet velocity” at 2.28 m/s corresponding to a mass flow of 1.117 kg/s. The walls were treated as non-slip conditions, which means that the velocity value is zero on the walls. Both outlets were defined with the boundary condition of a “pressure outlet” at atmospheric pressure. The air phase is set to enter the domain through both outlets when a negative pressure is developed inside the hydrocyclone. Finally, the turbulence conditions imposed at the hydrocyclone inlet for turbulent intensity and hydraulic diameter are determined by Equations (32) and (33), respectively.
I = 0.16   ( R e D H ) 1 8
D H = P / A
As for the outlets, the default values of 5% and 10% were used for the turbulent intensity and the viscosity ratio, respectively. For the LES turbulence model, the inlet perturbation was generated by using a spectral synthesizer in Ansys Fluent. The turbulence intensity was 5% as in the RANS models. For the particle tracking, the size distribution used was the same at Hsieh’s [4]. Limestone spherical particles of various diameters (35 μm, 25 μm, 17 μm, 12 μm, 9 μm, 6 μm, 4 μm) were found using the Rosin–Ralmmer distribution [27]; the distribution parameters are the mean diameter size and shape factor, with values of 17.96 µm and 1.44, respectively. Those parameters were found by a regression model. Additionally, the inlet velocity of each particle was set to 2.28 m/s. The simulations were run using Ansys© Fluent v19; the SIMPLE algorithm was used for the coupling of pressure and velocity. For the spatial discretization schemes used, the reader is referred to Table 3. This table also lists the temporary discretization and VOF multiphase model schemes. A 0.9 restitution coefficient was implemented at the hydrocyclone walls.
All simulations are initialized using 4000 iterations of only the water phase. Then, the simulation is changed to a transitory state, and a time step of 1 × 10⁻⁴ s is implemented for LES and RNG k-ε. For RSM, the time step was set at 2.5 × 10⁻⁴ s. For the three models evaluated, 20 iterations per time step were used throughout the simulations.
It was observed that once steady state was reached, the residuals are kept below 1 × 10⁻⁵ for the RMS turbulence model, which indicates a quantitative convergence. For each time step, the residual of continuity starts with a maximum value of 1 × 10⁻³ and drops slightly below 1 × 10⁻⁵ by the end of the time step for LES and RNG k-ε. The other residuals are below 1 × 10⁻⁵. The residual of continuity is expected to be higher than the other residuals when there are significant changes in the flow direction, as is the case for this study. However, it is possible to rely on these results because of the high quality of the mesh, as reported in Table 2.
Finally, for each turbulence model, the computationally measured variables are averaged after sampling the flow field variables during 0.5 s of simulation. For the RNG k-ε, RSM, and LES turbulence models, the simulation took approximately 36 h, 50 h, and 96 h to converge, respectively. All the simulations were carried out on an 8 core Intel Xeon E5-2630 v3 workstation with 96 GB of RAM.

3. Simulation Validation

3.1. Modeling of the Continous Phase

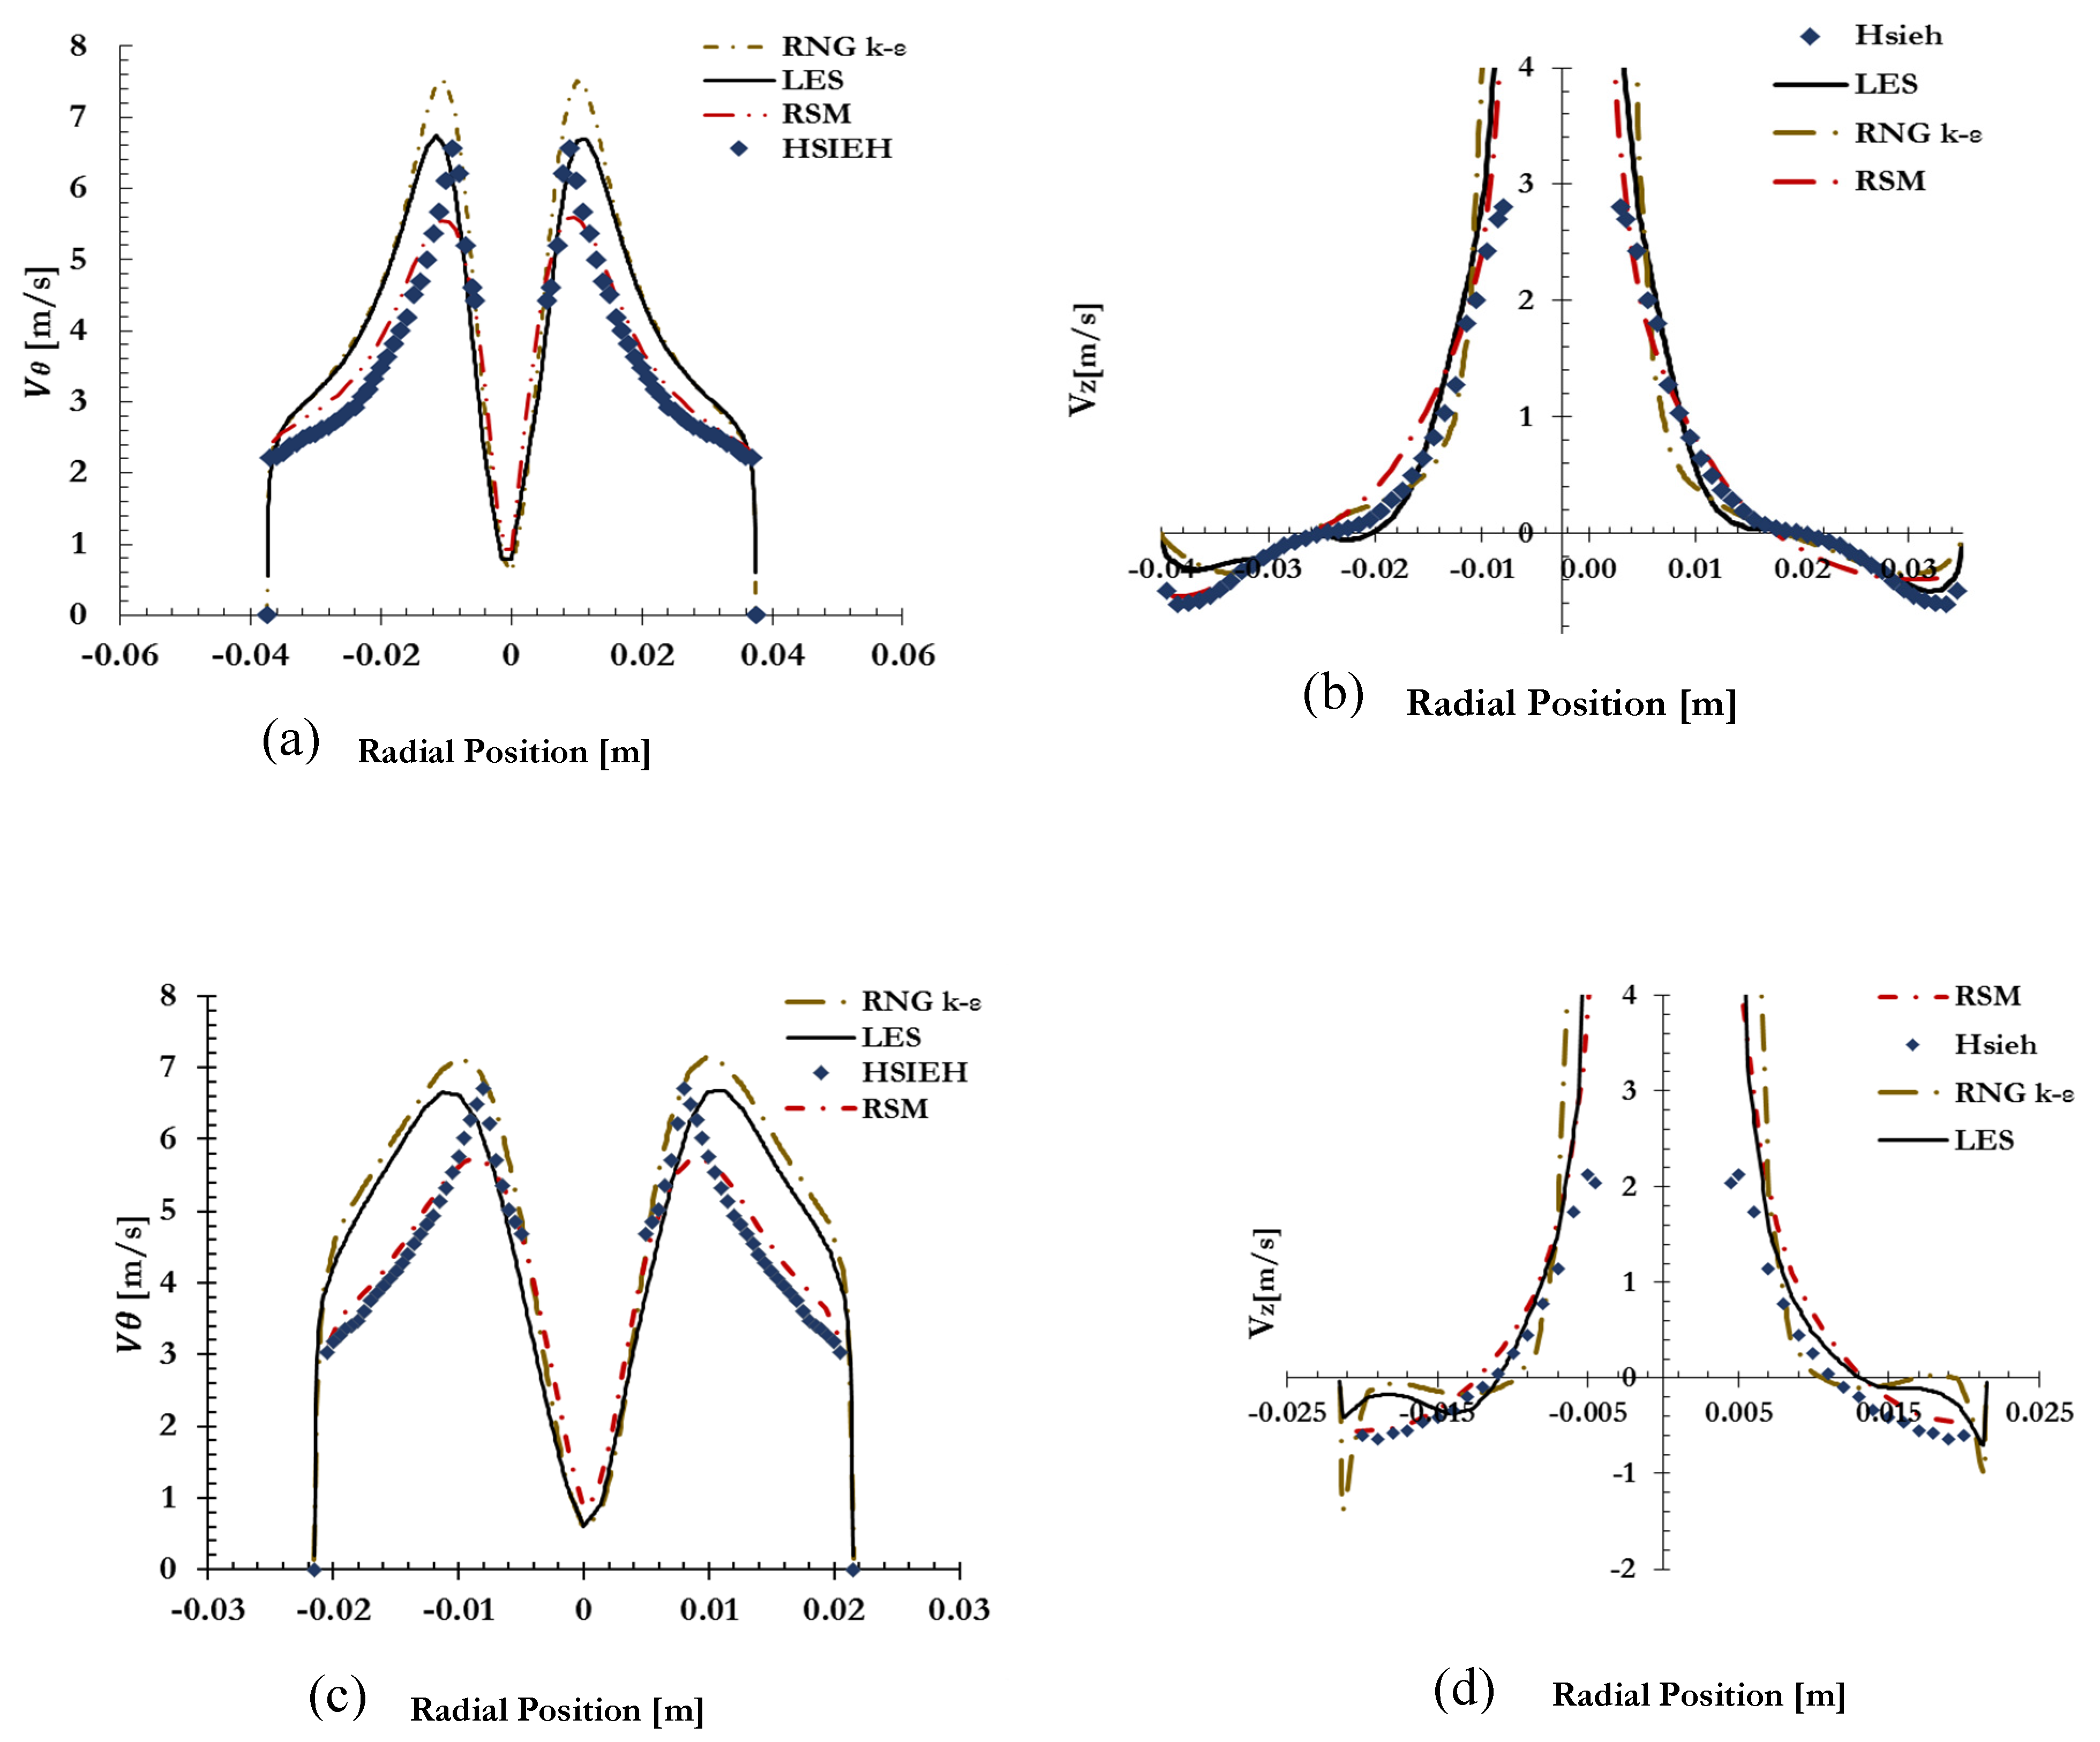
In order to assess the performance of the computational model developed in this study, the experimental data published by Hsieh was used to validate the results. There are two different axial positions at which experimental data is available, 60 mm and 120 mm from the top of the cylinder of the hydrocyclone. The tangential and axial velocity profiles are analyzed at both locations.
Figure 5a,c show the tangential velocity profiles at the 60 mm and 120 mm locations, respectively. While all models accurately predict the tangential velocity profile in the central forced vortex, both RNG k-ε and LES have difficulties in the free vortex region closer to the walls where the velocity is overestimated by these models. At both locations, the LES model is better at predicting the peak velocity, although its radial position is slightly offset. RSM underpredicts the peak velocity, while RNG k-ε overpredicts it at both locations.
The axial velocity profiles, shown in Figure 5b,d, show relatively good agreement between all models and the experimental data, although both RNG k and LES present some disagreement in the free vortex region closer to the wall.
The RSM model is part of the RANS family of turbulence models. In such models, the turbulent viscosity tends to diffuse the most pronounced velocity peaks, which might help explain the observed results. Although the RNG k-ε model was not expected to predict flow characteristics so accurately, this model combined with the higher than normal swirl factor constant ( α s ) yields good results.
LES accurately predicts values of the tangential velocity (within 2.86% compared to Hsieh) in the forced vortex region, including the peak velocity. Nevertheless, it was observed that LES overestimates the values of tangential velocity in the free vortex region closer to the wall. As for the axial velocity profiles, LES also has some problems closer to the wall. These results suggest that a finer mesh might be required in order to accurately capture the flow hydrodynamics near the wall when using a fixed Smagorinsky constant model.
Nevertheless, the mesh used in this work is finer than that used in previous works [3,6], where better results were obtained for the velocity profile at the free vortex region. A possible explanation is that for values of y+ ranging from 40 to 100 (as in previous works), the inertial sublayer is well described by the logarithmic law of the wall [14], as usually used in Ansys Fluent for this range of values of y+. The y+ value of 20 falls into the buffer layer, for which such law of the wall might not be adequate. A finer grid might have been needed to improve the model.
On the other hand, it is worth pointing out that studies such as Rudolf [22] are consistent with the results of this work in which LES overestimates the velocity in the free vortex region. This indicates that trying to describe the hydrodynamics behavior of hydrocyclones using the LES model is not recommended unless using a finer mesh, which is expensive in terms of computational cost.
The pressure contours predicted by the different models are shown in Figure 6. Table 4 presents the net pressure drop calculated for each model, showing differences of 2.3%, 16.0%, and 1.9%, respectively, for RNG k-ε, RMS, and LES. By comparing with results from [4], it can be seen that high values of pressure drop are correlated with the gradient of the tangential velocity in the radial direction. This relation can be explained by the pressure gradients equalizing the centrifugal forces in the flow. The higher the pressure gradients, the higher the velocity gradient.
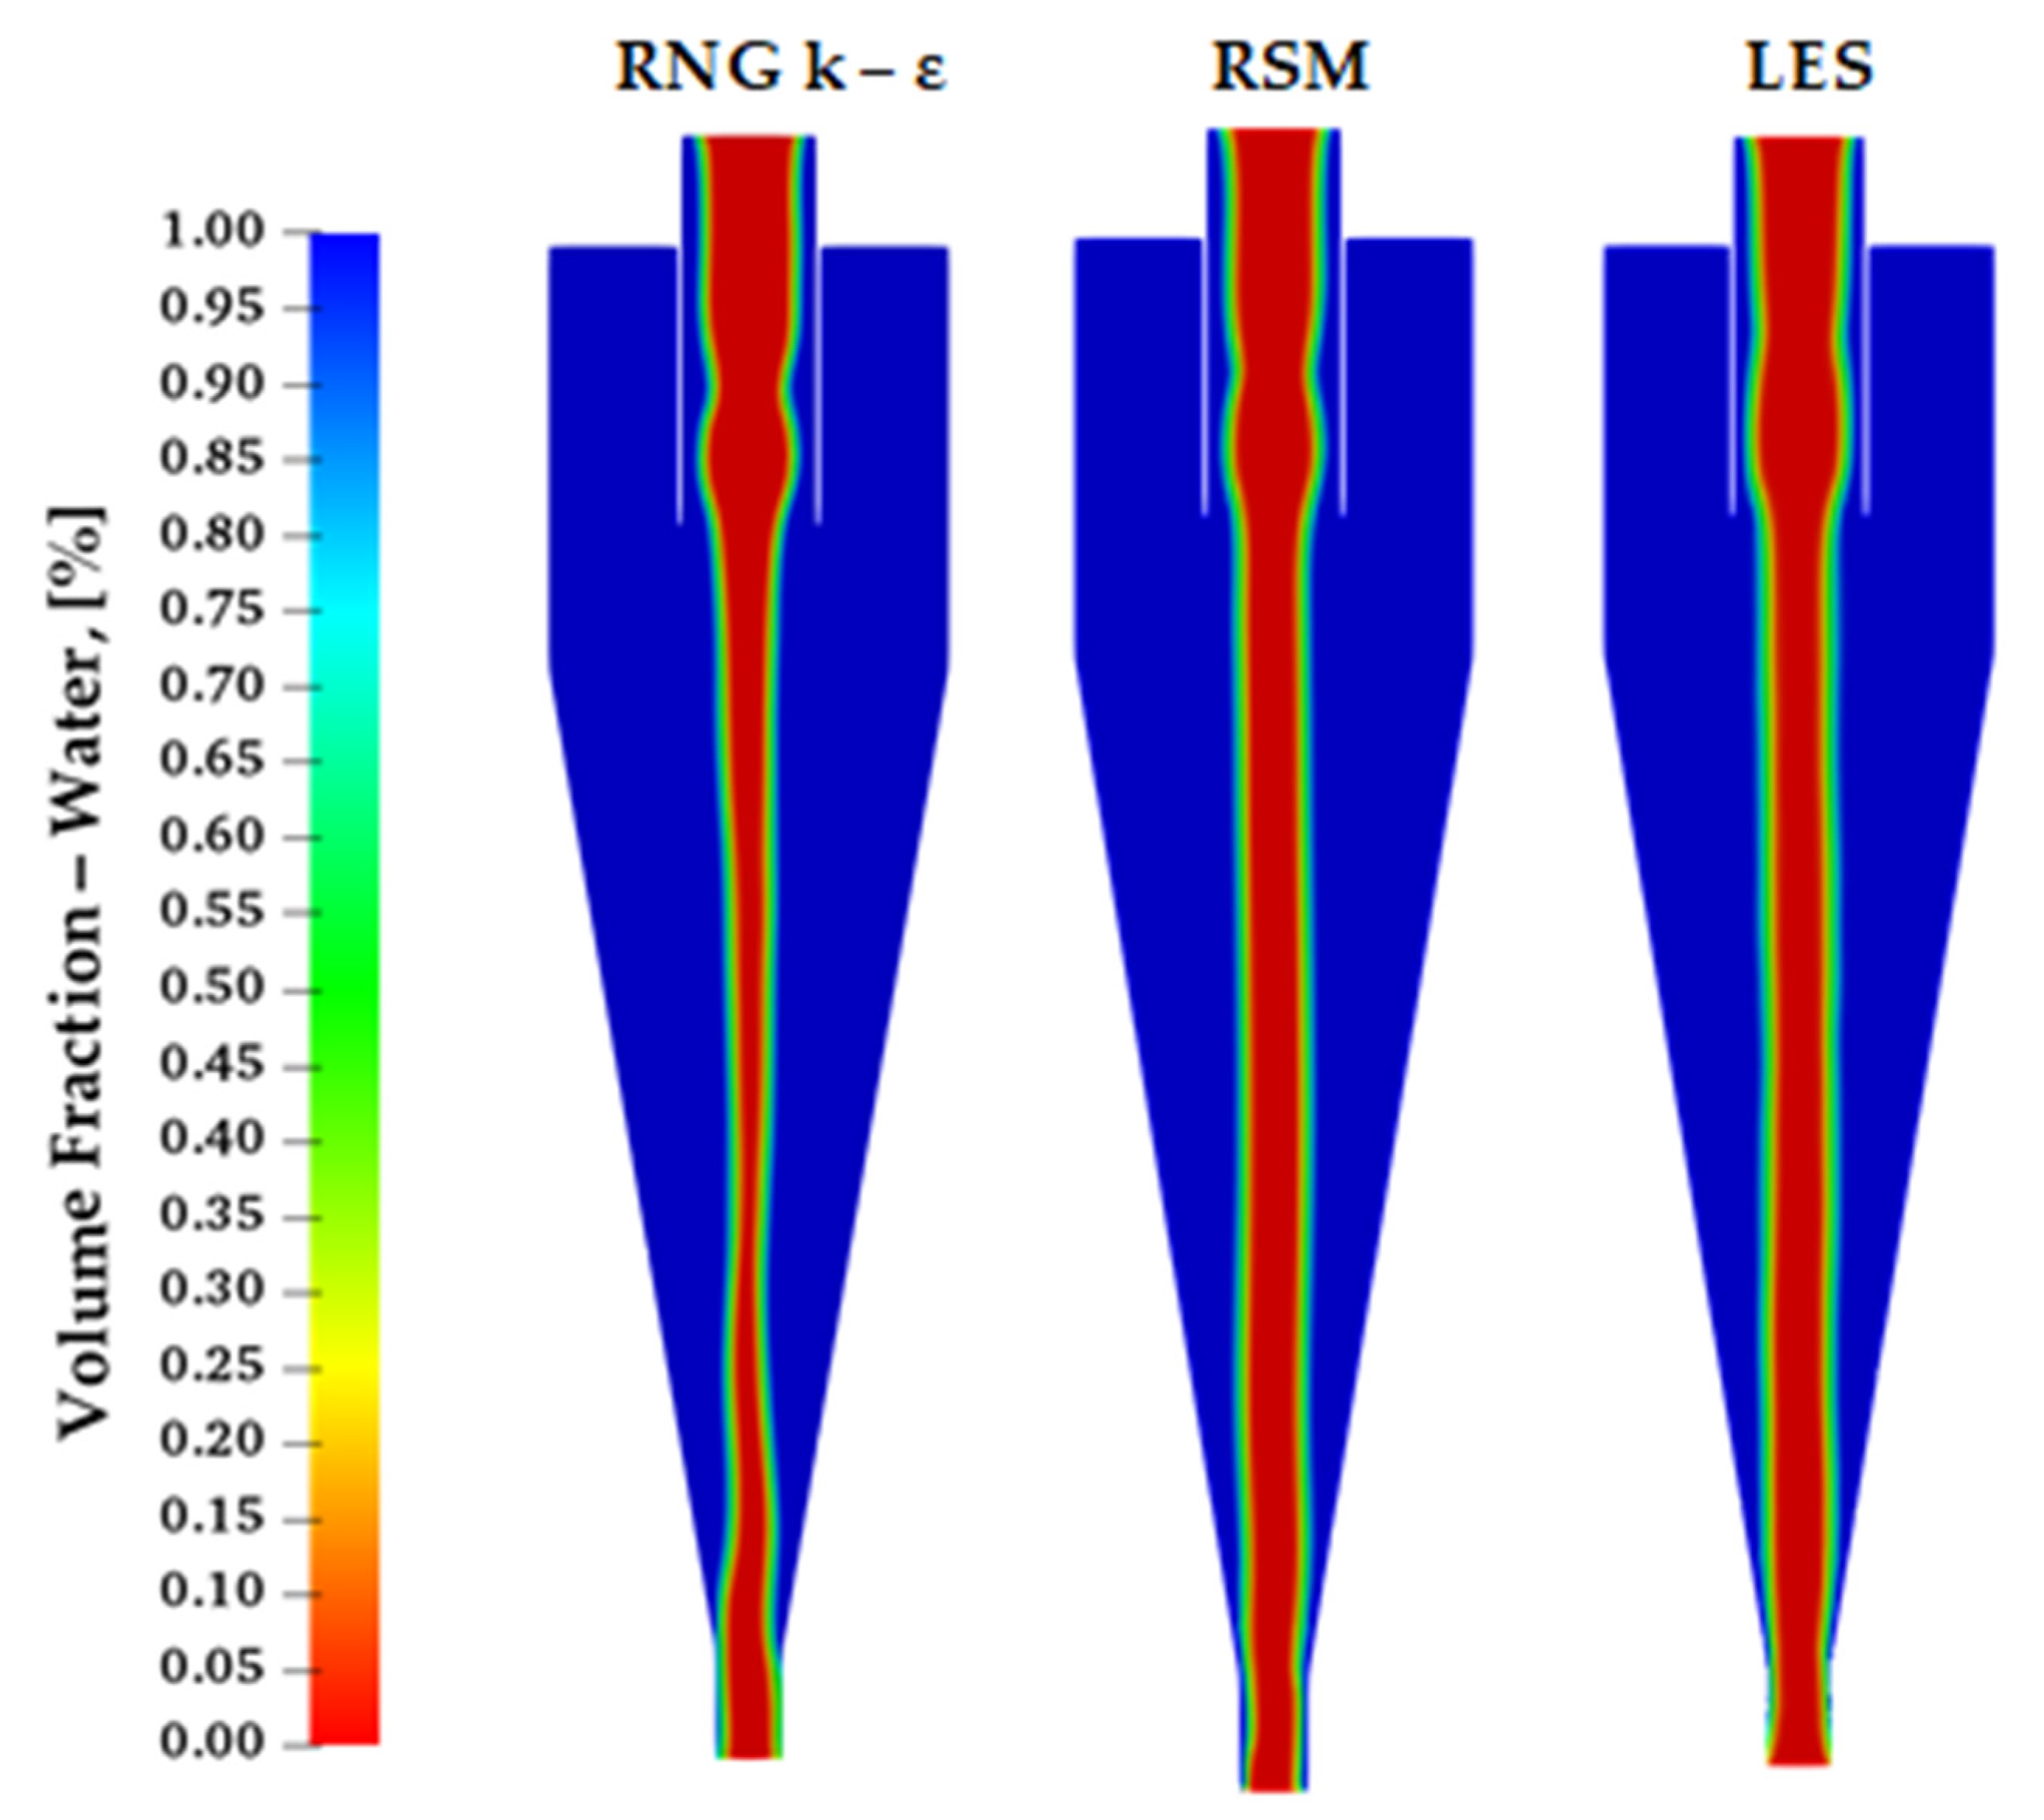
Air core diameter and the water split ratio are the last two factors to be validated for each turbulence model. Figure 7 shows that the three models can predict the formation of the air core. The RNG k-ε turbulence model accurately predicts this phenomenon, although no study mentions it previously. Table 4 quantitatively summarizes these results. The air core diameter is better predicted by RSM and LES, while the water split ratio is better predicted by RSM. For the purpose of iteratively improving the design of the hydrocyclones, it was found that RSM is the best model, as it accurately predicts the main variables, while maintaining a relatively low computational cost. Therefore, this model will be implemented for particle tracking and the exploration of new geometric hydrocyclone designs.
Table 4 summarizes the results of the validation of turbulence models for the continuous phase.

3.2. Modeling of a Discrete Phase

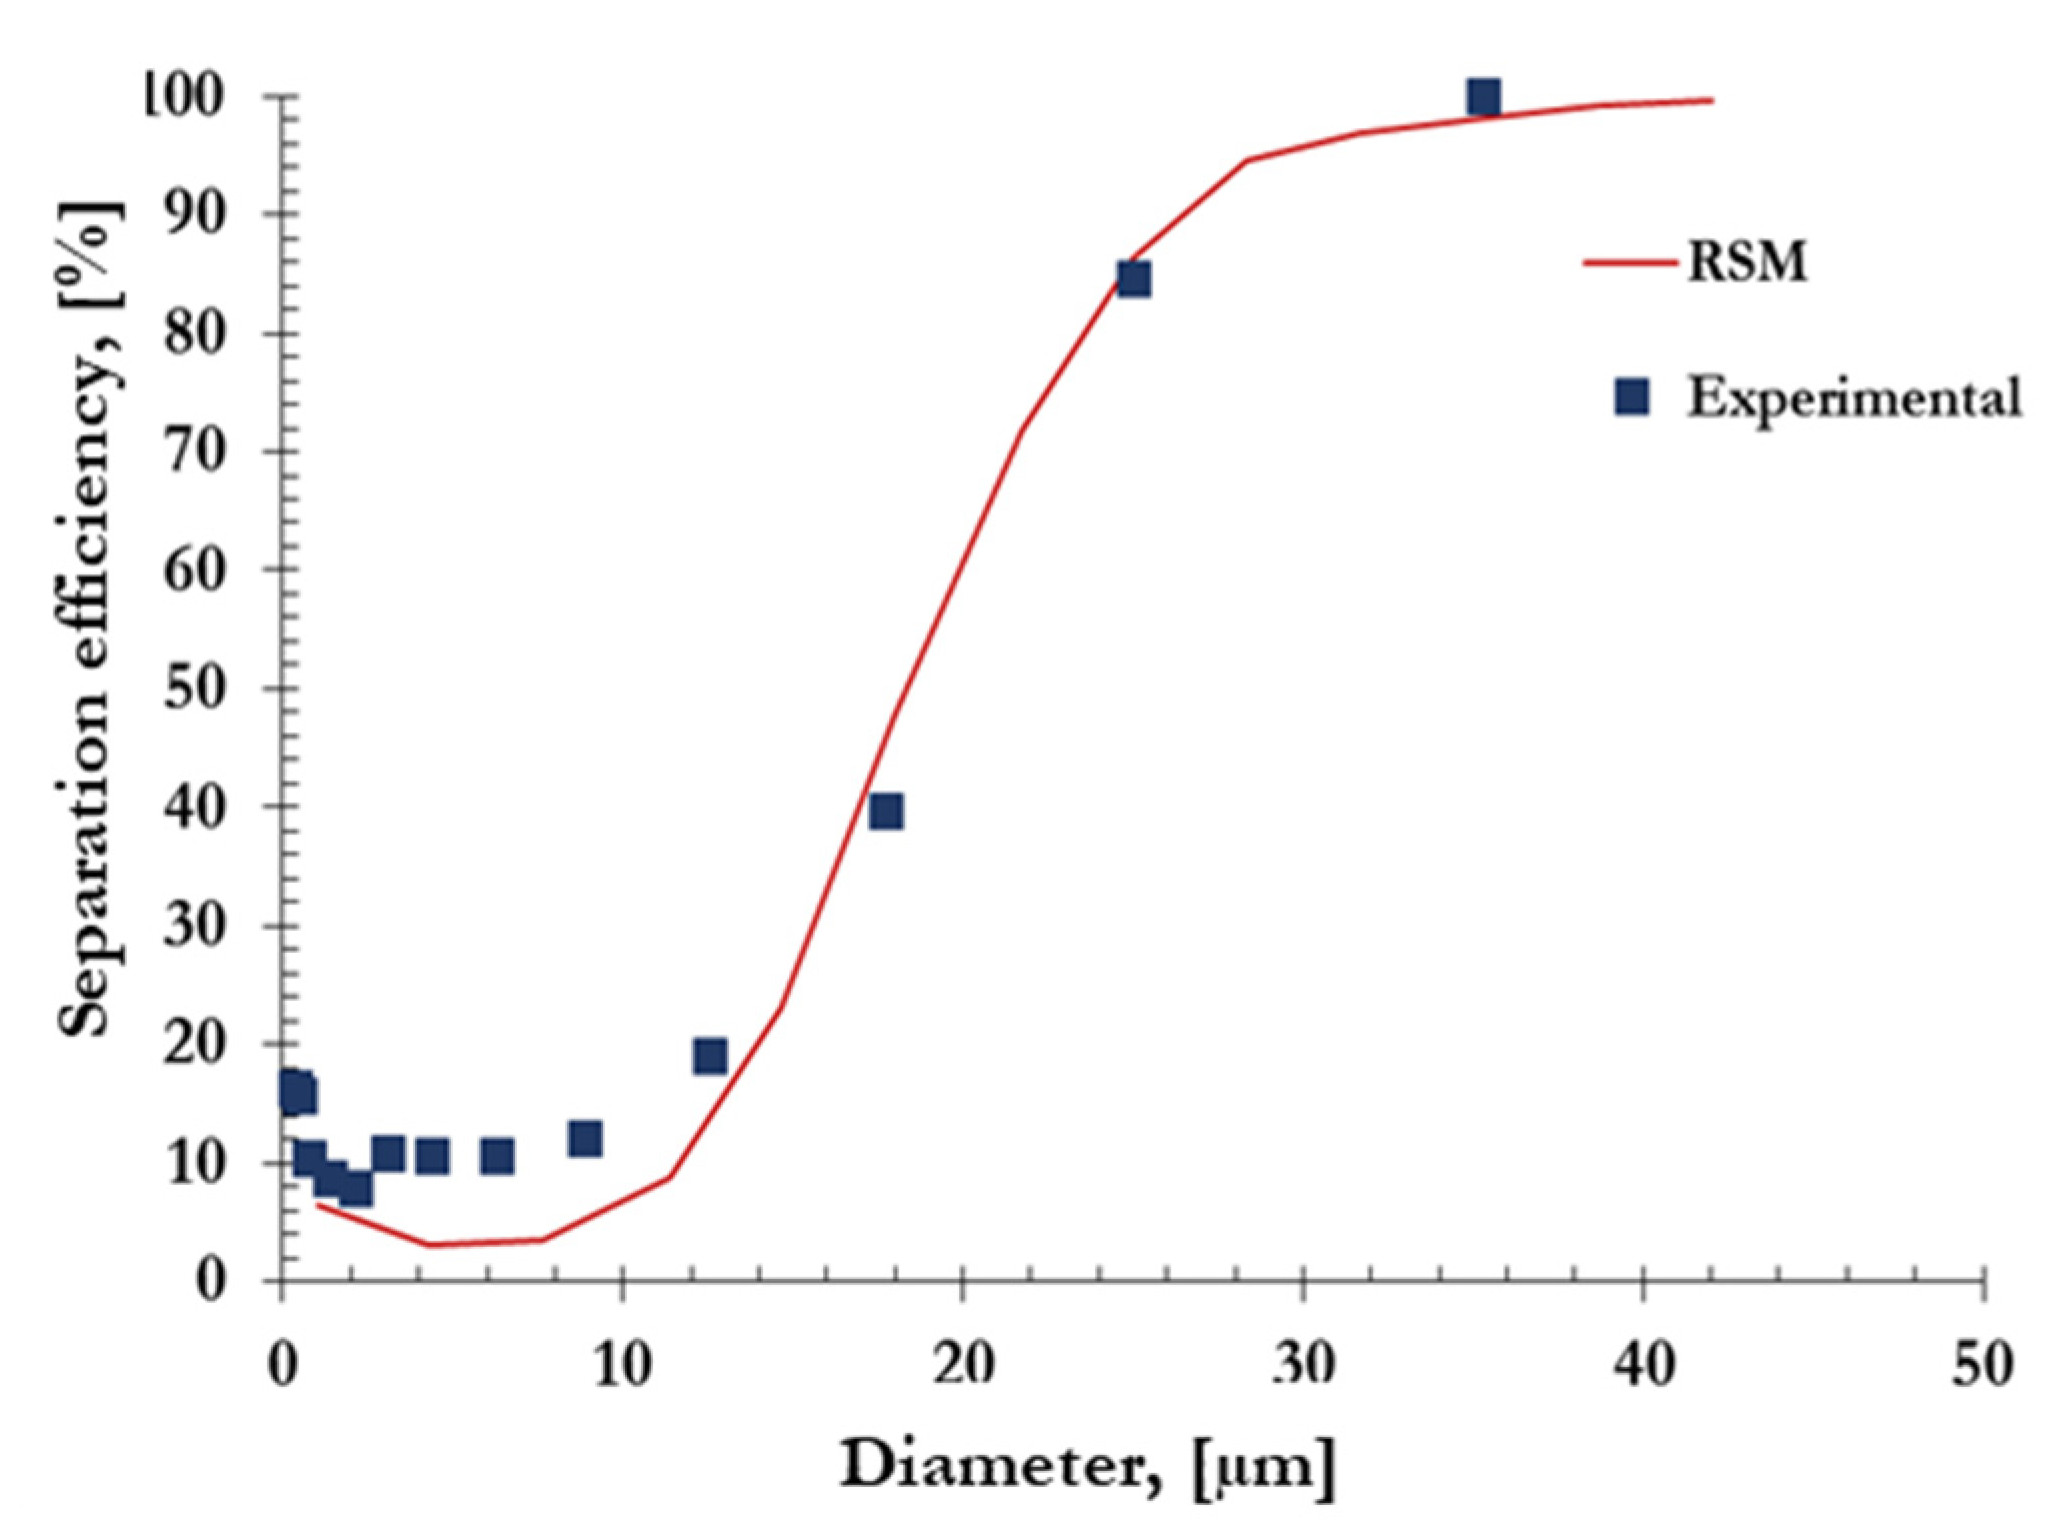
The discrete phase validation was executed in a steady state from the Ansys© Fluent® post-processor. One-way coupling with Lagrangian particle tracking was implemented given the low concentration of particles (4.88 wt%). Figure 8 shows the comparison of experimental results with respect to the simulated CFD analysis.
The “Fish Hook” effect is evident in the portion of the curve from 1 to 5 µm. The used turbulence model tries to capture this phenomenon but fails to estimate the probability of separation in that region. However, the parameters obtained—namely, the sharpness of separation and cut diameter (d50)—are experimentally consistent with the CFD simulation, and they have an accuracy of 4% and 7%, respectively. The previous results confirm that the one-way model, with steady tracking, is suitable for predicting the efficiency curve.
In summary, the computational model offers reliable results enabling the understanding of flow characteristics, which are not easily identified in experimental procedures. In terms of cost, this model converges with a few iterations, so it is possible to test more than one geometrical configuration to meet the needs and performance required for industrial applications.
4. Hydrocyclone Performance Analysis

4.1. Performance Variables

In this work, three performance criteria are considered: pressure drop, the sharpness of classification, and the efficiency separation. The parameter performance is described as follows:

4.1.1. Pressure Drop:

Δ P = P i n P o u t
where P i n is the pressure at the inlet and P o u t is the pressure at the outlet evaluated at the top of the vortex finder.

4.1.2. Classification of Sharpness

I = d 75 d 25 2 d 50 .  
Also known as imperfection, this parameter depends on three magnitudes, d25, d50, and d75, which are the probabilities of separation at 25%, 50%, and 75%, respectively.

4.1.3. Cut-Size Diameter

The d50 is the parameter estimating the same probability of particles leaving the reservoirs through the overflow or the underflow.

4.2. Geometric Considerations

A computational experiment was conducted to understand how changes in the geometric parameters influence the performance of a hydrocyclone. Table 5 shows the three factors (Di, Do, Lv) that are more likely to affect the separation efficiency and pressure drop. Those factors are non-dimensional with respect to the hydrocyclone diameter. The level of each factor was selected based on previous studies [13] and [28]. However, in these studies, there were several restrictions. In their respective works, they approached the optimal location.
In Figure 9, the design space is represented by a cube; each point is the possible combination of the levels of each factor. All values are investigated in five levels: −α, −1, 0, 1, and +α. The parameter α is calculated with 2k/4. In the case of three factors, alpha is equal to 1.68, which indicates that each point of the equidistant design space is 1.68 units from the central point.

4.3. Evaluating Hydrocyclone Performace

A total of four hydrocyclones including Hsieh’s hydrocyclone were evaluated; the results of this process are summarized in Table 6. In some configurations, two factors were maintained constant in order to determine the influence of one single factor on the hydrocyclone performance. For instance, the inlet size varies from 0.15 to 0.25 in configuration HC3 and HC4, but the cone length and vortex finder diameter remain constant. The same methodology is applied in the other configurations.
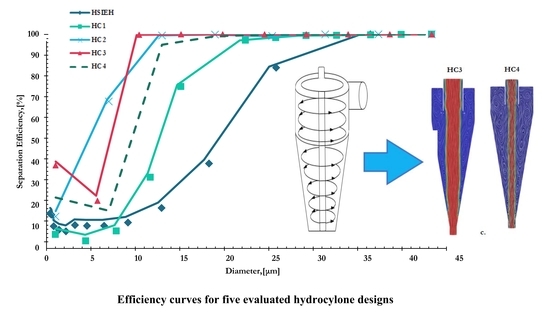
From Figure 10, the observed configurations, HC1, HC2, HC3, and HC4, are more efficient in terms of separation and cut diameter. Based on preliminary observation, it is possible to identify that the higher the inlet velocity, the greater the particle classification. As a result, the pressure drop is more significant. The previously mentioned results can be confirmed by comparing the HC3 and HC4 configurations, where the only geometric parameter that varies in these two configurations is the inlet diameter, see Table 6.
Figure 11 shows the streamlines of the velocity field in an axial cross-sectional cut. It is possible to see several stagnation points, since the fluid is losing momentum in the axial direction. Therefore, saddle points and vortices start appearing in the domain. In hydrocyclones, the saddle point represents the place where the separation process takes place. The primary purpose of improving the classification efficiency is to displace saddle points downward, near the spigot, where the smallest change of momentum occurs in the axial direction, and consequently, the particles are more likely to follow a path to the underflow. The vortices present in the hydrocyclones are undesirable, since they increase the residence time of the particles.
In Figure 11, the configurations are analyzed in pairs to elucidate how the flow patterns change from one geometry to another. Notice from Figure 11 and Table 6 that both configurations are similar. Both have the same length dimension of the hydrocyclone. It was found that the pressure drop and the cut diameter decrease with an increase in slenderness.
Furthermore, the classification is constant when the hydrocyclone length changes. Moreover, by analyzing Figure 11, it was observed that the inlet size is a significant factor, which is inversely proportional to pressure drop and directly proportional to the sharpness of classification and cut diameter. The saddle point and vortices are less chaotic than in the other configurations.
Ultimately, a possible interaction between the inlet and vortex finder may exist; an increment of those parameters reports a lower value in the sharpness of classification and the pressure drop. In general, every configuration has one common attribute: the air core formation does not block the exit of the particles through the underflow. The larger the diameter of the vortex finder, the larger the width of the air core and the fewer particles will be separated from the working fluid.
From the HC2 and HC3 configurations, it is evident that they perform better than Hsieh’s hydrocyclone, which is not a commercial hydrocyclone. The HC2 and HC3 configurations are in the range of the geometrical parameters proposed by the Rietema and Bradley brands, see Table 7. It would be possible to find the optimum operation point by exploring new designs similar to the configurations HC2 and HC3.
Table 8 summarizes the performance criteria of a hydrocyclone with respect to its geometrical parameters. The “−“sign indicates a decrease in the efficiency with a reduction in the factor, while the “+” sign indicates an increase.
This relationship enables more efficient hydrocyclones to be designed where their sharpness classification and cut size diameter is greater at the expense of minimal pressure drop.

5. Conclusions

In the development of the computational model, three turbulence models were evaluated. It was found that RSM can reproduce most of the flow patterns of the continuous phase at a relatively low computational cost. RSM was more time consuming than the RNG k-ε, due to the seven fields resolved per iteration in the former, but it was able to more accurately predict the main variables of interest. On the other hand, LES will require a finer grid to reach convergence and it is overall a more computationally expensive model. The RNG method took 36 h to run compared to 96 h for LES. It was also found that RSM can predict the classification curve in hydrocyclones point by point, making it suitable for the characterization of hydrocyclone performance.
The last significant finding was that some vortices and saddle points move as the geometry changes. These stagnation points are responsible for the low efficiency volume inside hydrocyclones. In order to ensure better performance, it is necessary to work with slender hydrocyclones, lower inlet diameters, and a lower vortex finder diameter. With this, it is also guaranteed that the momentum interchange remains in the axial direction. Consequently, the particles can leave the domain through the spigot. Finally, with these geometric variations, it is possible to build more compact hydrocyclones that meet the space limitation in any hydraulic system. For future work, we recommend applying the response surface methodology to mathematically determine the dependence between the evaluated geometrical factors and the performance of these filters.

Author Contributions

M.D.-C.: Methodology, Software, validation, Investigation, Writing—Original Draft, Visualization, J.G.-B.: Conceptualization, Investigation, Resources, Writing—Review and Editing, Supervision, B.N.: Resources, Writing—Review and Editing. A.G.-M.: Conceptualization, Investigation, Resources, Writing—Review and Editing, Project Administration, Supervision. All authors have read and agreed to the published version of the manuscript.

Funding

This research received no external funding.

Conflicts of Interest

The authors declare no conflict of interest.

Nomenclature

d50cut-size diameter, [µm]
y+dimensionless wall distance
u′ifluctuating velocity, [m s−1]
Sijgradient velocity tensor
ggravity, [m s−2]
DHhydraulic diameter, [mm]
Dchydrocyclone cylinder diameter, [mm]
Dihydrocyclone inlet diameter, [mm]
Dovortex finder diameter, [mm]
Iimperfection or sharpness of classification
TLintegration time, [s]
kkinetic energy
upparticle velocity, [m s−1]
Δppressure drop, [kPa]
ppressure, [kPa]
ReReynolds number
Ωrotational tensor
CsSmagorinsky constant
Lssub-grid-scale length
u ¯ i three components of the averaged velocity vector, [m s−1]

Greek Letters

νcinematic viscosity, [m2 s−1]
ϵdissipation energy
μdynamic viscosity, [Pa s]
δKronecker factor
τeeddy lifetime, [s]
ρfluid density, [kg m−3]
ρsparticle density, [kg m−3]
ε i j k permutation symbol
τijsgsshear stress sub-grid-scale
νTturbulent kinematic viscosity, [m2 s−1]
µtturbulent viscosity, [m2 s−1]

References

  1. Vakamalla, T.R.; Mangadoddy, N. Numerical simulation of industrial hydrocyclones performance: Role of turbulence modelling. Sep. Purif. Technol. 2017, 176, 23–39. [Google Scholar] [CrossRef]
  2. Azimian, M.; Bart, H.J. Numerical analysis of hydroabrasion in a hydrocyclone. Pet. Sci. 2016, 13, 304–319. [Google Scholar] [CrossRef] [Green Version]
  3. Karimi, M.; Akdogan, G.; Bradshaw, S.M.; Mainza, A. Numerical modelling of air core in hydrocyclones. In Proceedings of the Ninth International Conference on CFD in the Minerals and Process Industries, CSIRO, Melbourne, Australia, 10–12 December 2012. [Google Scholar]
  4. Hsieh, K.T.; Rajamani, K. Phenomenological model of the hydrocyclone: Model development and verification for single-phase flow. Int. J. Miner. Process. 1988, 22, 223–237. [Google Scholar] [CrossRef]
  5. Delgadillo, J.A.; Rajamani, R.K. A comparative study of three turbulence-closure models for the hydrocyclone problem. Int. J. Miner. Process. 2005, 77, 217–230. [Google Scholar] [CrossRef]
  6. Brennan, M.S.; Narasimha, M.; Holtham, P.N. Multiphase modelling of hydrocyclones–prediction of cut-size. Miner. Eng. 2007, 20, 395–406. [Google Scholar] [CrossRef]
  7. Tian, J.; Ni, L.; Song, T.; Olson, J.; Zhao, J. An overview of operating parameters and conditions in hydrocyclones for enhanced separations. Sep. Purif. Technol. 2018, 206, 268–285. [Google Scholar] [CrossRef]
  8. Zhao, Q.; Cui, B.; Wei, D.; Song, T.; Feng, Y. Numerical analysis of the flow field and separation performance in hydrocyclones with different vortex finder wall thickness. Powder Technol. 2019, 345, 478–491. [Google Scholar] [CrossRef]
  9. Zhu, L.; Li, A.; Wang, Z. Analysis of particle trajectories in a quick-contact cyclone reactor using a discrete phase model. Sep. Sci. Technol. 2018, 53, 928–939. [Google Scholar] [CrossRef]
  10. Vieira, L.G.M.; Barbosa, E.A.; Damasceno, J.J.R.; Barrozo, M.A.S. Performance analysis and design of filtering hydrocyclones. Braz. J. Chem. Eng. 2005, 22, 143–152. [Google Scholar] [CrossRef]
  11. Aldrich, C. Hydrocyclones. In Progress in Filtration and Separation; Academic Press: New York, NY, USA, 2014; pp. 1–24. [Google Scholar]
  12. Tang, B.; Xu, Y.; Song, X.; Sun, Z.; Yu, J. Numerical study on the relationship between high sharpness and configurations of the vortex finder of a hydrocyclone by central composite design. Chem. Eng. J. 2015, 278, 504–516. [Google Scholar] [CrossRef]
  13. Sun, X.; Kim, S.; Yang, S.D.; Kim, H.S.; Yoon, J.Y. Multi-objective optimization of a Stairmand cyclone separator using response surface methodology and computational fluid dynamics. Powder Technol. 2017, 320, 51–65. [Google Scholar] [CrossRef]
  14. Fluent Inc. FLUENT 6.3 User’s Guide; Fluent documentation; Fluent Inc.: New York, NY, USA, 2006; pp. 46–53. [Google Scholar]
  15. Stendal, E.A.R. Multiphase Flows in Cyclone Separators Modeling the Classification and Drying of Solid Particles Using CFD; Chalmers University of Technology: Gothenburg, Sweden, 2013. [Google Scholar]
  16. Davailles, A.; Climent, E.; Bourgeois, F. Fundamental understanding of swirling flow pattern in hydrocyclones. Sep. Purif. Technol. 2012, 92, 152–160. [Google Scholar] [CrossRef] [Green Version]
  17. Launder, B.E.; Spalding, D.B. The numerical computation of turbulent flows. In Numerical Prediction of Flow, Heat Transfer, Turbulence and Combustion; Pergamon: Oxford, UK, 1983; pp. 96–116. [Google Scholar]
  18. Crowe, C.T.; Schwarzkopf, J.D.; Sommerfeld, M.; Tsuji, Y. Multiphase Flows with Droplets and Particles; CRC Press: Boca Raton, FL, USA, 2011. [Google Scholar]
  19. de Souza, F.J.; Silveira Neto, A. Large eddy simulations of a hydrocyclone. In Proceedings of the Fluids Engineering Division Summer Meeting, Sydney, Australia, 15–19 July 2002; Volume 36150, pp. 559–564. [Google Scholar]
  20. Saidi, M.; Maddahian, R.; Farhanieh, B. Deoiling Hydrocyclones Flow Field-A Comparison between k-Epsilon and LES. Int. J. Mech. Mechatron. Eng. 2011, 5, 2292–2295. [Google Scholar]
  21. Saidi, M.; Maddahian, R.; Farhanieh, B.; Afshin, H. Modeling of flow field and separation efficiency of a deoiling hydrocyclone using large eddy simulation. Int. J. Miner. Process. 2012, 112, 84–93. [Google Scholar] [CrossRef]
  22. Rudolf, P. Simulation of multiphase flow in hydrocyclone. In EPJ Web of Conferences; EDP Sciences: Les Ulis, France, 2013; Volume 45, p. 01101. [Google Scholar]
  23. Fan, W.; Anglart, H. On the closure requirement for VOF simulations with RANS modeling. arXiv 2019, arXiv:1911.09727. [Google Scholar]
  24. Zhang, Y.; Cai, P.; Jiang, F.; Dong, K.; Jiang, Y.; Wang, B. Understanding the separation of particles in a hydrocyclone by force analysis. Powder Technol. 2017, 322, 471–489. [Google Scholar] [CrossRef]
  25. Mei, R. An approximate expression for the shear lift force on a spherical particle at finite Reynolds number. Int. J. Multiph. Flow 1992, 18, 145–147. [Google Scholar] [CrossRef]
  26. Ghodrat, M.; Kuang, S.B.; Yu, A.B.; Vince, A.; Barnett, G.D.; Barnett, P.J. Numerical analysis of hydrocyclones with different vortex finder configurations. Miner. Eng. 2014, 63, 125–138. [Google Scholar] [CrossRef]
  27. Beji, T.; Zadeh, S.E.; Maragkos, G.; Merci, B. Influence of the particle injection rate, droplet size distribution and volume flux angular distribution on the results and computational time of water spray CFD simulations. Fire Saf. J. 2017, 91, 586–595. [Google Scholar] [CrossRef] [Green Version]
  28. Hoekstra, A.J. Gas Flow Field and Collection Efficiency of Cyclone Separators, TU Delft 2000. Ph.D. Thesis, Delft University of Technology, Delft, The Netherlands, 2000. [Google Scholar]
Figure 1. Hydrocyclone schematic representation.
Fluids 05 00118 g001
Figure 2. Simulation step for hydrocyclone.
Fluids 05 00118 g002
Figure 3. Geometric dimensions and domain mesh.
Fluids 05 00118 g003
Figure 4. (a) Mean tangential velocity profile from Reynolds stress model (RSM) simulation on four different grid sizes at 60 mm from hydrocyclone Hsieh top, (b) Mean axial velocity profile from RSM simulation on four different grid sizes at 60 mm from hydrocyclone Hsieh top.
Fluids 05 00118 g004
Figure 5. Axial and tangential velocity profile at 60 mm and 120 mm from the top. (a) Tangential velocity at 60 mm, (b) axial velocity at 60 mm, (c) tangential velocity at 170 mm, and (d) axial velocity at 170 mm.
Fluids 05 00118 g005
Figure 6. Gradient pressure contours.
Fluids 05 00118 g006
Figure 7. Volume fraction of water contours.
Fluids 05 00118 g007
Figure 8. Efficiency separation curve.
Fluids 05 00118 g008
Figure 9. Design cube.
Fluids 05 00118 g009
Figure 10. Efficiency curve for the five hydrocyclones evaluated.
Fluids 05 00118 g010
Figure 11. Representation of saddle point and vortical structures for efficient hydrocyclones, (a) comparison flow pattern between HC1 and HC4, (b) comparison flow pattern between HC1 and HC2, (c) comparison flow pattern between HC3 and HC4, (d) HSIEH flow pattern.
Fluids 05 00118 g011
Table 1. Dimension of Hsieh hydrocyclone.
DimensionSymbolValue
Hydro cyclone diameter [mm]Dc75
Inlet, [mm]Di25
Vortex finder diameter, [mm]Do25
Spigot diameter, [mm]Ds12.5
Cylindrical section length, [mm]Lc75
Vortex finder lengthLv50
Included cone angle θ 20°
Table 2. Mesh quality information.
TypeStructured
Cell Number505,100
Max Skewness0.30 (>90%)
Aspect Ratio28.04
Orthogonality0.9 (>96%)
y + 20
Table 3. Set up case, turbulence models, and discretization scheme. RNG: renormalization group, VOF: volume of fluid. * represents the set up used for the LES model.
Turbulence Models
RNG k- ε
Reynolds Stress Models (RSM)
* Large Eddy Simulation (LES)
Discretization SchemesSchemes
MomentumQUICK Bounded Central Differencing (LES)
PressurePRESTO
Kinetic turbulent energySecond-Order Upwind
Turbulence energy dissipationSecond-Order Upwind
Reynolds stress componentsSecond-Order Upwind (RSM), Linear Pressure Gradient
Transient formulationFirst-Order Implicit * Bounded Second-Order implicit (LES)
Multiphasic model (VOF)HRIC Modified
Table 4. Summarized results from turbulence models implementation.
ModelsAir Core Diameter [mm]Split Ratio Water %Pressure Drop [kPa]
RNG k- ε 9.822.3050.20
RSM11.204.9039.60
LES11.601.9047.60
HSIEH11.004.8846.70
Table 5. Design space.
FactorsLevels
α−101−α
Di/Dc, x10.120.150.20.250.28
Do/Dc, x20.220.250.30.350.38
Lv/Dc, x31.312344.68
Table 6. Design matrix of experiments.
RunsDi/DcDo/DcL/DcDi [mm]Do [mm]L [mm]Velocity [m/s]ΔP [kPa]Idc [μm]
HC10.250.302.0018.7522.501504.0591.880.1912.9
HC20.150.602.0011.2545.0015011.2678.700.614.9
HC30.150.304.0011.2522.5030011.26175.000.127.2
HC40.250.304.0018.7522.503004.0568.800.219.1
Table 7. Geometric comparison of hydrocyclone designs.
HydrocyclonesDi/DcDo/DcL/Dc
Rietema 100.280.345.00
Bradley 100.150.206.80
Hsieh0.250.253.33
HC20.300.602.00
HC30.20.304.00
Table 8. Relationship between geometric parameters and hydrocyclone performance.
ParametersΔPIdc
Di/Dc+
Do/Dc+
L/Dc++