Effect of Corner Shape on Hydraulic Performance of One-Cycle Rectangular Labyrinth Weirs


Abstract
1. Introduction
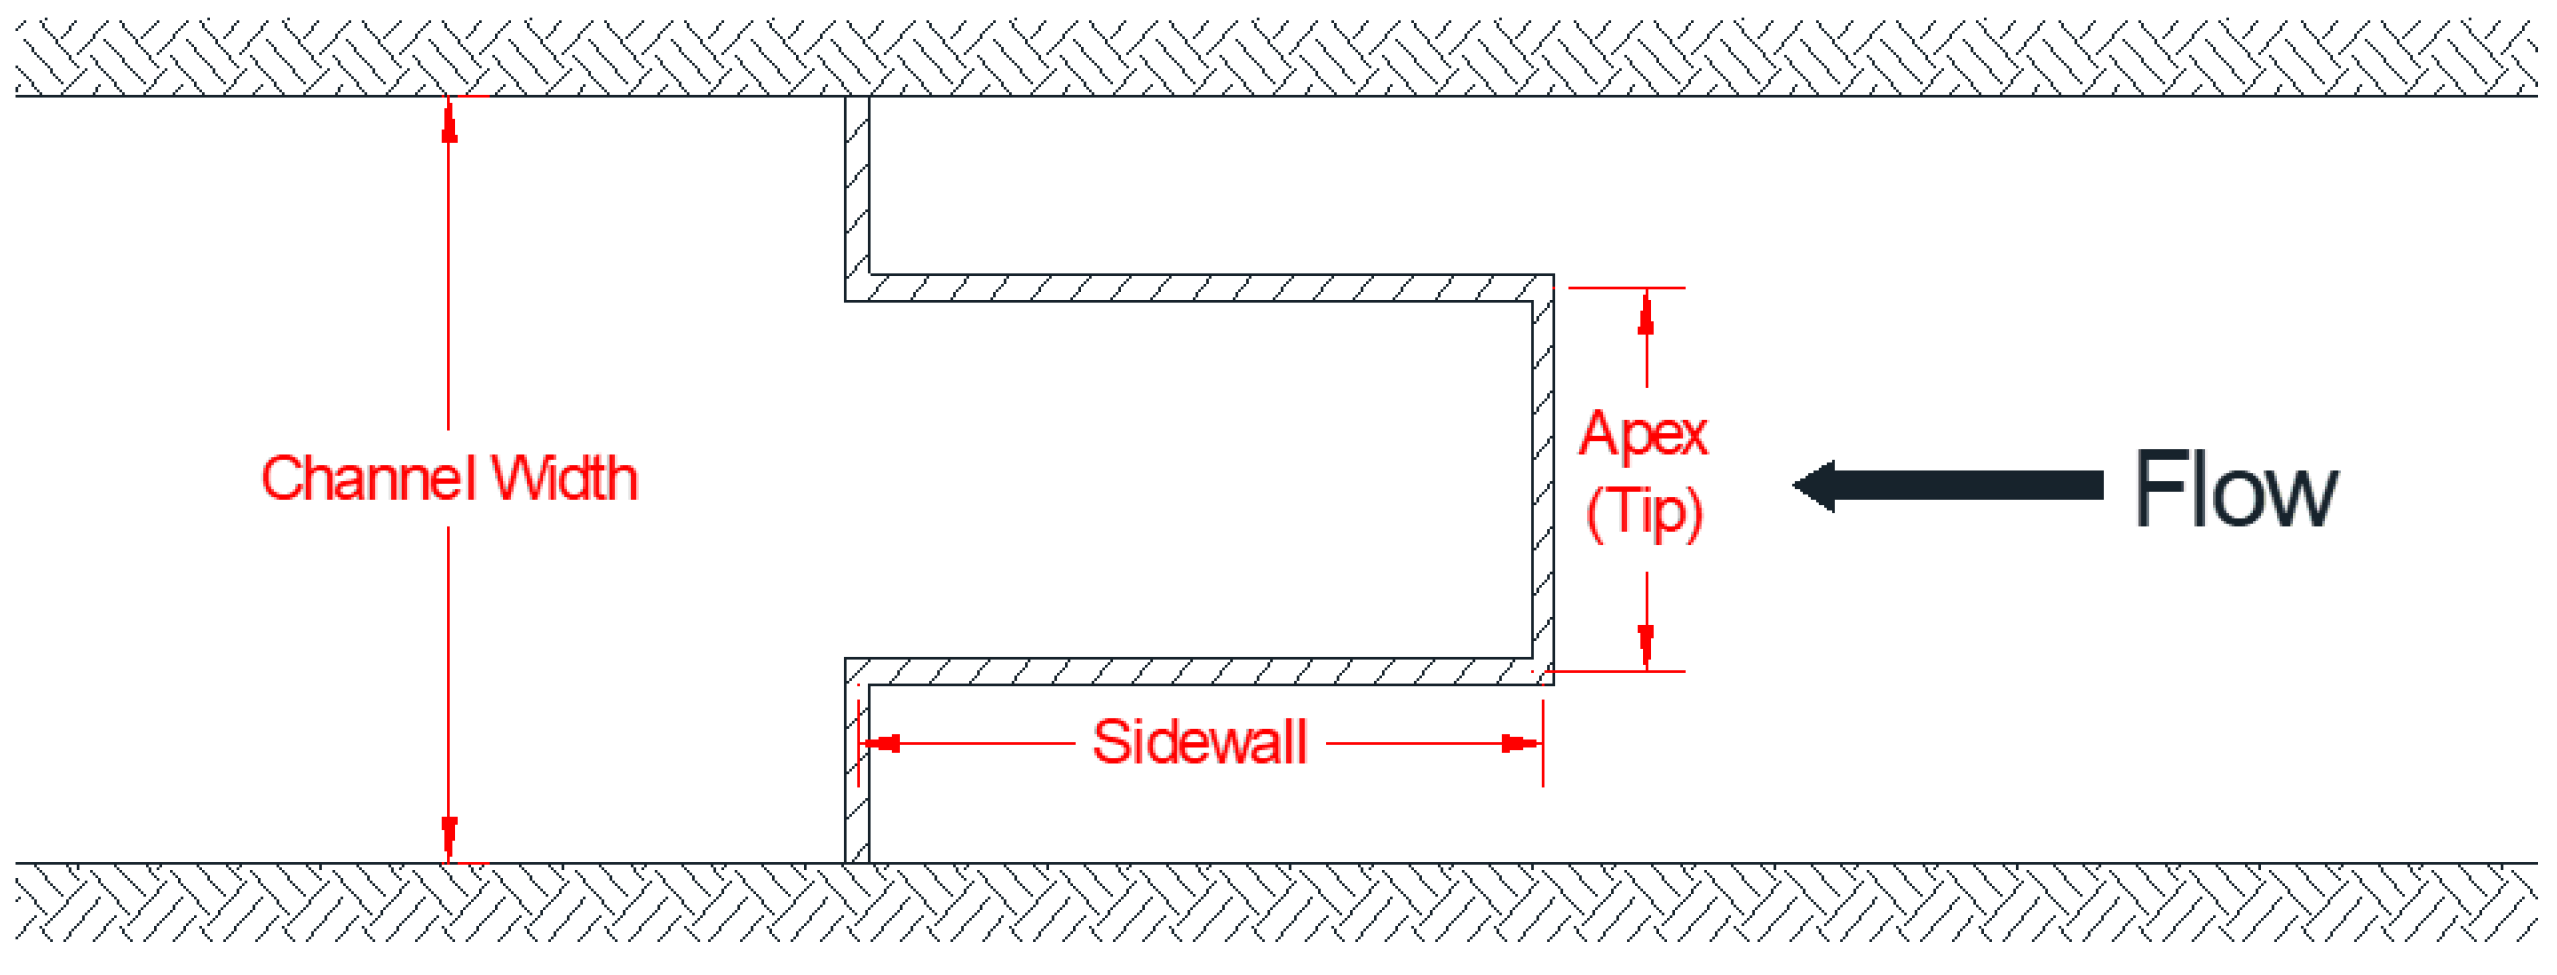
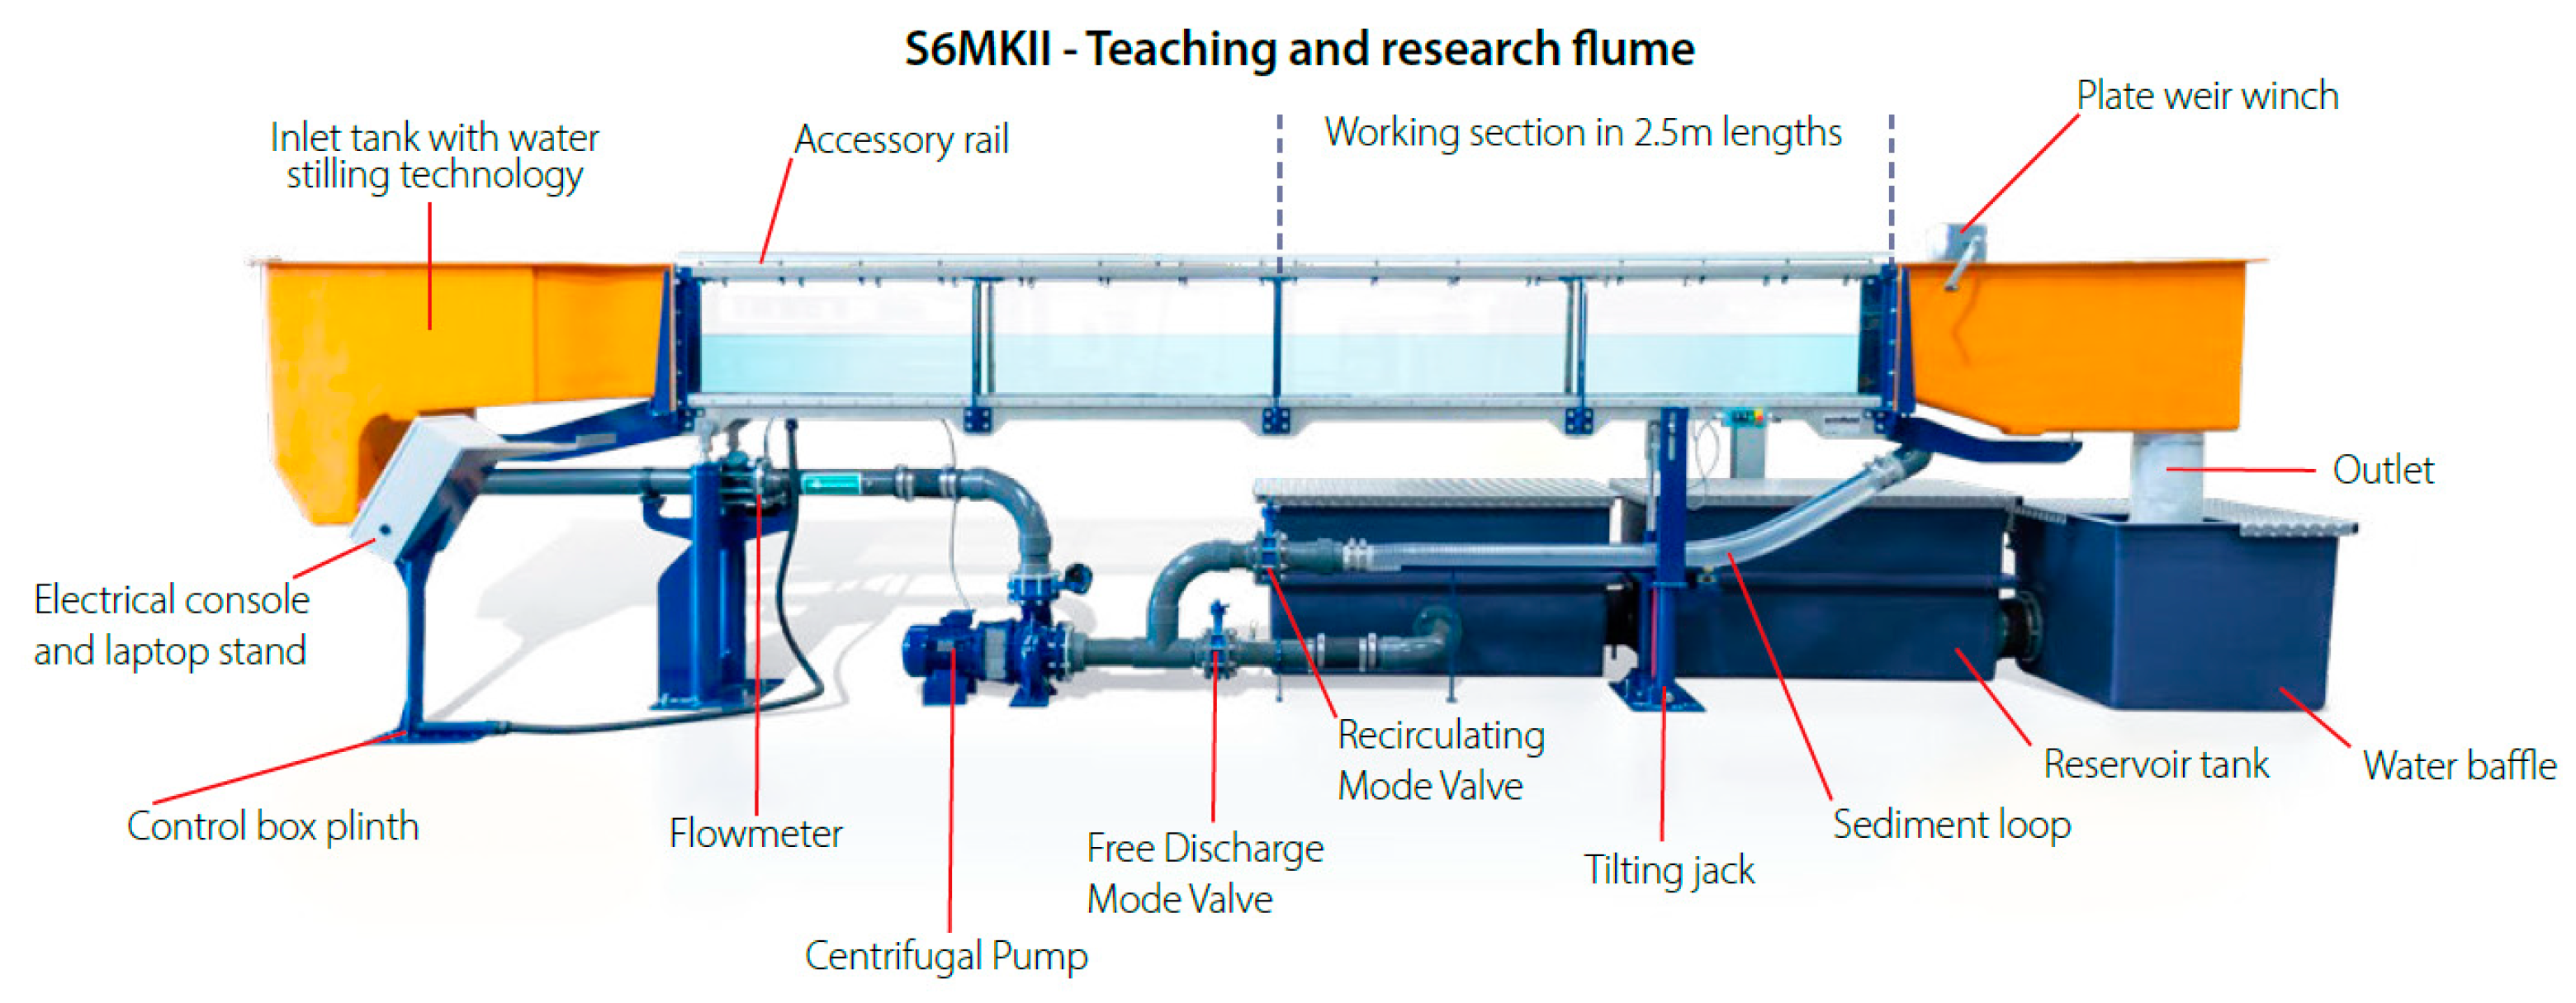
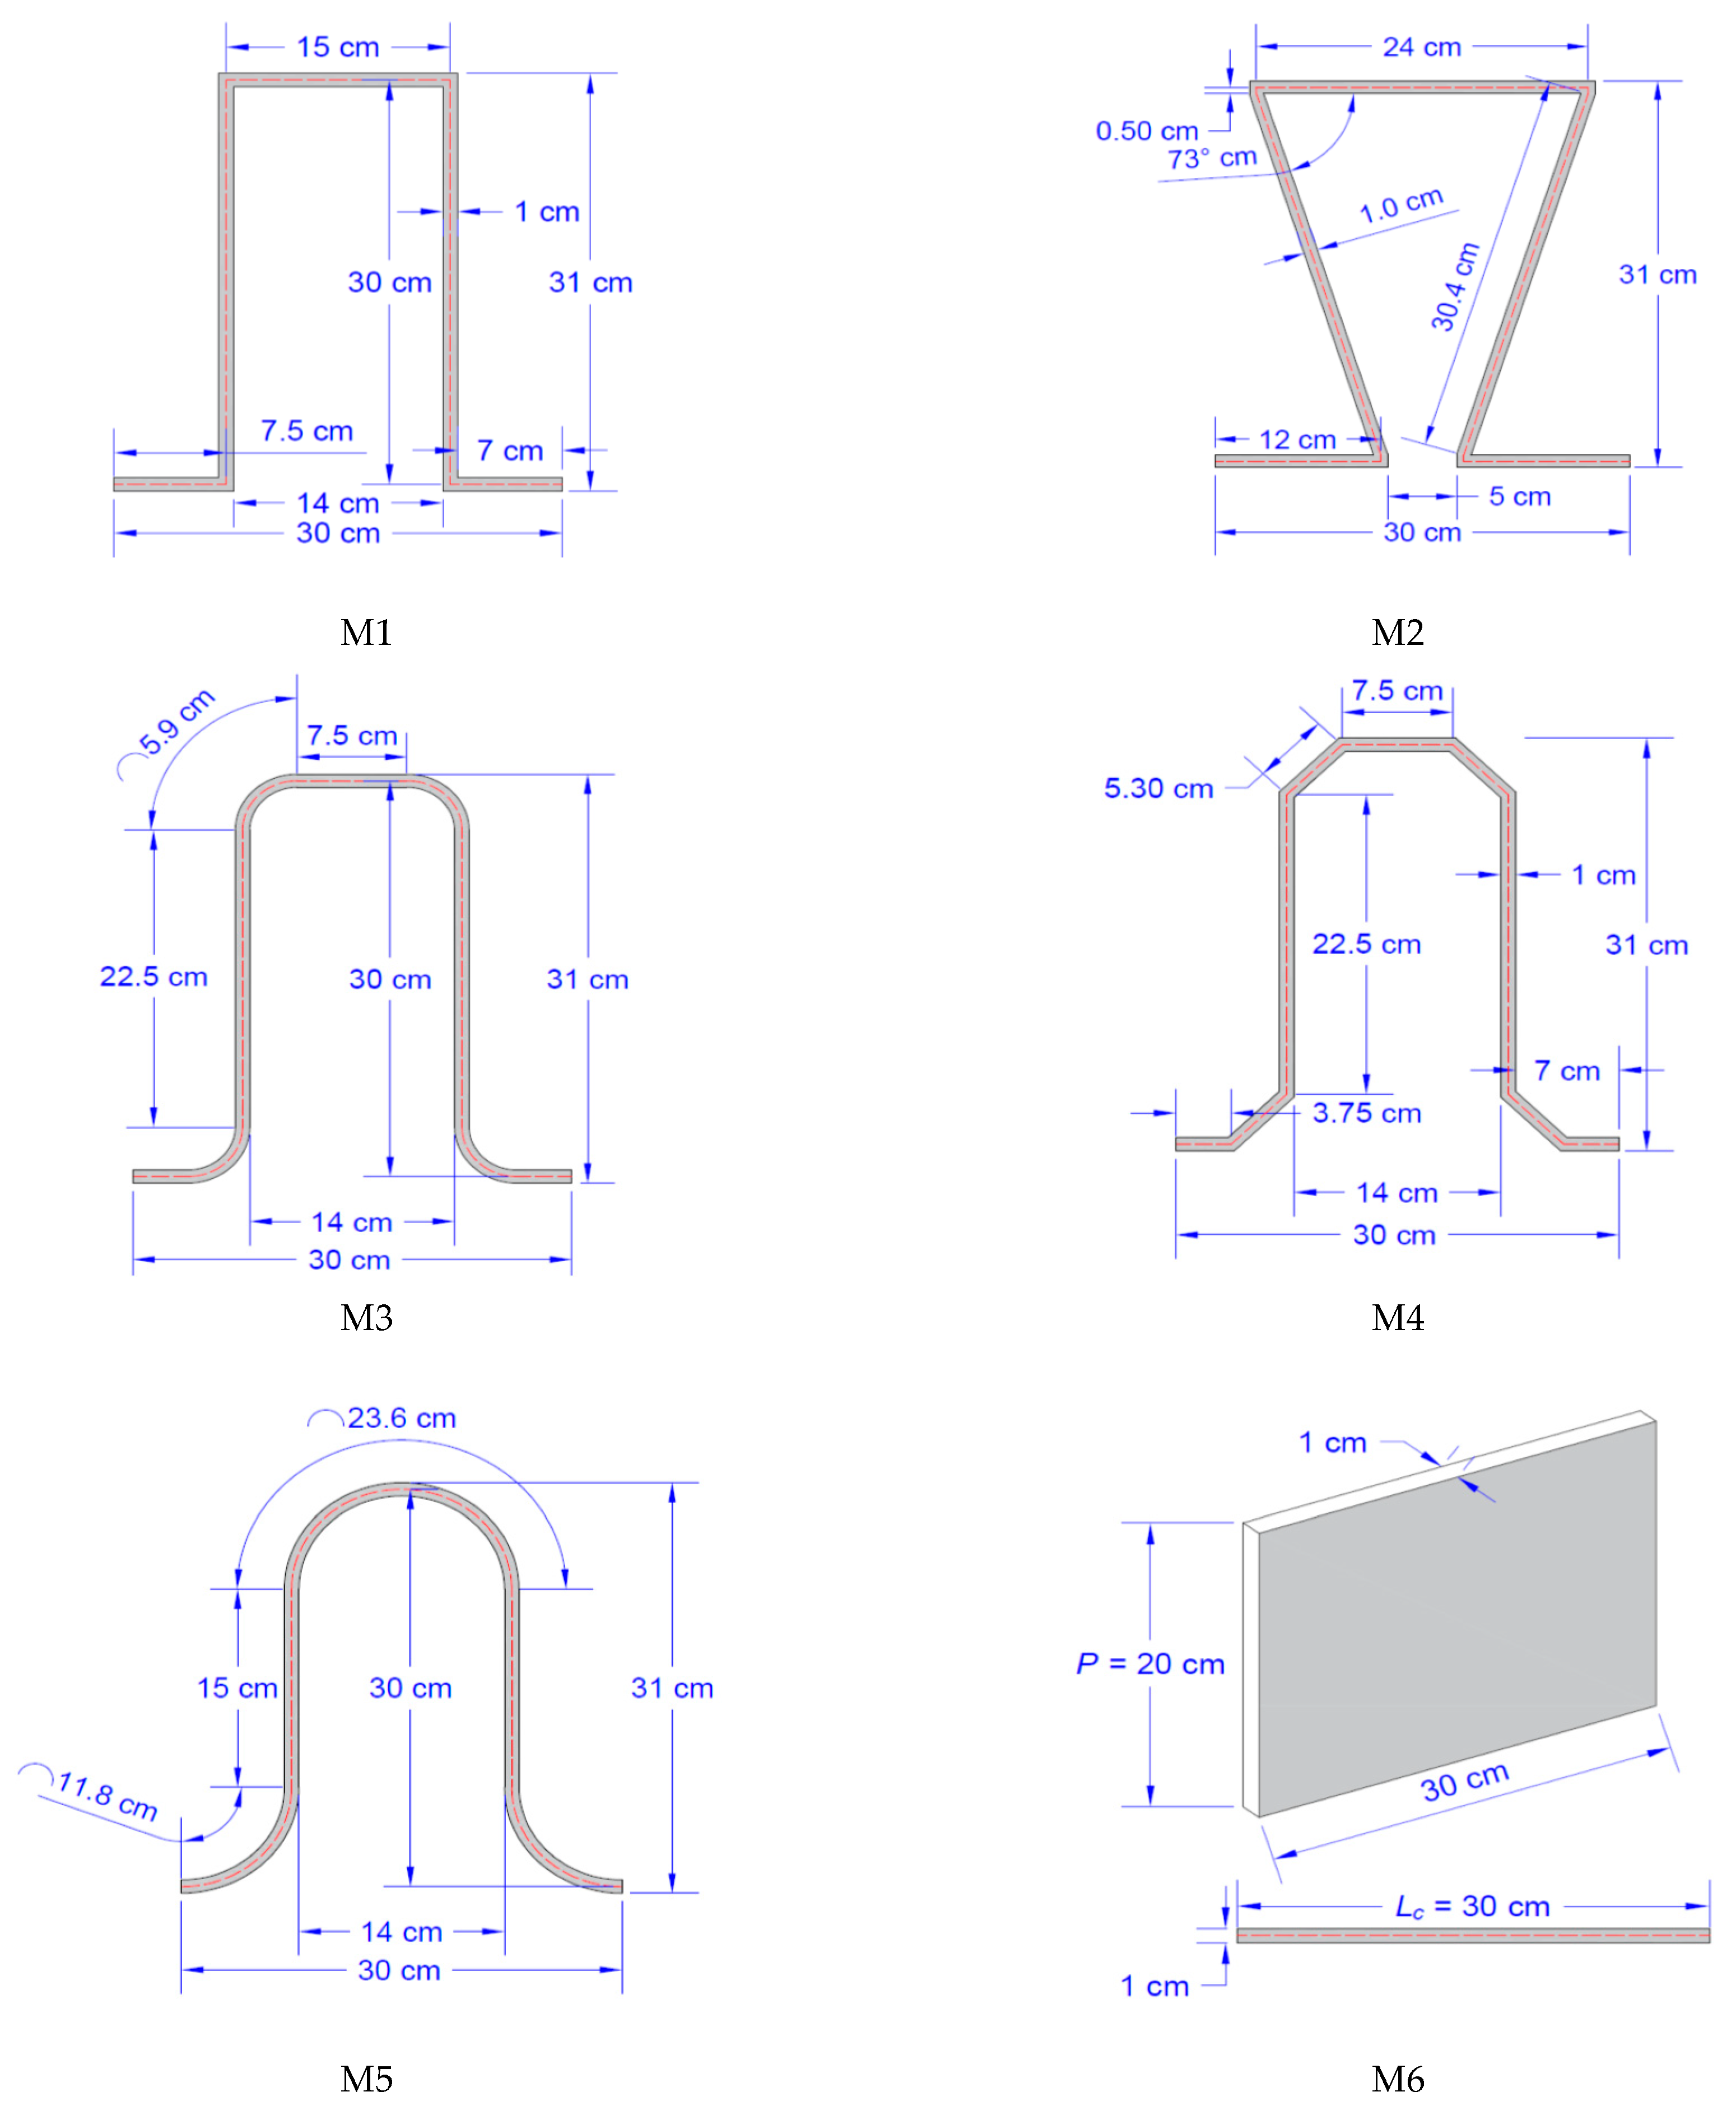
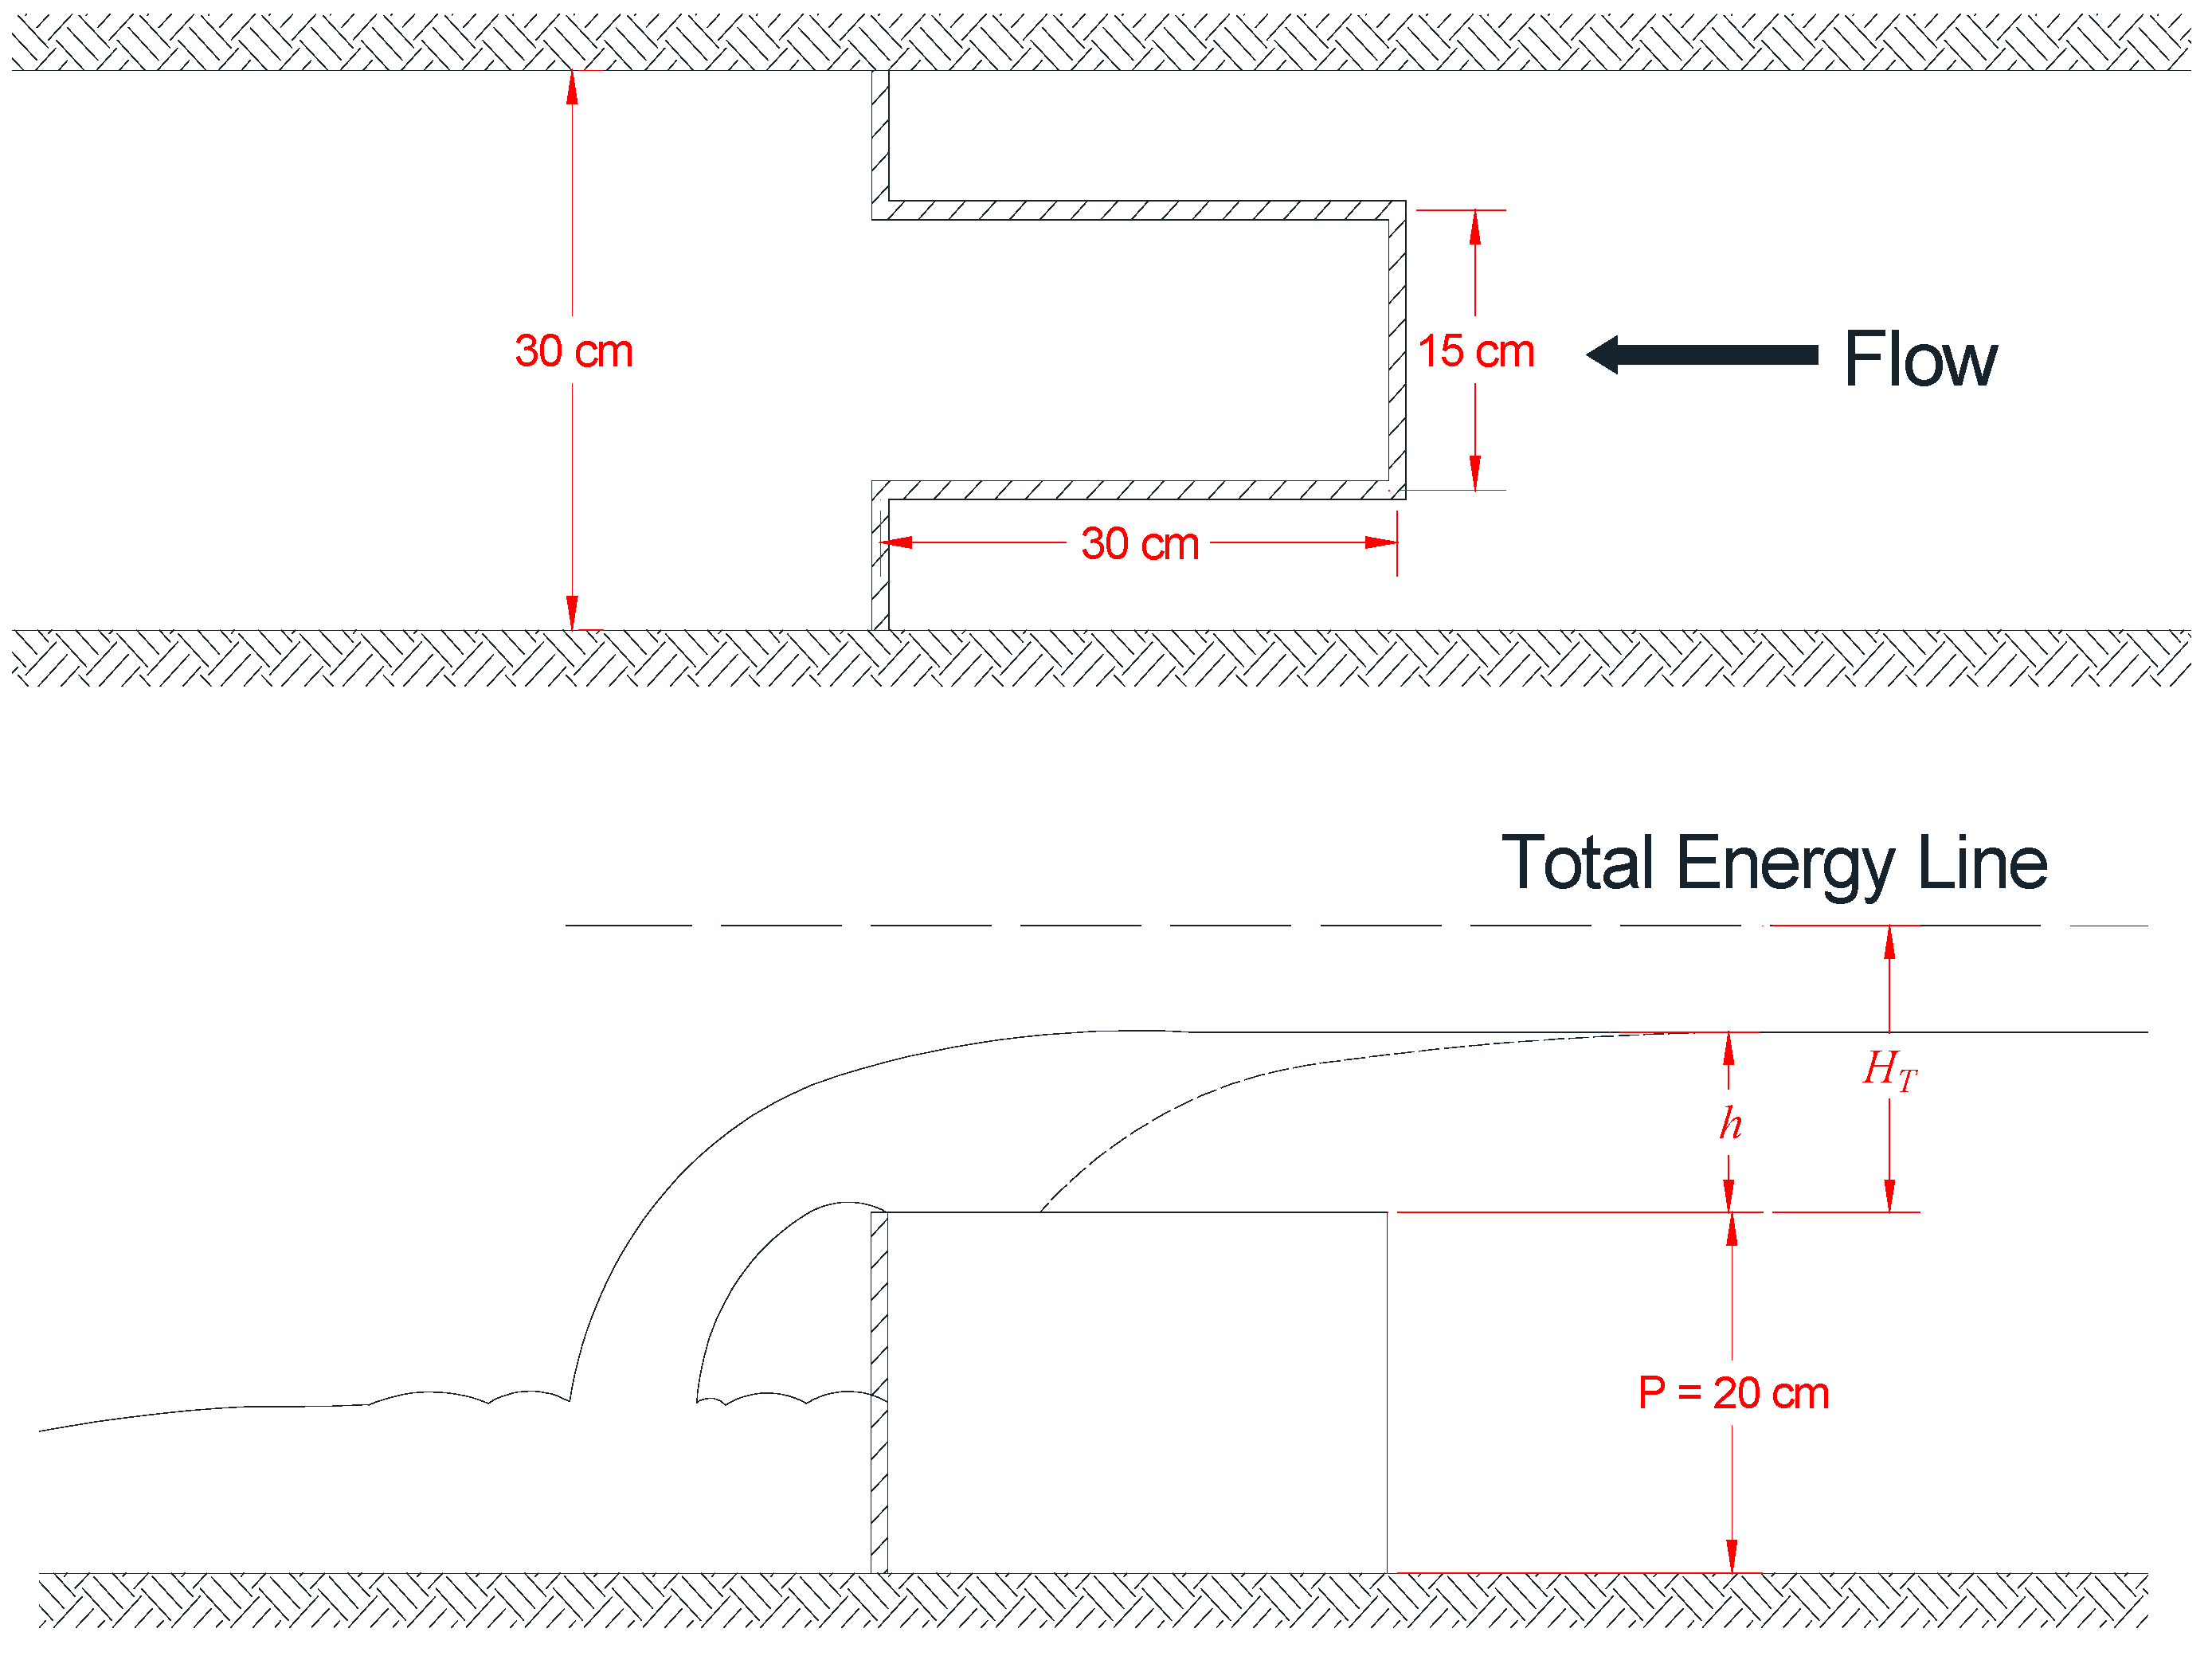
2. Experimental Works
3. Analysis of Results
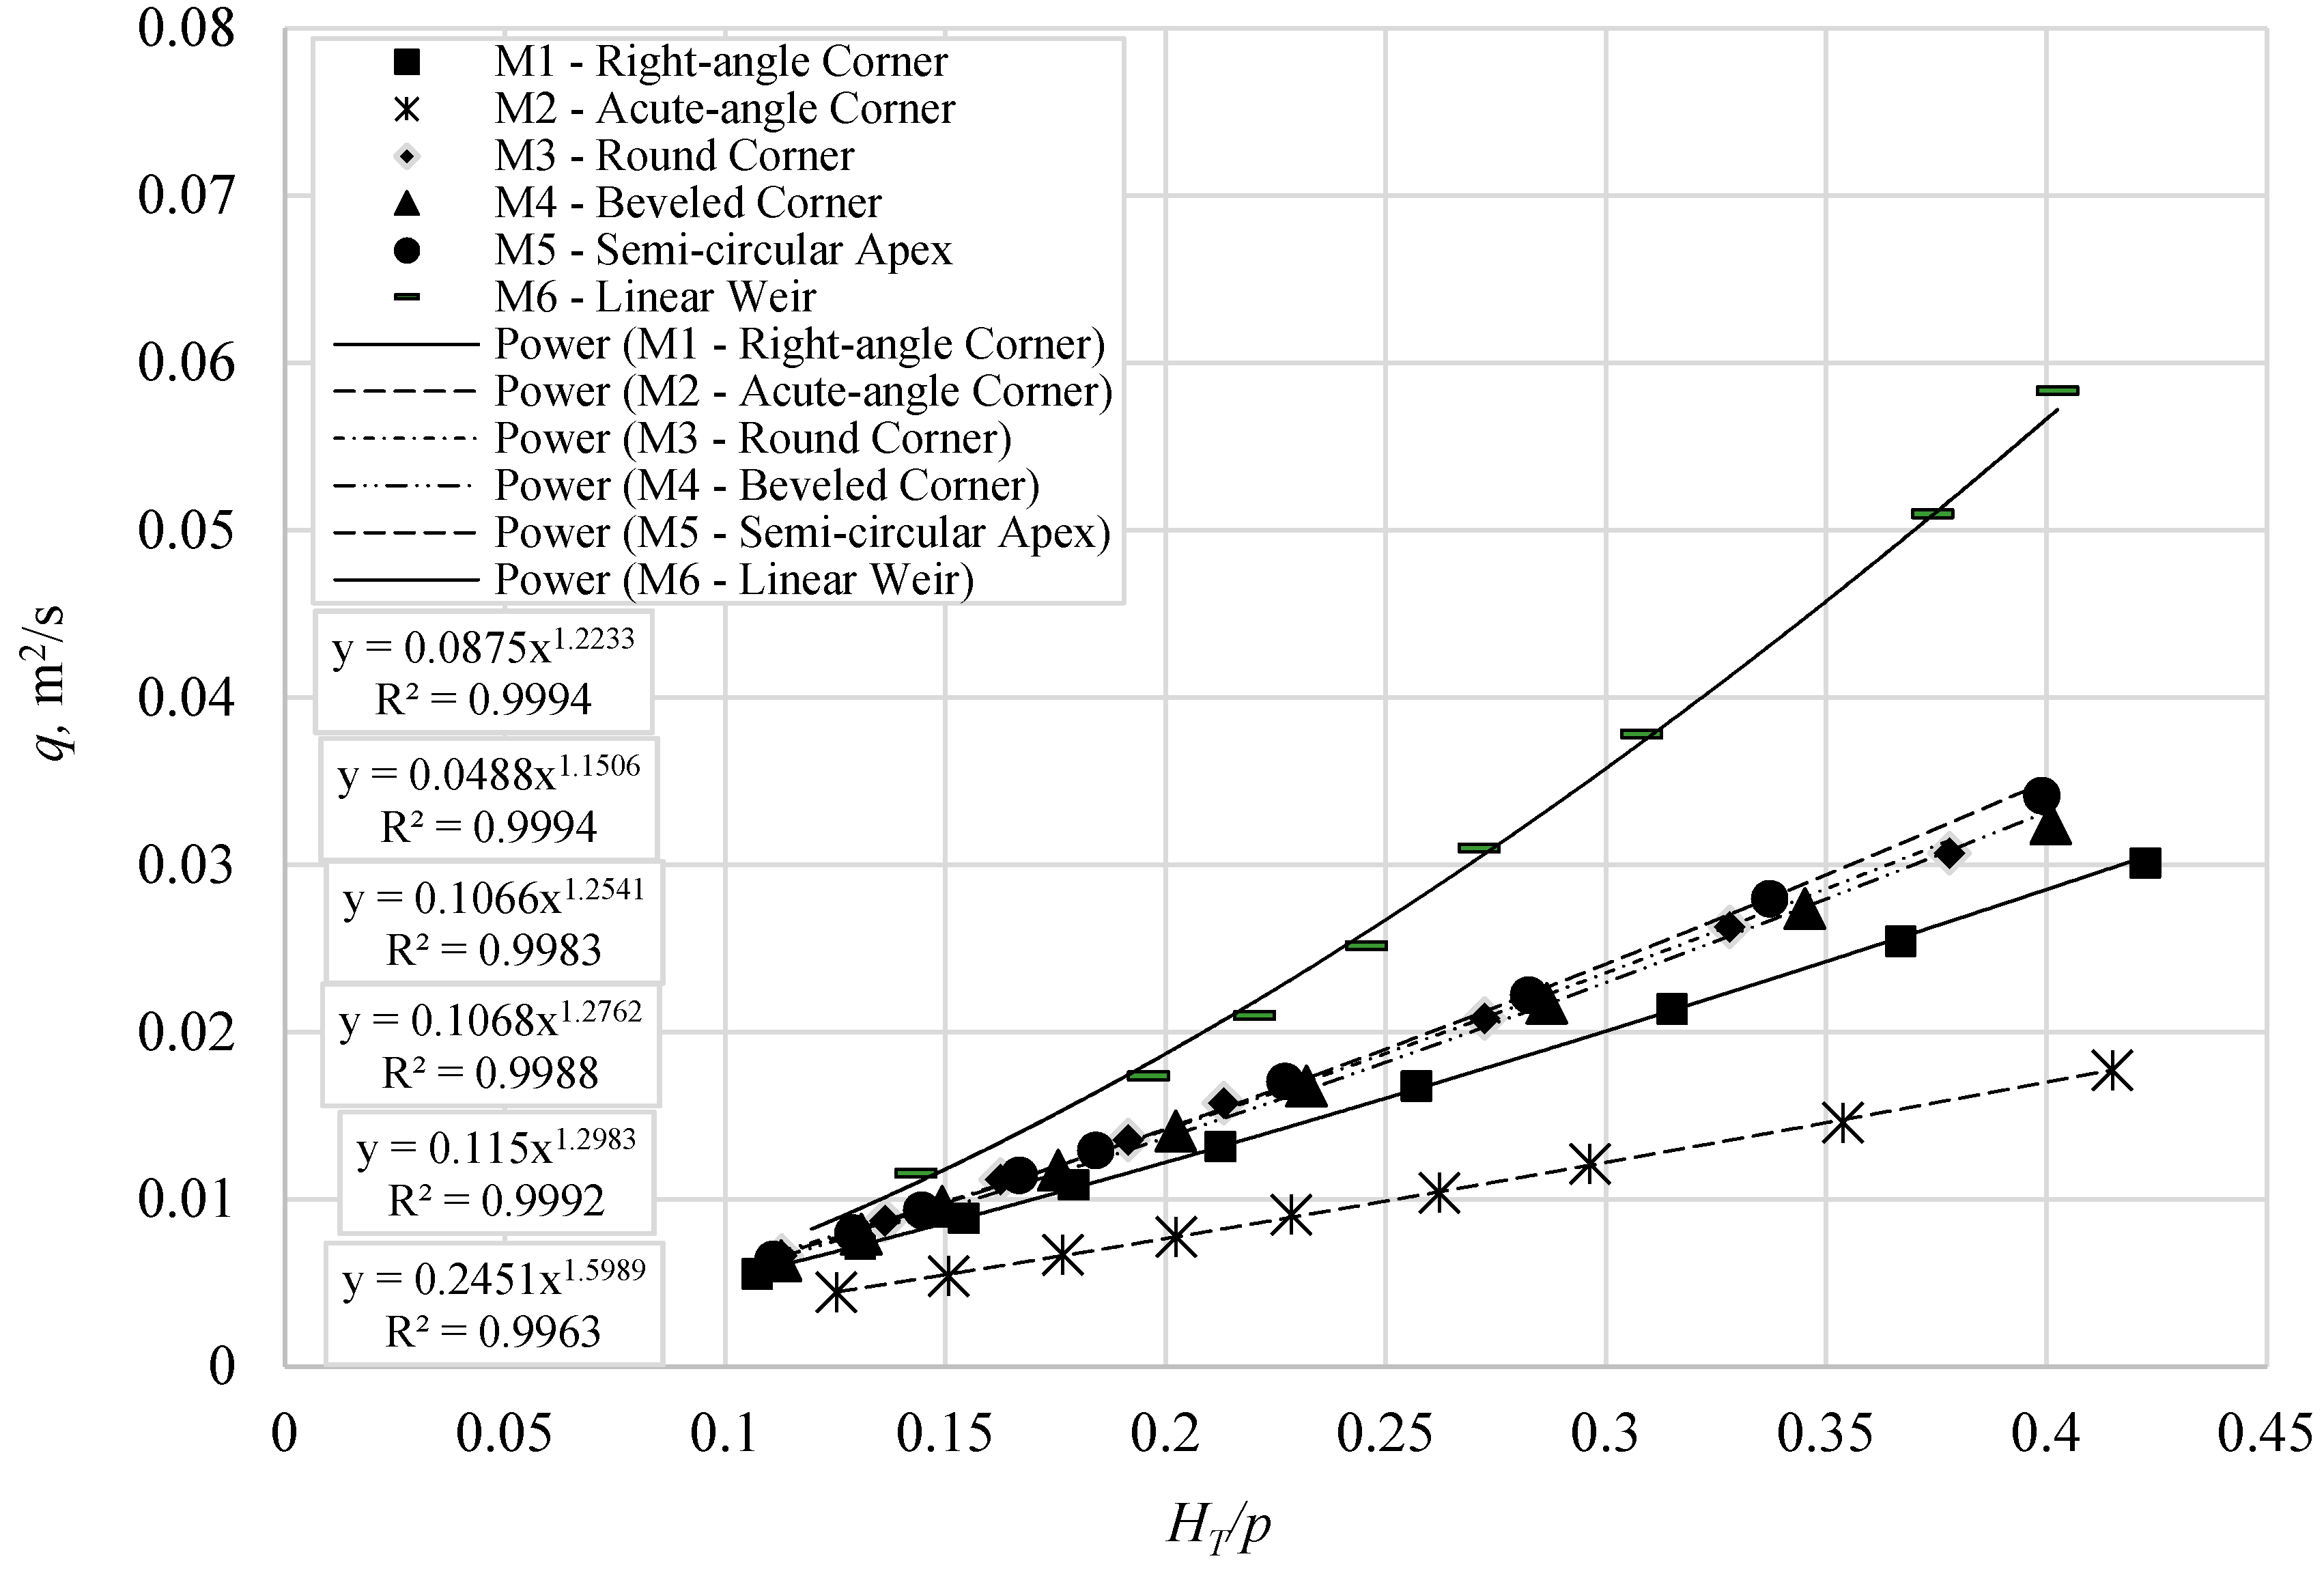
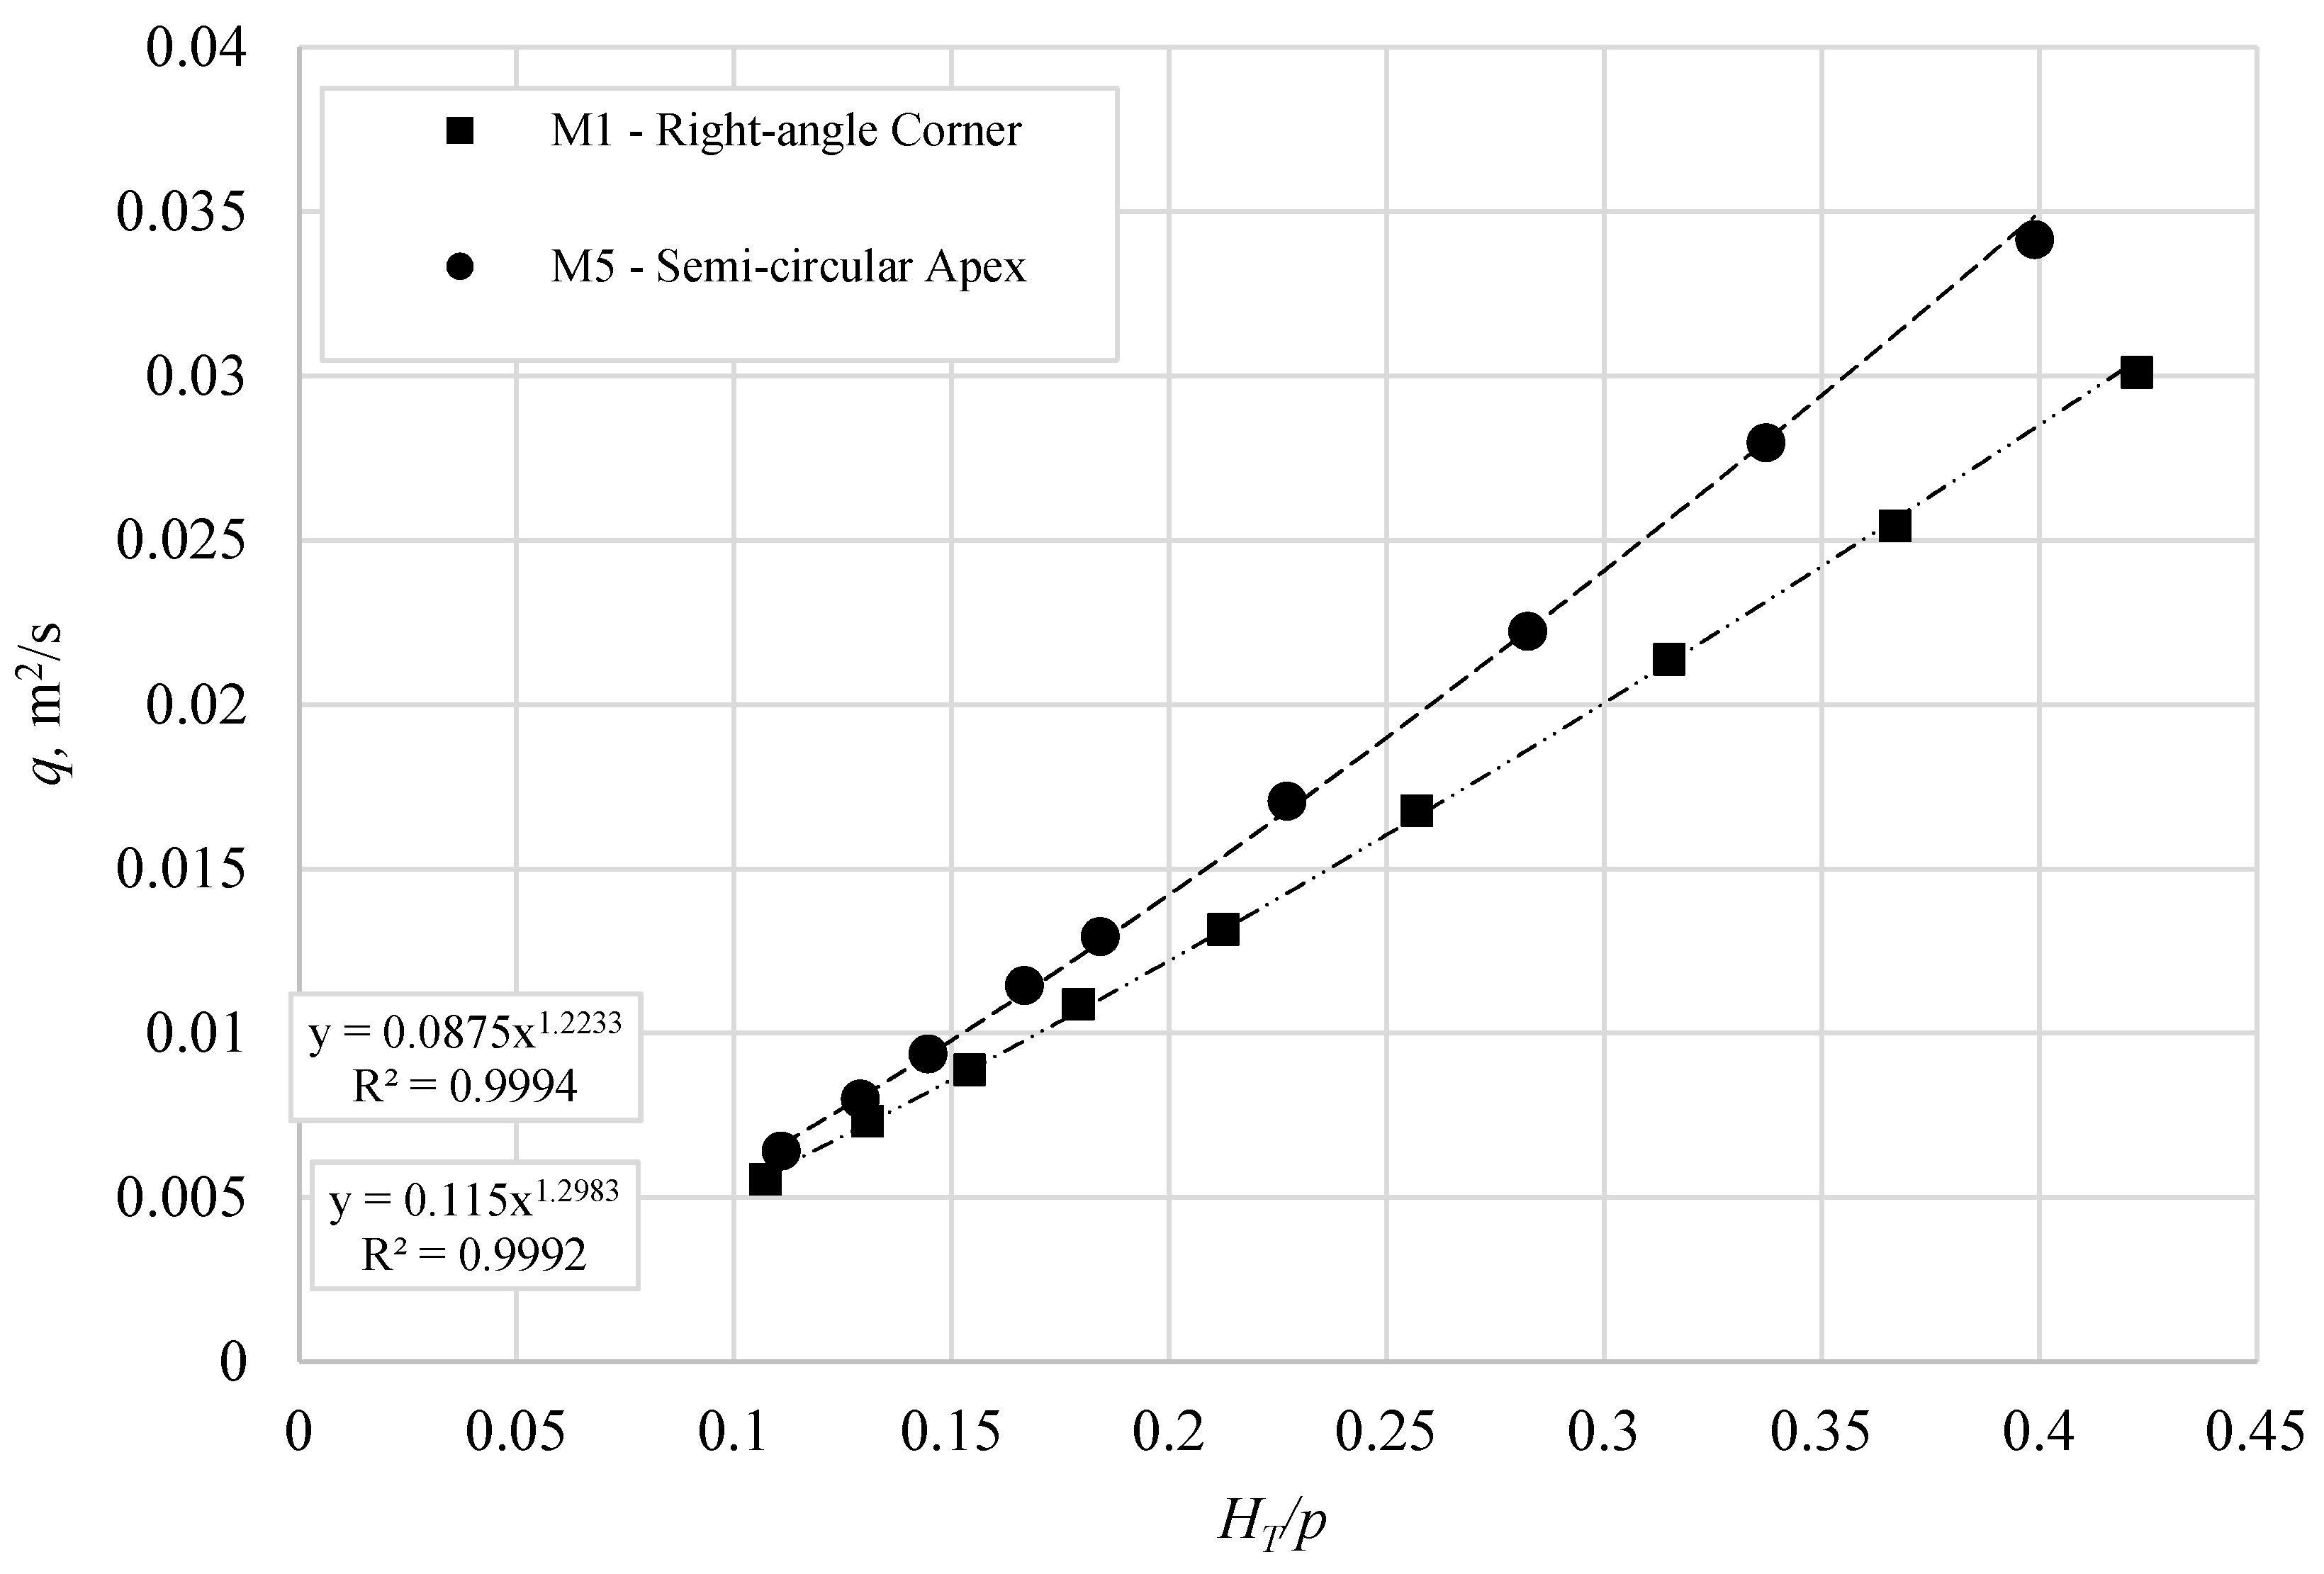
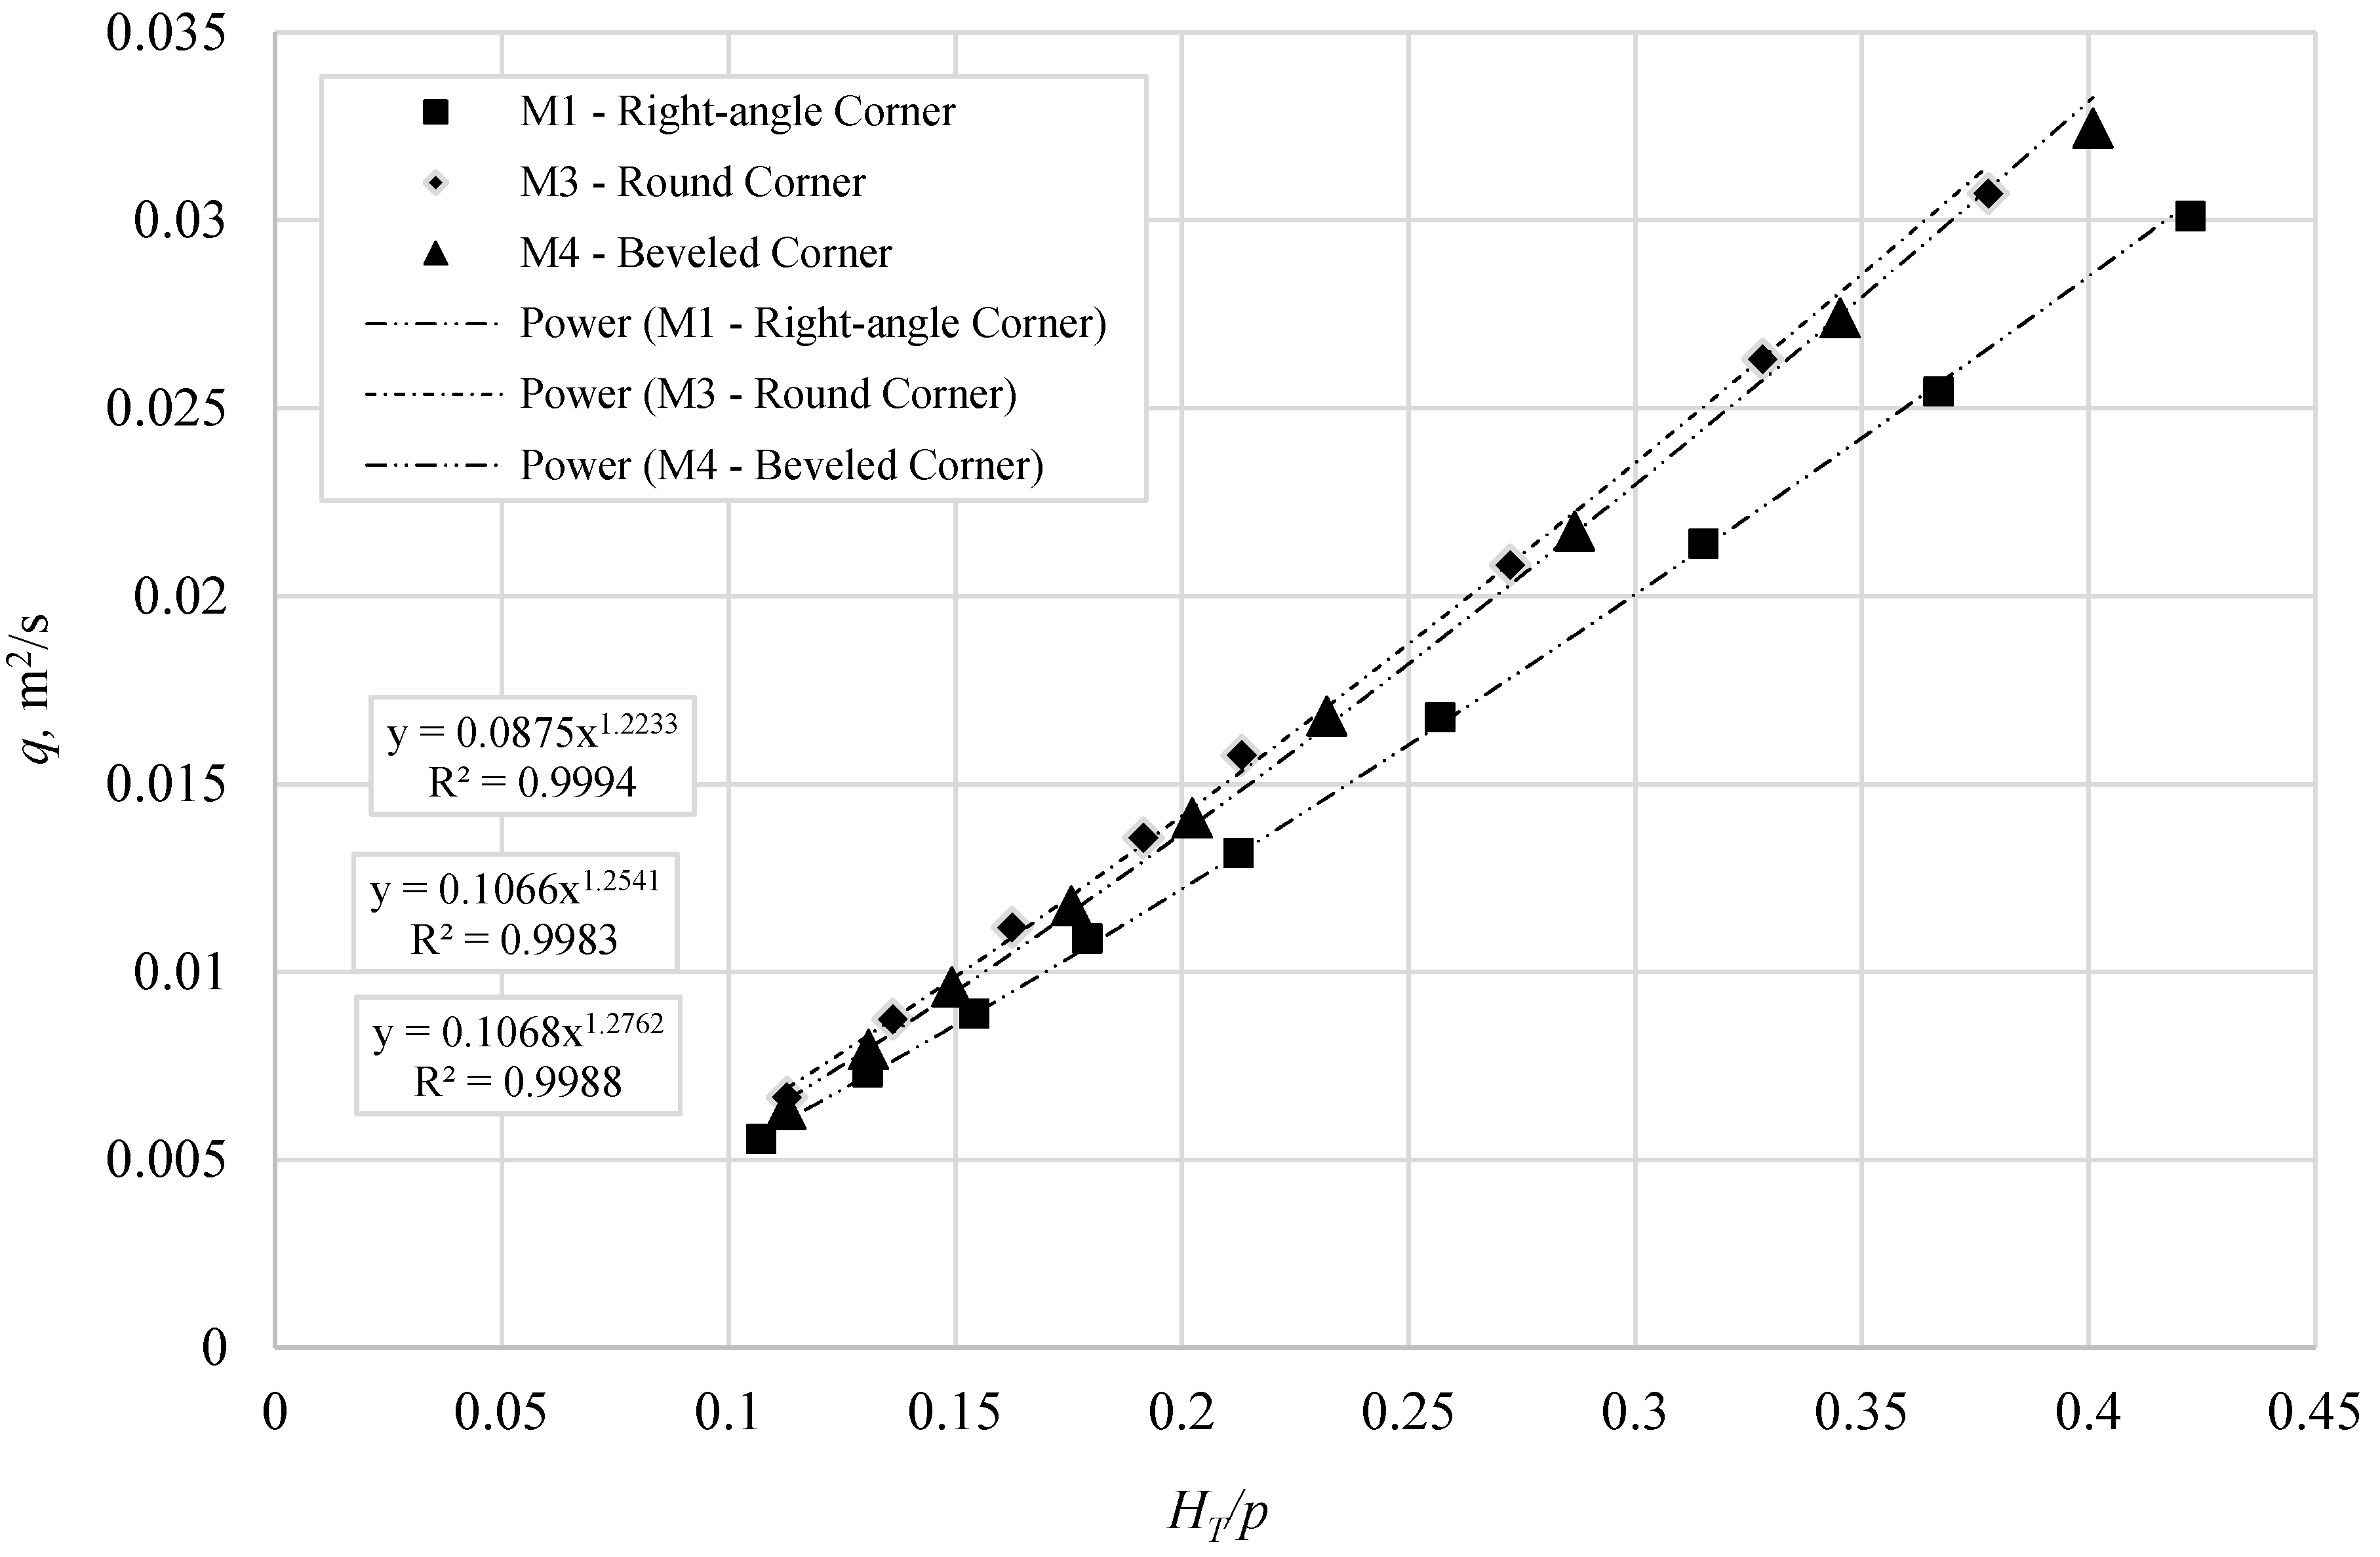
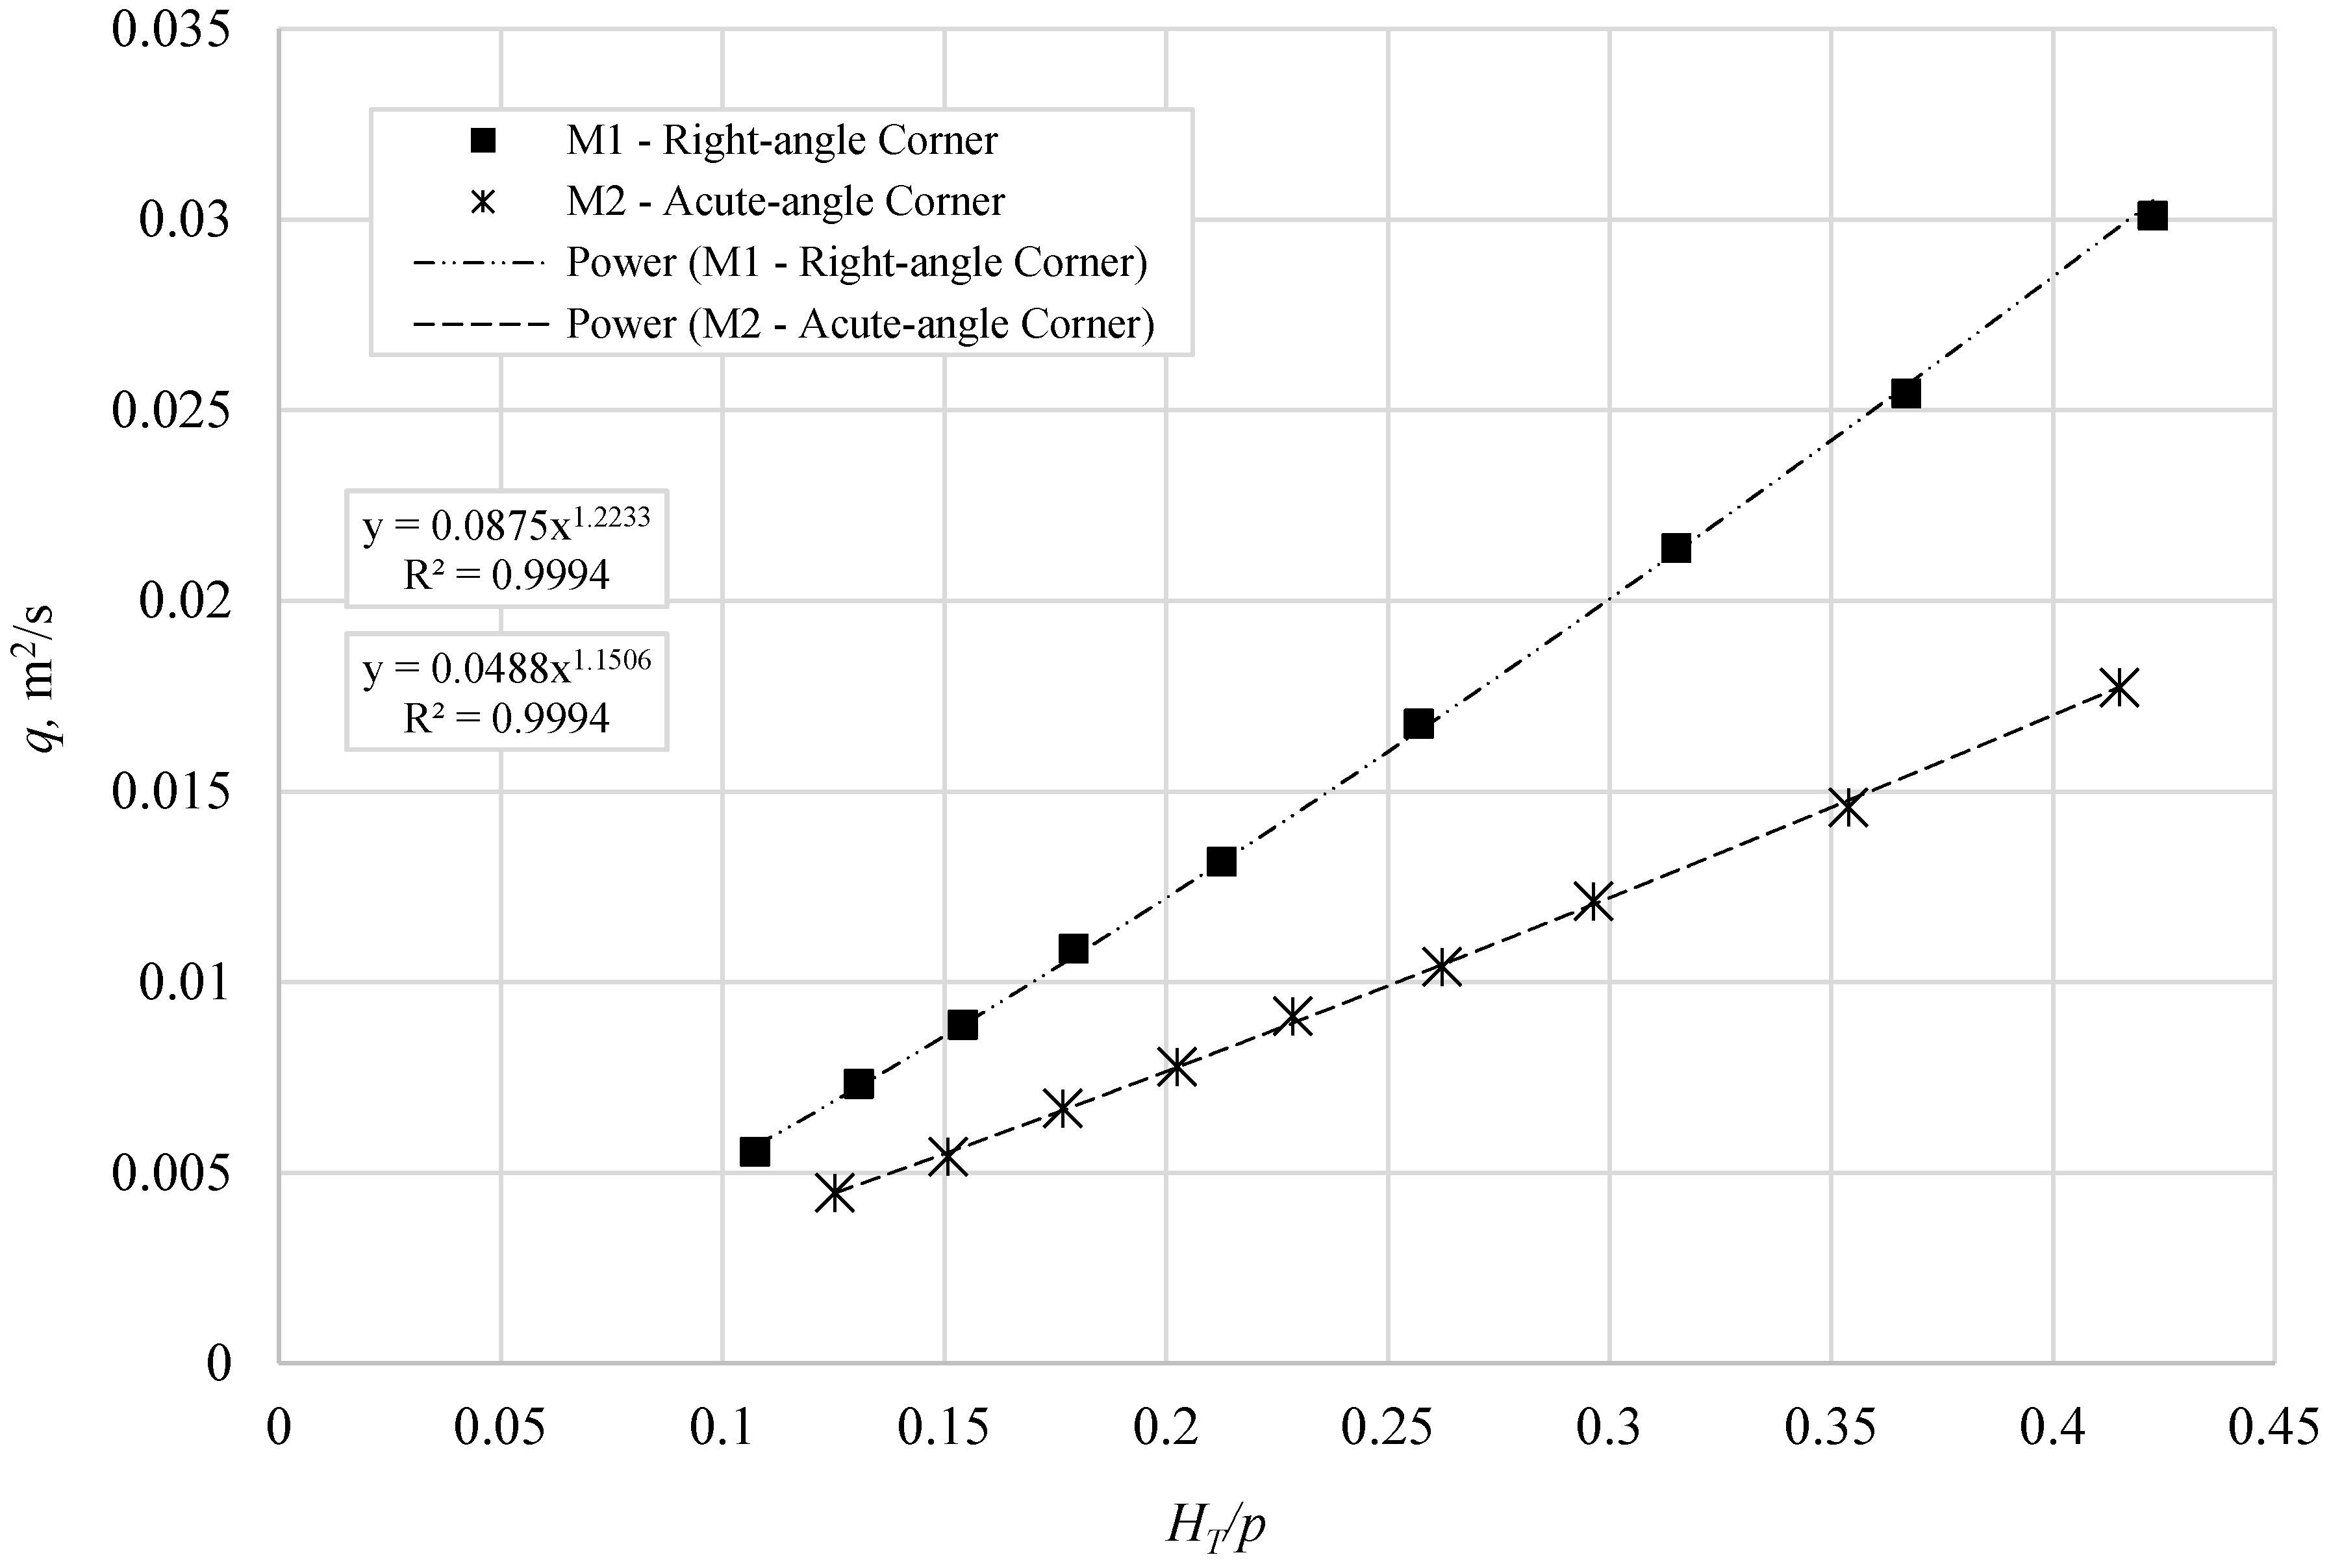
3.1. Hydraulic Performance of the Models
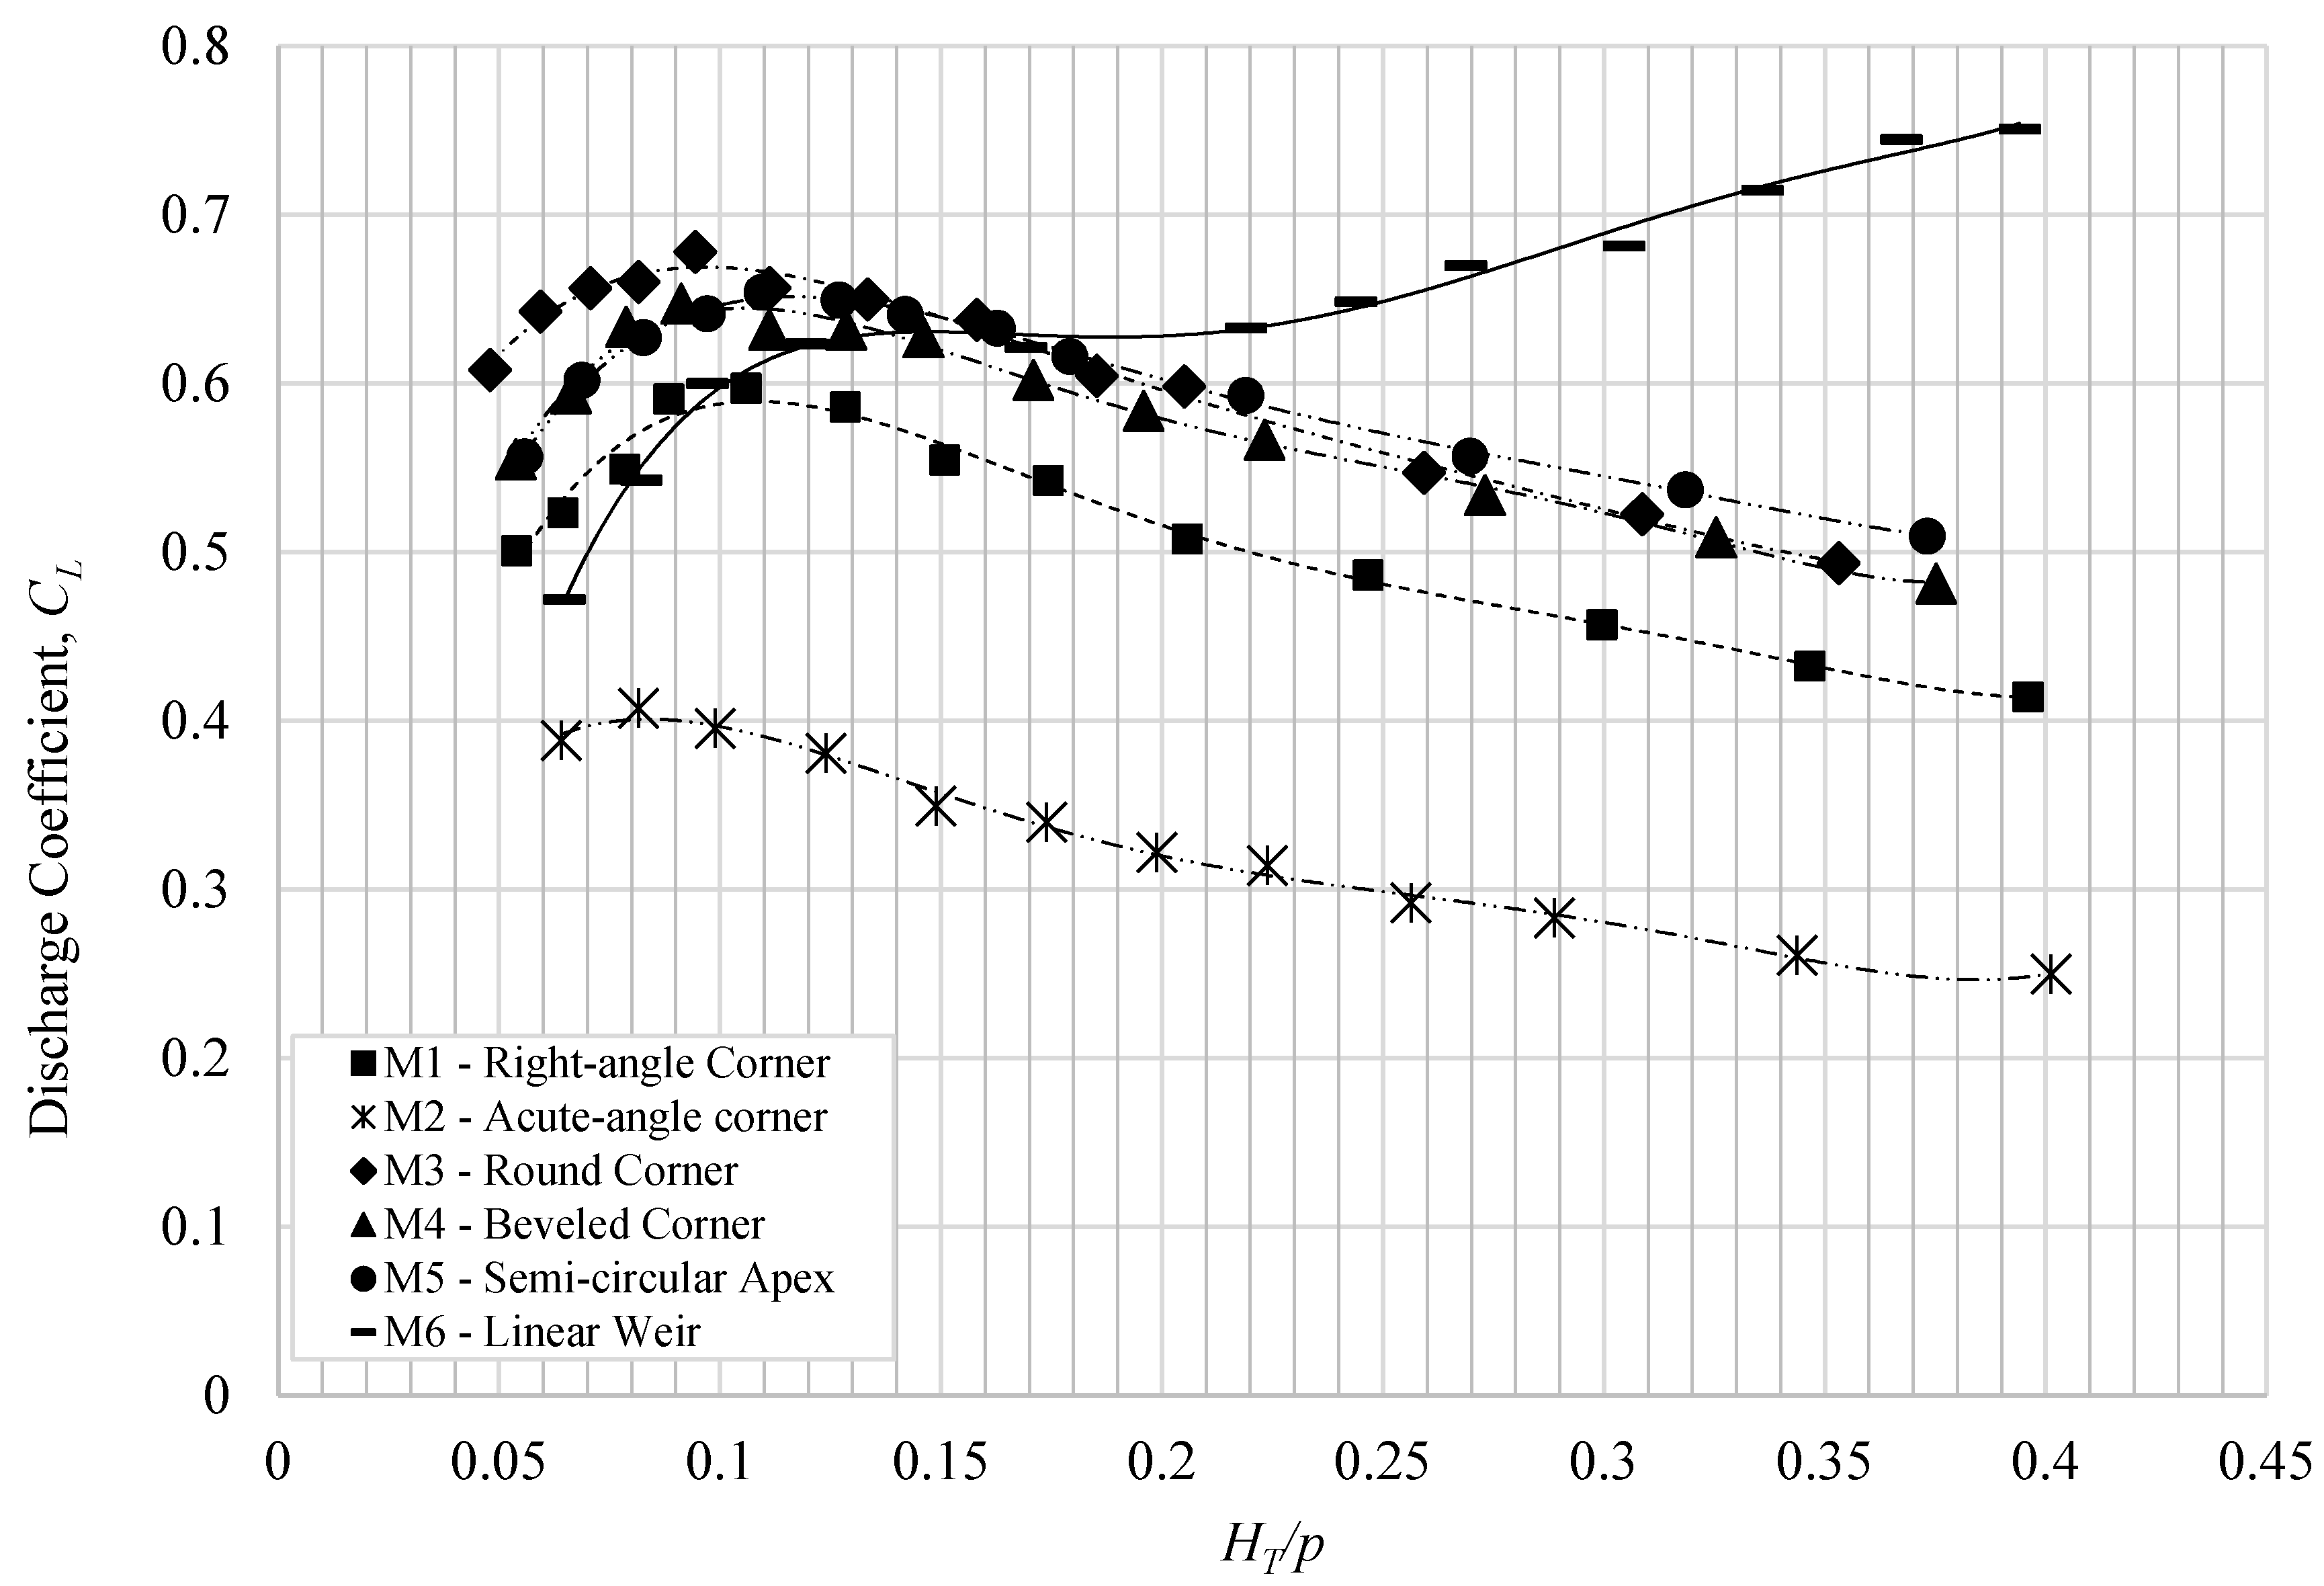
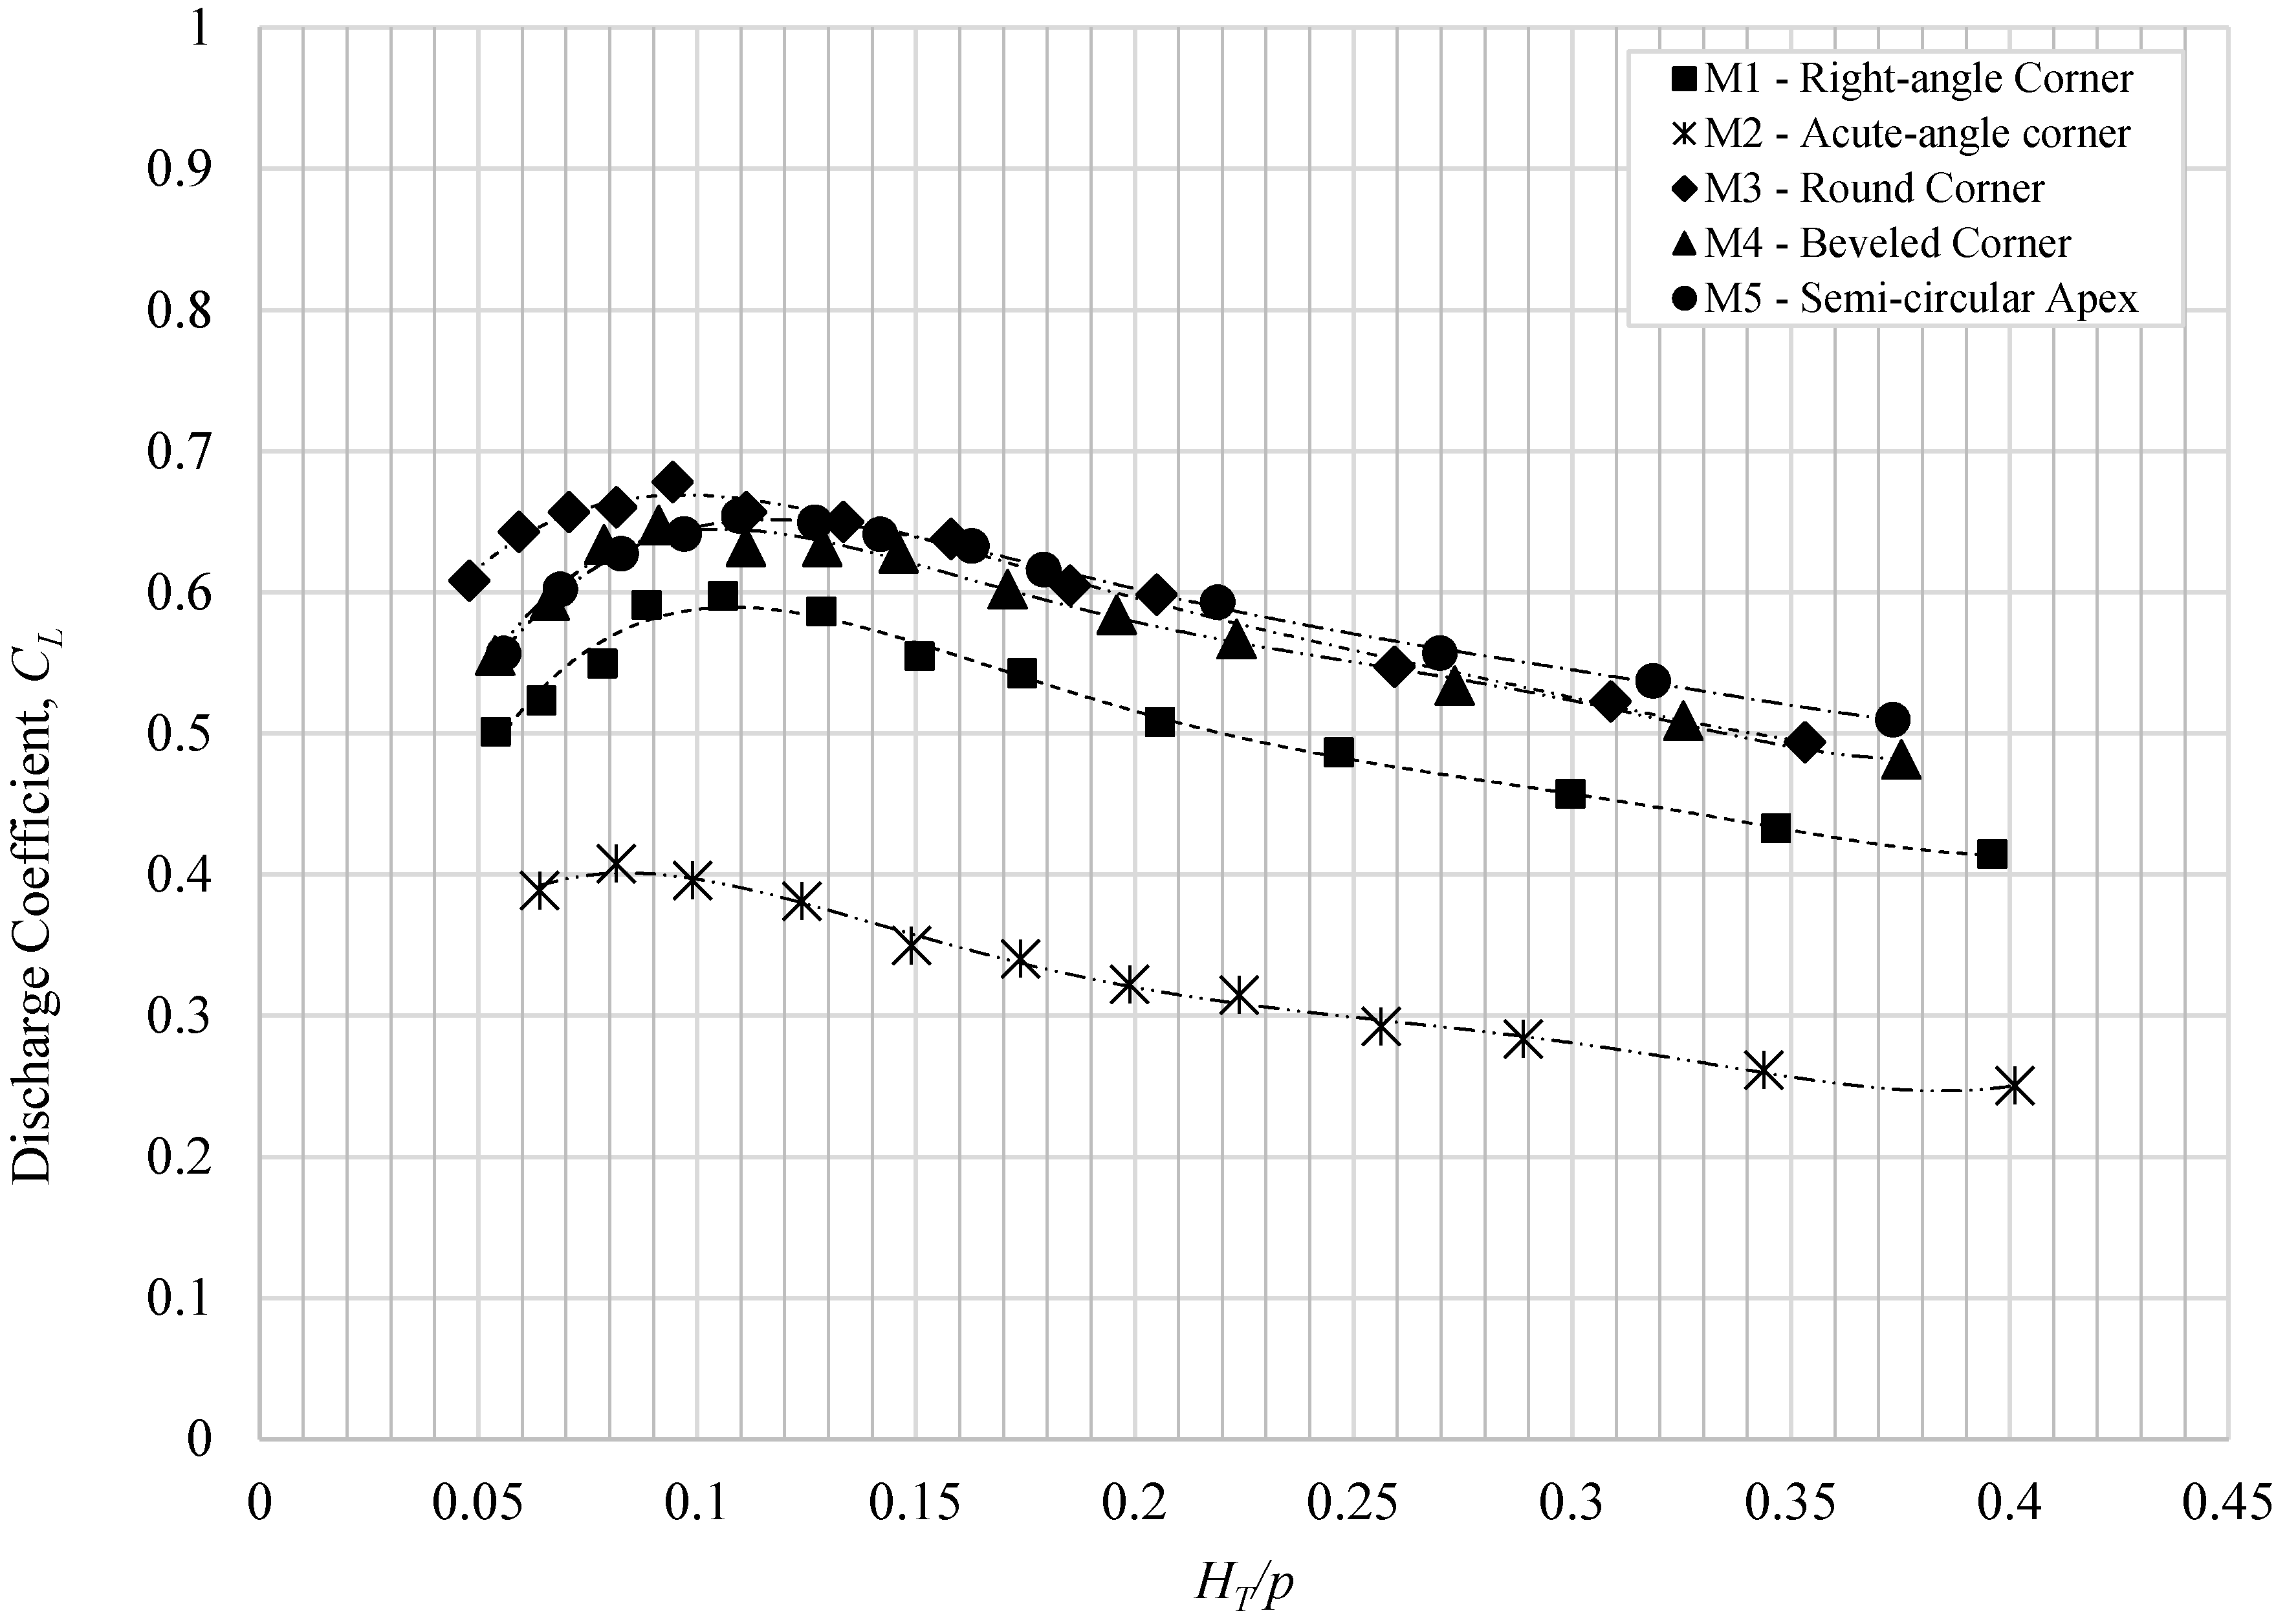
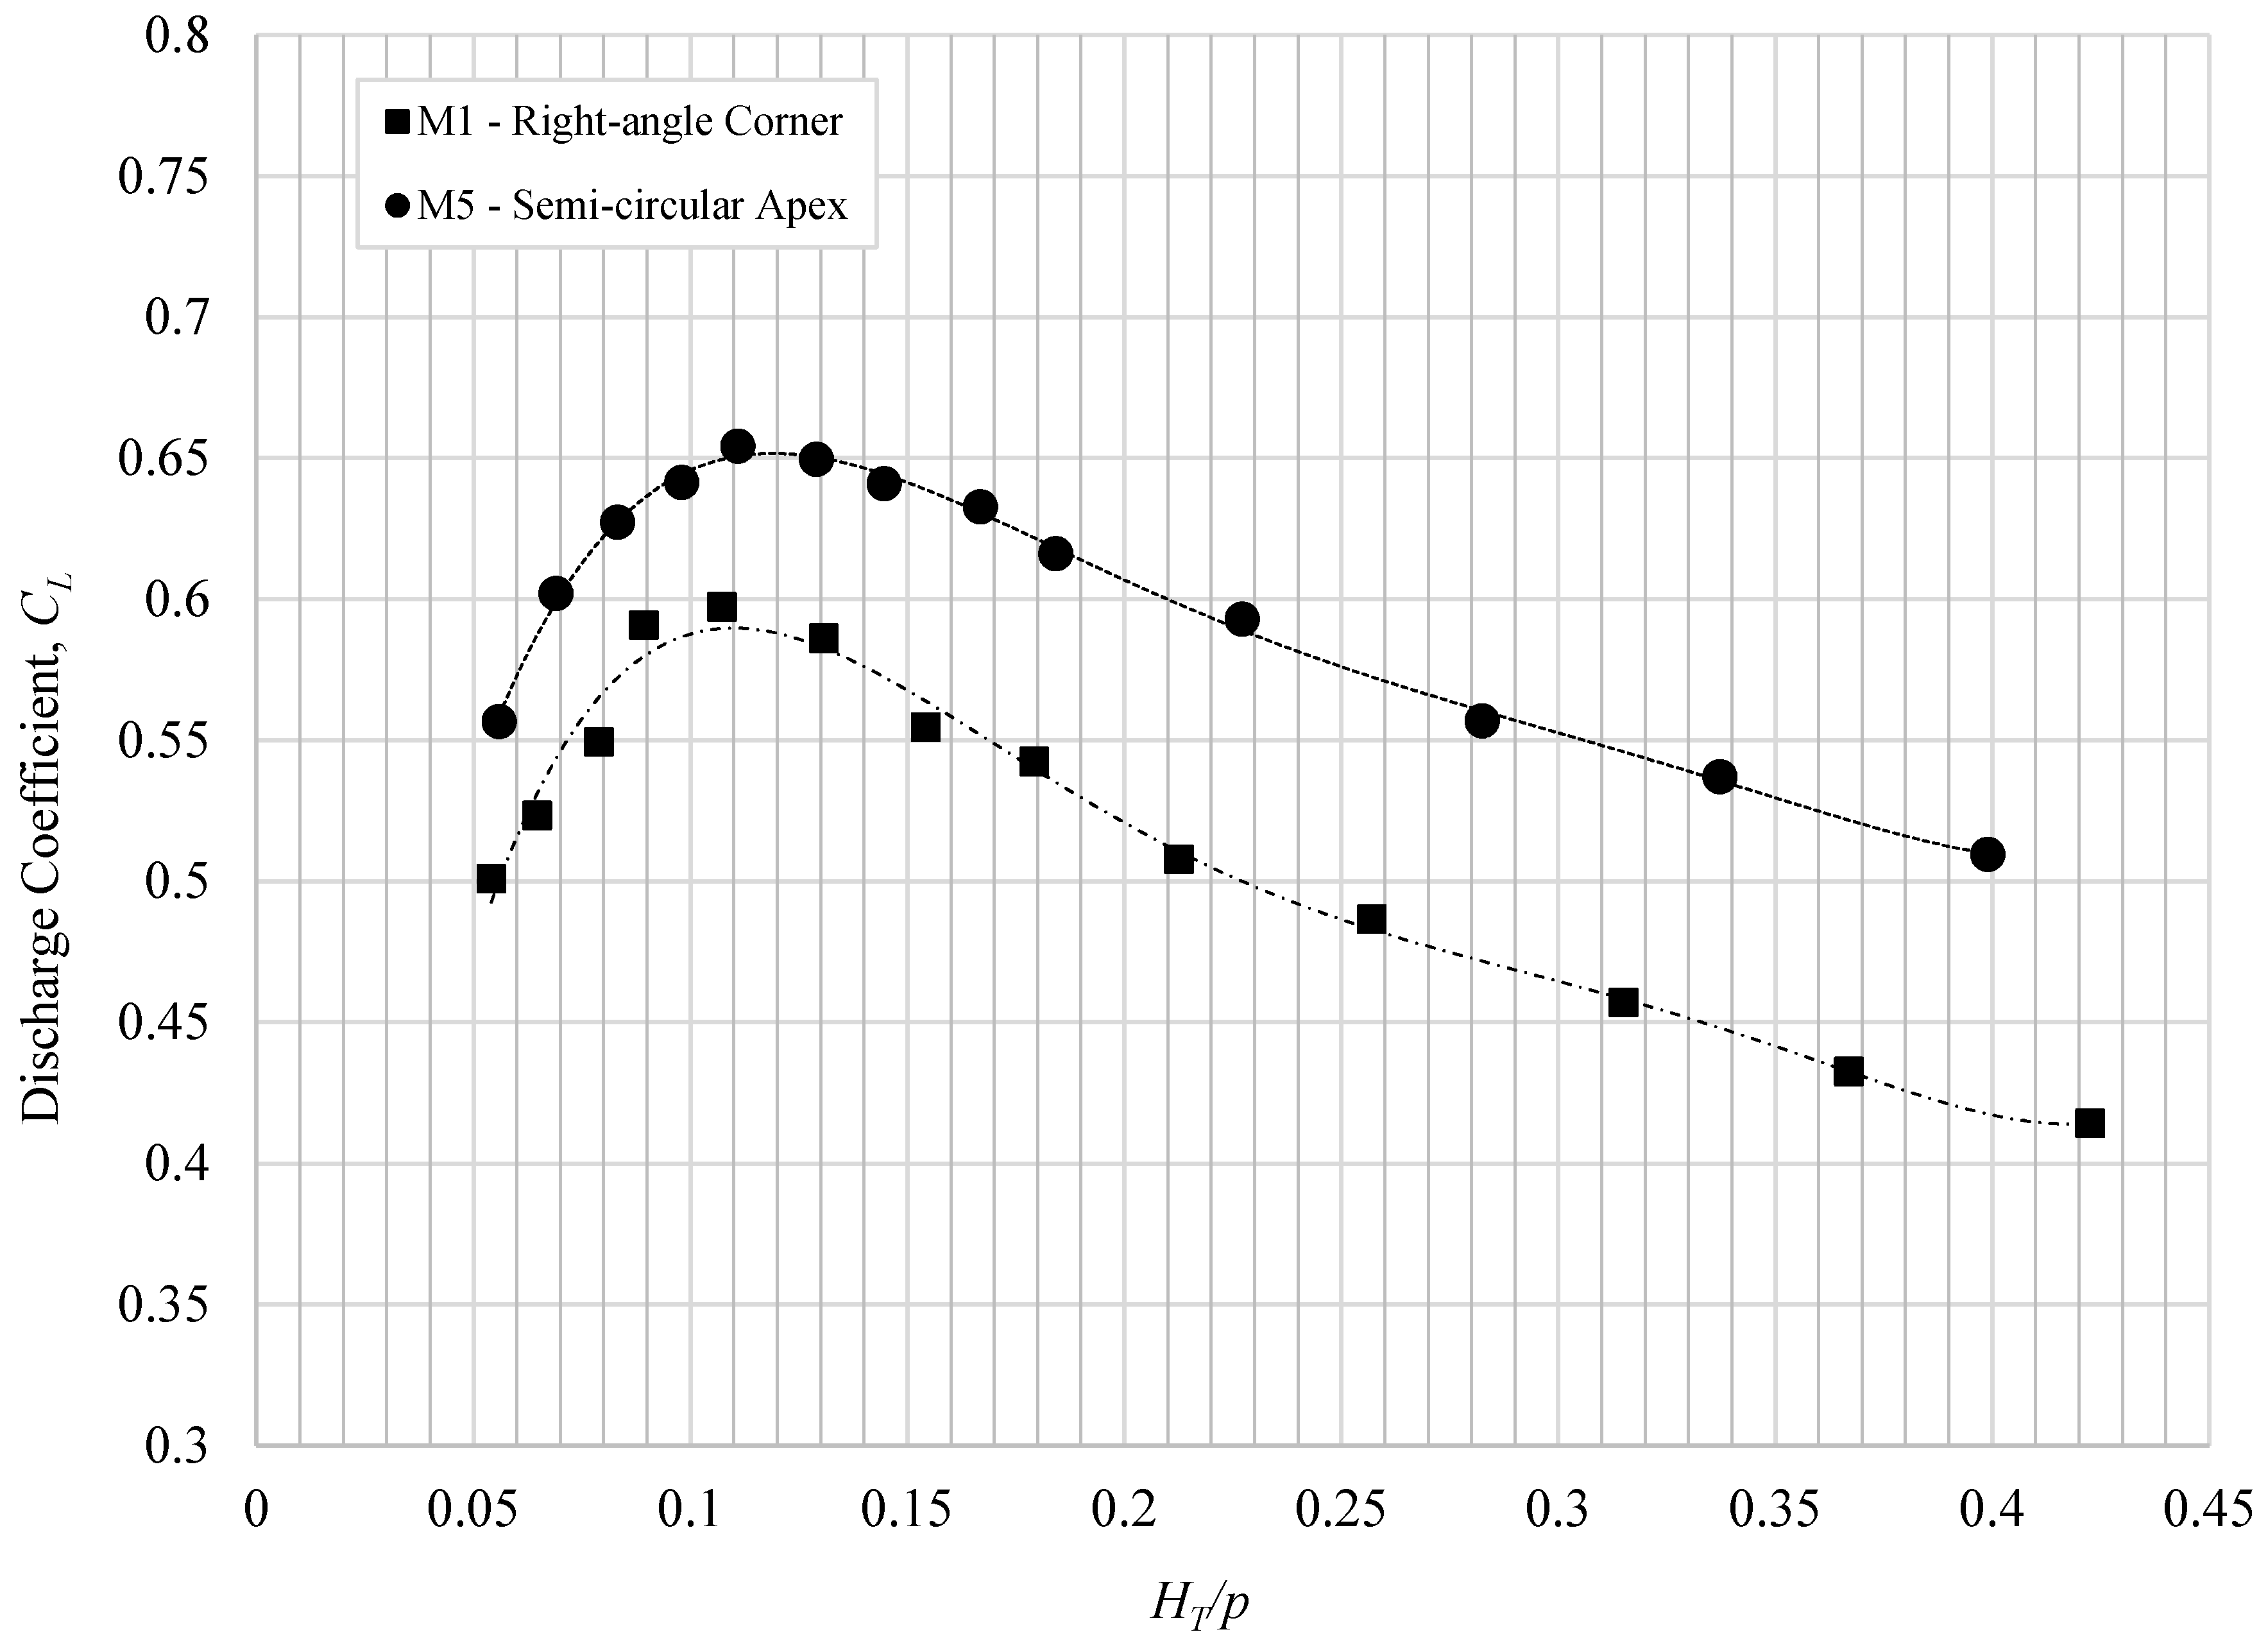
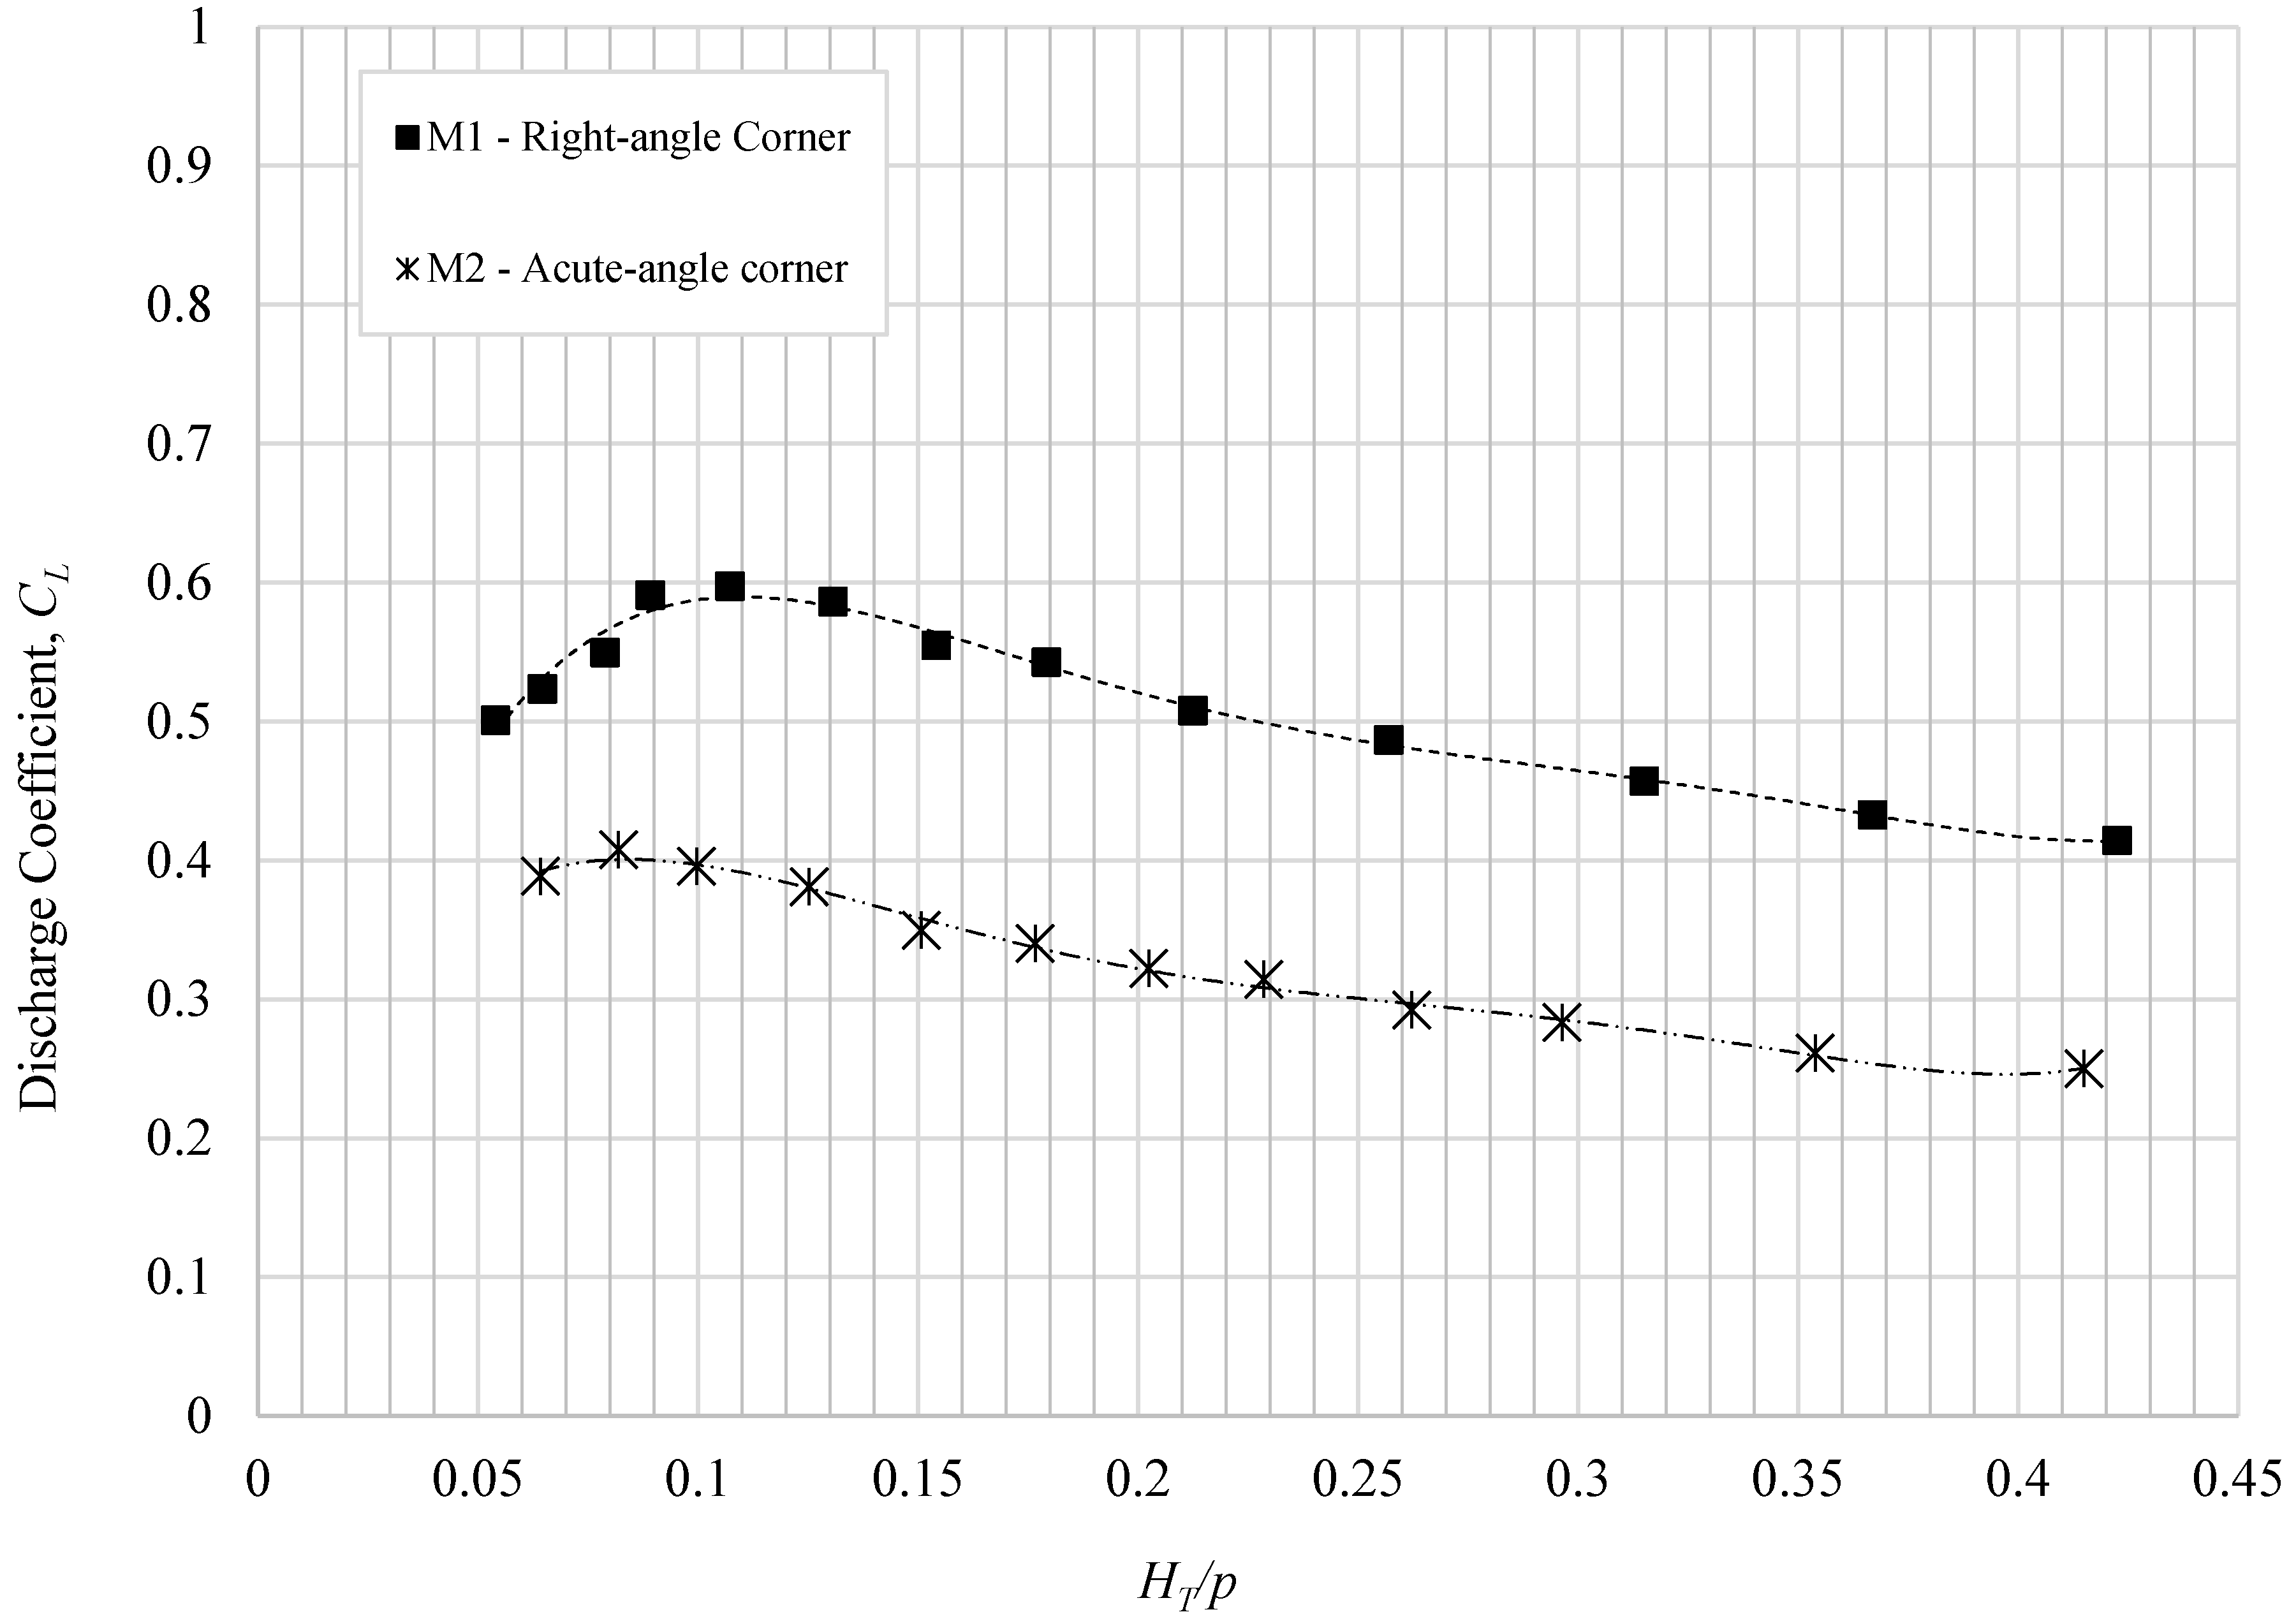
3.2. Effect of Corner Shape on the Discharge Coefficient
4. Conclusions
Author Contributions
Funding
Acknowledgments
Conflicts of Interest
References
- Anderson, R.M.; Tullis, B.P. Piano Key Hydraulics and Labyrinth Weir Comparisons. J. Irrig. Drain. Eng. (ASCE) 2013, 139, 246–253. [Google Scholar] [CrossRef]
- Bilhan, O.; Emiroglu, E.; Miller, C.J. Experimental investigation of discharge capacity of labyrinth weirs with and without nappe breakers. World J. Mech. 2016. [Google Scholar] [CrossRef]
- Crookston, B.M. Labyrinth Weirs. Ph.D. Thesis, Utah State University, Logan, UT, USA, 2010. [Google Scholar]
- Crookston, B.M.; Tullis, B.P. Labyrinth weirs: Nappe interference and local submergence. J. Irrig. Drain Eng. 2012, 138, 757–765. [Google Scholar] [CrossRef]
- Jansen, R.B. Advanced Dam Engineering for Design, Construction, and Rehabilitation; Springer Science & Business Media: Berlin/Heidelberg, Germany, 1988. [Google Scholar]
- Khode, B.V.; Tembhurkar, A.; Porey, P.; Ingle, R. Determination of Crest Coefficient for Flow over Trapezoidal Labyrinth Weir. World Appl. Sci. J. 2011, 12, 324–329. [Google Scholar]
- Taylor, G. The Performance of Labyrinth Weirs. Ph.D. Thesis, University of Nottingham, Nottingham, UK, 1968. [Google Scholar]
- Tullis, P.; Amanian, N.; Waldron, D. Design of labyrinth spillways. J. Hydraul. Eng. 1995, 121, 247–255. [Google Scholar] [CrossRef]
- Anderson, R.M.; Tullis, B.P. Comparison of piano key and rectangular labyrinth weir hydraulics. J. Hydraul. Eng. 2012, 138, 358–361. [Google Scholar] [CrossRef]
- Azimi, A.H.; Hakim, S.S. Hydraulics of flow over rectangular labyrinth weirs. Irrig. Sci. 2019, 37, 183–193. [Google Scholar] [CrossRef]
- Safarrazavi Zadeh, M.; Esmaeili Varaki, M.; Biabani, R. Experimental study on flow over sinusoidal and semicircular labyrinth weirs. ISH J. Hydraul. Eng. 2019, 1–10. [Google Scholar] [CrossRef]
- Houston, K. Hydraulic Model Study of Ute Dam Labyrinth Spillway; Rep. No. GR-82-7; U.S. Bureau of Reclamations: Denver, CO, USA, 1982.
- Falvey, H.T. Hydraulic Design of Labyrinth Weirs; ASCE: Reston, VA, USA, 2003; p. 162. [Google Scholar]
- Lux, F.; Hinchliff, D. Design and construction of labyrinth spillways. In 15th Congress ICOLD; Vol. IV, Q59-R15; ICOLD: Paris, France, 1985; pp. 249–274. [Google Scholar]
- Wormleaton, P.R.; Tsang, C.C. Aeration performance of rectangular planform labyrinth weirs. J. Environ. Eng. 2000, 126, 456–465. [Google Scholar] [CrossRef]
- Kabiri-Samani, A.; Javaheri, A.; Borghei, S.M. Discharge coefficient of a rectangular labyrinth weir. Proc. Inst. Civ. Eng.-Water Manag. 2013, 166, 443–451. [Google Scholar] [CrossRef]
- Emadi, A.R.; Rezaei, M. Experimental study of rectangular labyrinth weirs. J. Water Soil (Agric. Sci. Technol.) 2015, 29, 1438–1446. [Google Scholar]
- Heidarour, M.; Mousavi, S.F.; Zarmehri, A.R. Investigation of rectangular and U-shaped labyrinth weirs. JWSS-Isfahan Univ. Technol. 2006, 10, 1–12. [Google Scholar]
- Rostami, H.; Heidarnejad, M.; Purmohammadi, M.H.; Kamanbedast, A.; Bordbr, A. An Experimental study into discharge coefficient of labyrinth weirs with rectangular-shaped plans. Fresen. Environ. Bull 2016, 25, 5138–5144. [Google Scholar]
- Henderson, F.M. Open Channel Flow (No. 532 H4); Macmillan: New York, NY, USA, 1966. [Google Scholar]


| Model | P (mm) | LC (mm) | LC/w | w/P | Crest Shape | Corner Shape | Orientation |
|---|---|---|---|---|---|---|---|
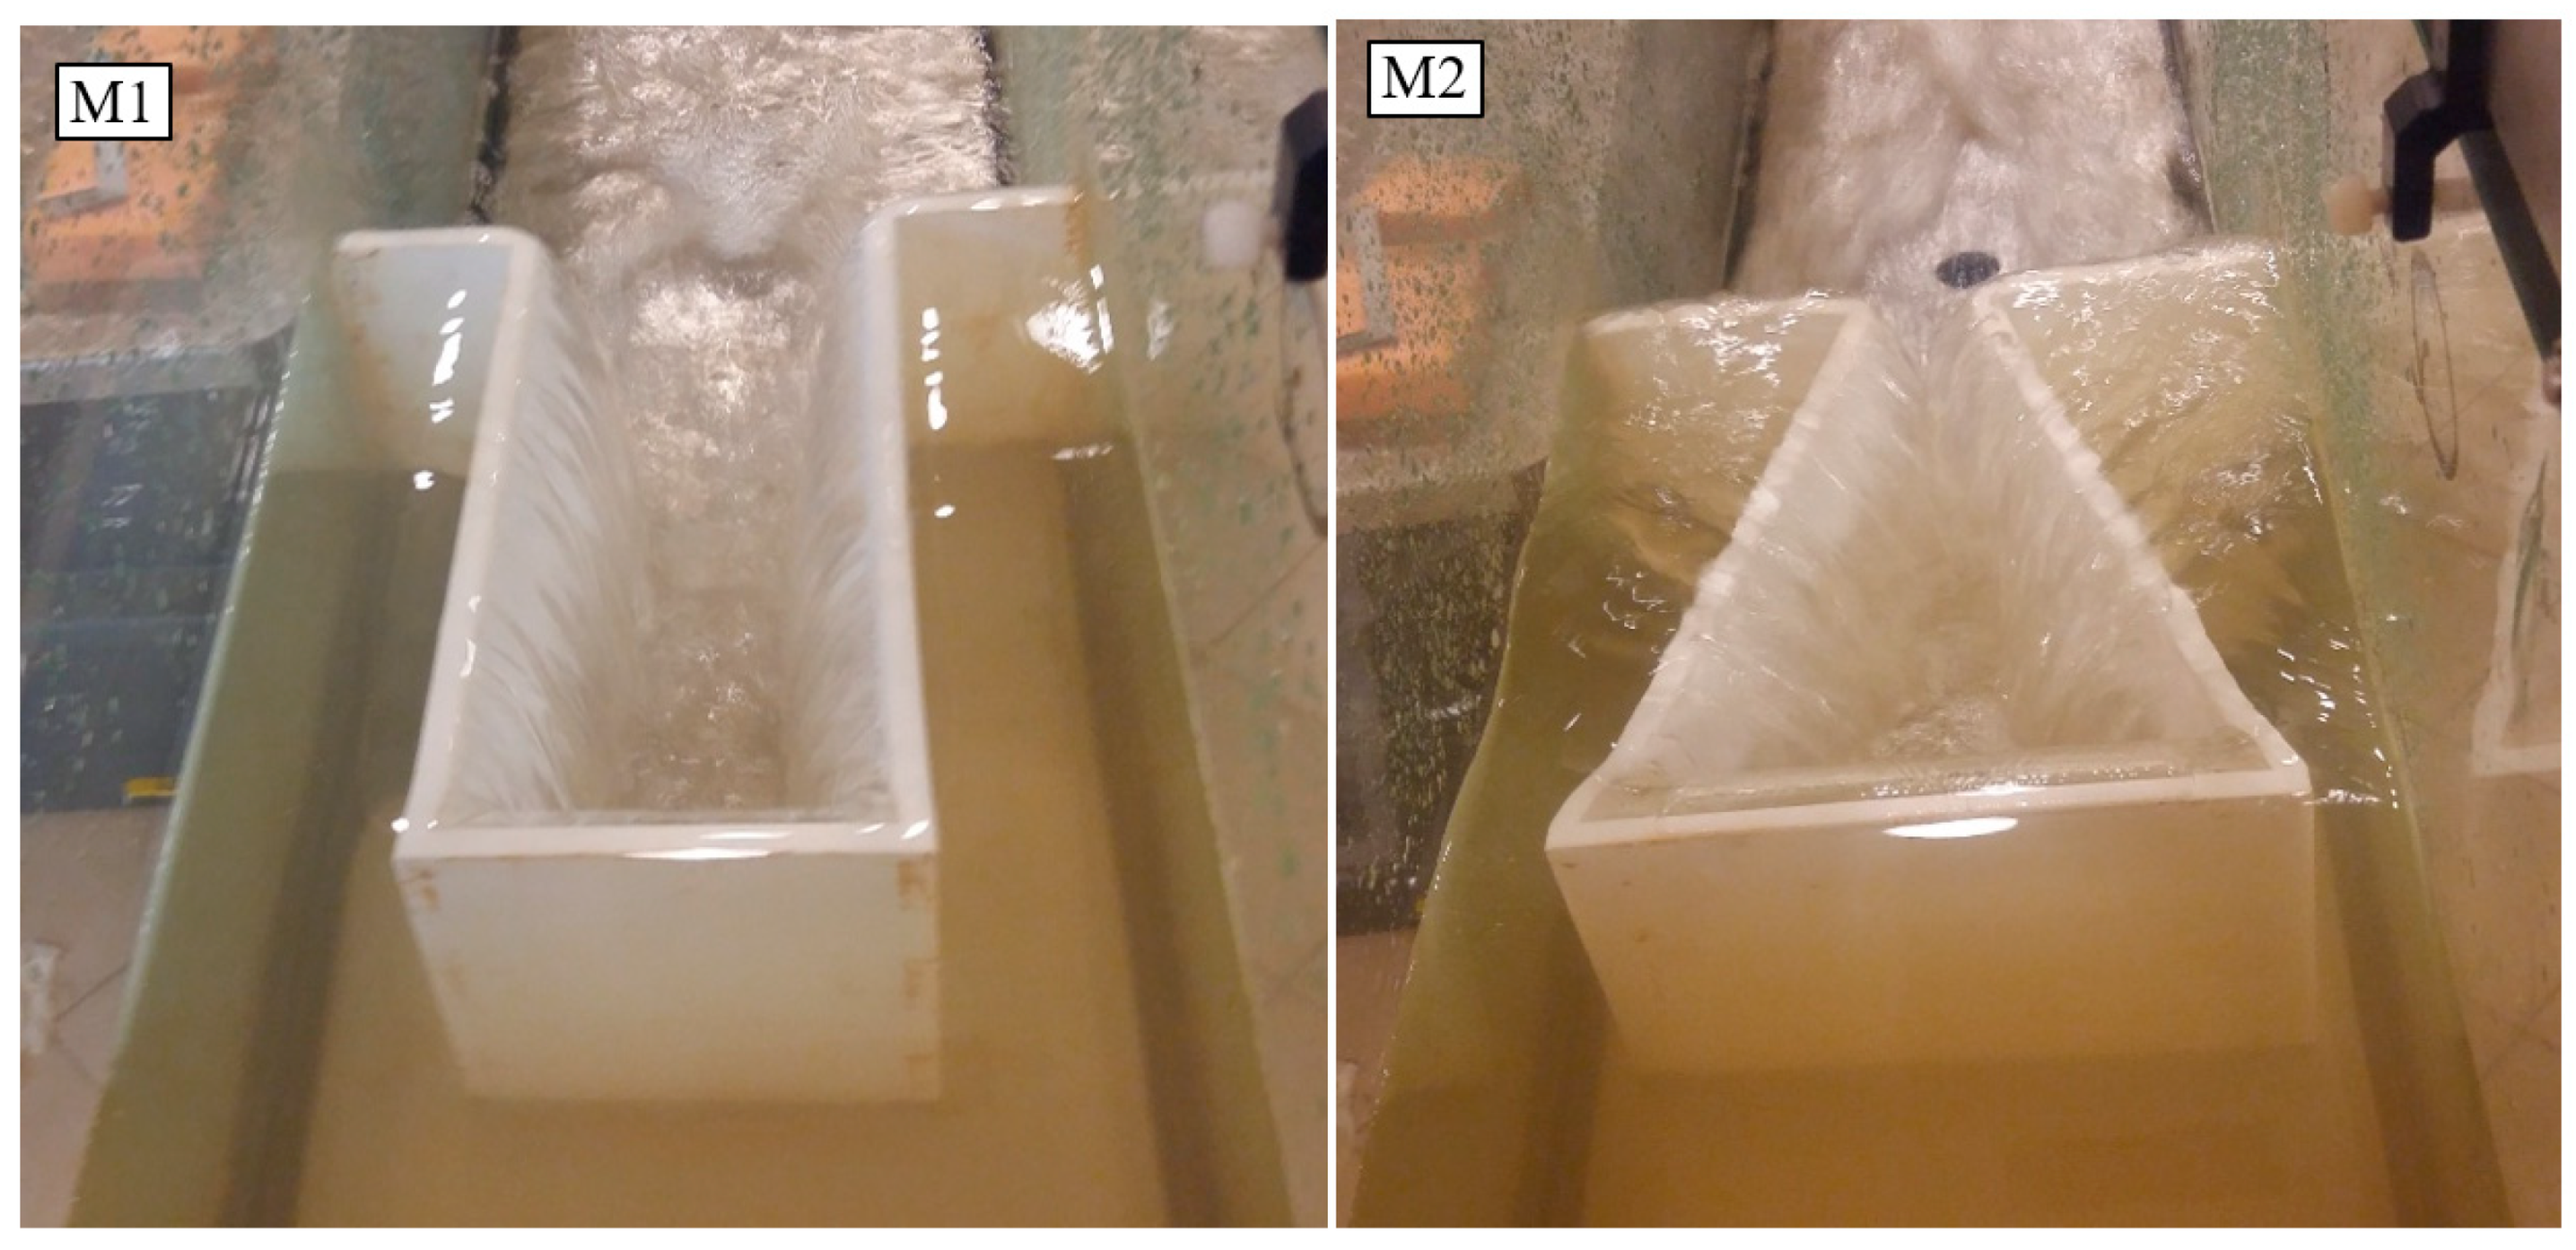
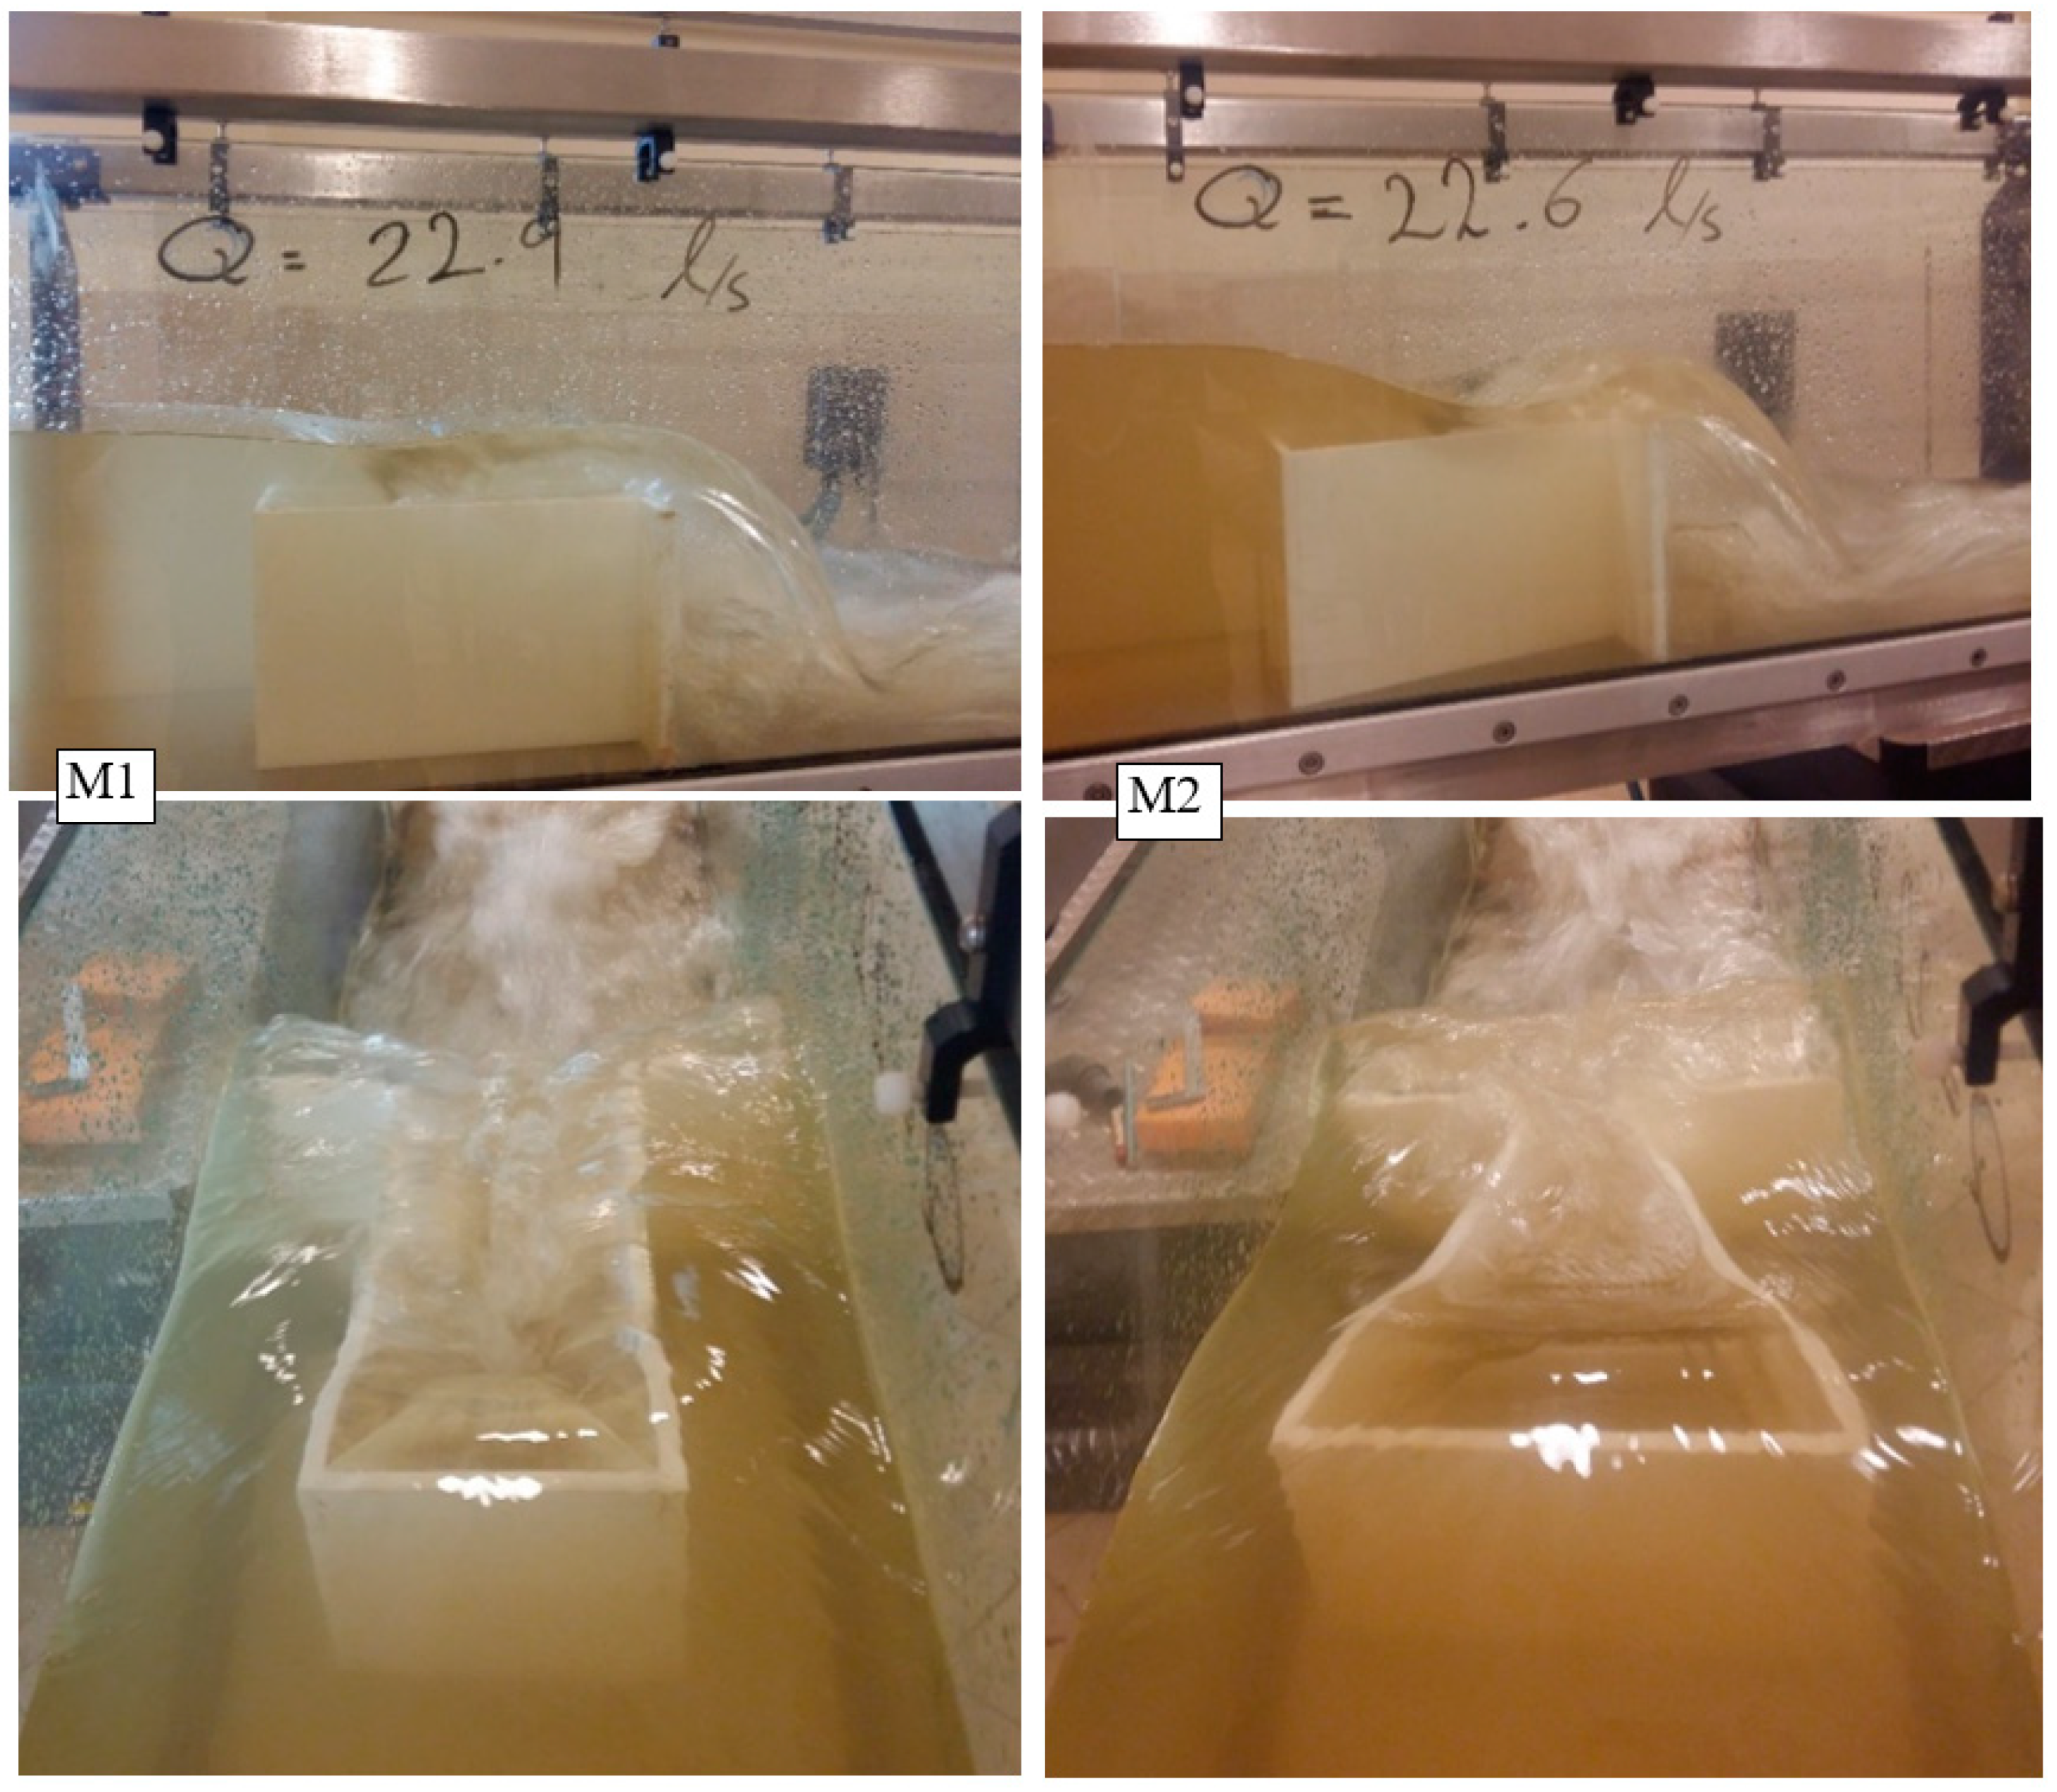
| M1 | 200.3 | 900 | 3 | 1.50 | Flat | Right-angle | Inverse |
| M2 | 200.2 | 1108 | 3.69 | 1.50 | Flat | Acute-angle | Inverse |
| M3 | 202.5 | 836 | 2.80 | 1.48 | Flat | Round | Inverse |
| M4 | 200.7 | 812 | 2.71 | 1.49 | Flat | Beveled | Inverse |
| M5 | 201.0 | 772 | 2.57 | 1.49 | Flat | Semi-circular Apex | Inverse |
| M6 | 201.0 | 300 | 1 | 1.49 | Flat | Linear | - |
| Model | Lc-weir/Lc-M1 | Q, m3/s | h, m | HT/P | Temperature, °C |
|---|---|---|---|---|---|
| M1 | 1.00 | 0.0015–0.0326 | 0.011–0.092 | 0.054–0.454 | 17.5–20.5 |
| M2 | 1.23 | 0.0013–0.028 | 0.011–0.112 | 0.049–0.581 | 20–21 |
| M3 | 0.93 | 0.00144–0.033 | 0.01–0.086 | 0.048–0.459 | 18–19.5 |
| M4 | 0.90 | 0.0015–0.033 | 0.011–0.089 | 0.054–0.481 | 17–18.5 |
| M5 | 0.86 | 0.00151–0.031 | 0.011–0.085 | 0.056–0.494 | 19–21 |
| M6 | 0.333 | 0.00062–0.0245 | 0.013–0.112 | 0.065–0.572 | 19–20.5 |
| Parameters | Changes in the Values, % | ||||
|---|---|---|---|---|---|
| M1/M2 | M3/M1 | M4/M1 | M5/M1 | M3/M4 | |
| Length ratios | 0.81 | 0.93 | 0.9 | 0.86 | 0.97 |
| Unit discharge (q) | 34.1–40.4 | 13.5–18.4 | 8.1–16.3 | 14.5–24.4 | 1.9–5.0 |
| (35.2) * | (15.3) | (12.0) | (19.0) | (2.9) | |
| Parameters | Changes in the Values, % | ||||
|---|---|---|---|---|---|
| M1/M2 | M3/M1 | M4/M1 | M5/M1 | M3/M4 | |
| Length ratios | 0.81 | 0.93 | 0.9 | 0.86 | 0.97 |
| Discharge Coefficient (CL) | 21.4–41.6 | 12.7–30.1 | 9.2–19.1 | 9.9–22.8 | 0.62–14.3 |
| (36.5) * | (16.6) | (13.0) | (16.7) | (3.2) | |
| Model | A | b | R2 |
|---|---|---|---|
| M1 | 0.0875 | 1.2233 | 0.9994 |
| M2 | 0.0488 | 1.1506 | 0.9994 |
| M3 | 0.1066 | 1.2541 | 0.9983 |
| M4 | 0.1068 | 1.2762 | 0.9988 |
| M5 | 0.115 | 1.283 | 0.9992 |
| Model | a0 | a1 | a2 | a3 | a4 | a5 | R2 |
|---|---|---|---|---|---|---|---|
| M1 | 0.0292 | 14.125 | −127.7 | 513.28 | −973.88 | 708.17 | 0.9837 |
| M2 | 0.1505 | 7.8043 | −84.449 | 385.25 | −813.08 | 648.89 | 0.9933 |
| M3 | 0.3651 | 8.2518 | −79.003 | 329.41 | −657.32 | 508.78 | 0.9906 |
| M4 | 0.1048 | 14.092 | −133.21 | 567.34 | −1146.8 | 888.8 | 0.9878 |
| M5 | 0.1558 | 11.755 | −101.13 | 394.12 | −736.42 | 533.37 | 0.9968 |
| M6 | −0.3453 | 21.979 | −187.94 | 756.75 | −1430.5 | 1031.7 | 0.9933 |
© 2020 by the authors. Licensee MDPI, Basel, Switzerland. This article is an open access article distributed under the terms and conditions of the Creative Commons Attribution (CC BY) license (http://creativecommons.org/licenses/by/4.0/).
Share and Cite
Yousif, O.S.Q.; Karakouzian, M. Effect of Corner Shape on Hydraulic Performance of One-Cycle Rectangular Labyrinth Weirs. Fluids 2020, 5, 117. https://doi.org/10.3390/fluids5030117
Yousif OSQ, Karakouzian M. Effect of Corner Shape on Hydraulic Performance of One-Cycle Rectangular Labyrinth Weirs. Fluids. 2020; 5(3):117. https://doi.org/10.3390/fluids5030117
Chicago/Turabian StyleYousif, Omed S. Q., and Moses Karakouzian. 2020. "Effect of Corner Shape on Hydraulic Performance of One-Cycle Rectangular Labyrinth Weirs" Fluids 5, no. 3: 117. https://doi.org/10.3390/fluids5030117
APA StyleYousif, O. S. Q., & Karakouzian, M. (2020). Effect of Corner Shape on Hydraulic Performance of One-Cycle Rectangular Labyrinth Weirs. Fluids, 5(3), 117. https://doi.org/10.3390/fluids5030117