Article

Effect of Overburden Height on Hydraulic Fracturing of Concrete-Lined Pressure Tunnels Excavated in Intact Rock: A Numerical Study

by
Moses Karakouzian
1,
Mohammad Nazari-Sharabian
1,* and
Mehrdad Karami
2
1
Department of Civil and Environmental Engineering and Construction, University of Nevada Las Vegas, Las Vegas, NV 89154, USA
2
Department of Civil Engineering, Isfahan University of Technology, Isfahan 8415683111, Iran
*
Author to whom correspondence should be addressed.
Fluids 2019, 4(2), 112; https://doi.org/10.3390/fluids4020112
Submission received: 2 June 2019 / Revised: 14 June 2019 / Accepted: 17 June 2019 / Published: 19 June 2019
(This article belongs to the Special Issue Recent Numerical Advances in Fluid Mechanics)

Abstract

:
This study investigated the impact of overburden height on the hydraulic fracturing of a concrete-lined pressure tunnel, excavated in intact rock, under steady-state and transient-state conditions. Moreover, the Norwegian design criterion that only suggests increasing the overburden height as a countermeasure against hydraulic fracturing was evaluated. The Mohr–Coulomb failure criterion was implemented to investigate failure in the rock elements adjacent to the lining. A pressure tunnel with an inner diameter of 3.6 m was modeled in Abaqus Finite Element Analysis (FEA), using the finite element method (FEM). It was assumed that transient pressures occur inside the tunnel due to control gate closure in a hydroelectric power plant, downstream of the tunnel, in three different closure modes: fast (14 s), normal (18 s), and slow (26 s). For steady-state conditions, the results indicated that resistance to the fracturing of the rock increased with increasing the rock friction angle, as well as the overburden height. However, the influence of the friction angle on the resistance to rock fracture was much larger than that of the overburden height. For transient-state conditions, the results showed that, in fast, normal, and slow control gate closure modes, the required overburden heights to failure were respectively 1.07, 0.8, and 0.67 times the static head of water in the tunnel under a steady-state condition. It was concluded that increasing the height of overburden should not be the absolute solution to prevent hydraulic fracturing in pressure tunnels.

1. Introduction

High-pressure water tunnels, usually excavated in rock, convey water from the upstream reservoir toward the turbines in hydropower plants, and turn the energy of the flowing water into electricity. These tunnels can be either steel-lined or concrete-lined; steel-lined pressure tunnels are safer, but more costly to construct. Concrete-lined pressure tunnels are faced with serious challenges in design and construction. In these tunnels, due to the lining permeability in areas where the rock is jointed, water seeps into the joints and expands the cracks. In cases where the rock is intact and not jointed, high internal pressure can fracture the rock. This phenomenon is called hydraulic fracturing, which makes the rock mass on the tunnel unstable.
Researchers studied various aspects of hydraulic fracturing in pressure tunnels, some of which are mentioned below. In 1986, Schleiss investigated leakage from pressure tunnels in the presence of groundwater, and presented the leakage relationships under two conditions: cracked and non-cracked concrete linings. The author concluded that dynamic pressure caused by various factors, such as a water hammer or earthquake, had a significant impact on the rate of leakage and expansion of rock joints [1]. Fernández and Alvarez (1994) used the finite element method (FEM) to study water leakage from a tunnel and effective stresses in the surrounding rock. The authors considered the ratio of total stress to effective stress in the rock as a safety factor against hydraulic fracturing [2]. Furthermore, using the FEM and a closed-form analytical solution, Bobet and Nam (2007) studied effective stresses around pressure tunnels under steady-state operation. The authors assumed there was no groundwater presence around the tunnel, and presented a new analytical solution for stresses and displacements in the surrounding rock and the lining. Their solution considered the interaction between the lining, surrounding rock, and pore pressure in the rock environment, as a result of leakage through the lining [3]. Moreover, Hachem and Schleiss (2010) evaluated pressure wave velocities in steel-lined pressure tunnels, with and without considering the fluid–structure interactions. The authors showed changes in pressure wave velocity, due to the characteristics of the surrounding rock, the thickness of the lining, and wave frequency [4].
Using the FEM, and in order to optimize the thickness of the concrete lining, Olumide and Marence (2012) simulated a pressure tunnel in a two-dimensional elasto-plastic space in order to study the effects of seepage on the tunnel’s concrete lining. The authors investigated cracks in the lining by coupling in situ stresses in the rock with the stresses caused by leakage, and validated their numerical model by the analytical method proposed by Schleiss (1986) [5]. Furthermore, Simanjuntak et al. (2014) studied displacements and stresses in the concrete lining and rock mass using the FEM, considering non-uniform in situ stresses around a pressure tunnel [6]. The authors showed that, in non-uniform stress conditions around the tunnel, when the coefficient of lateral rock pressure (k0) is ≤1, cracks form in the crown of the tunnel due to high internal pressure. In 2015, Zhou et al. considered the interactions between fluid and the concrete lining in pressure tunnels in order to study stresses in a tunnel lining. The authors considered the hydro-mechanical behavior of the surrounding rock and the tunnel lining by simulating the fluid inside rock joints and cracks in the concrete lining [7]. More recently, Pachoud and Schleiss (2016) investigated the impacts of the transient pressure wave in pressure tunnels due to water hammer. The authors presented analytical formulas for stresses and displacements in the environment around the tunnel [8]. In 2018, Zareifard presented an analytical solution for the design of pressure tunnels, considering seepage from a tunnel [9]. It should be noted that, in addition to the negative impacts of hydraulic fracturing in water resources and related structures, it is widely used in the oil and gas industry as a novel method for the exploitation of underground reservoirs [10].
Based on the literature review, many researchers investigated cracking in the rock or tunnel concrete lining in steady-state conditions with constant overburden, yet they did not consider the interactive effects of overburden height and transient pressures on hydraulic fracturing in the rock environment surrounding a tunnel. In the present study, in order to fill this gap in knowledge, the impact of overburden height on the bearing capacity of a tunnel in a steady-state condition was studied. For the next step, the effect of transient pressure caused by rapid gate operations on hydraulic fracturing in a tunnel in critical conditions (e.g., load rejection of the powerhouse) was investigated. The Mohr–Coulomb failure criterion was used to investigate the rock failure both in steady-state and transient-state conditions.

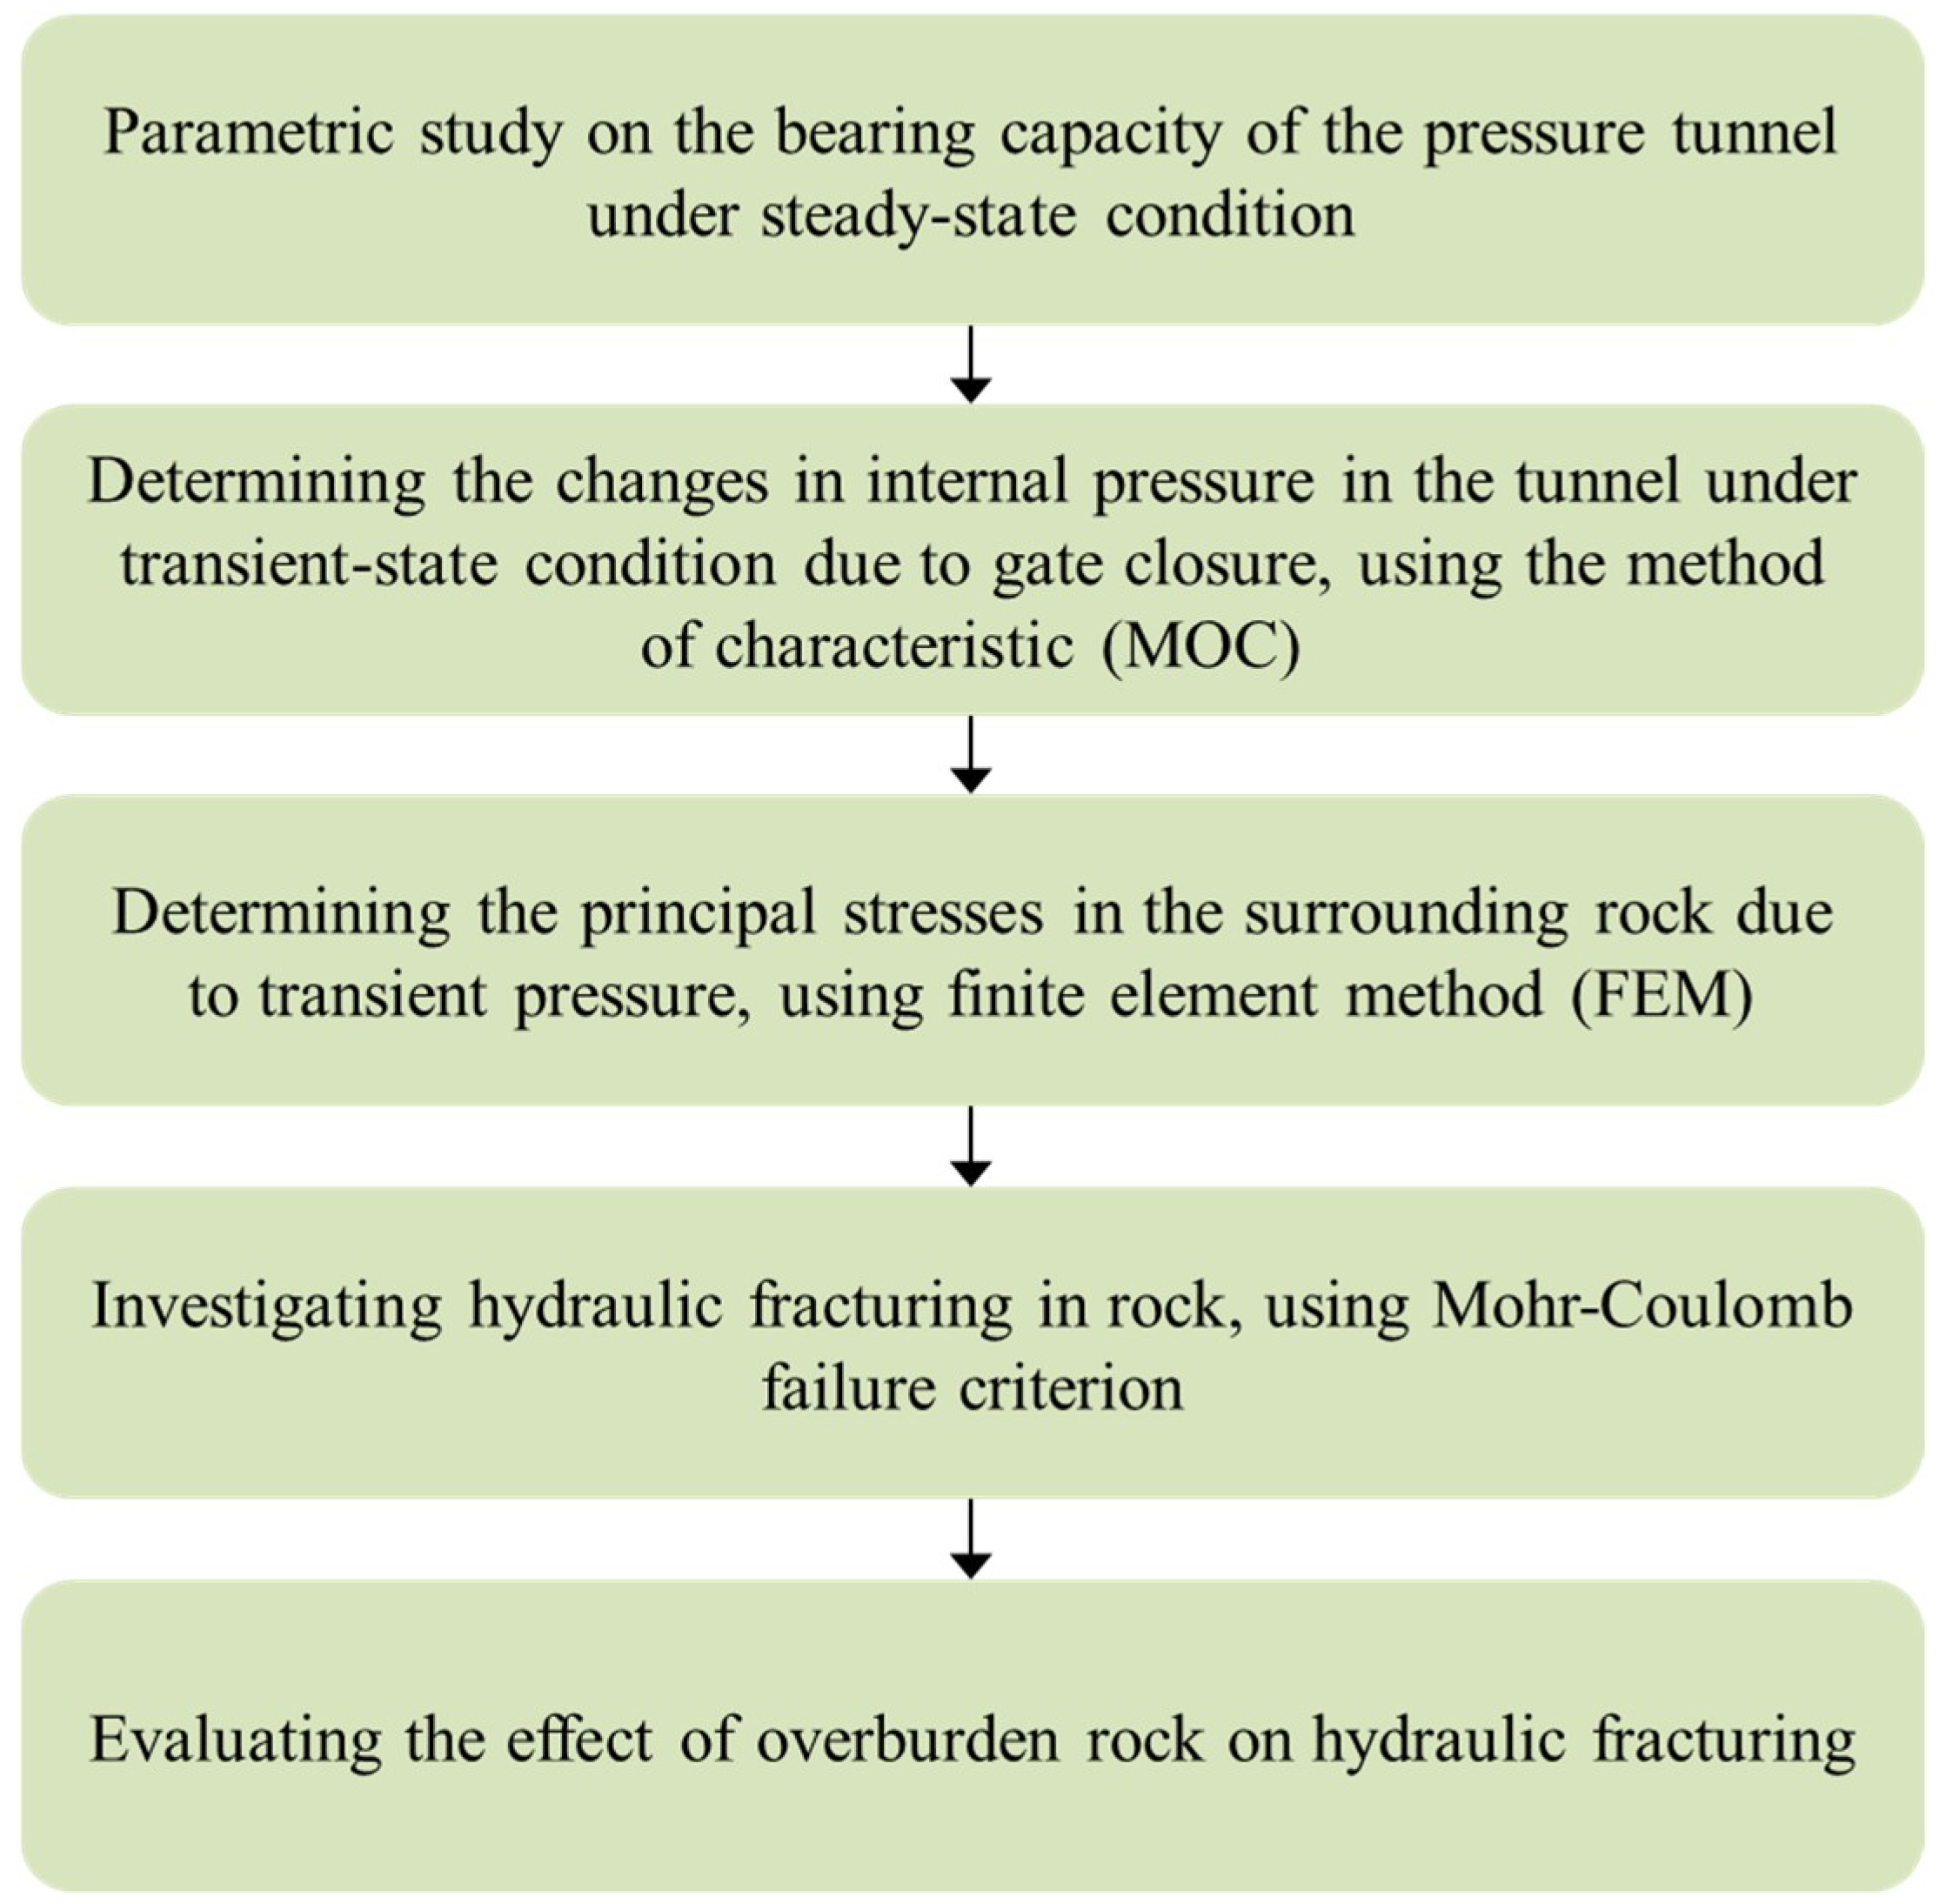
2. Materials and Methods

Using the FEM and considering the environment around the tunnel as an intact rock with elasto-plastic behavior, stresses around a tunnel were studied using the Abaqus Finite Element Analysis (FEA) software [11]. Because cracks were not explicitly modeled in the numerical model, principal stresses were used as indicators of potential fracturing. Since this solution involves the hydraulics of water flow in the tunnel and the impacts of internal pressures on the surrounding rock, the Hammer software and Abaqus FEA were linked for modeling and analyzing the system. The Hammer software [12], which works based on the method of characteristics (MOC), was employed to analyze the changes in the internal pressure inside the tunnel, as a function of time. The hydraulic analysis results, from the Hammer software in transient-state conditions, were transferred to the Abaqus FEA in order to analyze stresses in the surrounding rock. It was assumed that, at first, the internal pressure was in the steady-state condition. Afterward, because of sudden gate closure, transient pressures built up in the tunnel. The flowchart below summarizes the main steps in this study (Figure 1).

2.1. Governing Equations

Using the general Navier–Stokes equation (Equation (1)) and simplifying assumptions—(a) fluid inside the tunnel is non-viscous, (b) fluid velocity fluctuations are ignored, and (c) water has linear compressibility—the hydrodynamic pressure inside the tunnel can be obtained using Equations (1) and (2) [13].
ρ ( v t + v . v   ) = p + μ 2 v + B ,
ρ K 2 p t 2 = 2 p ,
where v is the flow velocity (m/s), μ is the fluid viscosity (Pa·s), B is the vector of body forces (N), p is the fluid hydrodynamic pressure in the tunnel (Pa), K is the bulk modulus (Pa), t is time (s), and ρ is the water density (kg/m3). The only boundary condition governing the fluid inside the tunnel is the boundary between the water and the lining. This boundary condition is defined as in Equation (3) [13].
p n = ρ u ¨ s n ,
where n is a perpendicular vector to the shared surface between the water and the lining, and u ¨ s is the second derivative of the lining elements’ displacements in contact with the fluid (m/s2). The above equation is based on the assumption that the radial displacements of the fluid and lining are similar at the contact surfaces. The connection between the hydrodynamic pressures inside the tunnel {p} and forces applied to the model caused by the hydrodynamic pressure {f} are linked by matrix [Q] (Equation (4)) [14].
[ Q ] { p } = { f } .
The coupling matrix [Q] links the hydrodynamic pressures due to gate closure, with forces generated in the concrete lining. This equation is solved by the Abaqus FEA, by applying the boundary and initial conditions. Finally, the displacements and stresses in the rock due to hydrodynamic pressures are calculated. The forces in the concrete lining due to water pressure are transferred to the surrounding rock. As a result, the equilibrium equation in the surrounding rock is as follows [14]:
[ M ] { u ¨ r } + [ C ] { u ˙ r } + [ K ] { u r } = { R r } ,
{Rr} = {f} − {fs},
where M, C, and K are mass, damping, and hardness matrices, respectively; Rr is the vector of external forces on the rock; u ¨ r and u ˙ r are the second and first derivatives of the rock elements, respectively; and u r is the displacement of the rock elements. Equation (6) shows that part of the hydrodynamic force is resisted by the concrete lining (fs). Therefore, the relationship between hydrodynamic pressure and displacements in the surrounding rock is obtained by linking Equations (4) and (5).

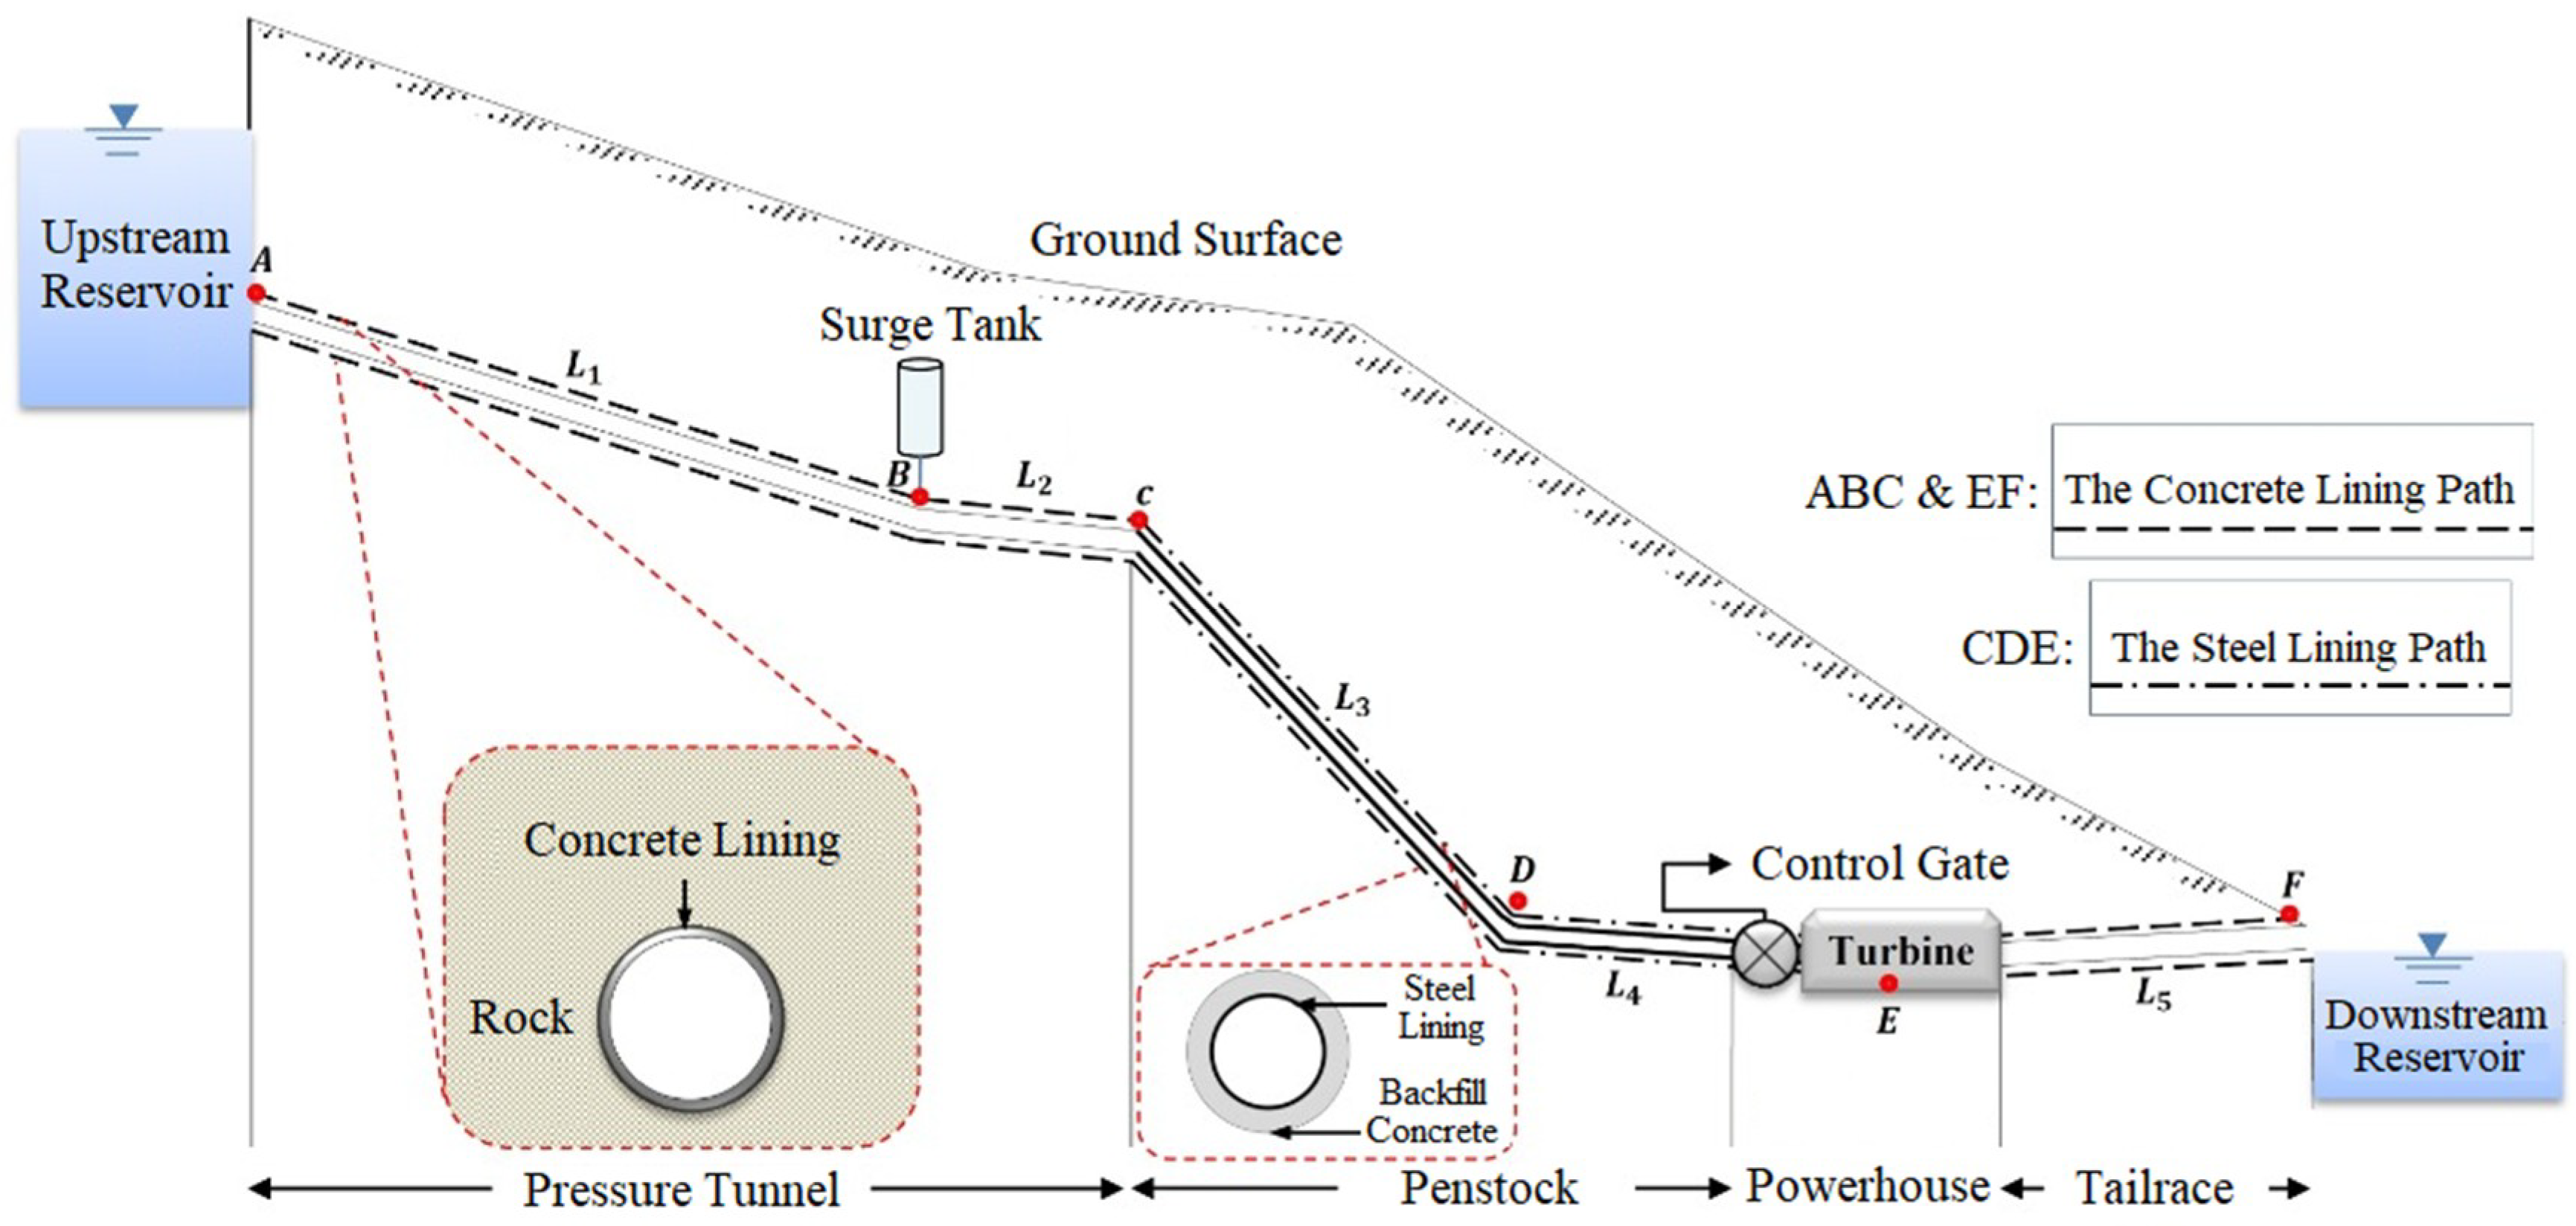
2.2. FEM and Effective Parameters

In the FEM modeling, the following factors were considered in the simulations:
  • A circular tunnel was excavated in intact rock by a tunnel boring machine (TBM);
  • Water pore pressure was considered in the concrete lining and in the rock;
  • The Mohr–Coulomb failure criterion was implemented in order to study stresses in the rock;
  • A damage plasticity behavior was considered in the concrete lining.
Using a trial-and-error procedure, the model boundaries were selected in a way so as to not affect stress distribution around the tunnel. Therefore, the model boundaries were set at 6d × 25d (d = tunnel diameter) (Figure 2). More details on the grid and boundary sensitivity analyses are presented in the Appendix A. Table 1 shows the mechanical properties of the lining. It was assumed that the tunnel was located above the groundwater level.
The only degree of freedom inside a water pressure tunnel is pressure in the fluid nodes. In Abaqus FEA, acoustic elements possess this feature and are appropriate for simulating the fluid movement inside a tunnel. Since acoustic environments are elastic, shear stresses do not exist in these environments and pressure is proportional to volume strain. In addition, the effects of inertia and compressibility are considered in acoustic elements [17].
In this study, the interactions between the fluid, lining, and surrounding rock were considered, and the fluid density was set at 1000 kg/m3, with a bulk modulus of 2.07 GPa. Taking into account the interaction between the fluid and lining, the structure surfaces and fluid that are in contact were tied together in Abaqus FEA. Applying the same reasoning, the external nodes of the lining were tied with the nodes of the surrounding rock due to structure–rock interactions.
The environment around the tunnel has in situ stresses. By defining the height, specific weight, and the lateral stress coefficients of the rock, equilibrium conditions between the horizontal and vertical stresses were achieved, which resulted in zero ground settlement before tunnel excavation.
Since the transient pressure inside the tunnel depends on factors such as gate operations, this pressure was applied to the model as a quasi-static load (by gradually increasing the loading, so that the impacts of inertia became negligible). This means that, at different times, different pressures were applied to the lining. In order to apply the time-variable pressure to all of the nodes in the acoustic environment, the amplitude function in Abaqus FEA was used.
The plane strain elements with linear interpolation function were employed to mesh the surrounding rock and concrete lining. In Abaqus FEA, these types of elements are called CPE4R (continuum plain strain element 4-node reduced integration). Meshing was such that, by approaching the tunnel section, the mesh size decreased to achieve more precise results. Moreover, plane stress family elements were used for meshing the lining. In Abaqus FEA, these elements are called CPS4R (continuum plain stress element 4-node reduced integration). Furthermore, in the lining and rock elements, the reduced integration method was implemented, and AC2D4 elements (acoustic continuum 2-dimension 4-node) were used to simulate water transient pressure inside the tunnel [11,18].
The first step in this research study was simulating in situ stresses. In order to have zero ground-surface settlement before tunnel excavation, these stresses should satisfy Equations (7) and (8) [19].
σ v = γ r h ,
σ h = γ r h k 0 ,
where γr is the specific weight of the rock, h is the height of the overburden rock, and k0 is the coefficient of lateral rock pressure. In the next step, the tunnel excavation was simulated. It was assumed that the tunnel was excavated by a tunnel boring machine. At this stage, the release of stress and displacements occurred in the rock. After the tunnel cross-section, the concrete lining was simulated. In this step, a concrete lining with the specifications presented in Table 1 was modeled. Interaction between the rock and the lining was considered using tangential and normal stiffnesses. The final step was applying steady-state conditions and hydrodynamic water pressure to the lining. It was assumed that the transient pressure inside the tunnel would occur due to the turbine gate closure in a typical hydropower plant (Figure 3).
Using the Hammer software, hydraulic analyses were performed in steady-state and transient-state conditions, by defining the characteristics of the duct (water tunnel), reservoir, and gate closure schedule. The parameters used for these analyses and their values are presented in Table 2 and Table 3. Water velocity was considered to be 6 m/s, according to the recommended value by the United States Bureau of Reclamation [20]. Moreover, in order to create critical conditions in the tunnel to determine its bearing capacity, it was assumed that the surge tank was disabled. The maximum flow rate was considered to be 60 m3/s, and, according to the gate closure time in typical water tunnels, the gate closure times were considered to be 14 s (fast), 18 s (normal), and 26 s (slow). Furthermore, based on the duct characteristics, the pressure wave velocity according to the characteristics of the duct was determined by Equation (9), where D is the inner diameter of the tunnel, E is the elastic concrete modulus, and tc is the lining thickness [21].
a = 1 ρ w ( ( 1 K w ) + ( D λ E t c ) ) .
It was assumed that the lining could expand in the longitudinal direction, which results in a λ (confinement coefficient) value of 1 [21].
The location for investigating stresses in the rock was considered to be near the penstock (Node C) in the tunnel path. Finally, the pressure values at this point, obtained by the Hammer software, were input to the Abaqus FEA, under hydrodynamic pressure loadings.

2.3. Parametric Study in Steady-State Conditions

In this study, the bearing capacity of the pressure tunnel under a steady-state condition was investigated. The bearing capacity of a concrete-lined pressure tunnel is dependent either on the tensile strength of the surrounding rock only, or both the concrete and the rock. Generally, in pressure tunnels that are excavated in intact rock, the concrete lining does not contribute to the stability of the tunnel during excavation and only provides an appropriate bed for water to be conveyed toward the turbine.
Crack formation in the surrounding rock (hydraulic fracturing), due to high internal pressure, shows that the pressure tunnel reached its ultimate capacity; therefore, a parametric study was performed to investigate the impact of overburden height on the ultimate bearing capacity of the pressure tunnel in a steady-state condition. Figure 4 shows the effective parameters in the bearing capacity of a tunnel. Pe(pi) is the water pressure on the outer surface of the concrete lining due to seepage. According to Equation (10), this parameter is dependent on internal pressure, and it was calculated using the FEM in the present study [22].
P e (   p i ) = p i 1 + ( k r l n ( r e r i ) k c l n ( R r e ) ) ,
where t (thickness of the lining), k0, kr (hydraulic conductivity of the rock), and γr (specific weight of the rock) were considered constant for all analyses, and their values are presented in Table 4. Moreover, the values for Er, C, φ, and h are presented in Table 5.
In each analysis, the bearing capacity of the tunnel was determined by increasing the internal pressure (pi) to the point at which the first crack was formed in the surrounding rock. In this situation, the corresponding pi was considered as the failure threshold, which indicates the ultimate bearing capacity of the tunnel.

2.4. Verification of the FEM

Tunsakul et al. (2014) investigated fracture propagation in a rock mass surrounding a tunnel, under high internal pressure, in an experimental model [26]. In order to verify the numerical model developed in the present study, an experiment with k0 = 0.5 was considered. Other assumptions based on the experimental model were as follows: no concrete lining exists (t = 0); the surrounding rock is impermeable (Pe(pi) = 0). According to Tunsakul et al. (2014), the cracking location depends on the coefficient of lateral rock pressure (k0). When k0 < 1, cracking occurs in the crown of the tunnel, and, for k0 ≥ 1, cracks form at the sides of the tunnel. The FEM results were in agreement with the findings of Tunsakul et al. (2014), since cracks formed in the crown of the tunnel (Figure 5).

3. Results and Discussion

3.1. Changes in Pore Pressure

Since concrete is not completely impermeable, water passing through the pores penetrates into the surrounding rock. The permeability of rock varies between 1 (completely permeable) and 10−12 m/s (almost impermeable). Figure 6 shows a comparison between the pore pressures obtained from the numerical model and the value obtained from Bouvard’s and Pinto’s (1969) analytical solutions (Equation (10)) [22]. According to Figure 6, the pore pressure obtained using the analytical solution is greater than the value obtained from the numerical solution.
The hydro-mechanical interaction is caused by jointing in rocks due to water pressure. As a result, water penetration toward the rock increases, which consequently leads to more leakage from the tunnel, and increases the pore pressure inside the rock joints. In analyses performed by Bouvard and Pinto, it was assumed that the rock was a porous medium, without effective stresses due to overburden rock. However, in the present numerical modeling, effective stresses due to overburden rock, which reduce the pore pressure in the rock, were considered as important factors in the simulation.

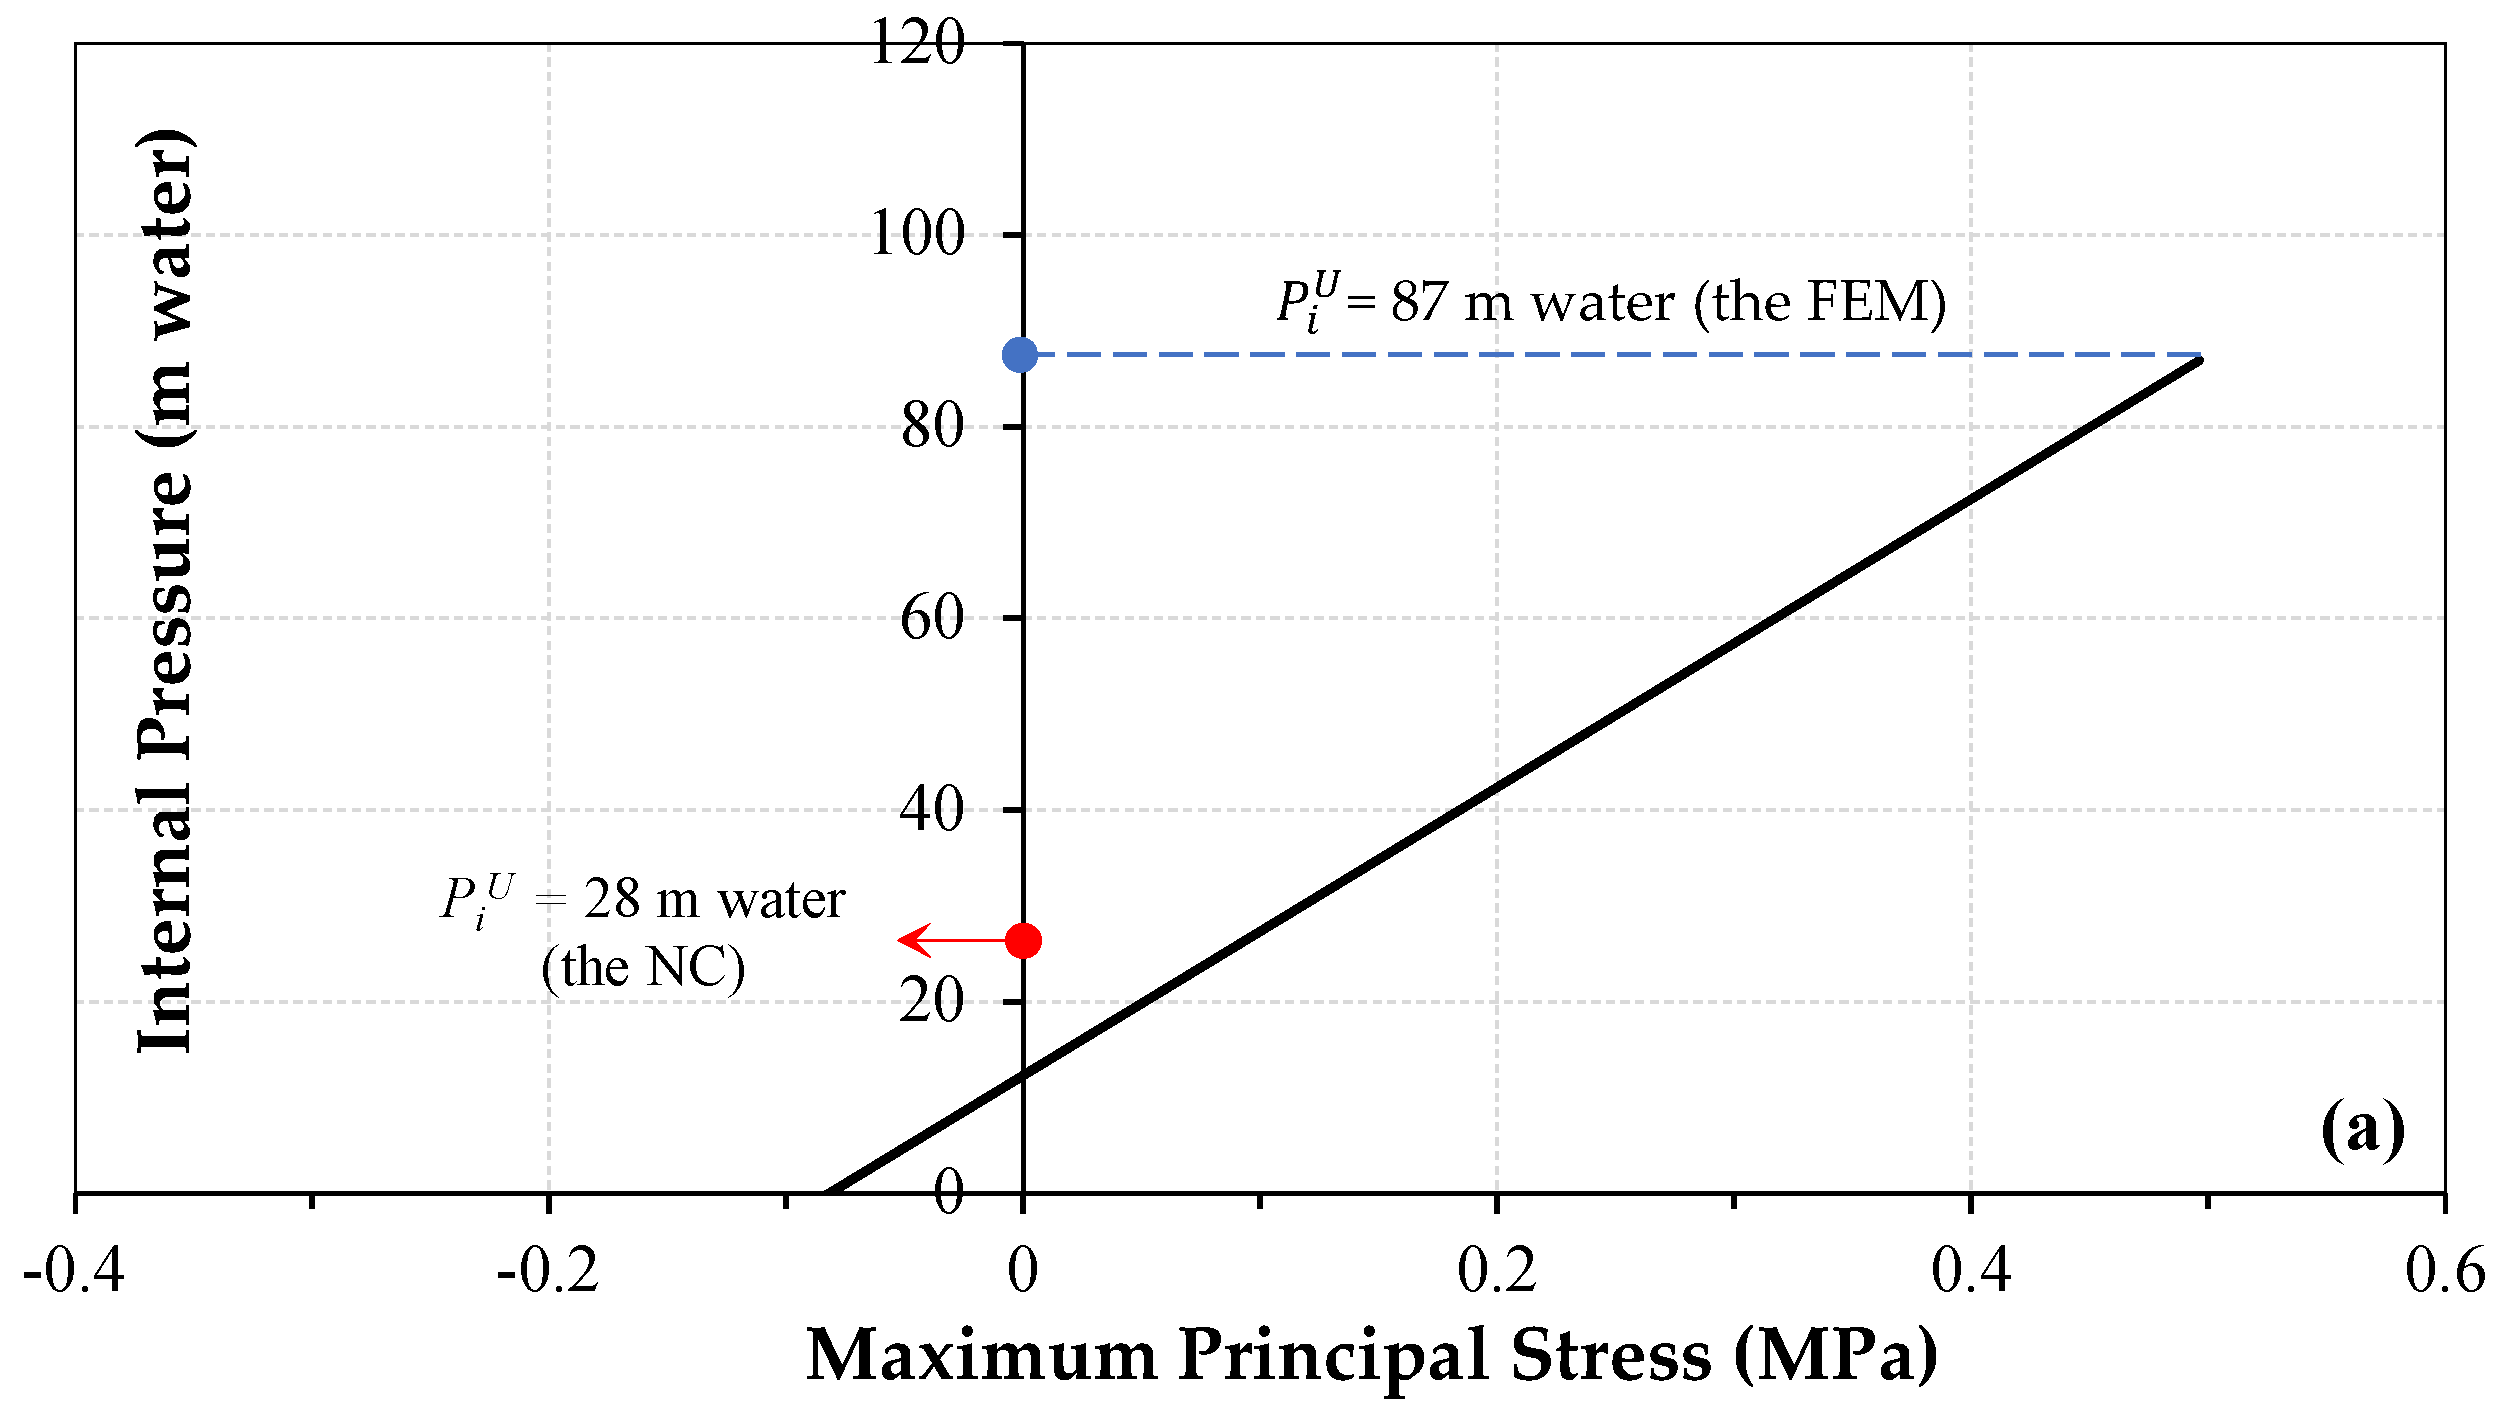
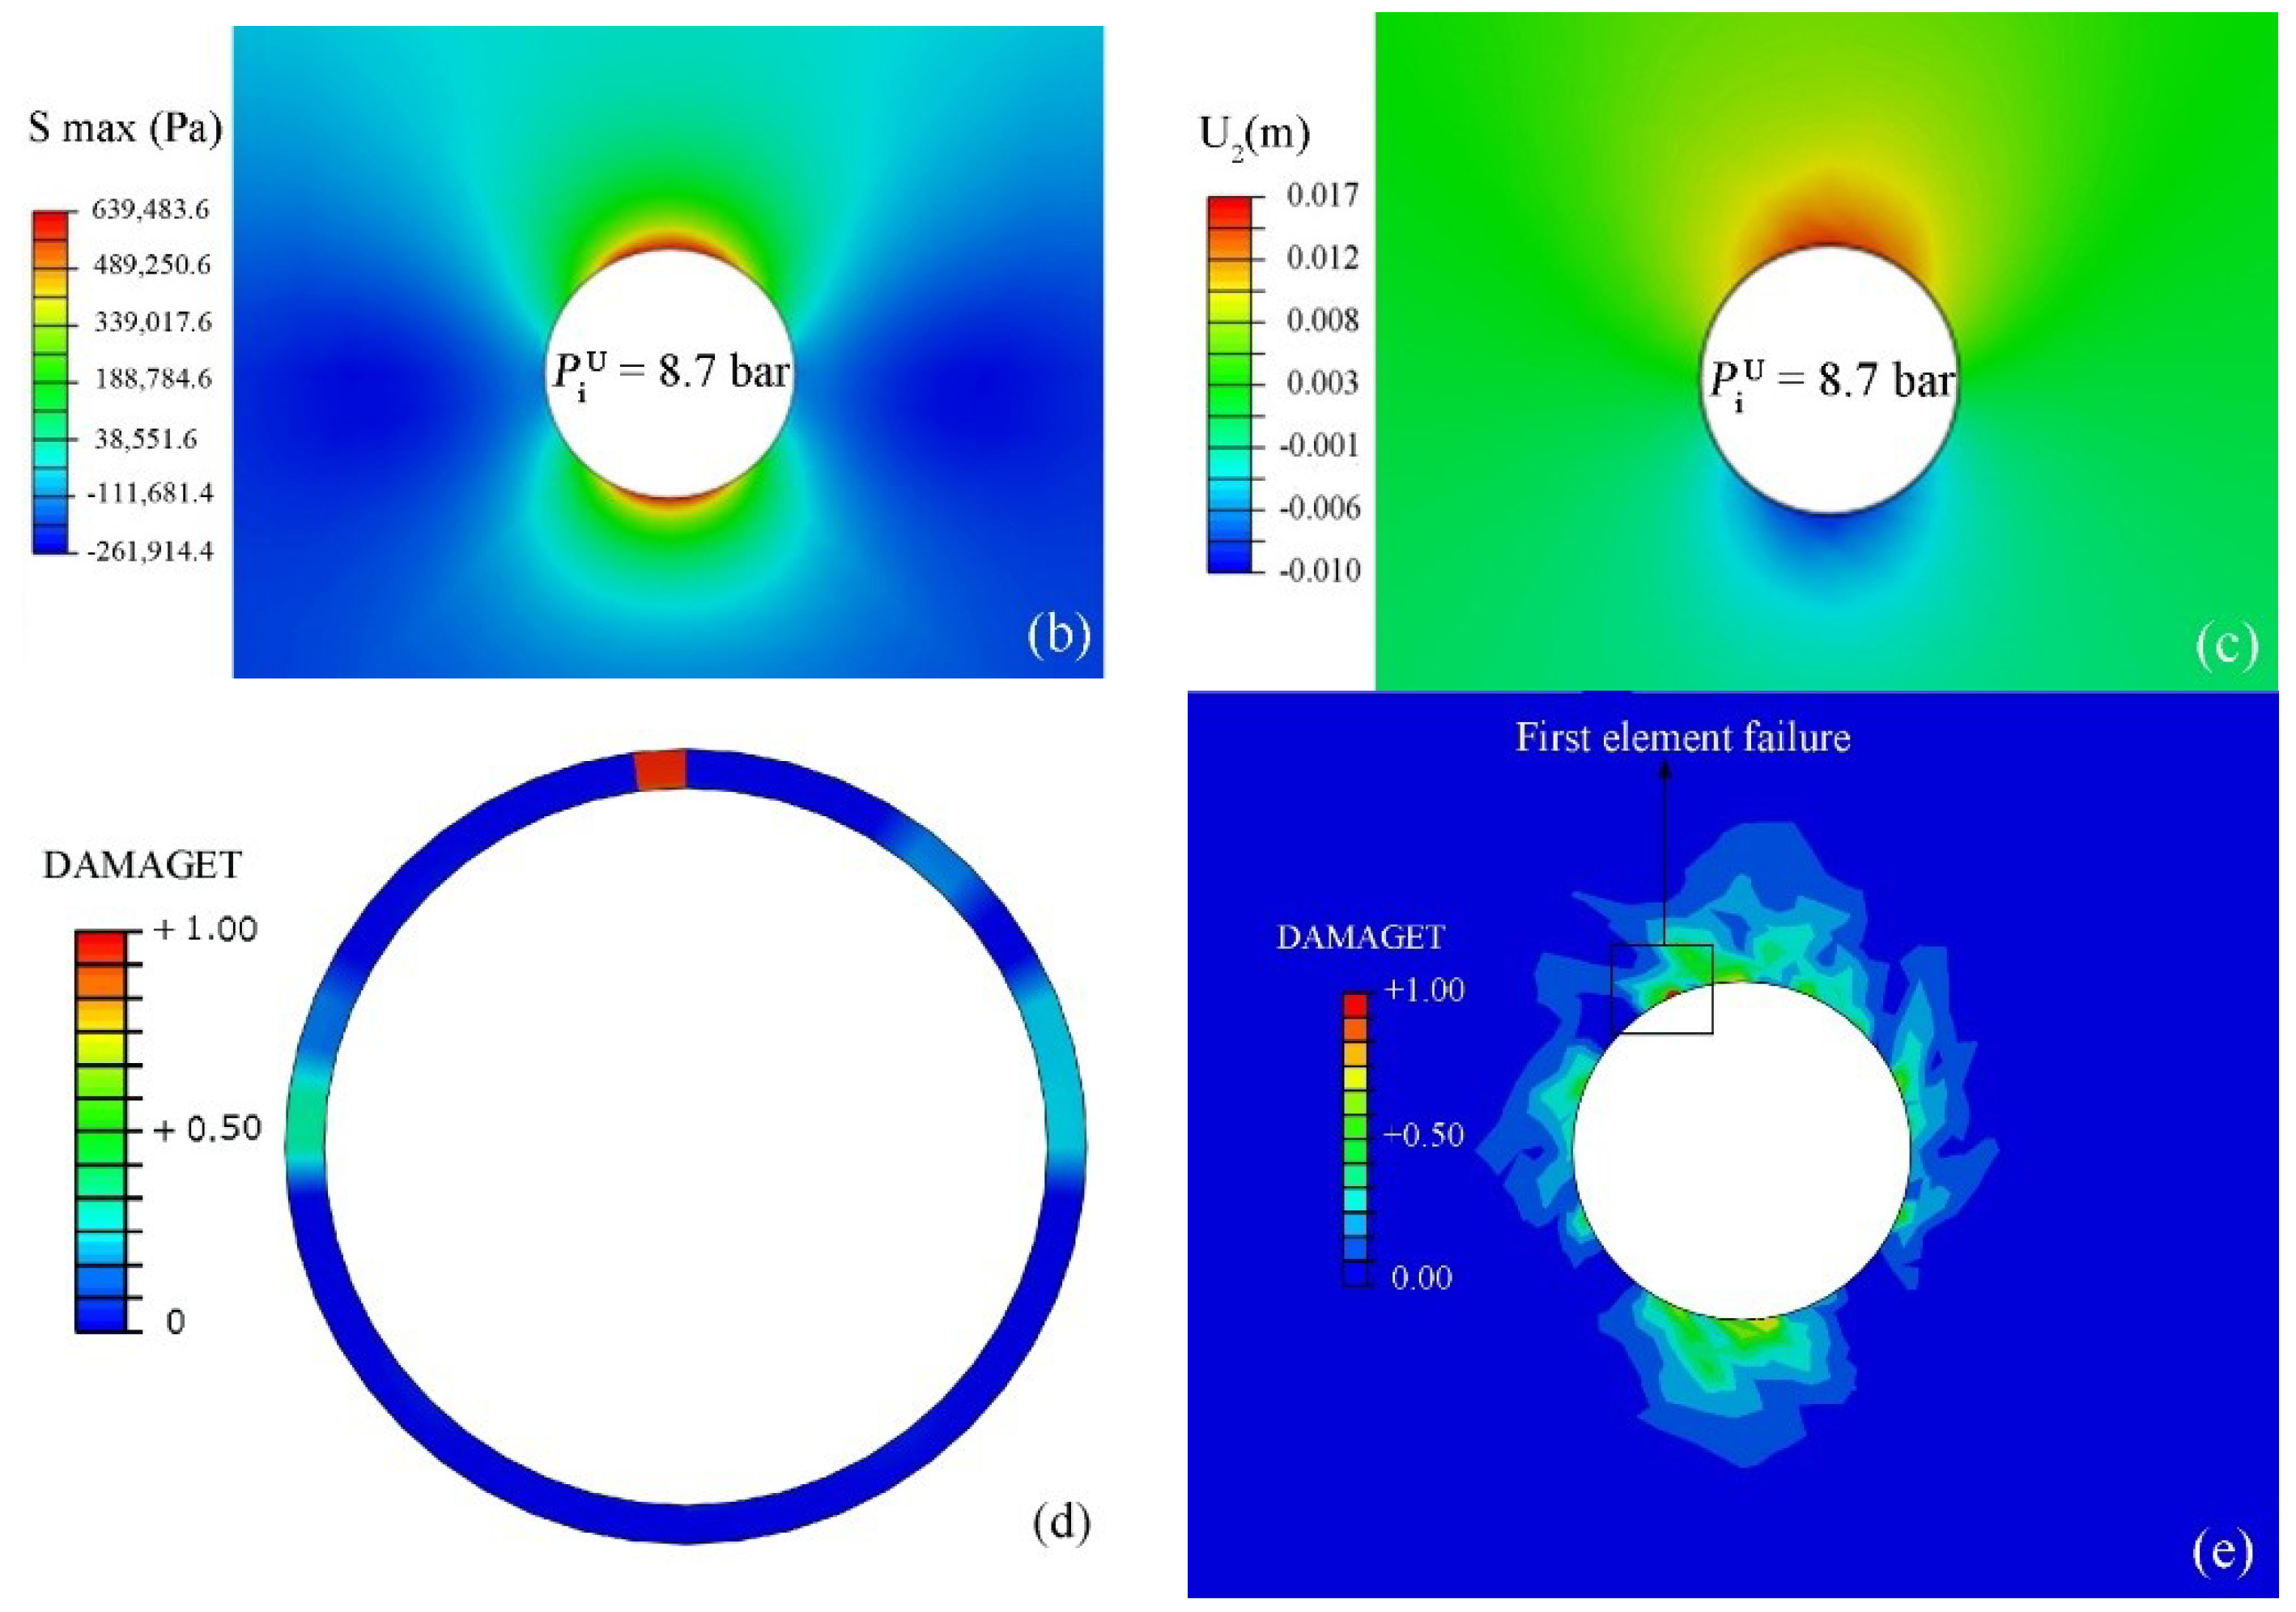
3.2. Bearing Capacity of the Tunnel in Normal Operating Conditions (Steady-State Conditions)

Based on the mechanical characteristics of the rock, and using the Mohr–Coulomb failure criterion, the failure of elements in the rock environment surrounding the tunnel was investigated. In this regard, maximum and minimum principal stresses were calculated and are presented in Figure 7. Since the problem was symmetric, half of the rock elements surrounding the tunnel were investigated.
In the Mohr–Coulomb failure criterion, the critical line divides the two-dimensional (2D) principal stresses into the safe zone (below the critical line), and the area where stresses cause failure in the element (above the critical line). Due to water pressure on the lining, and the transmission of part of this pressure to the rock, tensile stresses appear around the tunnel. Figure 7 shows that the combined stresses in elements surrounding the tunnel are located below the critical line, indicating that these elements do not fail. In Figure 7, the elements located near the critical line are considered as critical elements, which means higher water pressures will cause these elements to fail. Therefore, this internal pressure is the ultimate value that the rock can endure.
Considering the ultimate bearing capacity (PiU) obtained from the FEM, the Norwegian design criterion (NC) was evaluated to determine the overburden required to prevent hydraulic fracturing, due to the internal static head in the pressure tunnel (Equation (11)).
h   > γ w · H γ r · cos β ,
where h is the minimum overburden height to prevent hydraulic fracturing, H is the static water height in the tunnel, β is the slope of the valley that is equal to zero in this study, and γw and γr are the specific gravities of water and rock, respectively. The NC estimated the ultimate bearing capacity of the tunnel as 28 m water (for γw = 10 kN, γr = 28 kN, and h = 10 m).
Figure 8 shows (a) the ultimate bearing capacity of the tunnel under a steady-state condition based on the FEM results and the NC, (b) stress distribution in the rock, and (c) vertical displacements in the rock. According to the FEM results, the internal pressure equal to 8.7 bar (87 m water) is the maximum bearing capacity of the tunnel. According to Figure 8d, at first, the concrete lining cracks, and then cracking occurs in the surrounding rock. Afterward, a parametric study was performed and the effect of overburden height on the bearing capacity of the tunnel was investigated (Figure 9 and Table 6).
For validation of the results, an actual pressure tunnel project (Herlansfoss, Norway) was considered. In this project, the rock surrounding the tunnel is made of non-cracked schist with a friction angle equal to 30°. At chainages 150–200 m of the tunnel path, the tunnel is horizontal, with overburden height and an internal pressure of 45 m and 136 m water, respectively. In this range, no failure of the rock due to the internal pressure is observed [23]. The PiU values based on the FEM results (Figure 9), the NC, and in the actual project, are equal to 138, 126, and 136 m water, respectively, indicating that the FEM results are reliable. According to Table 6 and Figure 9, changes in PiU with increasing the overburden height are more dependent on φ than E and C.
In this study, the NC estimated the ultimate bearing capacity of the concrete-lined tunnel with 20 cm of the lining thickness and 3.6 m of diameter in intact rock, less than the value obtained from the numerical model in most cases (Figure 10). According to Figure 10, for all friction angles, up to 30 m of overburden height, the NC estimated PiU less than the FEM. By increasing the overburden height to values greater than 30 m, for all quantities of friction angles, PiU obtained from the FEM results approached the value obtained from the NC. Therefore, the NC overestimates the overburden required to prevent hydraulic fracturing in pressure tunnels located near the ground surface (h ≤ 30 m).

3.3. Applying Pressure Fluctuations in Transient-State Conditions

While the gate is being closed, the velocity upstream of the gate decreases, which results in a pressure build-up in the tunnel. The maximum pressure occurs when the gate is fully closed. Figure 11 shows the pressure fluctuations upstream of the gate during the total time of hydraulic analysis. In this study, it was assumed that the gate closure was done at a constant rate. Under sudden load rejection, which happens when the gate is closed quickly at a constant rate, critical conditions occur in the hydropower tunnel. This often occurs in special situations, such as a turbine generator shut down due to an earthquake. If the gate is closed in several stages, with different closure rates, the maximum transient pressure and the consequent damage to the lining will decrease.
In this study, the maximum pressure that was reached after complete gate closure was considered as the hydrodynamic load in the simulations; therefore, the rock resisted maximum water pressure, and the probability of hydraulic fracturing increased. The pressure–time curves at three different gate closure times are presented in Figure 12.
Figure 12 shows that the curves have a rising trend. According to Figure 12, by increasing the gate closure time, the maximum hydrodynamic pressure was reduced; during the first few seconds, kinetic energy converts into pressure energy at a faster rate; during the last seconds of gate closure, as water upstream of the gate reaches a steady-state condition, the pressure energy decreases. Transferring these loads to the Abaqus FEA and employing the Mohr–Coulomb failure criterion, the stresses in the rock elements surrounding the tunnel were calculated for different gate closure times, and are presented in Figure 13. According to Figure 13, the stress in almost all of the elements is above the critical line, which indicates that these elements failed. When the gate closes in 14 seconds, hydrodynamic pressures impose greater forces on the surrounding rock. Increasing the gate closure time decreases the pressures resulting from the transient-state condition. Figure 13c shows that some elements are in the safe zone, which demonstrates that increasing the gate closure time decreases the possibility of hydraulic fracturing in the rock.

The Effect of Increasing the Overburden Height on Preventing Hydraulic Fracturing

In order to investigate the impact of the overburden rock on hydraulic fracturing, the critical gate closure time of 14 s was considered. In this regard, the failure of the elements in the rock around the lining was investigated by considering the overburden height as 10, 20, 40, and 70 m. Figure 14 shows the stresses in these elements, with respect to the critical line, under different overburdens.
According to Figure 14, by increasing the overburden from 0.13H to 0.26H, stresses in some elements are higher than the critical value; therefore, these elements are located above the critical line. On the other hand, in some elements, stresses are less than the critical value, and they are located below the critical line. By increasing the overburden to 0.26H, as expected, the risk of hydraulic fracturing decreased as more elements appeared below the critical line. By increasing the overburden to 0.53H, more elements appeared below the critical line, but a number of elements were still above the critical line. For the case of an overburden equal to 0.93H, all elements appeared in the safe zone below the critical line, since the elements on the sides of the tunnel section are under the influence of stress concentration. As a result, they appear in the safe zone earlier than the other elements, due to an increase in the overburden.
Furthermore, Figure 15 shows the relationship between the overburden and the percentage of fractured elements around the tunnel. According to Figure 15, an increase in the overburden is not a safe solution to prevent the hydraulic fracturing phenomenon. In other words, due to rock overburden, the environment around the tunnel has in situ stresses. If the combination of stresses caused by the transient pressure inside the tunnel and the rock in situ stresses reaches a critical state, the elements will fail. The occurrence of hydraulic fracturing in one element will lead to a critical state in other elements. Therefore, it should be noted that increasing the overburden does not necessarily put all elements in the safe zone.

4. Conclusions

Different aspects of hydraulic fracturing in pressure tunnels were investigated in previous studies, and various strategies were proposed to prevent this serious issue. One strategy is to increase the height of overburden rock. In the present study, using the FEM, and considering the fluid–structure interactions, a pressure tunnel with an inner diameter of 3.6 m was modeled in intact elasto-plastic rock, and the Mohr–Coulomb failure criterion was employed to investigate failure in the rock environment surrounding the tunnel. A parametric study was performed to evaluate the bearing capacity of the tunnel, and the effect of transient pressure on the failure of the rock elements around the tunnel was investigated. Moreover, the applicability of the Norwegian design criterion was evaluated. Hydraulic analyses in transient hydraulic states were performed using Hammer software. The output of this software, including pressure–time values, were used in Abaqus FEA in order to analyze stresses in the rock.
The results showed the following:
  • Firstly, the concrete lining cracked, and then the elements in the surrounding rock failed;
  • Initial cracks were formed in the crown of the tunnel;
  • Increasing the overburden height had a less significant impact than a higher friction angle of the rock, on preventing the hydraulic fracturing of the rock elements;
  • The Norwegian design criterion is not an appropriate measure to prevent hydraulic fracturing in pressure tunnels with a typical diameter of about 3 m in intact rock with an approximate specific weight of 28 kN, and low overburden height (h ≤ 30 m);
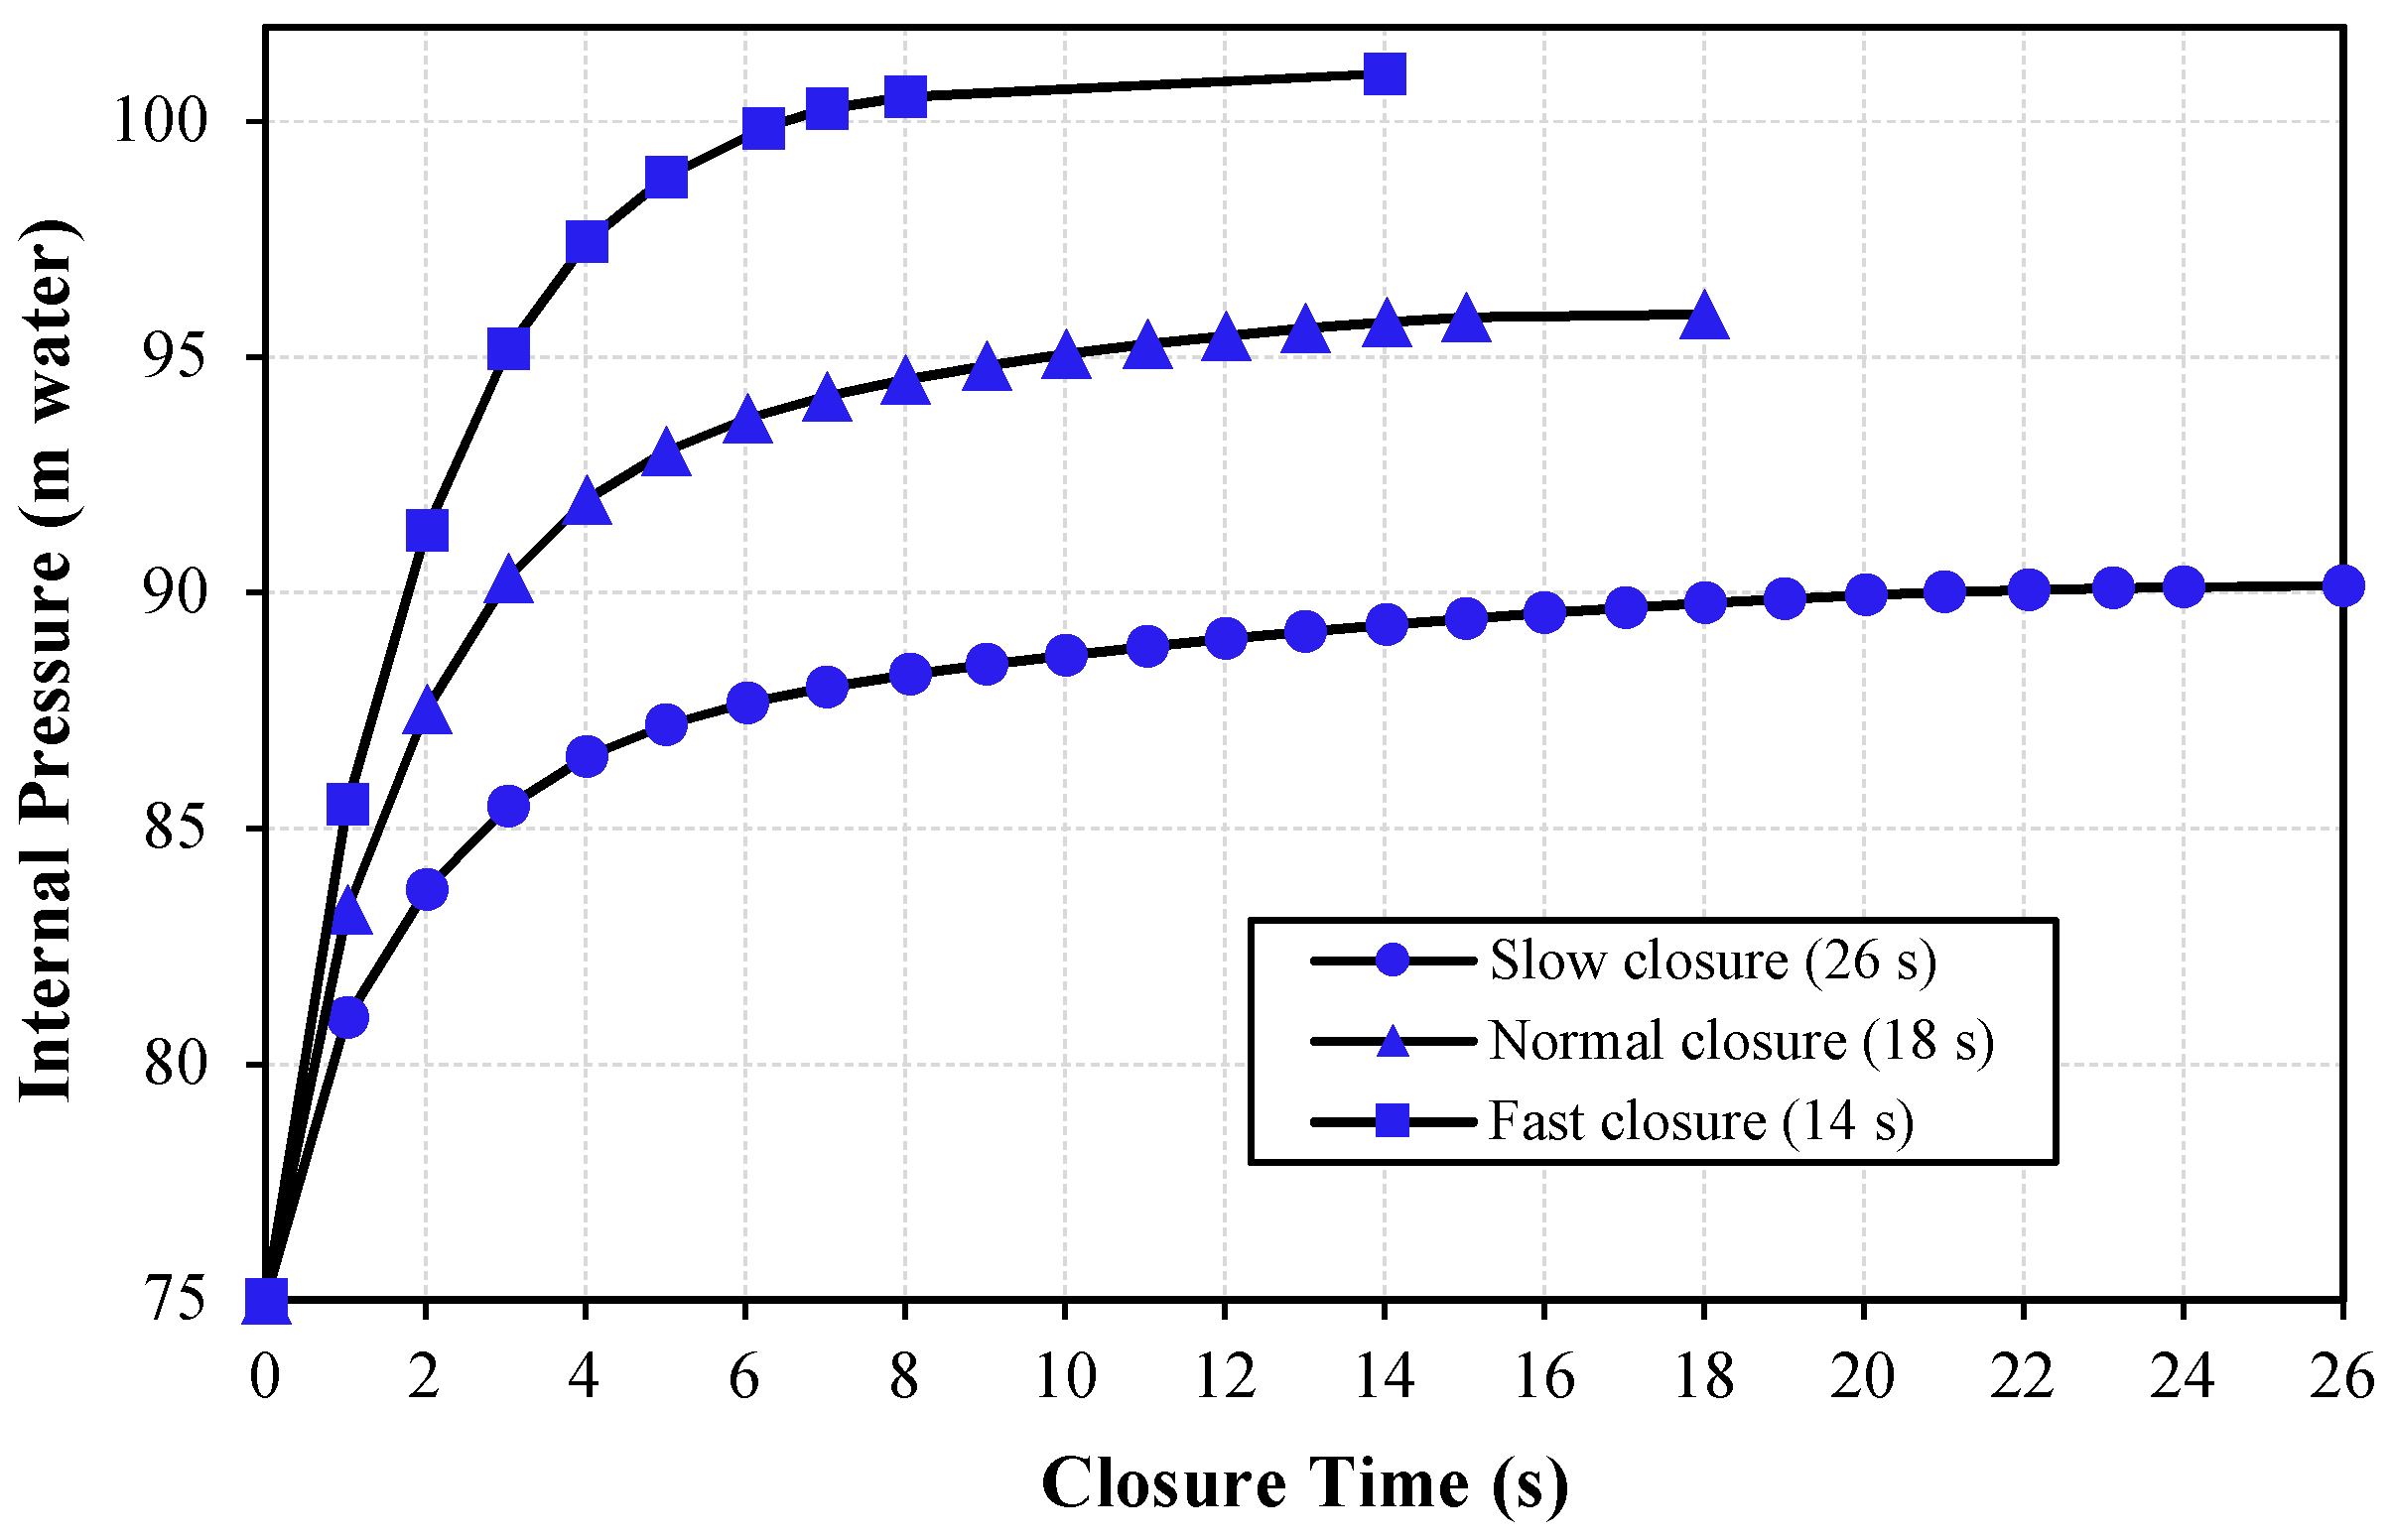
  • The rate of gate closure is a significant factor causing damage to the tunnel’s structure;
  • Increasing the gate closure time caused the maximum hydrodynamic pressure to decrease upstream of the gate, which resulted in a fewer number of failed elements in the rock around the tunnel;
  • Maximum transient pressures occurred in the early stages of gate closure and, consequently, hydraulic fracturing occurred during that time;
  • Analyses of the effects of different overburden heights indicated that increasing the overburden height would not always decrease the fracturing of rock elements;
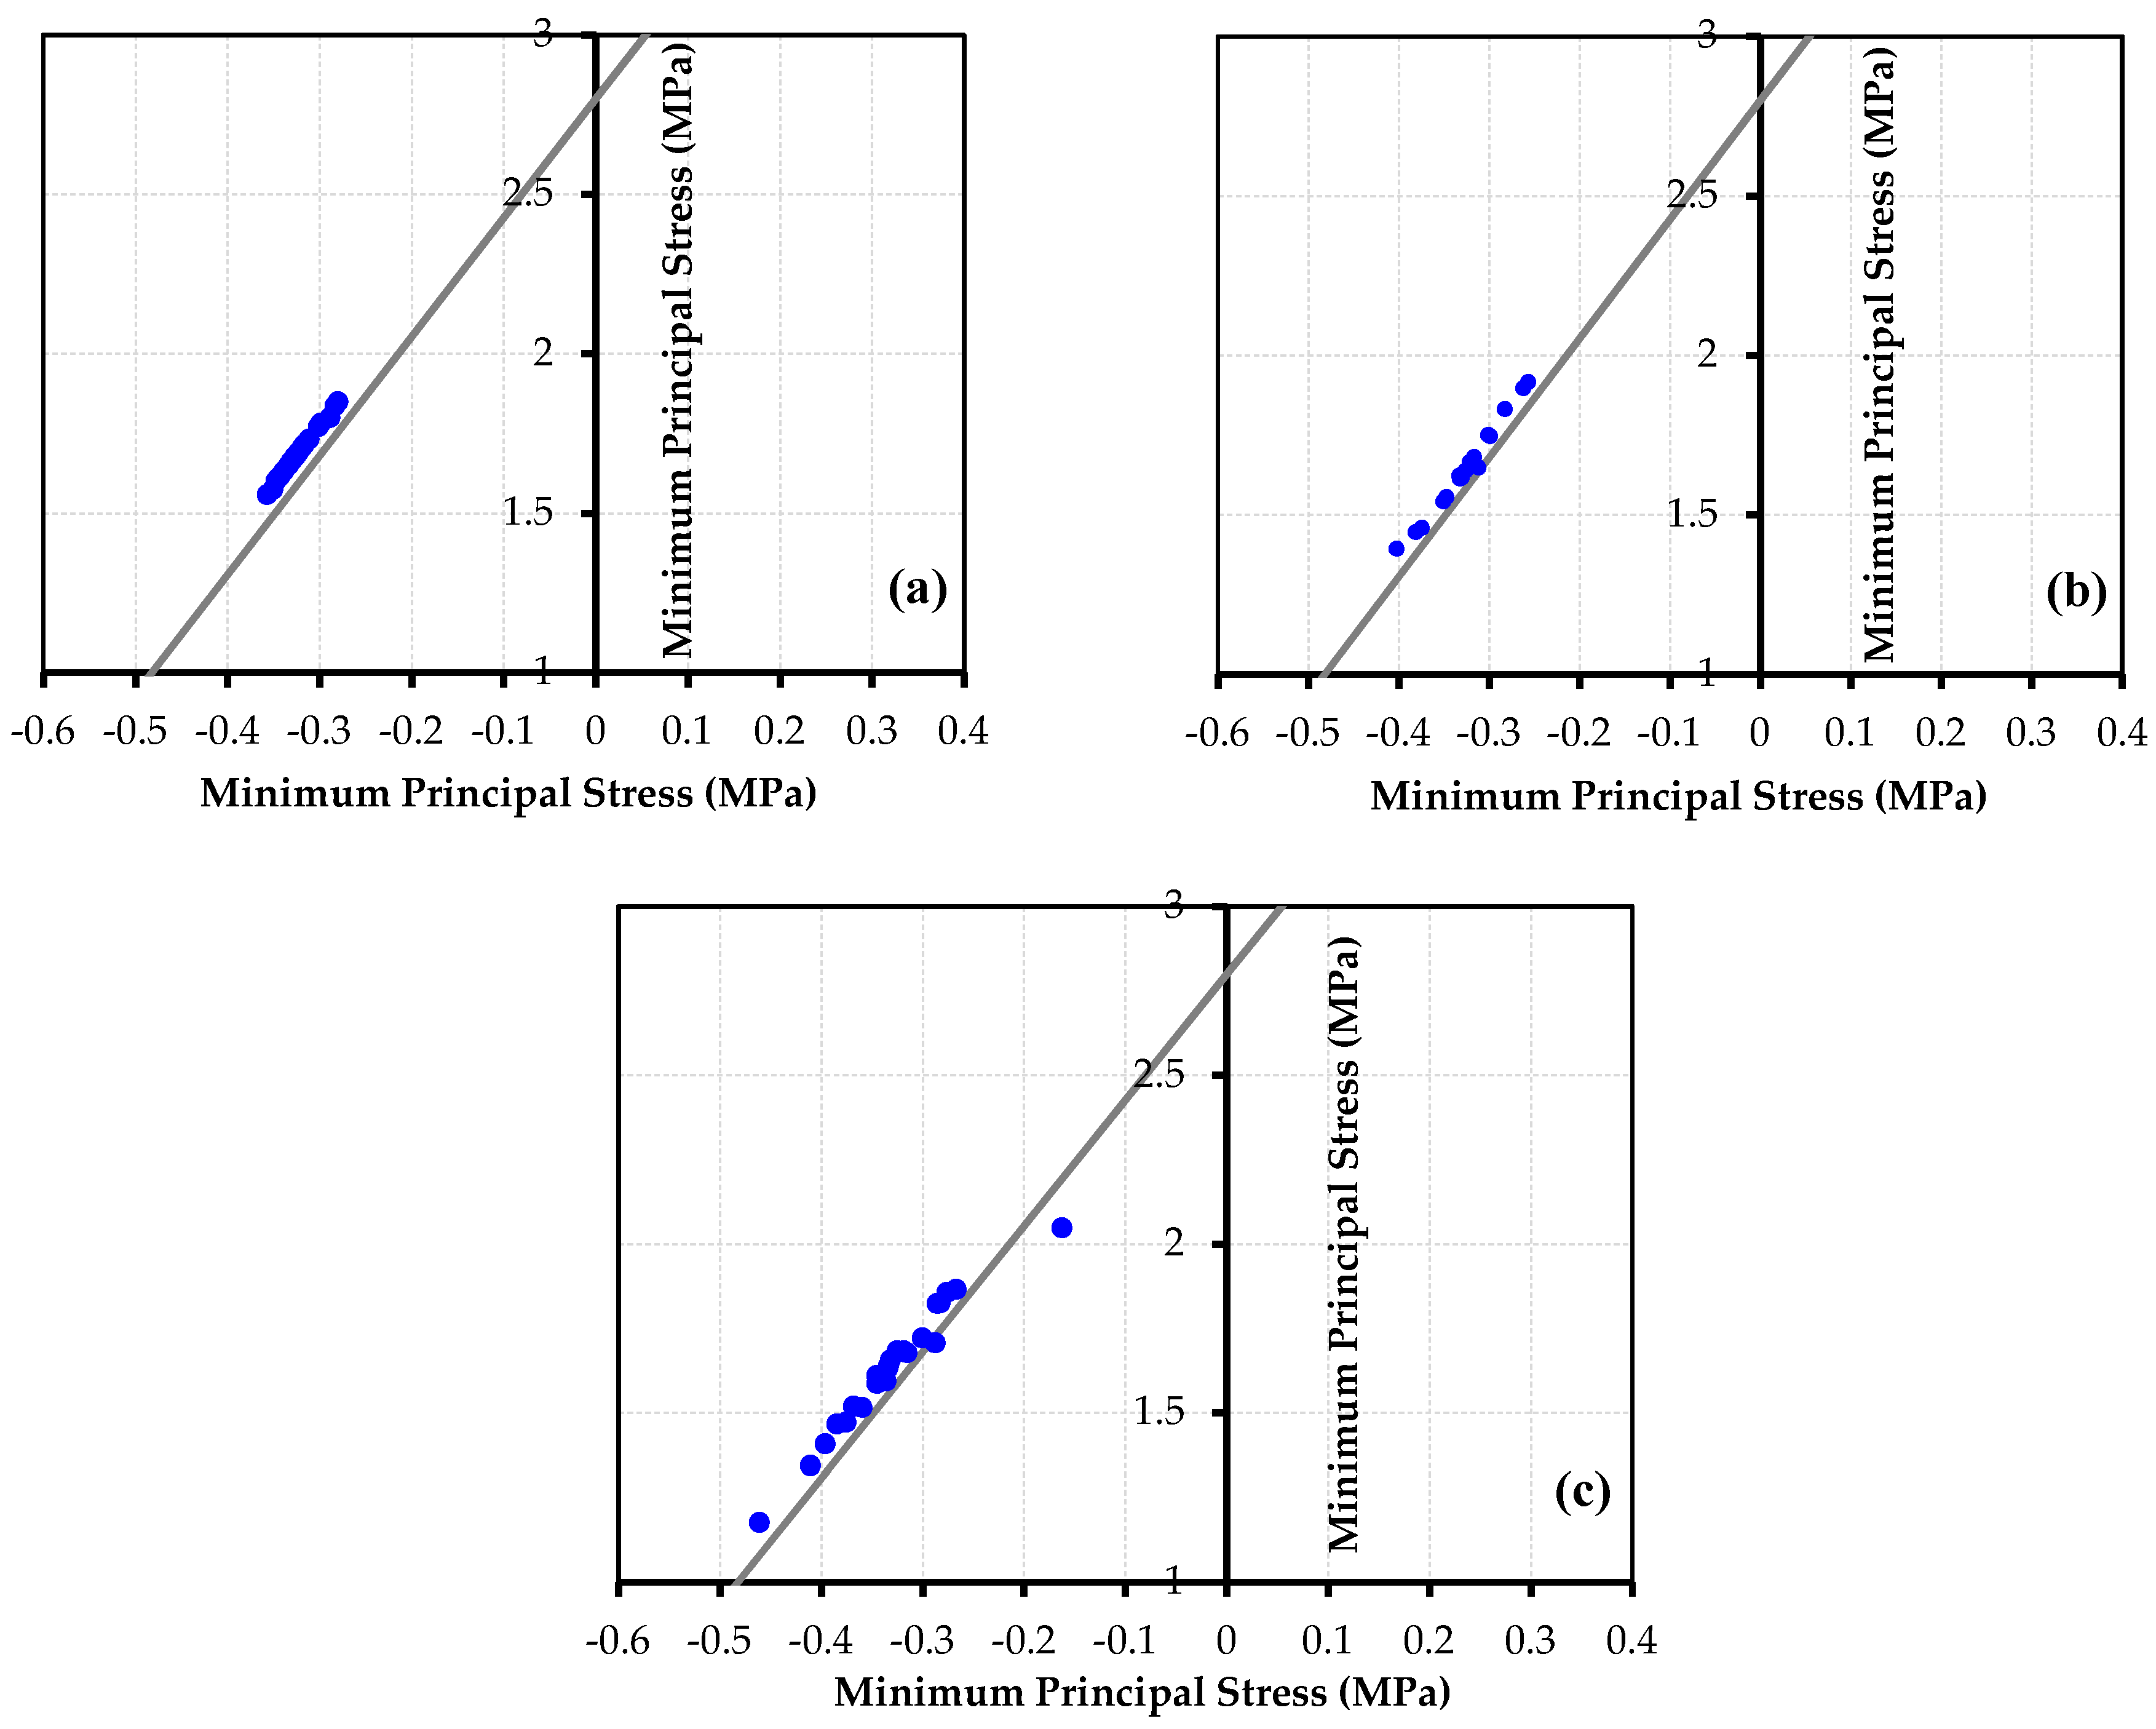
  • Based on the Mohr–Coulomb failure criterion results, by increasing the overburden height, fewer elements in the rock environment surrounding the tunnel failed, which can be attributed to the combination of principal stresses.
In order to prevent hydraulic fracturing in the rock, construction of a grouted zone around the pressure tunnel, along with increasing the overburden height, is recommended. The grout integrates the rock, in case any cracks exist, and improves its mechanical properties. In addition, the grouted zone results in decreased pore pressure in the rock, and reduces the possibility of hydraulic fracturing.

Author Contributions

Conceptualization, M.K. (Karakouzian), M.K. (Karami) and M.N.-S.; methodology, M.K. (Karakouzian), M.K. (Karami) and M.N.-S.; software, M.K. (Karami) and M.N.-S.; validation, M.K. (Karami) and M.N.-S.; writing—original draft preparation, M.N.-S. and M.K. (Karami); writing—review and editing, M.N.-S.; supervision, M.K. (Karakouzian).

Funding

This research received no external funding.

Conflicts of Interest

The authors declare no conflicts of interest.

Appendix

Grid and Boundary Sensitivity Analyses

Based on a trial-and-error procedure, a grid sensitivity analysis was performed in the model, in order to ensure convergence of the finite element equations, and the optimum pattern of meshing was determined. The mesh sizes used near the tunnel cross-section were smaller than those near the model boundaries (Figure 2).
Moreover, a sensitivity analysis was performed on the side boundaries of the model. According to Figure A1, for x ≥ 6D (D is the tunnel diameter) the side boundaries do not affect stresses in the rock environment surrounding the tunnel. In order to ensure preventing errors in the model calculations, this distance was considered twice the value obtained from grid sensitivity analysis (Figure 2).
Figure A1. Sensitivity analysis on the model boundaries: (a) changes in stress in the rock environment, vertically; (b) changes in stress in the rock environment, horizontally; x is the distance from the tunnel lining, σH is the horizontal stress in the rock, σV is the vertical stress in the rock, PH is the initial horizontal stress in the rock, and PV is the initial vertical stress in the rock.
Fluids 04 00112 g0a1

References

  1. Schleiss, A.J. Design of pervious pressure tunnels. Int. Water Power Dam Constr. 1986, 38, 21–26. [Google Scholar]
  2. Fernández, G.; Alvarez, T.A., Jr. Seepage-induced effective stresses and water pressures around pressure tunnels. J. Geotech. Eng. 1994, 120, 108–128. [Google Scholar] [CrossRef]
  3. Bobet, A.; Nam, S.W. Stresses around pressure tunnels with semi-permeable liners. Rock Mech. Rock Eng. 2007, 40, 287–315. [Google Scholar] [CrossRef]
  4. Hachem, F.E.; Schleiss, A.J. A review of wave celerity in frictionless and axisymmetrical steel-lined pressure tunnels. J. Fluids Struct. 2011, 27, 311–328. [Google Scholar] [CrossRef] [Green Version]
  5. Olumide, B.A.; Marence, M. Finite element model for optimum design of plain concrete pressure tunnels under high internal pressure. Int. J. Sci. Technol. 2012, 1, 216–223. [Google Scholar]
  6. Simanjuntak, T.D.Y.F.; Marence, M.; Mynett, A.E.; Schleiss, A.J. Pressure tunnels in non-uniform in situ stress conditions. Tunnell. Undergr. Space Technol. 2014, 42, 227–236. [Google Scholar] [CrossRef]
  7. Zhou, Y.; Su, K.; Wu, H. Hydro-mechanical interaction analysis of high pressure hydraulic tunnel. Tunnell. Undergr. Space Technol. 2015, 47, 28–34. [Google Scholar] [CrossRef]
  8. Pachoud, A.J.; Schleiss, A.J. Stresses and displacements in steel-lined pressure tunnels and shafts in anisotropic rock under quasi-static internal water pressure. Rock Mech. Rock Eng. 2016, 49, 1263–1287. [Google Scholar] [CrossRef]
  9. Zareifard, M.R. An analytical solution for design of pressure tunnels considering seepage loads. Appl. Math. Model. 2018, 62, 62–85. [Google Scholar] [CrossRef]
  10. Jia, B.; Tsau, J.S.; Barati, R. A review of the current progress of CO2 injection EOR and carbon storage in shale oil reservoirs. Fuel 2019, 236, 404–427. [Google Scholar] [CrossRef]
  11. Simulia. ABAQUS Theory Manual; Dassault Systèmes: Providence, RI, USA, 2012. [Google Scholar]
  12. Bentley Systems. HAMMER V8i User’s Guide. Available online: https://www.bentley.com/en/products/product-line/hydraulics-and-hydrology-software/hammer (accessed on 15 January 2019).
  13. Gasch, T.; Facciolo, L.; Eriksson, D.; Rydell, C.; Malm, R. Seismic Analyses of Nuclear Facilities with Interaction between Structure and Water: Comparison between Methods to Account for Fluid-Structure-Interaction (FSI); Elforsk: Frederiksberg, Denmark, 2013. [Google Scholar]
  14. Chopra, A. Dynamic of Structures, 4th ed.; Pearson Prentice Hall: Upper Saddle River, NJ, USA, 2012. [Google Scholar]
  15. Uchida, Y.; Kurihara, N.; Rokugo, K.; Koyanagi, W. Determination of tension softening diagrams of various kinds of concrete by means of numerical analysis. Fract. Mech. Concr. Struct. 1995, 1, 17–30. [Google Scholar]
  16. Lee, J.; Fenves, G.L. Plastic-damage model for cyclic loading of concrete structures. J. Eng. Mech. 1998, 124, 892–900. [Google Scholar] [CrossRef]
  17. Karami, M.; Kabiri-Samani, A.; Nazari-Sharabian, M.; Karakouzian, M. Investigating the effects of transient flow in concrete-lined pressure tunnels, and developing a new analytical formula for pressure wave velocity. Tunnell. Undergr. Space Technol. 2019, 91, 102992. [Google Scholar] [CrossRef]
  18. Karakouzian, M.; Karami, M.; Nazari-Sharabian, M.; Ahmad, S. Flow-induced stresses and displacements in jointed concrete pipes installed by pipe jacking method. Fluids 2019, 4, 34. [Google Scholar] [CrossRef]
  19. Jaeger, J.C.; Cook, N.G.W.; Zimmerman, R.W. Fundamentals of Rock Mechanics, 4th ed.; Blackwell Publishing: Hoboken, NJ, USA, 2007. [Google Scholar]
  20. Williams, O. Engineering and Design—Tunnels and Shafts in Rock; US Army Corps of Engineers: Washington, DC, USA, 1997. [Google Scholar]
  21. Halliwell, A.R. Velocity of a water-hammer wave in an elastic pipe. J. Hydraul. Div. 1963, 89, 121. [Google Scholar]
  22. Bouvard, M.; Pinto, N. Aménagement Capivari-Cachoeira étude du puits en charge. La Houille Blanche 1969, 7, 747–760. [Google Scholar] [CrossRef]
  23. Brekke, T.L.; Ripley, B.D. Design of pressu.re tunnels and shafts. Anal. Design Methods 1995, 349–369. [Google Scholar] [CrossRef]
  24. Hoek, E.; Carranza-Torres, C.; Corkum, B. Hoek-Brown failure criterion—2002 edition. Proc. NARMS-Tac 2002, 1, 267–273. [Google Scholar]
  25. RocLab, Rocscience Inc. Available online: https://www.rocscience.com/ (accessed on 15 January 2019).
  26. Tunsakul, J.; Jongpradist, P.; Soparat, P.; Kongkitkul, W.; Nanakorn, P. Analysis of fracture propagation in a rock mass surrounding a tunnel under high internal pressure by the element-free Galerkin method. Comp. Geotechnol. 2014, 55, 78–90. [Google Scholar] [CrossRef]
Figure 1. The flowchart of this study.
Fluids 04 00112 g001
Figure 2. The geometry of the surrounding rock and the excavation section.
Fluids 04 00112 g002
Figure 3. Simplified hydropower plan.
Fluids 04 00112 g003
Figure 4. Effective parameters in the parametric study.
Fluids 04 00112 g004
Figure 5. Comparing the formation and location of cracks in the numerical model (a) vs. the experimental model by Tunsakul et al. (2014) (b).
Fluids 04 00112 g005
Figure 6. Numerical vs. analytical results for pore pressures in the rock.
Fluids 04 00112 g006
Figure 7. The principal stresses in elements surrounding the tunnel, and their locations relative to the critical line.
Fluids 04 00112 g007
Figure 8. (a) The bearing capacity of the tunnel; (b,c) maximum stress and vertical displacement contours in the surrounding rock in a steady-state condition; (d,e) crack formation in the lining and rock.
Fluids 04 00112 g008aFluids 04 00112 g008b
Figure 9. Effect of overburden height on the bearing capacity of the tunnel. (a) h = 10 m; (b) h = 20 m; (c) h = 30 m; (d) h = 40 m.
Fluids 04 00112 g009
Figure 10. Comparing PiU based on the finite element model (FEM) results, the Norwegian design criterion (NC), and an actual pressure tunnel project, under steady-state conditions.
Fluids 04 00112 g010
Figure 11. Pressure fluctuations upstream of the gate during the hydraulic analysis.
Fluids 04 00112 g011
Figure 12. Changes in pressure upstream of the gate, in different scenarios: 14 s, 18 s, and 26 s.
Fluids 04 00112 g012
Figure 13. Stress in the elements by closing the gate in (a) 14 s, (b) 18 s, and (c) 26 s.
Fluids 04 00112 g013
Figure 14. The main stresses in surrounding rock by increasing overburden: (a) 0.13H, (b) 0.26H, (c) 0.53H, and (d) 0.93H (gate closure time in all cases was 14 s).
Fluids 04 00112 g014
Figure 15. Percentage of cracked elements due to increased overburden height for gate closure times of (a) 14 s, (b) 18 s, and (c) 26 s.
Fluids 04 00112 g015
Table 1. Mechanical properties of the lining [15,16].
ParameterValue
Elasticity (GPa)25
Tensile strength (MPa)3
Cohesion (MPa)4.5
Inner friction angle (°)45
Poisson's ratio (-)0.25
Density (kg/m3)2400
Axial compressive strength (MPa)28.3
Hydraulic conductivity (m/s)1 × 10−8
Table 2. Geometric and hydraulic characteristics of the duct.
Inner Diameter (m)Thickness (mm)Hazen Williams Coefficient (-)Initial Discharge (m3/s)Pressure Wave Velocity (m/s)Upstream Head (m)Initial Flow Velocity (m/s)
3.620010060911806
Table 3. Node elevations and properties of node E (turbine).
Elevations (m)NodeProperties of Node E (Turbine)
The diameter of the spherical valve (m)1.5
A (inlet)2305Efficiency (%)90
B2263.1Moment of inertia (N·m2)107
C2262.62Speed (rpm)580
D1753.5Specific speed115
E1714.9Gate closure schedule curveVariable
F (outlet)1770
Table 4. Constant values in present study.
ParameterValue
t (cm)20
k0 (-)0.5
kr (m/s)1 × 10−7
γr (kN)28
Table 5. Parameters and their values in parametric analyses [23,24,25].
ParameterRange
Er (GPa)2–10
C (MPa)0.635–1
φ (°)27.57–35.47
h (m)10–40
Table 6. The ultimate bearing capacity of the tunnel ( P i U ), under different scenarios. FEM—finite element model.
Scenario No.Er (MPa)h (m)C (MPa)φ (°) P i U   ( m )   Based   on   the   FEM
M-12177.94100.63527.5787.3373
M-23076.420.70129.3487.2097
M-36138.260.85132.8693.5221
M-48185.510.92934.32120.7
M-510,304.941.00335.47138.62
M-62177.94200.63527.5783.0878
M-73076.420.70129.34116.1696
M-86138.260.85132.86118.795
M-98185.510.92934.32114.442
M-1010,304.941.00335.47100.166
M-113076.42300.70129.3489.491
M-122177.940.63527.57110.301
M-136138.260.85132.86120.613
M-148185.510.92934.32100.115
M-1510,304.941.00335.47119.295
M-162177.94400.63527.5758.334
M-173076.420.70129.34126.234
M-186138.260.85132.8698.698
M-198185.510.92934.32100.362
M-2010,304.941.00335.47101.633

