1. Introduction
The laboratory production of new materials usually yields small quantities. This is the case, for example, of polymer synthesis, where specific architectures with controlled morphologies and narrow molecular weight distributions can be produced [
1,
2,
3]. With very low amounts (order of hundreds of milligrams), the analysis and characterization of the chemical and physical properties of the material become, as such, difficult and sometimes even impossible to perform with the available quantities, if further purification is needed [
4,
5]. Moreover, the synthetic process of complex architectures can be time consuming as, for example, in the case of regular branched structures [
6,
7,
8,
9]. On the other hand, time is an important variable in research, and laboratory resources are limited; hence, the necessity of obtaining data in a short time does not allow to gather sample material via a series of synthetic processes [
10].
One particular situation where both small samples and short measuring times are required is that of high throughput experimentation (HTE), particularly relevant in the field of polyolefin synthesis [
11,
12]. Here, a large number of polymer samples are synthesized under different conditions (pressure, temperature, feed composition, catalyst), simultaneously yielding several tens of different polymers, each one in the amount of a few milligrams.
Depending on the type of material, the amount of sample required for rheological characterization varies from several grams to a few milligrams. More specifically, for polymer melts, a linear frequency response with the canonical approach is obtained with less than 100 mg. For example, a standard 8mm plate-plate geometry requires roughly 25–50 mg [
13]. However, as mentioned above, this quantity can be larger than the usual amounts obtained from laboratory-scale synthesis. For these reasons, there is an increasing need to find an accurate and controlled way to measure small samples. Recent commercial rheometers facilitate this process, as they are able to measure very low torques (few nanonewton meters) and resolve extremely low angular displacements (hundreds of nanorads). Nevertheless, when different variables are forced to the maximum of their sensitivity in the same measurement, and secondary effects also play a role, the viscoelastic response becomes arguable and a more critical approach to the measurement protocol and its elaboration should be developed [
14]. Indeed, experimental techniques measure displacements and loads, and convert them in stress or deformation by assuming ideal conditions. Unfortunately, ideal conditions can be invalidated by various factors such as fluid and instrument inertia [
15], underfilling and overfilling, sample volume, and surface tension [
16,
17], to name a few. These effects can concurrently contribute in the same rheological measurement, and may invalidate results and sometimes cause measured properties to incorrectly appear nonlinear or non-Newtonian. As an example, surface tension can generate torques in steady shear for Newtonian fluids (which could be mistaken as shear thinning) and the effect could grow with slight overfilling, which increases contact line rotational asymmetry [
18].
A smaller amount of sample can be obviously employed by using smaller size geometries. This is a straightforward approach, for example, when working with parallel plates on rotational rheometers. Concerning parallel plates, the possibility of experimental errors, however, increases as the plate size decreases. For a given material in the same test conditions, the torque varies with the third power of the radius. Hence, reducing the radius by a factor of two means reducing the measured torque by eight times. In addition, if gap and strain are fixed, the applied angular displacement decreases linearly with the radius. Another issue arising with the use of small geometries is the difficulty of machining flat surfaces with small diameters, thus determining plate misalignment. On top of that, the squeeze flow of air between plates induces gap errors [
19,
20]; hence, the zero gap position must be carefully checked.
Nonlinear measurements are even more challenging. Nonetheless, there is a great interest to obtain information on the rheology of fluids in fast flow conditions, for example in fast shear, for processing applications. On the other hand, transient shear experiments are hindered by flow instabilities such as edge fracture. A possibility to perform reliable measurements in start-up shear is provided by the so-called cone-partitioned plate (CPP) geometry [
21,
22,
23,
24]. Such a geometry is formed by two parts, namely a bottom standard cone and a top plate that is split into an inner measuring plate and an outer non-measuring corona. The sample exceeds the area of the inner measuring plate so that, when shear fracture sets in at the edge of the sample, it requires a certain time to reach the inner part. During this time, reliable rheological measurements are still possible. However, even when working with small diameters of the inner plate, the overfilling to prevent edge fracture requires more sample compared with a standard cone and plate geometry with the same diameter.
In this study, we perform linear and nonlinear rheological measurements on a monodisperse polystyrene of average molecular weight 200,000 Da, with home-made tools characterized by small diameters and variable gap size. We try to minimize sample quantities and show that the linear response obtained with 8-mm parallel plates is reproducible, within experimental error, by using a plate of 3 mm. This means that, starting from the standard mass of 25–50 mg, one can obtain an accurate viscoelastic measurement with samples as small as 2 mg. In addition, we performed nonlinear start-up shear experiments with two cone-partitioned plate geometries, having an inner diameter of 6 mm and 4 mm, respectively. We demonstrate that reliable and reproducible nonlinear measurements are obtained with an amount of 10 mg.
2. Materials and Methods
For both linear and nonlinear tests, we used a linear polystyrene with a molecular weight of 200,000 Da, henceforth coded as PS200k. The polymer was purchased from Agilent Technologies (molecular weight of the highest peak, M
p = 202,100 Da; PDI = 1.03, as supplied by the producer; Batch No.: 0006314460). The samples were shaped to discs of different diameters by means of vacuum compression molding. Briefly, a proper amount of sample is weighed and inserted in a mold with a specific diameter (
Figure 1a). The mold consists of a bottom plate (E), a cylinder (D) with holes of specific diameters, and corresponding pistons (A). The clearance between the pistons and the holes is approximately 50 μm. The cylinder with holes is fixed to the bottom plate by means of four screws. The sample fills in a specific hole and the corresponding piston is placed on top. The mold is then inserted in a small vacuum chamber (B,C) and put in a hot press.
The samples were shaped for 8 min at 150 °C. The normal force applied was approximately 200 kg. After 8 min, the normal force was released. The mold was then cooled down to room temperature and the samples were extracted. We shaped samples with diameter values of 8, 6, 5, 4, and 3 mm. The corresponding masses at 25 °C, nominal gap (ratio of the total volume to the cross-section), actual gap used for the measurements, and ratio of nominal to actual gap are reported in
Table 1. To calculate the nominal gap, we evaluated the nominal volume as the product of the sample mass by the density of polystyrene at 150 °C (
g/cm
3).
Linear rheological measurements were performed on a Physica MCR702 (Anton Paar GmbH, Ostfildern, Germany) equipped with a Peltier plate and hood (H-PTD200) for temperature control. A shaft for disposable tools was used in order to mount homemade stainless-steel plates with different diameters (
Figure 1b). The linear frequency response was measured at three different temperatures, namely 130 °C, 150 °C, and 170 °C. The applied strain was 6% at 170 °C, 5% at 150 °C, and 2% at 130 °C. The thermal expansion of the tools was taken into account while measuring at different temperatures.
The terminal regime was obtained by performing creep measurements at 170 °C (applied stress = 50 Pa) and converting the creep compliance data into dynamic moduli. The creep conversion was performed by using the NLreg software [
25].
Nonlinear rheological tests were carried out on an ARES strain-controlled rheometer (TA instruments, New Castle, DE, USA) equipped with a convection oven for temperature control. We used two homemade cone-partitioned plate (CPP) geometries, one having an inner plate radius of 6 mm (referred to as CPP6) and another having an inner plate radius of 4 mm (referred to as CPP4). Details on the construction of the plates are provided elsewhere [
21,
26,
27]. The bottom cone is a homemade cone with a truncation of 105 µm and an angle of 5.5°.
3. Results and Discussion
Figure 2 shows the frequency response of PS200k at different temperatures. The data are taken with parallel plates having different diameters. For all samples, the following measuring protocol was applied. The sample was loaded at 150 °C; after 20 min, necessary to guarantee thermal equilibration and relaxation of the sample, a frequency sweep test in the range from 100 to 0.1 rad/s was performed (applied strain = 5%). Next, the temperature is increased to 170 °C; after 20 min, a frequency sweep test was performed (applied strain = 6%); at the end of the test a creep measurement was completed for approximately 30 min (applied stress = 50 Pa). The creep test at high temperature is used to complement the frequency measurements in the low frequency range. Subsequently, the temperature is lowered to 130 °C; after 40 min for thermal equilibration and sample relaxation, a frequency sweep test was performed (applied strain = 2%).
Figure 2 demonstrates good reproducibility of the tests with different diameters, within experimental error. The maximum deviation among the frequency sweep tests at 150 °C is of the order of 10%. At 170 °C, the deviation is even lower (7%). The maximum discrepancy among the tests is observed at 130 °C (
Figure 2c). There are multiple reasons for this discrepancy. First, the extent to which the sample is pressed in between the plates is not the same for all the samples, as can be noted from
Table 1. In fact, the ratio of the nominal gap (calculated as the ratio of the total volume of the sample to its cross-section) to the actual gap is not the same for all samples. During the loading, the sample needs to be pressed between the plates to allow for optimal adhesion of the polymer to the plate surfaces. Moreover, the volume between the plates must be completely filled by the polymer. It is quite difficult, however, to perfectly center the sample between the plates at high temperature. Therefore, it is sometimes necessary to squeeze the sample in between the plates in order to fill the measuring volume completely. In doing so, some parts of the sample exceed the area of the plate and wrap around the plate itself, causing an extra torque contribution, thus inducing an apparent increase in the viscoelastic moduli. Such an increase depends on the level of overloading and can shift the viscoelastic moduli up to 20% with respect to the true value. Another possible explanation for the vertical shift between the data is the gap setting. The zero gap was performed by software and manually checked by bringing the plates in contact with each other. However, it is difficult to machine completely flat plates, especially when dealing with small-diameter geometries. Small imperfections can lead to a few-microns-gap error. When working with standard gaps of approximately 1 mm, such an error is not relevant. However, it becomes important when working with small gaps, i.e., below 0.2 mm. Another possible source of the vertical shift has to do with the cooling of the sample from 170 °C to 130 °C. A rapid decrease in temperature can cause partial detachment of the sample from the plates or inhomogeneity of the edges due to the different thermal expansion coefficients of the polymer and measuring tools. The typical cooling rate of the Peltier element used here is approximately 20 °C/min in the temperature range explored. Moreover, the response of the thermal control unit is generally overdamped. This causes a temperature overshoot with respect to the set point during heating, or an undershoot during cooling. Therefore, the sample experiences a larger temperature difference with respect to the set points.
We point out that the shift of the curves at a fixed temperature in
Figure 2 is mainly vertical, even though a minor horizontal shift can be also detected from phase angle data. It is worth mentioning the slight deviation of the measurements in the high frequency part when measuring with 4-mm and 3-mm parallel plates (green and orange curves). This discrepancy is evident at 150 °C and 170 °C, where the elastic and viscous moduli tend to “bend” at high frequencies. We attribute such a deviation to the torsional compliance of the instrument, which affects the values of the moduli mainly in the high frequency range [
28]. We note that the instrument compliance is the total compliance resulting from the motor, measuring system, and Peltier element; therefore, it is specific for each combination of rheometer and plate [
29]. If the compliance of the measuring instrument is known, then the measured viscoelastic moduli can be corrected accordingly in order to obtain the true values. The expression for such a correction with parallel plates has been demonstrated in previous works [
28,
29,
30]. Since the error here is small, we did not attempt to correct the compliance effect of the measuring tools.
The data in
Figure 2 were used to build rheological mastercurves according to the time–temperature superposition (TTS) principle [
31,
32].
Figure 3 shows the mastercurves built from the dynamic frequency sweep tests in
Figure 2. Since only three temperatures were available, it was difficult to obtain a good empirical estimate of the horizontal shift factors. Therefore, the values of the William-Landel-Ferry (WLF) fit constants of polystyrene were taken from literature [
31,
33,
34]. In order to build the mastercurves in
Figure 3, we calculated the horizontal shift factors
according to the WLF fit equation,
at the reference temperature of 150 °C, using
°C and
°C. The calculation yields the following values of the shift factors:
, and
. The vertical shift factors were also calculated theoretically, according to temperature-density compensation. In fact, the vertical shift factors are given by
, where
is the density at the reference temperature
(in K), and
is the density at the temperature
. The density of polystyrene (in kg/m
3) at the different temperatures was evaluated according to
[
35], with the temperature expressed in K.
The mastercurves are reported in
Figure 3 with the same color legend as in
Figure 2. The agreement between the different datasets is good: the curves measured with the different plates virtually overlap with each other over the whole frequency range. The maximum deviation between points of the different mastercurves at the same frequency is approximately 12%; therefore, it can be considered within experimental error.
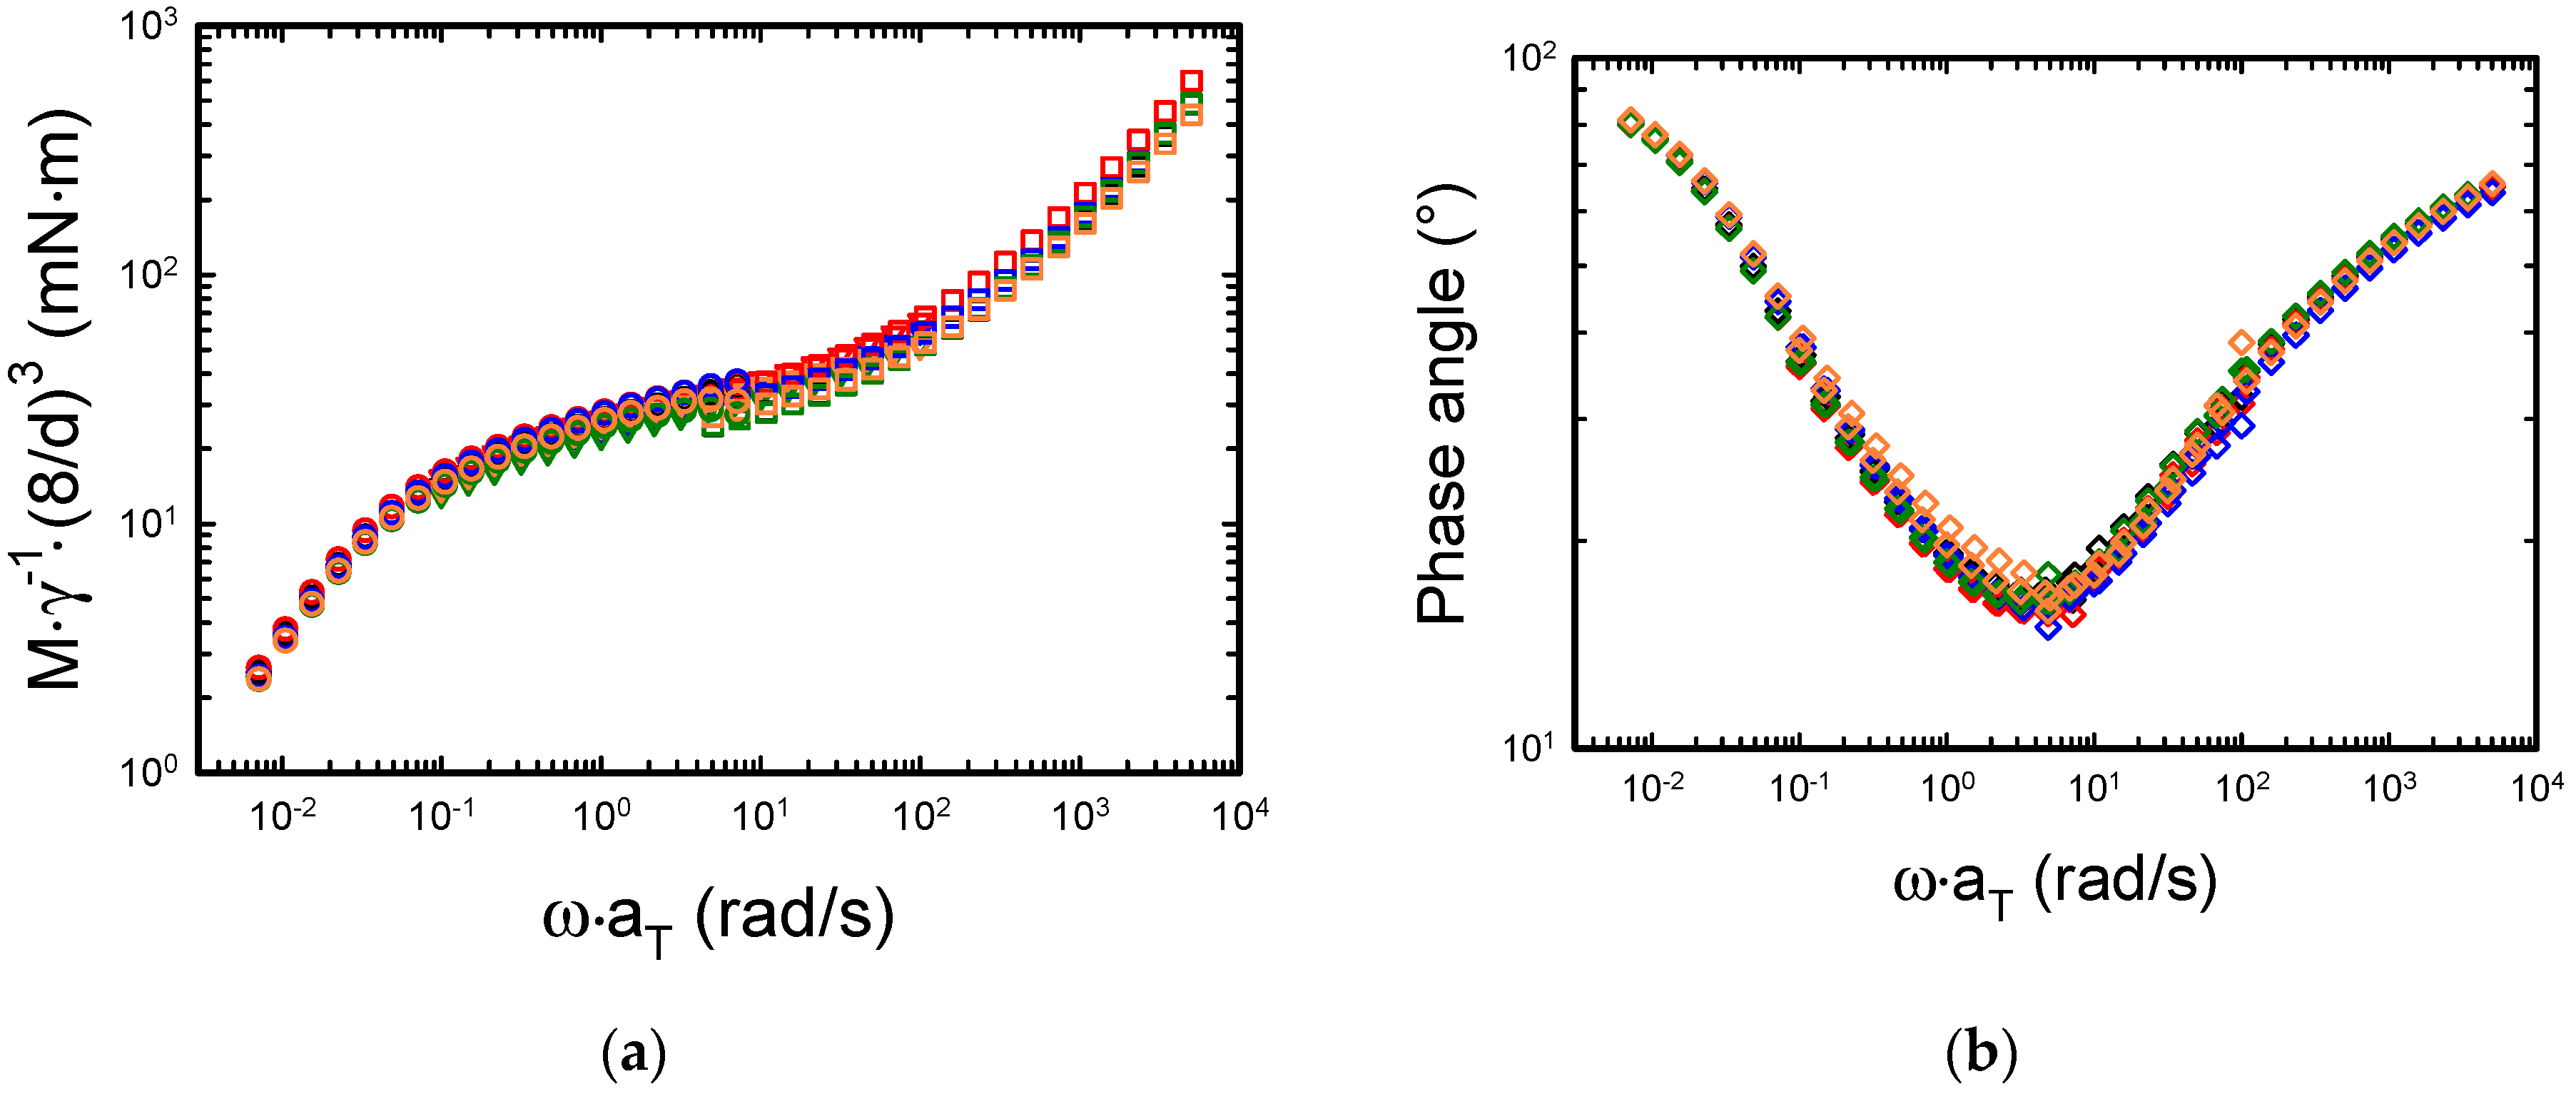
The deviation between measurements with different diameters can be better highlighted by plotting the relevant variables read by the rheometer during dynamic measurements, namely torque, and phase shift between torque and strain waves.
Figure 4a shows the mastercurves obtained normalizing the torque at different diameters.
In the linear regime, the torque signal is proportional to the applied strain and to the radius raised to the third power. Therefore, by dividing the torque signal by the strain and multiplying it by the ratio of the radii to the third power (D = 8 mm was used as reference), the data corresponding to the different diameters should collapse into a mastercurve. Furthermore, if one multiplies the dynamic data at the different temperatures by the corresponding horizontal shift factors, then a single torque mastercurve is obtained. It is worth mentioning that the lowest value of the measured torque for all the dynamic measurements (7.2 µNm) is well above the minimum torque measurable with the rheometer (0.001 µNm). The data in
Figure 4a show that indeed the normalized torque collapses into a mastercurve as expected, and the largest discrepancies between the different signals are observed at 130 °C. Moreover,
Figure 4b reports the phase angle as a function of frequency. The phase angle δ is evaluated as
. The signal becomes noisy around the minimum due to the large difference between the elastic and the viscous contribution to the viscoelastic response [
36]. The noise is more relevant with plates having small diameters because the magnitude of torque and angular displacement are smaller compared to those obtained with plates having larger diameters.
From the mastercurves in
Figure 3, the low frequency crossover, corresponding to the terminal relaxation time of the polymer, can be extracted. However, inspection of
Figure 3 shows that the terminal region, that is, the low frequency range where the storage modulus has a slope of 2 and the loss modulus has a slope of 1, is not fully attained. Measuring at temperatures higher than 170 °C with polystyrene is not recommended, as thermal degradation may occur [
37]. In addition, with the smallest diameter plate and at higher temperatures, the torque can reach values close to the sensitivity limits of the instrument. An alternative is to conduct a creep measurement and convert the creep compliance into dynamic data.
Figure 5a shows the creep experiments performed on the samples at 170 °C.
Figure 5a shows the excellent agreement between the data measured with different geometries. Discrepancies are observed only at short times, which are not relevant for the determination of the terminal behavior. The typical creep ringing at early times due to inertia is also observed with the smallest geometries (3 mm and 4 mm) [
14].
Figure 5b shows the conversion of the different compliance curves in
Figure 5a into dynamic moduli obtained with the NLreg software. The very good agreement for the loss modulus is evident. Larger, but still acceptable deviations are observed in the elastic modulus for measurements with different diameters. In addition, the agreement of the converted dynamic data with the measured data (black symbols) confirms the validity of the conversion of creep compliance into dynamic moduli and, indirectly, the reliability of the creep measurements.
Hitherto, our study focused on linear measurements, demonstrating that the relaxation spectrum of polymer melts can be safely measured even with very small sample amounts. However, to the end of polymer processing, information on nonlinear shear flow behavior is also important. The point here is again about the minimum amount of sample that could be used in order to obtain reliable data in the nonlinear regime. To address this question, we performed nonlinear start-up shear tests on PS200k at 160 °C and different shear rates. To this end, we used two different partitioned cone geometries with an inner diameter of 6 mm (CPP6) and 4 mm (CPP4), respectively. For the CPP6 setup we used 22 mg of sample, whereas with CPP4 we used only 10 mg of sample. The results of the test are reported in
Figure 6a.
Figure 6a demonstrates the excellent agreement between the data obtained with CPP6 and CPP4. The quality of the data is confirmed by the fact that the short-time nonlinear response overlaps with the linear viscoelastic (LVE) envelopes evaluated from a combination of the Cox-Merz rule [
38] and the Gleissle rule [
39]. The dashed black line is the LVE envelope calculated from the LVE response of the sample measured at 160 °C before starting the transient measurements. The grey dashed line, instead, is the mastercurve at 150 °C obtained with the 8-mm sample on the MCR702 and shifted to 160 °C. The experimental shift factor is
, whereas the shift factor predicted from the WLF fit is
. According to the WLF fit constants reported above, the latter value would correspond to a temperature of 161 °C. The mismatch could be due to the different thermal calibration of the two rheometers. To further confirm the quality of the data, we also checked the validity of the Cox-Merz rule (
Figure 6b) [
38]. We obtained a good agreement between the dynamic and transient data, consistently with previous literature reports [
24,
26]. The slope of the last four points is −0.91, slightly larger compared with the previously reported value of −0.82 [
26]. It is worth noting that the steady-state viscosity data obtained from the transient tests are systematically lower than the dynamic ones and that this mismatch is higher with increasing shear rate. The reasons for this discrepancy are multiple and could be, for example, related to wall-slip. Wall-slip of polystyrene melts was demonstrated in capillary and parallel plate geometries [
40,
41]. Concerning our data, we find a satisfactory agreement between transient and dynamic viscosity values in the transition from the Newtonian regime to the shear thinning region. However, we cannot completely exclude slip at high shear rates. On the other hand, in such a range, edge fracture can also partly affect the data. In fact, as it was pointed out above, the CPP can delay the effect of edge fracture into the measurement volume but cannot completely avoid it. The link between edge fracture and wall-slip in CPP geometry is an open question that deserves further investigation. As far as this paper is concerned, we aimed to demonstrate that few milligrams of sample are enough to obtain reproducible nonlinear data with state-of-the-art instrumentation on rotational rheometers.


