Article

Use of Computational Fluid Dynamics to Analyze Blood Flow, Hemolysis and Sublethal Damage to Red Blood Cells in a Bileaflet Artificial Heart Valve

by
Madison E. James
,
Dimitrios V. Papavassiliou
and
Edgar A. O’Rear
*
School of Chemical, Biological and Materials Engineering, University of Oklahoma, Norman, OK 73019, USA
*
Author to whom correspondence should be addressed.
Fluids 2019, 4(1), 19; https://doi.org/10.3390/fluids4010019
Submission received: 6 December 2018 / Revised: 15 January 2019 / Accepted: 22 January 2019 / Published: 29 January 2019
(This article belongs to the Special Issue Cardiovascular Flows)

Abstract

:
Artificial heart valves may expose blood to flow conditions that lead to unnaturally high stress and damage to blood cells as well as issues with thrombosis. The purpose of this research was to predict the trauma caused to red blood cells (RBCs), including hemolysis, from the stresses applied to them and their exposure time as determined by analysis of simulation results for blood flow through both a functioning and malfunctioning bileaflet artificial heart valve. The calculations provided the spatial distribution of the Kolmogorov length scales that were used to estimate the spatial and size distributions of the smallest turbulent flow eddies in the flow field. The number and surface area of these eddies in the blood were utilized to predict the amount of hemolysis experienced by RBCs. Results indicated that hemolysis levels are low while suggesting stresses at the leading edge of the leaflet may contribute to subhemolytic damage characterized by shortened circulatory lifetimes and reduced RBC deformability.

1. Introduction

In 2016, it was estimated that over 28.1 million people in the United Sates (11.5% of the adult population) were diagnosed with a heart disease [1]. Heart disease is currently the leading cause of death in the U.S., responsible for about 1 in every 4 deaths [2], and is a major cause of death and morbidity in many industrialized countries. Therapies for various heart diseases include coronary bypass surgery and angioplasty for coronary artery disease, transplants and ventricular assist devices (VADs) for congestive heart failure, or valve replacement for heart valve disorders.
Replacement heart valves are classified as either mechanical or bioprosthetic (made of tissue). Continued research is still being conducted to improve replacement heart valves and optimize their design. Bioprosthetic valves have a shorter life-span than mechanical valves, while mechanical valves are less biocompatible and more aggressively rejected by the body [3].
For both valve types, another major concern is the unnatural flow conditions to which these foreign objects expose the blood. Turbulent flow conditions can be generated, and the stresses of non-physiological turbulent flow can be damaging to blood cells, particularly platelets and erythrocytes [4,5]. In a high shear stress environment, platelets can rupture, aggregate, adhere to surfaces and undergo activation leading to explosive growth of thrombi [6,7,8]. Moreover, platelets will release pro-thrombogenic microparticles with shear [9]. Flow through valves and mechanical hemolysis (i.e., the release of hemoglobin from red blood cells due to stress), have been the subject of much study for heart valve prostheses. Erythrocytes can lose hemoglobin by rupture of the cell membrane or the temporary formation of pores in the membrane. When hemoglobin is released into the blood stream it lowers the oxygen carrying capacity of the blood and, in levels that are too high, can be toxic to the body. Computational fluid dynamics (CFD) studies to simulate flow through prosthetic heart valves often cite blood damage as a motivation with little attention to predicting hemolysis [10,11,12,13].
Damage to blood, even though mainly characterized by hemolysis, can also be subtler. Subhemolytic trauma can result in shortened life spans for red blood cells (RBCs) in patients with prosthetic heart valves as well as VADs [14,15]. The accelerated loss of red cells requires the individual to produce more red cells or contributes to anemia. This problem has largely been overlooked by those studying mechanical trauma in prosthetic heart valves.
Hemolysis and decreased RBC survival due to prosthetic heart valves has been described since the 1960’s [16]. Over time, the reported percent of patients who experience hemolysis after implantation has decreased due to the optimization of valve types and structure [17,18,19]. There is still some disagreement about the extent of hemolysis due to artificial heart valves. Incidences of hemolysis do occur due to obstruction of a leaflet by formation of a thrombus or pannus [20,21]. Failure of a suture with the valve pulling away from the surrounding tissue, dehiscence, is yet another problem [22] leading to hemolysis. While clinical studies show a prevalence of subclinical hemolysis (with a low incidence of hemolytic anemia or clinically severe hemolysis) in valve replacement patients [23,24,25], current in-vitro and CFD research into hemolysis damage are still measuring and predicting damage to RBCs from notable amounts of hemolysis caused by artificial heart valves [26,27,28,29].
In terms of predictive capabilities, Gierseipen et al. employed a power law mathematical model (Equation (1)) to predict hemolysis in artificial heart valves based on data obtained from experiments with a Couette viscometer [30]. The dependence of the hemolysis index HI on shear stress(τ) and exposure time (t) can then be estimated as follows [31]:
H I = C τ α τ β
with α, β, and C empirical constants.
Other investigators have continued to use in-vitro experimentation to assess the amount of hemolysis in blood due to shear stresses [32,33,34,35,36]. Further research led to modifications of this equation by examining additional variables for the blood, or, used alternative computational approaches to create new prediction models [37,38,39,40,41,42]. However, these predictions have been limited in their usefulness.
Many of the models have been largely based on data obtained from laminar flow conditions, but blood flow through the heart is known to be turbulent [43,44]. The nature of laminar and turbulent flow is inherently different, so it is unlikely that predictions obtained from idealized laminar flow conditions can predict the complexity of the mixing boundary layers and shearing stresses in turbulent flow. The complexity of turbulent flow also introduces the possibility that locally significant extensional stresses contribute to hemolysis. Additional research has analyzed hemolysis under turbulent conditions relative to viscous, Reynolds, and total stresses, but the question of which specific stress(es) or even deformation(s) causes hemolysis is still open to debate [4,5,45,46,47].
Another approach to blood damage analysis is to use the energy dissipation and the size of turbulent eddies to predict hemolysis. Eddies are spots of localized circulation in the fluid that can be idealized in the shape of a sphere when they are very small. Since the structure of turbulent flow is complex, eddies have been used to characterize the microstructure of the flow and to relate flow structure to expected damage to RBCs [5,48,49,50,51]. The total surface area of these eddies is of major importance, because damage to cells may well occur at the interface of eddies by both shear and extensional stresses.
The Kolmogorov length scale (KLS) is the smallest dissipative length scale that exists in turbulent flow, and it is used herein to represent the diameter of spherical eddies. The KLS is calculated using the kinematic viscosity of the fluid, v, (i.e., the ratio of dynamic viscosity over density, μ/ρ), and the turbulent kinetic energy dissipation rate, ϵ, found by using CFD modeling.
K L S = ( ν 3 ε ) 1 4 = ( μ 3 ρ 3 ε ) 1 4
Previous research found that eddies with size comparable to or smaller than RBCs are the most damaging [52], while those much larger than RBCs just shift the cells from their path in the overall bulk flow. The present work is focused on eddies with a diameter of 10 μm or less. Two factors, eddy intensity (i.e., size distribution) and spatial distribution, are important characteristics of the flow. Eddy intensity corresponds to the local damage: a higher eddy intensity means there is a larger number of smaller eddies in a region that indicate more viscous dissipation and more damage to cells. Spatial distribution indicates the likelihood that RBCs will encounter a region of high eddy intensity. An increased distribution of high intensity regions throughout the flow field increases the probability that RBCs will encounter a region where they will experience damage. CFD modeling can be used to capture the relative extent of regions likely to cause damage.
Two new equations (Equations (3) and (4)) have been proposed recently that utilize the surface areas of eddies to predict hemolysis. In these equations, HI is the hemolysis index (% hemolysis); t is the exposure time (in seconds); a, b, c, d and e are coefficients; and EAKLS(D1–D2) is the total surface area of eddies with diameters ranging from D1 to D2 divided by the total volume of the region of interest (in m−1) [53]. In Equation (3), the region of interest is composed of all eddies up to 10 μm in diameter, while in Equation (4), it is composed of eddies up to 9 μm in diameter. These equations were developed by empirically modeling three classical hemolysis experiments of turbulent flow utilizing a Couette flow viscometer, a capillary tube, and a jet [54,55,56]. These computational experiments were analyzed by KLS size distribution for 24 conditions and 5 orders of magnitude of exposure time to obtain the coefficients in Equations (3) and (4) (Table 1).
H I = b t + c × E A K L S ( 0 4 ) + d × E A K L S ( 5 7 ) + e × E A K L S ( 8 10 )
H I = a + b t + c × E A K L S ( 0 3 ) + d × E A K L S ( 4 6 ) + e × E A K L S ( 7 9 )
The objective of this research is to analyze the flow of blood through a bileaflet mechanical heart valve using computational fluid dynamics for the purpose of assessing cell damage. Specifically, to employ the CFD results to examine the distribution and intensity of eddies with a KLS of 10 μm or less for both a fully open functioning heart valve and a partially closed malfunctioning valve as might occur with a clot. As an alternative to the commonly used power law model, the hemolysis predictions of the two proposed models will be calculated using KLS results and eddy surface areas. The hemolysis and blood trauma predictions will be compared between the two valves at different flowrates.

2. Methods

The structure of the bileaflet heart valves in this study was based on an experimental system used by Hutchinson et al. [57]. This specific valve was selected because of the detailed schematics available, which allowed for a more accurate computational representation, and because of the imaging method used to obtain the experimental measurements. Their group used particle image velocimetry (PIV), one of the most commonly used flow imaging techniques, which has been found to have a greater resolution than other imaging methods like magnetic resonance imaging (MRI) and Doppler [58]. Their experimental system included an artificial heart valve modeled after the Carbomedics No. 25 aortic bileaflet mechanical heart valve. A virtual representation of Hutchinson’s bileaflet valve system for this research was created using ANSYS Workbench DesignModeler 18.1 (see Figure 1). The structure with axial lengths consisted of a 400 mm inlet, a 7.7 mm valve frame, a 27.8 mm sinus of varying diameter, and a 270 mm outlet. Both the inlet and outlet regions had diameters of 26.8 mm.
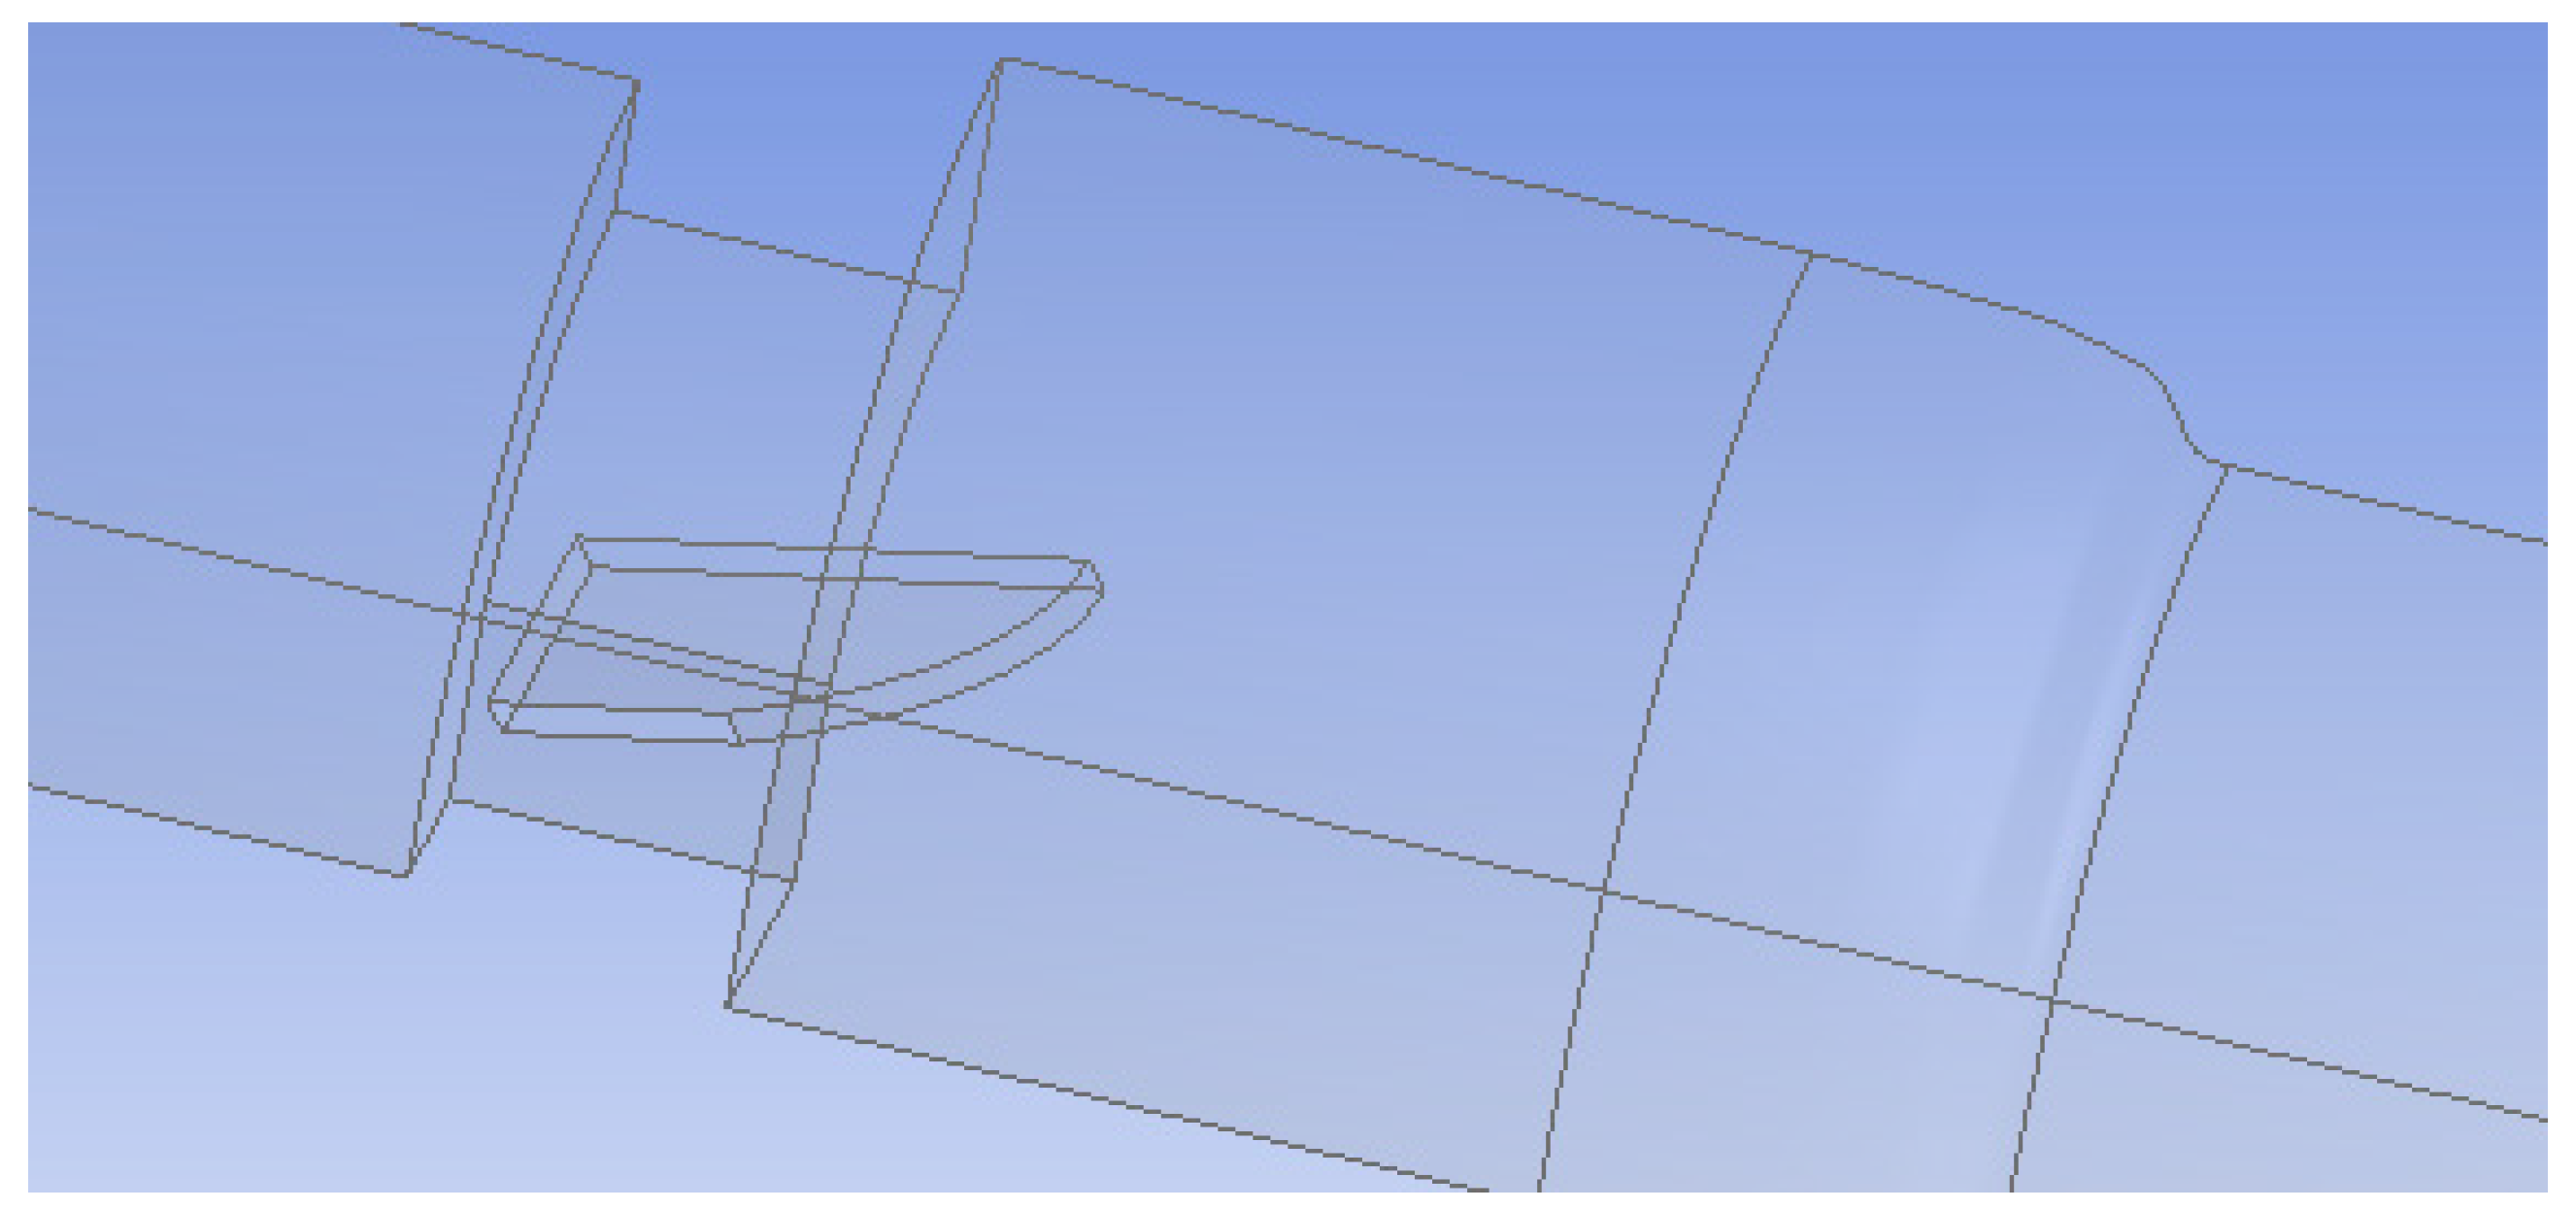
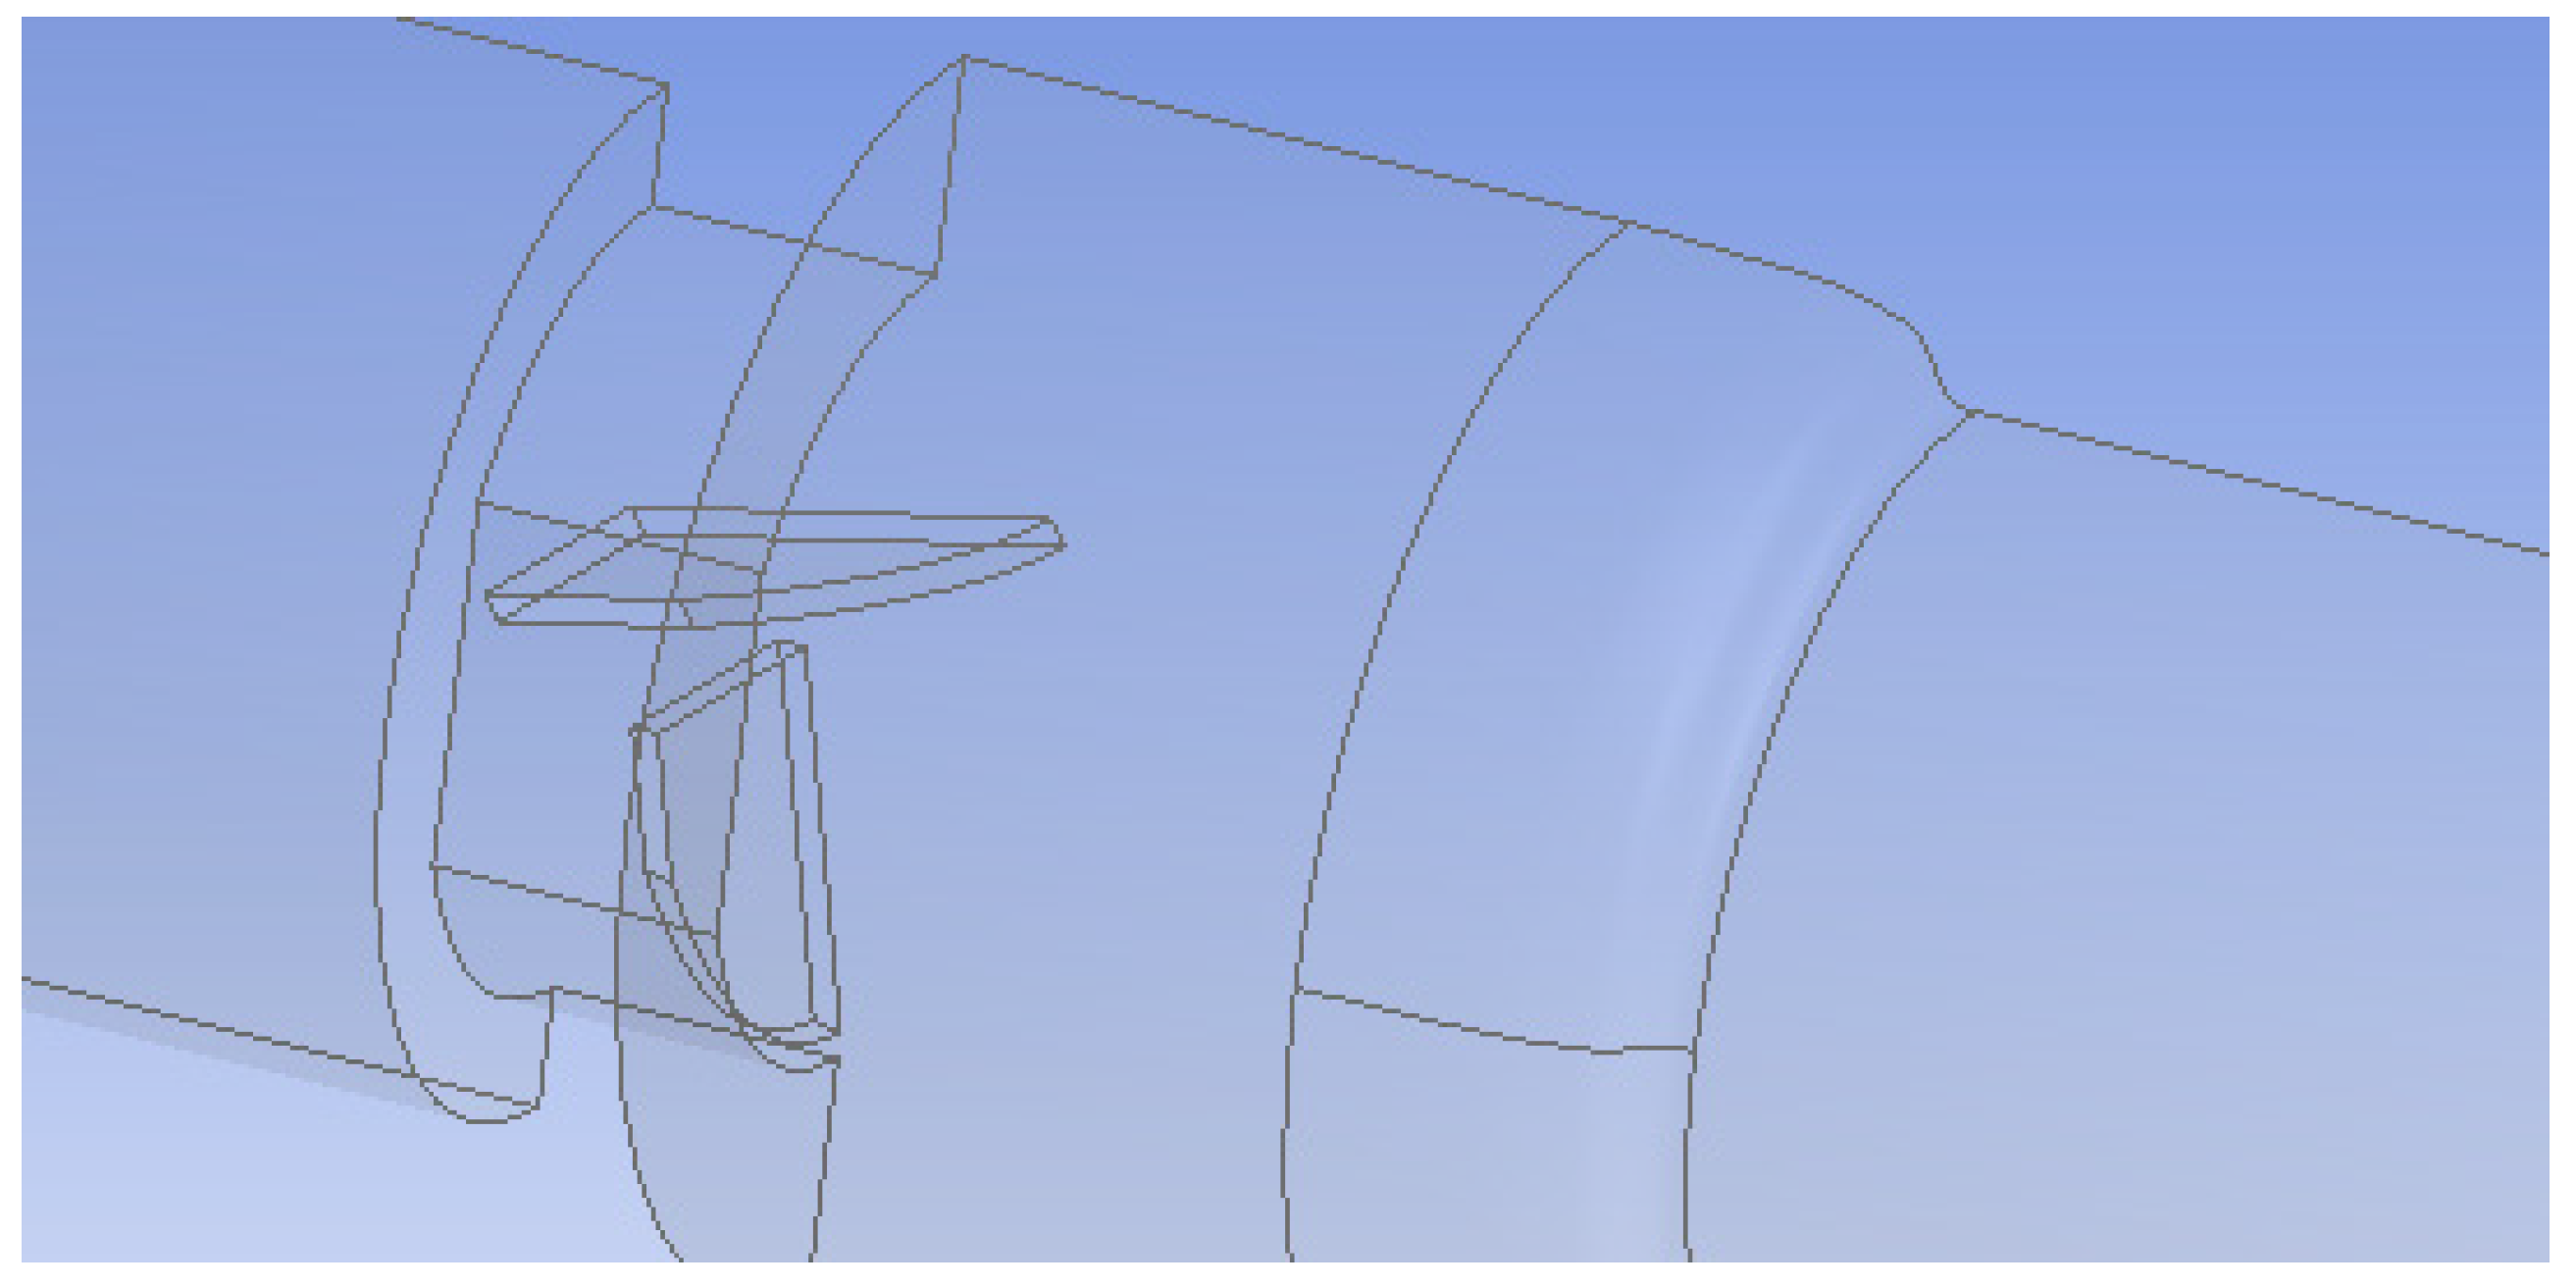
In the first setup, both valve leaflets were fully open and functioning, while in the second, one leaflet was mostly closed to represent a malfunctioning valve. The leaflets were 0.76 mm thick and had an 18.55 mm wide straight edge at the entrance of the valve and a curved edge at the outlet. The maximum length from edge to edge was 11.31 mm. The malfunctioning leaflet was tilted 65° towards the closed position to model a nearly closed leaflet. Since the functioning heart valve system was symmetric across two planes, flow in only a quarter of the valve was simulated (Figure 2). The malfunctioning heart valve was symmetric across the vertical plane bisecting the leaflets, so flow for only half of the valve was examined (Figure 3). Simulating flow in only half or a quarter of the valve decreased the number of computational mesh cells needed and markedly reduced the total computation time.

Flow Simulation

CFD simulations for turbulent flow were carried out with both k-ε and k-ω models for the fully open, functioning valve. The selection of specific CFD simulation results to be used for eddy analysis was based on comparison of the different model results with velocity profiles in the literature for this system [59,60].
In the k-ε turbulence model, equations are applied using a finite volume solver to find the turbulence kinetic energy ( k = 1 2 u i u i ¯ ) and dissipation rate of turbulent kinetic energy ( ε = 2 ν s i j s i j ¯ ) for the mean fluctuating strain s i j ¯ = 1 2 ( u i x j ¯ + u j x i ¯ ) . These are determined with:
t ( ρ k ) + x j ( ρ k U j ) = x j [ ( μ + μ t σ k ) k x j ] + G k ρ ε
t ( ρ ε ) + x j ( ρ ε U j ) = x j [ ( μ + μ t σ ε ) ε x j ] + ρ C 1 S ε ρ C 2 ε 2 k + ν ε
μ t = ρ C μ k 2 ε , C 1 = max [ 0.43 , η η + 5 ] , η = S k ε , S = 2 S i j S i j
where ui’ and uj are the velocity fluctuations in the i direction and j directions respectively, the overbar indicates average, ρ is density, µ is viscosity, ν is kinematic viscosity, µt is turbulent viscosity, Gk is the generation of turbulent kinetic energy due to the mean velocity gradients, and Sij is the mean strain rate. Model parameters have the standard values of C2 = 1.9 and Cµ = 0.09 and the turbulent Prandtl numbers for k and ε are σk = 1.0, σε = 1.2 [61].
In the k-ω SST method, the model transport equations are solved for turbulent kinetic energy, k and ω with the latter defined as ω ε / k . Both k-ε and k-ω approaches use the same equation for k while they differ when solving the second variable. Transport equations of the k-ω SST model are as follows:
t ( ρ k ) + x j ( ρ k U j ) = x j [ ( μ + μ t σ k ) k x j ] + G k Y k
t ( ρ ω ) + x j ( ρ ω U j ) = x j [ ( μ + μ t σ ω ) ω x j ] + G ω Y ω + D ω
where Gω is the generation of ω, Yk and Yω are dissipation of k and ω due to turbulence, Dω is the cross-diffusion term. The above terms can be found from:
μ t = ρ k ω 1 max [ 1 α * , S F 2 a 1 ω ] ,   σ k = 1 F 1 / σ k , 1 + ( 1 F 1 ) / σ k , 2 ,   σ ω = 1 F 1 / σ ω , 1 + ( 1 F 1 ) / σ ω , 2
α * = α * ( α 0 * + Re t / R k 1 + Re t / R k ) ,   Re t = ρ k / μ ω ,   R k = 6 ,   α 0 * = β i / 3 ,   β i = 0.072
F 1 = tanh ( ϕ 4 ) ,   ϕ = min [ max ( k 0.09 ω y , 500 μ ρ y 2 ω ) , 4 ρ k σ ω , 2 D ω + y 2 ] ,   D ω + = max [ 2 ρ 1 σ ω , 2 1 ω ω x j , 10 10 ]
F 2 = tanh ( ϕ 2 2 ) ,   ϕ 2 = max [ 2 k 0.09 ω y , 500 μ ρ y 2 ω ]
where y is the distance to the next surface and D ω + is the positive portion of the cross-diffusion term.
G k = ρ u i u j ¯ u j x j ,   G ω = α ω k G k
Y k = ρ β * f β * k ω ,   f β * =   { 1 x k 0 1 + 680 x k 2 1 + 400 x k 2 x k > 0 ,   x k = 1 ω 3 k x j ω x j ,   β * = β i * [ 1 + ζ * F ( M t ) ]
β i * = β * ( 4 15 + ( Re t R β ) 4 1 + ( Re t R β ) 4 ) ,   ζ * = 1.5 ,   R β = 8 ,   β * = 0.09
D ω = 2 ( 1 F 1 ) ρ 1 ω σ ω , 2 k x j ω x j
The model constants are: σ k , 1 = 1.176 , σ ω , 1 = 2.0 , σ k , 2 = 1.0 , σ ω , 2 = 1.168 ,   a 1 = 0.31 , β i , 1 = 0.075 , β i , 2 = 0.0828 , a * = 1 , a = 0.52 , a 0 = 1 9 , β * = 0.09 , β i = 0.072 , R β = 8 , R k = 6 , R ω = 2.95 , ζ * = 1.5 , M t 0 = 0.25 , σ k = 2.0 , σ ω = 2.0 .
Prior to running the flow simulation, boundary conditions were set for all of the surfaces in the model. The inlet was treated as a mass flow inlet, the outlet as outflow (a setting used when the conditions of the outlet are not known), the planes of symmetry as symmetry, and all other surfaces were treated as no-slip walls. For methods, the SIMPLE pressure-velocity coupling scheme, Green–Gauss cell based gradient, and standard pressure were used. Finally, the fluid properties of the volumetric region were defined.
For initial literature comparisons and results, properties in the simulation were set to match the values of the test fluid used in the Hutchinson et al. experimental system [50]: a kinematic viscosity of 1.57 × 10⁻⁶ m2/s and a density of 1796 kg/m3. Based on the density, viscosity, and diameter of the system, the inlet velocity was set to 0.445 m/s to obtain a Reynolds number of 7600 (as was used by Hutchinson et al.) [60]. The purpose of these runs was to develop validated computational methods before carrying out simulations of blood flow through the valve. Results were also compared to those of Blackmore et al., who ran computations with large eddy simulation (LES) techniques for the same physical experiment [59]. The comments in Blackmore’s paper indicate that they trusted the detailed velocity profile from the LES model over that from the physical experiment, because of issues with PIV, including the scarcity and settling of flow tracking seed particles in the fluid, preventing the detection of flow separation around the leaflets [59].
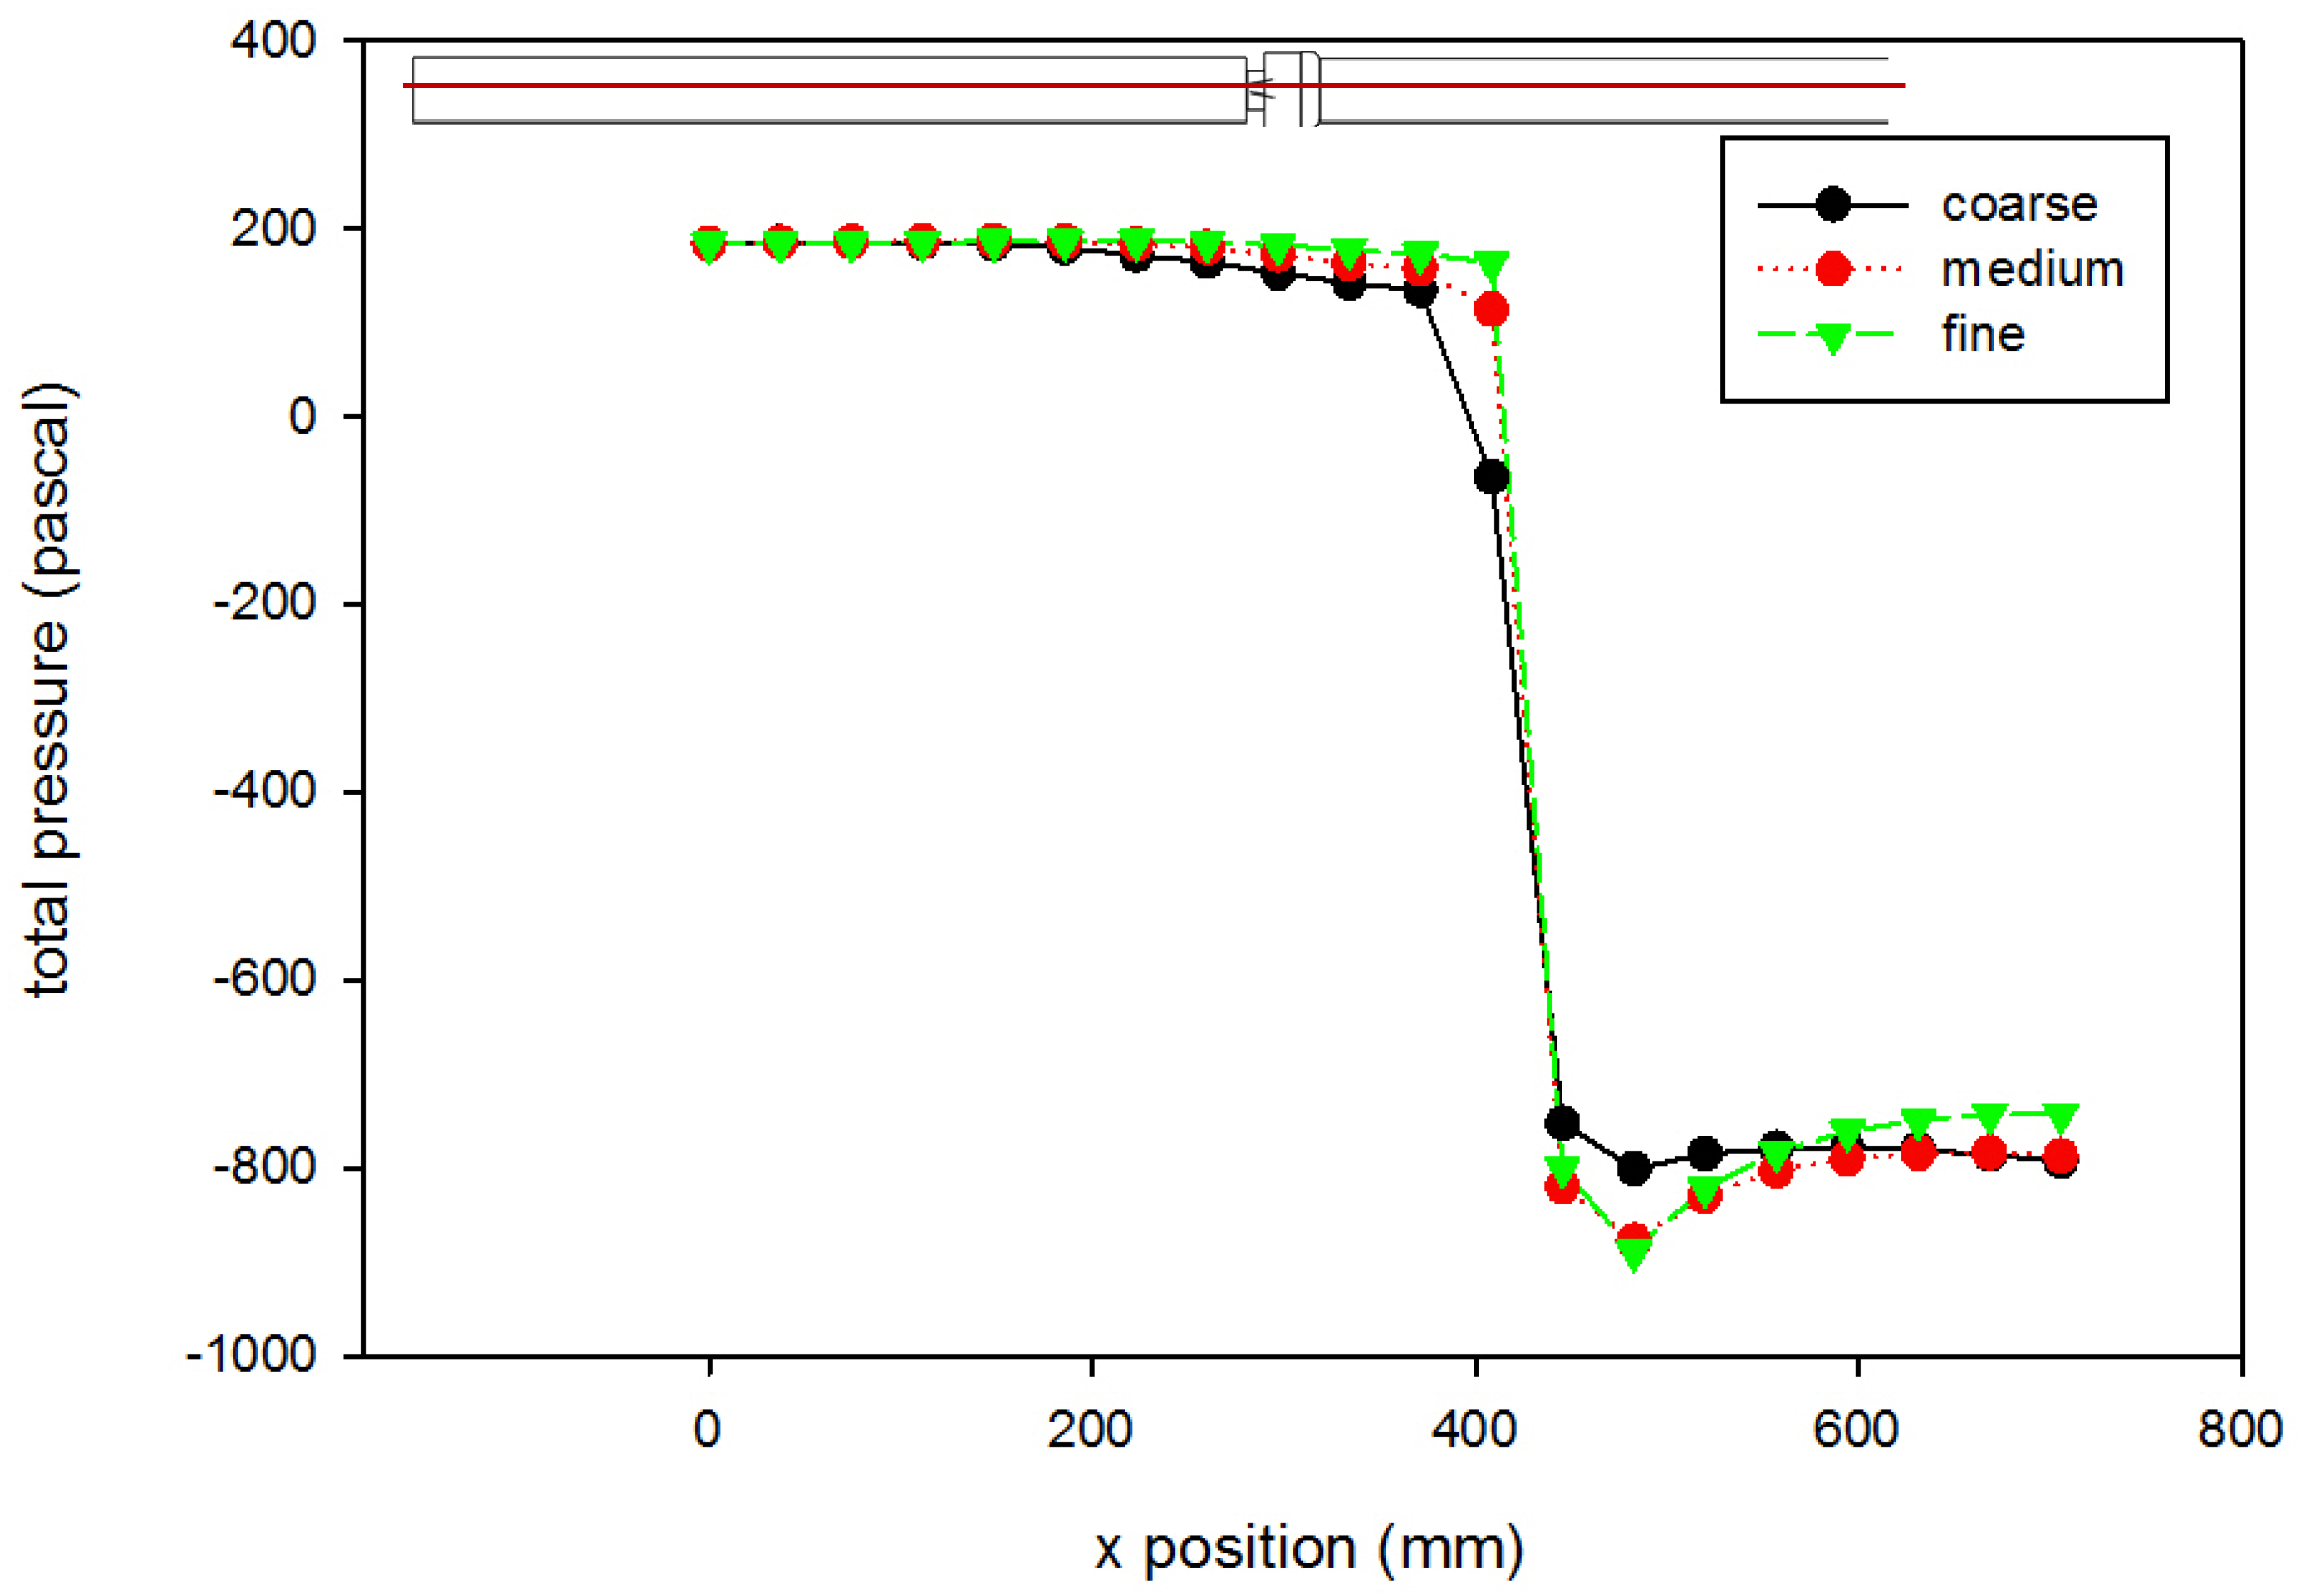
A mesh independence analysis was done using the region adaptation function in Fluent to refine the mesh until the difference in mesh size did not produce results with significant differences. Table 2 is a presentation of a comparison between the coarse, medium, and fine mesh sizes. For the different mesh sizes, variables were compared along the centerline of the computational domain and along cuts orthogonal to the centerline at various axial locations within the flow field. Examples are shown in Figure 4 and Figure 5, which present total pressure with axial position along the centerline and KLS values at an orthogonal cut 405 mm downstream of the inlet, respectively. The medium mesh was selected to conduct the computational analysis, because the distinct difference in the results between the coarse and medium mesh is not seen between the medium and fine meshes. With fewer computational mesh cells (meaning a decreased calculation time) in the medium mesh, the iterations converged to lower residual levels faster without a high percentage difference from those of the fine mesh.
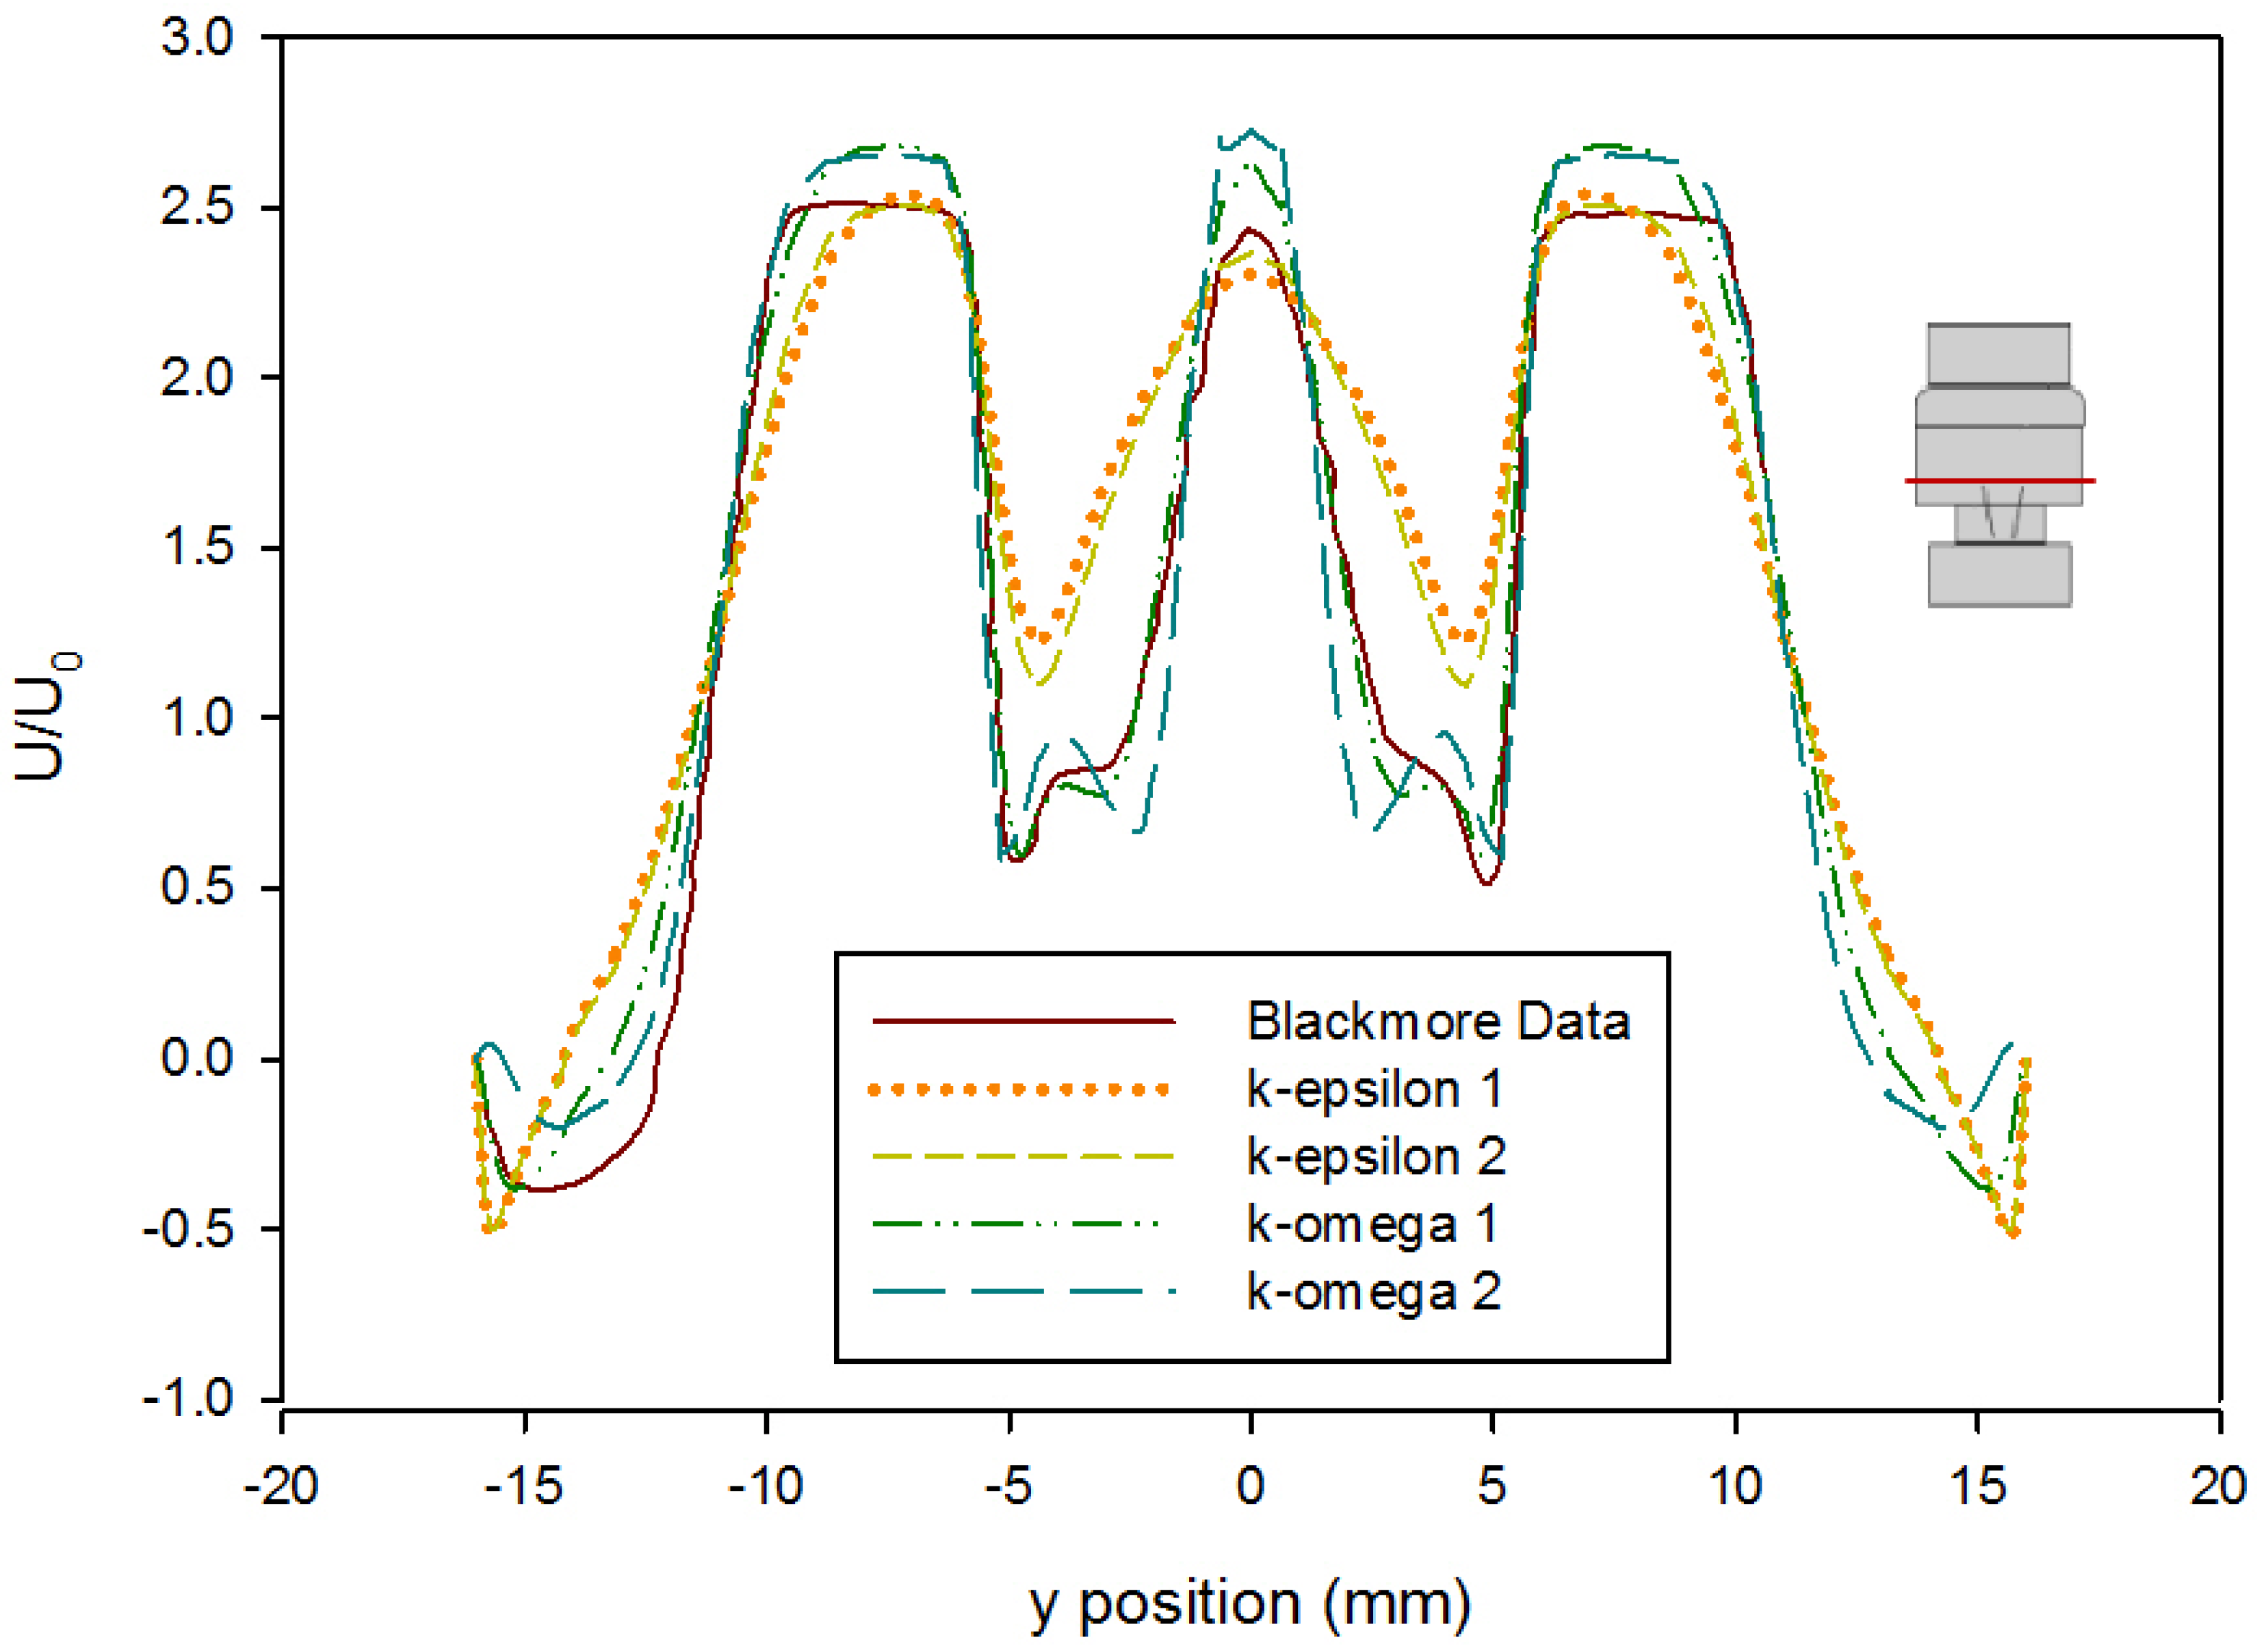
Turbulence simulations require the selection of a closure model to account for the fluctuations in the flow. An error analysis based on the velocity profile presented by Blackmore et al. was conducted to determine which turbulence closure approach to use [59]. Simulations were run at both first and second order convergence using the k-ε turbulence model with enhanced wall functions and the k-ω SST turbulence model with curvature and low-Re corrections. The velocity profile in Blackmore et al. was divided into four increments to create analytical polynomial equations to be used for error analysis. The predicted values from these equations were compared to the computational values from each turbulence model as seen in Figure 6. Error analysis showed that the k-ω SST first order model gave the best predictions for this geometry (Table 3). The computation of the error was done as follows: First, the velocity profile provided in Blackmore et al. was assumed to be the correct solution relative to which the error was calculated. This assumption was justified because the results provided by Blackmore et al. [59] were obtained using a large eddy simulation approach that is more accurate than Reynolds-Averaged Navier–Stokes models. Using 98 points across half of the profile (as the results are symmetric), the data plot in [59] was split into four lines, and each line was fit to a polynomial equation with the lowest root mean square error prior to overfitting (determined as a plateau in an error vs. degree of polynomial plot). From these equations, literature results were calculated based on the location of points from our Fluent model. The mean value of the absolute difference between each point in our model results and the data interpolated from [59] was calculated, as well as the mean square of this difference, and reported in Table 3.
After selecting the appropriate mesh size and turbulence model based on agreement with Hutchinson and Blackmore’s work, simulations of blood flow through the valve were run treating blood as a Newtonian fluid with a viscosity of 0.002 Pa·s and a density of 1050 kg/m3 [52]. These simulations for blood were conducted to obtain KLS distributions in the flow through the valve to use for eddy analysis and hemolysis predictions. The flowrates in this case were set to peak systolic flow, when turbulence is at its highest and blood is most likely to be damaged. Peak velocity of blood through heart valves in systolic flow has been cited as anywhere from 1.0–1.8 m/s, and in some cases has been found to be higher through artificial valves [44,62,63,64]. General values of 1.25 m/s and 1.5 m/s were selected for these simulations.
For eddy analysis of blood damage, cross-sectional surfaces were created 0.5 mm apart axially along the centerline. The surfaces were created along the length of the flow field in regions that contained eddies of 10 μm or smaller. The KLS values were calculated on each surface by using a user-defined equation (Equation (2)) in Fluent. Using this information, the total surface areas of all spheres with diameters equal to a specific KLS value can be calculated in 1-unit intervals (a unit being 1 μm) starting from the smallest diameter identified in the flow up to a diameter of 9 or 10 μm depending on which prediction model was applied (Equations (3) and (4)). To do this, the area of a particular KLS size range was determined on two consecutive surfaces and multiplied by the distance between the two surfaces, yielding the volume of the fluid containing eddies of that diameter.
The number of eddies (Neddy) of each size can be found by dividing the volume within the region made up by eddies of that specific size by the volume of one eddy (Veddy)
N e d d y = V r e g i o n ( K L S = D ) V e d d y ( K L S = D )
when the assumption that the eddies are spherical is made:
V e d d y = 4 3 π ( K L S 2 ) 3
Finally, the total surface area of eddies for each KLS value (Aeddy) was calculated by multiplying the surface area of one eddy with that specific KLS value by the total number of eddies of that size as follows:
A e d d y = N e d d y 4 π ( K L S 2 ) 2
The total surface areas for each size range were then normalized by dividing by the total volume of the region where hemolysis may occur (i.e., the region containing eddies with a KLS of either 9 or 10 μm or less, depending on the equation). This normalization process yields EAKLS(D1–D2) and allows for the calculation of hemolysis expected per volumetric unit. Using this basis facilitates calculations of hemolysis values that are device-independent, allowing the comparison of damage from different types of devices, in this case extending to heart valves.

3. Results and Discussion

Velocity characteristics of the functioning and malfunctioning valves were compared using two different fluids. Initially, a test fluid matching the one in Hutchison’s experiments [57] was used to develop a system for comparisons and validation. After validation of the computational method and initial comparisons to Hutchinson’s findings, simulations were carried out with blood as the fluid. The properties of the two fluids are shown in Table 4.
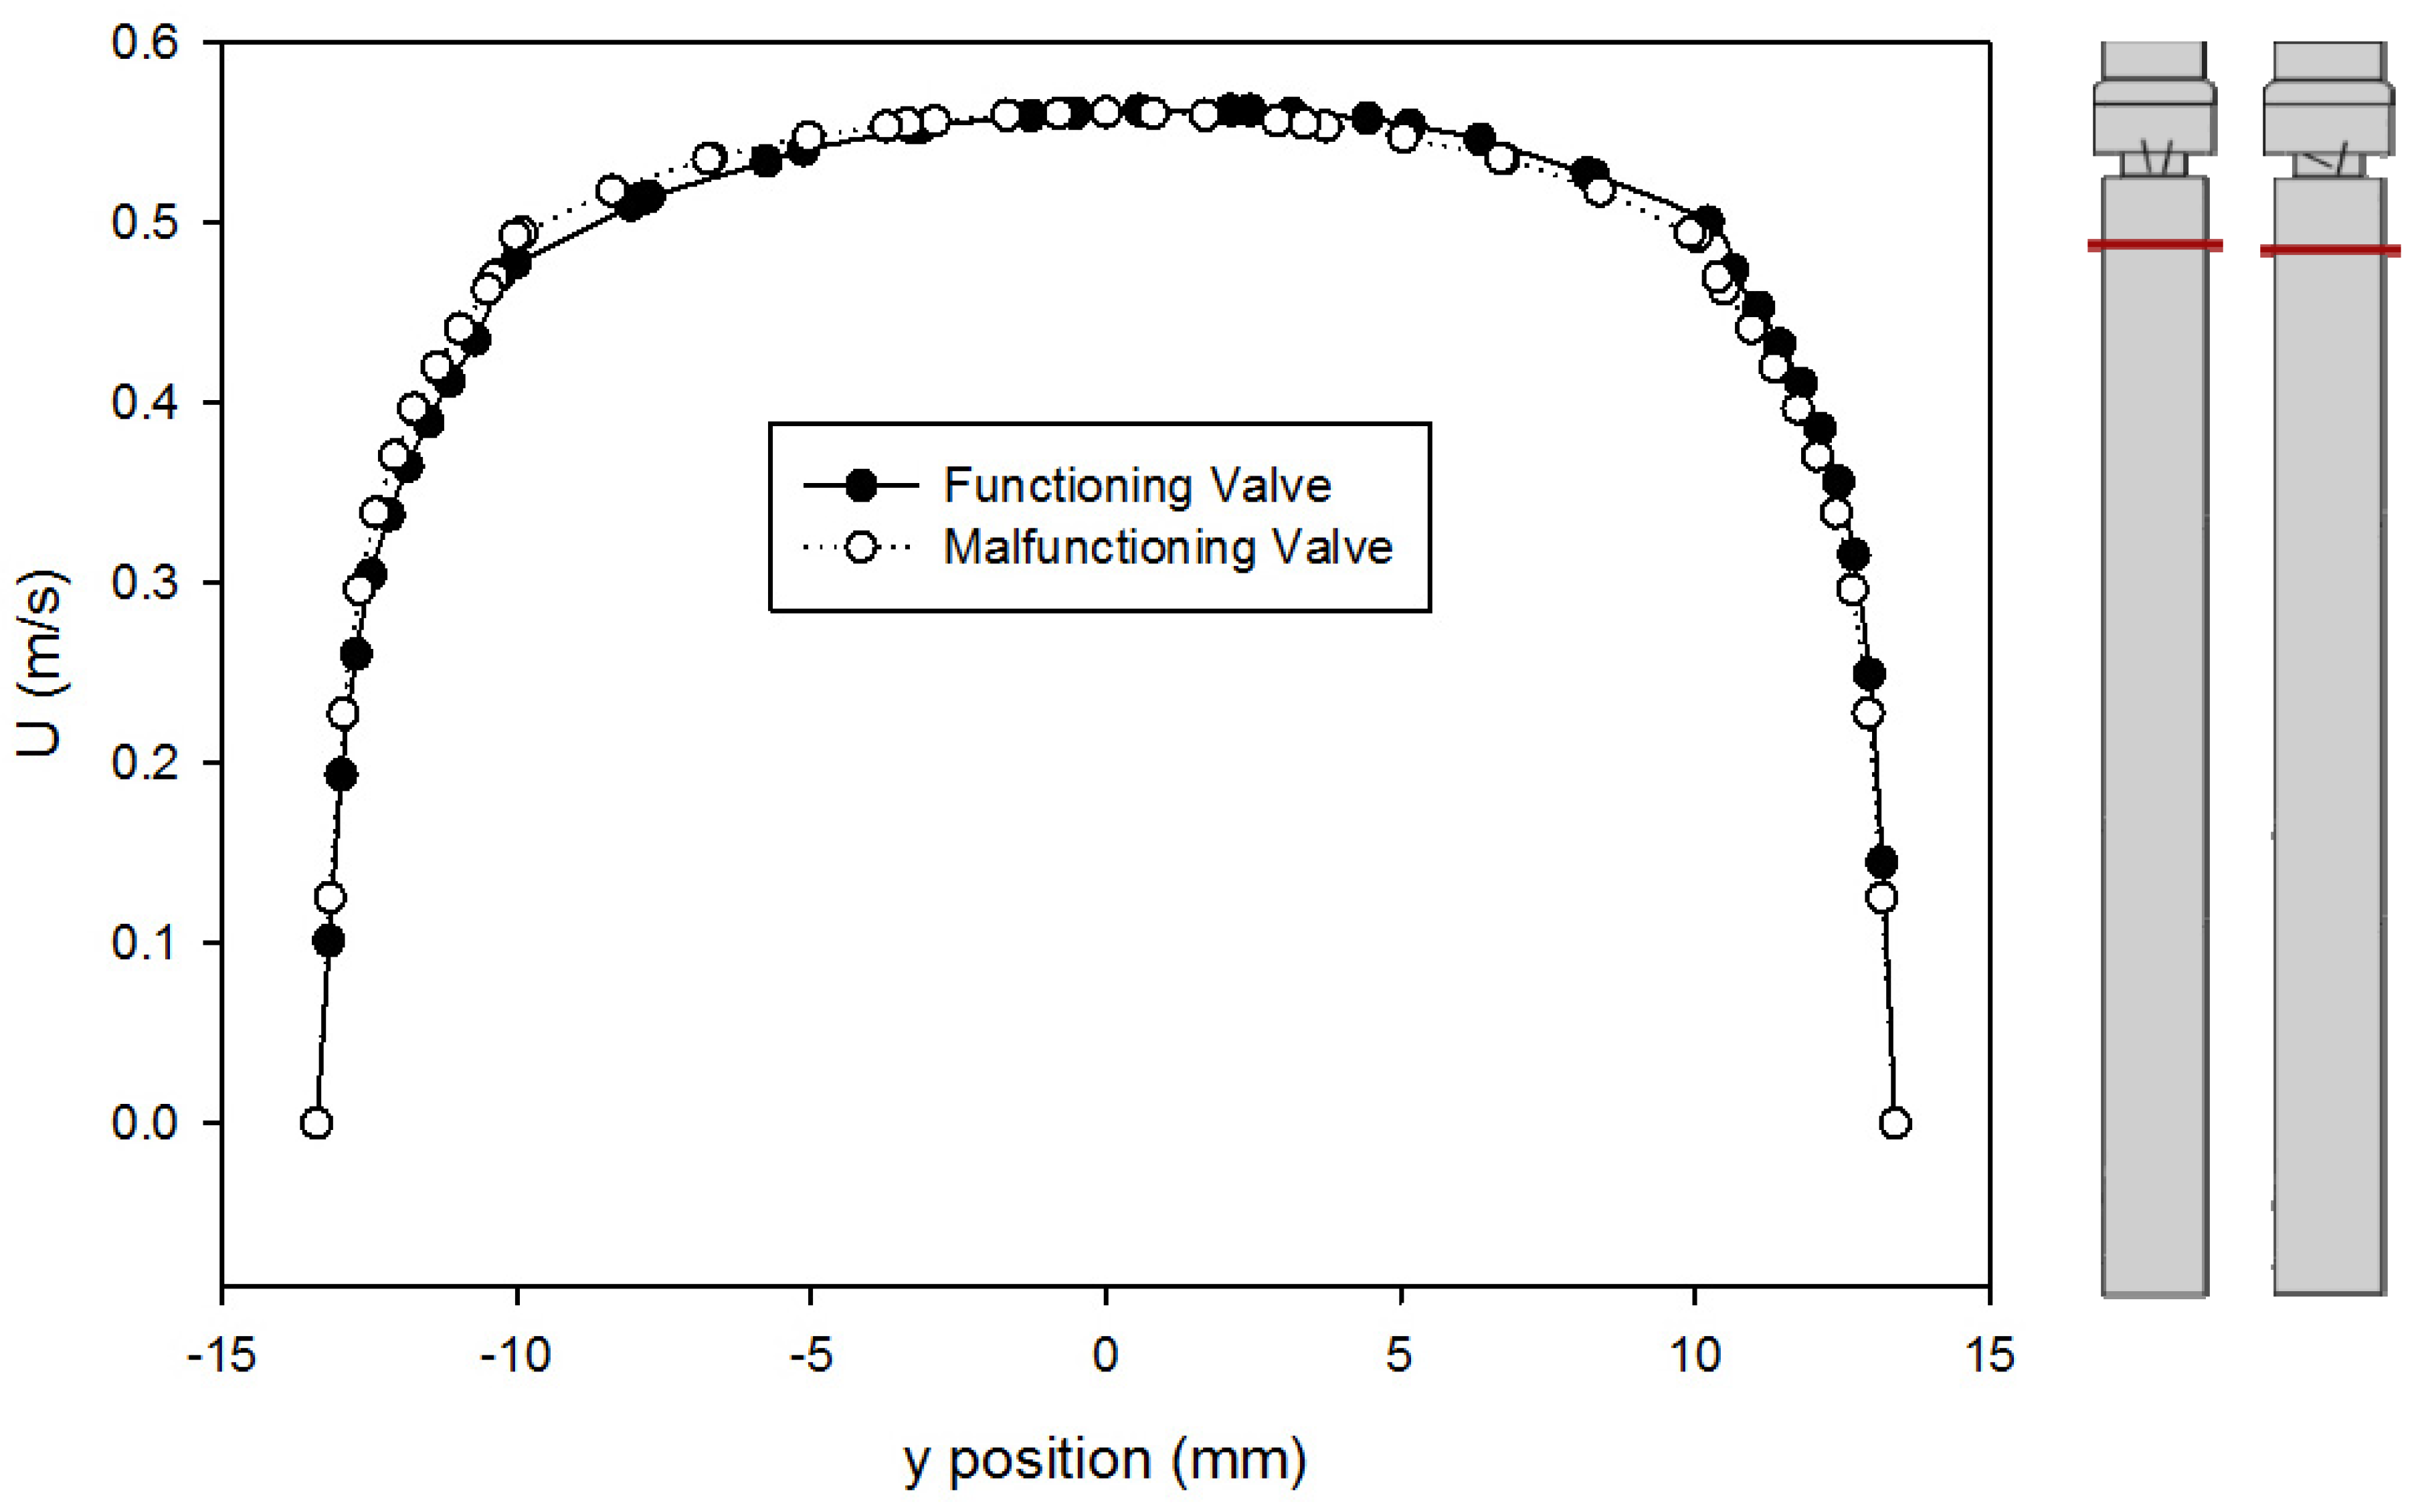
A comparison of the velocity profiles for the functioning and malfunctioning valves 375 mm downstream from the inlet (25 mm upstream from the entry to the valve) is shown in Figure 7. The shapes of the profile match for both valves, which confirms that both models reached a comparable fully developed turbulent flow. It also means that in both cases, the flow exhibited the same velocity profile as it approached the valve inlet, therefore any downstream difference in velocity profiles is only caused by the difference between the leaflets and not because of changes in flow prior to that.
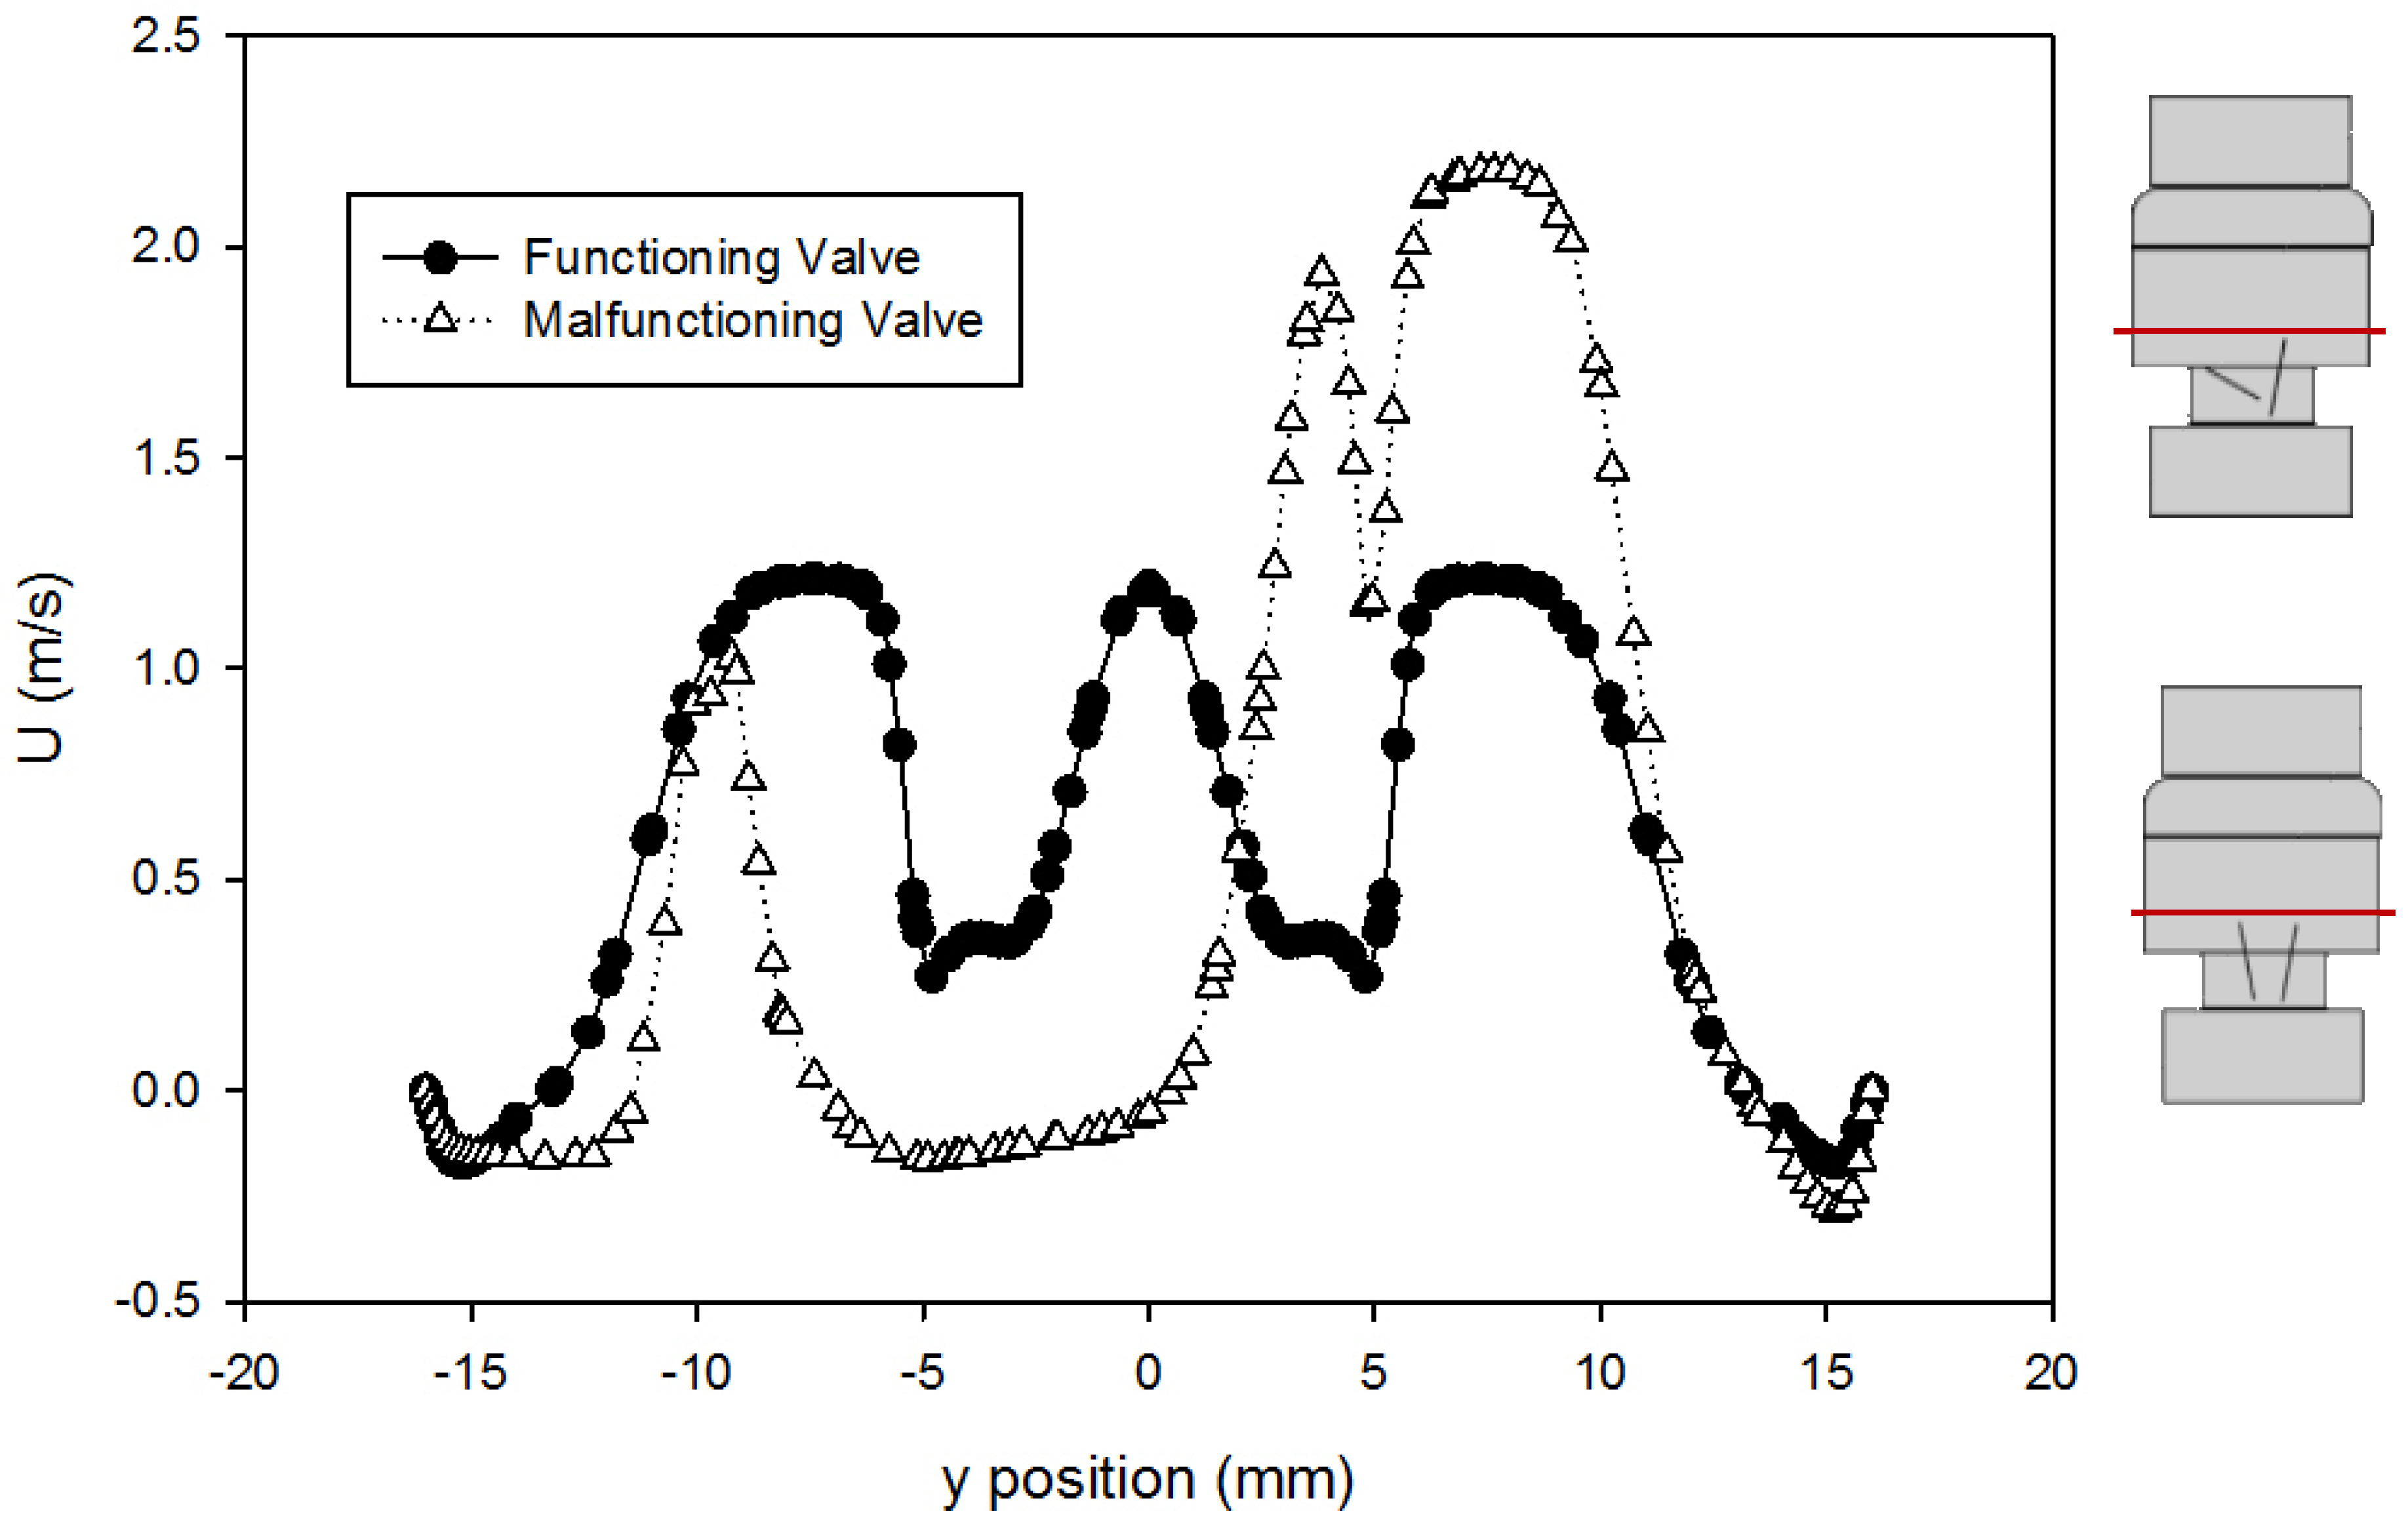
The velocity profiles just past the leaflet tips (at 414 mm downstream of the inlet) using the Hutchinson et al. run settings and fluid [60] are compared for the two valves in Figure 8. This point was chosen because it was the location of the velocity data available from Blackmore et al. [59] for comparison. From the plot, it can be seen that the peak velocity just past the leaflets increased from around 1.2 m/s for the functioning valve to 2.1 m/s for the malfunctioning valve. This is expected because closing one of the leaflets (the leaflet in the negative y-axis) means more fluid is forced through the space around the fully open leaflet, which increases the volumetric flow in that area, increasing the velocity. The dented shape of the profile near 5 mm corresponds with flow disruption around the slanted leaflet.
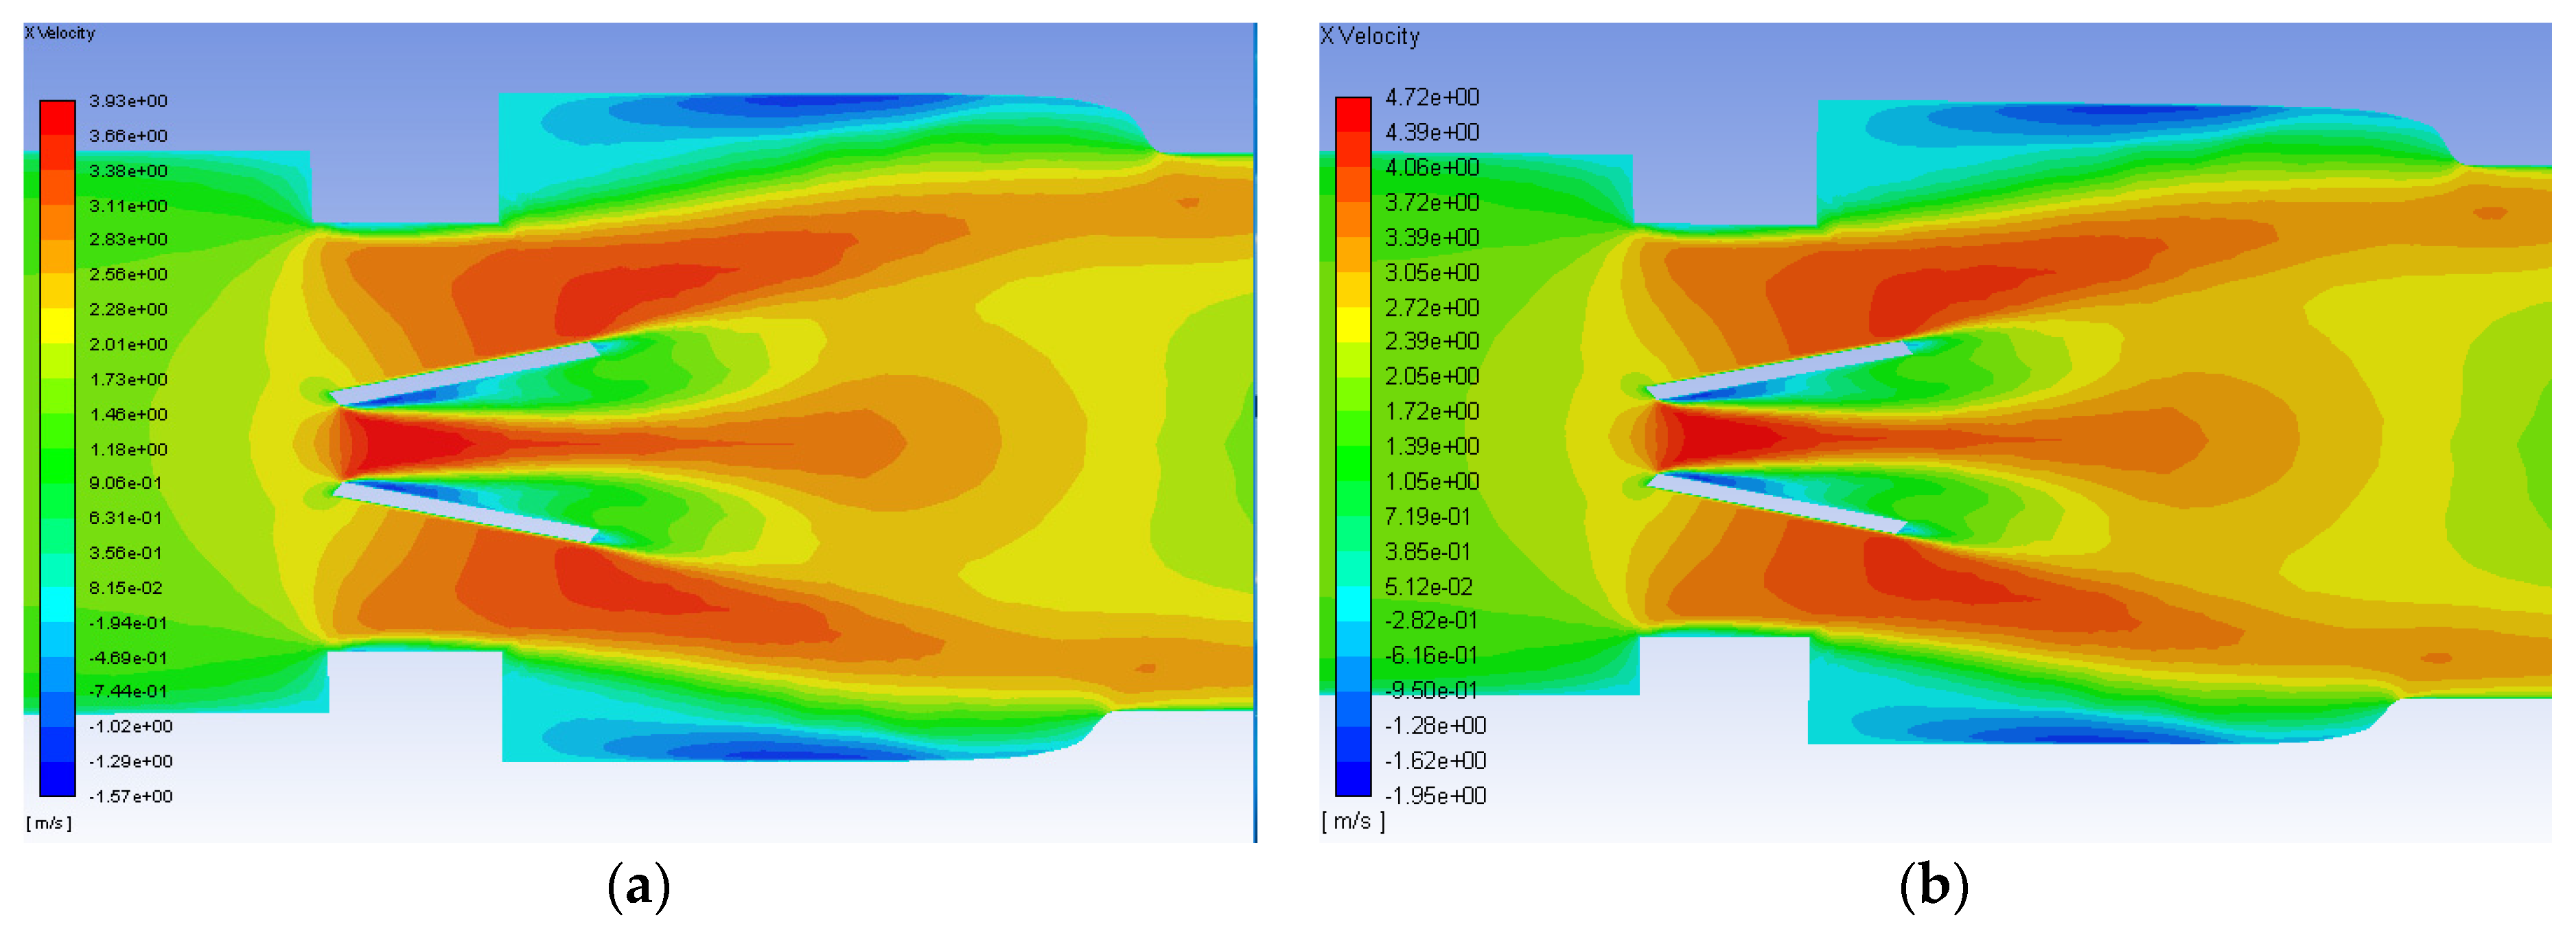
After the initial runs using the Hutchinson settings were examined, the runs with blood at 1.25 and 1.5 m/s were conducted and analyzed. The axial velocity contours for the functioning valve with an inlet flowrate of 1.25 and 1.5 m/s are shown in Figure 9. Though the scale of the velocity is higher for the greater flowrate, the contours for both simulations have the same trends. Peak streamwise velocity is seen in orange and red between and just outside of the leaflets. Backflow and circulation can also be seen in blue along the inner edge of the leaflets and near the wall after the diameter of the flow field expands from the heart valve channel to the sinus.
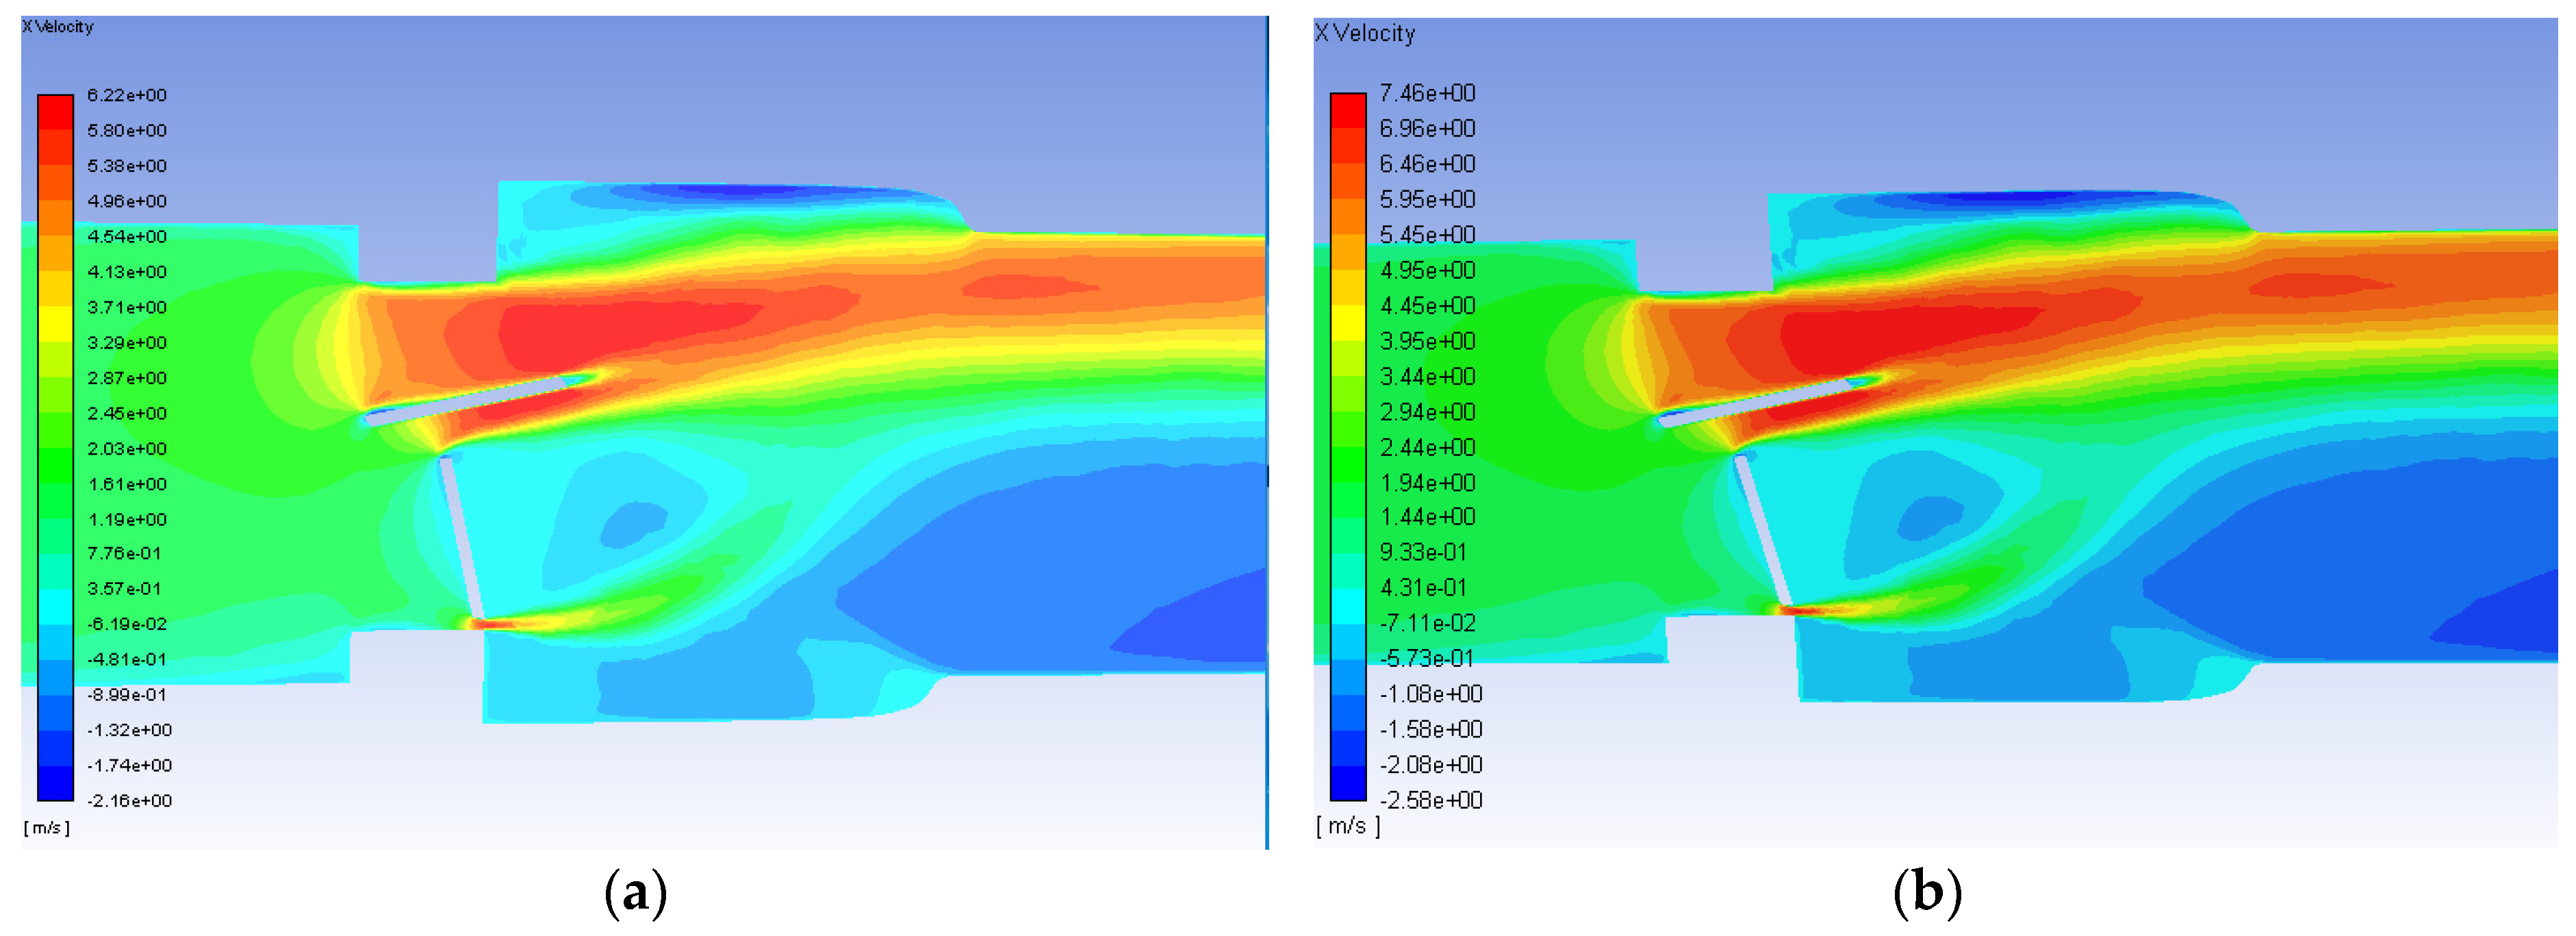
The axial velocity contours for the malfunctioning valve with a flowrate of 1.25 and 1.5 m/s are shown in Figure 10. As with the functioning valve, though the scale is greater for the higher flowrate, the qualitative trends in the contours are very similar. Unlike the functioning valve however, the contours are not symmetric about the centerline. There is a much larger region of high velocity flow around the fully open leaflet, and there is a much larger area of backflow and circulations beyond the mostly closed leaflet. For the inlet flow of 0.445 m/s, the maximum velocity observed was 2.2 m/s for the malfunctioning valve. Smadi found a value as high as 3.6 m/s in a 2D time dependent simulation of a malfunctioning bileaflet valve [62]. A very small region of high velocity flow occurs in the small gap between the malfunctioning leaflet and the wall, but it does not extend nearly as far as the high velocity region around the functioning leaflet.
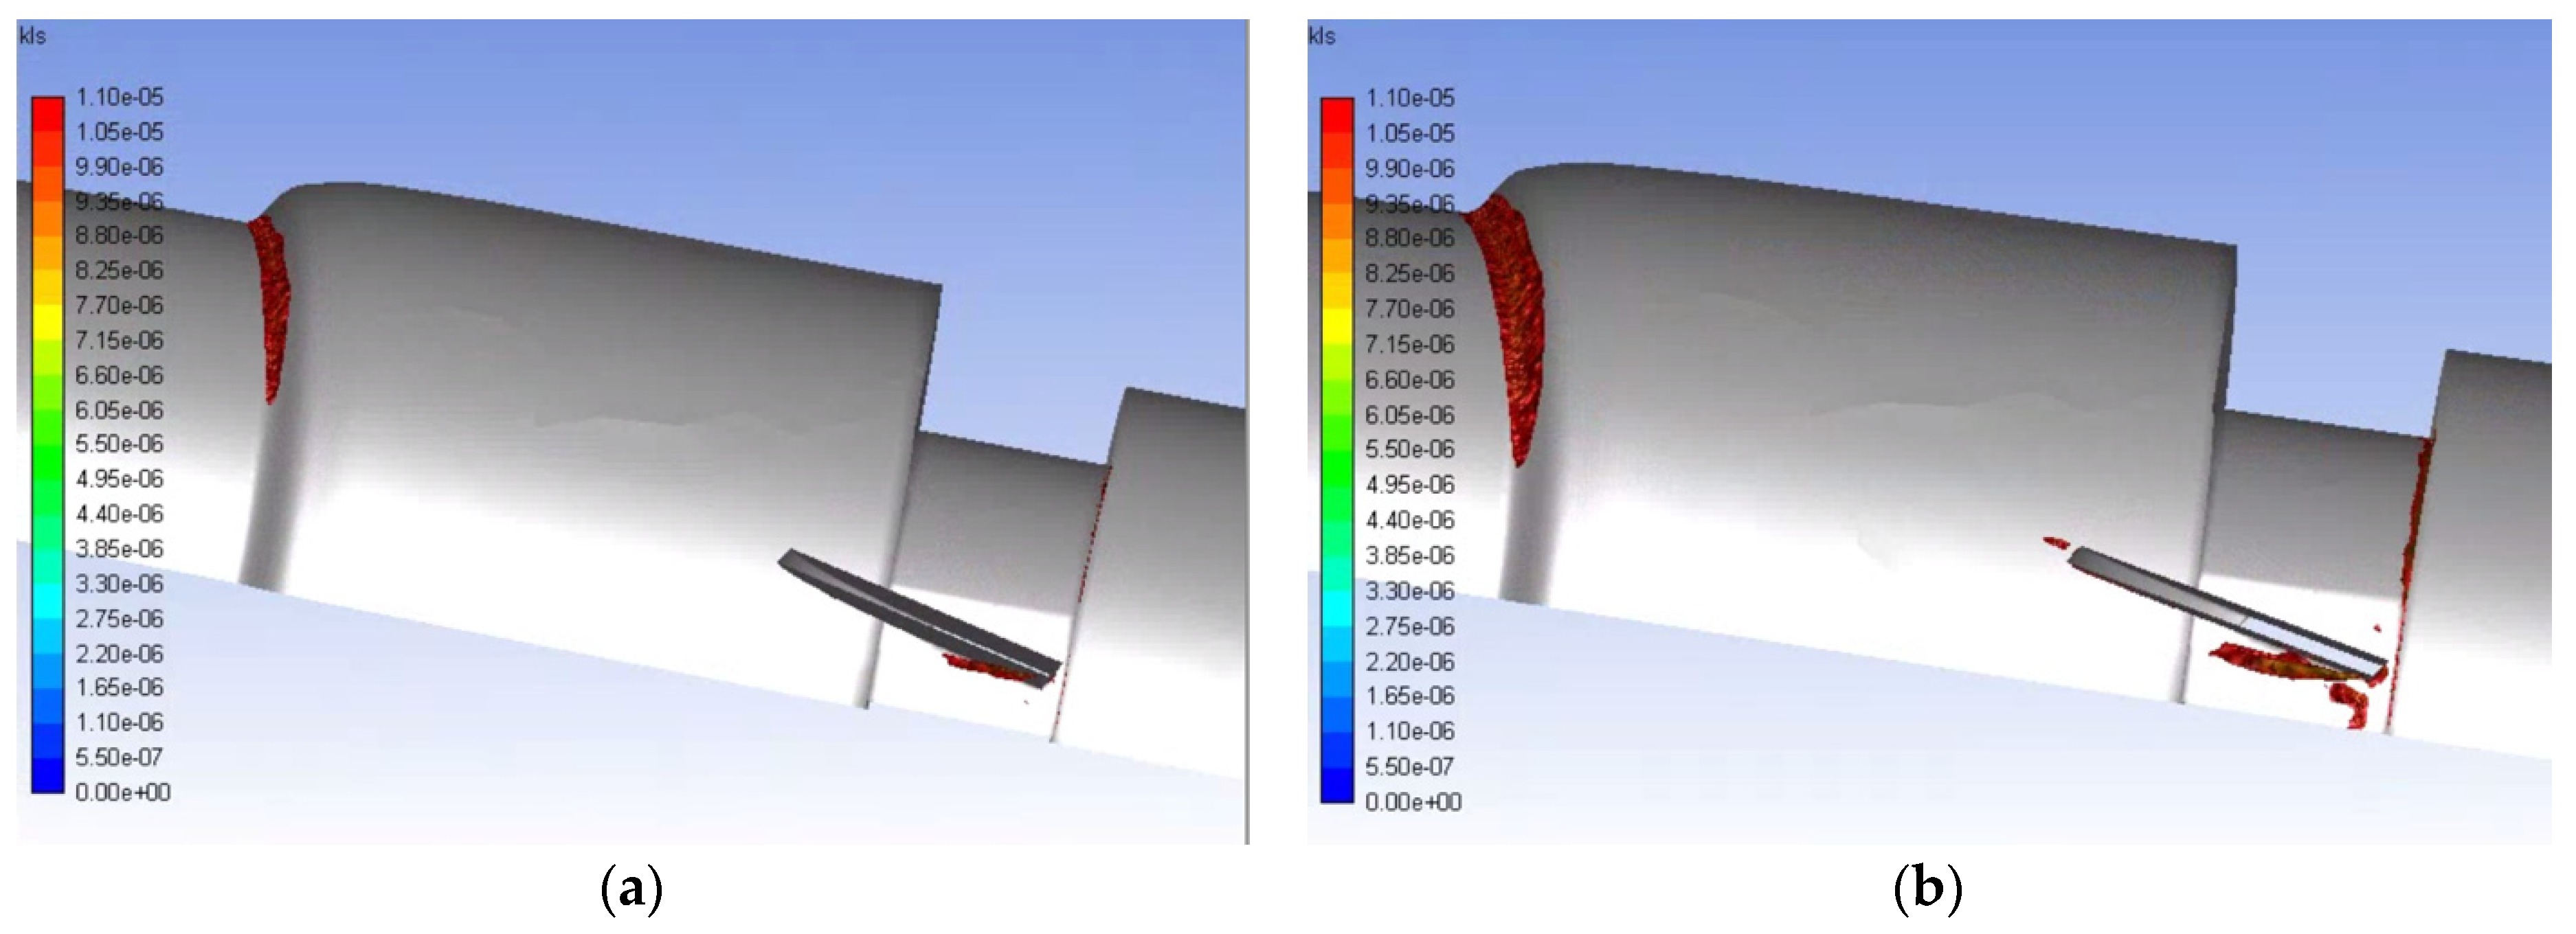
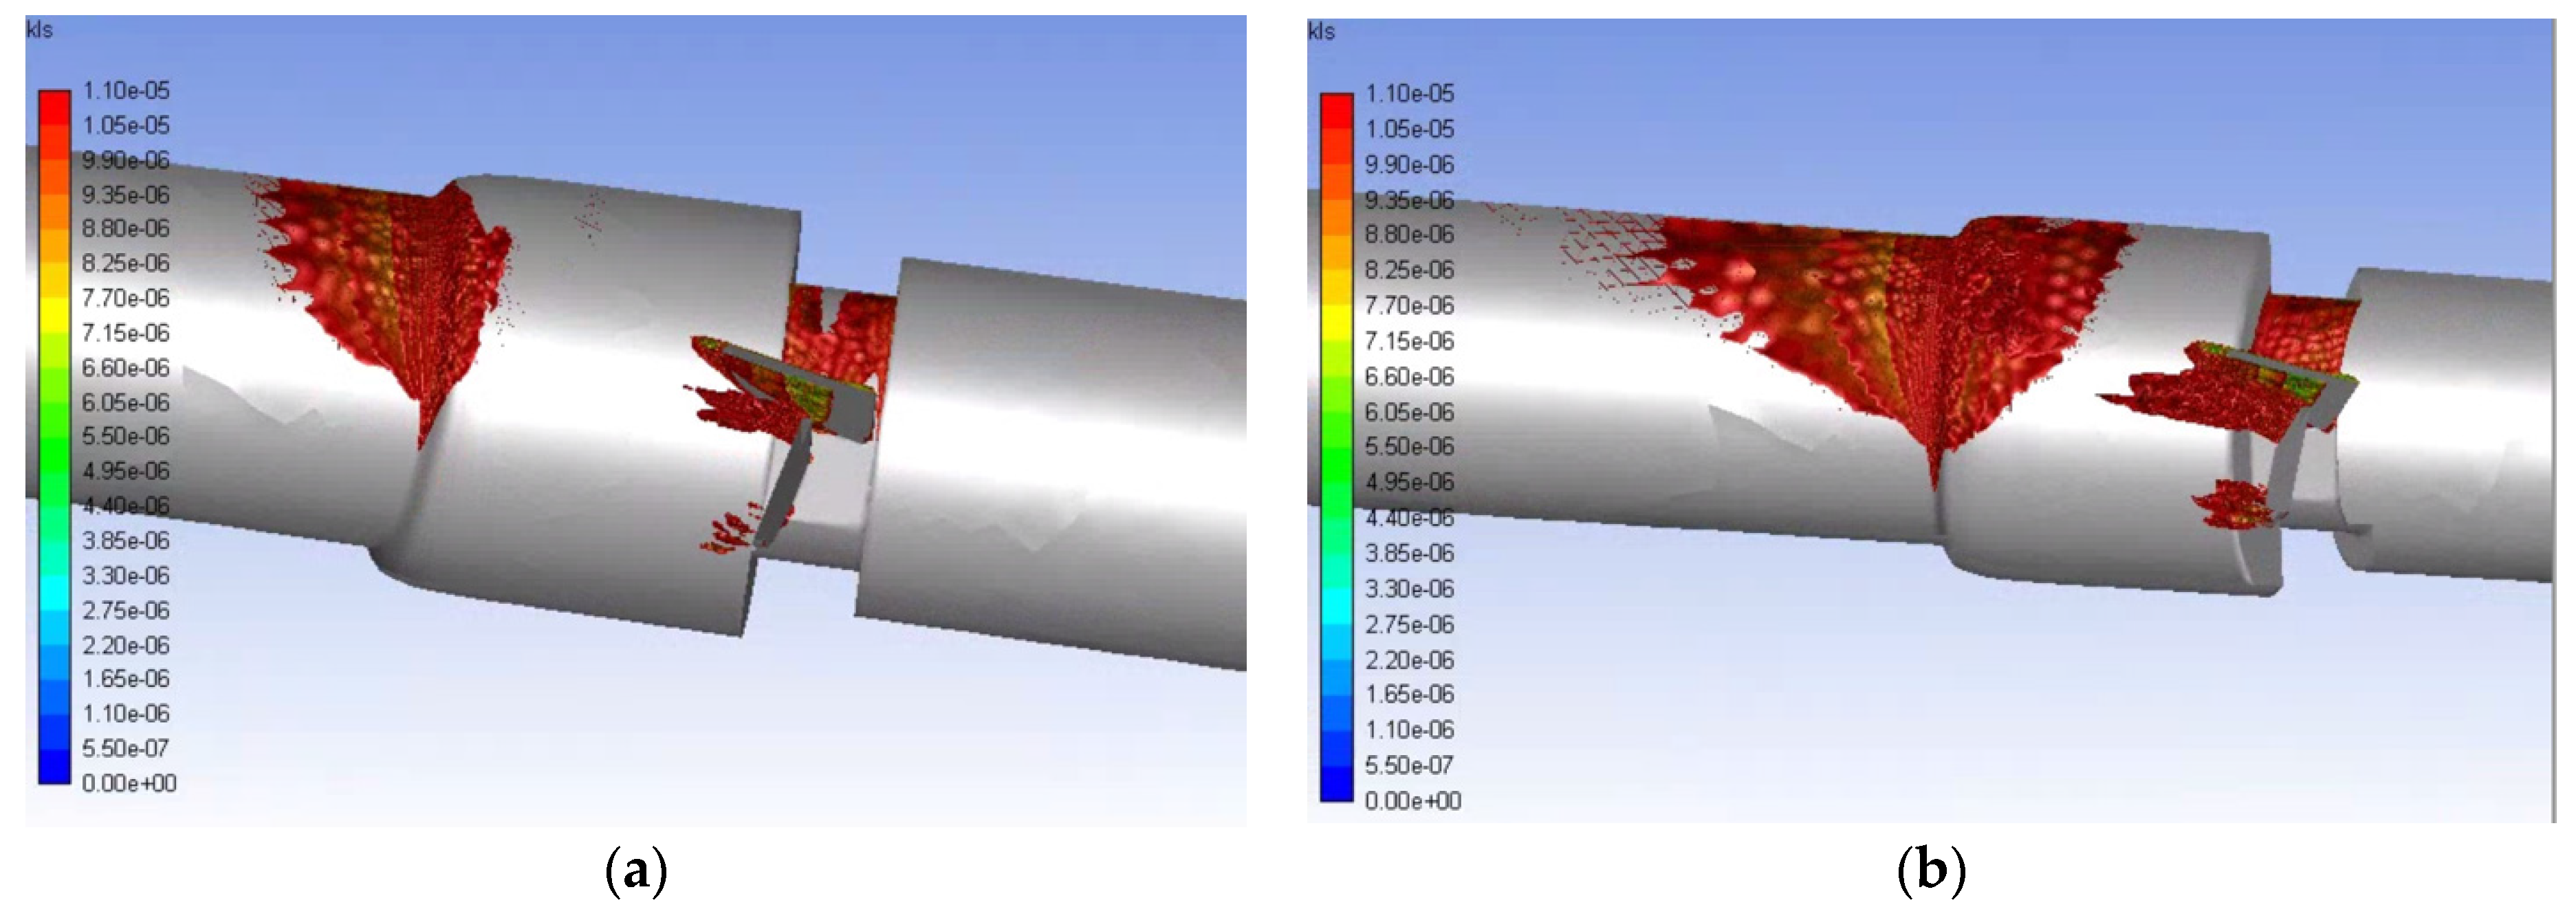
Eddies with a 10 μm diameter or less are of interest for hemolysis, so the volumetric contours of eddies of this size were plotted for the various runs. The volumetric contours of these eddies are shown in Figure 11 and Figure 12 for the functioning and malfunctioning heart valves respectively at both flow rates. In these figures, it can be seen that the eddies of 10 μm diameter or less are concentrated near the leading edge of the leaflets or near the wall where the pipe decreases in diameter (at the intersection of the inlet and the valve and the intersection of the aortic sinus and the outlet). For both the normal and malfunctioning valves, an increase in the inlet flowrate correlated to an increase in the volume of space taken up by the eddies of interest.
Eddies also continue much farther along the length of the flow field for the malfunctioning valve compared to the functioning valve (50 mm from the beginning of the valve for the 1.25 m/s inlet flowrate and 75 mm for the 1.5 m/s flowrate) and concentrate along the wall. This shows that the distribution of damaging eddies is much greater in a malfunctioning valve when compared to a functioning valve with the same inlet velocity.
Use of the experimental details available in Hutchinson’s study for the purpose of CFD validation meant limitations in this research. The geometry of his system only provides a simplified representation of the anatomy before and after the valve. Also, the elastic properties of the tissue have not been taken into account nor the effects of the full cardiac cycle on flow and valve dynamics. Still, the results show that smaller KLS values can be found around the valve leaflets and near the contractions.
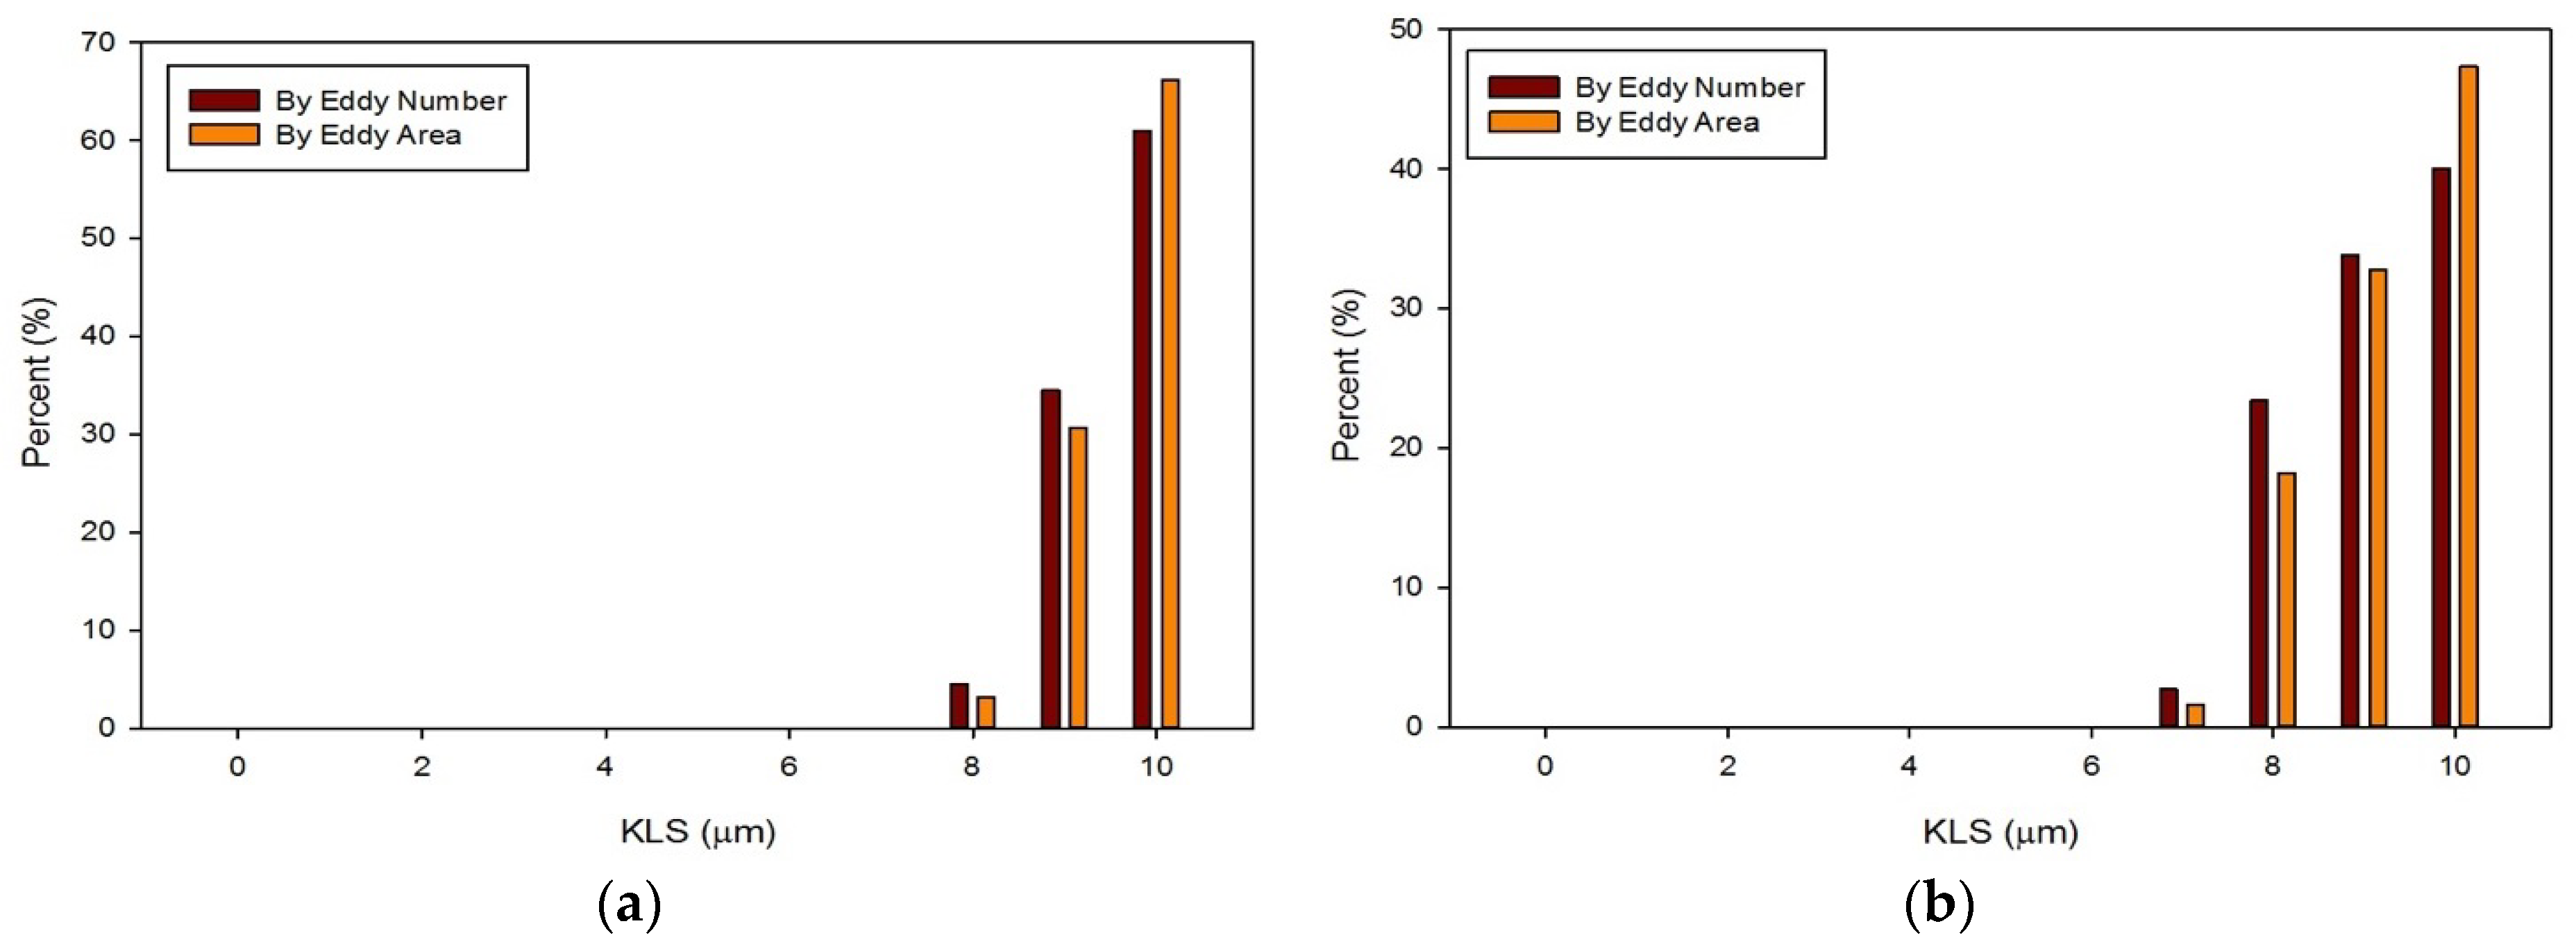
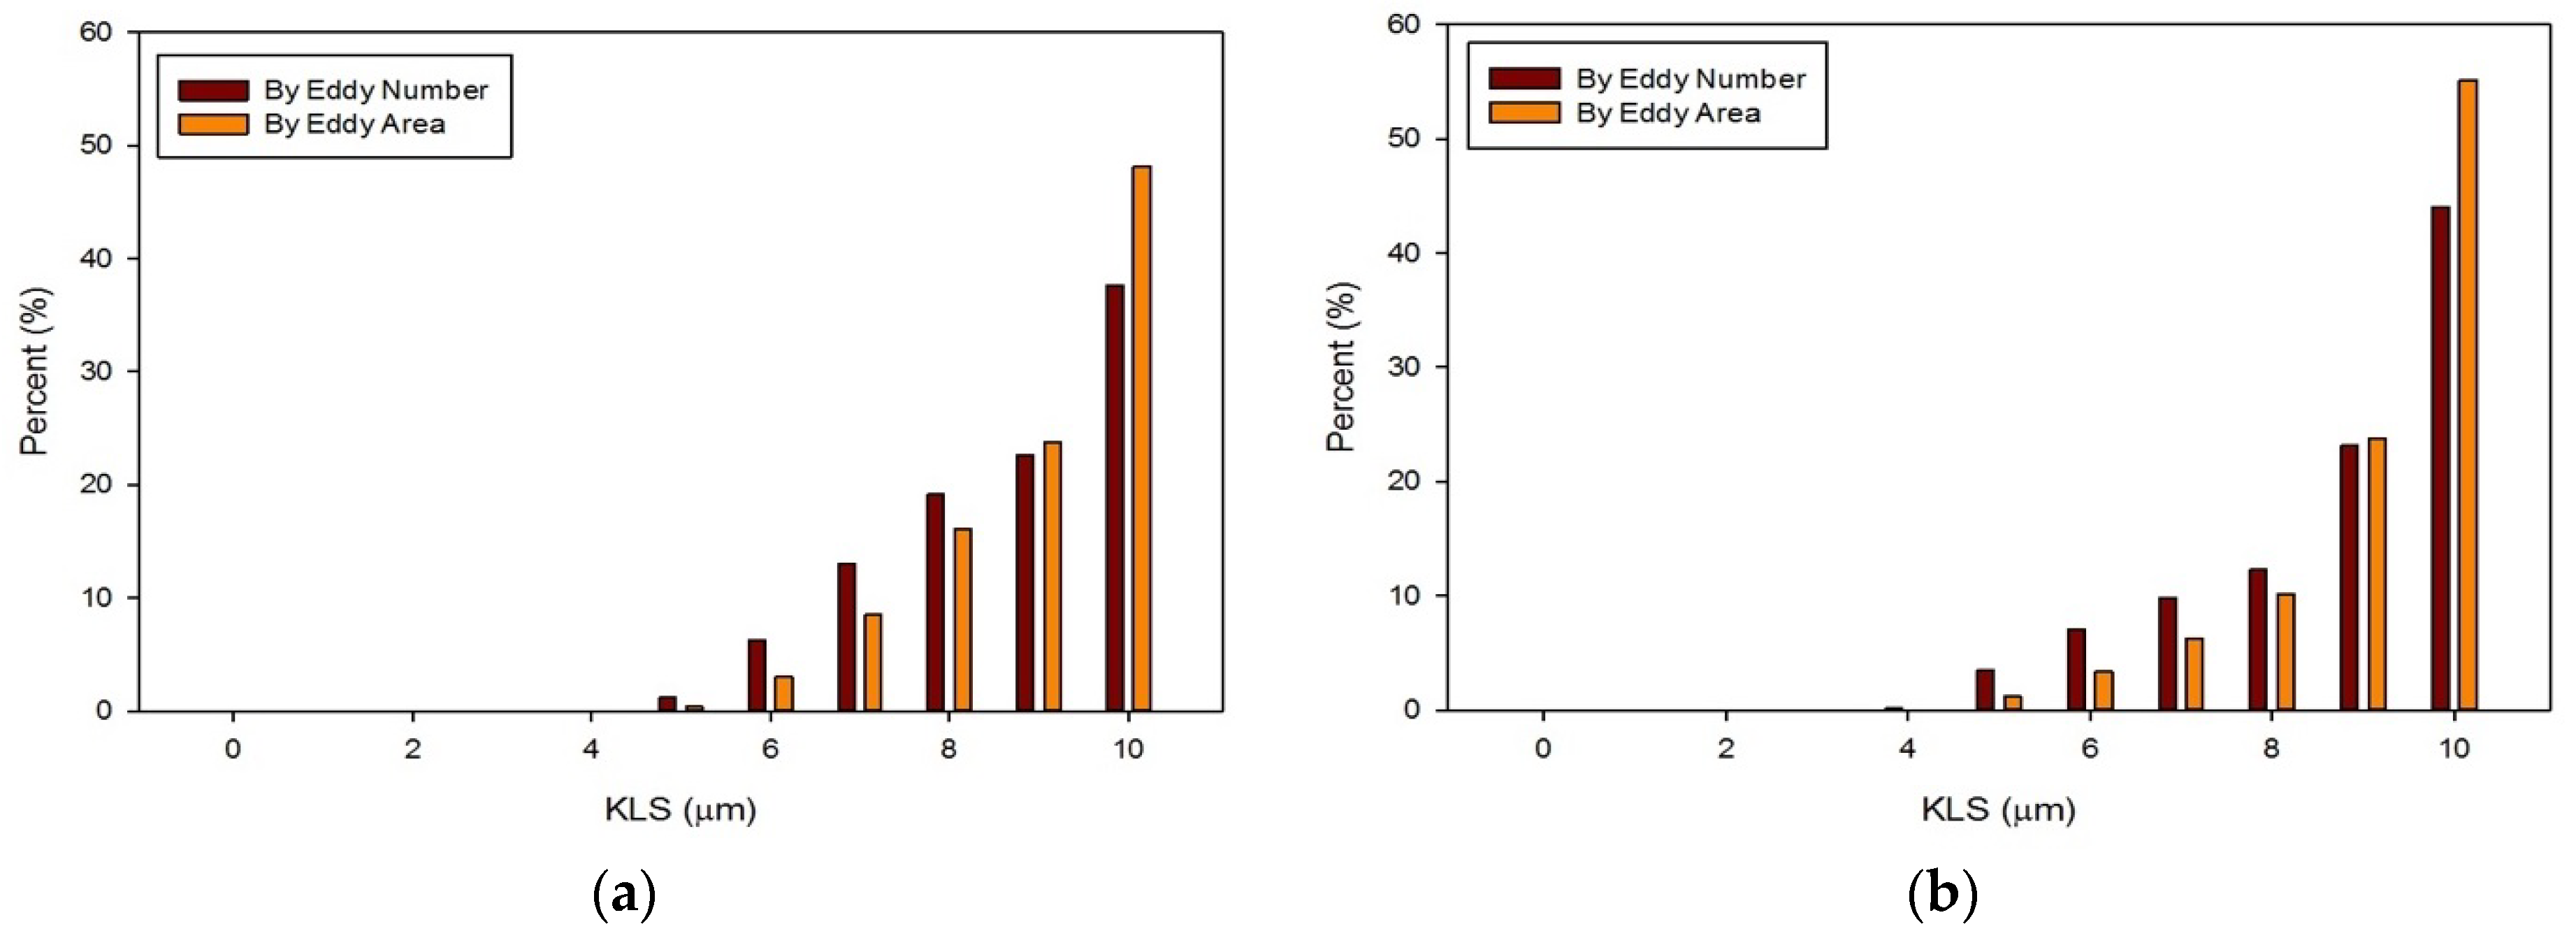
The distribution of eddies (by both area and frequency) with a KLS of 10 μm or less were calculated for all of the runs with blood. Results for these distributions are shown in Figure 13 and Figure 14. With an increase in the flowrate, for both the functioning and malfunctioning valves, there was a shift to smaller eddy sizes and an increase in the percent of the smallest eddies. This is expected as an increase in velocity increases the Reynolds number and turbulence of the flow, which increases the dissipation of energy and leads to decreased KLS values. The total number and surface area of eddies of each size also increased with an increase in velocity.
In all cases, the largest percent of eddies, both by area and frequency, were the eddies in the range of 10 μm. When comparing the two valves at the same flowrate, the malfunctioning valve had a greater proportion of eddies of smaller sizes than the functioning valve. Moreover, the absolute number of eddies of all sizes was greater for the malfunctioning valve, meaning the total area occupied with eddies was also greater. Finally, the spatial distribution of eddies, or the total volume over which hemolysis occurs, was also greater for the malfunctioning valve (see Figure 11 and Figure 12).
The hemolysis predictions based on the normalized surface areas of eddies were calculated using Equations (3) and (4) (Table 5). The results shown are the hemolysis indices per cubic meter (m3) based on the regions of hemolysis (regions having eddies with a diameter of 10 μm or less for Equation (3) and 9 μm or less for Equation (4)). In all cases at the same flowrate, the malfunctioning valve had a higher expected hemolysis. In most cases, a higher flowrate also correlated to a higher expected hemolysis. This did not hold true for Equation (3) for the malfunctioning valve.
This is because for a flowrate of 1.5 m/s there were a lot more eddies in the malfunctioning valve system with an 8–10 μm diameter that took up a much larger volume down the length of the valve. When normalized, this would give a smaller hemolysis per m3 when compared to the system with a 1.25 m/s flowrate, which had a smaller volume to normalize all of the surface areas. In other words, at any point within the region of fluid that hemolysis is expected (i.e., within the region of fluid containing eddies of KLS equal to 9/10 μm or less), the hemolysis index on average would be lower than the index of the lower flowrate system because the higher flowrate system had a much greater percentage of eddies of a larger size (or low intensity). This result serves to illustrate that hemolysis depends on both eddy intensity and the extent of the regions in the device where hemolysis occurs.
To compare the total hemolysis expected in each case, the normalized hemolysis must be multiplied by the region containing hemolysis, or volume of space taken up by eddies of 9 or 10 μm depending on the equation. These results are shown in Table 6. In all cases, a higher flowrate correlated with a higher total hemolysis index prediction. At the same flowrate, the malfunctioning valve always had a higher predicted total hemolysis index than the functioning valve. We need to point out here that the model equations, when compared to experiments in the Ozturk et al. work [53], yielded a coefficient of determination R2 between 0.77 and 0.87.
These levels of hemolysis are quite small even before accounting for dilution by total blood volume. In fact, hemolysis is now considered to be a minor clinical problem insofar as the valve design is considered. Hemolysis problems are commonly related to issues other than flow through the valve or valve design. Most often, incidences of high hemolysis are due to paravalvular leakage rather than damaging flow conditions created by the heart valve itself [61,65,66].
With hemolysis less of an issue, the value of computational analysis for heart valves and damage to erythrocytes is brought into question. In fact, problems remain. Further improvement in valve design is needed to address the shortened circulatory life of red blood cells from sublethal trauma. Eddy analysis shows some promise in this regard as the results in Figure 11 suggest modification of the leading edge of the valve leaflet to eliminate smaller eddies that appear there might be fruitful. The challenge in addressing sublethal damage to the erythrocyte has been finding a suitable marker quantifying the magnitude of the effect [57]. With a suitable marker, equations analogous to Equations (3) and (4) might be obtained for sublethal injury from turbulent flow. We expect larger eddies would need to be considered in that case and new empirical coefficients determined.

4. Summary and Conclusions

In this work a CFD-based, three-dimensional model of a bileaflet artificial heart valve was created in both a functioning and malfunctioning position. The results of simulations were compared with literature [57,59,60] to evaluate the accuracy of the various computational methods. Velocity profiles and contours were also compared between the two valves. Additionally, analysis was done on eddy intensity and distribution throughout the flow field, and the percent distribution of eddy sizes by both number of eddies and total surface area of eddies were compared between the valves at multiple flowrates. Finally, predictions of hemolysis were made using a recently developed empirical model that accounts for turbulent kinetic energy dissipation (Equations (3) and (4)). The main conclusions were:
  • The CFD model of the functioning valve gave good agreement with velocity data from literature using a medium mesh density and first order k-ω SST turbulence model with curvature and low-Re corrections. This validates the results of the heart valve simulations and gives confidence to other results obtained.
  • Simulations within the malfunctioning valve indicated a larger number of small eddies formed on the side of the valve and sinus near the fully open, functioning leaflet, when compared to the nearly closed, malfunctioning leaflet. Again, this is due to a larger amount of fluid flow in this region, creating more areas of turbulence and higher turbulent dissipation rates.
  • Results showed that an increased flowrate corresponds with an increase in eddy intensity because of the increase in the number and areas of eddies of smaller sizes. It was also found that at the same flowrate, when compared to the functioning valve, the malfunctioning valve showed increased eddy intensity and eddies farther down the flow field. This means that an increase in flowrate or a malfunction in the valve can increase both eddy intensity and distribution, resulting in greater hemolysis.
  • The hemolysis predictions were lower than others in the literature [26,27] and support the view that current artificial heart valves do not cause a significant amount of hemolysis when functioning properly. Adapting the method to subhemolytic injury to cells could provide further improvement in the design of valve prostheses.
The lack of hemolytic damage points to subhemolytic and sublethal damage now being of greater concern than actual hemolysis for further valve improvement. Hemolysis and the prediction equations can still be used as a comparative measure to determine which heart valves, flowrates, and malfunction types could be more damaging to the red blood cells. While these predictions support relative damage results, more in-vitro work will be necessary to employ eddy analysis effectively for subhemolytic damage.

Author Contributions

Conceptualization and project administration, D.V.P and E.A.O.; methodology all co-authors; analysis and investigation, all co-authors; simulations and data collection, M.E.J.; writing—review and editing, all co-authors.

Funding

This research received no external funding.

Acknowledgments

The use of computing facilities at the University of Oklahoma Supercomputing Center for Education and Research (OSCER).

Conflicts of Interest

The authors declare no conflict of interest.

References

  1. Blackwell, D.; Villarroel, M.A. Tables of Summary Health Statistics for U.S. Adults: 2015 National Health Interview Survey. National Center for Health Statistics. Available online: http://www.cdc.gov/nchs/nhis/SHS/tables.htm (accessed on 28 January 2019).
  2. Murphy, S.L.; Xu, J.; Kochanek, K.D.; Curtin, S.C.; Arias, E. Deaths: Final Data for 2015. Natl. Vital Stat. Rep. 2017, 66, 1–75. [Google Scholar]
  3. Dasi, L.P.; Simon, H.A.; Sucosky, P.; Yoganathan, A.P. Fluid Mechanics of Artificial Heart Valves. Clin. Exp. Pharmacol. Physiol. 2009, 36, 225–237. [Google Scholar] [CrossRef] [PubMed]
  4. Hund, S.J.; Antaki, J.F.; Massoudi, M. On the representation of turbulent stresses for computing blood damage. Int. J. Eng. Sci. 2010, 48, 1325–1331. [Google Scholar] [CrossRef] [PubMed] [Green Version]
  5. Antiga, L.; Steinman, D.A. Rethinking turbulence in blood. Biorheology 2009, 46, 77–81. [Google Scholar] [PubMed]
  6. Casa, L.D.; Deaton, D.H.; Ku, D.N. Role of high shear rate in thrombosis. J. Vasc. Surg. 2015, 61, 1068–1080. [Google Scholar] [CrossRef]
  7. Slepian, M.J.; Sheriff, J.; Hutchinson, M.; Tran, P.; Bajaj, N.; Garcia, J.G.N.; Scott Saavedra, S.; Bluestein, D. Shear-mediated platelet activation in the free flow: Perspectives on the emerging spectrum of cell mechanobiological mechanisms mediating cardiovascular implant thrombosis. J. Biomech. 2017, 50, 20–25. [Google Scholar] [CrossRef] [PubMed] [Green Version]
  8. Bluestein, D.; Chandran, K.B.; Manning, K.B. Towards non-thrombogenic performance of blood recirculating devices. Ann. Biomed. Eng. 2010, 38, 1236–1256. [Google Scholar] [CrossRef]
  9. Simak, J.; Gelderman, M.P. Cell membrane microparticles in blood and blood products: Potentially pathogenic agents and diagnostic markers. Transfus. Med. Rev. 2006, 20, 1–26. [Google Scholar] [CrossRef] [PubMed]
  10. Marom, G. Numerical Methods for Fluid-Structure Interaction Models of Aortic Valves. Arch. Comput. Method Eng. 2015, 22, 595–620. [Google Scholar] [CrossRef]
  11. Zhou, F.; Cui, Y.Y.; Wu, L.L.; Yang, J.; Liu, L.; Maitz, M.F.; Brown, I.G.; Huang, N. Analysis of Flow Field in Mechanical Aortic Bileaflet Heart Valves Using Finite Volume Method. J. Med. Biol. Eng. 2016, 36, 110–120. [Google Scholar] [CrossRef]
  12. Khalili, F.; Gamage, P.P.T.; Sandler, R.H.; Mansy, H.A. Adverse Hemodynamic Conditions Associated with Mechanical Heart Valve Leaflet Immobility. Bioengineering (Basel) 2018, 5, 74. [Google Scholar] [CrossRef] [PubMed]
  13. Shahriari, S.; Maleki, H.; Hassan, I.; Kadem, L. Evaluation of shear stress accumulation on blood components in normal and dysfunctional bileaflet mechanical heart valves using smoothed particle hydrodynamics. J. Biomech. 2012, 45, 2637–2644. [Google Scholar] [CrossRef] [PubMed]
  14. Shapira, Y.; Vaturi, M.; Sagie, A. Hemolysis Associated with Prosthetic Heart Valves A Review. Cardiol. Rev. 2009, 17, 121–124. [Google Scholar] [CrossRef] [PubMed]
  15. Taimeh, Z.; Koene, R.J.; Furne, J.; Singal, A.; Eckman, P.M.; Levitt, M.D.; Pritzker, M.R. Erythrocyte aging as a mechanism of anemia and a biomarker of device thrombosis in continuous-flow left ventricular assist devices. J. Heart Lung Transplant. 2017, 36, 625–632. [Google Scholar] [CrossRef] [PubMed]
  16. Yacoub, M.H.; Keeling, D.H. Chronic haemolysis following insertion of ball valve prostheses. Br. Heart J. 1968, 30, 676–678. [Google Scholar] [CrossRef] [PubMed]
  17. Kloster, F.E. Diagnosis and management of complications of prosthetic heart valves. Am. J. Cardiol. 1975, 35, 872–885. [Google Scholar] [CrossRef]
  18. Maraj, R.; Jacobs, L.E.; Ioli, A.; Kotler, M.N. Evaluation of hemolysis in patients with prosthetic heart valves. Clin. Cardiol. 1998, 21, 387–392. [Google Scholar] [CrossRef] [Green Version]
  19. Amidon, T.M.; Chou, T.M.; Rankin, J.S.; Ports, T.A. Mitral and Aortic Paravalvular Leaks with Hemolytic-Anemia. Am. Heart J. 1993, 125, 266–268. [Google Scholar] [CrossRef]
  20. Tanis, W.H.; van den Brink, R.; Symersky, P.; Budde, R.; Chamuleau, S. Differentiation of thrombus from pannus as the cause of acquired mechanical prosthetic heart valve obstruction by non-invasive imaging: A review of the literature. Eur. Heart J. Cardiovasc. Imaging 2014, 15, 119–129. [Google Scholar] [CrossRef]
  21. Sucha, D.; Symersky, P.; van den Brink, R.B.A.; Tanis, W.; Laufer, E.M.; Meijs, M.F.L.; Habets, J.; de Mol, B.A.; Mali, W.P.; Chamuleau, S.A.; et al. Diagnostic evaluation and treatment strategy in patients with suspected prosthetic heart valve dysfunction: The incremental value of MDCT. J. Cardiovasc. Comput. 2016, 10, 398–406. [Google Scholar] [CrossRef]
  22. Madukauwa-David, I.D.; Pierce, E.L.; Sulejmani, F.; Pataky, J.; Sun, W.; Yoganathan, A.P. Suture dehiscence and collagen content in the human mitral and tricuspid annuli. Biomech. Model. Mechanobiol. 2018. [Google Scholar] [CrossRef] [PubMed]
  23. Mecozzi, G.; Milano, A.D.; De Carlo, M.; Sorrentino, F.; Pratali, S.; Nardi, C.; Bortolotti, U. Intravascular hemolysis in patients with new-generation prosthetic heart valves: A prospective study. J. Thorac. Cardiovasc. Surg. 2002, 123, 550–556. [Google Scholar] [CrossRef] [Green Version]
  24. Shivakumaraswamy, T.M.P.; Radhakrishnan, B.; Khandekar, J.; Agrawal, N.; Patwardhan, A.; Khandeparkar, J. Intravascular hemolysis in patients with normally functioning mechanical heart valves in mitral position. Indian J. Thoracis Cardiovasc. Surg. 2006, 22, 215–218. [Google Scholar] [CrossRef]
  25. Sabzi, F.; Khosravi, D. Hemolytic Anemia after Aortic Valve Replacement: A Case Report. Acta Medica Iranica 2015, 53, 585–589. [Google Scholar] [PubMed]
  26. Susin, F.M.; Espa, S.; Toninato, R.; Fortini, S.; Querzoli, G. Integrated strategy for in vitro characterization of a bileaflet mechanical aortic valve. Biomed. Eng. Online 2017, 16, 29. [Google Scholar] [CrossRef] [PubMed]
  27. de Tullio, M.D.; Nam, J.; Pascazio, G.; Balaras, E.; Verzicco, R. Computational prediction of mechanical hemolysis in aortic valved prostheses. Eur. J. Mech. B-Fluid 2012, 35, 47–53. [Google Scholar] [CrossRef]
  28. Toninato, R.; Fadda, G.; Susin, F.M. A Red Blood Cell Model to Estimate the Hemolysis Fingerprint of Cardiovascular Devices. Artif. Organs 2018, 42, 58–67. [Google Scholar] [CrossRef]
  29. Yin, W.; Ngwe, E.C.; Rubenstein, D.A. A Biocompatible Flow Chamber to Study the Hemodynamic Performance of Prosthetic Heart Valves. Asaio J. 2012, 58, 470–480. [Google Scholar] [CrossRef] [Green Version]
  30. Giersiepen, M.; Wurzinger, L.J.; Opitz, R.; Reul, H. Estimation of Shear Stress-Related Blood Damage in Heart-Valve Prostheses—Invitro Comparison of 25 Aortic Valves. Int. J. Artif. Organs 1990, 13, 300–306. [Google Scholar] [CrossRef]
  31. Blackshear, P.L.; Dorman, F.D.; Steinbach, J.H. Some Mechanical Effects That Influence Hemolysis. Trans. Am. Soc. Artif. Int. Organs 1965, 11, 112. [Google Scholar] [CrossRef]
  32. Heuser, G.; Opitz, R. A Couette Viscometer for Short-Time Shearing of Blood. Biorheology 1980, 17, 17–24. [Google Scholar] [CrossRef] [PubMed]
  33. Fraser, K.H.; Zhang, T.; Taskin, M.E.; Griffith, B.P.; Wu, Z.J. A Quantitative Comparison of Mechanical Blood Damage Parameters in Rotary Ventricular Assist Devices: Shear Stress, Exposure Time and Hemolysis Index. J. Biomech. Eng. 2012, 134, 081002. [Google Scholar] [CrossRef] [PubMed] [Green Version]
  34. Zhang, T.; Taskin, M.E.; Fang, H.B.; Pampori, A.; Jarvik, R.; Griffith, B.P.; Wu, Z.J. Study of Flow-Induced Hemolysis Using Novel Couette-Type Blood-Shearing Devices. Artif. Organs 2011, 35, 1180–1185. [Google Scholar] [CrossRef] [PubMed]
  35. Ding, J.; Niu, S.Q.; Chen, Z.S.; Zhang, T.; Griffith, B.P.; Wu, Z.J. Shear-Induced Hemolysis: Species Differences. Artif. Organs 2015, 39, 795–802. [Google Scholar] [CrossRef] [PubMed]
  36. Leverett, L.B.; Lynch, E.C.; Alfrey, C.P.; Hellums, J.D. Red Blood-Cell Damage by Shear-Stress. Biophys. J. 1972, 12, 257. [Google Scholar] [CrossRef]
  37. Arvand, A.; Hormes, M.; Reul, H. A validated computational fluid dynamics model to estimate hemolysis in a rotary blood pump. Artif. Organs 2005, 29, 531–540. [Google Scholar] [CrossRef]
  38. Chan, W.K.; Wong, Y.W.; Ding, Y.; Chua, L.P.; Yu, S.C.M. Numerical Investigation of the Effect of Blade Geometry on Blood Trauma in a Centrifugal Blood Pump. Artif. Organs 2002, 26, 785–793. [Google Scholar] [CrossRef]
  39. Song, X.W.; Throckmorton, A.L.; Wood, H.G.; Antaki, J.F.; Olsen, D.B. Computational fluid dynamics prediction of blood damage in a centrifugal pump. Artif. Organs 2003, 27, 938–941. [Google Scholar] [CrossRef]
  40. Arora, D.; Behr, M.; Pasquali, M. A tensor-based measure for estimating blood damage. Artif. Organs 2004, 28, 1002–1015. [Google Scholar] [CrossRef]
  41. Vitale, F.; Nam, J.; Turchetti, L.; Behr, M.; Raphael, R.; Annesini, M.C.; Pasquali, M. A multiscale, biophysical model of flow-induced red blood cell damage. Aiche J. 2014, 60, 1509–1516. [Google Scholar] [CrossRef]
  42. Taskin, M.E.; Fraser, K.H.; Zhang, T.; Wu, C.F.; Griffith, B.P.; Wu, Z.J.J. Evaluation of Eulerian and Lagrangian Models for Hemolysis Estimation. Asaio J. 2012, 58, 363–372. [Google Scholar] [CrossRef] [PubMed] [Green Version]
  43. Stein, P.D.; Sabbah, H.N. Turbulent Blood-Flow in Ascending Aorta of Humans with Normal and Diseased Aortic Valves. Circ. Res. 1976, 39, 58–65. [Google Scholar] [CrossRef] [PubMed]
  44. Sabbah, H.N.; Stein, P.D. Turbulent Blood-Flow in Humans—Primary Role in Production of Ejection Murmurs. Circ. Res. 1976, 38, 513–525. [Google Scholar] [CrossRef] [PubMed]
  45. Jones, S.A. A Relationship between Reynolds Stresses and Viscous Dissipation—Implications to Red-Cell Damage. Ann. Biomed. Eng. 1995, 23, 21–28. [Google Scholar] [CrossRef] [PubMed]
  46. Yen, J.H.; Chen, S.F.; Chern, M.K.; Lu, P.C. The effect of turbulent viscous shear stress on red blood cell hemolysis. J. Artif. Organs 2014, 17, 178–185. [Google Scholar] [CrossRef]
  47. Lee, H.; Tatsumi, E.; Taenaka, Y. Experimental Study on the Reynolds and Viscous Shear Stress of Bileaflet Mechanical Heart Valves in a Pneumatic Ventricular Assist Device. Asaio J. 2009, 55, 348–354. [Google Scholar] [CrossRef] [PubMed] [Green Version]
  48. Quinlan, N.J.; Dooley, P.N. Models of flow-induced loading on blood cells in laminar and turbulent flow, with application to cardiovascular device flow. Ann. Biomed. Eng. 2007, 35, 1347–1356. [Google Scholar] [CrossRef]
  49. Aziz, A.; Werner, B.C.; Epting, K.L.; Agosti, C.D.; Curtis, W.R. The cumulative and sublethal effects of turbulence on erythrocytes in a stirred-tank model. Ann. Biomed. Eng. 2007, 35, 2108–2120. [Google Scholar] [CrossRef] [PubMed]
  50. Liu, J.S.; Lu, P.C.; Chu, S.H. Turbulence characteristics downstream of bileaflet aortic valve prostheses. J. Biomech. Eng. 2000, 122, 118–124. [Google Scholar] [CrossRef]
  51. Dooley, P.N.; Quinlan, N.J. Effect of Eddy Length Scale on Mechanical Loading of Blood Cells in Turbulent Flow. Ann. Biomed. Eng. 2009, 37, 2449–2458. [Google Scholar] [CrossRef] [Green Version]
  52. Ozturk, M.; O’Rear, E.A.; Papavassiliou, D.V. Hemolysis Related to Turbulent Eddy Size Distributions Using Comparisons of Experiments to Computations. Artif. Organs 2015, 39, E227–E239. [Google Scholar] [CrossRef] [PubMed]
  53. Ozturk, M.; Papavassiliou, D.V.; O’Rear, E.A. An approach for assessing turbulent flow damage to blood in medical devices. Journal of biomechanical engineering. J. Biomech. Eng. 2017, 139, 011008. [Google Scholar] [CrossRef] [PubMed]
  54. Sutera, S.P.; Mehrjardi, M.H. Deformation and Fragmentation of Human Red Blood-Cells in Turbulent Shear-Flow. Biophys. J. 1975, 15, 1–10. [Google Scholar] [CrossRef]
  55. Kameneva, M.V.; Burgreen, G.W.; Kono, K.; Repko, B.; Antaki, J.F.; Umezu, M. Effects of turbulent stresses upon mechanical hemolysis: Experimental and computational analysis. Asaio J. 2004, 50, 418–423. [Google Scholar] [CrossRef] [PubMed]
  56. Forstrom, R.J. A New Measure of Erythrocyte Membrane Strength-The Jet Fragility Test. Ph.D. Thesis, University of Minnesota, Minneapolis, MN, USA, 1969. [Google Scholar]
  57. Hutchinson, C. Stereoscopic PIV in steady Flow Through a Bileaflet Mechanical Heart Valve. Ph.D. Thesis, University of Toronto, Toronto, ON, Canada, 2009. [Google Scholar]
  58. Raghav, V.S.S.; Saikrishnan, N. Experimental Assessment of Flow Fields Associated with Heart Valve Prostheses Using Particle Image Velocimetry (PIV): Recommendations for Best Practices. Cardiovasc. Eng. Technol. 2018, 9, 1–15. [Google Scholar] [CrossRef] [PubMed]
  59. Blackmore, A.S.P. Large Eddy simulations and Particle Image velocimetry Experiments within a BIMHV Flow Near Peak Systole. In Proceedings of the International Symposium on Turbulence and Shear Flow Phenomena (PTFP-8), Poitiers, France, 23–30 August 2013; TSFP DIGITAL LIBRARY ONLINE. Begell House Inc.: Danbury, CT, USA, 2013. [Google Scholar]
  60. Hutchison, C.; Sullivan, P.; Ethier, C.R. Measurements of steady flow through a bileaflet mechanical heart valve using stereoscopic PIV. Med. Biol. Eng. Comput. 2011, 49, 325–335. [Google Scholar] [CrossRef] [PubMed]
  61. Hwang, H.Y.; Choi, J.-W.; Kim, H.-K.; Kim, K.-H.; Kim, K.-B.; Ahn, H. Paravalvular Leak After Mitral Valve Replacement: 20-Year Follow-Up. Ann. Thoracic Surg. 2015, 100, 1347–1352. [Google Scholar] [CrossRef] [PubMed]
  62. Smadi, O.; Hassan, I.; Pibarot, P.; Kadem, L. Numerical and experimental investigations of pulsatile blood flow pattern through a dysfunctional mechanical heart valve. J. Biomech. 2010, 43, 1565–1572. [Google Scholar] [CrossRef] [PubMed]
  63. Jahandardoost, M.; Fradet, G.; Mohammadi, H. Effect of heart rate on the hemodynamics of bileaflet mechanical heart valves’ prostheses (St. Jude Medical) in the aortic position and in the opening phase: A computational study. Proc. Inst. Mech. Eng. H 2016, 230, 175–190. [Google Scholar] [CrossRef]
  64. Khalili, F.G.P.; Mansy, H.A. Hemodynamics of a Bileaflet Mechanical Heart Valve with Different Levels of Dysfunction. J. Appl. Biotechnol. Bioeng. 2017, 2. [Google Scholar] [CrossRef]
  65. Ko, T.Y.; Lin, M.S.; Lin, L.C.; Liu, Y.J.; Yeh, C.F.; Huang, C.C.; Chen, Y.H.; Chen, Y.S.; Kao, H.L. Frequency and Significance of Intravascular Hemolysis Before and After Transcatheter Aortic Valve Implantation in Patients with Severe Aortic Stenosis. Am. J. Cardiol. 2018, 121, 69–72. [Google Scholar] [CrossRef] [PubMed]
  66. Cho, I.J.; Moon, J.; Shim, C.Y.; Jang, Y.; Chung, N.; Chang, B.C.; Ha, J.W. Different Clinical Outcome of Paravalvular Leakage After Aortic or Mitral Valve Replacement. Am. J. Cardiol. 2011, 107, 280–284. [Google Scholar] [CrossRef] [PubMed]
Figure 1. In silico reproduction of the valve test system. The flow is from left to right, the green area representing the flow entrance region before the valve and the blue area representing the flow area downstream from the valve.
Fluids 04 00019 g001
Figure 2. Geometry of the functioning heart valve (leaflets fully open). Only a quarter of the flow system was simulated because of symmetry.
Fluids 04 00019 g002
Figure 3. Geometry of the malfunctioning heart valve (one leaflet mostly closed). Only half of the flow system was simulated because of symmetry.
Fluids 04 00019 g003
Figure 4. Grid independence analysis for pressure (using the Hutchinson et al. run settings [53] with an inlet velocity of 0.445 m/s). The red line on the inset figure indicates the location at which the measurements were taken, with flow from the left towards the right. Inlet gauge pressure was set to 0 Pa. Lines shown are best fits of the data.
Fluids 04 00019 g004
Figure 5. Grid independence analysis for KLS at 405 mm downstream of the inlet (using the Hutchinson et al. run settings [53] with an inlet velocity of 0.445 m/s). The red line on the inset figure indicates the location at which the measurements were taken, with flow from the bottom towards the top.
Fluids 04 00019 g005
Figure 6. Comparison of time-averaged velocity profiles at x = 414 mm (using the Hutchinson et al. and Blackmore et al. run settings [59,60] with an inlet velocity of 0.445 m/s) from various turbulence model predictions. (k-epsilon 1 and k-epsilon 2 indicate results by applying a k-ε closure with first order and second order convergence, respectively, while k-omega 1 and k-omega 2 indicate results by applying a k-ω SST closure with first order and second order convergence, respectively.) The red line on the inset figure indicates the location at which the measurements were taken, with flow from the bottom towards the top.
Fluids 04 00019 g006
Figure 7. Comparison of velocity profiles at x = 375 mm for the functioning and malfunctioning valves (using the Hutchinson et al. run settings [53] with an inlet velocity of 0.445 m/s). The red lines on the inset figures indicate the location at which the measurements were taken, with flow from the bottom towards the top. The location r = 0 is on the centerline of the pipe and valve arrangement seen on Figure 1.
Fluids 04 00019 g007
Figure 8. Comparison of velocity profiles at x = 414 mm for the functioning and malfunctioning valves (using the Hutchinson et al. run settings [60] with an inlet velocity of 0.445 m/s). The red lines on the inset figures indicate the location at which the measurements were taken, with flow direction from the bottom towards the top of the scheme. The location r = 0 is on the centerline of the pipe and valve arrangement seen on Figure 1.
Fluids 04 00019 g008
Figure 9. Axial velocity contours on the plane of symmetry for the functioning valve with blood and an inlet velocity of 1.25 m/s (a) and 1.5 m/s (b). Flow direction is from left to right.
Fluids 04 00019 g009
Figure 10. Velocity contours on the plane of symmetry for the malfunctioning valve with blood and an inlet velocity of 1.25 m/s (a) and 1.5 m/s (b). Flow direction is from left to right.
Fluids 04 00019 g010
Figure 11. Volumetric contours of eddies with low KLS values for the functioning valve with blood and an inlet velocity of 1.25 m/s (a) and 1.5 m/s (b) (Note: The view is the inner portion of the valve, so the direction of the model appears reversed and flow is now from right to left.).
Fluids 04 00019 g011
Figure 12. Volumetric contours of eddies with low KLS values for the malfunctioning valve with blood and an inlet velocity of 1.25 m/s (a) and 1.5 m/s (b) (Note: The view is the inner portion of the valve, so the direction of the model appears reversed and flow is from right to left.).
Fluids 04 00019 g012
Figure 13. Distributions of eddy size by frequency and area for the functioning valve with an inlet velocity of 1.25 m/s (a) and 1.5 m/s (b).
Fluids 04 00019 g013
Figure 14. Distributions of eddy size by frequency and area for the malfunctioning valve with an inlet velocity of 1.25 m/s (a) and 1.5 m/s (b).
Fluids 04 00019 g014
Table 1. Coefficients for Eddy Analysis Equations (3) and (4).
Model Versionabcde
Equation (3)-5.57 × 10−42.45 × 10−52.67 × 10−61.14 × 10−6
Equation (4)1.62 × 10−71.82 × 10−73.08 × 10−53.42 × 10−61.72 × 10⁻⁶
Table 2. Table of mesh sizes at different densities.
MeshCellsFacesNodes
Coarse117,950263,64937,829
Medium943,6002,080,556284,342
Fine7,548,80016,529,9042,204,660
Table 3. Table of root mean square and mean absolute errors for turbulence models.
Error Typek-epsilon 1k-epsilon 2k-omega 1k-omega 2
Mean Absolute Error0.1870.1650.0720.104
Root Mean Square Error0.1090.0860.0160.028
Table 4. Comparison of two fluids used for CFD modeling.
FluidDensity (kg/m3)Kinematic Viscosity (m2/s)Dynamic Viscosity (Pa·s)
Test Fluid17961.57 × 10−6-
Blood1050-0.002
Table 5. Normalized hemolysis predictions per m3 for the eddy size distribution alone.
Model VersionFunctioning ValveMalfunctioning Valve
1.25 m/s1.5 m/s1.25 m/s1.5 m/s
Equation (3)0.675%0.716%0.833%0.818%
Equation (4)1.097%1.135%1.273%1.314%
Table 6. Hemolysis predictions within the total volume occupied by small eddies.
Model VersionFunctioning ValveMalfunctioning Valve
1.25 m/s1.5 m/s1.25 m/s1.5 m/s
Equation (3)8.806 × 10⁻⁹%2.402 × 10⁻⁸%1.995 × 10⁻⁷%6.615 × 10⁻⁷%
Equation (4)4.496 × 10⁻⁹%1.867 × 10⁻⁸%1.405 × 10⁻⁷%4.264 × 10⁻⁷%