Article

Parametric Investigation of Methanol Spray Combustion Under Direct-Injection Conditions

1
School of Mechanical and Manufacturing Engineering, University of New South Wales, Sydney, NSW 2052, Australia
2
School of Mechanical Engineering, Shanghai Jiao Tong University, Shanghai 200240, China
3
Everllence, Teglholmsgade 41, 2450 Copenhagen, Denmark
*
Authors to whom correspondence should be addressed.
Fluids 2026, 11(8), 203; https://doi.org/10.3390/fluids11080203
Submission received: 18 May 2026 / Revised: 31 July 2026 / Accepted: 14 August 2026 / Published: 17 August 2026
(This article belongs to the Collection Challenges and Advances in Heat and Mass Transfer)

Abstract

This study presents a systematic mapping of methanol spray autoignition, lift-off, and flame development across an engine-relevant range of ambient temperatures (1000–1200 K), injection pressures (70–130 MPa), and O2 concentrations (21–15 vol.%), using a single fixed injector and optical configuration. In addition, the study reports a dual-fuel strategy to address the low-temperature instability challenges highlighted by the mapping. Within this dataset, ignition delay increases with a lower ambient temperature, reduced injection pressure, or a lower O2 concentration, while the lift-off length increases with a lower temperature and higher injection pressure. Schlieren imaging consistently captures ignition in the mid-axial region of the jet, softening of spray-head gradients before high-temperature ignition, and occasional upstream ignition sites during the diffusion-controlled phase that affect the flame base position. At the lowest tested temperature of 1000 K, methanol autoignites over a wide ignition-delay range (±1.33 ms), with combustion occurring outside the chamber’s field of view. The corresponding heat-release profile cannot be interpreted conclusively under the current test configuration. Introducing a pilot jet at this condition enables methanol to ignite shortly after the start of injection over a much narrower range (∼±0.10 ms). The resulting combustion event remains within the field of view and occurs much closer to the nozzle compared with its autoignition counterpart.

1. Introduction

Methanol’s appeal as a clean alternative fuel has motivated research into its use in internal combustion engines [1], showing the benefits and limitations of methanol in direct diesel substitution [2,3]. Its low cetane number leads to poor autoignition quality [4], often requiring ignition-assist strategies [5], and its lower heating value necessitates higher fuel injection quantities for comparable power output [6]. Accordingly, tailored engine strategies have been developed to harness methanol’s clean combustion characteristics [7,8,9,10].
Beyond engine studies, controlled parametric experiments in simplified environments, such as constant-volume combustion chambers (CVCCs), enable the effects of ambient and injection parameters to be isolated. These studies have provided fundamental insights into methanol ignition and combustion that complement the findings from the engine-based studies. A summary of the most relevant fundamental studies is provided below.
Siebers et al. [11] investigated the autoignition of directly injected methanol, ethanol, and their 10% water blends in a CVCC. Ambient conditions were systematically varied (0.8–8 MPa, 600–1600 K) to represent different compression ratios and intake preheat levels, while injection pressures (8–18 MPa) and fuel quantities were also examined. In the study, methanol autoignited in 3–10 ms at a minimum temperature of approximately 950 K, showing little sensitivity to water addition of up to 10% by volume or the tested injection pressures or fuel quantities. Ethanol exhibited a similar ignition-delay range but at 900 K. However, the study performed a limited analysis of ignition behaviour and flame development, and the injection pressures used were below typical modern engine values.
In a separate study, Ming et al. [12] combined experiments with chemical kinetic simulations to compare methanol spray flames against iso-octane and n-heptane under limited constant-volume conditions (950 K, 4 MPa, 30 MPa injection pressure, 21% ambient O2 concentration). Using high-speed chemiluminescence imaging with a two-colour technique, they reported ignition delays of 1.0 ms for n-heptane, 8.2 ms for methanol, and 8.9 ms for iso-octane. Methanol’s first detectable luminosity appeared further downstream, and its flame luminosity, both in relative magnitude and base position, exhibited greater fluctuation than that of the hydrocarbon fuels. Although the reported results are insightful, the interpretation was constrained due to the nature of the optical diagnostics technique used. Methanol’s high autoignition resistance causes the flame to stabilise farther downstream of the nozzle, meaning a different portion of the flame remains within the field of view compared with other fuels. In addition, its lower C/H ratio and intrinsic oxygen content reduce luminosity and the signal-to-noise ratio. All of these factors complicate the direct comparison of the luminosity-based observations of the tested fuels, making them more challenging to interpret. The injection and ambient pressures employed were below those typical of modern engines, where injection pressures often exceed 100 MPa and in-cylinder pressures surpass 6–8 MPa [13,14].
More engine-relevant conditions were explored in a recent Engine Combustion Network (ECN) presentation [15], an international collaborative research initiative that provides benchmark experiments and simulations for spray and combustion processes under engine-relevant conditions. The results were reported on methanol’s ignition delay, lift-off length, spray penetration, and soot formation under Spray D conditions using an axial single-hole nozzle with a 0.186 mm orifice. Tests were performed at an ambient density of 22.8 kg/m3, temperatures from 800 to 1200 K, 15% (reacting) and 0% (inert) O2, and an injection pressure of 150 MPa. Cross-comparisons among methanol, n-dodecane, and oxymethylene ether (OME) showed similar ignition-delay ranges at different temperatures, with methanol igniting in 0.85–1.75 ms at 1100 K, n-dodecane in 0.7–1.0 ms and OME in 0.9–1.5 ms at approximately 800 K. The presentation also identified 1100 K as the lowest temperature at which methanol autoignition occurred and noted the larger uncertainty in methanol’s ignition-delay and lift-off measurements relative to other fuels.
To summarise, the existing research on methanol as a compression-ignition fuel has established its attractive emissions profile and highlighted its fundamental challenges, particularly its low cetane number, long ignition delays, and sensitivity to ignition assist strategies. Engine-scale investigations have demonstrated methanol’s potential for ultra-low soot combustion; yet, they also reveal a strong dependence on ignition-assist hardware and a limited understanding of in-cylinder flame development. Fundamental-level investigations, such as constant-volume studies, have provided valuable autoignition data, but many were conducted at sub-modern injection pressures or with restricted optical diagnostics, limiting insight into flame stabilisation, lift-off behaviour, and the influence of engine-relevant ambient conditions. More recent work, including ECN, has begun to explore methanol under higher-injection pressures and engine-representative conditions, though the parametric coverage is still incomplete. Consequently, the literature lacks a systematic characterisation of methanol jet ignition and combustion at conditions representative of modern diesel engines, particularly regarding ignition delay, lift-off length, and flame evolution across an engine-relevant range of temperatures, oxygen concentrations, and injection pressures.
The present study addresses this gap by providing a systematic, single-configuration mapping of methanol autoignition, lift-off, and flame development across 70–130 MPa injection pressures, 1000–1200 K ambient temperatures, and 15–21 vol.% O2 concentrations, establishing a comprehensive baseline for methanol autoignition behaviour under engine-relevant conditions. In addition, referencing the earlier reports (e.g., [11]) of 3–10 ms ignition delays at top dead centre relevant conditions corresponds to a large crank-angle span (18–60 °CA at 1000 rpm and 36–120 °CA at 2000 rpm), beyond which stable combustion phasing can be accommodated. Even in low-speed engines (50–150 rpm), the equivalent 0.9–8.1 °CA window remains significant, and the previously reported scatter suggests significant cycle-to-cycle variability, underscoring the operational challenges across both high- and low-speed applications. Therefore, recognising the practical challenges posed by methanol’s long ignition delays, whilst it is not the primary focus, the study also explores the effect of small pilot-fuel injection on the ignition and flame development of the methanol fuel jet, providing insight into strategies that may enable stable methanol combustion in compression-ignition applications. While prior research studies [16] show that dual-fuel combustion processes are highly sensitive to interdependent factors, such as injection timing, fuel energy shares, injector configuration, and ambient conditions, evaluating the remaining variables is reserved for future comprehensive work. Accordingly, these initial tests were restricted to a fixed injector configuration and injection sequence at the lowest ambient temperature (1000 K), a condition characterised by notably long methanol ignition delays.

2. Experimental Details

2.1. Constant-Volume Combustion Chamber

An optically accessible, high-temperature, high-pressure preburn-type vessel was used to simulate compression-ignition engine top-dead-centre conditions. The CVCC has a 114 mm cross-section and six ports, with sapphire windows providing a 101.6 mm clear aperture for multiple viewing angles and a large field of view. A solenoid-actuated Bosch injector (part number: 0445110257) was mounted on one port for fuel delivery. A mixing fan, operated at 1000 rpm through the top port, ensured a homogeneous ambient environment and improved the spatial uniformity of the temperature distribution, and was stopped before injection to avoid introducing pressure-trace noise. The chamber was heated by 16 cartridge heating elements rated at 500 W each (240 V DC supply), distributed around the CVCC with at least two elements embedded in each side wall and four elements each in the top and bottom walls, regulated by a PID controller that automatically switched the heating elements on and off to maintain the 403 K set-point temperature to simulate engine wall temperature and prevent condensation on the sapphire windows. The core temperature was measured at the chamber centre with a K-type thermocouple, while the bulk temperature was monitored from the pressure history; Figure 1 shows a representative trace. During the experiments, the chamber was filled with a premixed lean charge of acetylene (C2H2), hydrogen (H2), oxygen (O2), and nitrogen (N2), which was spark-ignited to generate a high-temperature, high-pressure environment. C2H2 and H2 were selected because their high reactivity and flame speeds promote rapid and stable combustion, enabling the desired pressure and temperature conditions to be achieved within a short time while maintaining good repeatability. O2 participated in the premixed combustion process, with the remaining excess establishing the desired ambient O2 concentration after combustion, while N2 was used as a diluent to achieve the target thermodynamic conditions. The mixture composition was adjusted to achieve target ambient O2 concentrations of 21, 18, or 15 vol.% (reacting) or 0 vol.% (non-reacting). Fuel injection was triggered once the desired ambient condition was reached. Table 1 summarises the premixed reactant composition (in vol.%) used to reach each target ambient condition; note that the reactant O2 fraction listed in the table (vol.% of the premixed charge) is distinct from the target ambient O2 concentration achieved after pre-combustion (vol.%, listed separately in the same table). For this study, a combination of high-speed schlieren imaging, diffuse back-illumination imaging, OH* chemiluminescence imaging, and high-speed pressure measurements, widely used in fundamental engine combustion studies [17], was employed. Details of the methodologies are provided in the following sections. Individually, the diagnostics implemented in the present work provide only a limited level of detail regarding jet development, ignition, and combustion progression. Nevertheless, as the findings of this study demonstrate, the combined application of these diagnostic techniques reveals a wealth of valuable preliminary information. Future studies would benefit from temporally and spatially resolved measurement techniques, such as laser-induced fluorescence, to further elucidate the underlying processes and extend the findings presented here.

2.1.1. High-Speed Schlieren Imaging

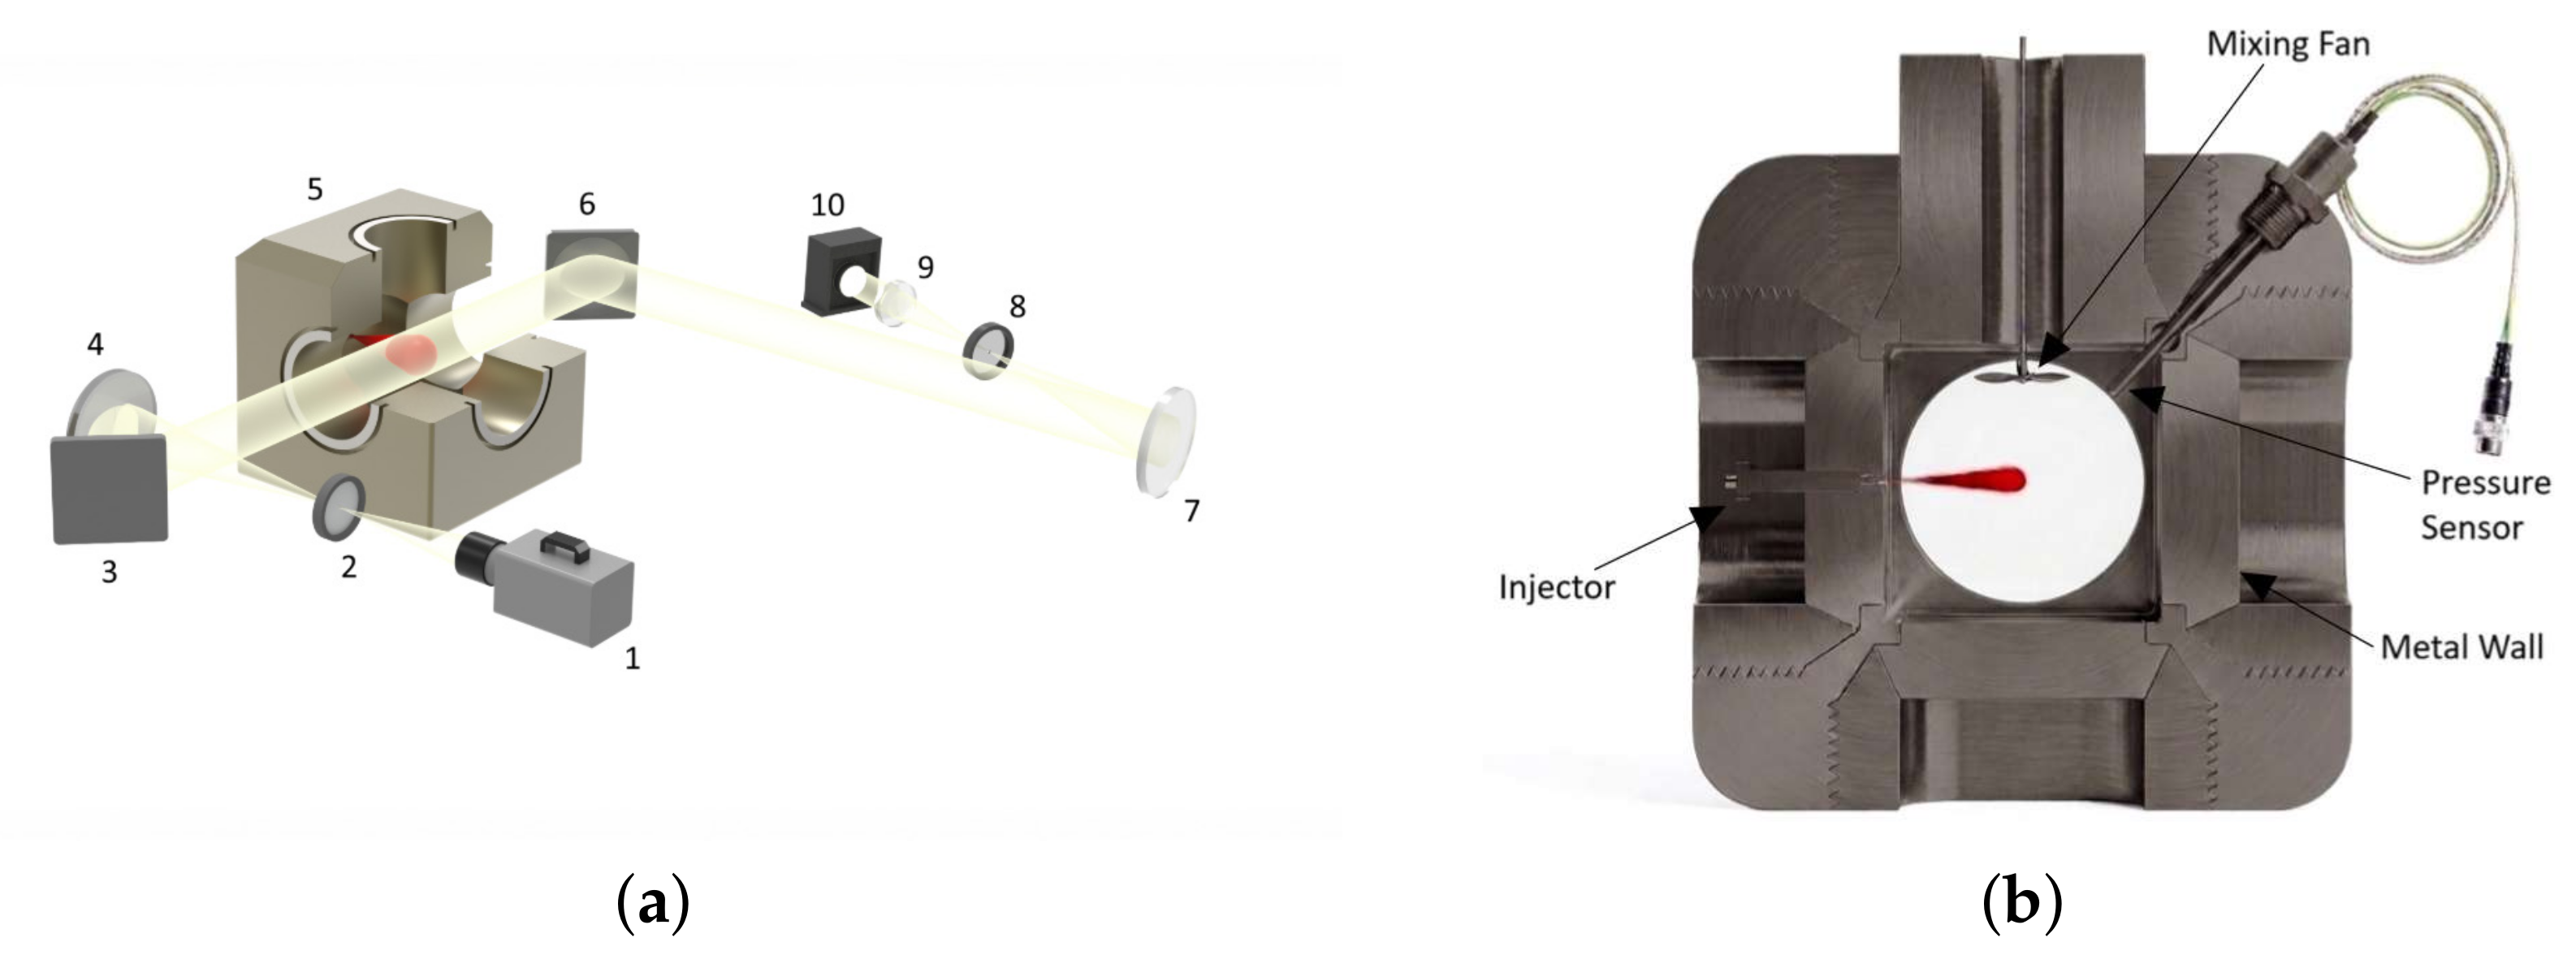
This study employed high-speed schlieren imaging to visualise the fuel spray boundary and analyse the associated mixing, ignition, and combustion phenomena. Figure 2a shows the Z-type schlieren configuration, comprising a 150 W Xenon arc lamp (Abet Technologies 150 Series) as the light source. The light was focused using a plano-convex lens (50 mm diameter, 75 mm focal length), collimated with an f/6 parabolic mirror, and directed through a mirror into the CVCC. After passing through the CVCC, the light was reflected by another mirror, re-collimated, passed through a 3 mm aperture to enhance sensitivity, and finally captured by a high-speed complementary metal-oxide semiconductor (CMOS) camera (Phantom VEO) equipped with a Nikon-Nikkor f/1.8 lens with an 85 mm focal length. Figure 2b shows a cross-sectional view of the CVCC, detailing the internal chamber geometry, injector arrangement, pressure sensor location, and mixing fan configuration. A representative methanol spray is shown for illustration purposes. With the existing optical layout, the schlieren system provided a usable field of view extending approximately 90 mm downstream of the nozzle. The resulting image has a spatial resolution of approximately 0.13 mm/pixel. The camera was operated at 46 K frames per second with a 1 µs exposure time.
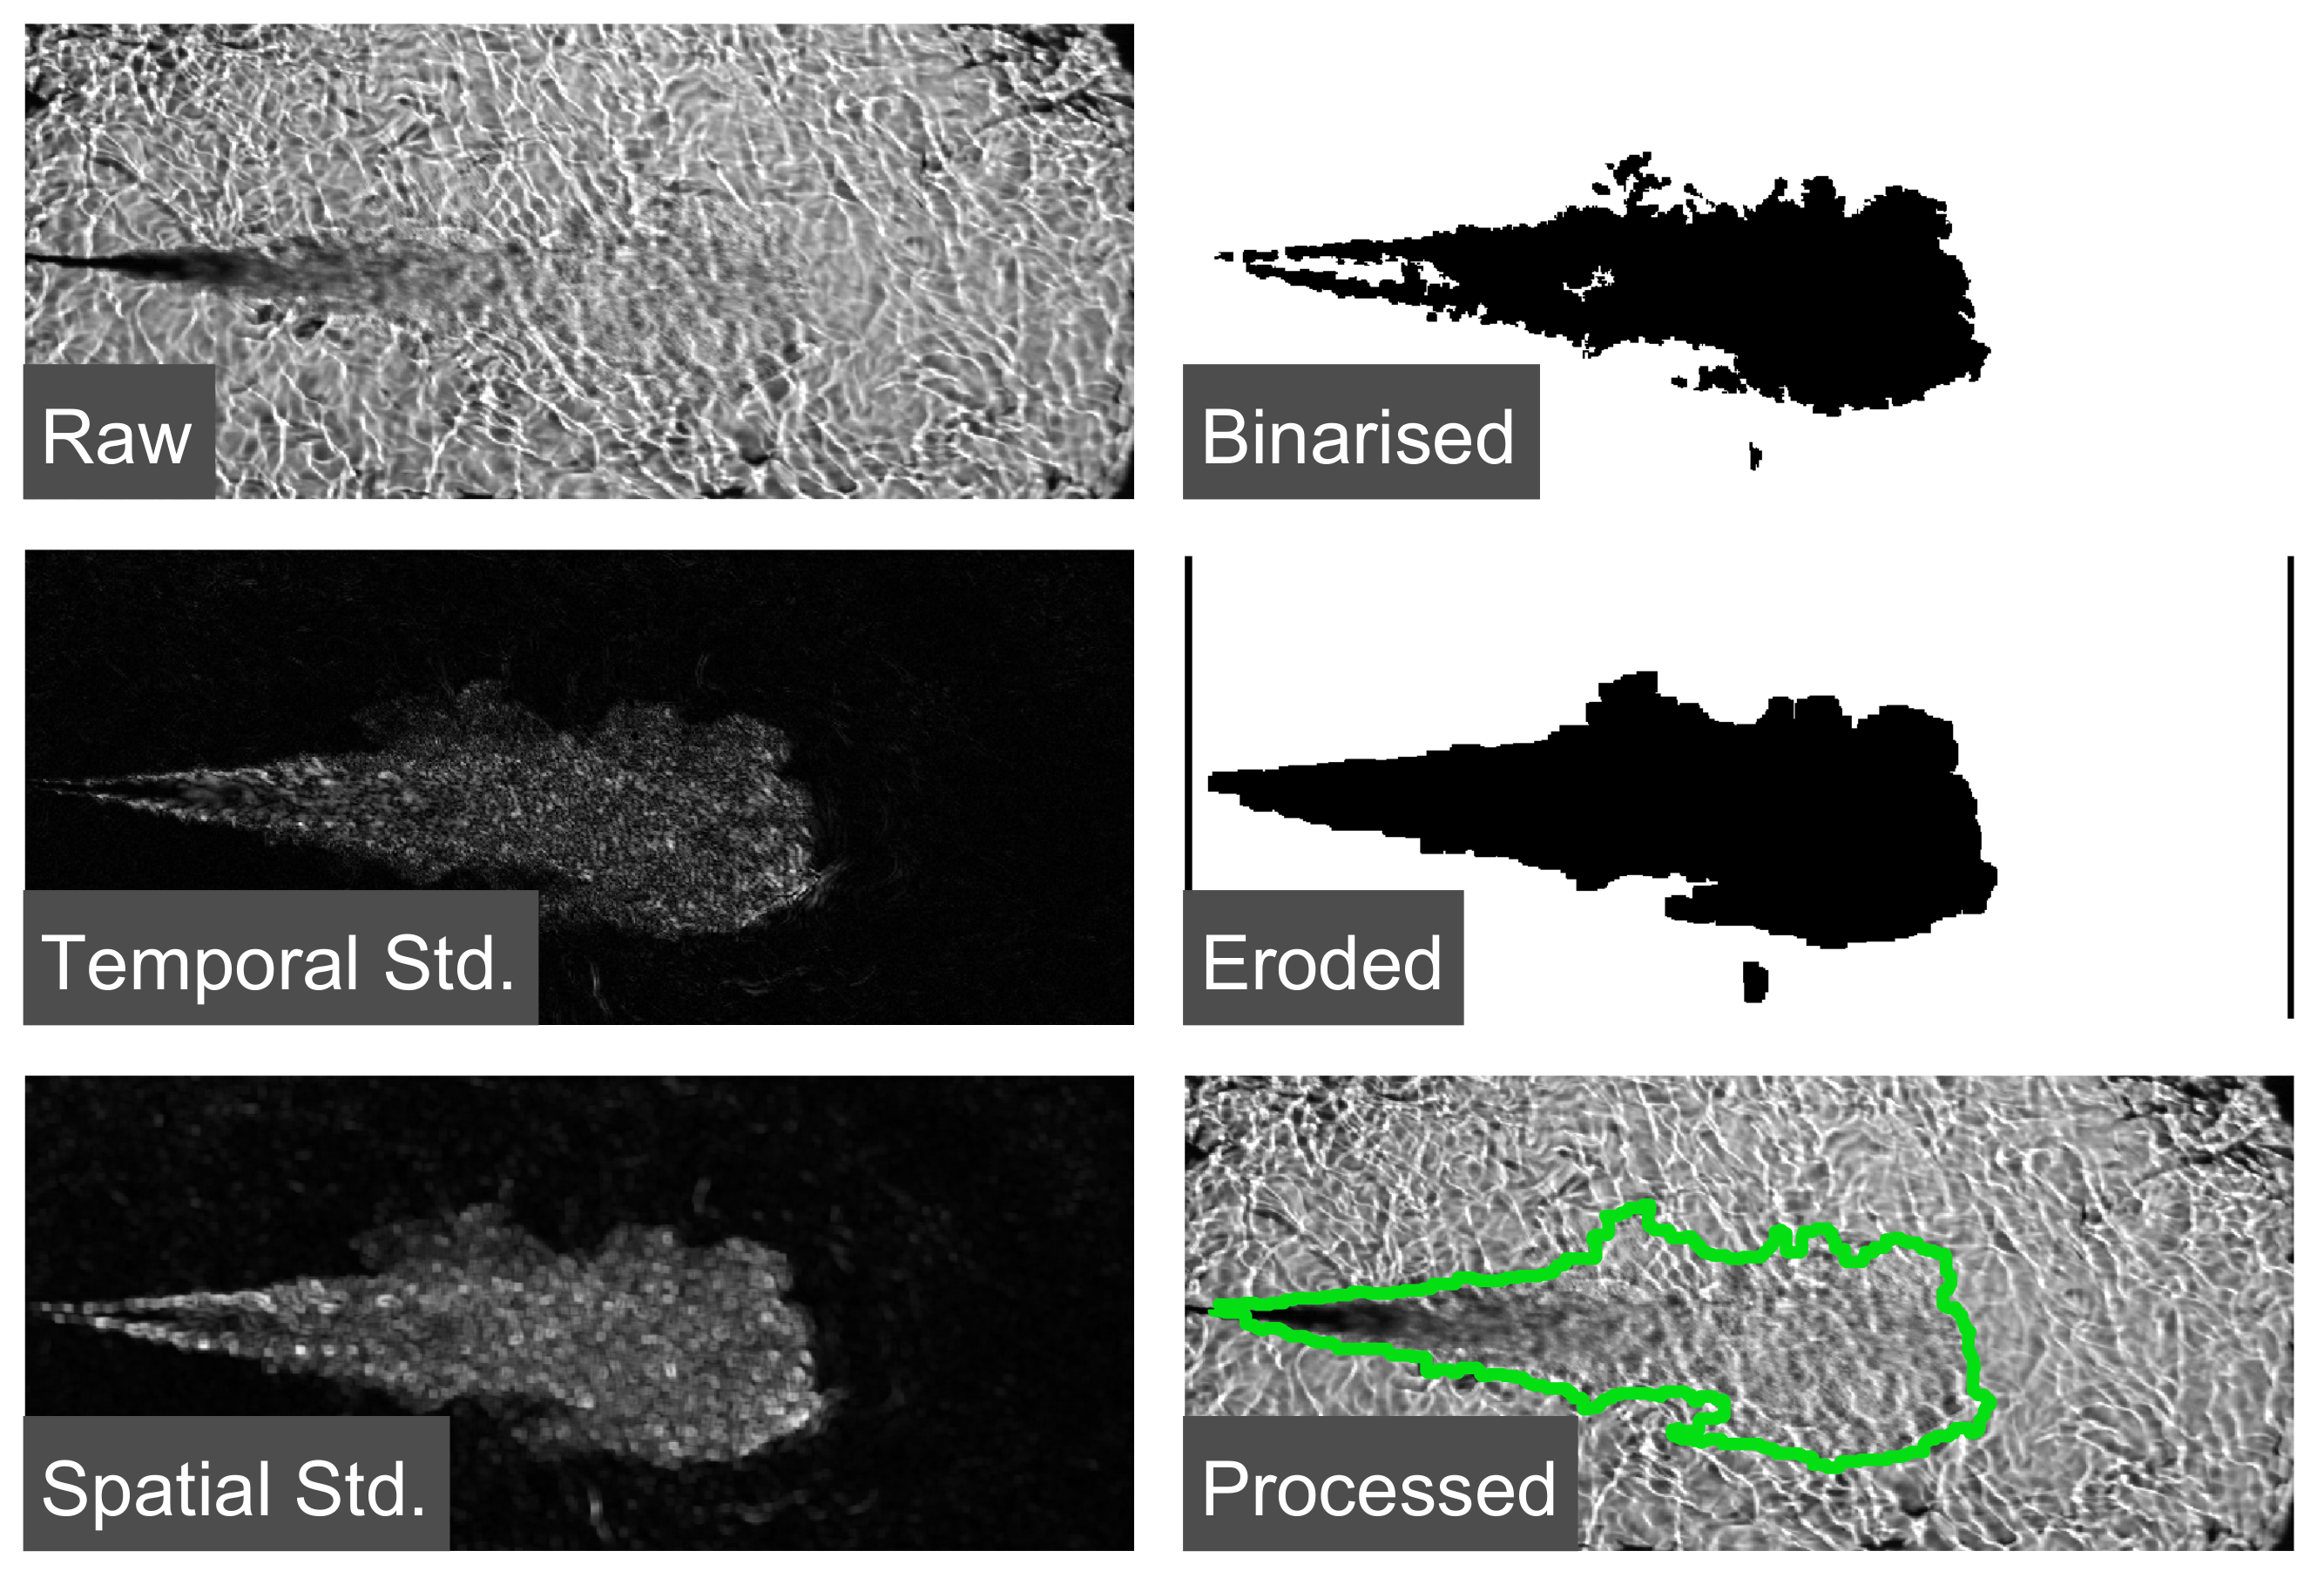
When processing the schlieren images, the methanol spray boundary was determined using a boundary-detection method adapted from Pastor et al. [18]. A temporal standard-deviation image was computed from adjacent frames and subsequently processed using a standard-deviation filter. Since the background remained relatively static, regions with high intensity contrast in the spatial standard-deviation image corresponded to the fast-moving spray boundary. Morphological operations (e.g., erosion and dilation) were then applied to reduce noise and enhance the boundary. Figure 3 illustrates the processing steps.

2.1.2. Diffused Back-Illumination

The diffused back-illumination technique was employed to measure the liquid penetration length through the attenuation of background light caused by droplet scattering and absorption. A Xenon arc lamp coupled with a holographic diffuser sheet (203.2 × 203.2 mm, 20° diffusing angle, Edmund Optics) provided uniform illumination, and the spray was recorded using a Phantom VEO high-speed camera equipped with a Nikon-Nikkor 85 mm lens. Image processing followed the method of Refs. [19,20], in which intensity values were converted into optical thickness ( K L ) values:
K L = ln I I 0
where I and I 0 represent the transmitted intensity with spray and the background intensity without spray, respectively. Extinction was calculated pixel-by-pixel from the intensity ratio to generate a two-dimensional K L map. The axial extinction profile was then analysed following Ref. [20] with liquid length derived by extrapolating the downstream decay slope of the profile to the point where extinction reached zero. The near-nozzle region affected by beam steering was excluded from the analysis.

2.1.3. OH* Chemiluminescence

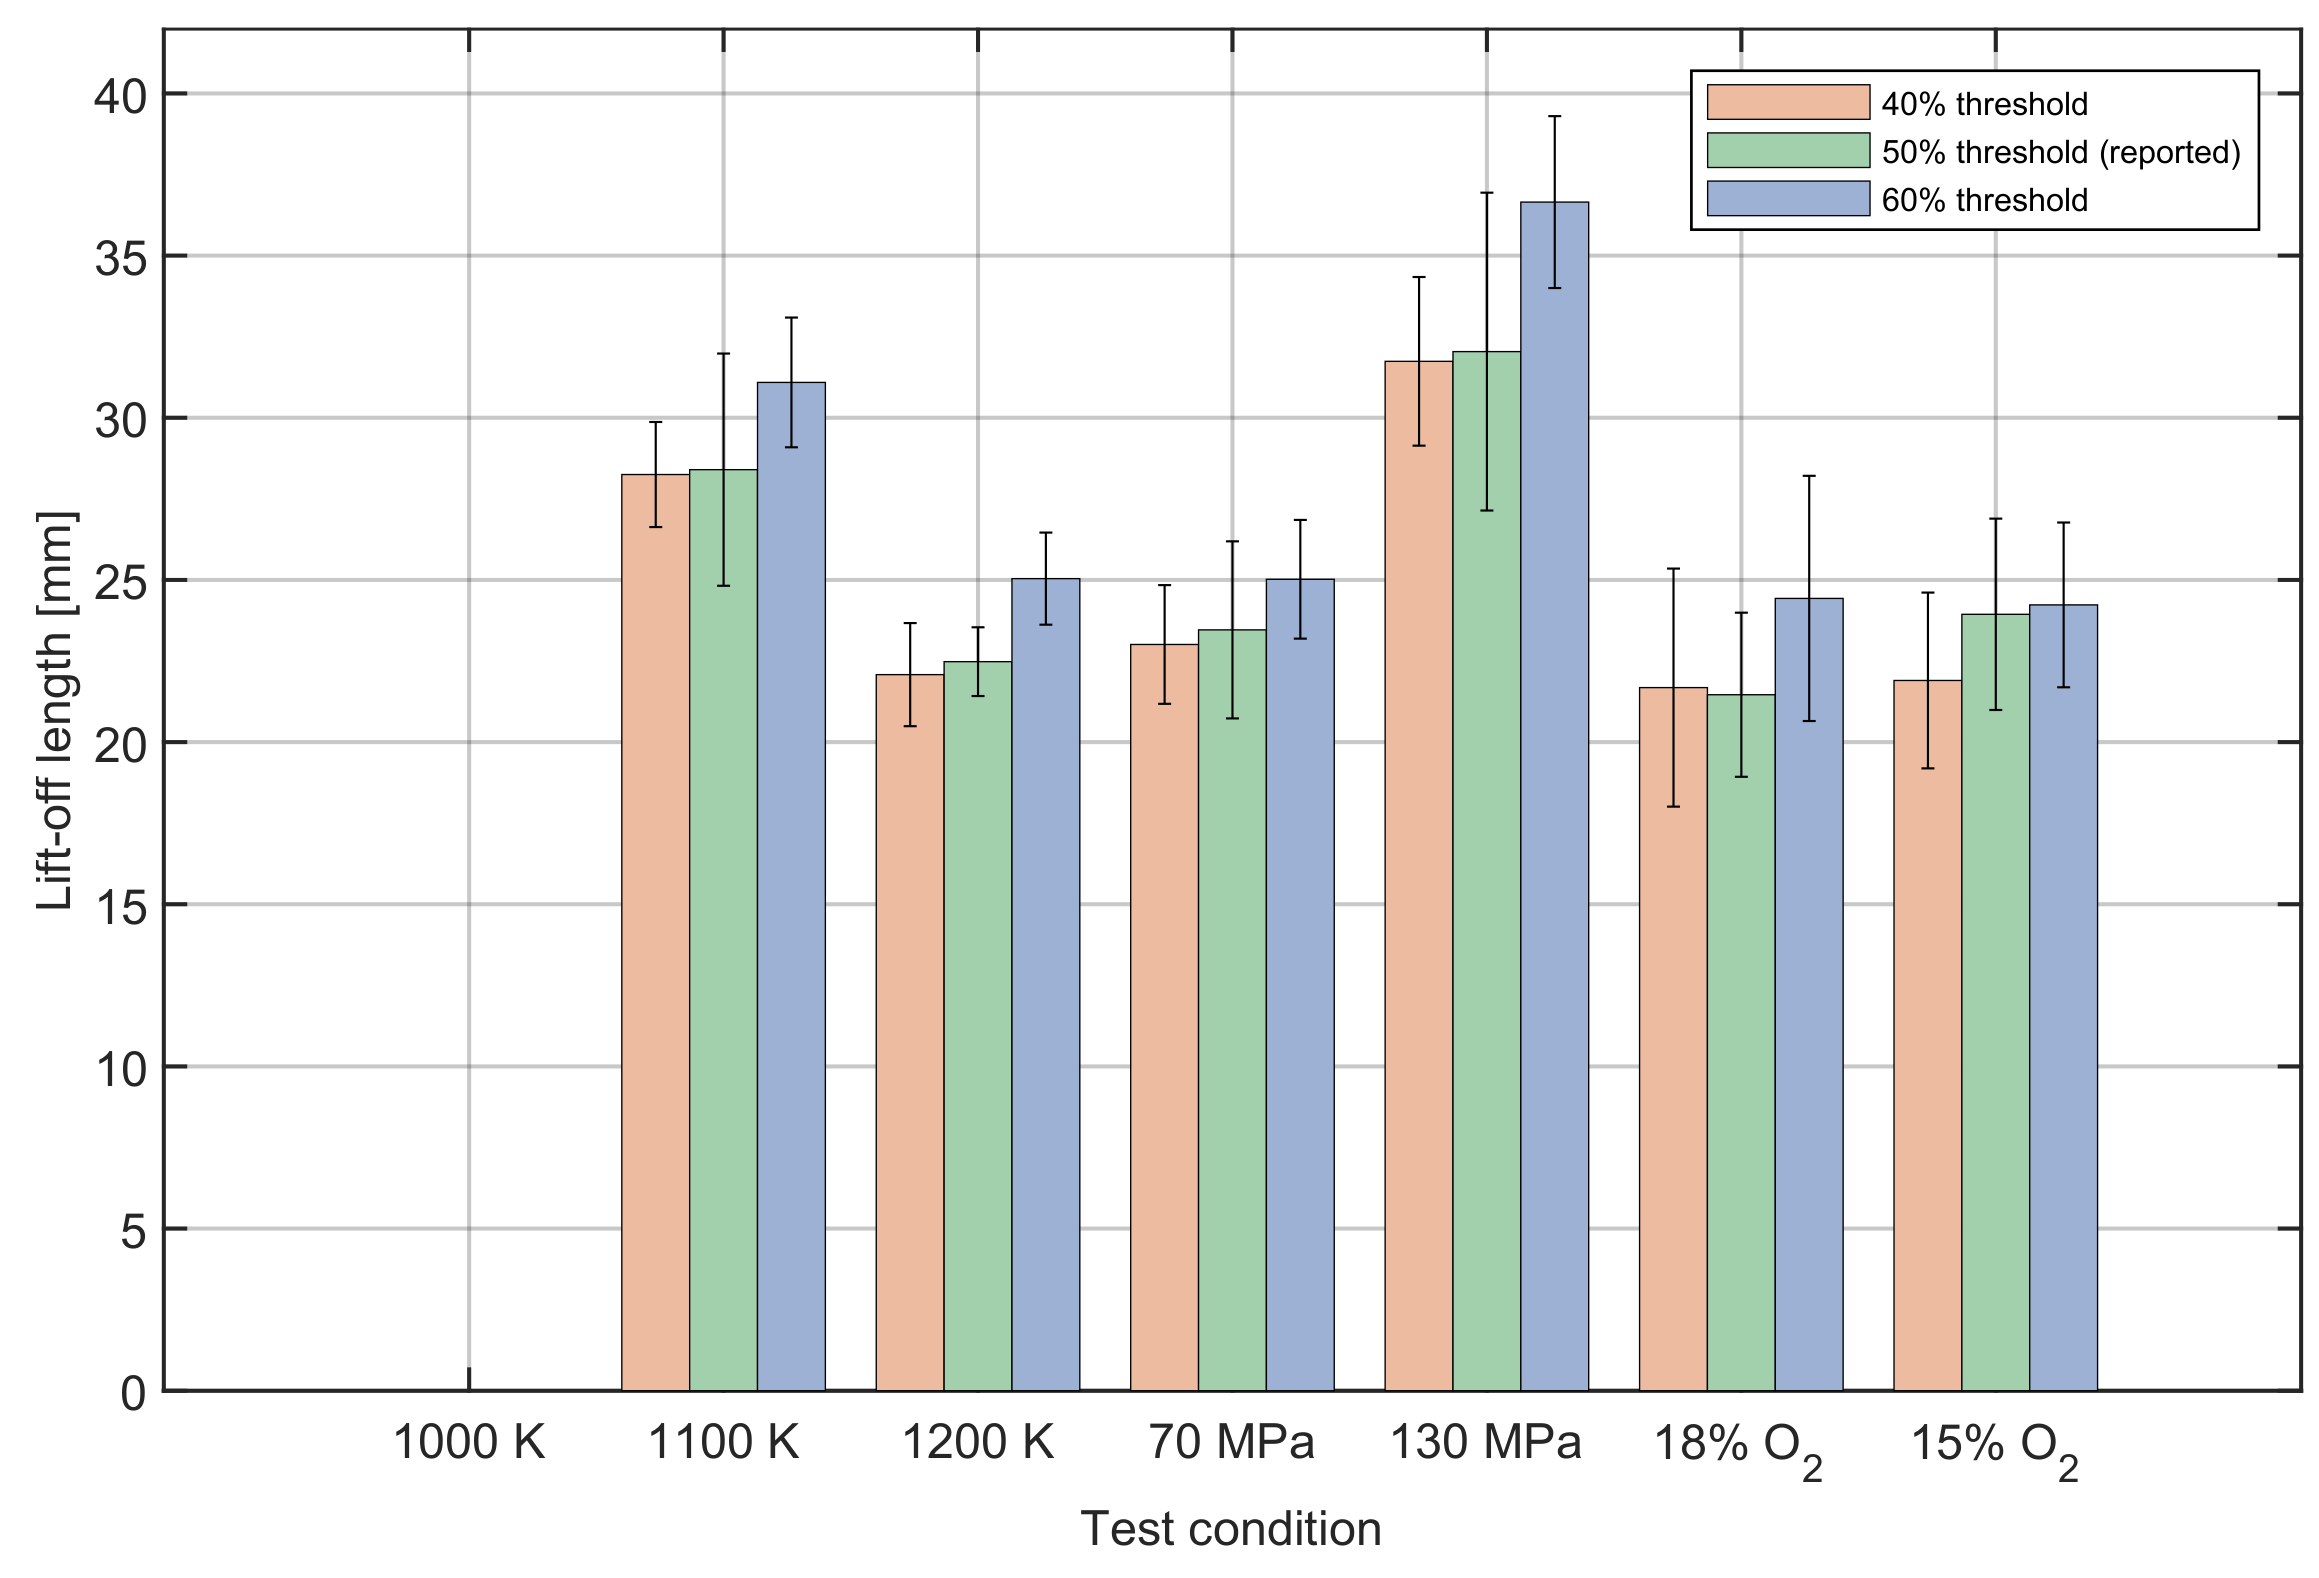
OH* chemiluminescence imaging was performed using an intensified charge-coupled device (ICCD) camera (Andor iStar) with a 50-mm f#3.5 UV lens and a 310-nm band-pass filter to suppress off-band emissions. The corresponding pixel resolution was 0.13 mm/pixel. Based on prior studies [21,22], 2 ms gate width was used to average turbulence at the lift-off length while maintaining a good signal-to-noise ratio. The ICCD camera delay and gate width were adjusted to capture the flame during the later combustion stage (5–7 ms after the start of injection), avoiding the initial injection period when the flame may still be developing, as well as the end-of-injection transients. The lift-off length was determined following the commonly adopted approach in engine-combustion studies [23]: after background correction, the lift-off point on each side of the spray axis was identified as the axial location where intensity first exceeded 50% of the maximum value, measured from the injector outlet, and the lift-off length was taken as the average of these two axial distances. A 50% threshold was selected for the present study, as it is the value widely adopted in the engine-combustion literature. To assess the sensitivity of the results to this choice, additional analyses were performed (Appendix A.2). These analyses showed that, although the absolute values varied, the overall trends remained unchanged, providing confidence that the findings are not sensitive to the selected threshold.

2.1.4. Pressure Trace and Apparent Heat Release Rate

Pressure traces were recorded at 200 kHz during the premixed combustion and cooling periods using a Kistler 6052C piezoelectric transducer with a 5015A amplifier. Fuel was injected into the chamber during the cooling phase once the required ambient conditions were reached. The pressure trace was processed using established methodologies and thermodynamic property assumptions consistent with those widely reported in the diesel combustion literature. The pressure filtering, background pressure correction procedure, and heat-release analysis formulation were selected based on approaches that have been extensively applied and validated in previous studies [24,25,26]. The raw pressure signal was smoothed using a Savitzky–Golay filter, and heat-loss effects were corrected using a background pressure-correction method reported in the literature [24,25]. An exponential decay fit was used to model the chamber pressure drop, and subtracting this fit from the measured trace yielded the net pressure rise from ignition and combustion. The apparent heat release rate (AHRR) was then calculated from the corrected pressure. The governing equations and the associated simplifications used in the heat-release analysis follow standard formulations that are well documented in the literature (e.g., [26]) using the following equation:
d Q d t = γ γ 1 P d V d t + 1 γ 1 V d P d t
where Q is the heat energy released during combustion; γ is the ratio of specific heats; P is the instantaneous chamber pressure; d V d t is the rate of change of chamber volume over time; V is the chamber volume; and d P d t is the rate of change of chamber pressure over time. The value of γ is typically set to 1.35, estimated using a second-order correlation with temperature, as in Ref. [27]. Since the volume inside the CVCC remains constant, the d V d t term becomes zero, simplifying the equation to:
d Q d t = 1 γ 1 V d P d t

2.2. Fuel Injection Systems

As noted in the introduction, the study comprises two parts. In the first, methanol autoignition experiments were conducted using a commercial solenoid-activated Bosch common-rail injector. The orifices of the original multi-hole nozzle were laser-welded closed. A single coaxial orifice of 0.180 mm was then laser-drilled onto the nozzle, with the geometry verified by computed tomography scanning. Fuel delivery was controlled by a Zenobalti ZB-5100 injector driver and supplied by a high-pressure pneumatic pump (Tarek, 250 MPa maximum). The injector was centrally mounted for horizontal-axis injection.
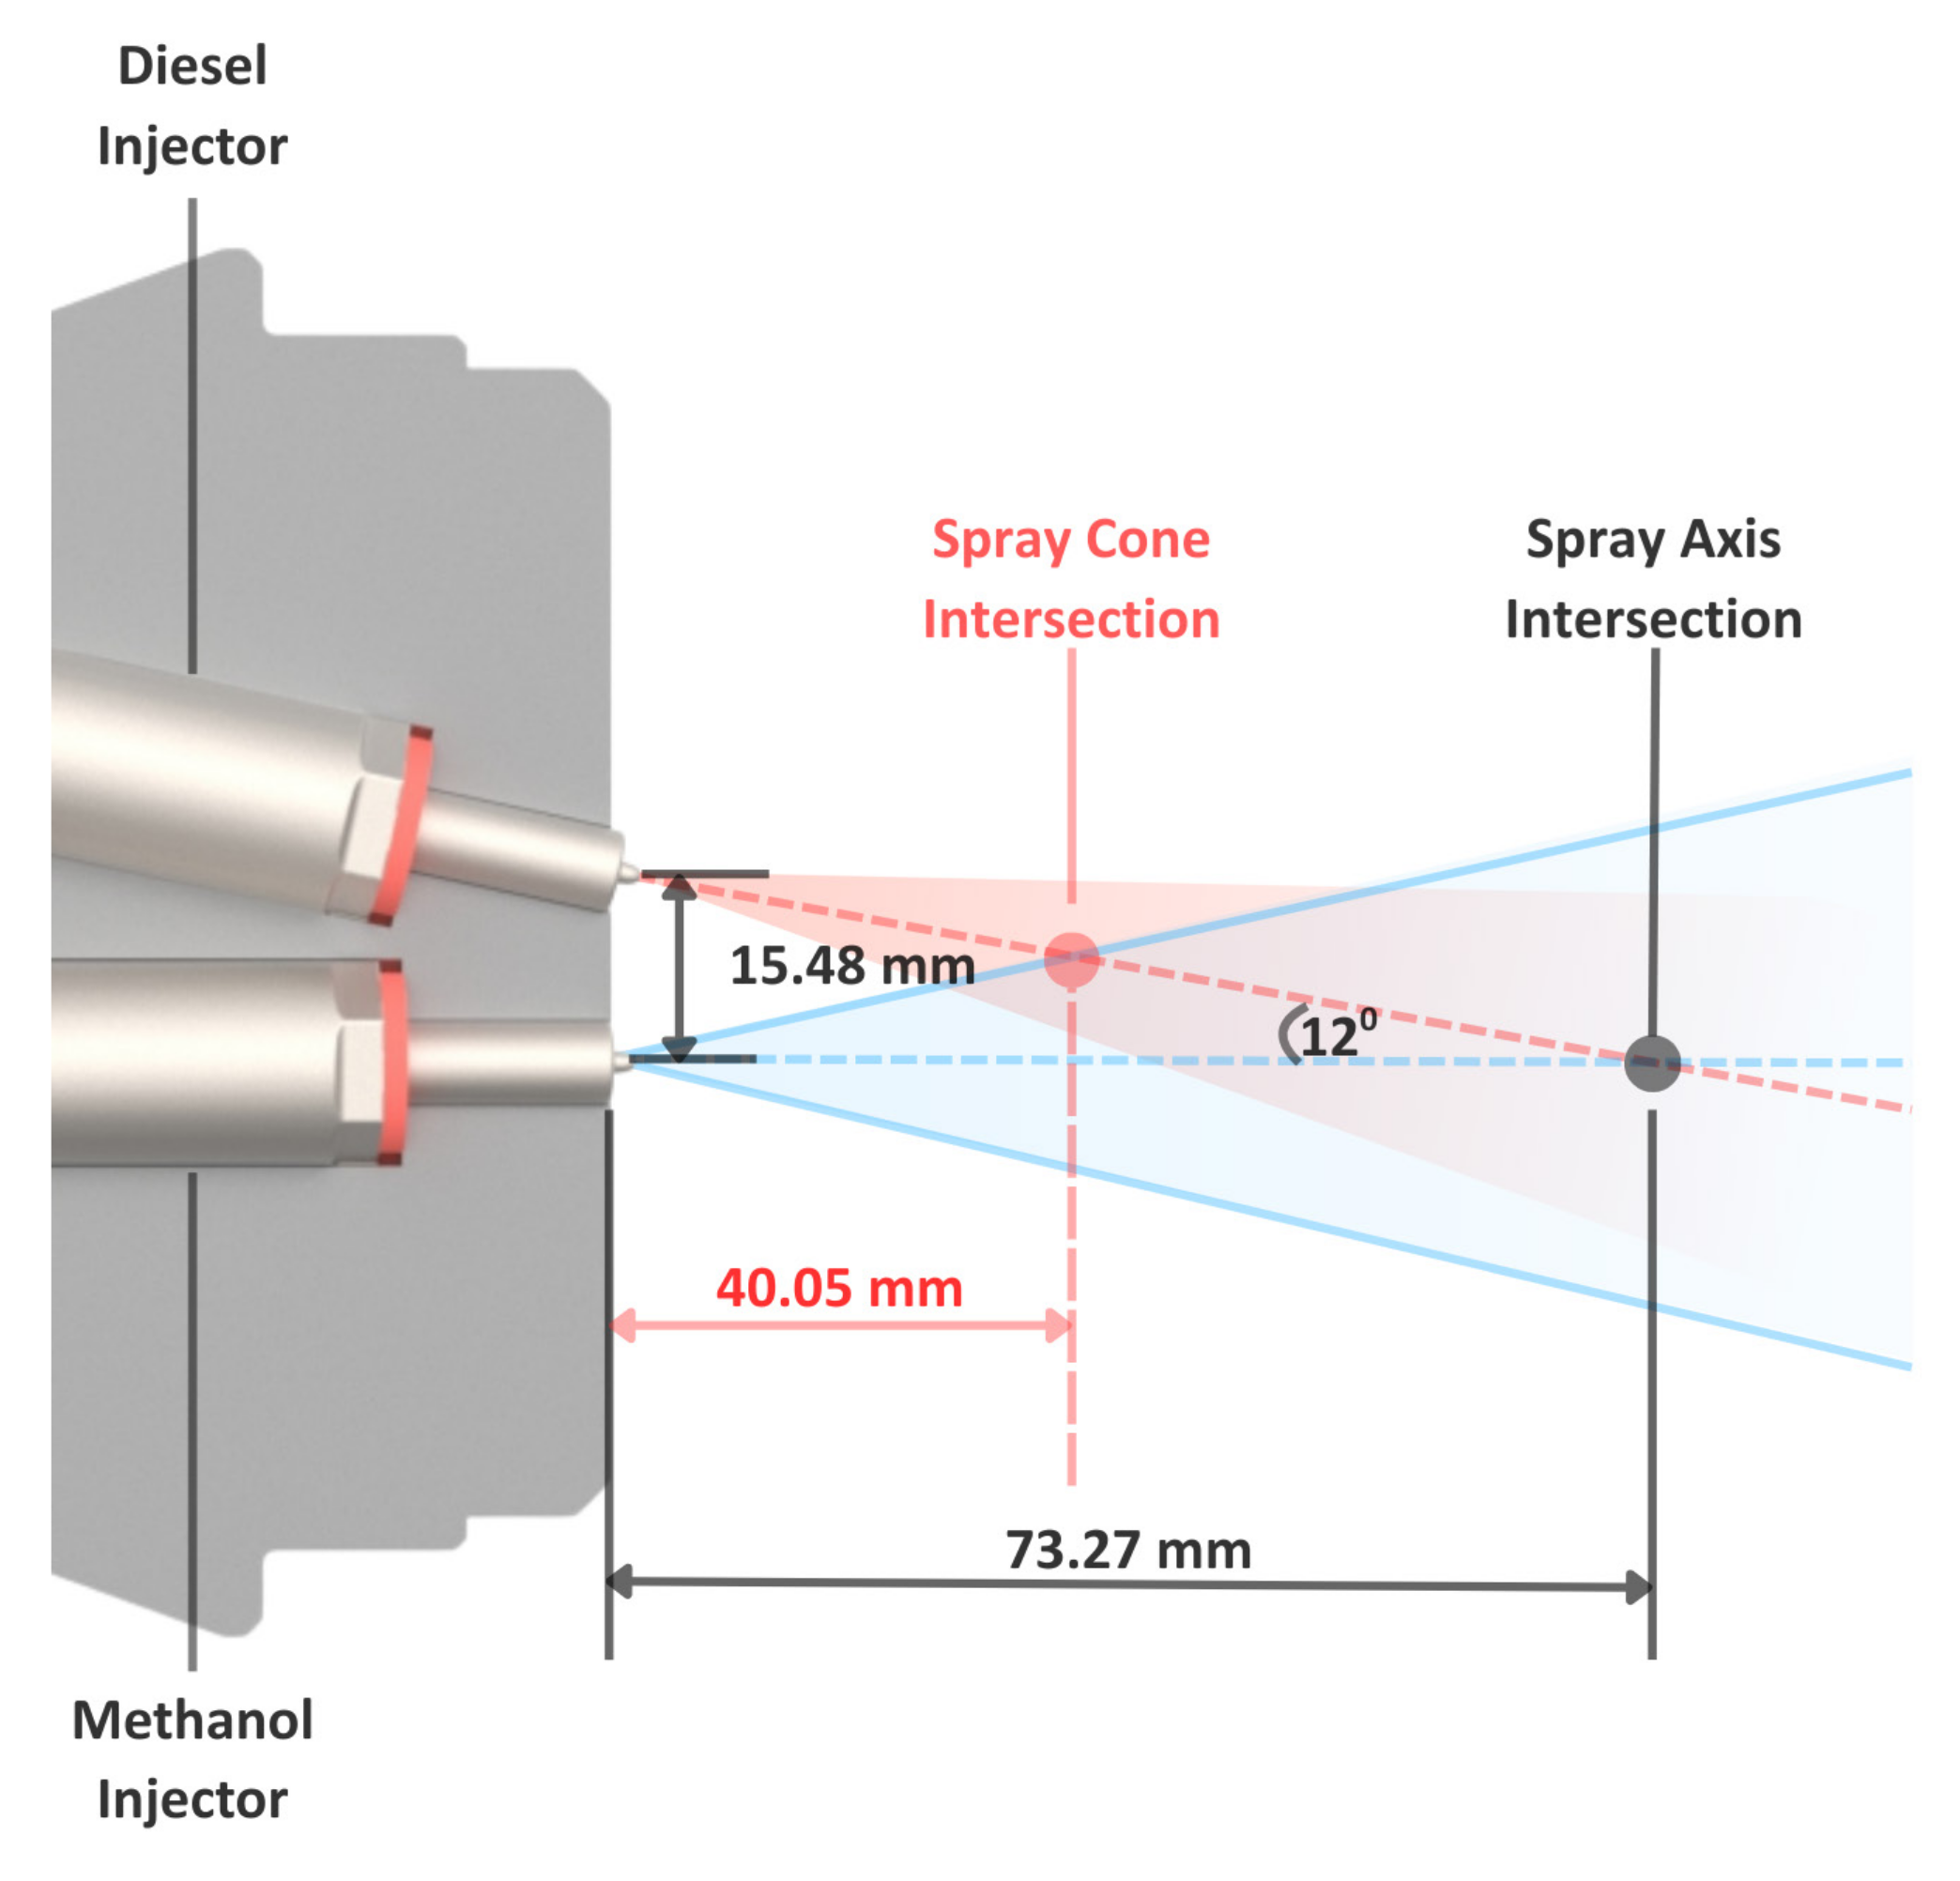
The second part employed a dual-fuel configuration in which a pilot jet was used to ignite the methanol spray. n-Heptane was used as the diesel surrogate, as it is commonly adopted in engine studies due to its well-characterised kinetics [26,28]. The methanol injector, nozzle, and driver were identical to those used in the autoignition tests. A second Bosch injector, modified in the same manner to produce a single coaxial orifice of 0.082 mm, delivered the pilot fuel. n-Heptane delivery was controlled by a separate Zenobalti ZB-5100 injector driver and a dedicated, identical high-pressure pump. Both injector drivers were synchronised using a DG-535 digital timing generator. Figure 4 shows the configuration, with the two injectors arranged in a 12° converging orientation and the methanol injector also being centrally mounted. Single-orifice coaxial-hole injectors were used in both cases to simplify diagnostics and interpretation.
The injection rate was measured with a Bosch tube-type analyser [29,30]. The measuring tube was pressurised with test fuel to match the chamber back pressure during injection [29]. At the reference injection pressure and ambient conditions, the injected mass was 68.73 mg. Only minor variation (68.52–69.81 mg) was measured when the back pressure was adjusted to simulate the tested range. Varying the injection pressure to 70 MPa and 130 MPa against a fixed reference back pressure changed the injected mass to 58.36 mg and 75.43 mg, respectively.

2.3. Test Matrix

In the first part of the study, methanol (99.98% purity) autoignition was investigated under reference conditions: 100 MPa injection pressure, 1100 K ambient temperature, 21 vol.% ambient O2 and an ambient density of 23.3 kg/m3. An electronic injection duration of 10 ms (hydraulic duration: 10.98 ms) was specified to allow sufficient time for assessing the flame development trend. Parametric variations were introduced by changing only the parameter of interest while holding all others at reference. Three injection pressures (70, 100, and 130 MPa), three ambient temperatures (1000, 1100, and 1200 K, corresponding to trigger pressures of 6.0, 6.6, and 7.1 MPa), and four O2 concentrations (21 vol.%, 18 vol.%, 15 vol.%, and 0 vol.%) were tested to capture both reactive and non-reactive cases. The injection pressure range (70–130 MPa) extends beyond the lower values used in earlier work [11,12], thereby better representing the modern engine operating range. The selected temperature range reflects values commonly examined in earlier methanol autoignition studies, with the lowest condition (1000 K) being of particular interest, given conflicting reports of autoignition characteristics [11,12,15]. The variation in O2 concentration (reactive) from 21 vol.% to 15 vol.% was chosen to replicate conditions from undiluted air to exhaust gas recirculation-diluted mixtures. It is noted that these conditions are not intended to reproduce a specific engine operating point but to isolate methanol’s fundamental ignition behaviour under controlled, engine-relevant conditions. During the experiments, the injection duration was intentionally held constant during pressure sweeps to focus on flame behaviour under comparable injection times rather than equal injected energy. A constant density was also maintained while varying temperature and pressure—a standard CVCC practice—to isolate temperature effects without altering jet development or mixing.
In the second part, n-heptane was used as a diesel surrogate to ignite the methanol jet. Dual-fuel processes are well-documented to depend on injector configuration, injection sequence, fuel energy share, and ambient conditions, with coupling among these factors [16]. To control these effects, the injector configuration was kept constant, and both fuels were injected simultaneously. The effect of the pilot-fuel energy share was examined by injecting n-heptane (95% purity) at 100 MPa with electronic injection durations of 0.6, 1.0, and 1.5 ms (hydraulic injection durations: 1.26, 2.15, and 2.70 ms). These settings produce n-heptane energy shares of 3.60%, 7.75%, and 9.54%, respectively, with the remainder coming from the methanol jet, which was injected at 100 MPa. These values were estimated from the products of the injected fuel masses and their lower heating values. The ambient conditions were fixed at 1000 K, and 21 vol.% O2. Table 2 summarises the full test matrix.

3. Results and Discussion

The results and discussion are organised into four sections. First, methanol spray characteristics, specifically the liquid penetration length, are presented. Second, general trends in ignition delay and lift-off length are examined across different test conditions. This is followed by parametric variation cases, where ignition, combustion, heat-release characteristics, and flame behaviour are analysed. The final subsection addresses methanol-pilot fuel dual-fuel operation at 1000 K for three pilot fuel injection durations. For each diagnostic, at least ten experimental runs were performed to ensure data statistical reliability.

3.1. Methanol Spray Characteristics

The liquid length of the non-reacting methanol spray was also measured using diffused back-illumination at ambient temperatures of 1000, 1100, and 1200 K, conditions expected to have the strongest influence on liquid length, as summarised in Table 3. The results show a decreasing liquid length with increasing ambient temperature, consistent with the expectation that higher gas temperatures supply more thermal energy to the entrained air, accelerating fuel vaporisation and thereby shortening the liquid length [31].

3.2. Ignition Delay and Lift-Off Length

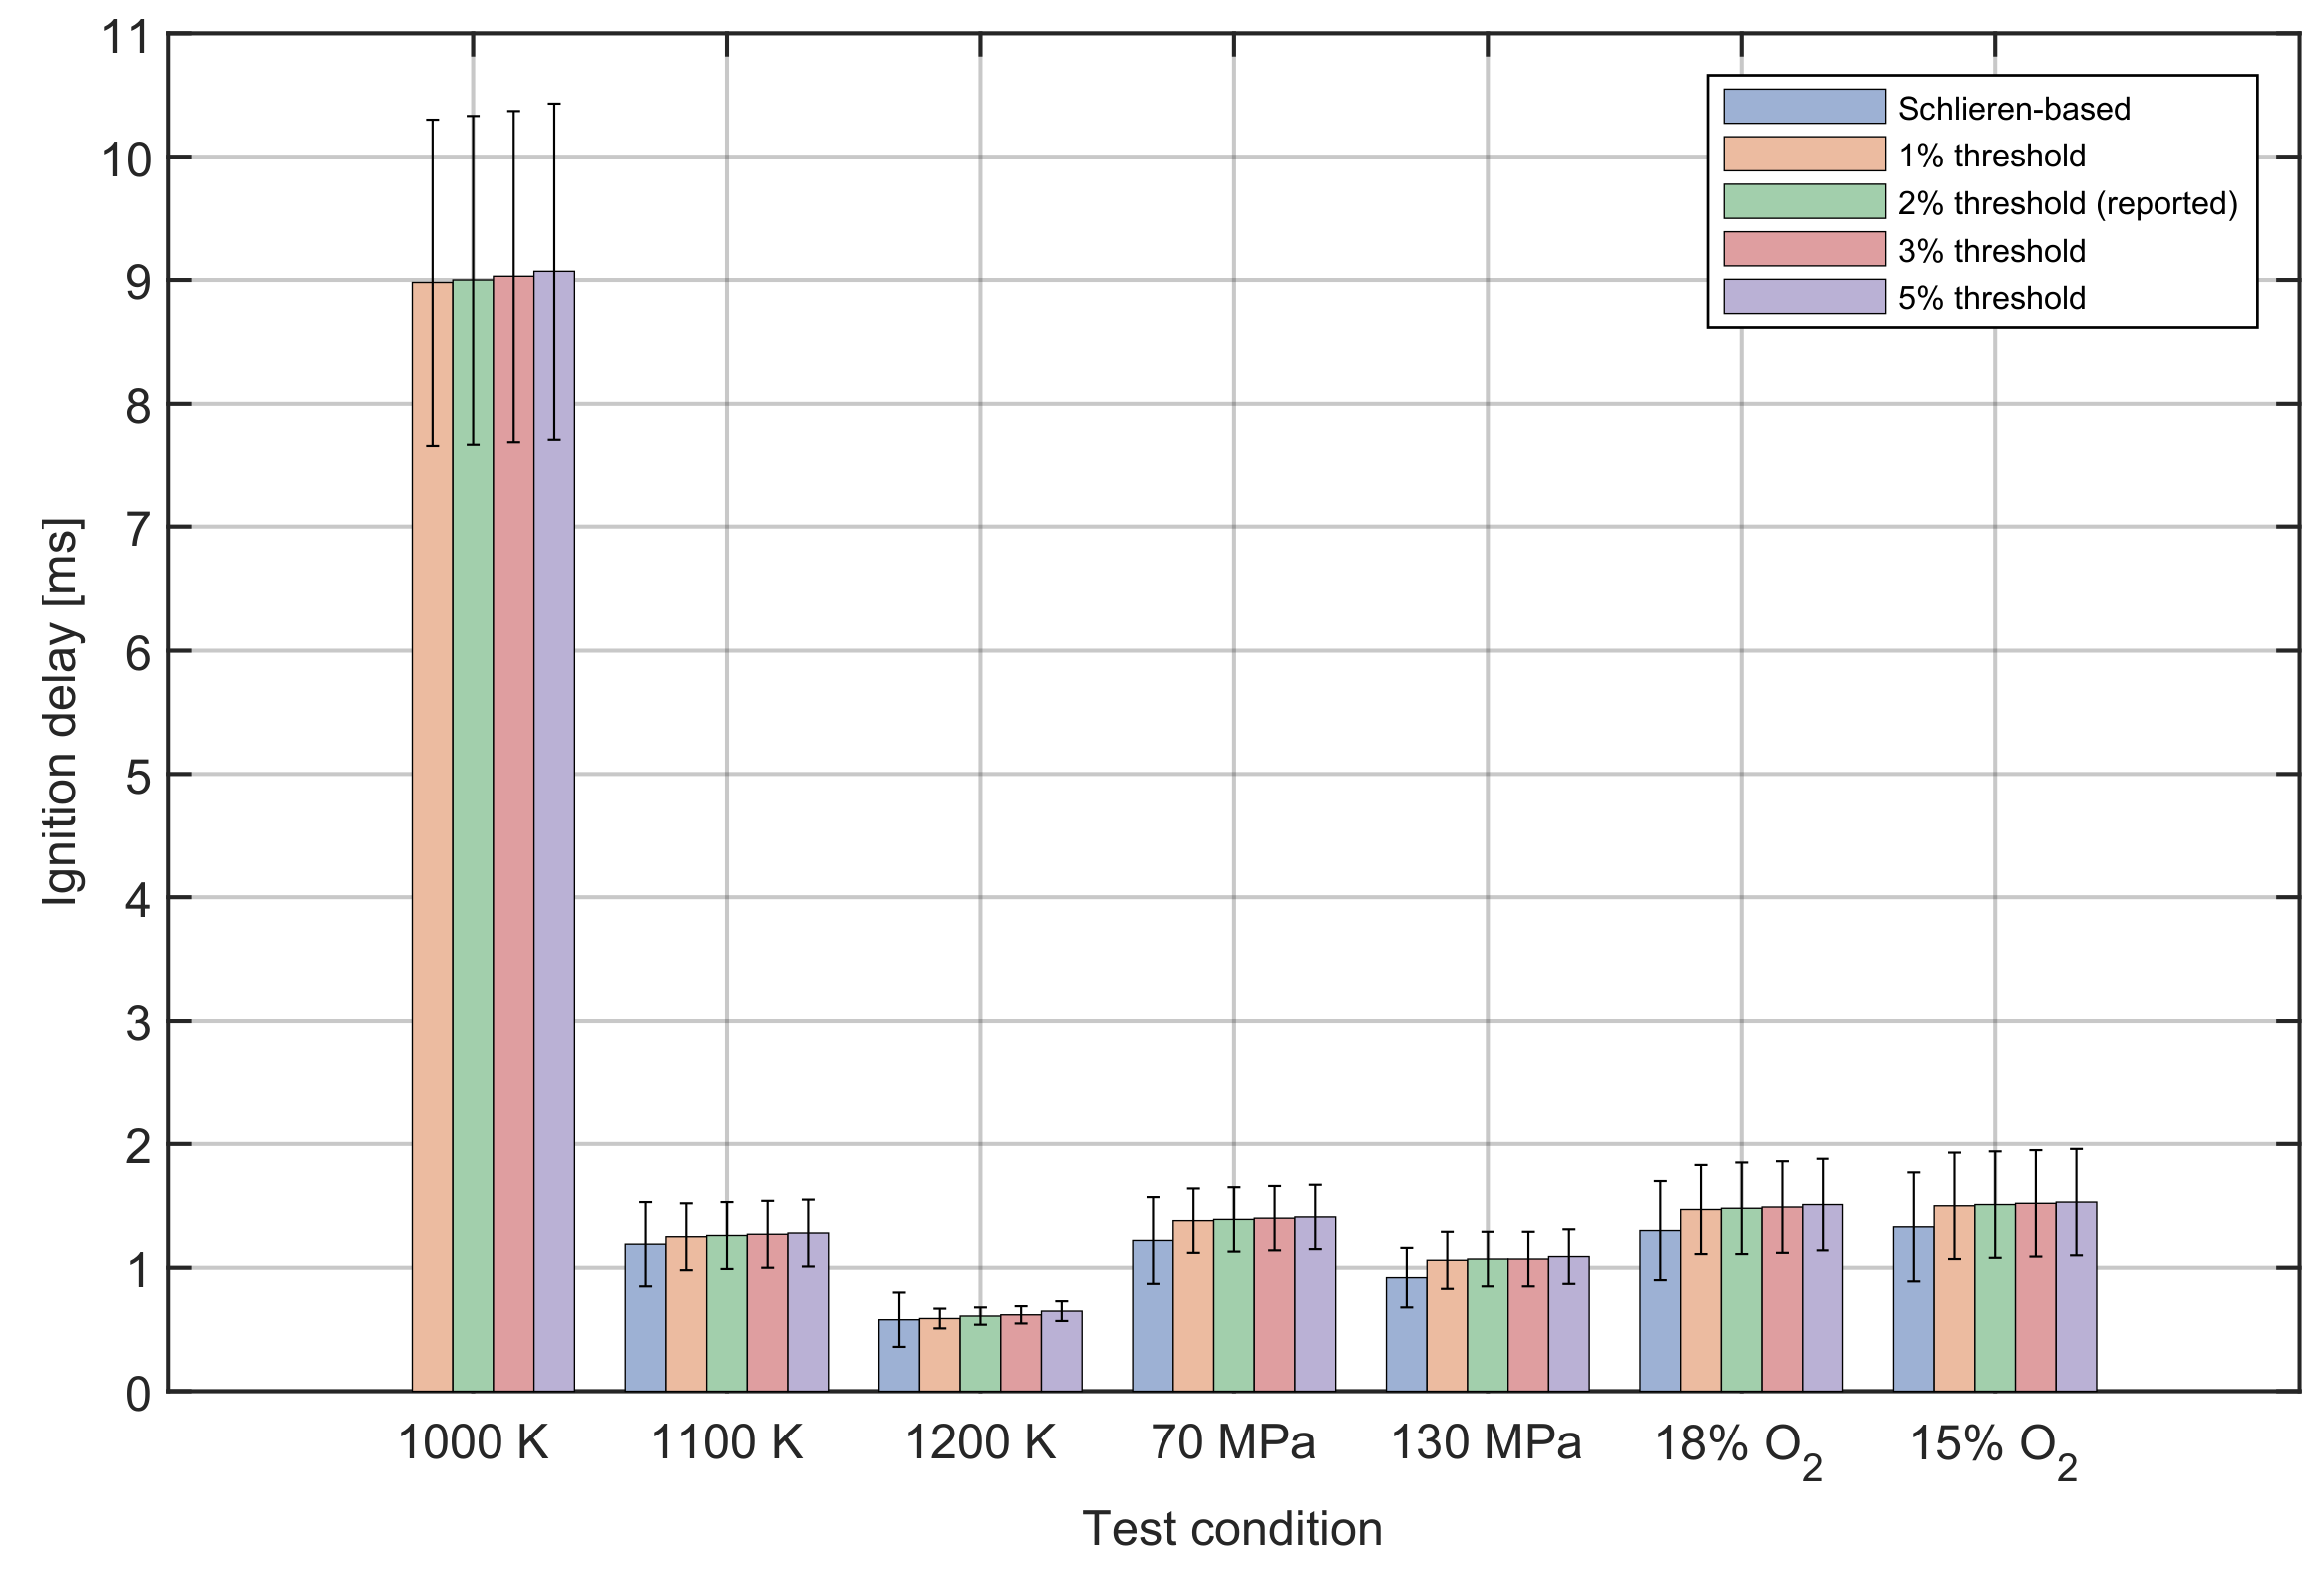
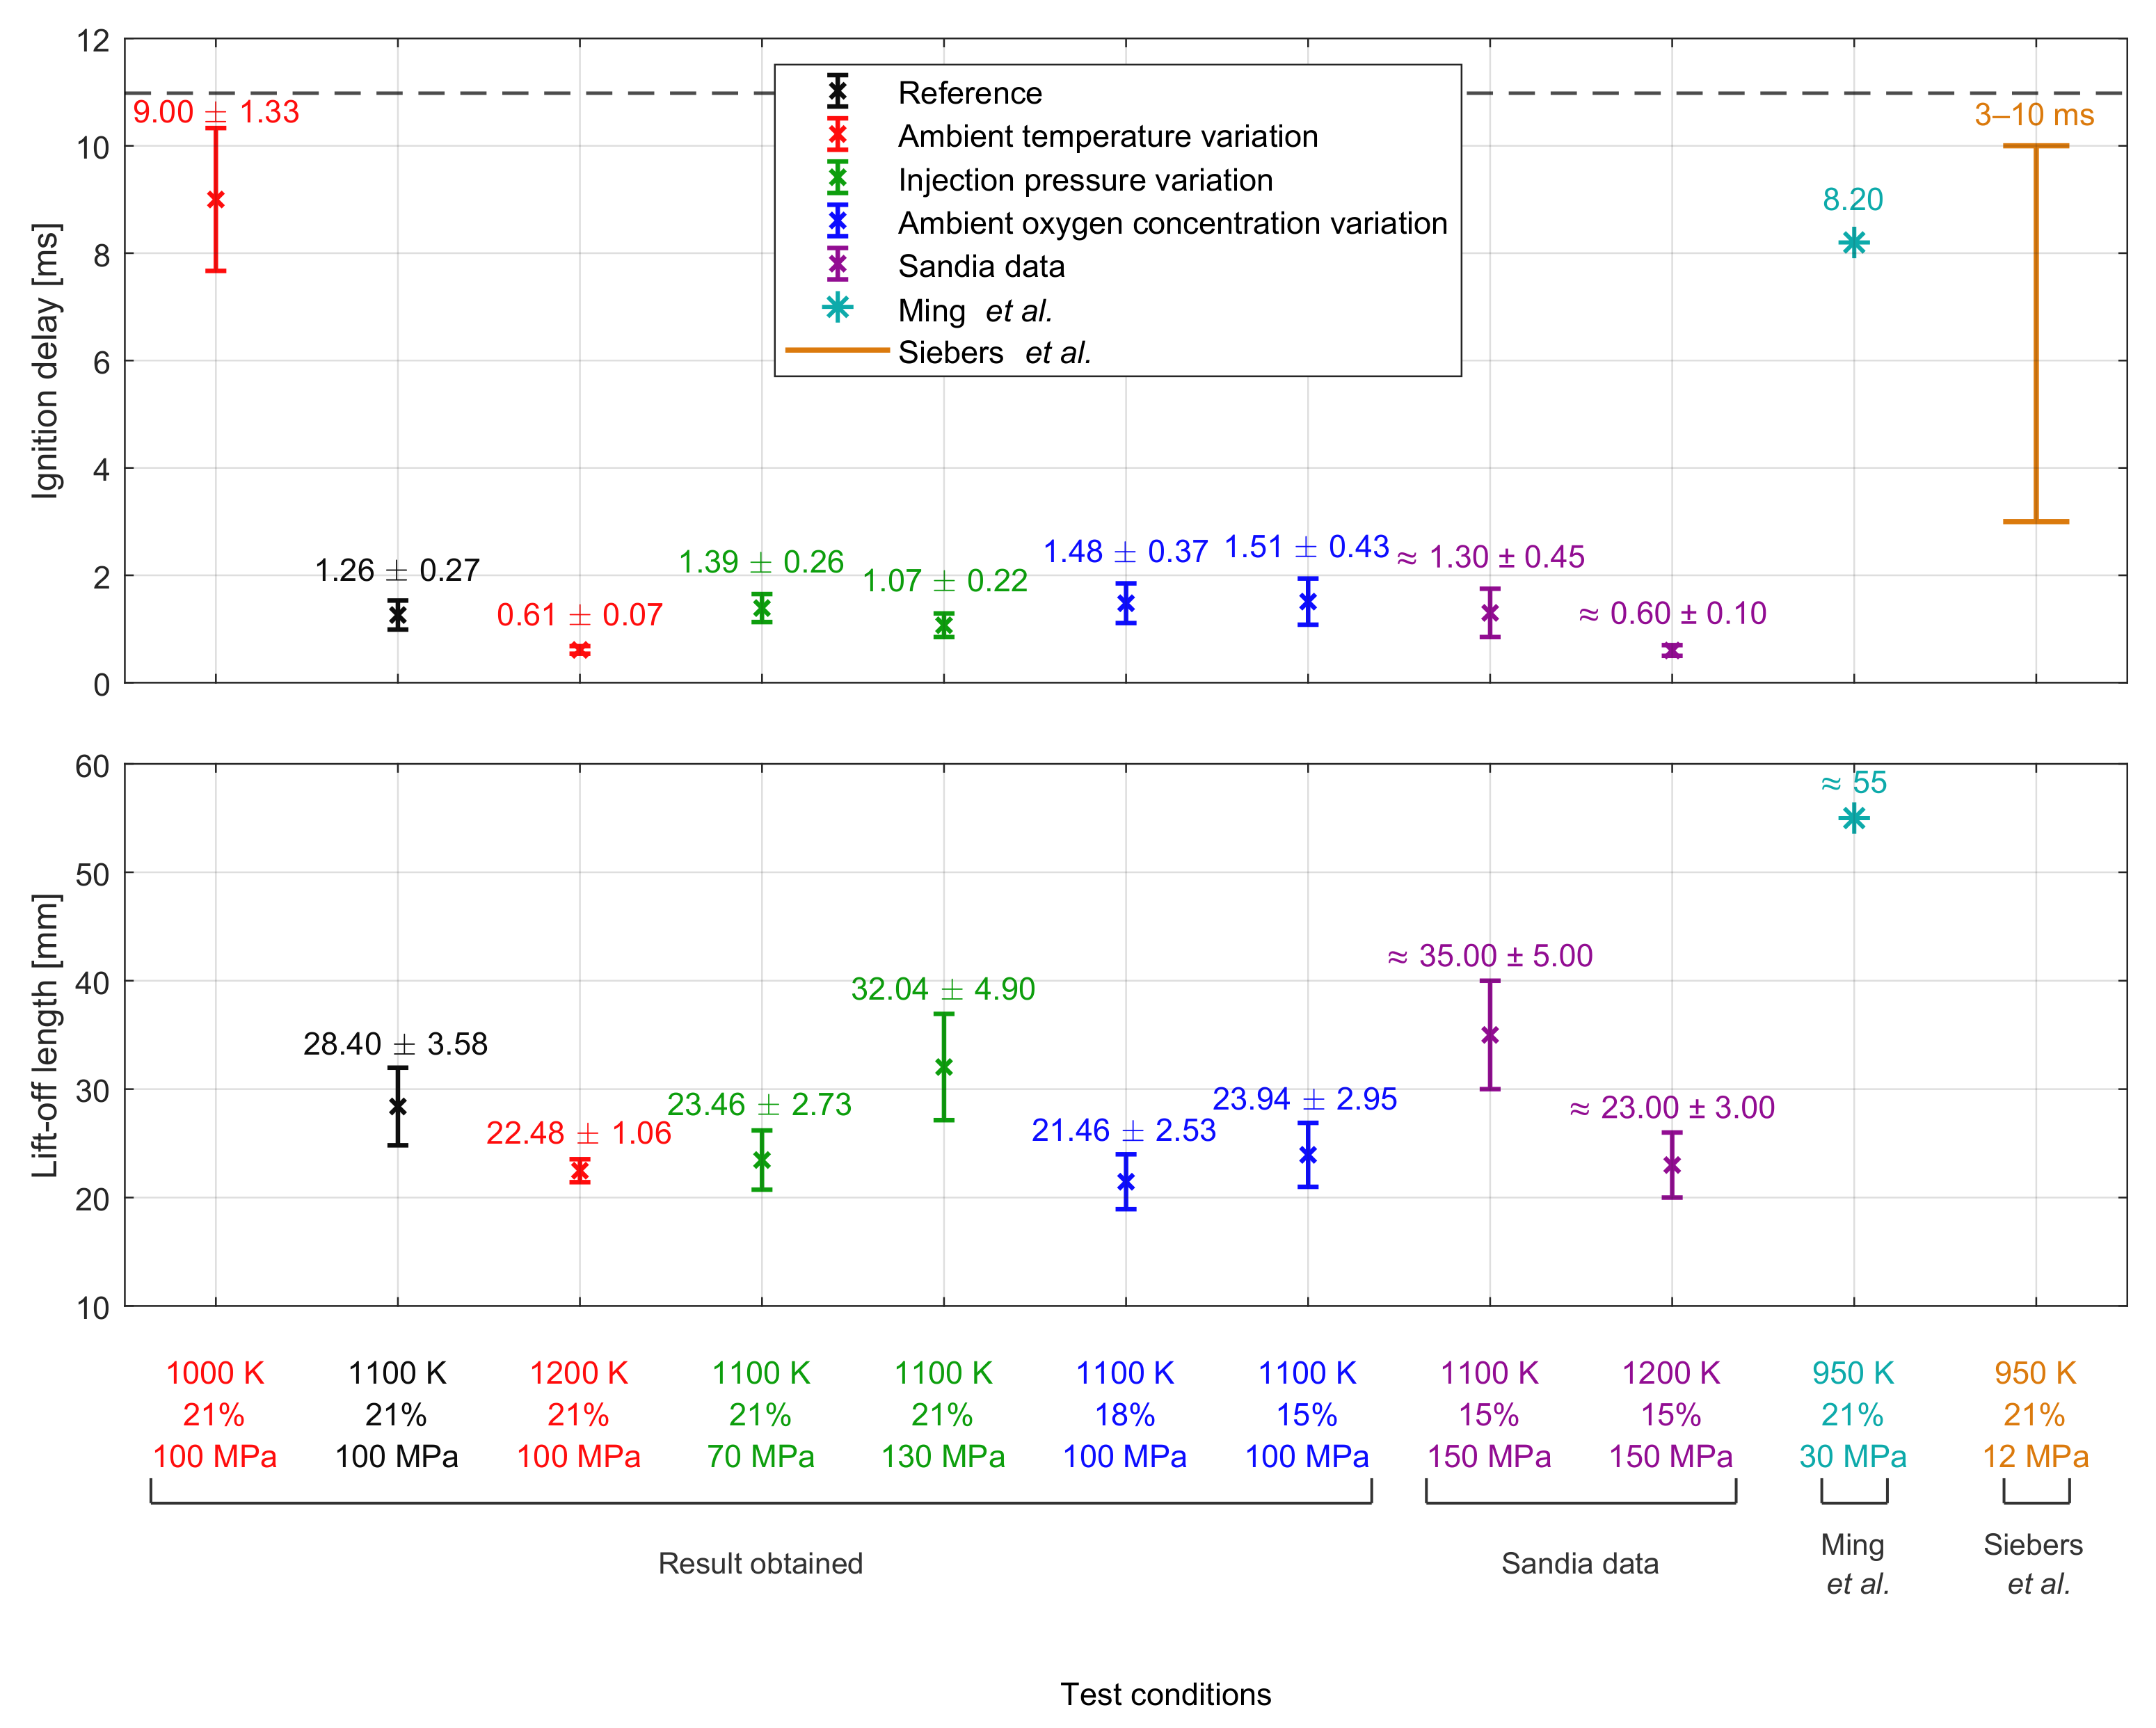
Ignition delay was determined using the pressure rise method, defined as the time after the start of injection (aSOI) when the chamber pressure exceeded a threshold equal to 2% of the total pressure rise from combustion. This threshold was selected because it reliably marked the onset of high-temperature combustion while filtering out pre-ignition noise in the pressure trace. The same pressure-based threshold criterion was applied consistently to ensure a uniform and directly comparable definition of ignition delay across the full parametric sweep. Mean ignition delays, together with run-to-run variations (one standard deviation), were obtained for all parameter variations. The results are plotted in Figure 5. It is noted that schlieren-derived ignition delays were also evaluated to check method and threshold sensitivity (sensitivity analysis presented in Appendix A.1). While absolute values differed, the trends matched, reinforcing the robustness of the reported results.
The results show that, for methanol, ignition delay decreases with increasing ambient temperature, from 1.26 ± 0.27 ms at 1100 K to 0.61 ± 0.07 ms at 1200 K . This trend is consistent with diesel-like fuels, where ignition delay follows an Arrhenius-type dependence on temperature [32]. With the variation in injection pressure, the ignition delay is 1.26 ± 0.27 ms at the 100 MPa reference, increases slightly to 1.39 ± 0.26 ms at 70 MPa, and decreases to 1.07 ± 0.22 ms at 130 MPa, showing that higher injection pressure only marginally advances autoignition. Ignition delay reflects the combined effects of physical and chemical processes: increasing injection pressure reduces the physical delay through improved atomisation, vaporisation, and mixing, whereas the chemical delay, governed mainly by fuel chemistry, temperature, and ambient pressure, is relatively insensitive to injection pressure variation [33]. For low-cetane fuels such as methanol, the longer chemical delay dominates [34], explaining the limited sensitivity to injection pressure. Regarding O2 concentration, only a small increase in ignition delay is measured with decreasing O2, with a difference of just 0.25 ms between the highest and lowest tested concentrations. Specifically, ignition delay increases from 1.26 ± 0.27 ms at 21 vol.% O2 to 1.51 ± 0.43 ms at 15 vol.%, consistent with the expected trend for diesel-like fuels [32]. Given the long injection duration, negative ignition dwell events—i.e., ignition occurring before the end of injection [35]—were observed under all tested conditions.
The lift-off length of the methanol spray was measured from OH* chemiluminescence images analysed according to the method outlined in Section 2.1.3, with the measured lift-off length values for each parametric variation plotted in Figure 5. At 1000 K, the lift-off length is beyond the field of view, while higher ambient temperature reduces it ( 28.40 ± 3.58 mm at 1100 K and 22.48 ± 1.06 mm at 1200 K). This reduction results from higher ambient temperature, which promotes faster evaporation and chemical reaction rates, shortening the ignition delay and bringing flame stabilisation closer to the nozzle [32]. With injection pressure variation, the lift-off length decreases to 23.46 ± 2.73 mm at 70 MPa, but increases to 32.04 ± 4.90 mm at 130 MPa. This increase is attributed to higher injection pressure, which increases jet velocity and momentum, pushing the flame stabilisation point further downstream [21]. For O2 concentration variation, the lift-off length decreases from the reference to 21.46 ± 2.53 mm at 18 vol.% O2 and 23.94 ± 2.95 mm at 15 vol.% O2. The lift-off length trends with the ambient temperature and injection pressure are consistent with expectations. The exception is the O2 variation, which shows a trend opposite to conventional diesel studies. This discrepancy will be examined in Section 3.3.3.
What is noteworthy is that the plots also include ignition delay and lift-off values reported in prior studies [11,12,15] for reference. It should be noted that not all values in those works are directly reported. In cases where the relevant quantity is not explicitly provided (e.g., methanol lift-off length measurement in Ref. [12]), an effort has been made to post-process the available information to infer an approximate value. Where data is not available and inference is not feasible (e.g., Ref. [11]), the corresponding point is omitted from the plot. Minor notes in the figure caption clarify which values are inferred and which are excluded. As highlighted in the introduction, the configurations and operating conditions in those studies differ from the present study; however, they remain the closest available in the literature. The ignition delay values and their overall trends are reasonably comparable. In terms of lift-off lengths, the values obtained in the present study exhibit trends that align with expectations based on the tested parametric variations. When compared against prior studies, the closest matching conditions are those at 1100 K with 15 vol.% O2. Under these conditions, the lift-off lengths measured here can be compared with the data reported at the ECN workshop (also 1100 K and 15 vol.% O2). The lift-off lengths from the present study are shorter than the ECN reported values [15]; however, it is important to note that the injection pressure used in the ECN dataset is approximately 50 MPa higher than that employed in the current study, which would be expected to influence the lift-off behaviour.

3.3. Combustion and Heat Release Characteristics

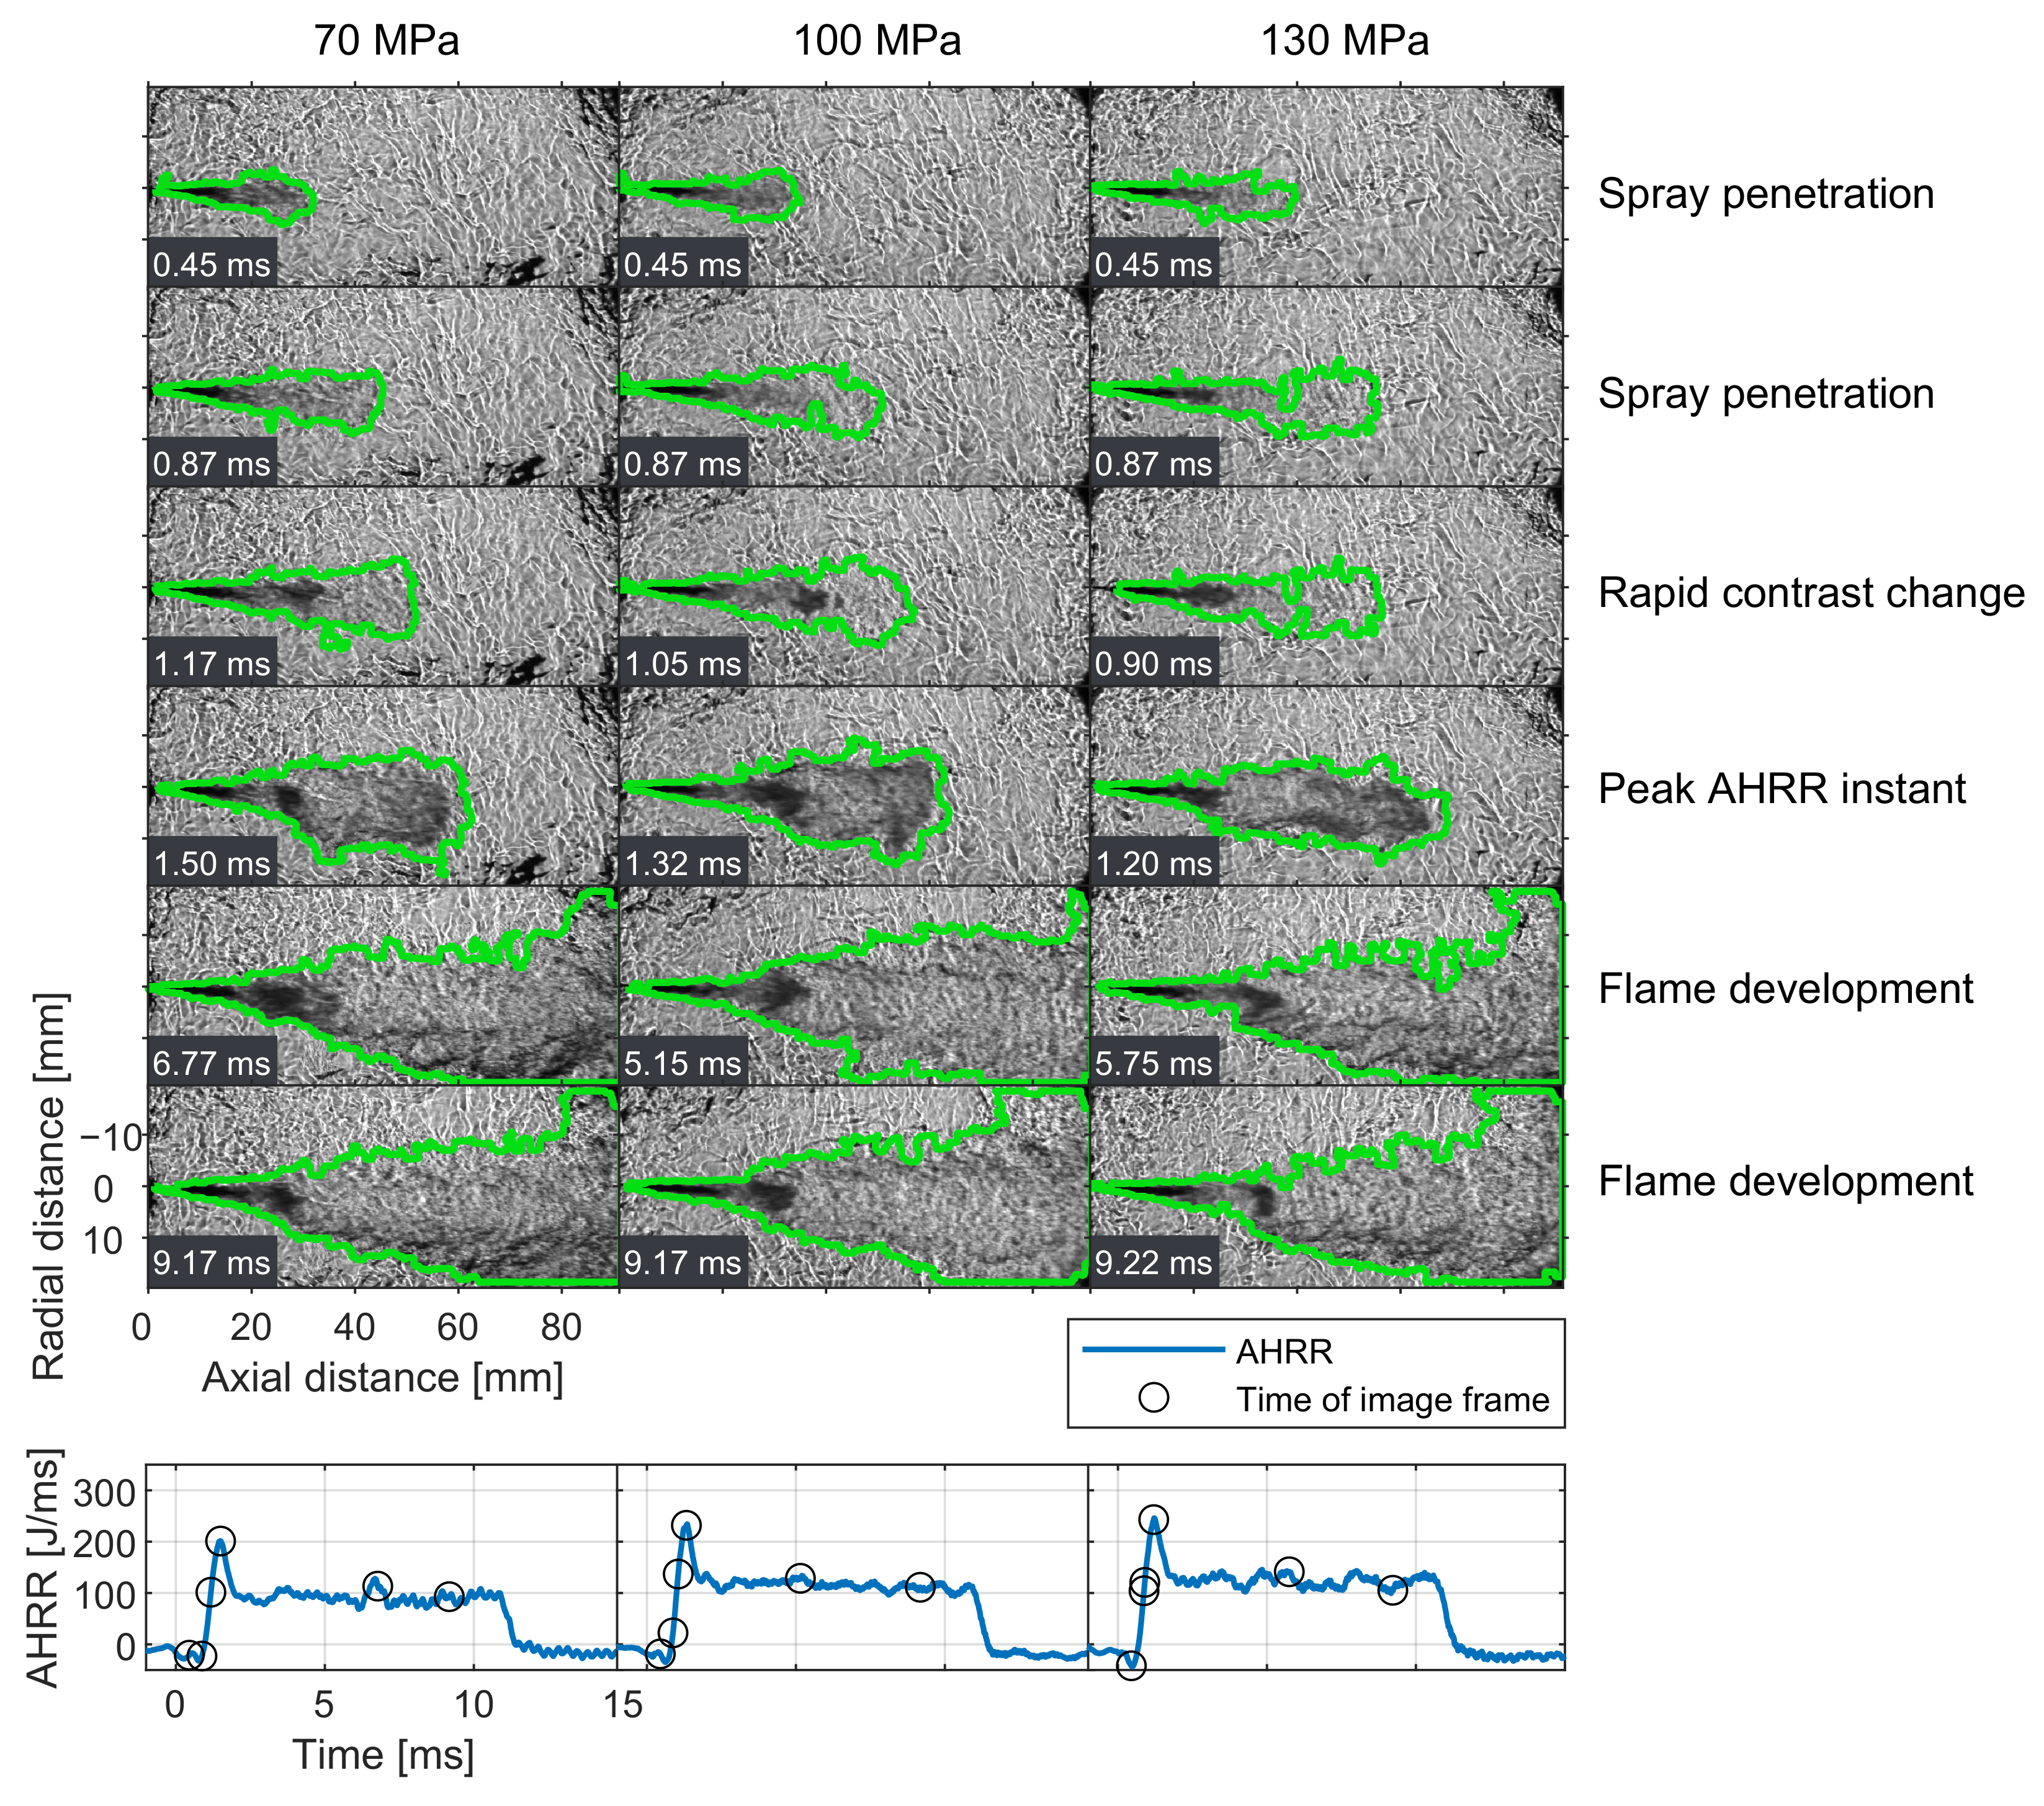
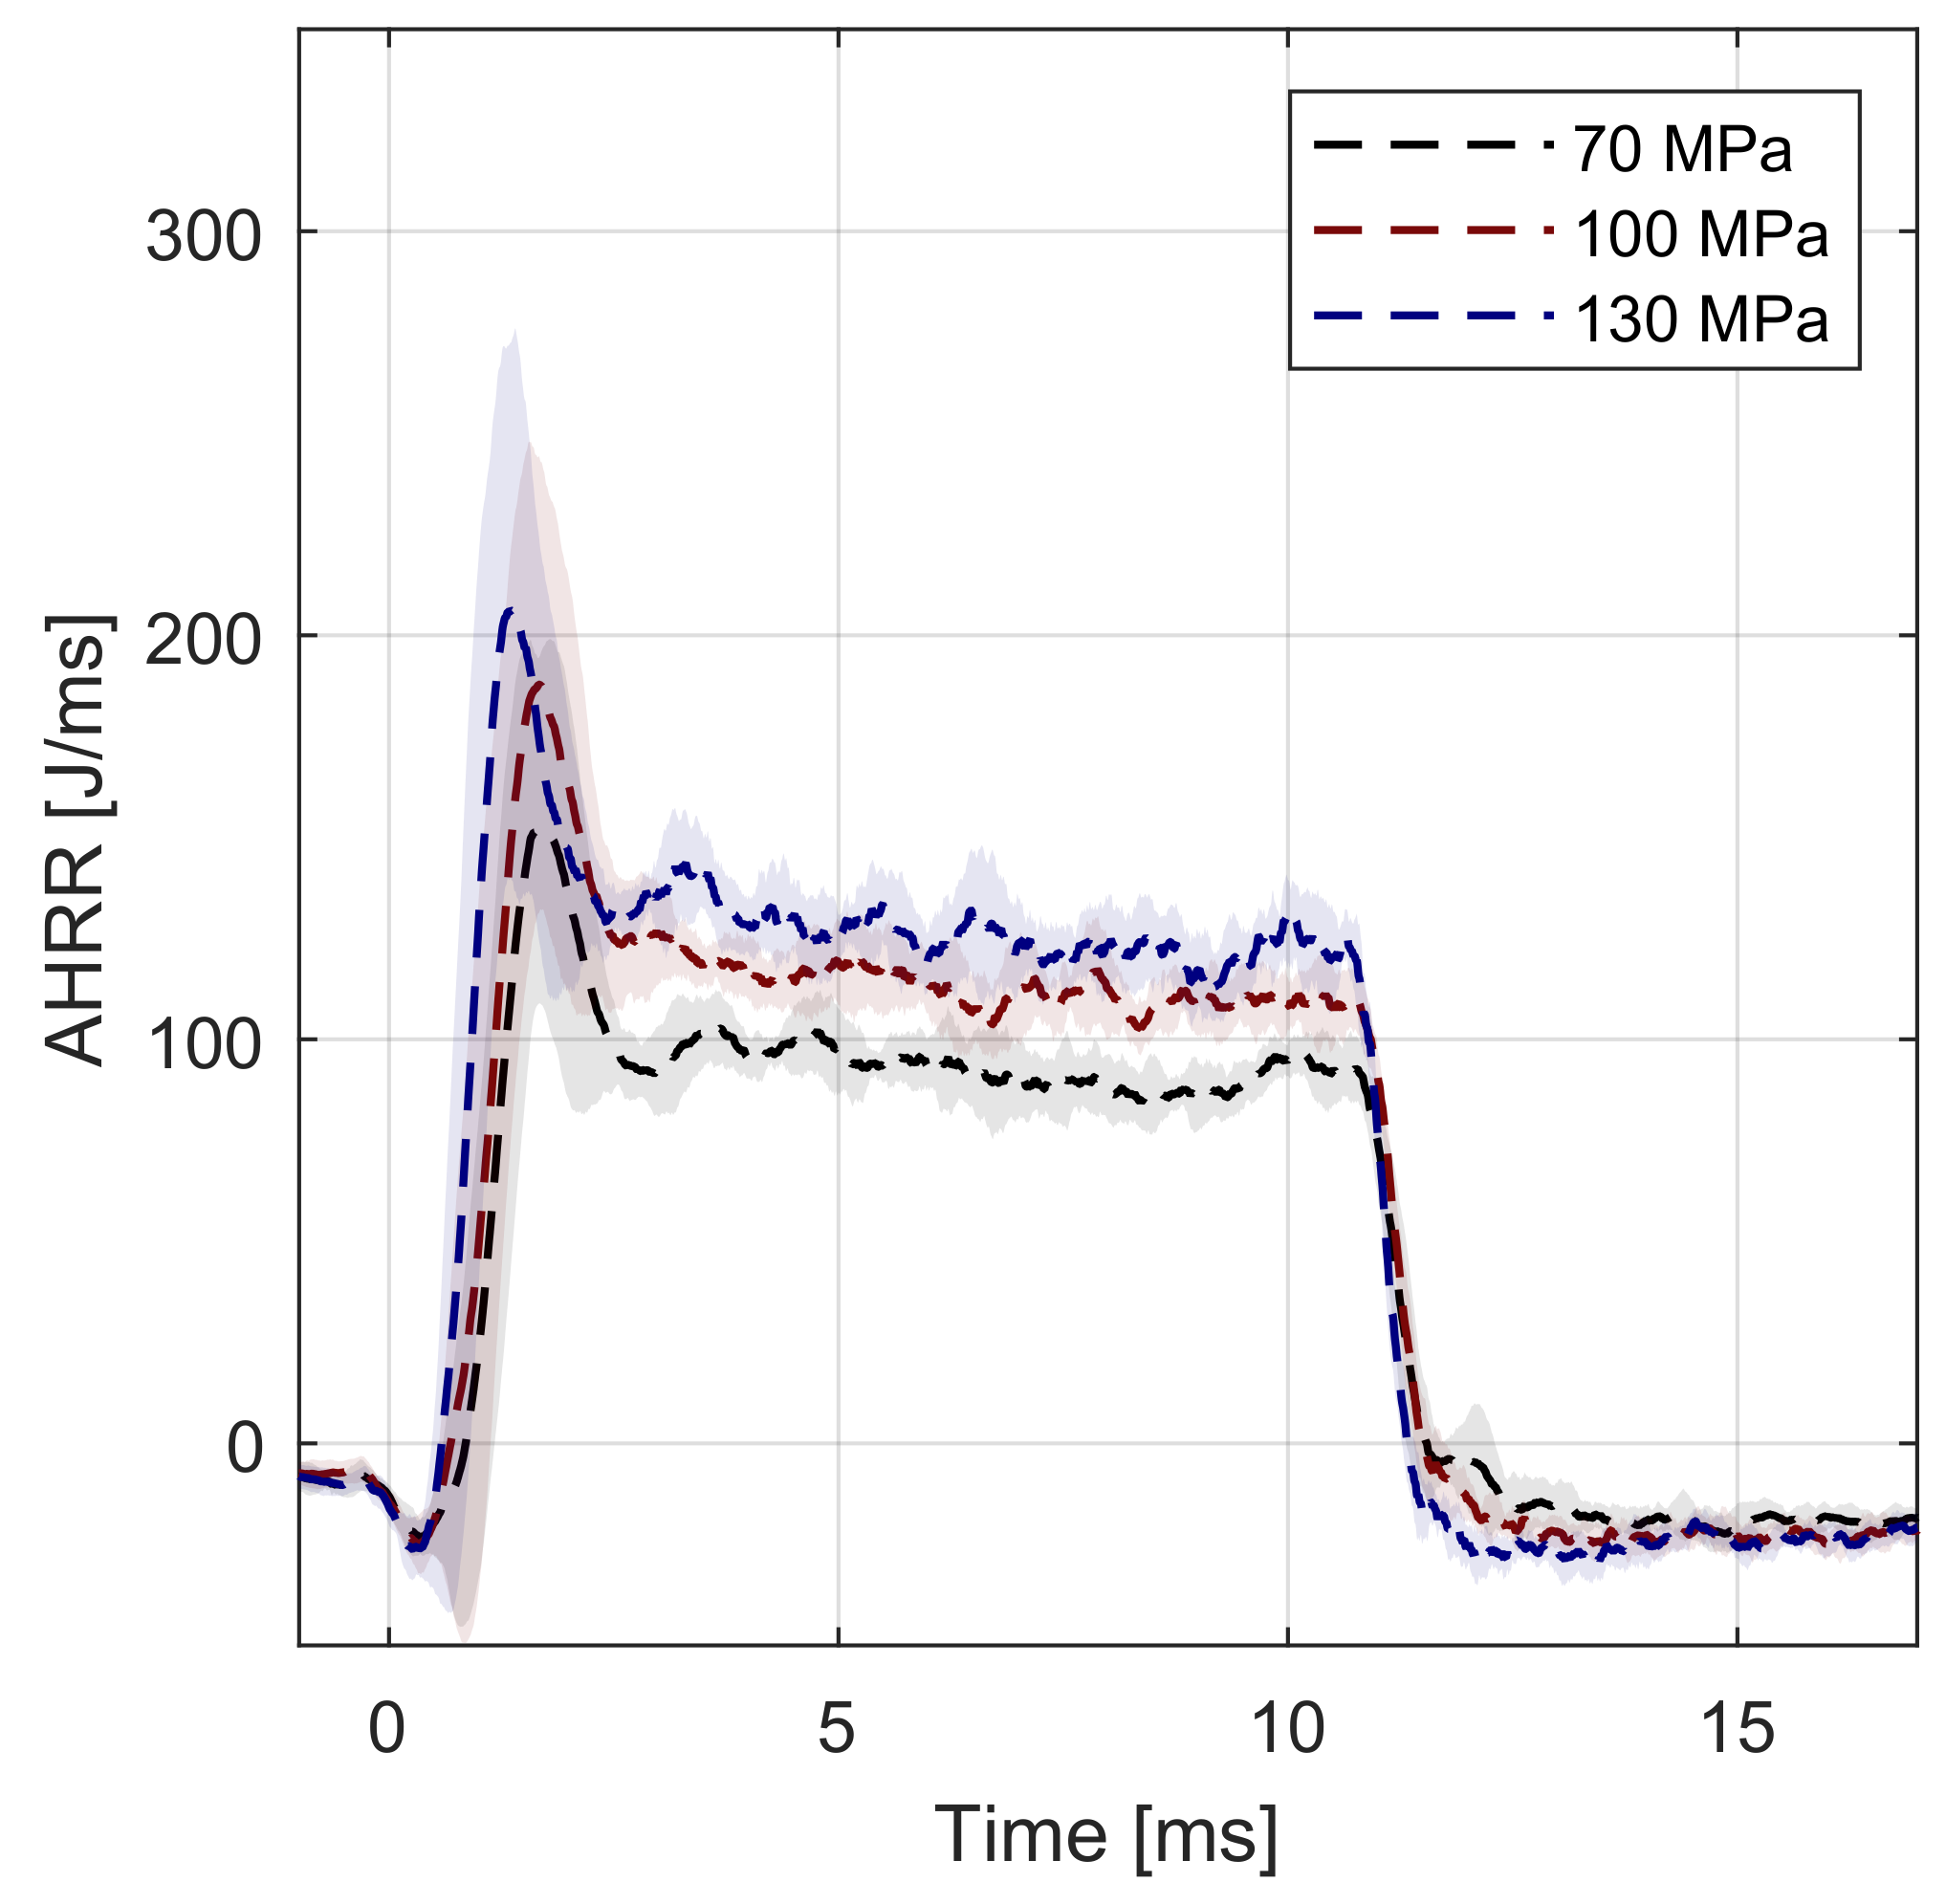
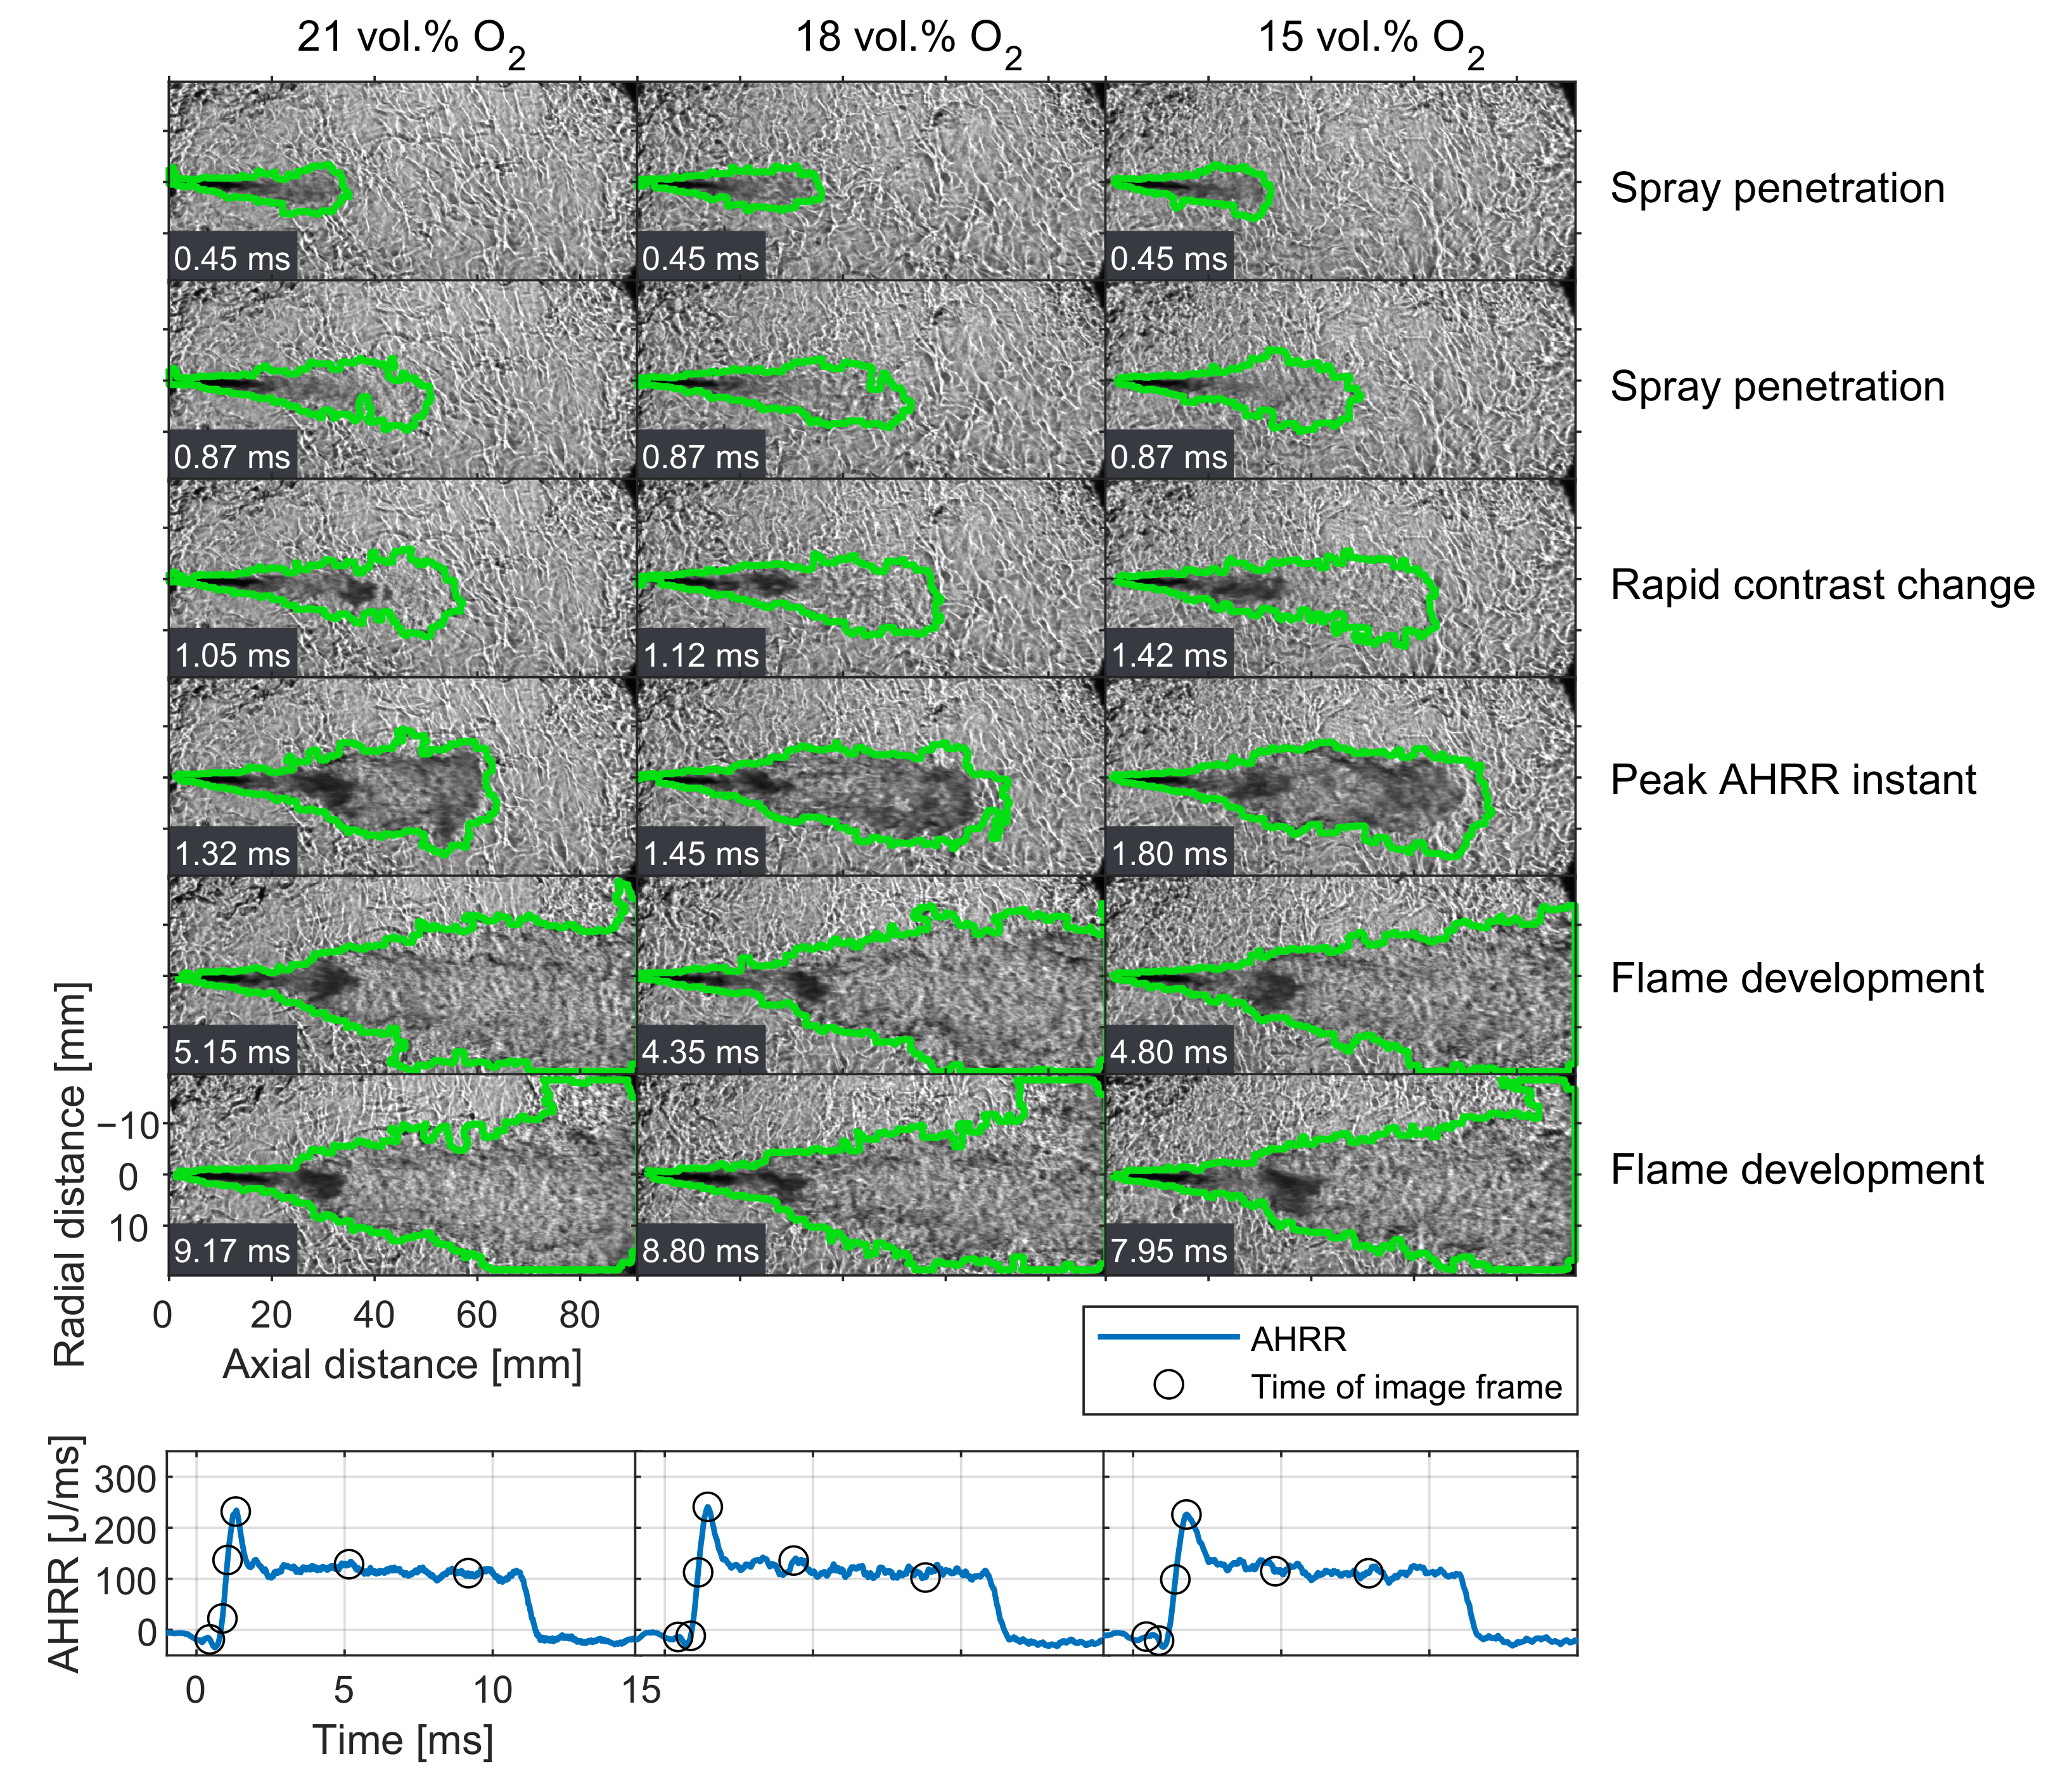
This section presents high-speed schlieren sequences illustrating the effects of parametric variations on ignition, combustion, and flame development in methanol sprays. For each condition, sequences from runs with ignition delays closest to the average (Figure 5) are shown together with the corresponding AHRR profiles. Representative frames highlight key stages—spray penetration, rapid intensity decrease (darkening) associated with high-temperature ignition, peak AHRR, and quasi-steady state. The timings of these frames are marked by black circles on the corresponding AHRR curves. Ensemble-averaged AHRR profiles are also included to aid interpretation.

3.3.1. Ambient Temperature Effect

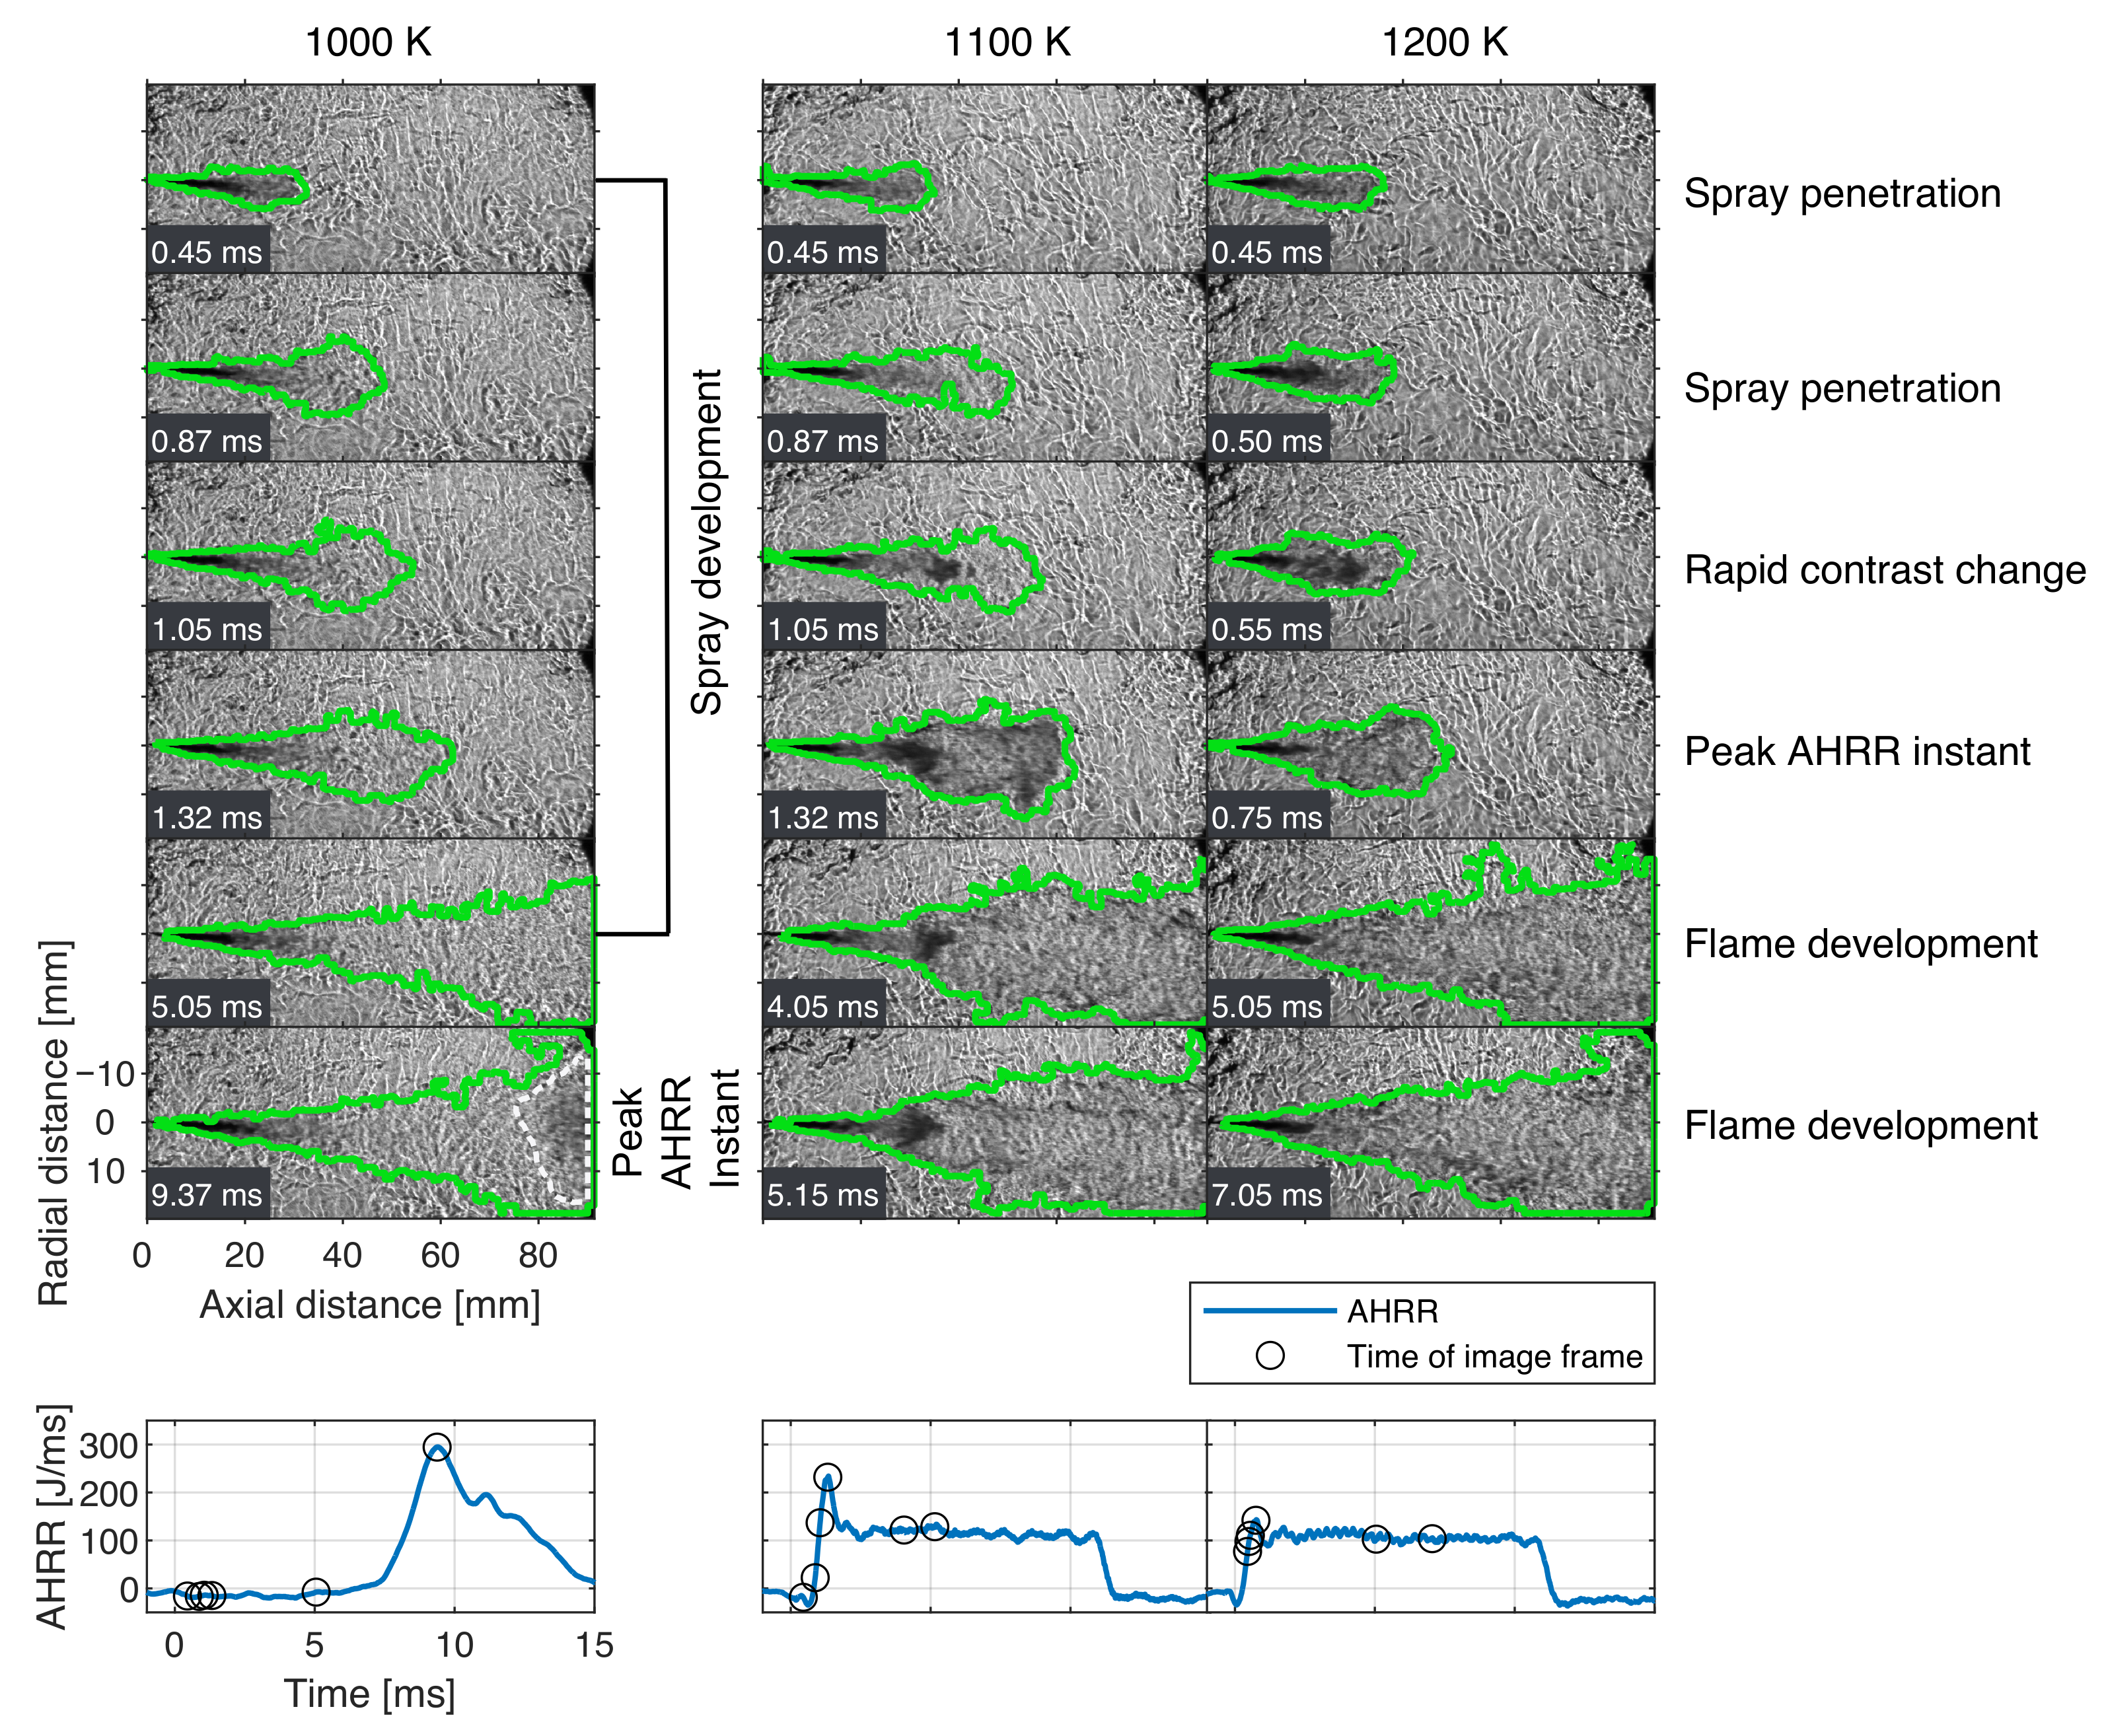
Figure 6 shows the temporal evolution of schlieren images of the ambient temperature cases. Solid green lines denote the methanol spray boundary; the abscissa and ordinate represent axial and radial distances from the injector nozzle, located at the midpoint of the left edge. The same colour scheme, annotations, and formatting are applied consistently in subsequent sections. Corresponding heat-release profiles for each run are shown below the image sequences. The selected representative frames are extracted from the full image sequences and included to aid interpretation and facilitate a visual comparison across conditions, rather than to provide precise, high-resolution measurements of event timing.
Focusing on the reference case (i.e., 1100 K case), the first frame shows darkened regions near the nozzle, corresponding to the liquid phase where droplets cause light extinction across the spray. In the next frame, the liquid and vapour phases begin to separate, with the liquid penetrating to approximately 19 mm but no further. The vapour jet head, though less dark, remains discernible against the background; however, the overall jet contrast decreases downstream, indicating that the jet refractive index converges toward that of the ambient. In the third frame, a rapid contrast change (darkening) appears in the mid-jet region, corresponding to high-temperature ignition, as hot, low-density gases generate refractive index gradients that are markedly different from the ambient. Subsequent frames show pronounced radial and axial expansion, with the jet continuing to penetrate downstream as time after the start of injection increases. The distinct radial expansion is attributed to thermal expansion in regions of significant heat release. A clear contrast difference is evident between the high-temperature combustion regions, the less-dark vapour regions near the injector, and the liquid phase. Prior diesel studies have shown that the onset of radial expansion correlates with the transient lift-off length [17,36]. In the present images of the reference case, the lift-off location (i.e., the point of rapid radial expansion) lies downstream of the liquid length.
For the 1200 K case (Figure 6, right column), the overall jet development is similar to the reference (Figure 6, middle column). The key difference is that the rapid contrast change, while still occurring in the mid-jet region, appears earlier in timing than in the reference (0.55 ms aSOI in Figure 6, right column, versus 1.05 ms aSOI in Figure 6, middle column), resulting in a shorter axial penetration length at ignition. Compared with the reference, the radial expansion of the jet after ignition is less distinct. In addition, the contrast within the jet boundary shows less separation between the liquid phase and the high-temperature region, indicating closer proximity of these phases at 1200 K . For the 1000 K case (Figure 6, left column), no high-temperature region is visible within the field of view (i.e., 90 mm downstream from the nozzle) at the onset of the rapid heat rise in the heat-release curve (Figure 7, black curve). A darkened contrast appears only in the downstream region, far from the nozzle (highlighted by the white-dashed area in the last frame of Figure 6, left column). However, it is unclear whether this feature results from flame recession, recirculation, or other effects. Therefore, the flame evolution at 1000 K will not be discussed.
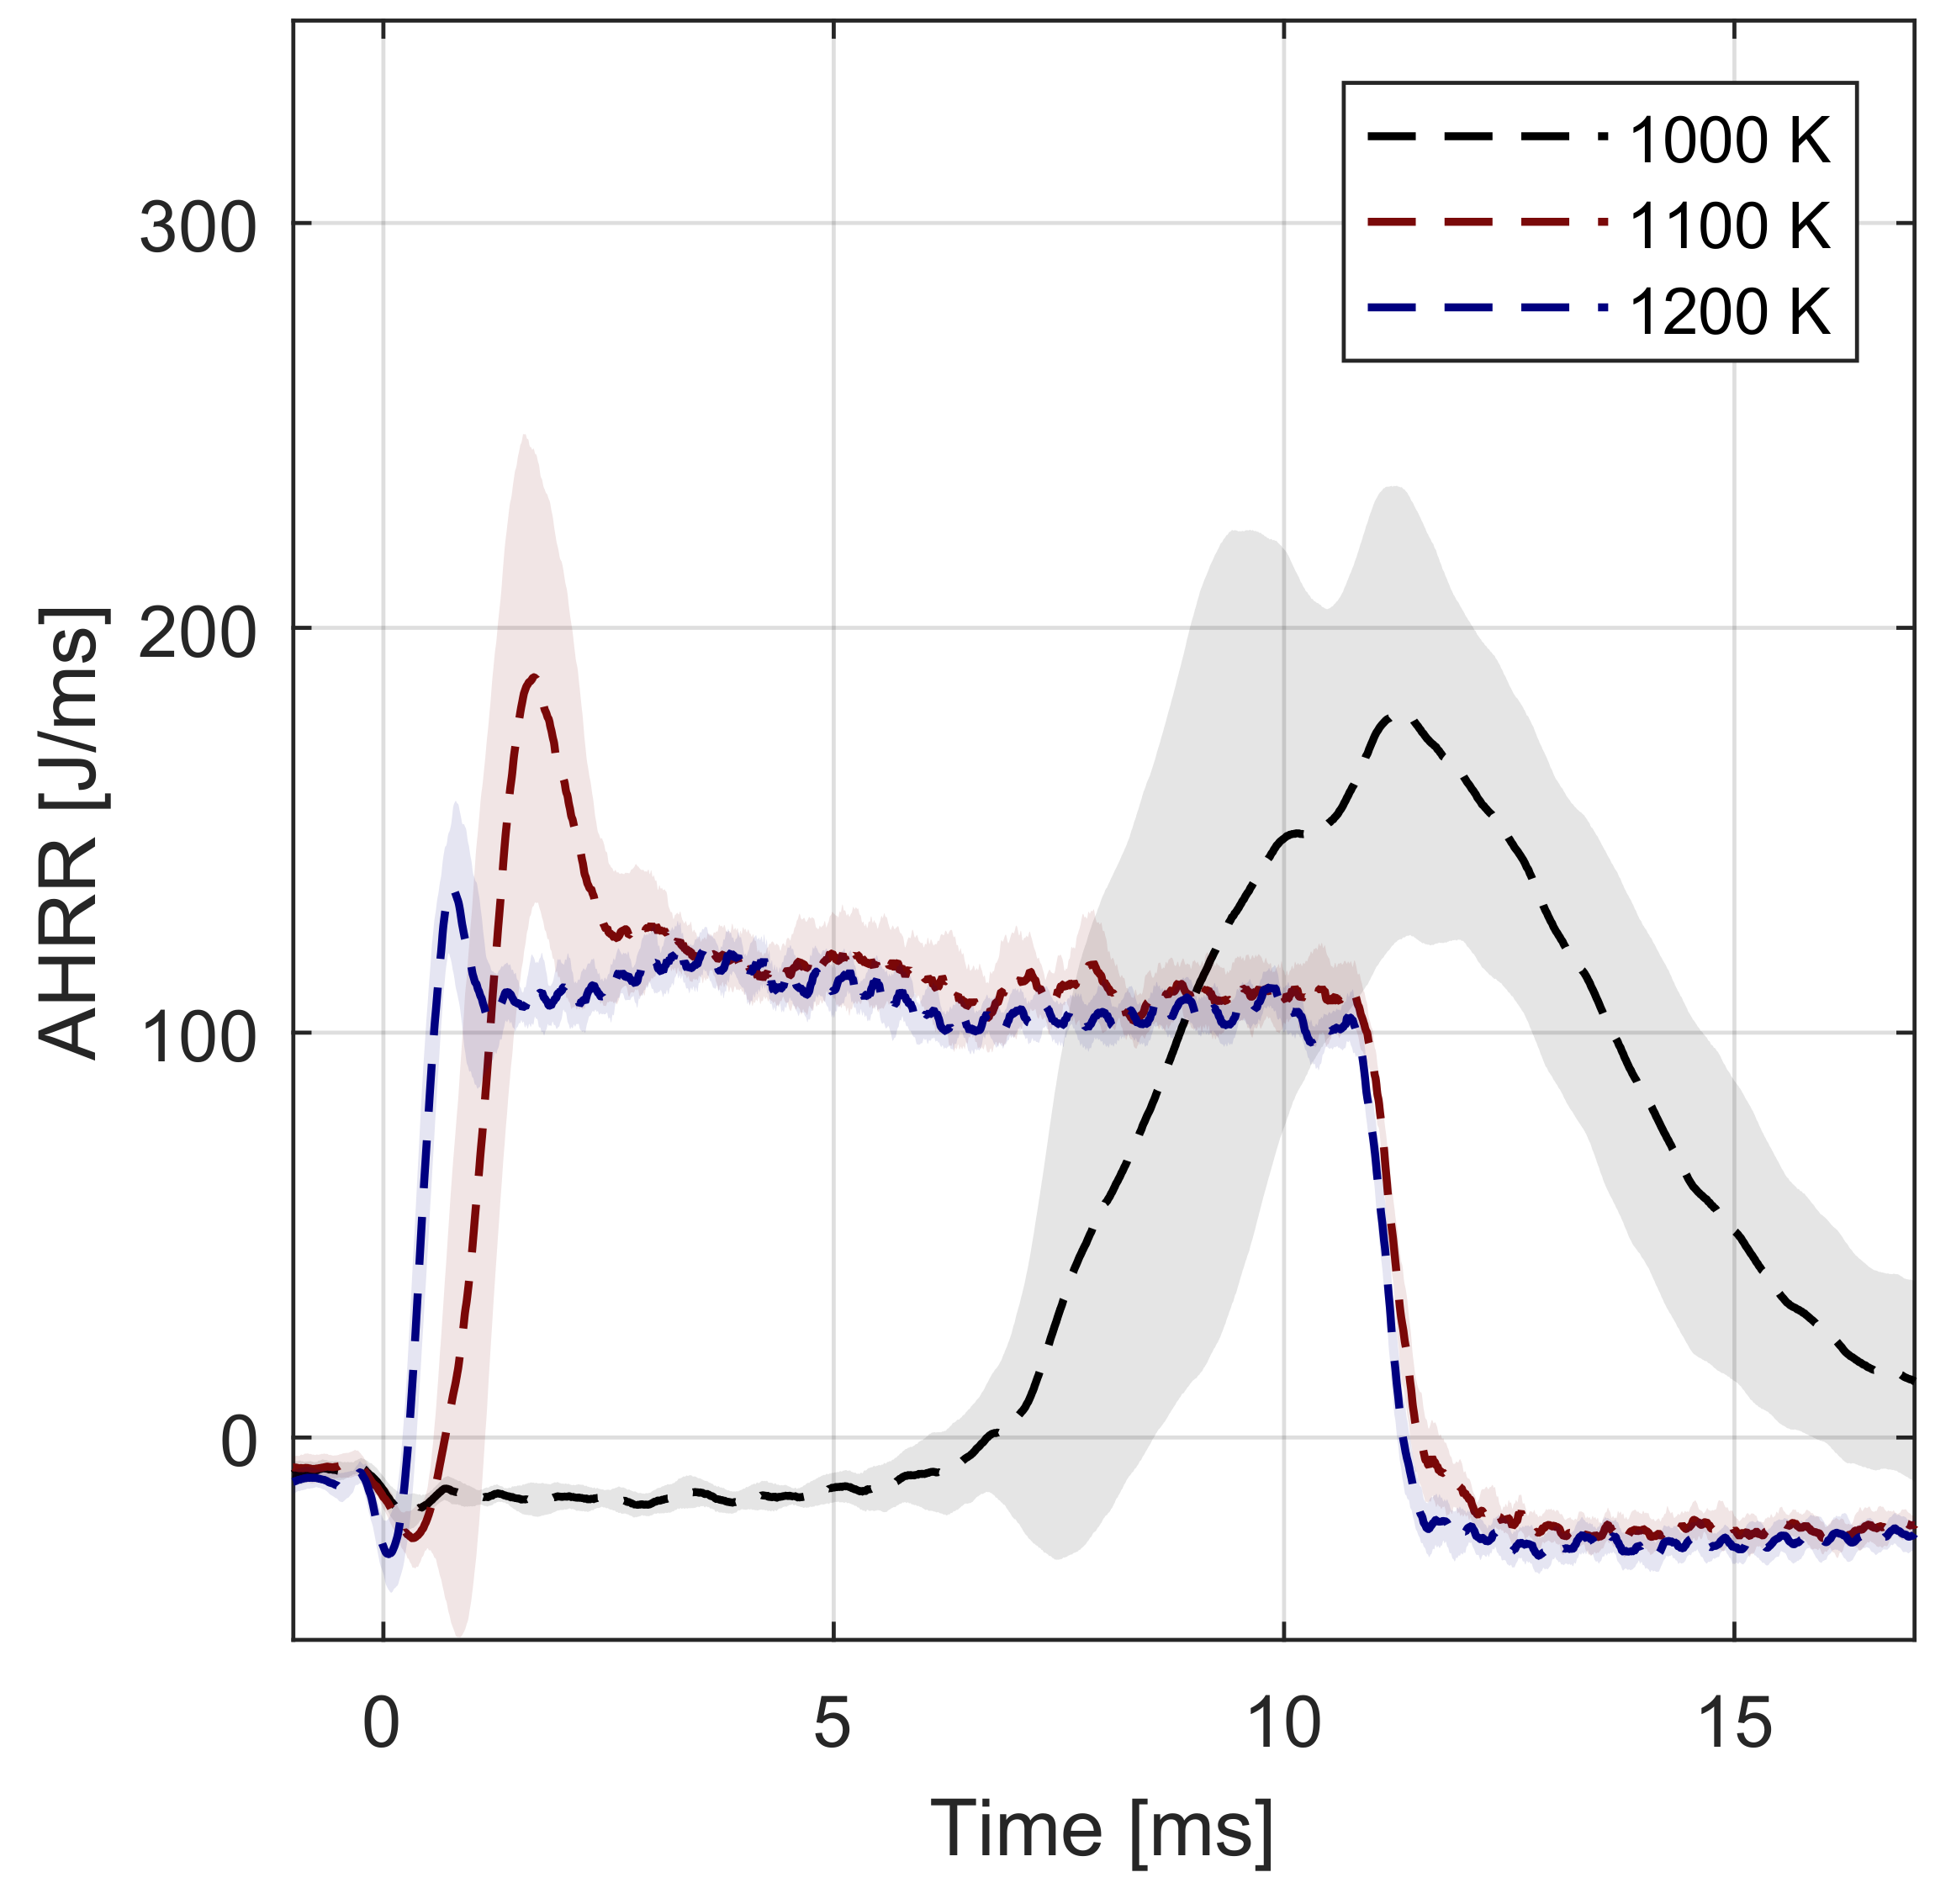
Figure 7 shows the average AHRR curves for the ambient temperature cases. At 1200 K and 1100 K , the profiles exhibit an initial premixed combustion peak, followed by a plateau corresponding to diffusion-controlled combustion. The initial premixed peak is less pronounced for the 1200 K cases than in the reference, consistent with the shorter mixing time before ignition at a higher temperature [37]. At 1000 K , the AHRR rise is broader and more gradual, with no clear diffusion phase. Under the present test conditions, jet–wall impingement is estimated to occur at approximately 2.5 ms aSOI (based on the non-reacting jet penetration measurement, not shown for brevity), so ignition occurs after wall impingement. As previous studies [38] have shown, such impingement can alter the heat release profile. Therefore, while the AHRR data provide insight into the ignition process, drawing definitive conclusions regarding the underlying combustion behaviour from the overall heat release profile, beyond ignition delay estimation, is challenging. This is because the data were likely influenced by jet-wall interactions, although their occurrence could not be confirmed with the current experimental configuration.
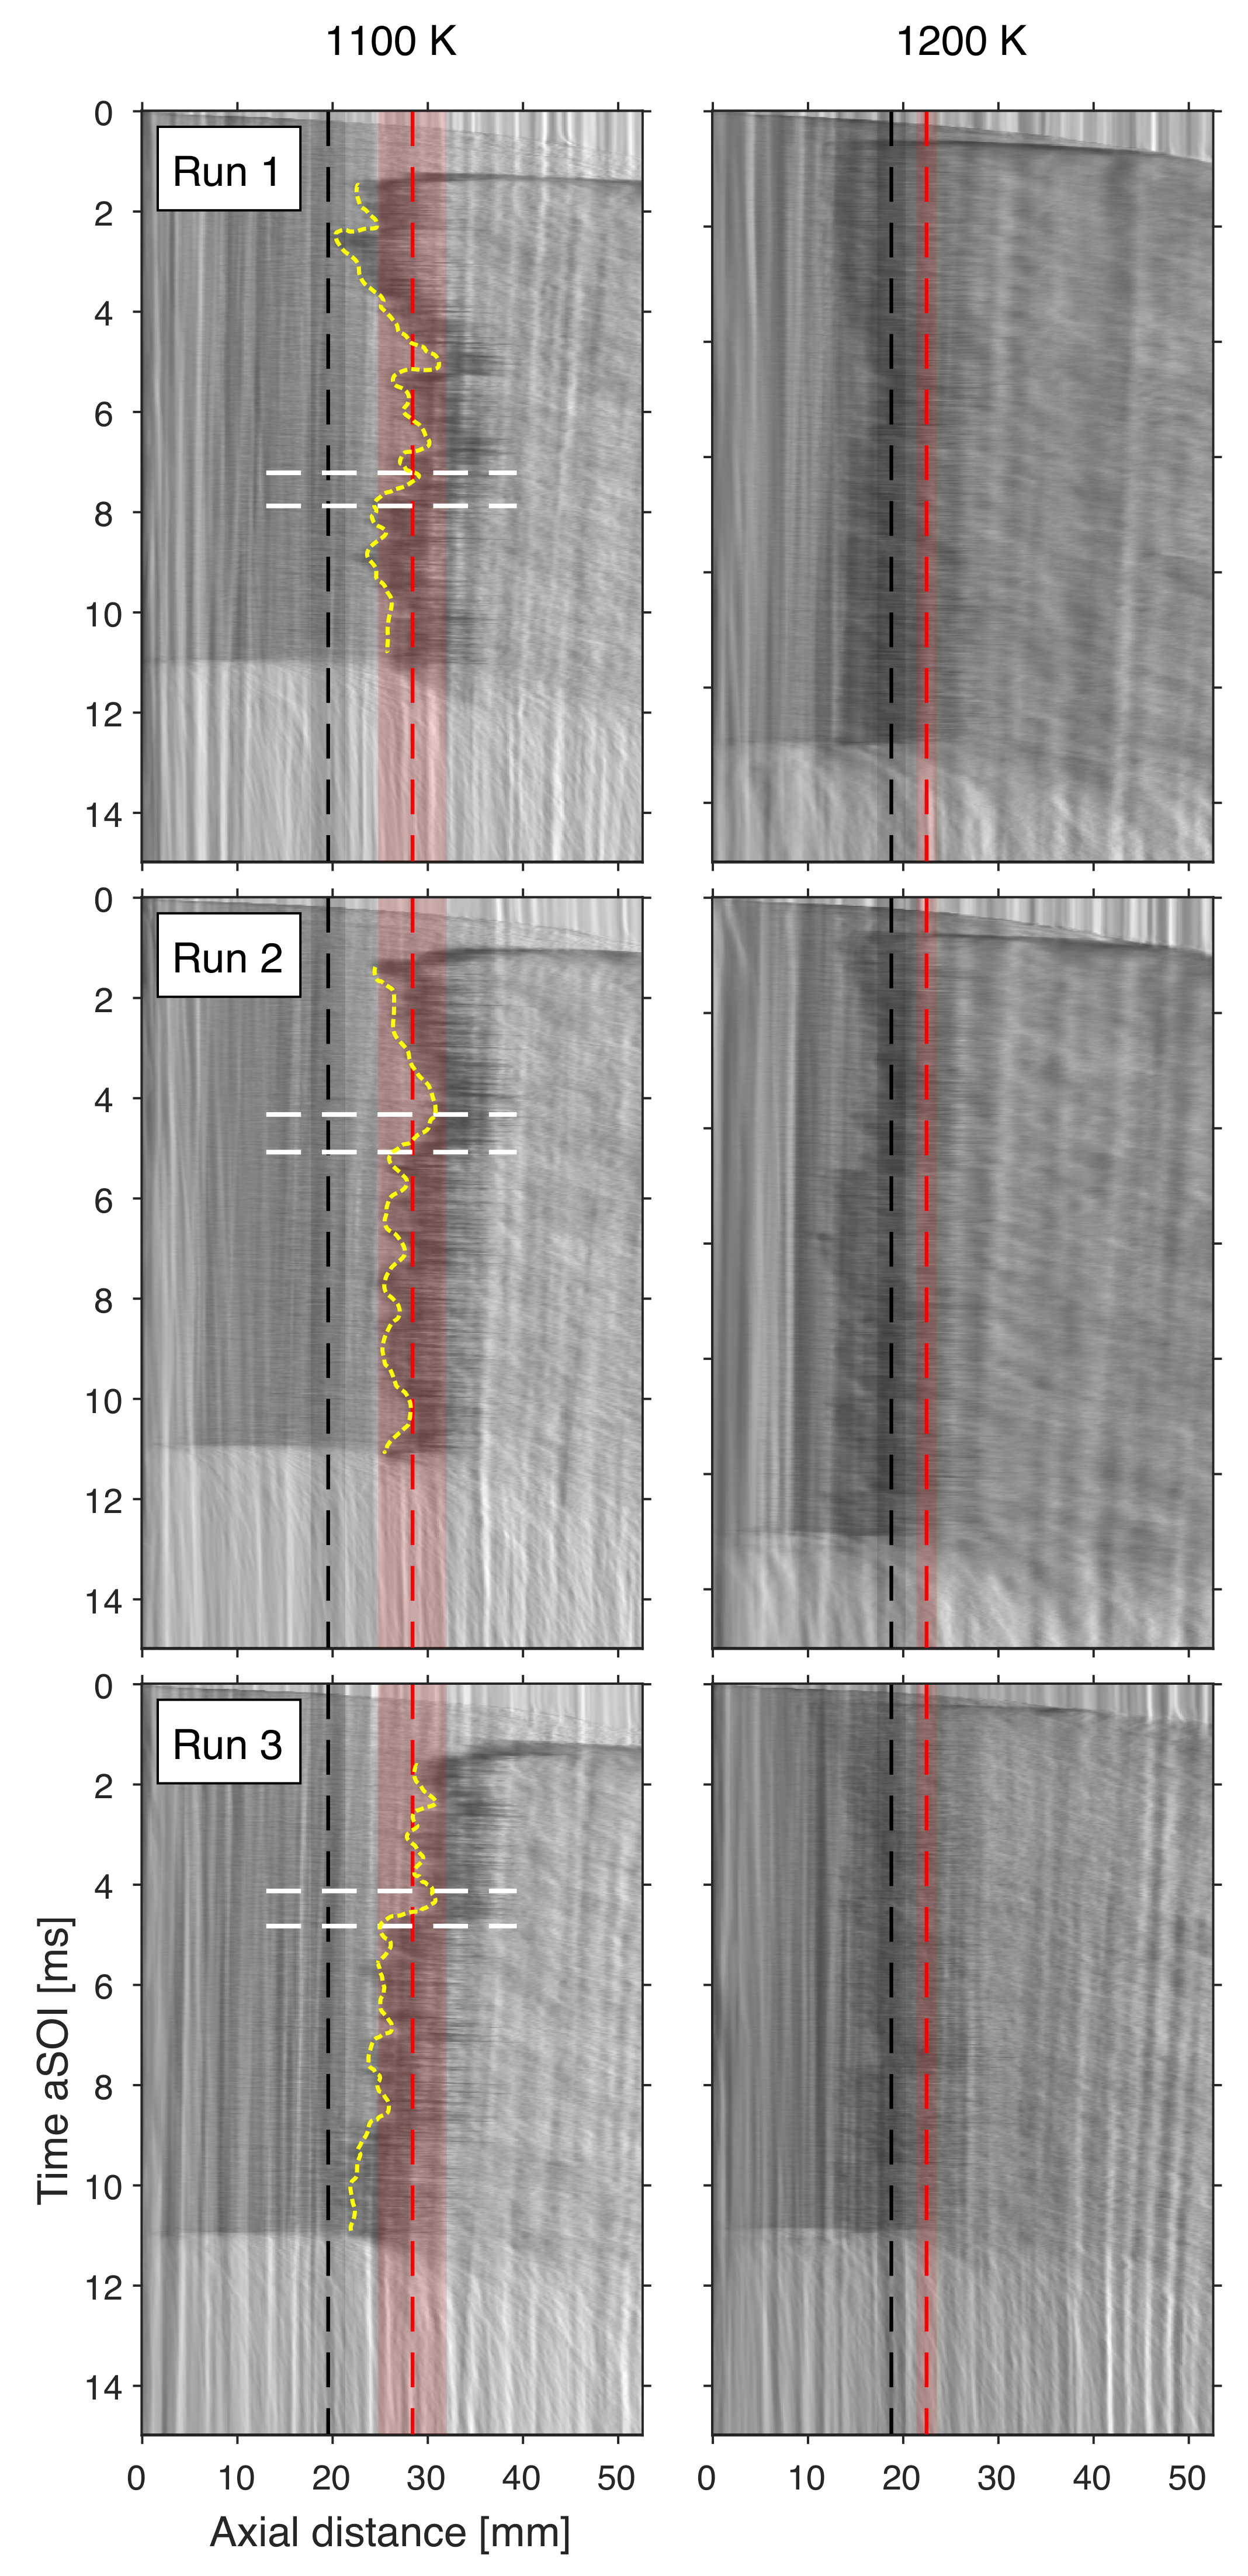
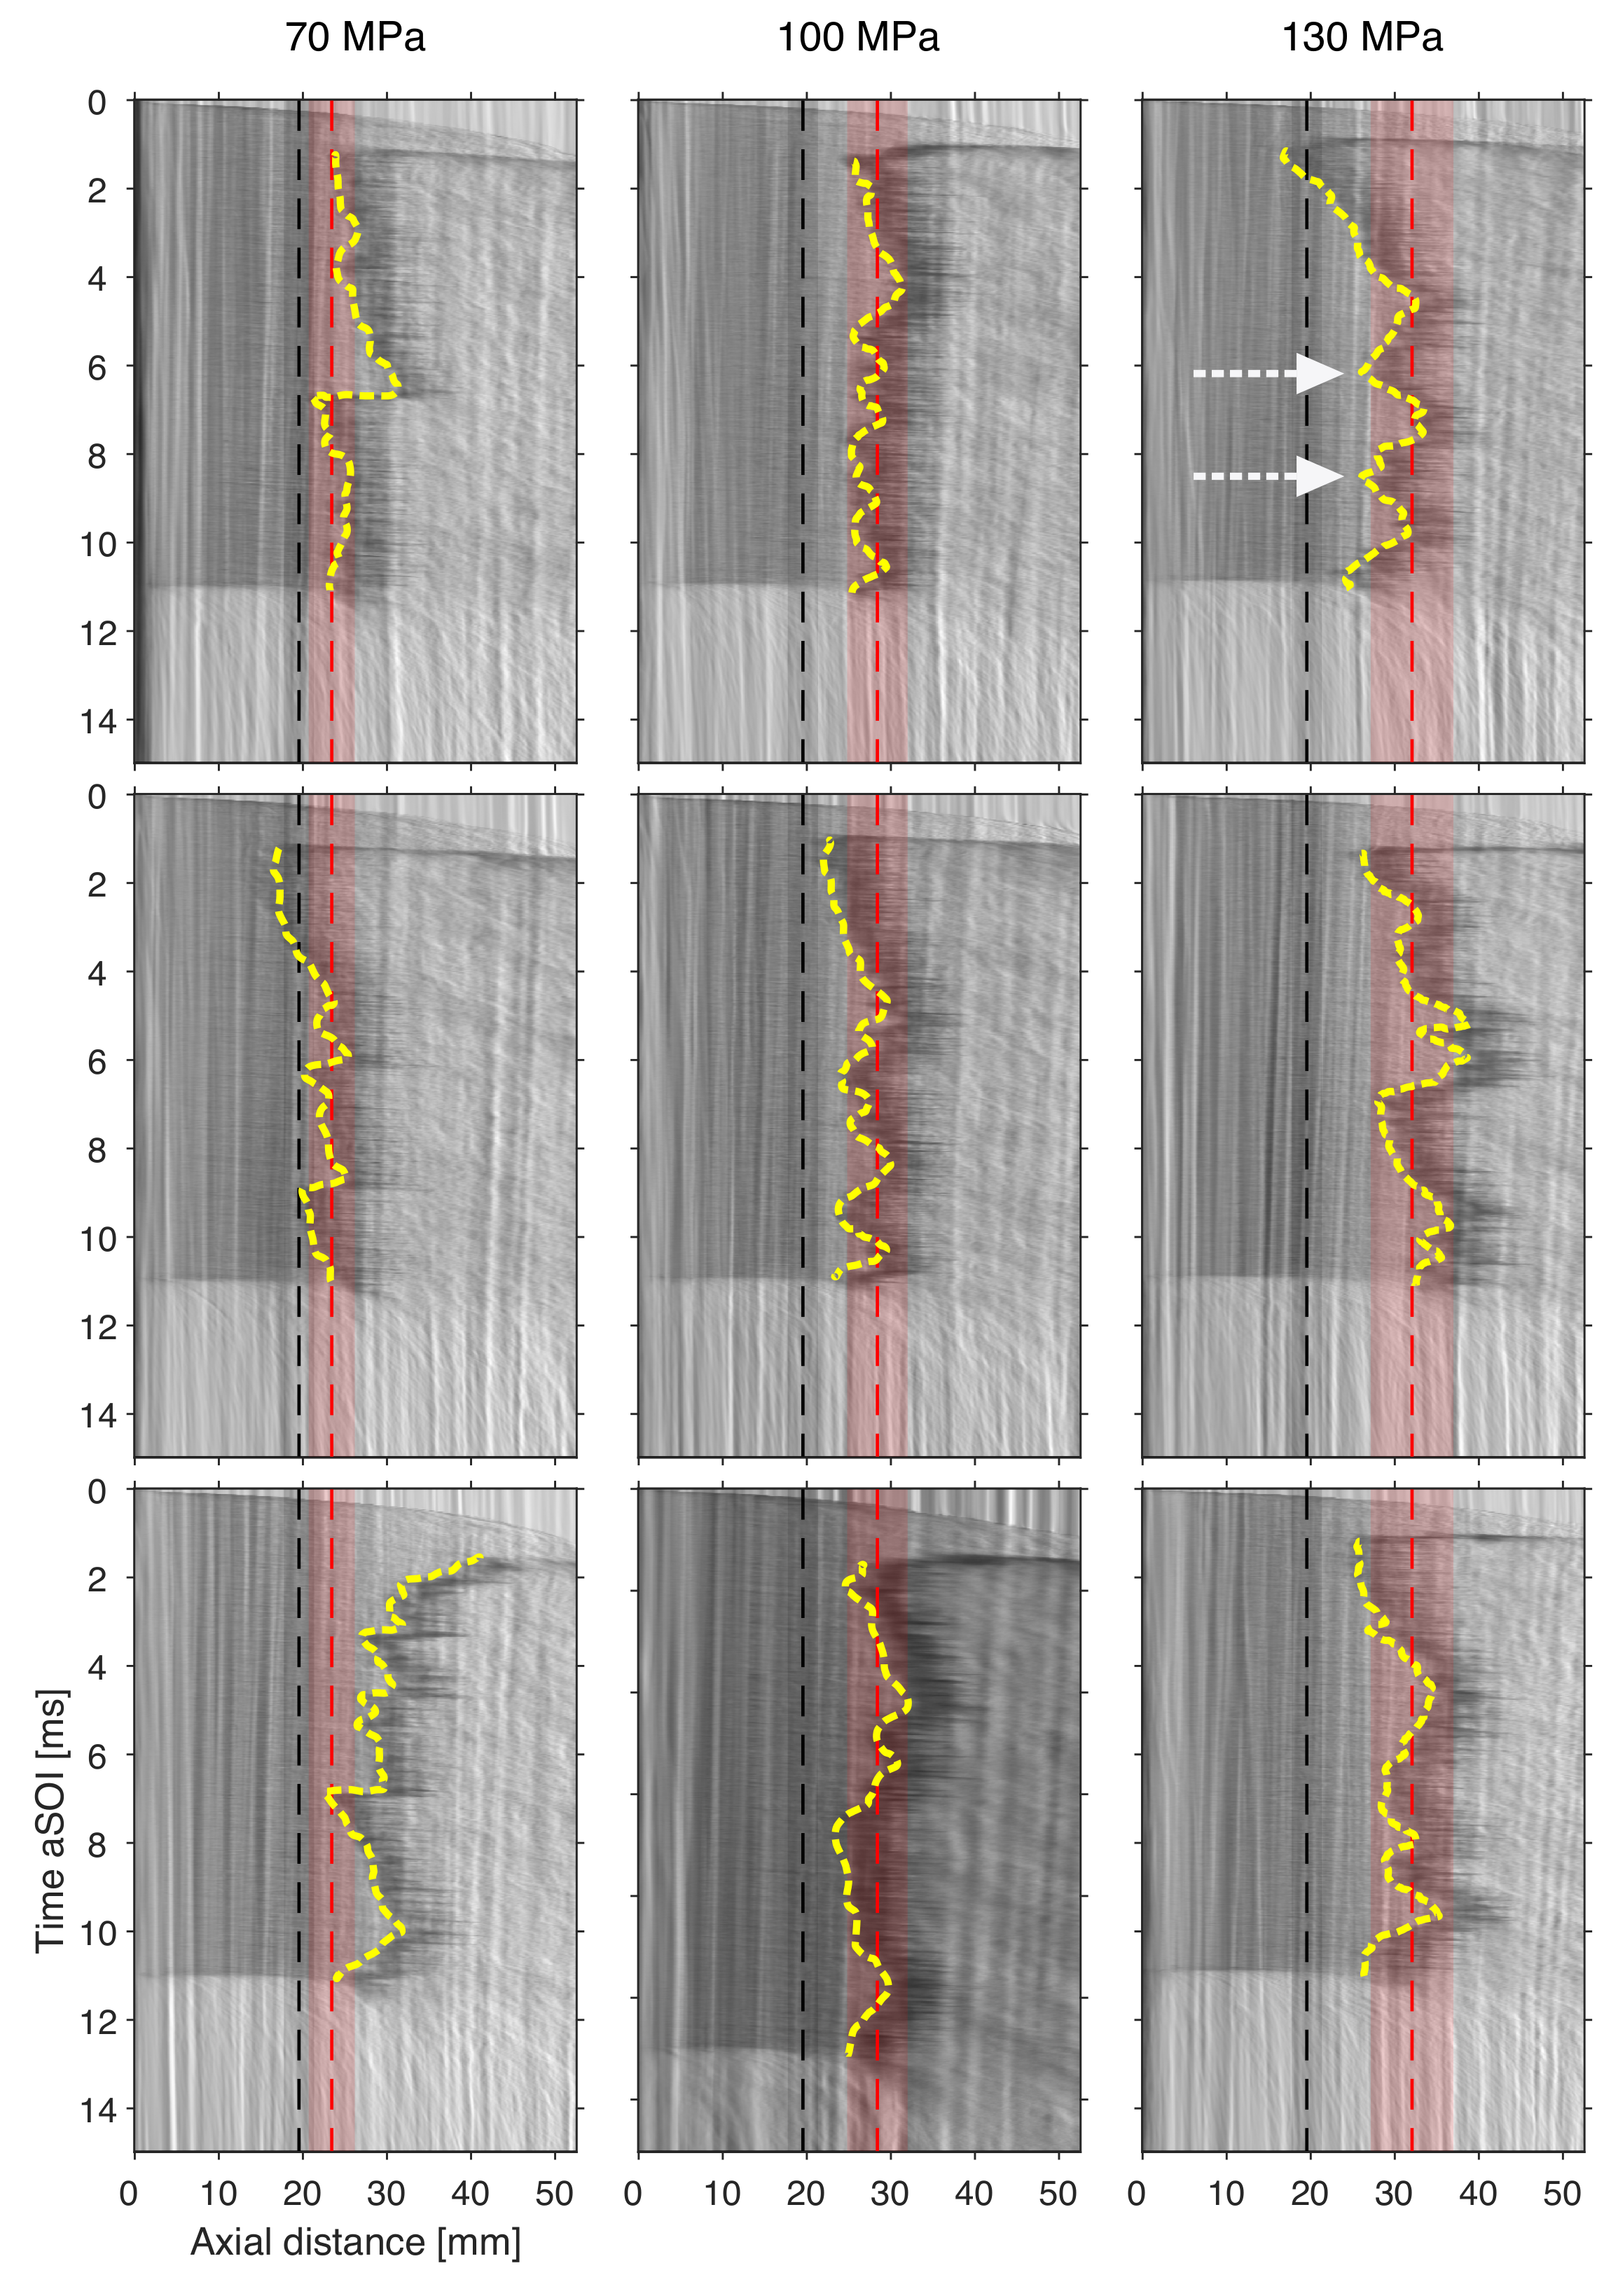
For methanol spray flames, a frame-by-frame schlieren analysis revealed fluctuations in flame lift-off under certain conditions. Previous studies have shown that high-speed schlieren imaging can capture transient lift-off lengths when radial expansion from thermal effects is evident [36]. Accordingly, in the schlieren method, lift-off values were obtained by radially integrating intensity along the spray centreline at each axial location for every frame. This integration enhanced contrast changes associated with thermal expansion, enabling a clearer identification of the flame base. The instantaneous schlieren-derived lift-off values were then compared with those from time-averaged OH* chemiluminescence images taken at a later stage of injection to assess whether the averaged OH*-based measurements remain representative under conditions where transient fluctuations occur in the schlieren data.
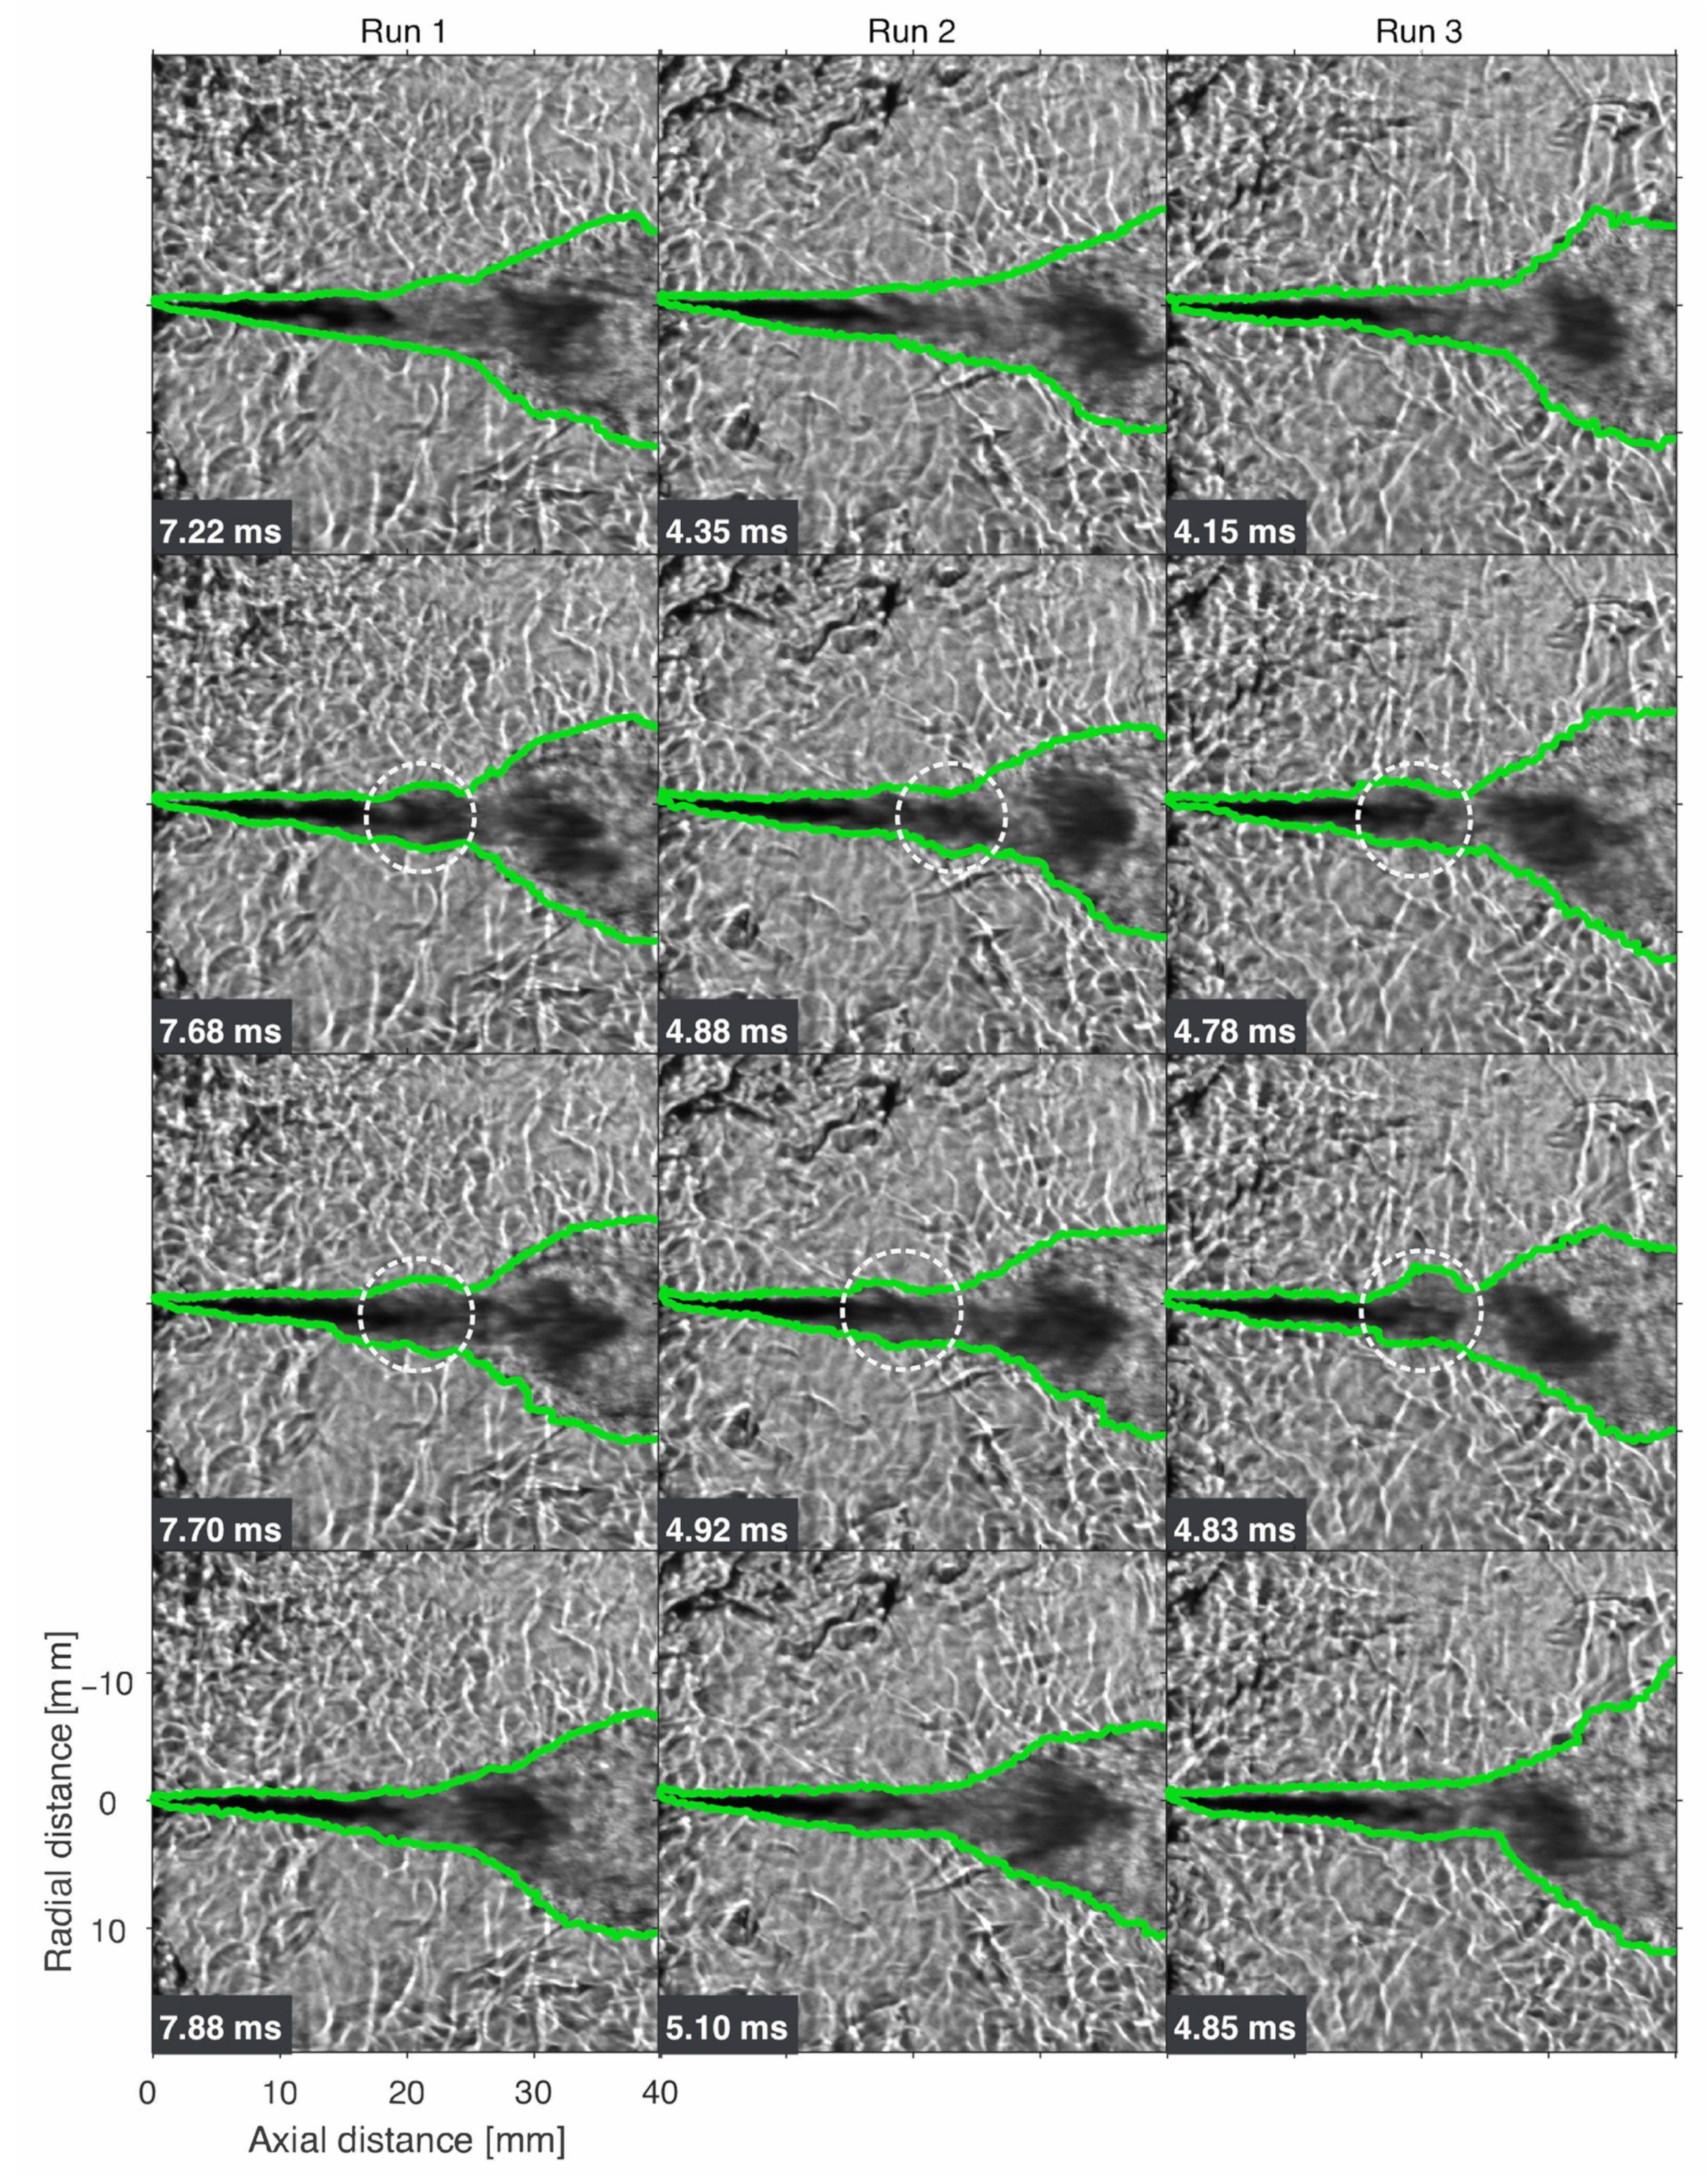
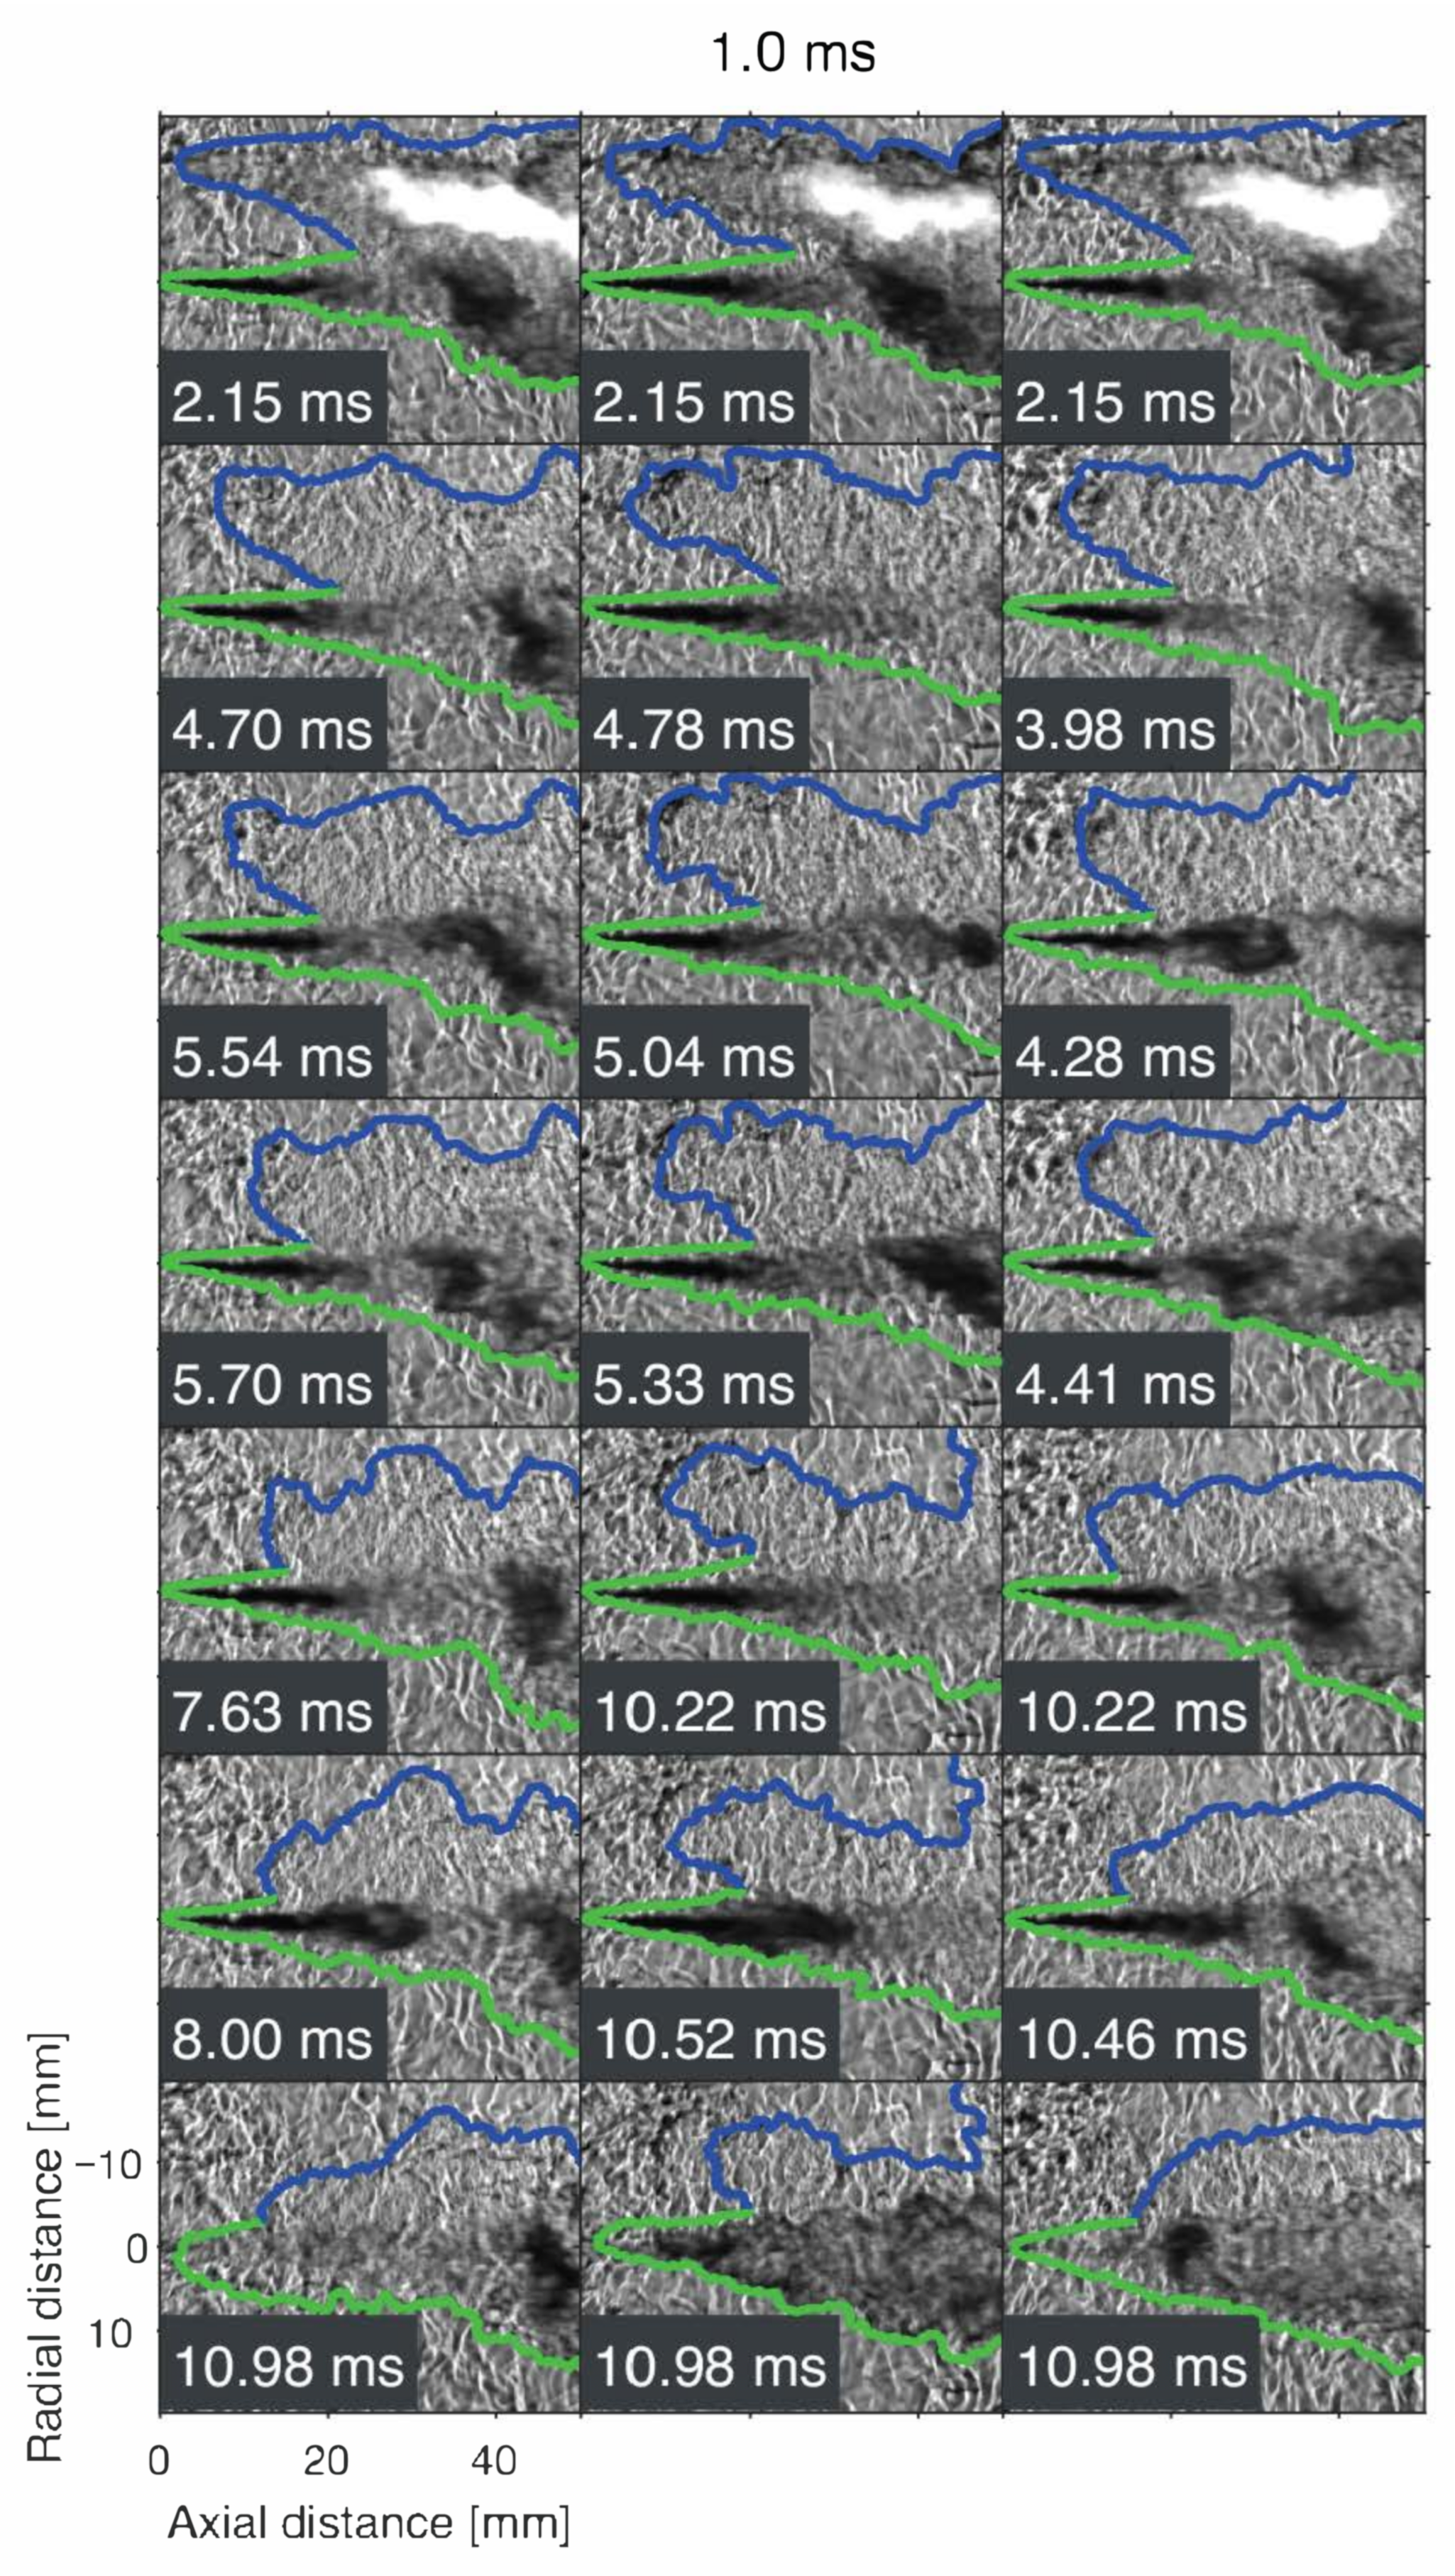
Figure 8 presents three runs for each condition. The black dashed lines indicate the liquid length, the red lines show the OH*-derived lift-off length with shaded uncertainty bounds, and the yellow dashed lines mark the axial location where distinct schlieren-contrast changes occur, representing the instantaneous flame lift-off base. For the 1100 K case (Figure 8, left column, runs 1–3), the flame lift-off fluctuates over time. Closer inspection of the schlieren image sequences bounded by the white dashed time windows in Figure 8 reveals localised darkened regions forming upstream of the main flame after the premixed burn phase; these sequences are shown in detail in Figure 9. These regions expand and merge with the reacting jet, causing the flame base to move upstream before travelling downstream again over time. Three representative schlieren sequences corresponding to these sudden shifts in the radially integrated profiles (Figure 8) are shown in Figure 9. Similar self-ignition events have been reported in diesel combustion studies [39], typically after the premixed burn phase during quasi-steady combustion. Overall, the schlieren-derived flame base positions remain within the OH*-derived uncertainty bounds.
For the 1200 K case, schlieren images show less apparent radial expansion after ignition and reduced contrast between the liquid phase and the high-temperature region, suggesting closer spatial proximity of the two. Consequently, phase-to-phase contrast changes are less distinct than in the reference cases. Here, OH*-derived lift-off lengths appear further downstream than schlieren values. While schlieren measurements are less reliable under these conditions, the line-of-sight nature of OH* chemiluminescence must also be considered: when the flame base coincides with or is located near the dense liquid core, the attenuation or obscuration of OH* emission can cause the first detectable signal to appear further downstream of the actual stabilisation point. Therefore, as the lift-off length approaches the liquid length, these diagnostic uncertainties require careful interpretation.
For methanol, the existence of two-stage ignition remains debated. Burke et al. [40] investigated low to moderate pressure conditions (2–50 bar, 820–1650 K) using shock tube, rapid compression machine, and jet-stirred reactor experiments and reported no evidence of low-temperature chemistry. In another study, Wang et al. [41], using a high-pressure jet-stirred reactor experiment (10–100 bar, 550–950 K), observed the signature of two-stage ignition for rich mixtures under high-pressure conditions (equivalence ratio of 9.0 at 100 bar). Kaario et al. [42] recently conducted simulation work at 1100 K and 1200 K, which are similar to the conditions in the current study, to examine the ignition characteristics of methanol. Their homogeneous reactor simulation results indicate that methanol exhibits two-stage ignition, but with key differences from diesel-relevant fuels, such as n-dodecane. For methanol, the first-stage heat release is stronger than the second, and the most suitable chemical indicators (e.g., CH3O and CH2O) differ from the classical RO2-H2O2 sequence typical of diesel fuels. Moreover, two-stage ignition in methanol occurs only within a narrow window of lean equivalence ratios near the most reactive mixture fraction and at elevated pressures, unlike n-dodecane, which shows two-stage ignition across a broader range of temperatures and mixture fractions. These simulation findings suggest that while methanol can display two-stage ignition, there are differences in the associated chemistry and ignition behaviour.
Experimentally, schlieren imaging of diesel sprays has often been used to detect first-stage ignition. The jet appears more “transparent” near the head or edges of the reacting jet, signalling cool-flame activity as parent fuel molecules partially oxidise and local temperatures rise slightly. This reduces density gradients, bringing the jet’s refractive index closer to that of the surrounding gas, diminishing schlieren contrast and causing the apparent disappearance. During high-temperature ignition, the jet borders reappear as stronger heat release and reactions restore density gradients. However, even in diesel studies, the degree of transparency varies: when fuel-air mixing or temperature fields are highly stratified, refractive index changes are less uniform, and the cool flame is harder to detect with line-of-sight schlieren. In the present experiments, a relatively large nozzle diameter of 0.18 mm was used, as smaller nozzles produced cavitation-induced instabilities—expected given methanol’s low boiling point. Although the larger nozzle reduces cavitation, it also promotes greater mixture stratification. These factors, combined with the differences associated with methanol highlighted by Kaario et al. [42], mean that it remains uncertain whether schlieren contrast variations analogous to those observed in diesel can reliably indicate two-stage ignition in methanol. It is emphasised that the diagnostics employed in the present study cannot confirm or rule out the occurrence of two-stage ignition. The aim is to determine whether methanol exhibits a contrast behaviour commonly reported in diesel jets [26]. In diesel jets, this behaviour consists of an initial transition toward increased transparency during first-stage ignition. This is followed by a subsequent darkening associated with second-stage ignition. The present study examines whether this same pattern also manifests in methanol under comparable conditions.
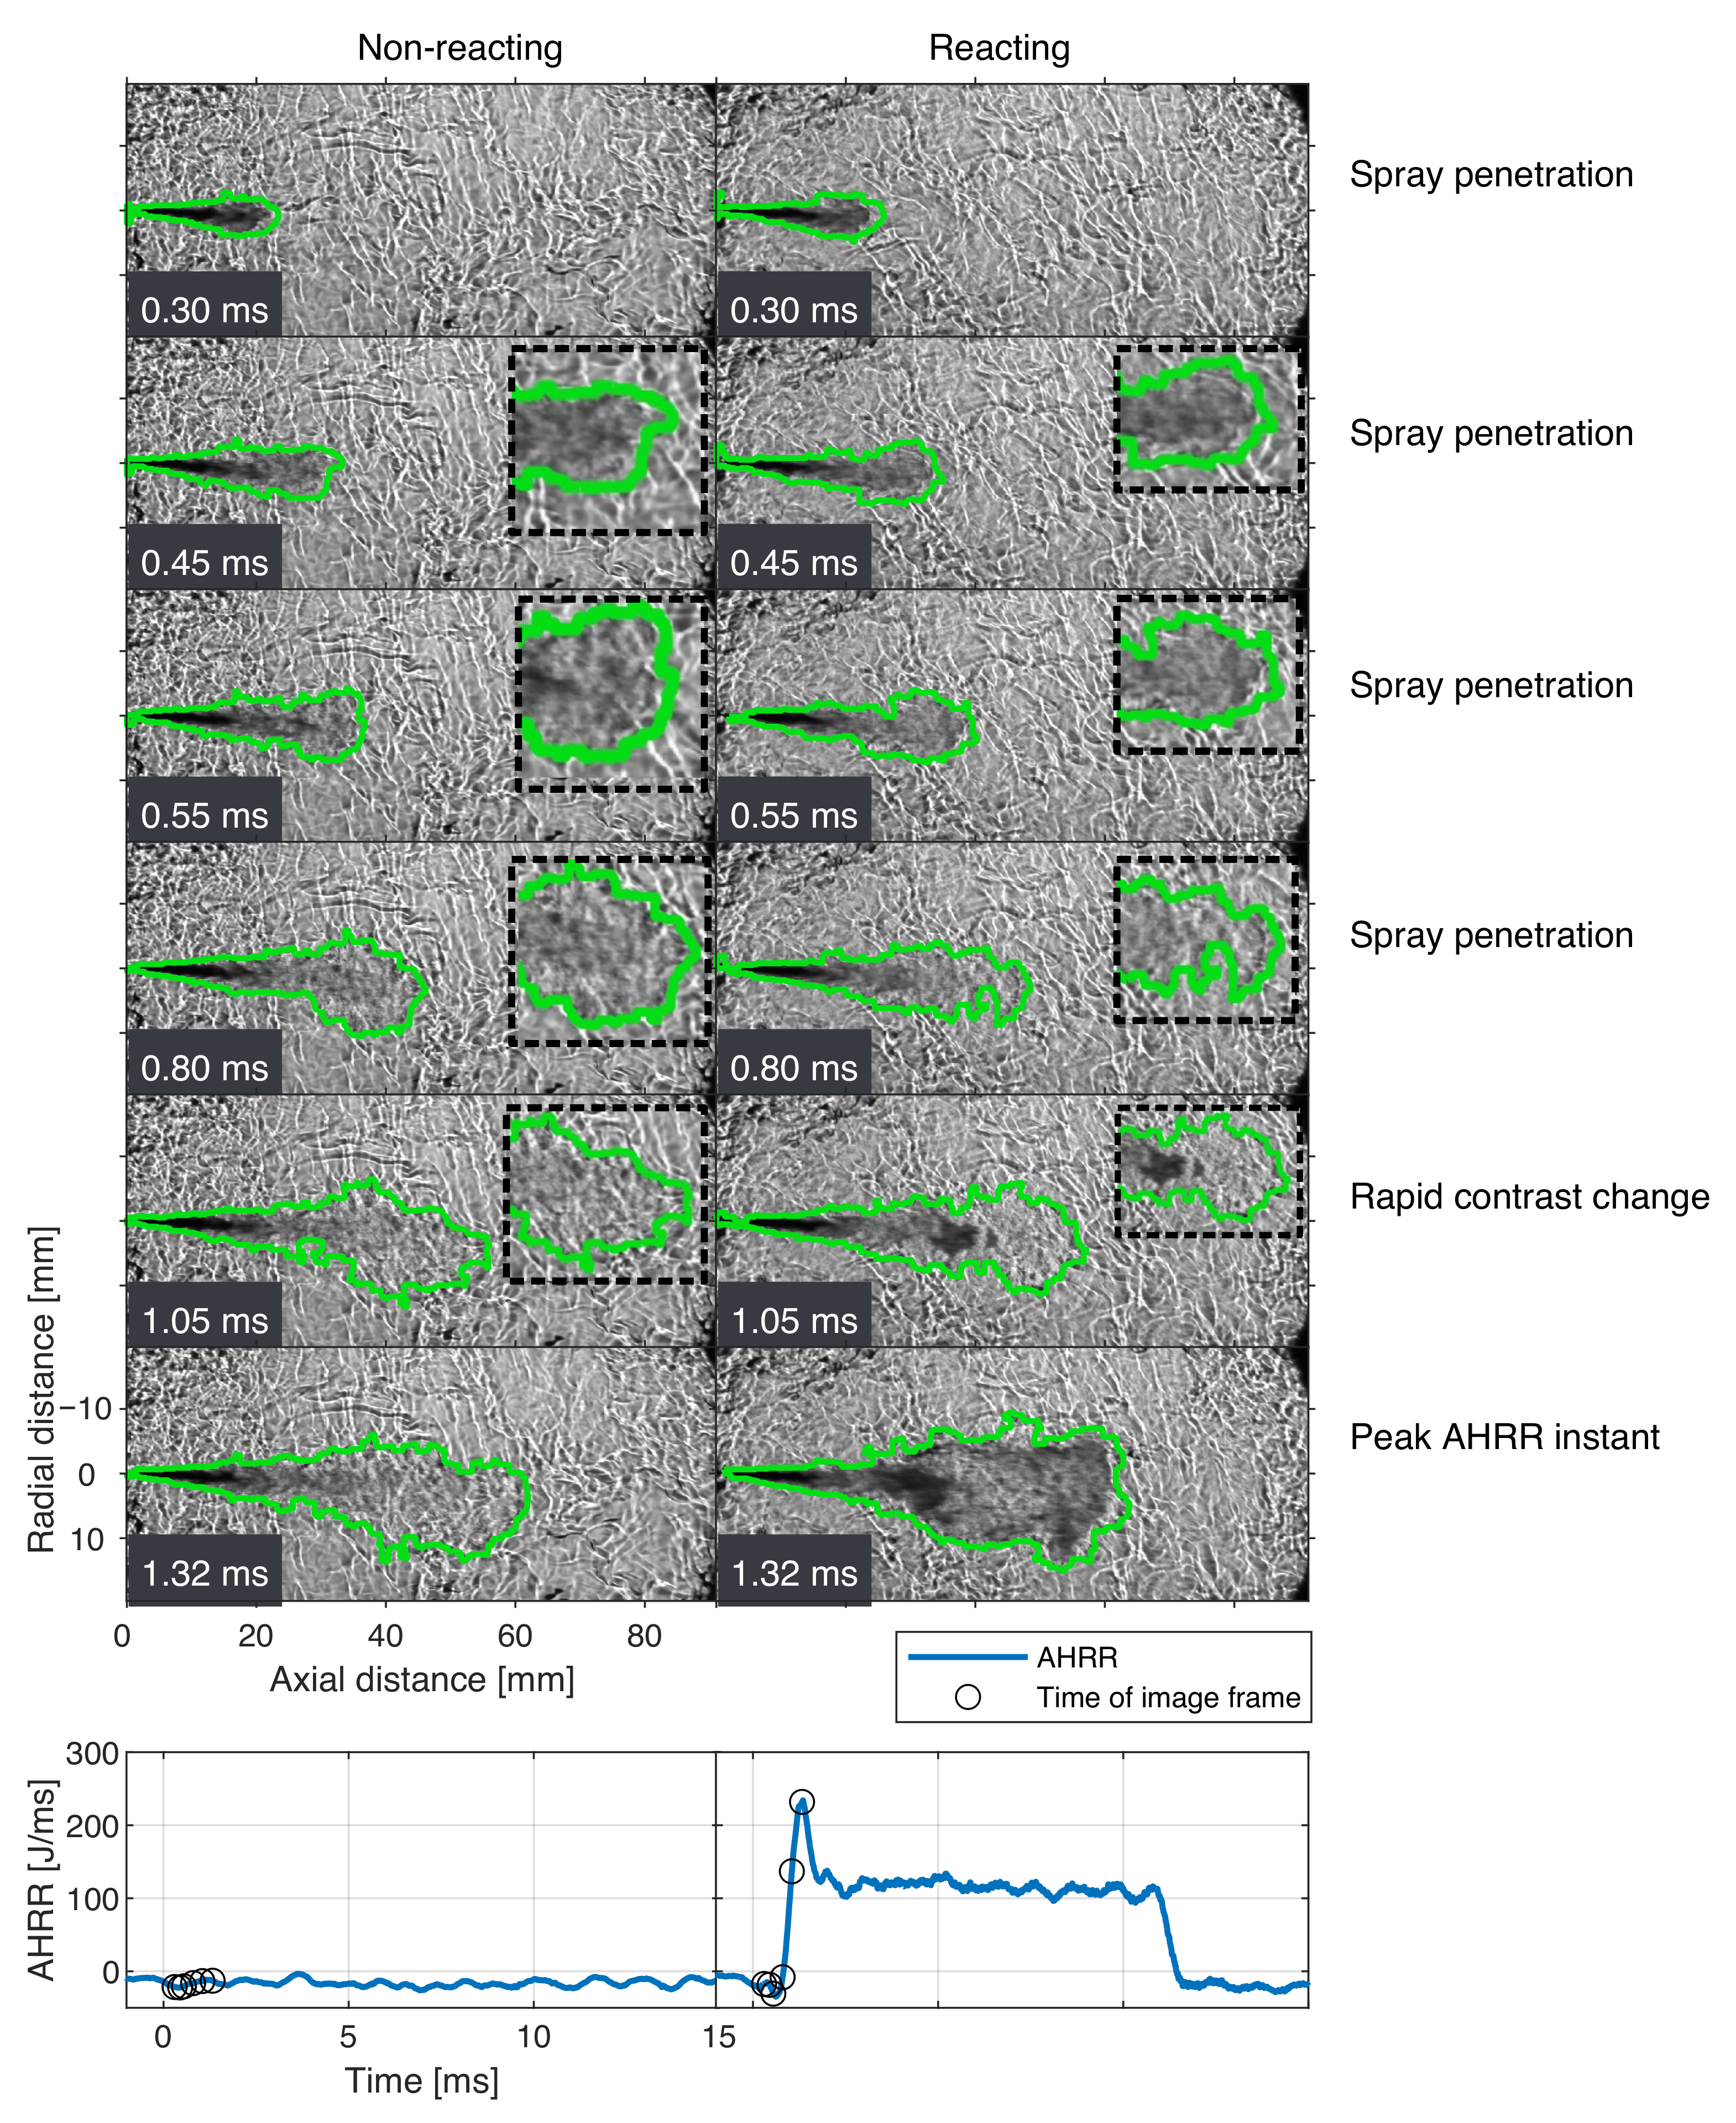
To examine this, reacting and non-reacting schlieren images recorded at reference conditions are compared. Figure 10 presents time-sequenced schlieren images of a non-reacting spray (left) and a reacting methanol spray (right). At 0.25 ms aSOI, both cases appear similar: liquid and vaporising fuel form dark regions, axial and radial penetrations match, and the liquid length is about 19 mm. From the second to fourth frames, the spray-head regions in both cases show lighter contrast than the liquid core but remain darker than the background. The reacting case appears slightly darker, with background features inside the jet boundary being less distinguishable, but the differences are marginal. As the sprays evolve, the overall contrast of both jets changes. By 1 ms aSOI (fifth frame), the reacting case shows localised high-contrast regions, but the spray head remains similar to the non-reacting case. Between 1.0 and 1.27 ms aSOI, the non-reacting spray propagates axially with nearly constant radial width. In contrast, the reacting spray expands radially due to high-temperature combustion, as indicated by darkened schlieren regions and corresponding heat-release profiles.
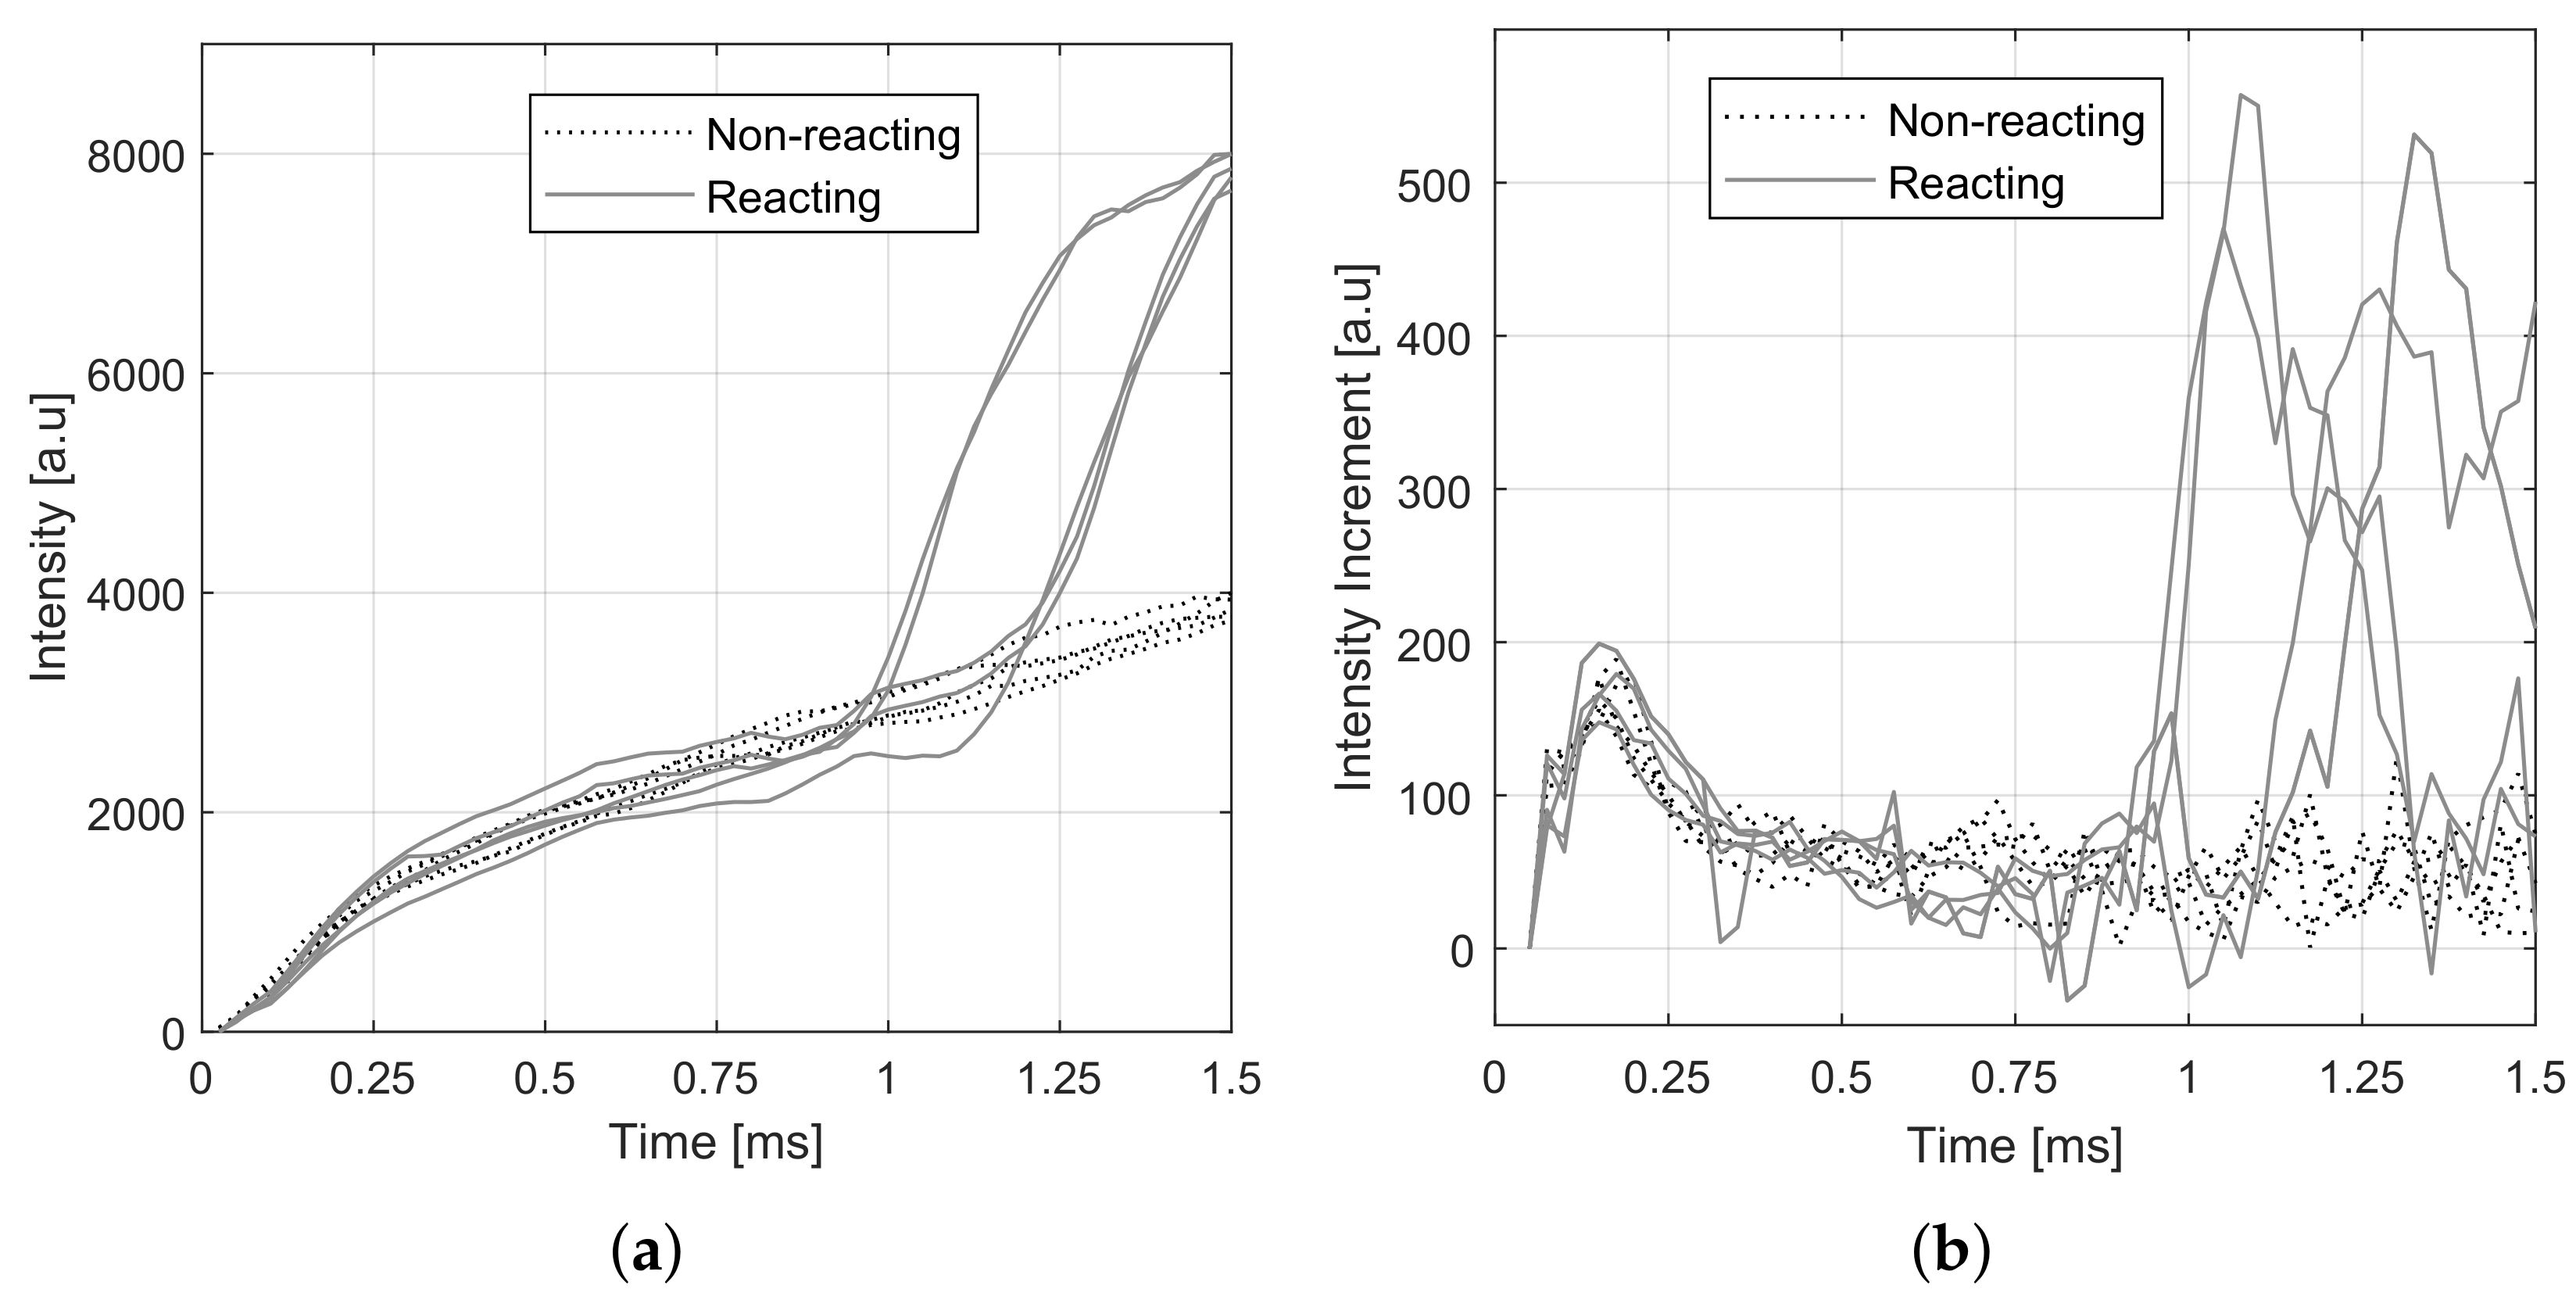
The comparison shows that the visual differences between reacting and non-reacting schlieren images prior to high-temperature ignition are subtle. Therefore, adapting the approach of Banajes et al. [43], the intensity variations within the jet boundaries were analysed over time to quantify subtle refractive-index changes. The results from five runs of both cases are shown in Figure 11a, with the corresponding intensity increments (i.e., frame-to-frame intensity changes) further presented in Figure 11b. The analysis was restricted to the spray boundary, unlike earlier studies that assessed whole-image intensity changes, which can make variations too subtle to detect, particularly for methanol, where overall intensity differences are small [43]. For the non-reacting cases, intensity increases steadily throughout the injection. In reacting cases, a brief plateau precedes a sharp rise associated with high-temperature ignition, consistent with the appearance of darkened schlieren regions. Increment plots show a slight reduction in the rate of increase before ignition for the reacting cases compared with the non-reacting cases. Overall, the results suggest that the technique can still be useful in capturing refractive index changes in the lead-up to and during high-temperature ignition, but the differences are small and significantly weaker than those reported in diesel sprays [17,43,44].

3.3.2. Injection Pressure Effect

Previous studies have demonstrated that injection pressure alters the injected fuel quantity, spray penetration, atomisation, and mixing [45]. As the primary interest of this work is to compare flame development and stabilisation processes over an identical time frame, the injection duration was held constant. Therefore, the observed trends across the pressure sweep inevitably reflect the effects of a varying fuel energy share alongside changing injection pressure, a limitation that should be noted when interpreting the results. Figure 12 presents schlieren images of the injection pressure cases. In all cases, spray development follows that described for the ambient-temperature cases: the liquid core forms first, ignition appears as marked by rapid mid-jet darkening, and subsequent combustion drives radial and axial expansion. As expected, increasing injection pressure yields greater axial vapour penetration at ignition in the selected runs, as seen by comparing the third frame in each column of Figure 12 (70, 100, and 130 MPa, left to right).
Figure 13 shows average AHRR profiles for methanol sprays at three injection pressures. All profiles exhibit the expected rapid rise in heat release after ignition, followed by a quasi-steady phase. As noted earlier, although a higher injection pressure enhances atomisation and mixing, the relatively long chemical delay of low-cetane methanol results in only limited sensitivity of ignition delay to injection pressure. Injection pressure, nevertheless, has a clear influence on combustion: peak apparent heat release increases from 70 to 130 MPa (black to blue curves, Figure 13). With the ignition delay remaining unchanged, the differences are attributed to the greater injected and entrained fuel mass at higher pressures. After the initial peak, all cases transition into a diffusion-controlled plateau, with AHRR levels rising with injection pressure in line with the higher continuous fuel supply.
Figure 14 compares the resulting flame base locations for the injection pressure cases. Focusing on trends beyond 2.5 ms aSOI (after the jet head has travelled beyond the field of view), the flame base shifts progressively downstream with increasing injection pressure. At the lowest pressure, the flame base locates closer to the injector, although schlieren images still show clear separation between the liquid phase and lift-off. Although the schlieren-based flame base positions show some fluctuation, including instances where rapid lift-off reductions are observed (two sample events are highlighted with a white arrow in Figure 14 as a reference), they remain within the uncertainty bounds of the OH*-based lift-off values. Overall, the results indicate that the schlieren and OH*-derived lift-off values are consistent across the tested injection pressure range.

3.3.3. Ambient O2 Concentration Effect

Figure 15 shows schlieren sequences for ambient O2 variation cases. In all cases, the spray evolution is similar to the reference: a liquid core forms first, ignition appears as mid-jet darkening, and combustion then drives radial and axial expansion.
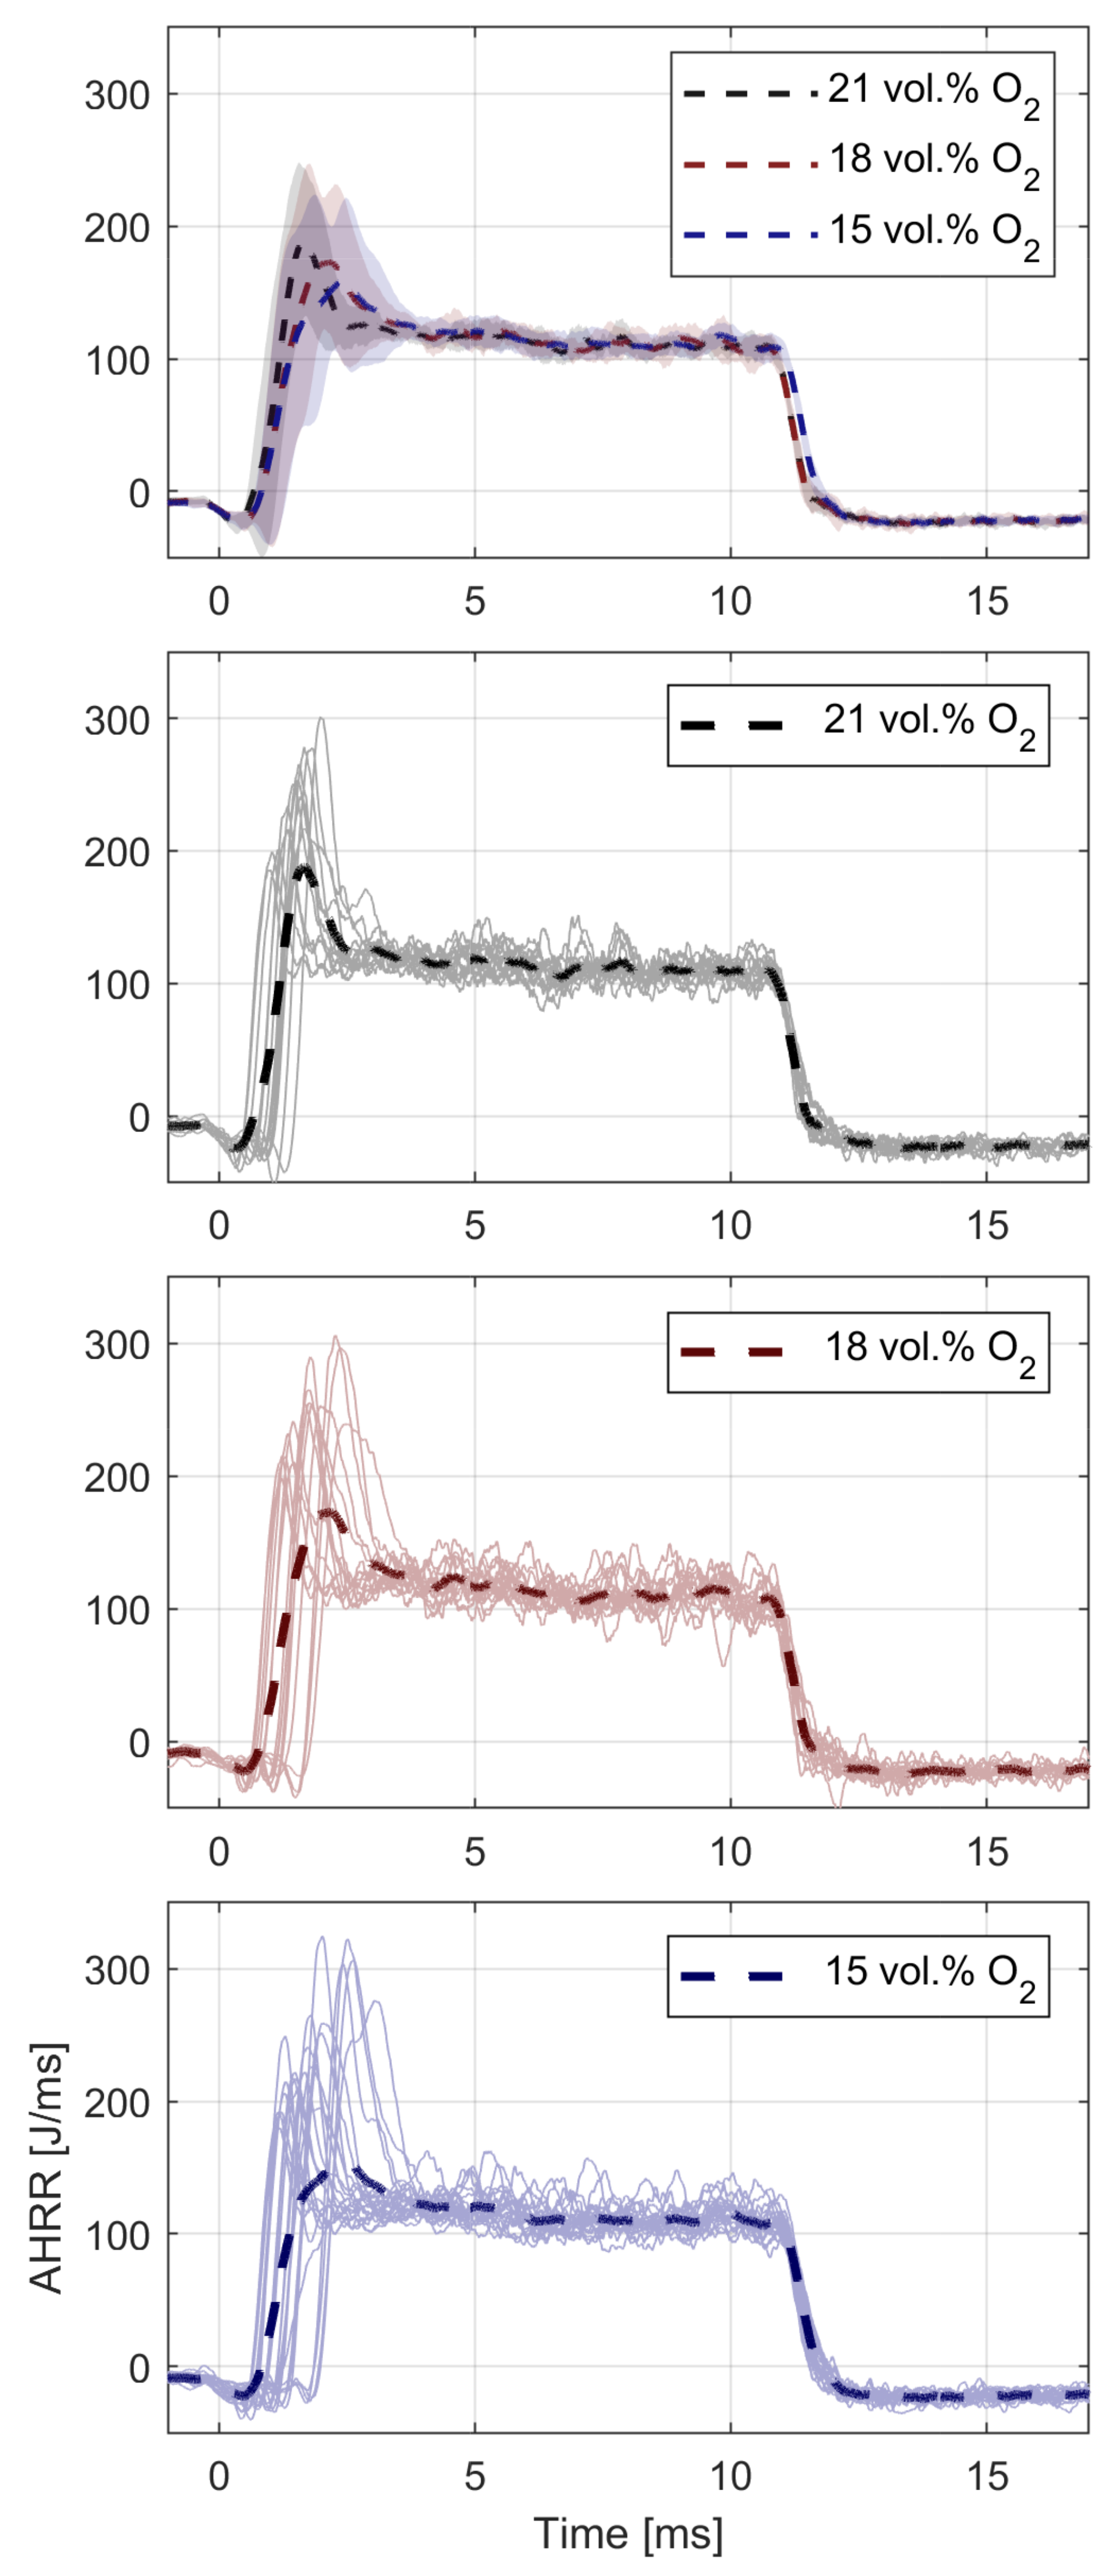
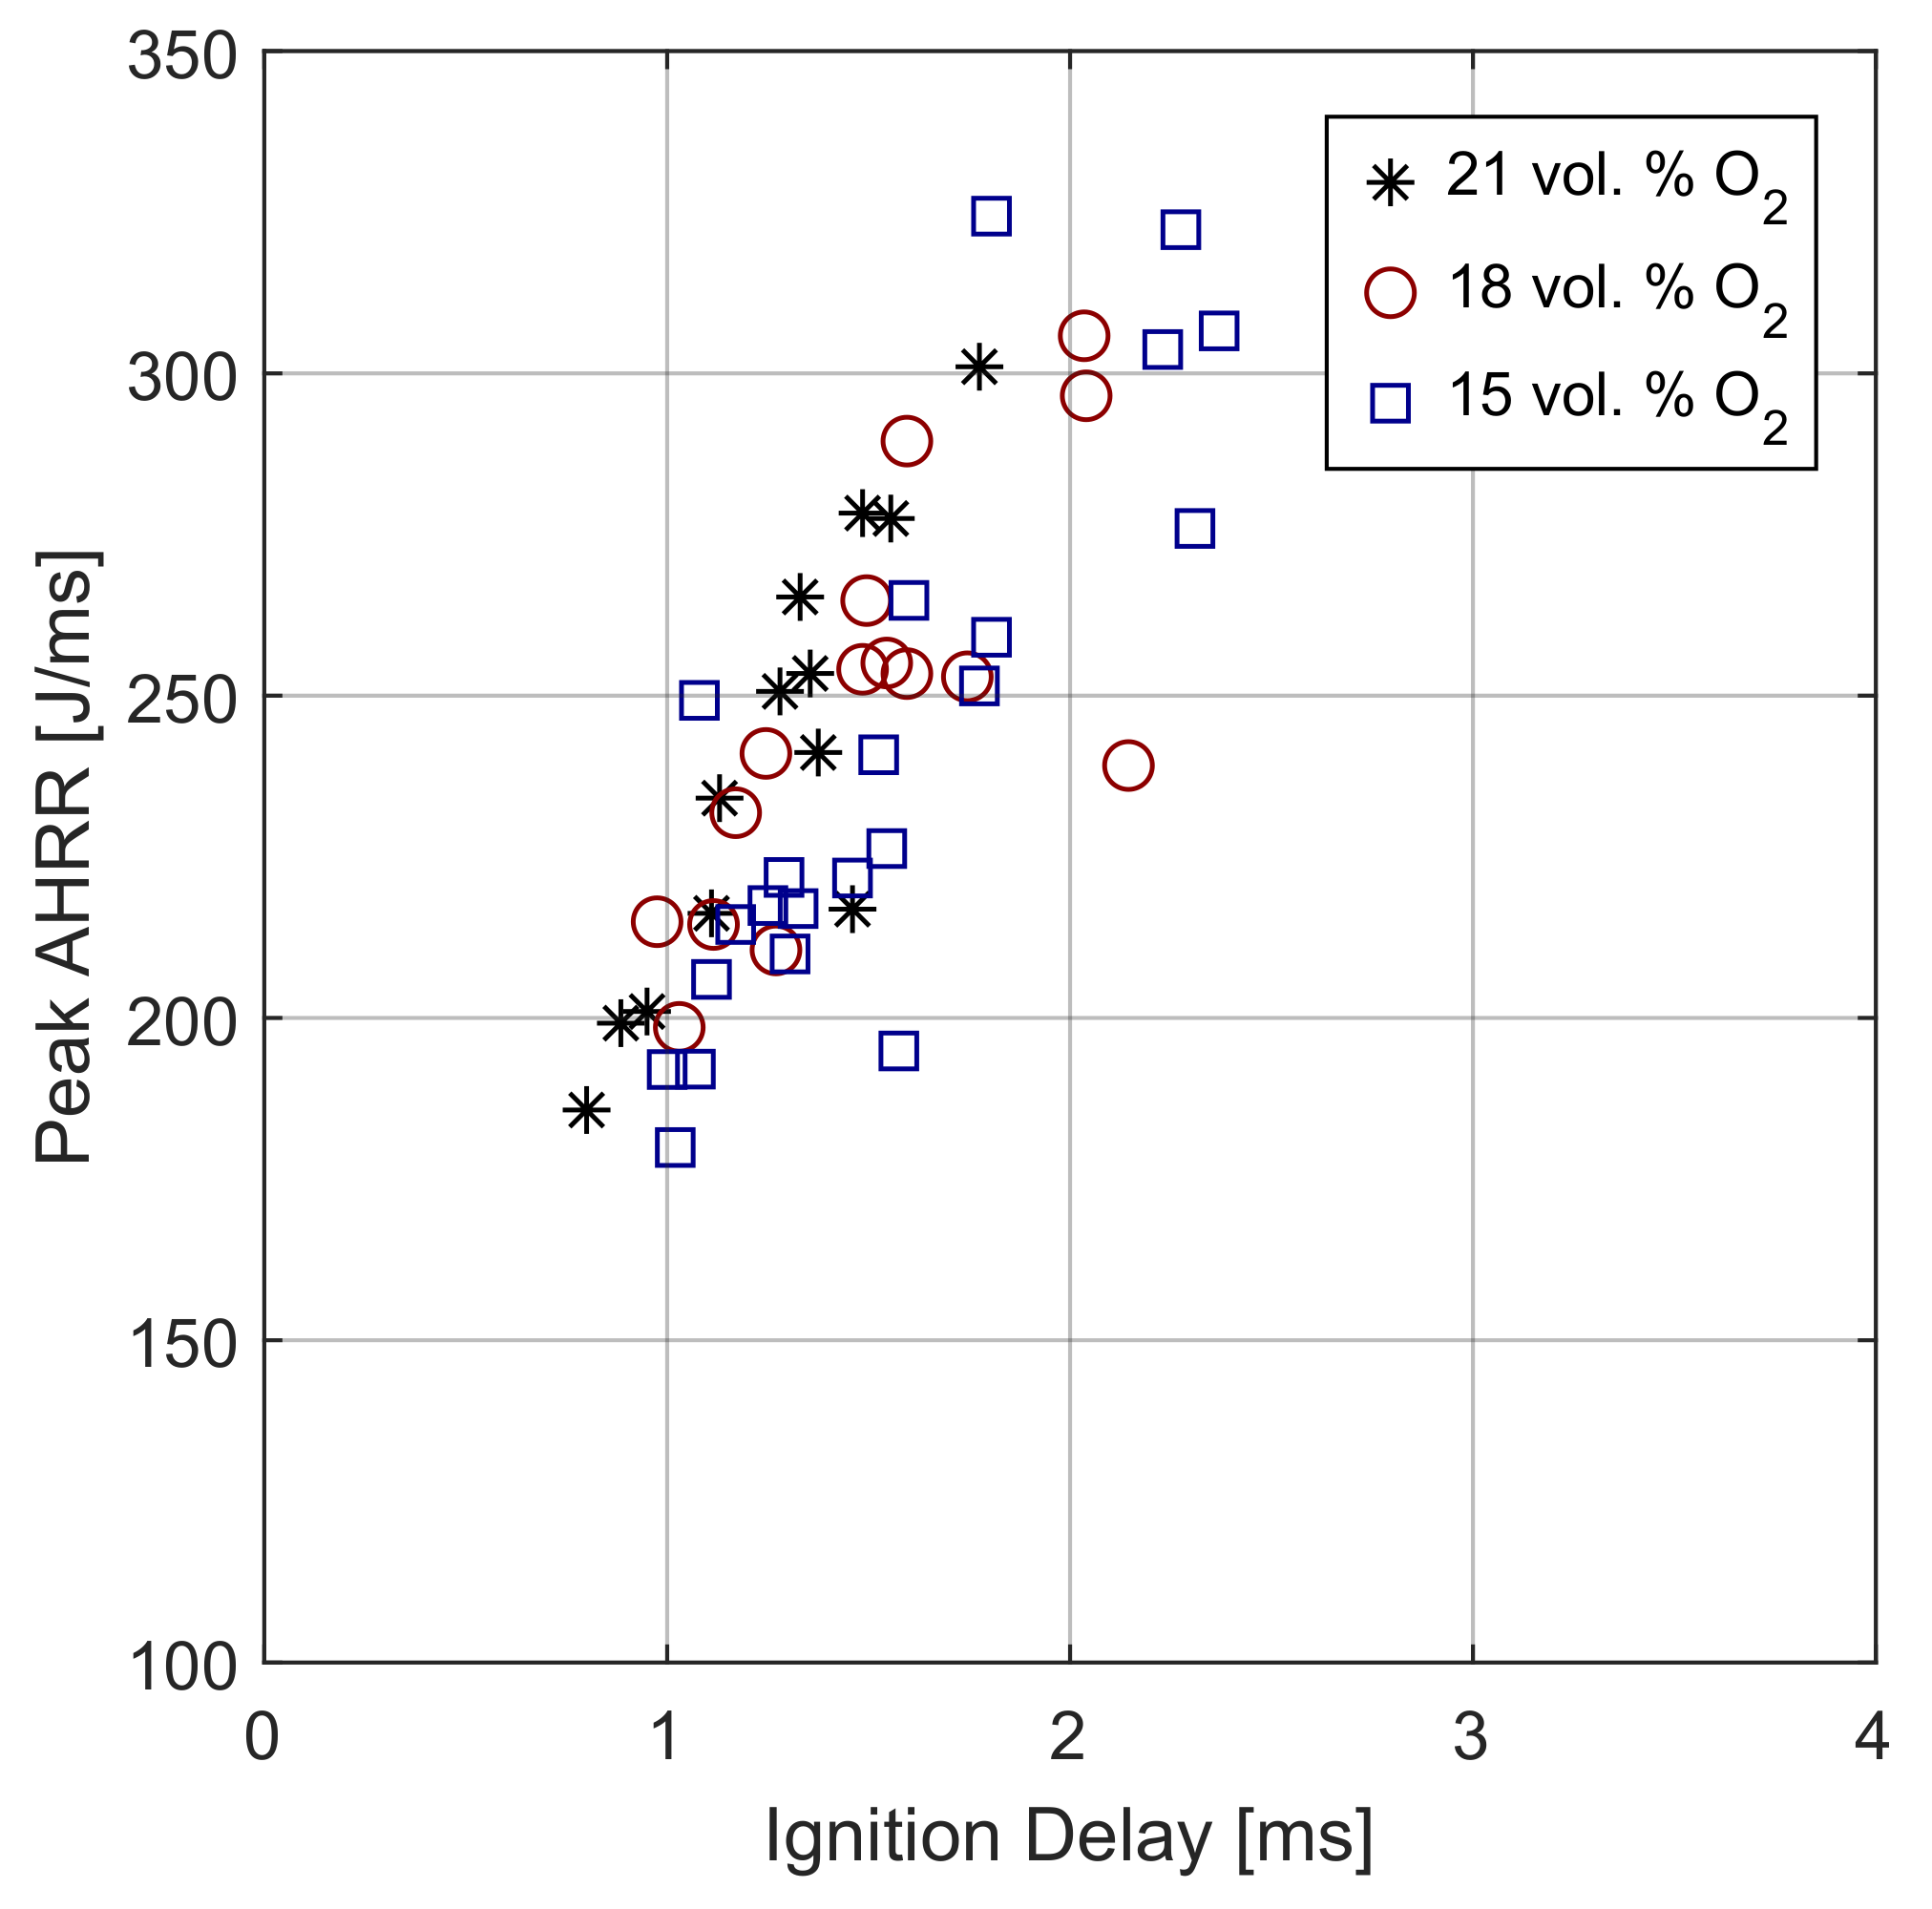
Figure 16 shows AHRR curves for the varied ambient O2 concentration cases. The averaged profiles and associated standard deviations (Figure 16, top panel, black/red/blue curves for 21/18/15 vol.% O2, respectively) indicate a decrease in peak AHRR with reduced O2 concentration, consistent with findings from previous studies [46]. However, uncertainty in AHRR increases as the ambient O2 concentration decreases, with the standard deviation of ignition delay increasing from 0.27 ms at 21 vol.% O2 to 0.37 ms at 18 vol.% and 0.43 ms at 15 vol.% (summarised in Figure 5). The broader timing spread introduces greater run-to-run variability, which can obscure individual premixed peak trends in ensemble averages. To examine this, individual experimental runs are presented alongside their averages in Figure 16. The peak AHRR values for each run are also plotted against their measured ignition delays in Figure 17. Within each O2 concentration (Figure 17, black/red/blue markers for 21/18/15 vol.% O2), peak AHRR generally increases with ignition delay, reflecting longer premixing. Across O2 concentrations at a fixed ignition delay (Figure 17, comparing marker colours at a given x-axis value), lower O2 cases yield reduced premixed peak AHRR, although the reduction is less pronounced than the ensemble averages imply, indicating that averaging can mask timing variability, amplifying the apparent effect of O2. No clear influence of ambient O2 concentration is observed during the diffusion combustion phase. This is despite the expectation that combustion in the diffusion-controlled regime is governed by fuel-air mixing [46], and therefore, ambient O2 availability can influence the reaction and heat release rate. However, a prior study [46] reported that biodiesel exhibited more closely matched heat-release behaviour during the mixing-controlled phase when the ambient oxygen concentration is compared to diesel. This behaviour may be attributed to the fuel-bound oxygen in biodiesel, which partially offsets the effects of ambient oxygen changes [47]. This likely explains the invariant diffusion phase heat release profile of methanol, which contains approximately 50% oxygen by mass, but further investigation is needed to clarify.
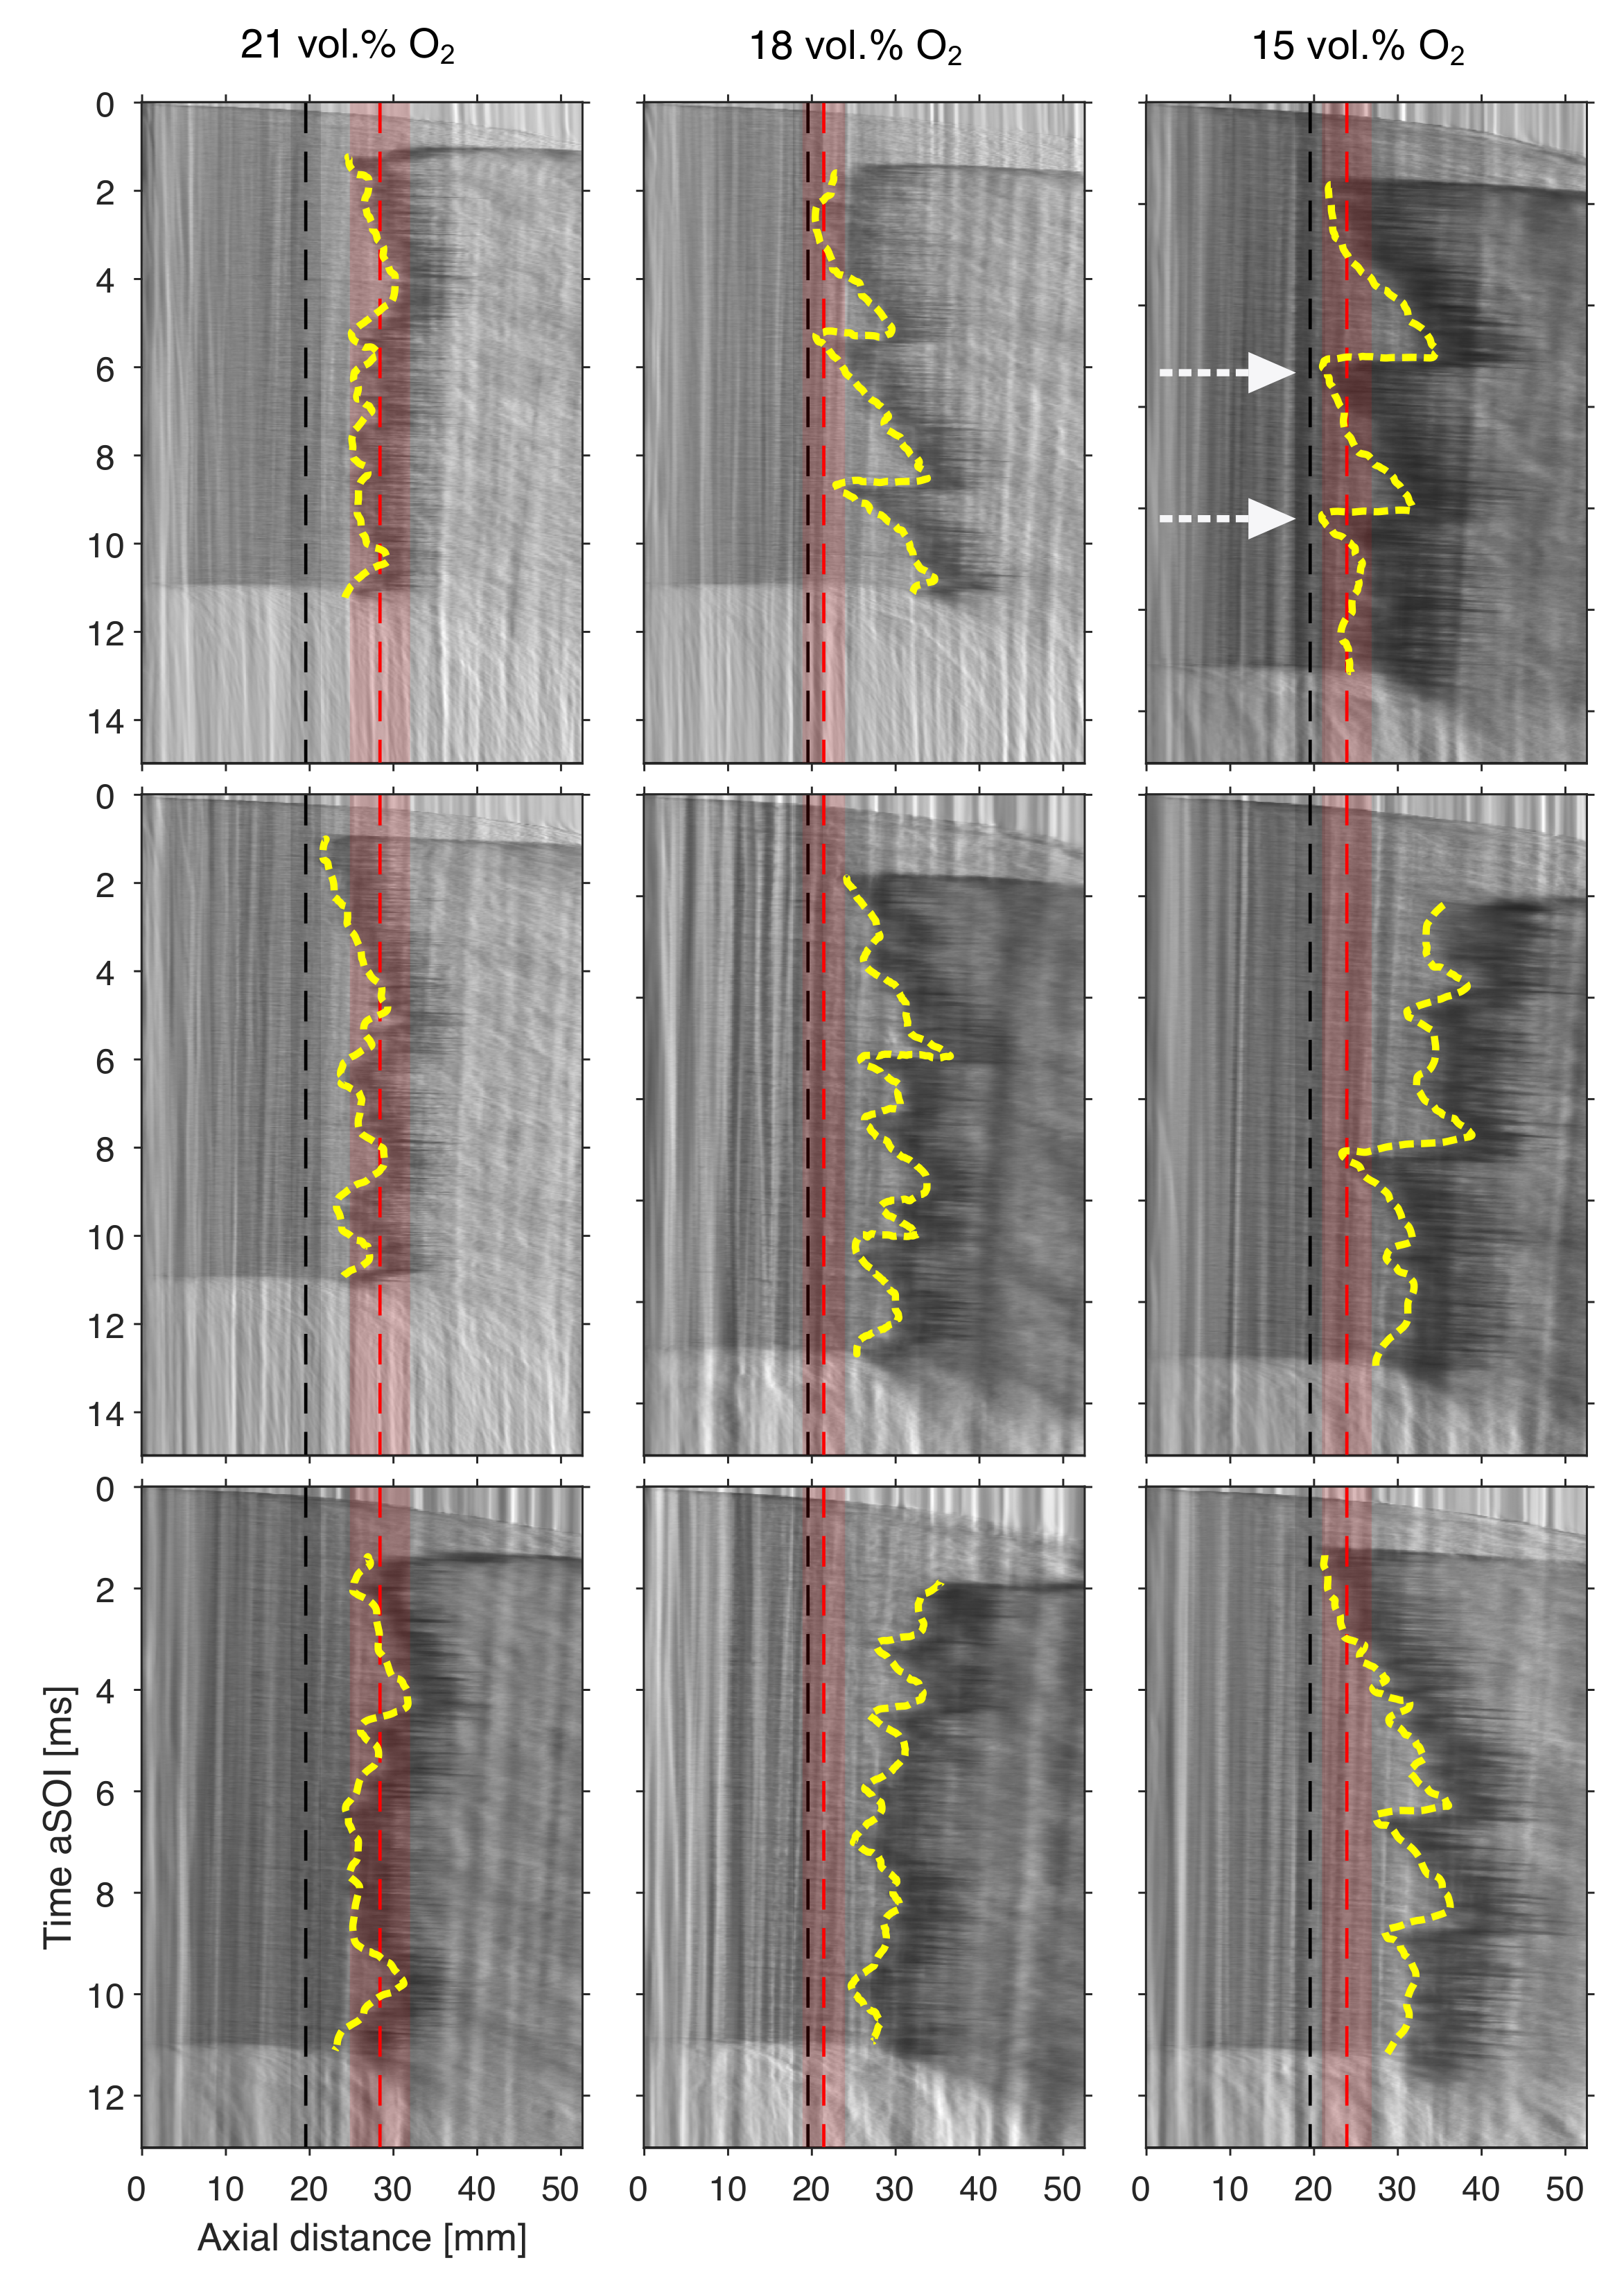
Similar to the earlier analysis, schlieren-derived lift-off positions for the ambient O2 cases are shown in Figure 18. Relative to the 21 vol.% O2 reference, the 18 vol.% and 15 vol.% cases exhibit a larger temporal spread in lift-off location (two sample events of rapid lift-off reductions are highlighted with white arrows in Figure 18 for reference). Under these lower-O2 conditions, the schlieren-identified flame base often lies outside the range of the time-averaged OH* lift-off and its uncertainty bounds.
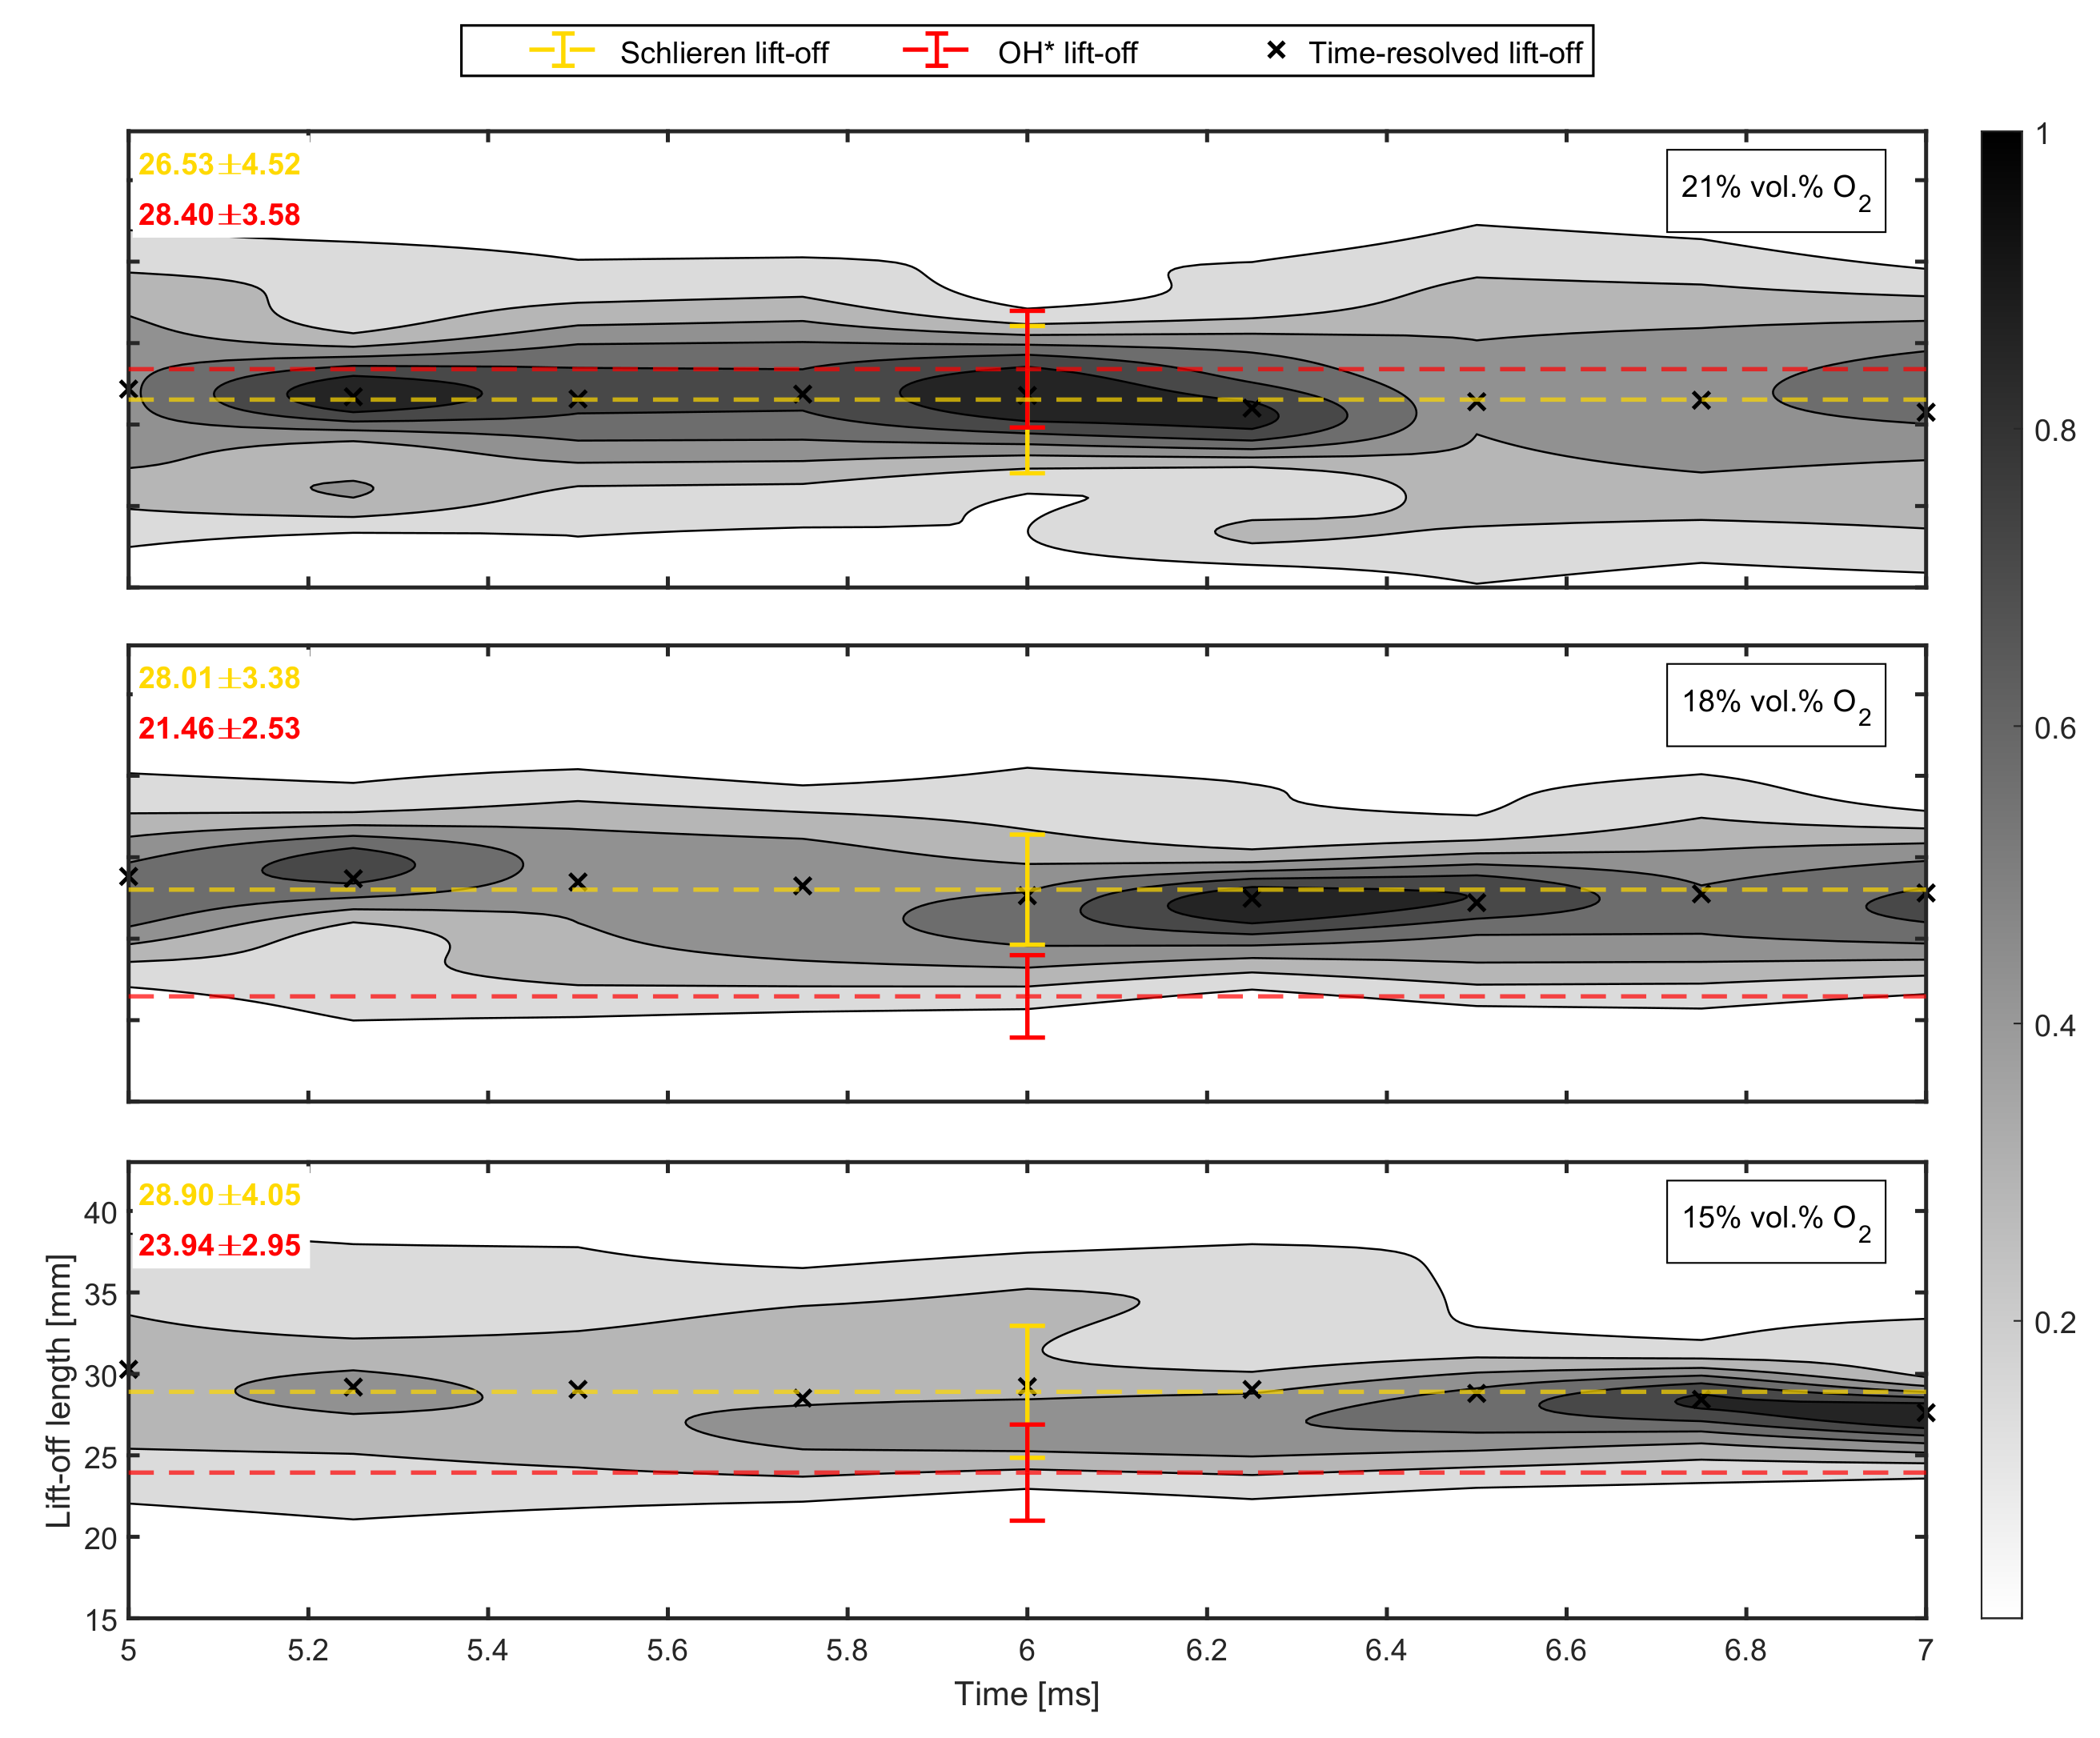
To examine the source of this discrepancy more closely, probability density functions (PDFs) of the instantaneous flame base positions were extracted for each ambient O2 condition, along with the corresponding mean positions at different times after SOI, as shown in Figure 19. These are then compared with both the OH*-based lift-off values (time-averaged over 5–7 ms) and the schlieren-derived lift-off values over the same interval, ensuring that all diagnostics are evaluated over an identical portion of the injection event. The distributions show that the flame base position fluctuates considerably across all O2 cases. The PDFs show that the schlieren-based lift-off follows the mean flame base location more closely. This is expected, as the schlieren lift-off and flame base statistics originate from the same datasets, whereas the OH* measurements were acquired separately. It is also notable that the schlieren-derived lift-off lengths (yellow dashed lines, all three panels of Figure 19) exhibit the expected increase with decreasing ambient O2 (26.53 mm at 21 vol.% O2 to 28.90 mm at 15 vol.% O2, values listed in the top-left corner of each panel in Figure 19), a trend consistent with diesel behaviour—even though the agreement is likely coincidental—unlike the OH*-based measurements (red dashed lines, same figure) as discussed in Section 3.2. While OH* chemiluminescence has known limitations, it remains the most widely used diagnostic for lift-off length measurements in the literature. The comparison nevertheless highlights the challenges of inferring meaningful time-averaged lift-off lengths when the flame base remains highly unsteady throughout the injection event and between runs. Under such conditions, diagnostics capable of resolving the temporal evolution of the flame base, such as schlieren imaging, may reduce one source of uncertainty associated with lift-off length determination.

3.3.4. Axial Ignition Location

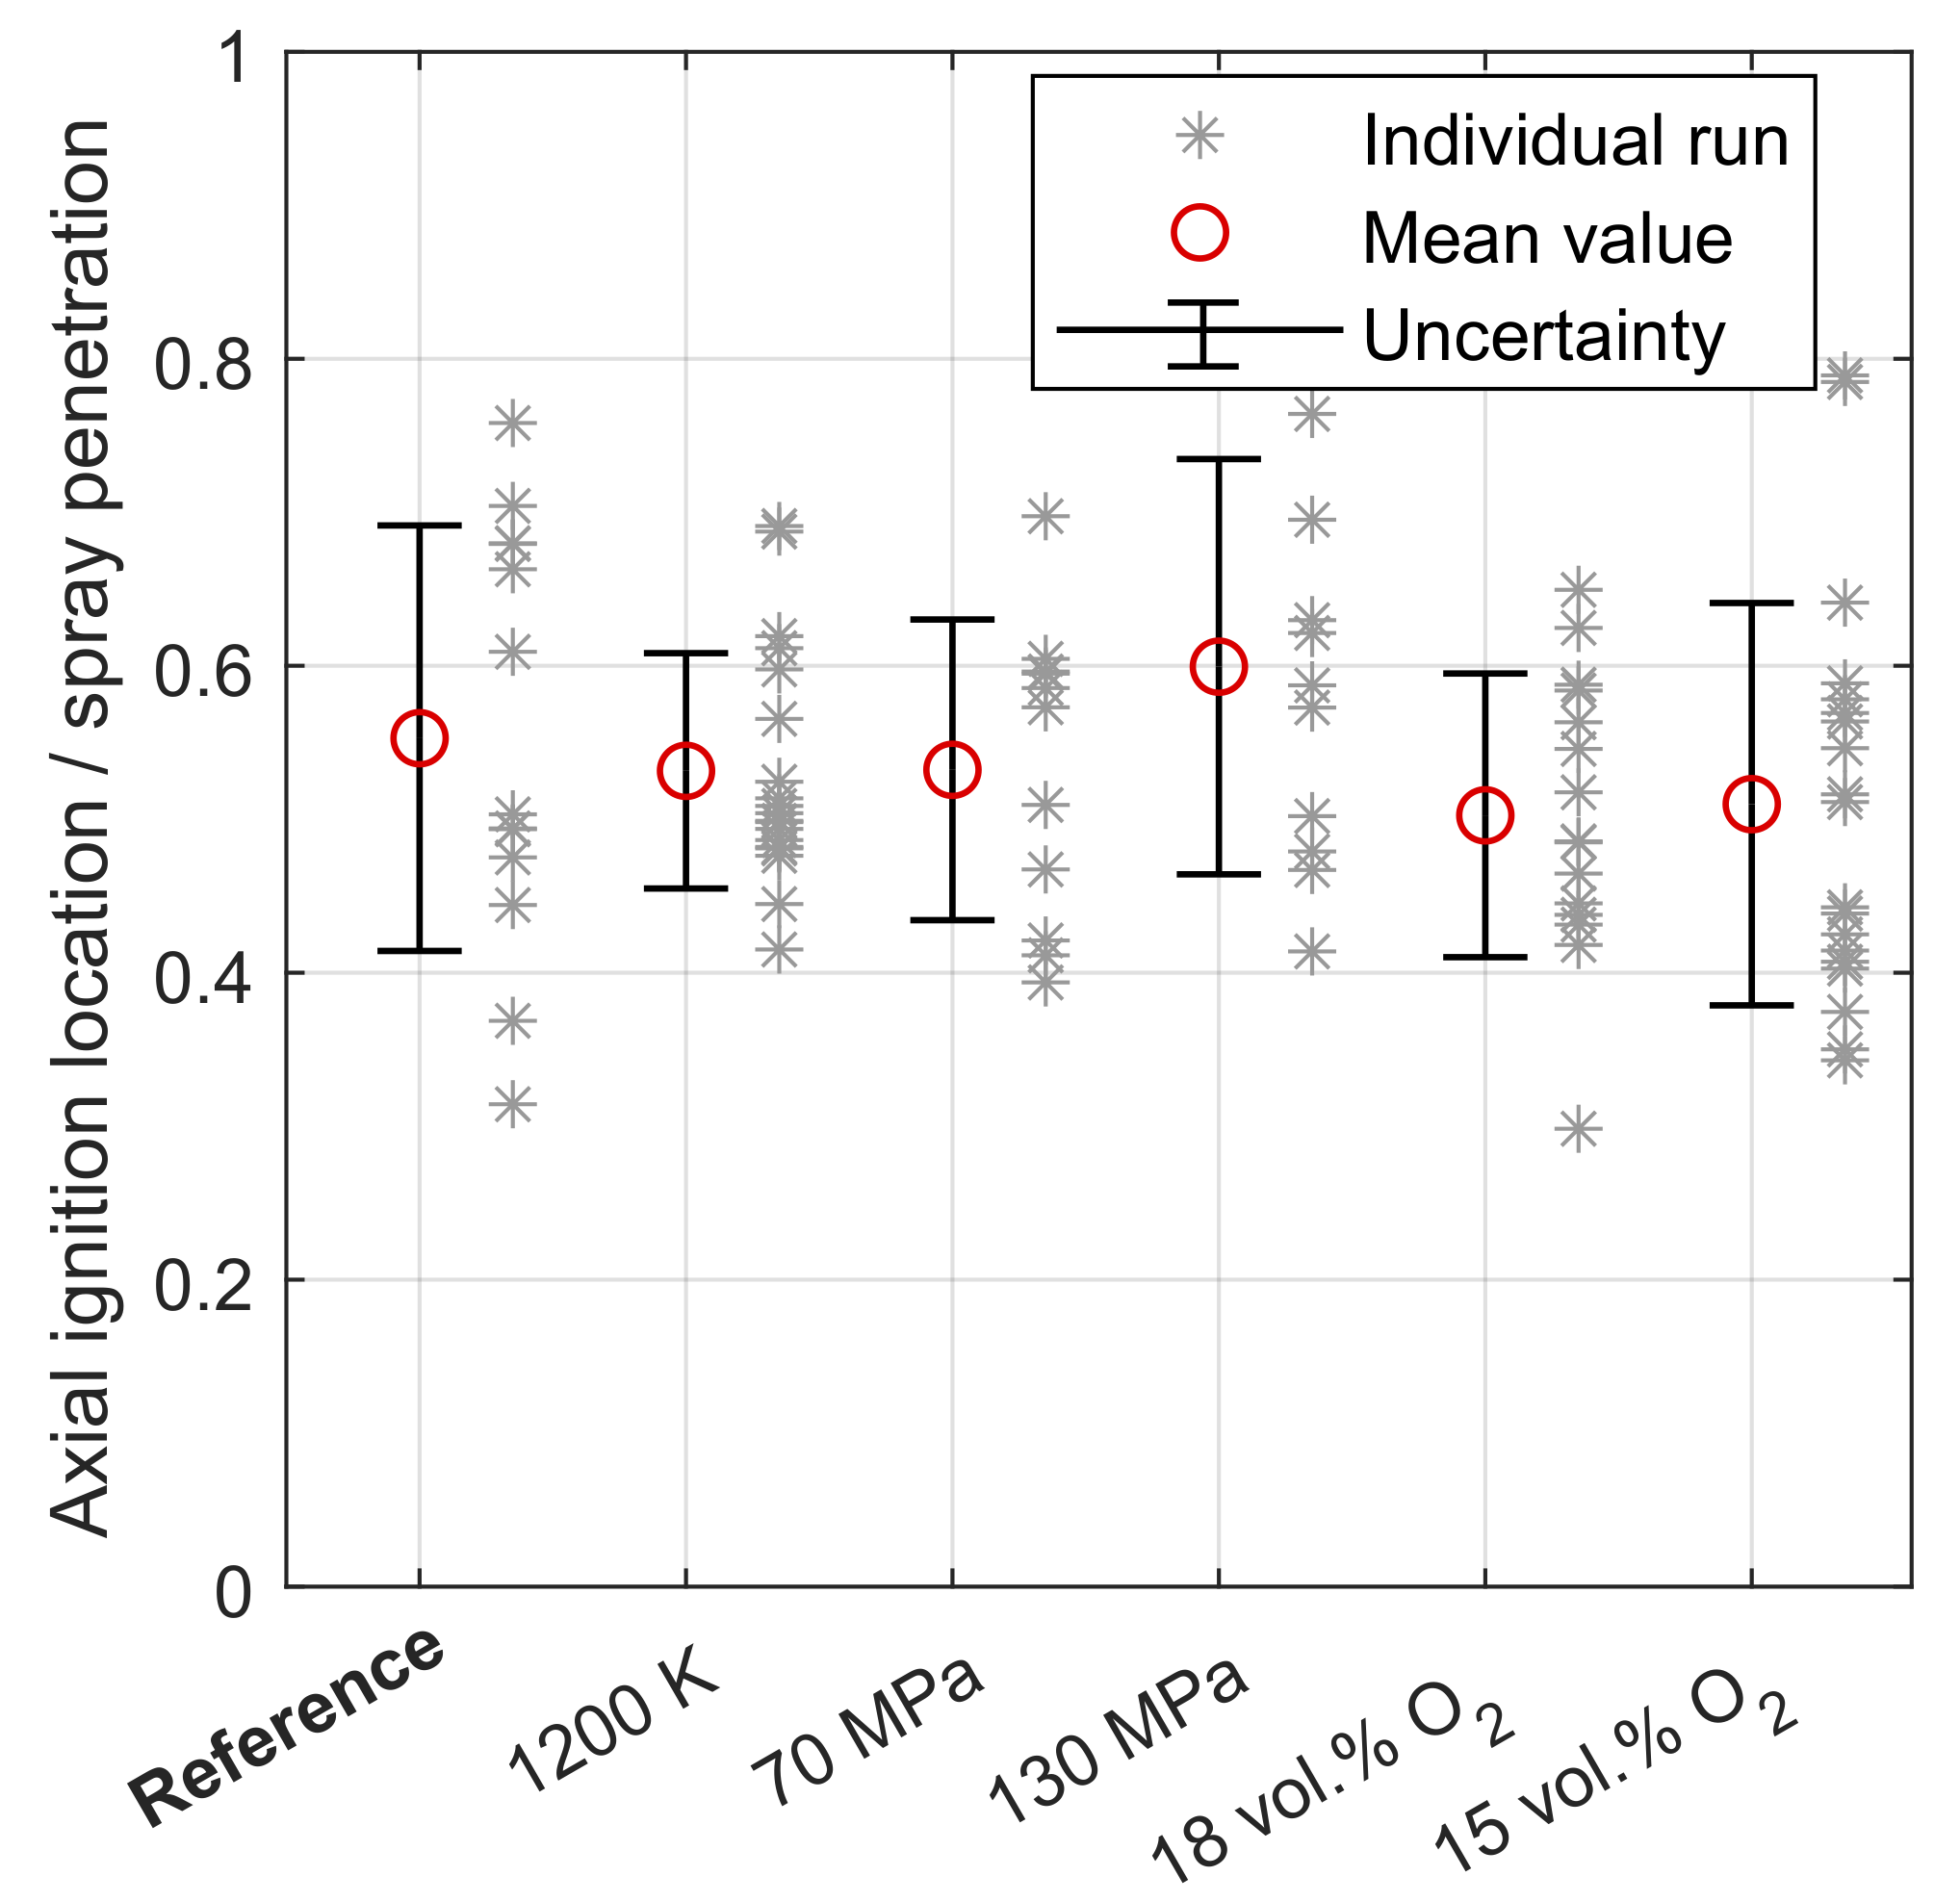
In the schlieren sequences presented earlier, ignition consistently initiated in the mid-jet region across all test conditions. To quantify this, the axial location of the first ignition kernel (excluding the 1000 K case, where ignition occurred beyond the field of view) was extracted from the schlieren images and normalised by spray tip penetration at ignition timing. The ignition location was defined as the axial distance from the nozzle to the first clearly detectable rapid change in schlieren contrast. As shown in Figure 20 (grey asterisks: individual runs; red circles: mean ignition location; black error bars: associated uncertainty), the results exhibit some scatter but consistently cluster in the mid-jet region across all six test conditions shown along the horizontal axis. Kaario et al. [42] reported a similar behaviour in their high-fidelity large eddy simulation (LES) of methanol and n-dodecane sprays. Their simulations showed methanol igniting preferentially in the mid-jet region, in contrast to n-dodecane, which ignited near the spray tip. The study attributed this to mixture-reactivity effects: methanol’s most reactive equivalence ratio is leaner than stoichiometric, which leads to ignition for methanol occurring in the mid-jet region because that is where the local equivalence ratio aligns with the most reactive methanol-air mixture. While schlieren cannot resolve local mixture fraction or, as a line-of-sight diagnostic, pinpoint the three-dimensional spatial position of the ignition kernel, and the cited simulations and the present experiments are not exactly identical, the agreement between experimental ignition locations and LES predictions is still noteworthy.

3.4. Dual-Fuel

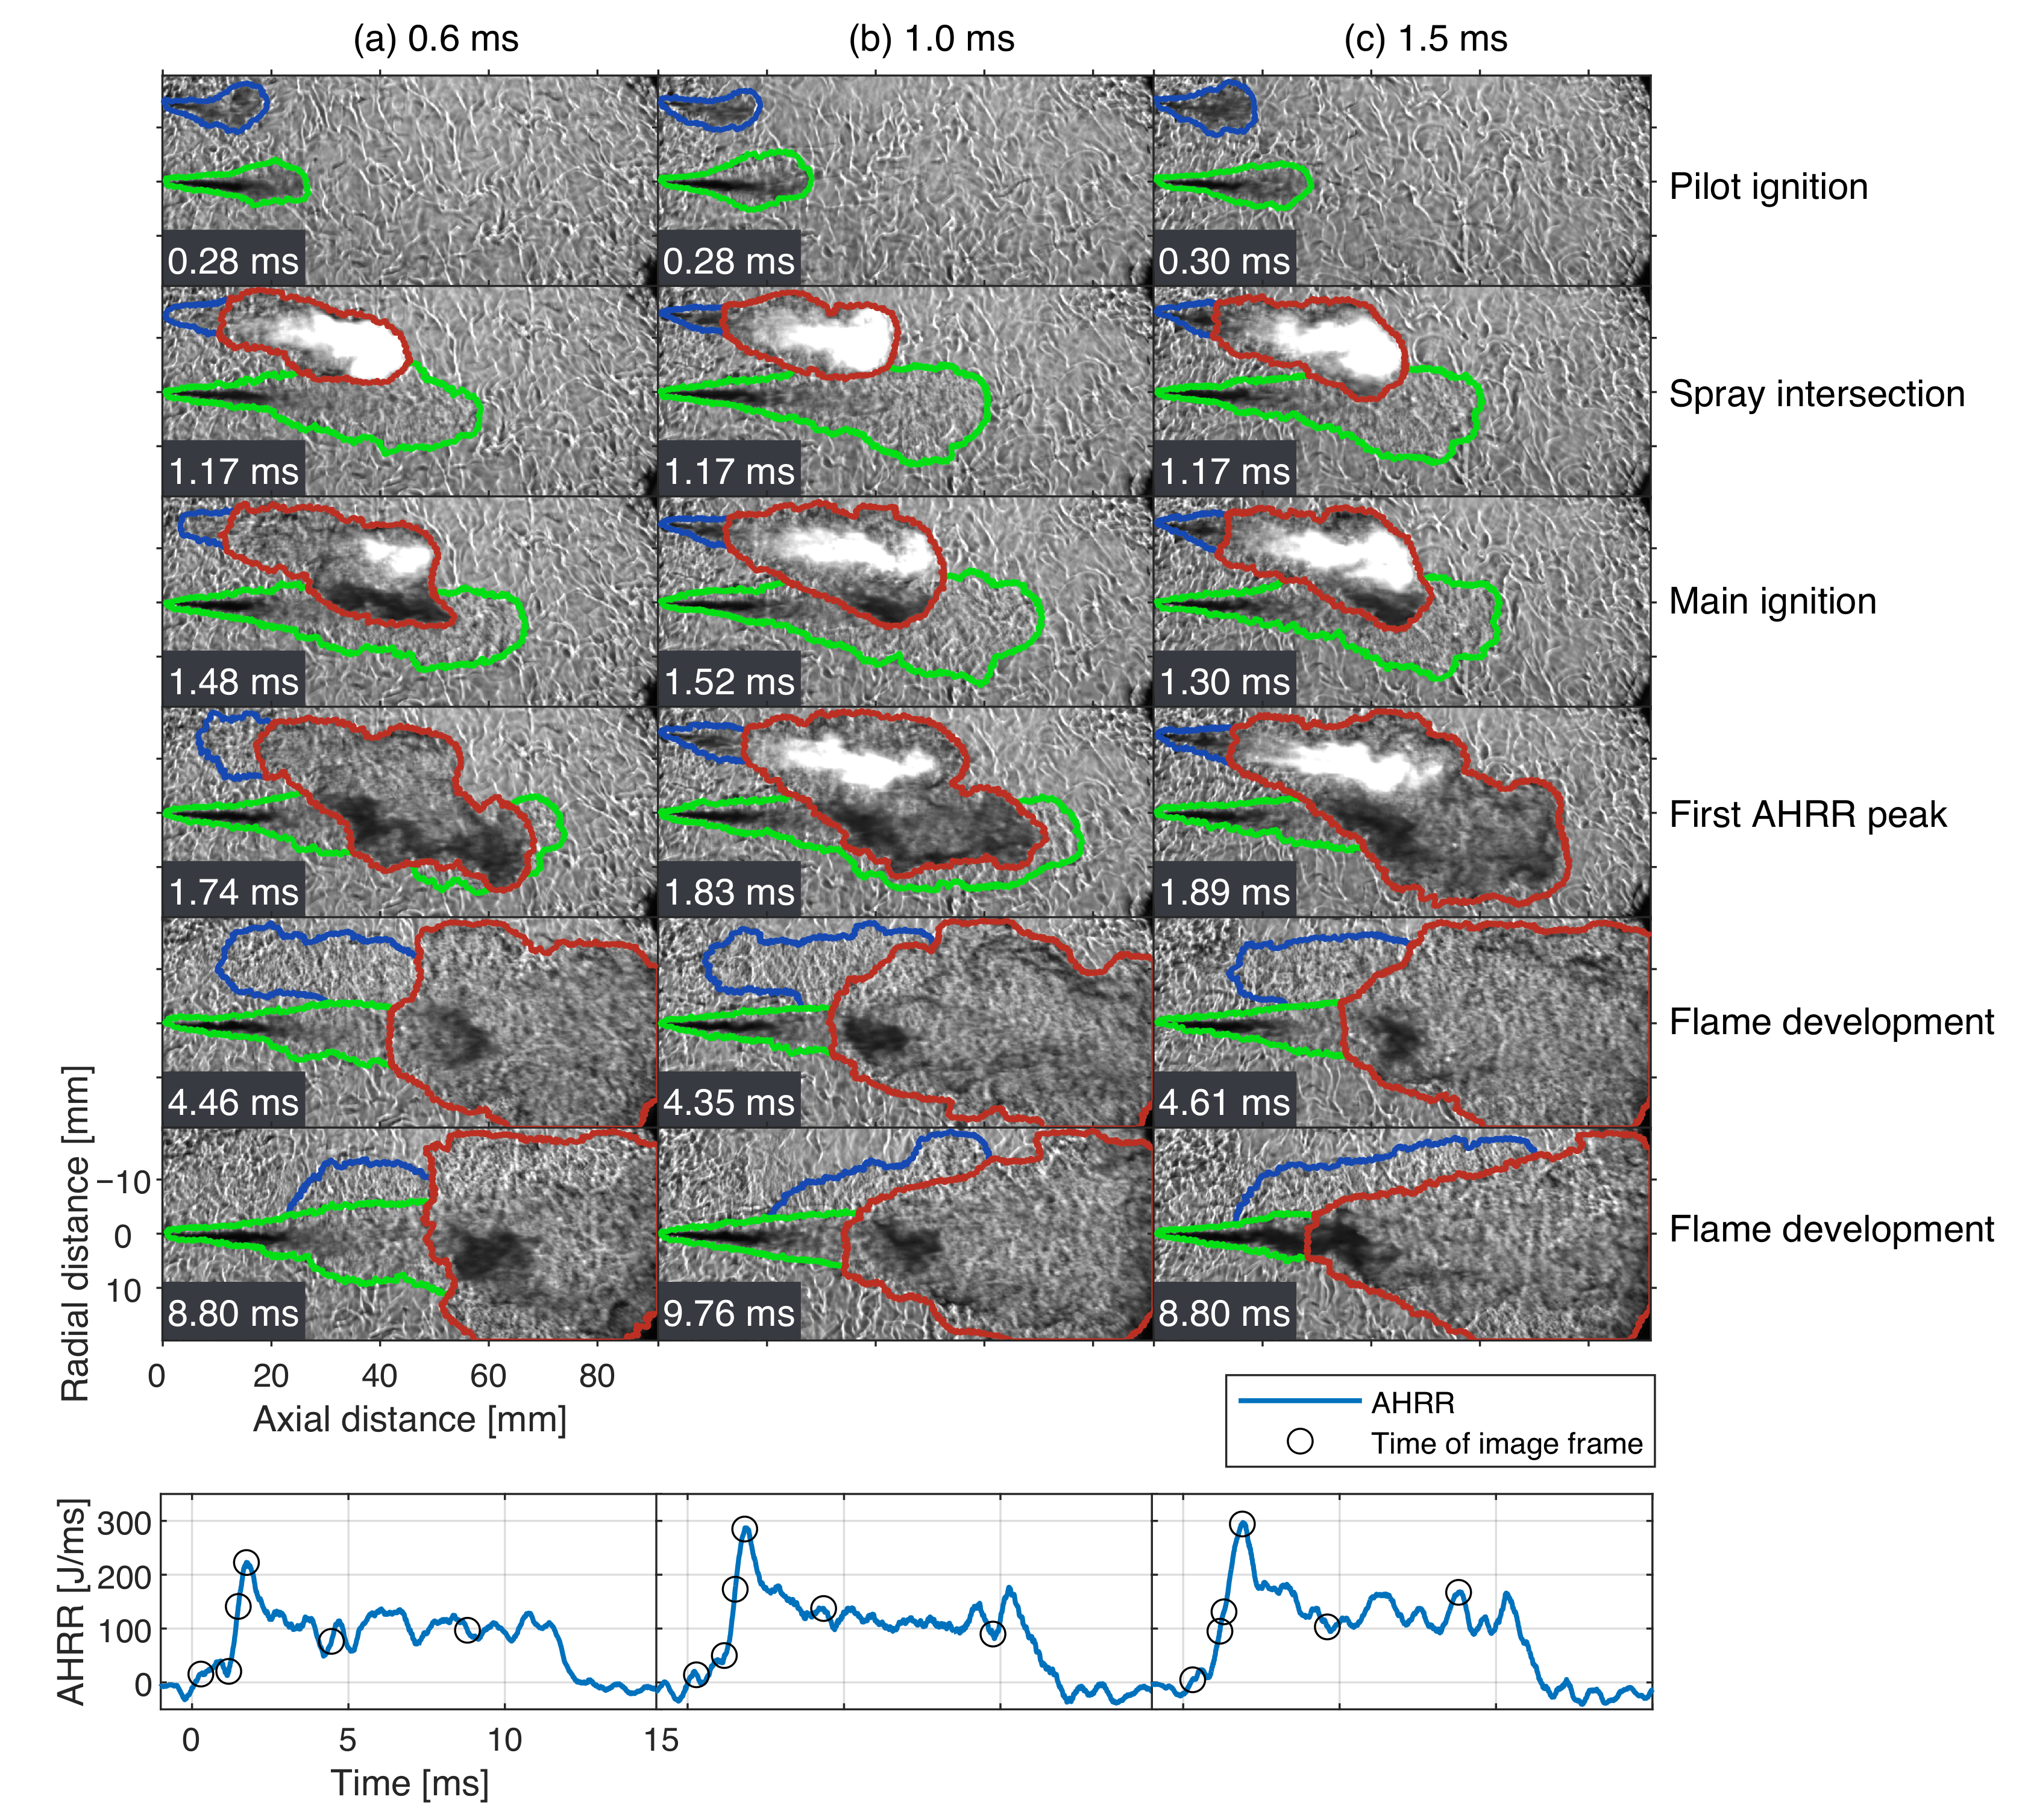
The preceding sections reported the methanol spray and autoignition behaviours. A key finding was the confirmation of a long ignition delay with large run-to-run uncertainty (i.e., 9.00 ± 1.33 in Figure 5) and a lift-off distance extending beyond the field of view at 1000 K. This highlights a challenge for using methanol as a single fuel in compression-ignition engines at a comparable top-dead-centre temperature range without modifications or ignition assistance. Accordingly, a dual-fuel strategy employing diesel as a pilot is considered here to enable methanol ignition at 1000 K. The present study provides a preliminary investigation for a future, more comprehensive dual-fuel evaluation, focusing on the influence of pilot injection quantity. Three pilot injection durations were tested, and for clarity, the cases are referenced by their electronic injection durations. This subsection is organised as follows: ignition delay, followed by combustion and heat-release characteristics. Temporal schlieren image sequences are used to illustrate the key stages of the combustion process—pilot ignition, jet–jet interaction, main ignition, the first AHRR peak, and flame development stage.

3.4.1. Ignition Delay

Table 4 presents ignition delays for both fuels across three pilot-jet injection durations. In the 0.6 ms case, the pilot end of injection (EOI) occurred just before main ignition, whereas for the 1.0 ms and 1.5 ms cases, methanol ignition began within the hydraulic injection duration of both. Regardless, for all three cases, the pilot ignition delay remained consistent, and the main ignition delays were within experimental uncertainties. These findings highlight the potential of the diesel-methanol dual-fuel approach under the test conditions and configuration, such that only a small quantity of pilot diesel can ignite methanol, with an associated uncertainty that is an order of magnitude lower than that observed for methanol autoignition at 1000 K.

3.4.2. Combustion and Heat Release Characteristics of Diesel Methanol Dual-Fuel

Figure 21 shows the temporal schlieren images for methanol-diesel combustion under three different pilot injection durations. The green and blue lines mark the methanol and pilot jet boundaries, while the red line outlines the high-temperature reaction zone. The wide dynamic intensity range and rapid structural changes make the development of an automated boundary-detection algorithm challenging. For example, the pilot jet moved rapidly, darkened, brightened, and then blended into the background after EOI, while the methanol jet exhibited its own evolving contrast patterns. A manual inspection procedure was therefore used to track coherent structures that maintained continuity across frames. Across all cases (Figure 21, columns a–c for the 0.6, 1.0, and 1.5 ms pilot durations), pilot fuel ignites first, externally to the main jet boundary, as shown by the red high-temperature reaction zone forming outside the blue pilot-jet boundary in the earliest frames of each column—which likely explains the consistent pilot ignition delay across pilot injection durations. The reaction front then intersects and propagates into the methanol jet. The main jet flame subsequently stabilises downstream from the nozzle, even after the pilot jet ceases injection. The luminous region originates within the pilot jet and diminishes once pilot injection ceases, with the pilot flame receding toward the injector after EOI. It is important to recall that, under the present test conditions, the lift-off length of the single-fuel case extends beyond the field of view.
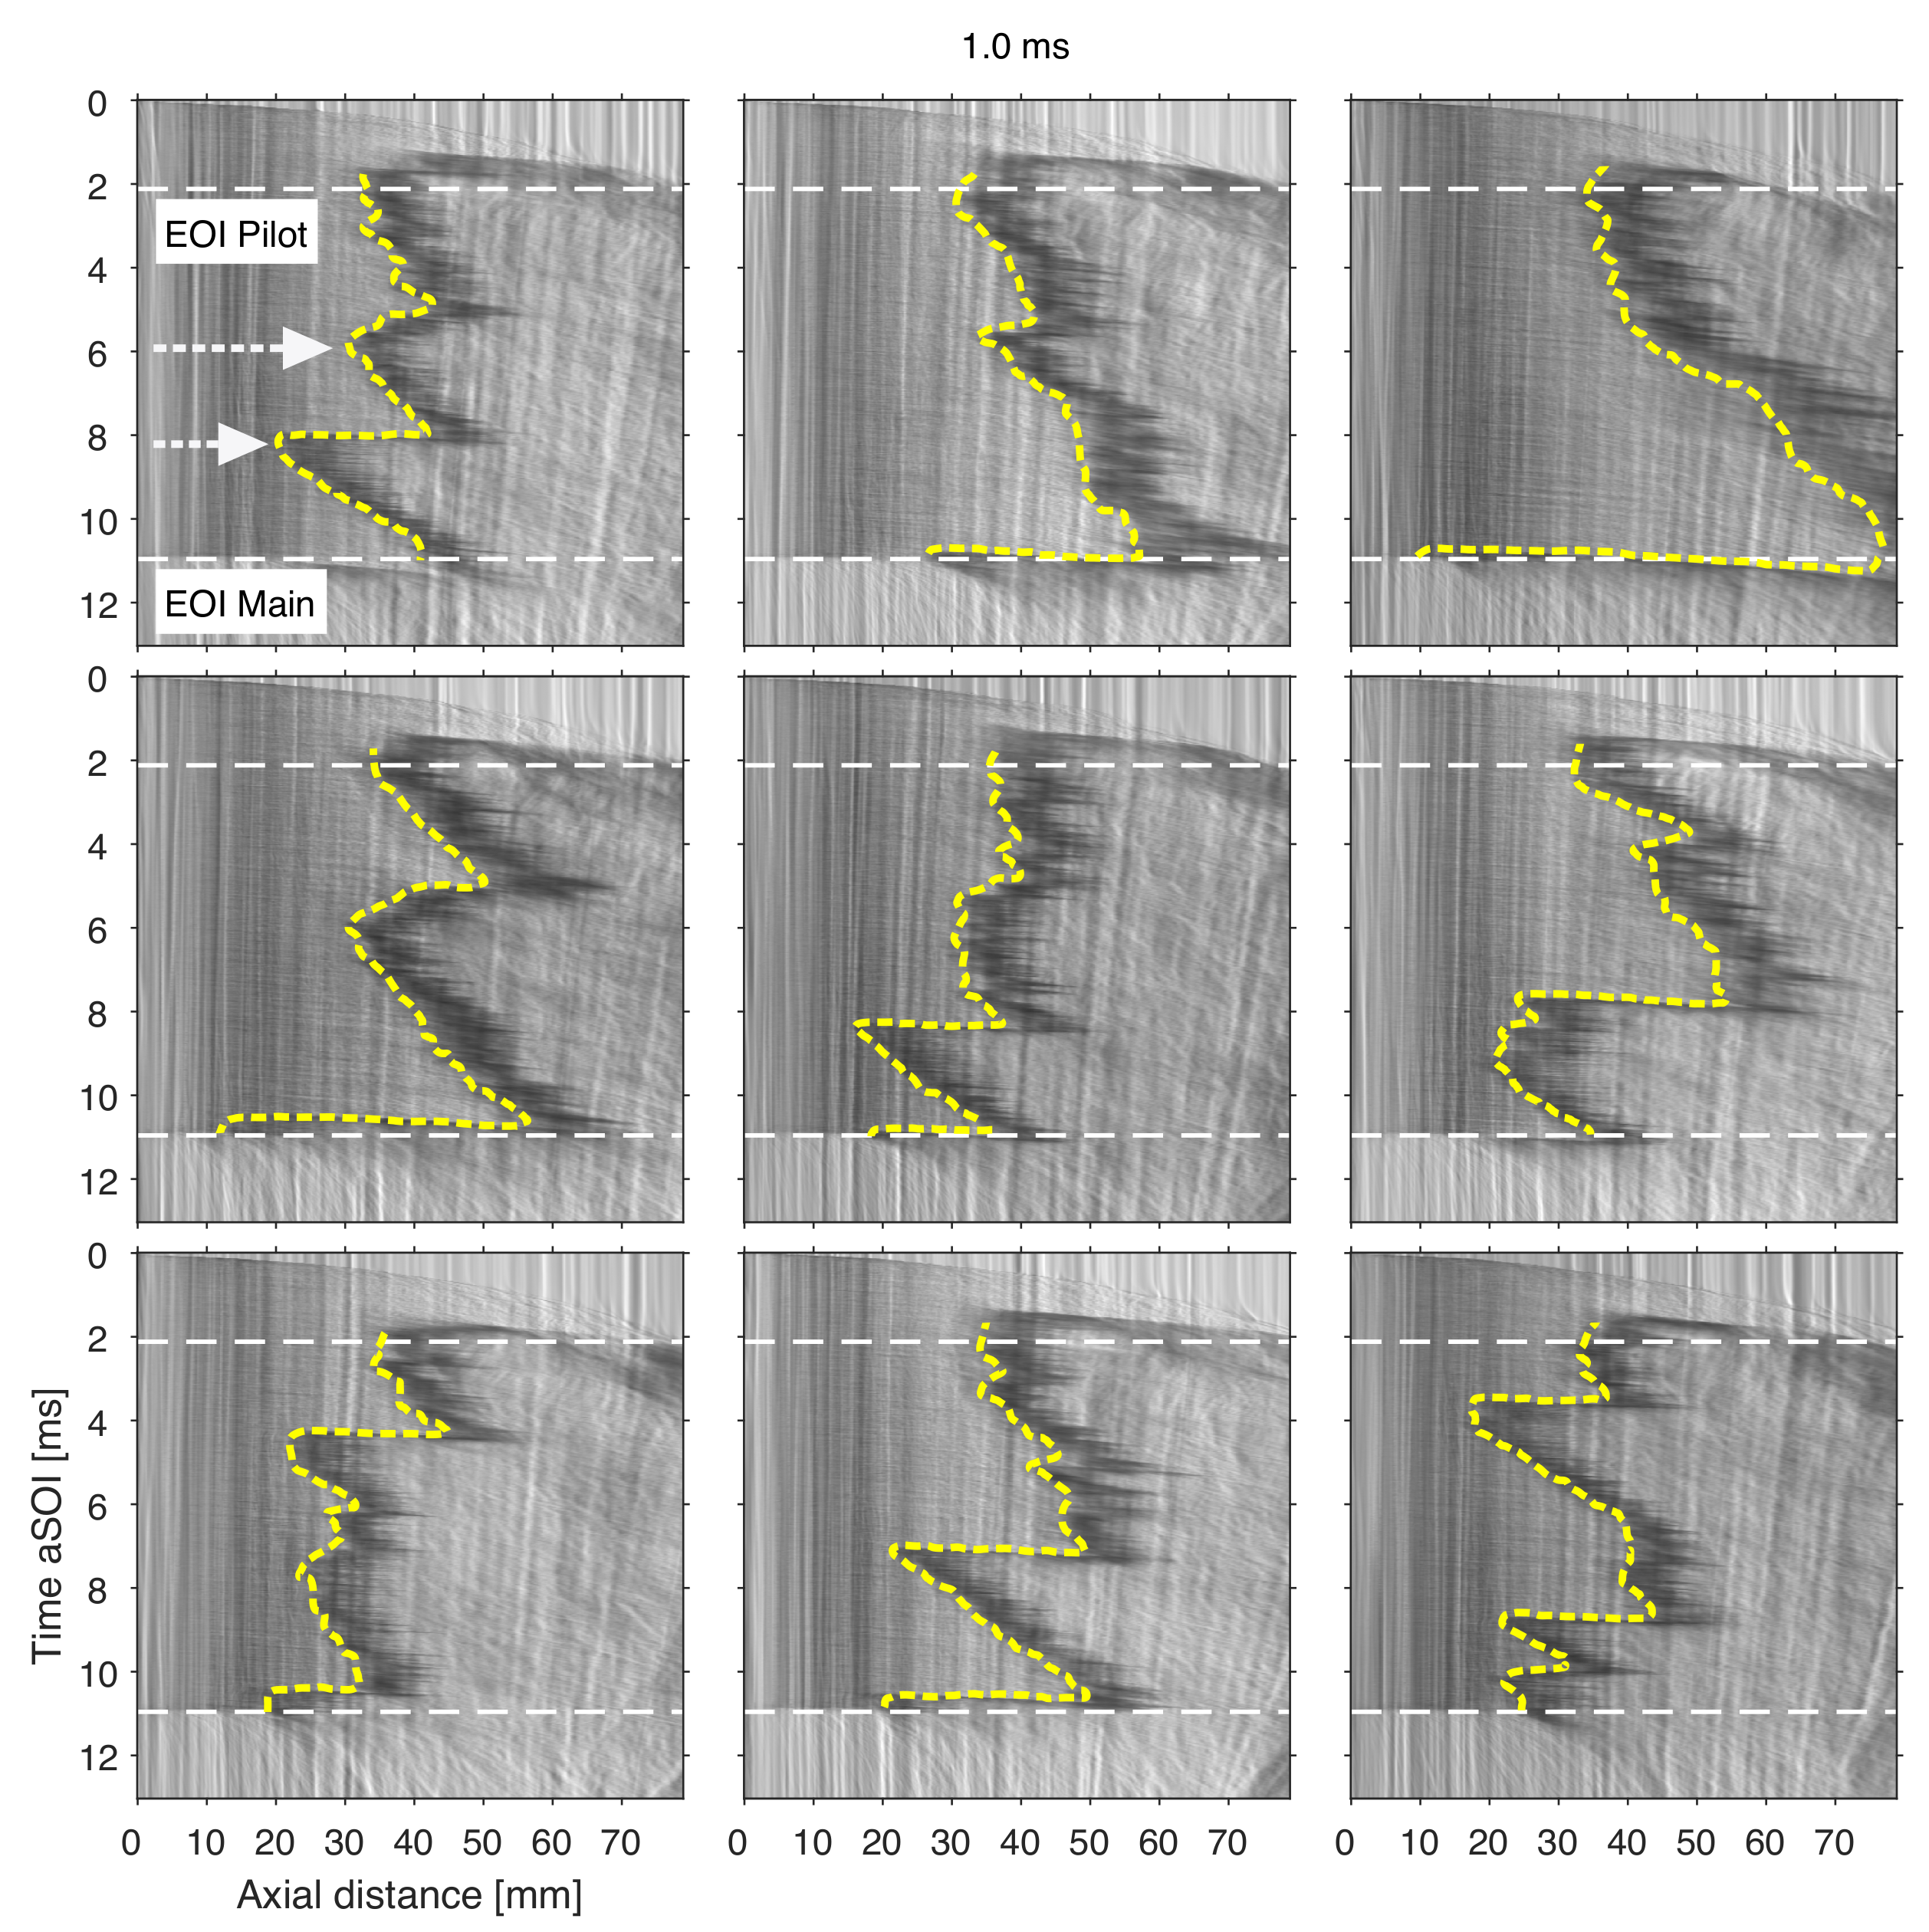
An analysis of the flame base position over time was also performed. All three cases showed similar behaviour, so the 1.0 ms pilot-injection case is used for discussion. The images reveal substantial run-to-run variation in flame base location. Once ignited, the methanol flame generally shifts downstream, but rapid lift-off reductions occur (two sample events are highlighted with white arrows in Figure 22 as a reference) when upstream dark regions form and merge with the reaction zone. These events can occur multiple times during injection and, in many of the runs, near EOI. For further insight, Figure 23 presents close-up schlieren sequences. The first frame shows the dual-fuel image at pilot jet EOI; subsequent frames capture isolated upstream dark regions that later merge with the downstream reaction zone, shifting the flame base upstream. The final frame shows the flame base position at the main jet EOI. The images show that remnants of the pilot jet interact with the main jet boundary from the initial downstream intersection back toward the nozzle.
Previous diesel studies have shown a linear, gradual increase in lift-off length when ignition is initiated by laser-induced plasma upstream of the natural lift-off location [39,48], with stabilisation attributed to autoignition supported by re-entrainment of hot combustion products through turbulent mixing at the jet edges. If stabilisation were considered solely on this basis, methanol would present greater challenges than diesel due to its high latent heat of vaporisation, elevated autoignition temperature, and low adiabatic flame temperature (Table 5). Near the nozzle, evaporative cooling lowers reactant temperatures. The higher autoignition temperature increases the required re-entrainment of hot products. The lower adiabatic flame temperature yields cooler products, further raising this requirement [49,50]. Farther downstream, methanol sprays also become lean, and the excess air acts as a thermal ballast that suppresses combustion temperatures and produces cooler products, again unfavourable for stabilisation. These combined properties, together with interactions between the methanol jet and pilot-fuel combustion products, shape the observed lift-off behaviour. In the 1000 K single-fuel case, ignition occurs outside the field of view, and the flame base remains far downstream, near the edge of the observation window. In contrast, the dual-fuel results show that pilot fuel, beyond igniting the methanol jet, its remnants can act to bring flame stabilisation comparatively closer to the nozzle. The lower end of the lift-off range approaches the liquid length, where colder gases and liquid methanol can hinder ignition. It is also noted that ammonia, which shares methanol’s high latent heat, elevated autoignition temperature, and low adiabatic flame temperature (Table 5), has likewise been reported to exhibit similar stabilisation characteristics [51].
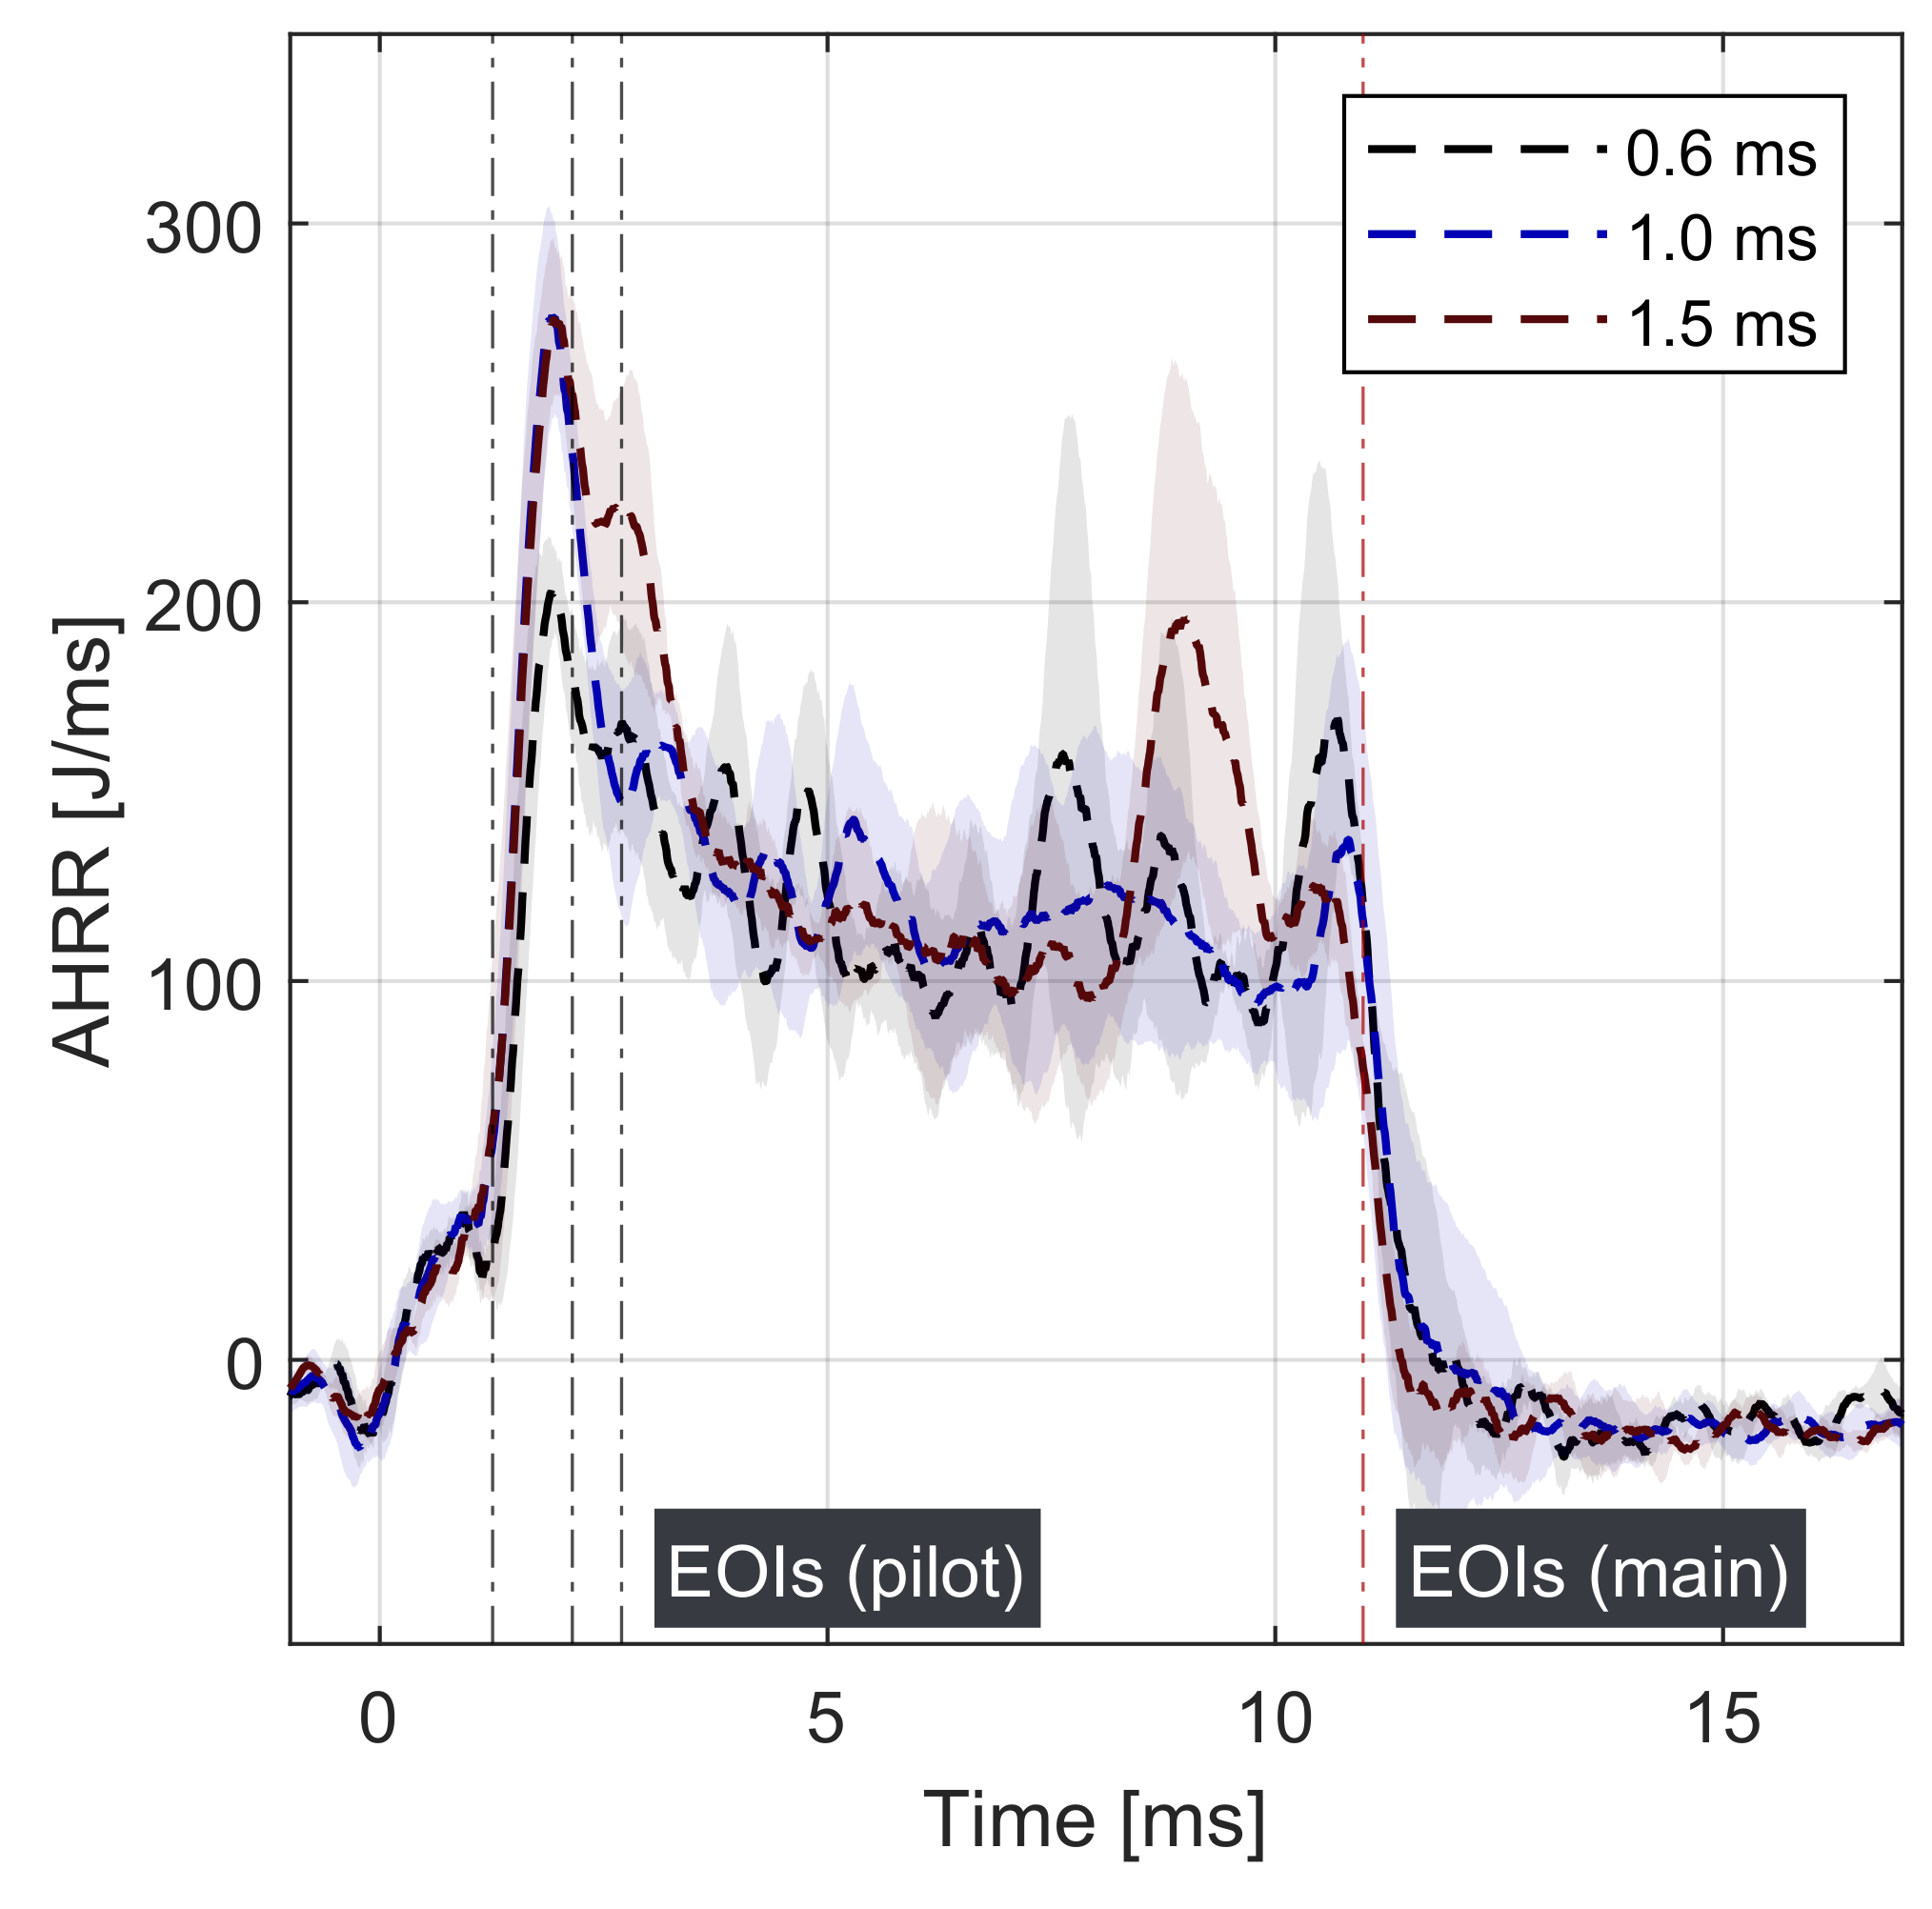
Figure 24 presents the average AHRR curves for the three cases, with all cases exhibiting a rapid heat-release rise after ignition, followed by a levelling characteristic of the mixing-controlled phase. The 1.0 ms and 1.5 ms cases (red and blue curves, Figure 24) reach similar peak magnitudes, whereas the 0.6 ms case (black curve, Figure 24) peaks lower. For the longer injections, EOI coincides with or follows the peak AHRR, while for the 0.6 ms case, it precedes it, indicating that continued pilot fuel injection contributes to the higher peaks in the longer duration cases. Heat release during the mixing-controlled phase is broadly similar across cases, though fluctuations appear, particularly near EOI. These fluctuations align with the EOI transients observed in the schlieren sequences, where the increased entrainment of ambient gases—characteristic of EOI [52]—and, in this case, the entrainment of pilot jet remnants can drive rapid upstream shifts of the flame base.
The shorter lift-off distances achieved in the dual-fuel cases suggest reduced unburned-fuel emissions relative to the autoignition case under similar conditions [53,54]. Additionally, production engines typically employ multi-hole injectors, where jet–jet interactions enhance mixing and entrainment, promoting greater stabilisation than the present single-hole configuration [55]. Other practical measures—such as post-injections of a more reactive fuel can promote the burnout of less reactive main fuels and reduce unburned-fuel emissions [56,57]. Preheating the main fuel similarly improves stabilisation by reducing evaporative cooling and increasing mixture temperatures [51]. In dual-fuel engines with separate pilot and main injectors, variations in injector orientation, injection pressure, and jet momentum can also be used to modify lift-off behaviour [58,59].

4. Conclusions

This study provided a systematic, single-configuration mapping of methanol spray autoignition, lift-off, and flame development across an engine-relevant range of ambient temperature (1000–1200 K), injection pressure (70–130 MPa), and O2 concentration (21–15 vol.%), using an optically accessible constant-volume chamber under simulated direct-injection compression-ignition engine conditions. High-speed schlieren imaging, OH* chemiluminescence, diffused back-illumination, and heat-release-rate measurements were combined to characterise the methanol jet flame across this range. In addition, a dual-fuel strategy was tested to address the low-temperature ignition instability challenges that the mapping revealed. Under the conditions investigated in this study, the following conclusions can be drawn:
  • The ignition delay results show that the methanol ignition delay decreases with an increasing ambient temperature or rising injection pressure. The jet ignition delay increases as ambient O2 decreases. The lift-off length, measured using both OH*- and schlieren-based methods, increases with a decreasing ambient temperature or higher injection pressure. With reduced ambient O2 conditions, OH* measurement gives a shorter lift-off length, whereas schlieren shows a longer lift-off length. The divergence in lift-off trends appears to arise from the transient motion of the flame base across varied O2 conditions.
  • Schlieren imaging shows a subtle softening of refractive-index gradients in the methanol spray-head region prior to high-temperature ignition, indicating the technique’s potential for detecting the two-stage ignition behaviour suggested by the recent simulation study, but it is emphasised that the technique cannot confirm the presence of the two-stage ignition process itself. Across all tested conditions, ignition consistently initiates in the mid-axial region of the jet, consistent with previous numerical predictions. The images further show that, after the premixed combustion phase, upstream ignition sites can appear during the diffusion-controlled phase, triggering a sequence of events that shift the flame base upstream before it subsequently moves downstream.
  • Across all tested conditions, except at the lowest ambient temperature, the methanol spray exhibits a distinct premixed combustion phase followed by a diffusion-controlled phase. At 1000 K, ignition is not captured by schlieren imaging, as it occurs beyond the field of view but is detected in the heat release analysis. The corresponding heat release profile shows no clear diffusion-controlled phase, but jet-wall interaction, which cannot be confirmed under the current test configuration, may have impacted its heat release.
  • At the lowest tested temperature, the methanol spray was re-examined with diesel pilot-jet assistance. In the dual-fuel case, the pilot consistently ignites outside the methanol jet before intersecting it, after which the reaction front transfers to and propagates along the methanol jet boundary. This configuration—demonstrated for pilot jet energy share ranging from 3.60% to 9.54%—enables methanol to ignite within a shorter time frame and with reduced variation in ignition timing while also allowing the flame base position to be established within the field of view, in contrast to the autoignition case under the same low temperature conditions. Across the tested pilot-injection range, the primary measurable change is the variation in the premixed peak magnitude of the apparent heat release rate. No other differences are observed because of the nature and sensitivity limits of the diagnostics used in this study.

Author Contributions

Conceptualisation, K.A., G.Z., K.M.P. and Q.N.C.; formal analysis, Q.N.C.; investigation, K.A.; resources, Q.N.C.; data curation, K.A.; writing—original draft preparation, K.A.; writing—review and editing, G.Z., R.C., Y.L., S.X., K.M.P., C.W., G.H.Y. and Q.N.C.; validation, K.A.; visualisation, K.A., G.Z., R.C. and Y.L.; supervision, S.X., G.H.Y. and Q.N.C.; project administration, Q.N.C.; funding acquisition, Q.N.C. All authors have read and agreed to the published version of the manuscript.

Funding

The first author acknowledges the support of the Commonwealth through the Australian Government Research Training Program Scholarship. The authors acknowledge the support of Australian Research Council (ARC) Research Hub for Fire Resilience Infrastructure, Assets and Safety Advancements (FRIASA). The corresponding author and the SJTU-affiliated co-author acknowledge the support of SJTU-UNSW Collaborative Research Fund (Stage II).

Institutional Review Board Statement

Not applicable.

Informed Consent Statement

Not applicable.

Data Availability Statement

The data presented in this study are available upon request from the corresponding author.

Acknowledgments

The authors also acknowledge the support of Benjamin Johnston at Macquarie University for assisting with nozzle laser drilling at the Optofab facilities, which was supported by the Optofab Node of the NCRIS-enabled Australian National Fabrication Facility. Kar Mun Pang acknowledges Innovationsfonden Denmark under the Grant No. 3129-00016B.

Conflicts of Interest

Author Kar Mun Pang was employed by the company Everllence. The remaining authors declare that the research was conducted in the absence of any commercial or financial relationships that could be construed as a potential conflict of interest.

Appendix A

Appendix A.1

Schlieren-derived ignition delays were also evaluated for all conditions in which ignition occurred within the optical field of view (i.e., excluding the 1000 K single-fuel case) to assess method and threshold sensitivity. This comparison, together with a sensitivity analysis of the pressure-rise threshold using 1%, 2%, 3%, and 5% of the total pressure rise, is presented in Figure A1. Ignition delay was found to be insensitive to the selected threshold, with values varying by less than 0.09 ms across the tested range, which is within the run-to-run standard deviation, and with schlieren-based and pressure-based measurements showing consistent trends across all conditions.
Figure A1. Sensitivity of ignition delay to detection method (schlieren-based vs. pressure-based) and to the pressure-rise threshold used to define ignition, across all tested conditions. Pressure-based ignition delay is shown using thresholds of 1%, 2%, 3%, and 5% of total pressure rise, with 2% corresponding to the value used throughout the analysis. Error bars denote one standard deviation over repeated runs.
Fluids 11 00203 g0a1

Appendix A.2

The sensitivity of the reported lift-off length to the selected OH* intensity detection threshold was evaluated using thresholds of 40%, 50% (the value used in the main analysis), and 60% of the peak intensity. The results are presented in Figure A2. Overall, the relative trends are preserved across all three threshold values. Minor changes in the ordering of the lift-off lengths are observed for the oxygen variation cases, particularly between the 18% and 15% O2 conditions. These differences remain within the measurement uncertainties and do not affect the overall conclusions of the study.
Figure A2. Sensitivity of OH*-based lift-off length to the intensity detection threshold, across all tested conditions. Lift-off length is shown at 40%, 50%, and 60% of peak OH* intensity, with 50% corresponding to the threshold value used in the main analysis. Error bars denote one standard deviation over repeated runs. The lift-off length is not shown for the 1000 K condition, as the flame lies beyond the optical field of view.
Fluids 11 00203 g0a2

References

  1. García, A.; Monsalve-Serrano, J.; Micó, C.; Guzmán-Mendoza, M. Parametric evaluation of neat methanol combustion in a light-duty compression ignition engine. Fuel Process. Technol. 2023, 249, 107850. [Google Scholar] [CrossRef] [Scilit]
  2. Liu, F.; Guo, H.; Zheng, X.; Li, H.; Wang, X. Mechanism of methanol and formaldehyde emissions from methanol-fueled engines. Fuel Process. Technol. 2025, 268, 108177. [Google Scholar] [CrossRef] [Scilit]
  3. Yin, X.; Xu, L.; Duan, H.; Wang, Y.; Wang, X.; Zeng, K.; Wang, Y. In-depth comparison of methanol port and direct injection strategies in a methanol/diesel dual fuel engine. Fuel Process. Technol. 2023, 241, 107607. [Google Scholar] [CrossRef] [Scilit]
  4. Li, J.; Gong, C.M.; Su, Y.; Dou, H.L.; Liu, X.J. Effect of injection and ignition timings on performance and emissions from a spark-ignition engine fueled with methanol. Fuel 2010, 89, 3919–3925. [Google Scholar] [CrossRef] [Scilit]
  5. Li, S.; Wei, Y.; Wang, N.; Huang, S.; Zhou, X.; Cao, J.; Chen, R.; Li, T. Dynamic characteristics of pilot injection: Spray evaporation, mixture formation, and combustion under engine-like conditions. Exp. Therm. Fluid Sci. 2025, 169, 111564. [Google Scholar] [CrossRef] [Scilit]
  6. Wang, Q.; Wei, F.; Dong, P.; Xiao, G.; Cui, Z.; Tian, J.; Shi, X.; Long, W. Visualization study on combustion characteristics of direct-injected hydrous methanol ignited by diesel in a constant volume combustion chamber. Fuel 2023, 335, 127063. [Google Scholar] [CrossRef] [Scilit]
  7. Agarwal, A.K.; Karare, H.; Dhar, A. Combustion, performance, emissions and particulate characterization of a methanol–gasoline blend (gasohol) fuelled medium duty spark ignition transportation engine. Fuel Process. Technol. 2014, 121, 16–24. [Google Scholar] [CrossRef] [Scilit]
  8. Zhang, Z.; Cheung, C.S.; Yao, C. Influence of fumigation methanol on the combustion and particulate emissions of a diesel engine. Fuel 2013, 111, 442–448. [Google Scholar] [CrossRef] [Scilit]
  9. Mueller, C.J.; Musculus, M.P. Glow Plug Assisted Ignition and Combustion of Methanol in an Optical DI Diesel Engine; Technical Report, SAE Technical Paper; SAE International: Warrendale, PA, USA, 2001. [Google Scholar]
  10. Richards, B. Methanol-fueled Caterpillar 3406 engine experience in on-highway trucks. SAE Trans. 1990, 99, 1033–1045. [Google Scholar]
  11. Siebers, D.L.; Edwards, C. Autoignition of methanol and ethanol sprays under diesel engine conditions. SAE Trans. 1987, 96, 140–152. [Google Scholar]
  12. Ming, Z.; Liu, B.; Zhang, X.; Wen, M.; Liu, H.; Cui, Y.; Ye, Y.; Wang, C.; Jin, C.; Yusuf, A.A.; et al. Study of methanol spray flame structure and combustion stability mechanisms by optical phenomenology and chemical kinetics. Fuel Process. Technol. 2023, 252, 107947. [Google Scholar] [CrossRef] [Scilit]
  13. Celıkten, I. An experimental investigation of the effect of the injection pressure on engine performance and exhaust emission in indirect injection diesel engines. Appl. Therm. Eng. 2003, 23, 2051–2060. [Google Scholar] [CrossRef] [Scilit]
  14. Kaisan, M.U.; Narayan, S.; Ismail, N.A.; Dambatta, Y.S. Assessment of in-cylinder pressure in diesel engines using novel combustion indices. Cogent Eng. 2021, 8, 1920561. [Google Scholar] [CrossRef] [Scilit]
  15. Manin, J. OME and methanol diesel combustion. In Presentation at ECN 9.0 Workshop, 2023; Sandia National Laboratories: Livermore, CA, USA, 2023. [Google Scholar]
  16. Rorimpandey, P.; Aryal, K.; Zhai, G.; Xu, S.; Mun Pang, K.; Yeoh, G.H.; Kook, S.; Chan, Q.N. A review of the fundamental understanding of hydrogen-diesel direct injection combustion: Recent advances and future outlook. Energy Fuels 2025, 39, 16538–16560. [Google Scholar] [CrossRef] [Scilit]
  17. Skeen, S.A.; Manin, J.; Pickett, L.M. Simultaneous formaldehyde PLIF and high-speed schlieren imaging for ignition visualization in high-pressure spray flames. Proc. Combust. Inst. 2015, 35, 3167–3174. [Google Scholar] [CrossRef] [Scilit]
  18. Pastor, J.V.; Payri, R.; Garcia-Oliver, J.M.; Nerva, J.G. Schlieren Measurements of the ECN-Spray A Penetration Under Inert and Reacting Conditions; Technical Report, SAE Technical Paper; SAE International: Warrendale, PA, USA, 2012. [Google Scholar]
  19. Bardi, M.; Bruneaux, G.; Malbec, L.M. Study of ECN injectors’ behavior repeatability with focus on aging effect and soot fluctuations. In Proceedings of the SAE 2016 World Congress and Exhibition, Detroit, MI, USA, 12–14 April 2016; SAE International: Warrendale, PA, USA, 2016. [Google Scholar]
  20. Manin, J.; Bardi, M.; Pickett, L.M. SP2-4 Evaluation of the liquid length via diffused back-illumination imaging in vaporizing diesel sprays (SP: Spray and Spray Combustion, General Session Papers). In Proceedings of the International Symposium on Diagnostics and Modeling of Combustion in Internal Combustion Engines 2012.8; The Japan Society of Mechanical Engineers: Tokyo, Japan, 2012; pp. 665–673. [Google Scholar]
  21. Siebers, D.; Higgins, B. Flame lift-off on direct-injection diesel sprays under quiescent conditions. SAE Trans. 2001, 110, 400–421. [Google Scholar]
  22. Payri, R.; García-Oliver, J.M.; Bardi, M.; Manin, J. Fuel temperature influence on diesel sprays in inert and reacting conditions. Appl. Therm. Eng. 2012, 35, 185–195. [Google Scholar] [CrossRef] [Scilit]
  23. Bardi, M.; Payri, R.; Malbec, L.M.C.; Bruneaux, G.; Pickett, L.M.; Manin, J.; Bazyn, T.; Genzale, C.L. Engine combustion network: Comparison of spray development, vaporization, and combustion in different combustion vessels. At. Sprays 2012, 22, 807–842. [Google Scholar] [CrossRef] [Scilit]
  24. Higgins, B.; Siebers, D.; Aradi, A. Diesel-spray ignition and premixed-burn behavior. SAE Pap. 2000, 109, 961–984. [Google Scholar]
  25. Lillo, P.M.; Pickett, L.M.; Persson, H.; Andersson, O.; Kook, S. Diesel spray ignition detection and spatial/temporal correction. SAE Int. J. Engines 2012, 5, 1330–1346. [Google Scholar] [CrossRef] [Scilit]
  26. Zhai, G.; Xing, S.; Srna, A.; Wehrfritz, A.; Kook, S.; Hawkes, E.R.; Chan, Q.N. Ignition and flame stabilisation of primary reference fuel sprays at engine-relevant conditions. Combust. Flame 2021, 233, 111620. [Google Scholar] [CrossRef] [Scilit]
  27. Brunt, M.F.; Rai, H.; Emtage, A.L. The calculation of heat release energy from engine cylinder pressure data. SAE Trans. 1998, 107, 1596–1609. [Google Scholar]
  28. Zhai, G.; Rorimpandey, P.; Pang, K.M.; Kook, S.; Yeoh, G.H.; Chan, Q.N. Methane-diesel direct-injection combustion under engine-relevant conditions. Fuel 2025, 399, 135613. [Google Scholar] [CrossRef] [Scilit]
  29. Bosch, W. The fuel rate indicator: A new measuring instrument for display of the characteristics of individual injection. SAE Trans. 1967, 75, 641–662. [Google Scholar]
  30. Payri, R.; Salvador, F.; Gimeno, J.; Bracho, G. A new methodology for correcting the signal cumulative phenomenon on injection rate measurements. Exp. Tech. 2008, 32, 46–49. [Google Scholar] [CrossRef] [Scilit]
  31. Siebers, D.L. Liquid-phase fuel penetration in diesel sprays. SAE Trans. 1998, 107, 1205–1227. [Google Scholar]
  32. Pickett, L.M.; Siebers, D.L.; Idicheria, C.A. Relationship between ignition processes and the lift-off length of diesel fuel jets. SAE Trans. 2005, 114, 1714–1731. [Google Scholar]
  33. Rosseel, E.; Sierens, R. The Physical and the Chemical Part of the Ignition Delay in Diesel Engines; Technical Report, SAE Technical Paper; SAE International: Warrendale, PA, USA, 1996. [Google Scholar]
  34. Cowart, J.; Luning Prak, D.; Hamilton, L. The effects of fuel injection pressure and fuel type on the combustion characteristics of a diesel engine. J. Eng. Gas Turbines Power 2015, 137, 101501. [Google Scholar] [CrossRef] [Scilit]
  35. Musculus, M.P.; Miles, P.C.; Pickett, L.M. Conceptual models for partially premixed low-temperature diesel combustion. Prog. Energy Combust. Sci. 2013, 39, 246–283. [Google Scholar] [CrossRef] [Scilit]
  36. Wei, Y.; Li, T.; Wang, B.; Shi, W. Simultaneous Measurement of the Flame Lift-Off Length on Direct Injection Diesel Sprays Using High Speed Schlieren Imaging and OH Chemiluminescence; Technical Report, SAE Technical Paper; SAE International: Warrendale, PA, USA, 2017. [Google Scholar]
  37. Yip, H.L.; Srna, A.; Liu, X.; Kook, S.; Hawkes, E.R.; Chan, Q.N. Visualization of hydrogen jet evolution and combustion under simulated direct-injection compression-ignition engine conditions. Int. J. Hydrogen Energy 2020, 45, 32562–32578. [Google Scholar] [CrossRef] [Scilit]
  38. Chander, S.; Ray, A. Flame impingement heat transfer: A review. Energy Convers. Manag. 2005, 46, 2803–2837. [Google Scholar] [CrossRef] [Scilit]
  39. Pickett, L.M.; Kook, S.; Persson, H.; Andersson, Ö. Diesel fuel jet lift-off stabilization in the presence of laser-induced plasma ignition. Proc. Combust. Inst. 2009, 32, 2793–2800. [Google Scholar] [CrossRef] [Scilit]
  40. Burke, U.; Metcalfe, W.K.; Burke, S.M.; Heufer, K.A.; Dagaut, P.; Curran, H.J. A detailed chemical kinetic modeling, ignition delay time and jet-stirred reactor study of methanol oxidation. Combust. Flame 2016, 165, 125–136. [Google Scholar] [CrossRef] [Scilit]
  41. Wang, Z.; Zhao, H.; Yan, C.; Lin, Y.; Lele, A.D.; Xu, W.; Rotavera, B.; Jasper, A.W.; Klippenstein, S.J.; Ju, Y. Methanol oxidation up to 100 atm in a supercritical pressure jet-stirred reactor. Proc. Combust. Inst. 2023, 39, 445–453. [Google Scholar] [CrossRef] [Scilit]
  42. Kaario, O.T.; Karimkashi, S.; Bhattacharya, A.; Vuorinen, V.; Larmi, M.; Bai, X.S. A comparative study on methanol and n-dodecane spray flames using Large-Eddy Simulation. Combust. Flame 2024, 260, 113277. [Google Scholar] [CrossRef] [Scilit]
  43. Benajes, J.; Payri, R.; Bardi, M.; Martí-Aldaraví, P. Experimental characterization of diesel ignition and lift-off length using a single-hole ECN injector. Appl. Therm. Eng. 2013, 58, 554–563. [Google Scholar] [CrossRef] [Scilit]
  44. Pickett, L.M.; Kook, S.; Williams, T.C. Visualization of diesel spray penetration, cool-flame, ignition, high-temperature combustion, and soot formation using high-speed imaging. SAE Int. J. Engines 2009, 2, 439–459. [Google Scholar] [CrossRef] [Scilit]
  45. Riess, S.; Weiss, L.; Peter, A.; Rezaei, J.; Wensing, M. Air entrainment and mixture distribution in Diesel sprays investigated by optical measurement techniques. Int. J. Engine Res. 2018, 19, 120–133. [Google Scholar] [CrossRef] [Scilit]
  46. Zhang, J.; Jing, W.; Roberts, W.L.; Fang, T. Effects of ambient oxygen concentration on biodiesel and diesel spray combustion under simulated engine conditions. Energy 2013, 57, 722–732. [Google Scholar] [CrossRef] [Scilit]
  47. Cui, J.; Yu, R.; Wang, H.; Wang, Y.; Tong, J. A Comparative Study of Methanol and Methane Combustion in a Gas Turbine Combustor. Energies 2025, 18, 1765. [Google Scholar] [CrossRef] [Scilit]
  48. Zhai, G.; Xing, S.; Yuen, A.C.; Medwell, P.R.; Kook, S.; Yeoh, G.H.; Chan, Q.N. Laser ignition of iso-octane and n-heptane jets under compression-ignition conditions. Fuel 2022, 311, 122555. [Google Scholar] [CrossRef] [Scilit]
  49. Cui, M.; Nour, M.; Fu, J.; Zhang, W.; Wang, G.; Xu, H.; Yao, B.; Li, X. Fundamental investigation of methanol flash boiling combustion under direct injection conditions. Combust. Flame 2025, 276, 114147. [Google Scholar] [CrossRef] [Scilit]
  50. Nour, M.; Zhang, W.; Cui, M.; Fu, J.; Luo, X.; Qiu, S.; Li, X.; Xu, M. Comprehensive experimental analysis on combustion characteristics of acetone-butanol-ethanol fuel in a constant volume combustion chamber under gasoline direct injection conditions: Effect of fuel composition. Energy Convers. Manag. 2025, 339, 119948. [Google Scholar] [CrossRef] [Scilit]
  51. Scharl, V.; Lackovic, T.; Sattelmayer, T. Characterization of ammonia spray combustion and mixture formation under high-pressure, direct injection conditions. Fuel 2023, 333, 126454. [Google Scholar] [CrossRef] [Scilit]
  52. Musculus, M.P.; Kattke, K. Entrainment waves in diesel jets. SAE Int. J. Engines 2009, 2, 1170–1193. [Google Scholar] [CrossRef] [Scilit]
  53. Yip, H.L.; Srna, A.; Zhai, G.; Wehrfritz, A.; Kook, S.; Hawkes, E.R.; Chan, Q.N. Laser-induced plasma-ignited hydrogen jet combustion in engine-relevant conditions. Int. J. Hydrogen Energy 2023, 48, 1568–1581. [Google Scholar] [CrossRef] [Scilit]
  54. Yip, H.L.; Zhai, G.; Rorimpandey, P.; Kook, S.; Hawkes, E.R.; Chan, Q.N. Experimental study of laser-ignited hydrogen jet flame evolution under simulated direct-injection diesel engine conditions. Int. J. Hydrogen Energy 2024, 93, 1060–1070. [Google Scholar] [CrossRef] [Scilit]
  55. Rusly, A.M.; Le, M.K.; Kook, S.; Hawkes, E.R. The shortening of lift-off length associated with jet–wall and jet–jet interaction in a small-bore optical diesel engine. Fuel 2014, 125, 1–14. [Google Scholar] [CrossRef] [Scilit]
  56. Shi, Z.; Qian, Y.; Mi, S.; Lu, X. Application of different injection strategies under methanol/diesel dual-fuel intelligent charge compression ignition (ICCI) mode with high methanol energy ratio at low engine loads. Fuel 2026, 405, 136561. [Google Scholar] [CrossRef] [Scilit]
  57. Ichikawa, Y.; Niki, Y.; Takasaki, K.; Kobayashi, H.; Miyanagi, A. NH3 combustion using three-layer stratified fuel injection for a large two-stroke marine engine: Experimental verification of the concept. Appl. Energy Combust. Sci. 2022, 10, 100071. [Google Scholar] [CrossRef] [Scilit]
  58. Rorimpandey, P.; Zhai, G.; Kook, S.; Hawkes, E.R.; Chan, Q.N. Effects of energy-share and ambient oxygen concentration on hydrogen-diesel dual-fuel direct-injection (H2DDI) combustion in compression-ignition conditions. Int. J. Hydrogen Energy 2024, 49, 1346–1361. [Google Scholar] [CrossRef] [Scilit]
  59. Rorimpandey, P.; Zhai, G.; Kook, S.; Hawkes, E.R.; Chan, Q.N. Effects of jet interaction angle on the ignition and combustion characteristics of hydrogen-diesel dual-fuel direct injection. Int. J. Hydrogen Energy 2024, 67, 172–191. [Google Scholar] [CrossRef] [Scilit]
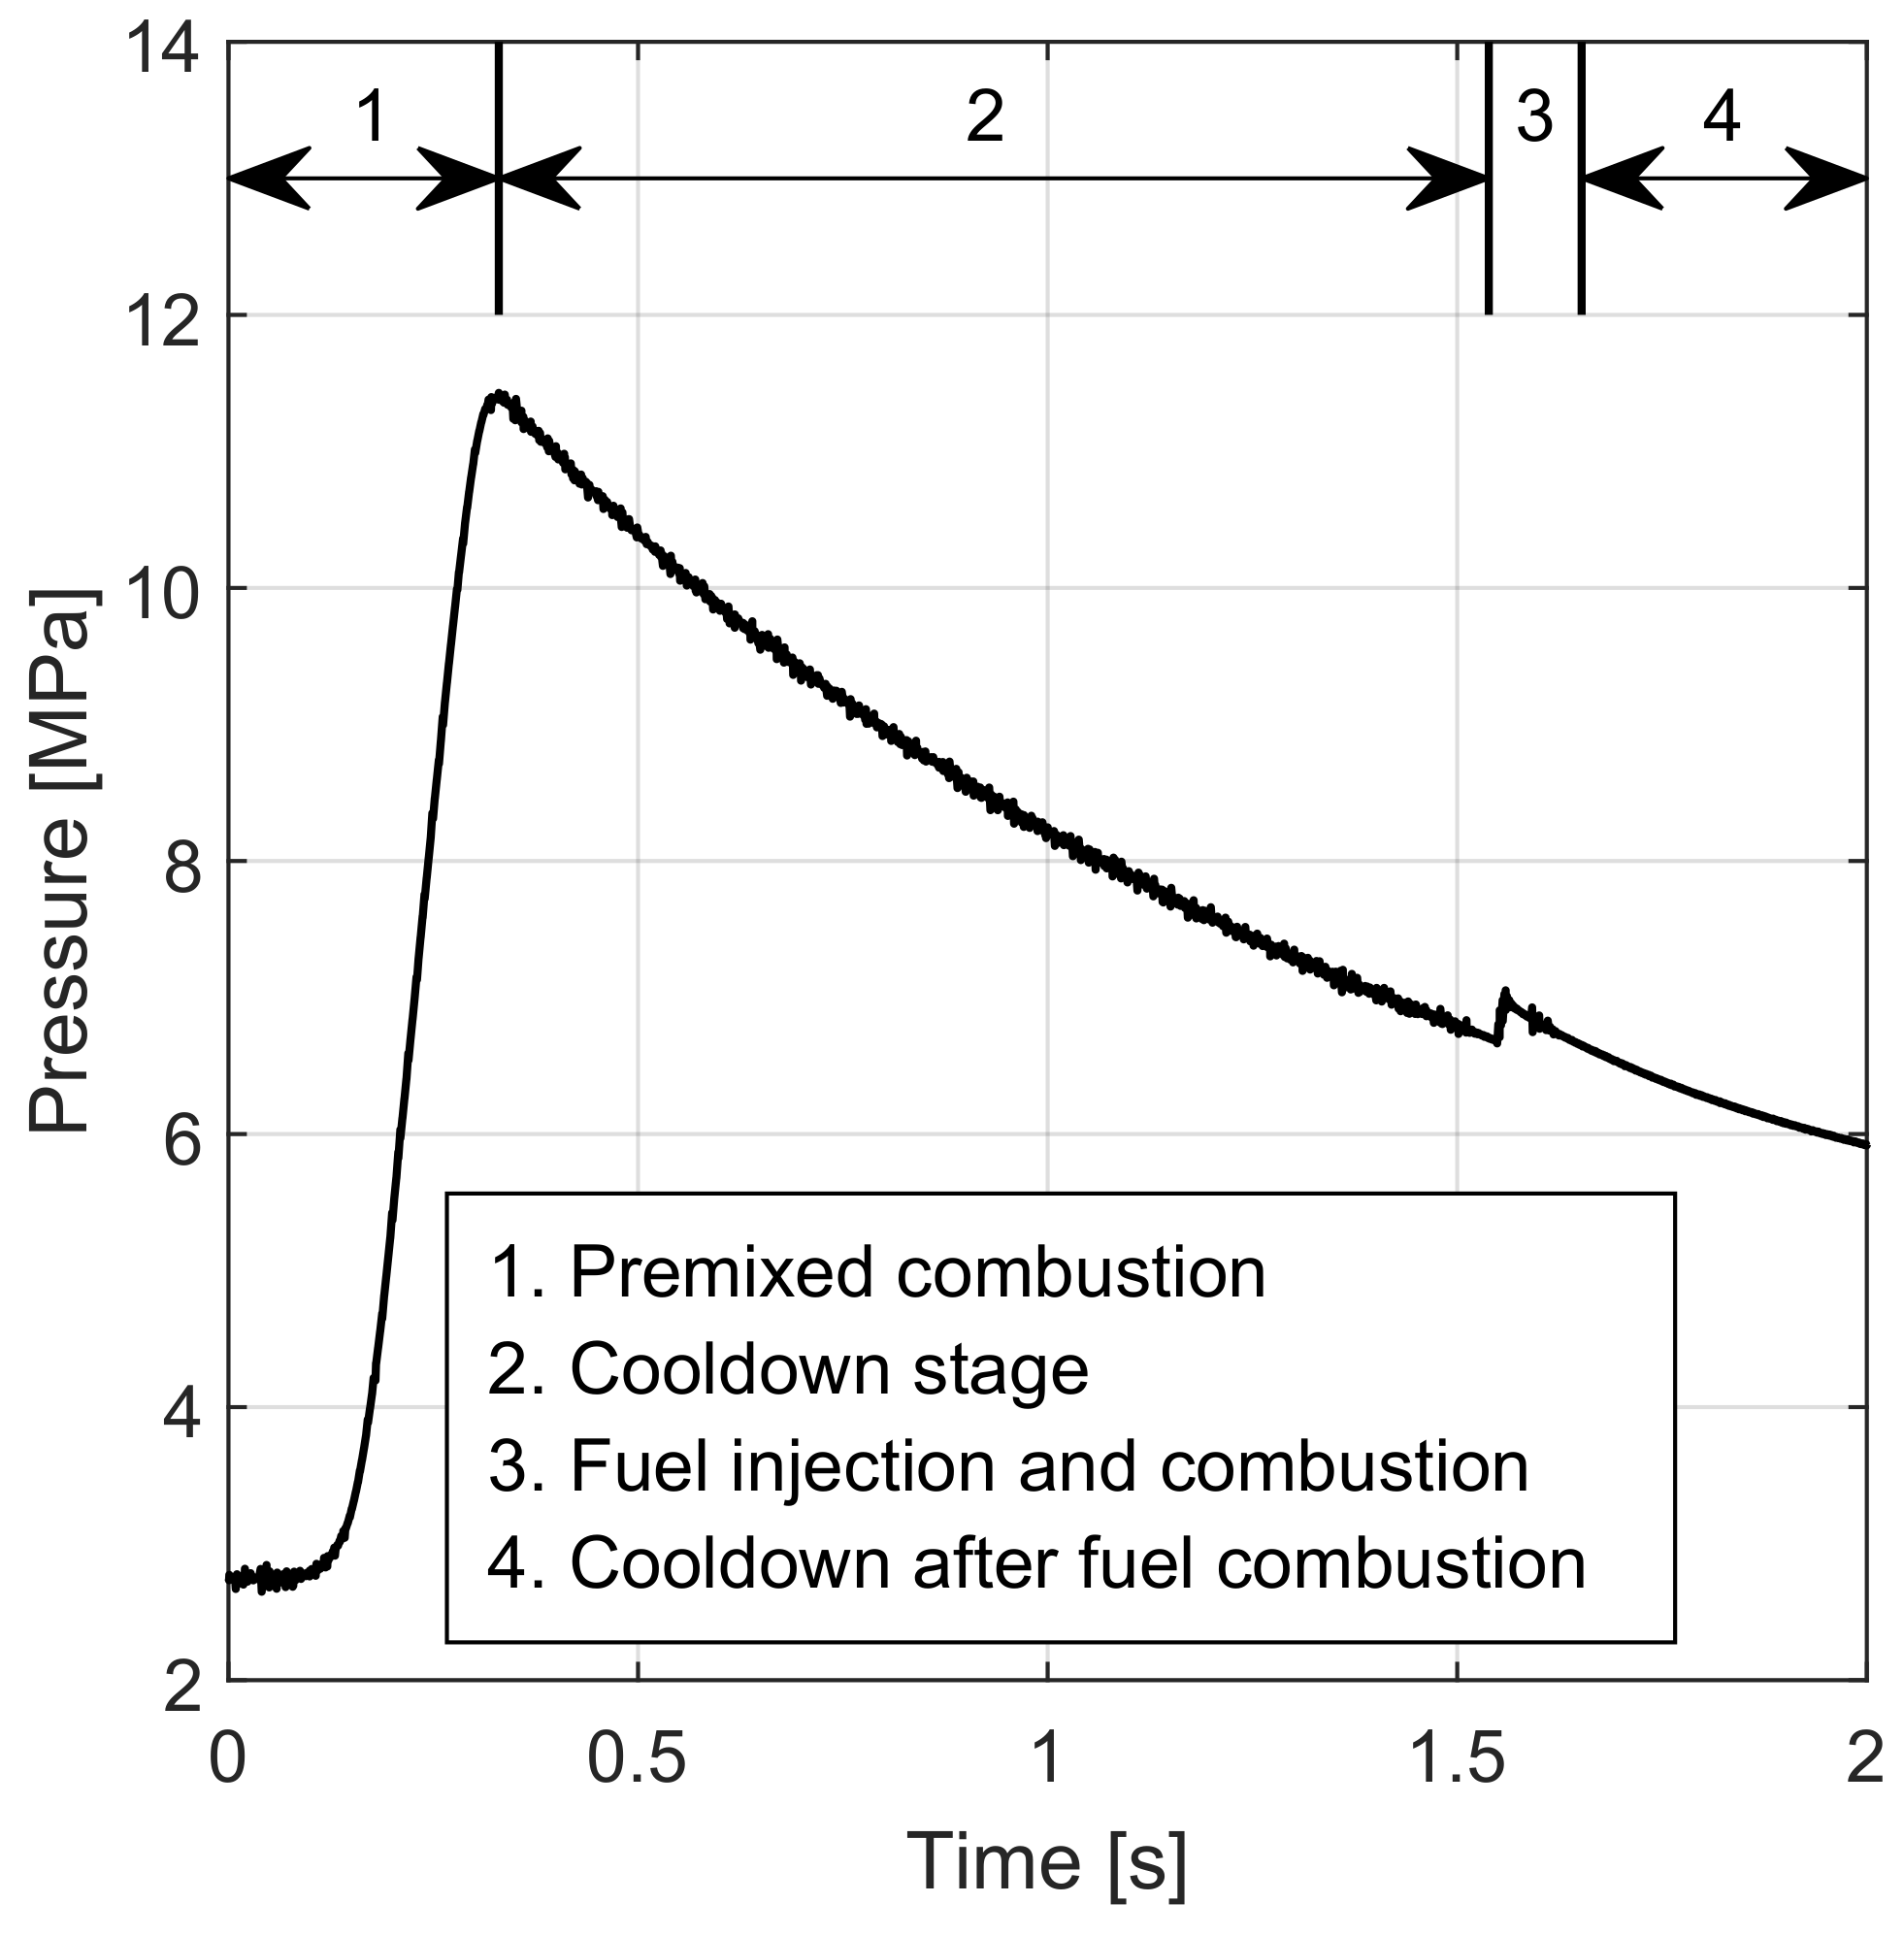
Figure 1. Sample pressure trace profile during a reactive methanol injection event. 1. Premixed combustion; 2. cool-down stage; 3. fuel injection and combustion; 4. cool-down phase after the start of injection (SOI), and fuel combustion.
Fluids 11 00203 g001
Figure 2. (a) Optical setup used for high-speed schlieren imaging. Optical path indicated in yellow. Components: 1. CMOS camera; 2. iris; 3. reflector; 4. parabolic mirror; 5. CVCC (section view); 6. reflector; 7. parabolic mirror; 8. iris; 9. plano-convex lens; 10. xenon arc Lamp. (b) cross-sectional view of the CVCC, showing the internal chamber geometry, injector arrangement, pressure sensor, and mixing fan. The optically accessible central cavity is bounded by the surrounding metal chamber walls; a representative methanol spray is shown for illustration.
Fluids 11 00203 g002
Figure 3. Schematic diagram of the schlieren image processing procedures for the spray boundary. The text box indicates various steps in the order of raw, temporal standard deviation, spatial standard deviation, binarised, eroded and processed image. The presented case is a methanol spray at 1.75 ms aSOI. Ambient conditions: 1100 K, 0 vol.% O2 concentration, 100 MPa injection pressure. Processed frame with the detected methanol spray boundary highlighted in green.
Fluids 11 00203 g003
Figure 4. Schematic diagram of the methanol and pilot fuel injector arrangements, with symbolic jet cones (methanol in blue, pilot fuel in red), depicting the spray cone and axis of intersection.
Fluids 11 00203 g004
Figure 5. Average ignition delays with run-to-run variability (one standard deviation) are shown for ambient temperature (red), injection pressure (green), and ambient oxygen concentration (blue) cases. The abscissa denotes the test conditions, and the horizontal dash-dotted line indicates the end of injection. The results from the present study are compared with CVCC literature data, including Sandia [15] (purple), Ming et al. [12] (cyan), and Siebers et al. [11] (orange). Siebers et al. did not provide lift-off length measurements.
Fluids 11 00203 g005
Figure 6. Sample schlieren images of methanol sprays at ambient temperatures of 1000 K (left), 1100 K (middle), and 1200 K (right). Timestamps are referenced to the SOI. Solid green lines indicate the spray boundaries. The corresponding heat release profiles for each run are shown below the image sequences, with circular markers denoting the time instances of the selected frames. The white dashed area is marked at the last frame in the first column to show a faint, darkened region.
Fluids 11 00203 g006
Figure 7. Average AHRR for the methanol spray flames when subjected to the ambient temperature of 1000 K (black), 1100 K (red), and 1200 K (blue). Colour-shaded areas represent the run-to-run variations (one standard deviation).
Fluids 11 00203 g007
Figure 8. Flame base location traces with respect to time after the start of injection, derived from schlieren images at 1100 K (reference) and 1200 K. The black dashed line indicates liquid length from diffused back-illumination, the red dashed line denotes the OH*-based lift-off length with shaded uncertainty, and the yellow dashed line indicates the instantaneous flame lift-off base. The white dashed lines enclose the time intervals from which schlieren recordings were extracted for a closer examination of fluctuation sources in Figure 9.
Fluids 11 00203 g008
Figure 9. Schlieren images of methanol sprays highlighting self-ignition events. Timestamps are given relative to the start of injection. The white circle marks the observed emergence of a darkened region upstream of the main flame, while the green solid lines indicate spray boundaries.
Fluids 11 00203 g009
Figure 10. Schlieren images of the methanol jet under non-reacting (left) and reacting (right) reference conditions. The corresponding heat-release profiles for both reacting and non-reacting runs are shown below the image sequences, showing detectable heat release only in the latter. Inset images, outlined by black dashed boxes, provide a closer view of the jet head to highlight potential intensity differences between the reacting and non-reacting cases.
Fluids 11 00203 g010
Figure 11. Intensity (a) and intensity increment (b) versus time after the start of injection for five non-reacting and reacting runs under reference conditions.
Fluids 11 00203 g011
Figure 12. Sample schlieren images of methanol sprays at injection pressures of 70 MPa (left), 100 MPa (middle), and 130 MPa (right). Timestamps are referenced to the start of injection. Solid green lines mark the spray boundaries.
Fluids 11 00203 g012
Figure 13. Average AHRR for methanol sprays at injection pressures of 70 MPa (black), 100 MPa (red), and 130 MPa (blue). Colour-shaded areas indicate run-to-run variation (one standard deviation).
Fluids 11 00203 g013
Figure 14. Flame base location traces with respect to time after the start of injection, derived from schlieren images of the 70 MPa, 100 MPa (reference) and 130 MPa cases. The black dashed line indicates liquid length from diffused back-illumination, the red dashed line denotes the OH*-based lift-off length with shaded uncertainty, and the yellow dashed line indicates the instantaneous flame lift-off base. The white arrows denote examples of two instances where rapid upstream shifts in flame base are observed.
Fluids 11 00203 g014
Figure 15. Sample schlieren images for methanol sprays at ambient O2 concentration conditions of 21 vol.% (left), 18 vol.% (middle), and 15 vol.% (right) column. A timestamp of each image is referenced to the SOI. Green solid lines indicate the spray boundaries.
Fluids 11 00203 g015
Figure 16. Average AHRR for methanol sprays at ambient O2 concentrations of 21 vol.% (black), 18 vol.% (red), and 15 vol.% (blue). Shaded regions in the first plot of the column denote run-to-run variability (one standard deviation). The first top plot shows the ensemble-averaged AHRR, while the subsequent three plots of the column present individual runs with their corresponding averages at each O2 level.
Fluids 11 00203 g016
Figure 17. Peak AHRR versus ignition delay at ambient O2 concentrations of 21 vol.% (black), 18 vol.% (red), and 15 vol.% (blue).
Fluids 11 00203 g017
Figure 18. Flame base location traces with respect to time after start of injection, derived from schlieren images for the 21 vol.% (reference), 18 vol.% and 15 vol.% O2 concentration cases. The black dashed line indicates liquid length from diffused back-illumination, the red dashed line denotes the OH*-based lift-off with uncertainty represented using shading. The yellow dashed line indicates the instantaneous flame lift-off base. White arrows denote examples of two instances where rapid upstream shifts in flame base are observed.
Fluids 11 00203 g018
Figure 19. Probability density functions of flame base positions as a function of time after start of injection, derived from schlieren imaging for the different ambient O2 conditions. The contour shading indicates the probability density at each time interval, with the corresponding mean positions also shown. The yellow and red dashed lines denote the mean schlieren- and OH*-derived lift-off lengths, respectively, with vertical error bars at 6 ms indicating their standard deviations. The corresponding mean and standard-deviation values are listed in the top-left corner of each panel in matching colours.
Fluids 11 00203 g019
Figure 20. Axial ignition location normalised by spray tip penetration for all test conditions. The grey asterisks denote individual runs, the red circles indicate the mean ignition location, and the black error bars represent the associated uncertainty.
Fluids 11 00203 g020
Figure 21. Processed schlieren images at selected time instants for the different injection duration cases. The pilot jet boundary is shown in blue, the methanol jet boundary is in green, and the flame region is in red. Axial and radial distances are measured from the methanol injection nozzle, and the time sequence is referenced to the start of injection (SOI) of the pilot and main (methanol) jets.
Fluids 11 00203 g021
Figure 22. Flame base location traces as a function of time after pilot/main start of injection, derived from schlieren images for the reference dual-fuel case with a pilot jet of 1.0 ms injection duration. The yellow dashed line indicates the instantaneous flame lift-off base. The upper and lower horizontal white dashed lines indicate the pilot and main jet EOIs. White arrows denote examples of two instances where rapid upstream shifts in flame base are observed.
Fluids 11 00203 g022
Figure 23. Close-up schlieren images of the dual-fuel case of 1.0 ms injection duration spanning from pilot jet EOI to main jet EOI. The sequence highlights interaction between the two jets, with the blue and green lines outlining the boundaries of the pilot and main jets, respectively.
Fluids 11 00203 g023
Figure 24. Average AHRR for the dual-fuel case with pilot injection durations of 0.6, 1.0 and 1.5 ms. Shaded regions indicate run-to-run variations (one standard deviation). Vertical dashed lines denote the end of injection for the pilot jets (corresponding to the different injection durations) and the main jet.
Fluids 11 00203 g024
Table 1. Composition of reactants (in vol.%) required for reaching the ambient conditions at the fuel injection timing [ambient temperature (T), ambient pressure (P), and ambient oxygen concentration (O2)].
Conditions and Reactant Composition
TPAmbient O2C2H2H2O2N2
[K][MPa][vol.%][vol.%][vol.%][vol.%][vol.%]
1200, 1100, 10007.1, 6.6, 6.0213.000.5028.3868.12
960, 8905.7, 5.2183.030.5025.5070.97
153.060.5022.6373.82
03.200.508.2588.05
Table 2. Summary of the investigated cases, associated experimental conditions, and corresponding notations. Bold text indicates reference conditions.
Autoignition
Experimental ParametersVaried ParameterAmbient Temperature [K]Ambient O2 [vol.%]Injection Pressure [MPa]
Reference1100 K110021100
Ambient temperature variation1000 K100021100
1200 K120021100
Injection pressure variation70 MPa11002170
130 MPa110021130
Ambient O2 variation18% O2110018100
15% O2110015100
Dual-fuel
Pilot injection duration variation0.6 ms100021100
1.0 ms100021100
1.5 ms100021100
Table 3. Average liquid lengths and run-to-run variations at 0 vol.% O2 concentration and 100 MPa injection pressure. The reference case is shown in bold.
ConditionsLiquid Length
Temperature [K]O2[vol.%]Injection Pressure [MPa][mm]
1000010020.99 ± 0.95
1100010019.58 ± 1.79
1200010018.80 ± 1.48
Table 4. Summary of average ignition delays and run-to-run variations for dual-fuel cases with different pilot jet injection durations.
Pilot Fuel Injection DurationIgnition Delay [ms]
[ms, Electronic]Pilot (Schlieren Based)Main (Schlieren Based)
0.60.26 ± 0.011.48 ± 0.10
1.00.26 ± 0.021.41 ± 0.10
1.50.26 ± 0.001.38 ± 0.13
Table 5. Physical and chemical properties of methanol compared with diesel and ammonia. Referenced from [51].
PropertyMethanolDieselAmmonia
Lower heating value [MJ/kg]19.9∼43.418.8
Latent heat of vaporisation at 1 bar [kJ/kg]1101∼2561371
Flammability limit [ vol.%]6.7–36∼0.6–6.516–25
Adiabatic flame temperature [K]2143∼23262123
Minimum autoignition temperature [K]738∼527–558924
Boiling temperature [K]338∼555–611240
Fuel density at 293 K, 10 bar [kg/m3]792870610
Stoichiometric air-fuel ratio [kg air/kg fuel]6.47∼14.56.05
Disclaimer/Publisher’s Note: The statements, opinions and data contained in all publications are solely those of the individual author(s) and contributor(s) and not of MDPI and/or the editor(s). MDPI and/or the editor(s) disclaim responsibility for any injury to people or property resulting from any ideas, methods, instructions or products referred to in the content.