Article

Numerical Simulation Study on the Performance of a New Gas Burner for Radiant Heating

College of Electric and Power Engineering, Taiyuan University of Technology, Taiyuan 030024, China
*
Author to whom correspondence should be addressed.
Fluids 2025, 10(9), 245; https://doi.org/10.3390/fluids10090245
Submission received: 5 August 2025 / Revised: 7 September 2025 / Accepted: 17 September 2025 / Published: 19 September 2025
(This article belongs to the Section Mathematical and Computational Fluid Mechanics)

Abstract

Compared with other fossil fuels, the combustion of natural gas releases fewer pollutants, with carbon dioxide being the main emission. As the need for environmental protection increases, gas combustion technology has been progressively developed, working to improve combustion efficiency and reduce harmful emissions. This study utilized computational fluid dynamics to conduct a numerical simulation of gas burners, establishing a physical model on the basis of the standard structural dimensions of the burners. This research focused on investigating the impacts of the excess air ratio, air temperature, and fuel load on combustion characteristics and nitrogen oxide emission levels. These results indicate that although increasing the excess air ratio can effectively reduce nitrogen oxide generation, it adversely affects the combustion efficiency. Additionally, a decrease in air temperature tends to reduce nitrogen oxide emissions, but adaptive adjustments to the combustion system are needed to sustain efficiency. While reducing the fuel load contributes to lower nitrogen oxide emissions, it compromises the combustion efficiency.

1. Introduction

As the principal driver of global energy markets, China’s consumption volume consistently surpasses that of other major industrialized nations. Alongside the accelerated growth of China’s economy, the nation’s energy consumption requirements have exhibited a significant upward trajectory [1,2,3]. At present, the main primary energy sources worldwide are oil, coal and natural gas. In China, the total consumption of coal accounts for more than half, while the consumption of natural gas is far less than that of oil and coal. The energy consumption structure is unreasonable, which is also attributed to China’s energy pattern of “lacking oil, gas and coal” [4]. During the combustion and use of coal, large amounts of pollutants, including smoke dust, sulfur dioxide, carbon dioxide, and nitrogen oxides are released. When these pollutants are discharged into the atmosphere, they can form acid rain and the greenhouse effect [5,6], causing severe damage to the ecological environment of our country. In contrast, the main component of natural gas is CH4, which has the advantages of high calorific value, large reserves, low emissions and high efficiency and cleanliness [7,8,9]. Therefore, vigorously developing natural gas has significant practical significance for solving the problems of energy shortages and environmental pollution in China.
Gas-fired radiant heating is a highly efficient technology that uses the heat energy produced by burning natural gas or liquefied petroleum gas (LPG) to transfer heat directly to objects and the ground through equipment like radiant tubes or ceramics [10,11,12], mainly via radiant heat transfer. The main advantage of this technology is that it heats the target area directly (such as floors and equipment), avoiding the large energy consumption needed to heat the entire space (especially the unwanted air at the top) with traditional convection methods. This makes it especially suitable for places with high ceilings, like industrial plants, warehouses, maintenance workshops, and aircraft hangars. At the technical level, the use of non-premixed combustion technology and low NOx burners in closed metal tubes significantly improves combustion efficiency and reduces pollutant emissions. When the system is in operation, the air required for combustion is taken from outside, and the exhaust gas after combustion is also discharged directly to the outside. The gas-fired radiant heating system requires no external combustion equipment and is compact, saving space and complex boiler equipment required in a traditional boiler room.
Combustion technologies such as low-NOx burners in industry, DLE systems of gas turbines, and fully premixed surface burners achieve near-chemical equivalent ratio combustion by controlling the premixing of gas and air. The thermal efficiency is greater than 95%, and the NOx emissions are reduced to less than 30 mg/m3 through the control of the combustion temperature. However, it is limited by technical bottlenecks such as poor fuel adaptability and insufficient stability at low loads [13,14,15]. At present, China’s industrial combustion equipment must meet the strict requirement of NOx ≤ 80 mg/m3 stipulated in the “Emission Standard of Air Pollutants for Boilers” (GB13271-2014) [16]. However, the existing burners can improve the uniformity of mixing by 30% through nozzle dynamics optimization and cyclone field enhancement, suppress local high-temperature zones, and achieve a NOx reduction of 20% to 40% [17]. It has both economic and environmental benefits.
As key energy conversion equipment for converting the chemical energy of natural gas into thermal energy, gas burners play a role in organizing combustion [18,19,20]. At present, China is actively promoting the adjustment of its energy structure through macrolevel policy guidance. The proportion of clean energy natural gas continues to rise, and the natural gas industry has developed rapidly. Compared with conventional fossil fuels like coal and petroleum, natural gas exhibits cleaner combustion properties, producing significantly reduced levels of pollutants. Notably, its combustion process achieves minimal emissions of sulfur compounds and particulate matter, as substantiated by environmental impact studies [21,22,23]. However, its combustion process in burners involves complex physical and chemical reactions and still inevitably generates a large amount of nitrogen oxides.
In recent years, extensive research has been carried out on optimizing natural gas burners to achieve low-NOx emissions and high combustion efficiency, with notable progress in structural design, technical innovation, and alternative fuel adaptation. Fan et al. [24] addressed issues of poor heat diffusion and high NOx emissions in small and medium-sized industrial natural gas burners with straight-through nozzles by developing a new low-NOx burner fitted with a multi-port diffusion nozzle. Through a combination of numerical simulation and experimental work, they optimized the structural parameters of the burner, finding that a 40° swirl angle and 8 swirl blades were optimal. For large-scale industrial heating scenarios, Lee et al. [25] investigated the use of fuel-flow-pulsed combustion in a multi-burner reheating furnace (equipped with six 20 kW burners) to decrease NOx emissions and enhance efficiency. Their findings demonstrated that when pulsation was applied to all burners (3 Hz frequency, 90% duty cycle), NOx emissions were reduced by 77.1% compared to the baseline (76.1 ppm), and the time taken to heat a 308 kg carbon steel specimen to 1000 °C was shortened, while fuel consumption was also lowered. Regarding high-power natural gas burner technology, Huang et al. [26] developed a 14 MW water-cooled premixed burner to tackle challenges such as high flame temperatures and difficult NOx control. Using numerical simulations, they examined how structural parameters (e.g., low cooling component height, gas inlet spacing) and operating parameters affect combustion characteristics. After optimization (low cooling component height of 70 mm, gas inlet spacing of 1 mm, flare angle of gas channels of 13°, etc.), the combustion temperature was maintained at 1642 K, with NOx emissions as low as 2.89 mg/Nm3. Pandey et al. [27] investigated how synthetic natural gas (SNG)—a potential alternative to LPG—operates in traditional LPG burners through computer simulations. They discovered that increasing the nozzle orifice size by 40–50% (optimally to 1.15 mm) allowed SNG to burn completely at an inlet pressure of 2.75 kPa, with an average flame temperature of 1700 K and a uniform flame distribution, laying the groundwork for adapting LPG burners to utilize natural gas-based fuels.
Gas burners have been widely used because of their high efficiency, safety and reliability. However, as the main energy-consuming equipment in China now and in the future, how to achieve energy conservation and emission reduction has received extensive attention from all sectors of society, and research on gas burners has also become a hot topic in academic circles. Existing studies on natural gas burners mainly focus on structural optimization (e.g., multi-port nozzles, swirl blades), specific low-NOx technologies (e.g., pulsed combustion, water cooling, flue gas recirculation), or alternative fuel adaptation. Meanwhile, the impacts of key operating parameters (such as excess air ratio, air temperature, and fuel load) on combustion characteristics and NOx emissions—critical for practical burner operation and optimization—require further systematic investigation. In this work, the research subject of this work is a 300 kW gas-fired radiant heating system applied to aircraft hangars. The combustion process of the burner was studied using numerical simulation with the application of computational fluid dynamics. The internal flow field of the overall gas burner was analyzed by investigating the effects of excess air ratio, air temperature and fuel load on the combustion characteristics, and the combustion characteristics and NOx generation law were determined to provide a reference basis for the optimization of the gas burner.

2. Materials and Methods

2.1. Physical Model

This paper mainly studies the combustion process of natural gas in gas burners. Figure 1a shows the image of the burner’s internal structure. Combining the relevant size parameters of the burner, the 3D model of the burner was built at a 1:1 scale via the 3D modeling software SolidWorks 2024 to restore the entire detailed structure of the burner. The 3D structural model of the burner is shown in Figure 1b. It is composed of the burner shell and the internal structure of the burner. The dimensions of the burner shell are 245 mm × 245 mm × 390 mm. The internal structure of the burner includes the fuel inlet pipe, natural gas header, nozzle, scaling pipe and stable diffuser inside the pipe. Natural gas first enters the natural gas header with dimensions of 200 mm × 160 mm × 60 mm through three inlet pipelines. After being diverted in the natural gas header, it is ejected from twenty-one nozzles distributed on the outlet surface of the header. The burner uses a staged air supply system, with primary air mainly introducing natural gas into the burner to ensure proper mixing and combustion at the start. Secondary air then provides extra oxygen to areas where the primary air does not fully burn the fuel, promoting complete combustion and increasing efficiency and temperature. The distributions of the natural gas header and nozzles are presented in Figure 1c. Further research has been conducted on the scaling tube and the internal stable diffuser, as they play crucial roles in the overall combustion effect. Figure 1d shows the relevant structures of the scaling tube and the internal stable diffuser. The relevant technical parameters of this gas burner are shown in Table 1 below. The scaling tube is a typical combination of a mixer and a diffuser and is widely used in burner design. The model of the fluid computing area can be found in the additional materials.

2.2. Grid Division

The volume extraction tool in SCDM 2024 software was utilized to extract the fluid region from the 3D model of the combustor to obtain a continuous working volume. The gas burner cross-section and symmetric model computational area are shown in Figure 2. The determined calculation area model was imported into FLUENT meshing for grid division. Owing to the symmetrical structure of this burner, a semi-model approach was adopted for simulation analysis to reduce computational resources, enhance efficiency, and facilitate data encryption. Following the aforementioned meshing methodology, the gas burner was divided into four distinct grid configurations, each subjected to independent validation. The results are presented in Table 2 below. Grid 1 exhibited poor fitting performance. From Grid 2 to Grid 4, simulation quality progressively improved with increasing grid density, though computational time correspondingly rose. Compared to Grid 3, Grid 4 required 50% longer computation time. Balancing practical computational resources and simulation accuracy, the final grid size selected was 1.2 million (semi-model). To verify the correctness of the meshing, the temperature distribution on the axial centerline of the gas burner was calculated, and the results are shown in Figure S2. Figure 3 below shows the final determined calculation grids for the burner area.

2.3. Mathematical Model

In this work, the SIMPLE algorithm was selected for simulation, and the discretization format was the second-order windward format PRESTO! for pressure discretization of the combustion process [28]. The governing principles underlying all natural flow and reaction phenomena are universally described by three fundamental conservation laws: mass, momentum, and energy conservation. In a given system, whether a single component or multiple components coexist, each of its components must follow the component conservation equation. As shown in Equations (1)–(4),
ρ t + ( ρ u i ) x i = 0  
( ρ u i ) t + · ( ρ u i u j ) = p + · ( μ u i ) + ρ g + F
( ρ h ) t + ( ρ u i h ) x j = - p u j x j + ( λ T x j ) + Φ + S h
t ( ρ m l ) + x j ( ρ u j m l + J l , j ) = R l
where t is time, ρ is the density, kg/m2, s; u is the velocity in the x directions, m/s; μ is the molecular viscosity of the fluid, Pa∙s; p is static pressure on the fluid microelement; g is gravitational volumetric force, N; F is external volume force, N; ( λ T x j ) is heat conduction term; λ is thermal conductivity, W/(m·K); Φ is dissipation coefficient, W/m3; Sh is internal heat source, W/m3; ml is mass fraction of component l, %; Jl is diffusion flux of component l, kg/(m2·s); and Rl is the formation rate of component l, mol/s.
In this work, considering that the gas nozzles are closely arranged and have a complex structure and small pore diameters, the gas burner model and combustion process lead to drastic changes in the flow field, which may lead to the formation of a reflux zone and turbulent flow. Moreover, there is a diffusion stabilizer inside the combustion chamber, with many diffusion holes distributed on it, which will form vortices. Therefore, the Realizable k-ε model was finally used to simulate the turbulence process [29]. The species transport model can be used to simulate the combustion mechanism to choose Fluent’s own methane two-step combustion mechanism, and the corresponding species transport model to use the ED (Eddy-Dissipation) model (Equations (5) and (6)). In response to the requirements of this research and literature review, the P-1 radiation model (Equation (7)) was selected [30].
R i ,   r = v i ,   r M w ,   i A ρ ε k Y p j N v j ,   r M w ,   j
R i ,   r = v i ,   r M w ,   i A ρ ε k min Y R v R ,   r M w ,   R
q r = 1 3 ( α + σ s )     C σ s G
where Y p is the mass fraction of P; Y R is the mass fraction of R; v is the chemical stoichiometry; G is the incident radiant heat, J; α is the absorptivity; σs is the diffusion coefficient; and C is the linear anisotropic stage function coefficient.
During the combustion of gas, NOx is inevitably generated. Actual test results show that NO is the main source of NOx emitted from combustion plants, accounting for more than 95% of the NOx. The chain equation for the formation of NO from the reaction of N2 was given by Winter et al. [31], as shown in Equations (8)–(10). Studying the emissions of nitrogen oxides during the combustion process is an important indicator for measuring combustion performance. The sources of NOx in burners are three main sources: rapid-type, thermal-type and fuel-type. Fuel-type NOx is mainly generated by the reaction between N in the fuel and O in the air, given the composition of natural gas used in this work does not contain N, so fuel-type NOx is ignored. Fast-type NOx is generated at the front of the flame when the concentration of oxygen in the fuel is higher, the generation speed is very fast and the amount of generation is very small, the concentration of oxygen is the main influencing factor, and it is almost independent of the temperature, so the fast-type NOx is ignored. Thermal-type NOx is mainly generated by the reaction between N in the air and O at high temperature. The excess air coefficient, temperature, and residence time are the main influencing factors. NOx increases with temperature, especially when the temperature is higher than 1500 K, and NOx shows an exponential growth law with the increase in temperature. Therefore, in this work, the thermal type NOx is mainly considered in the thermal state simulation calculation.
O 2 O + O
O + N 2 NO + N
N +   O 2 NO + O

2.4. Boundary Conditions

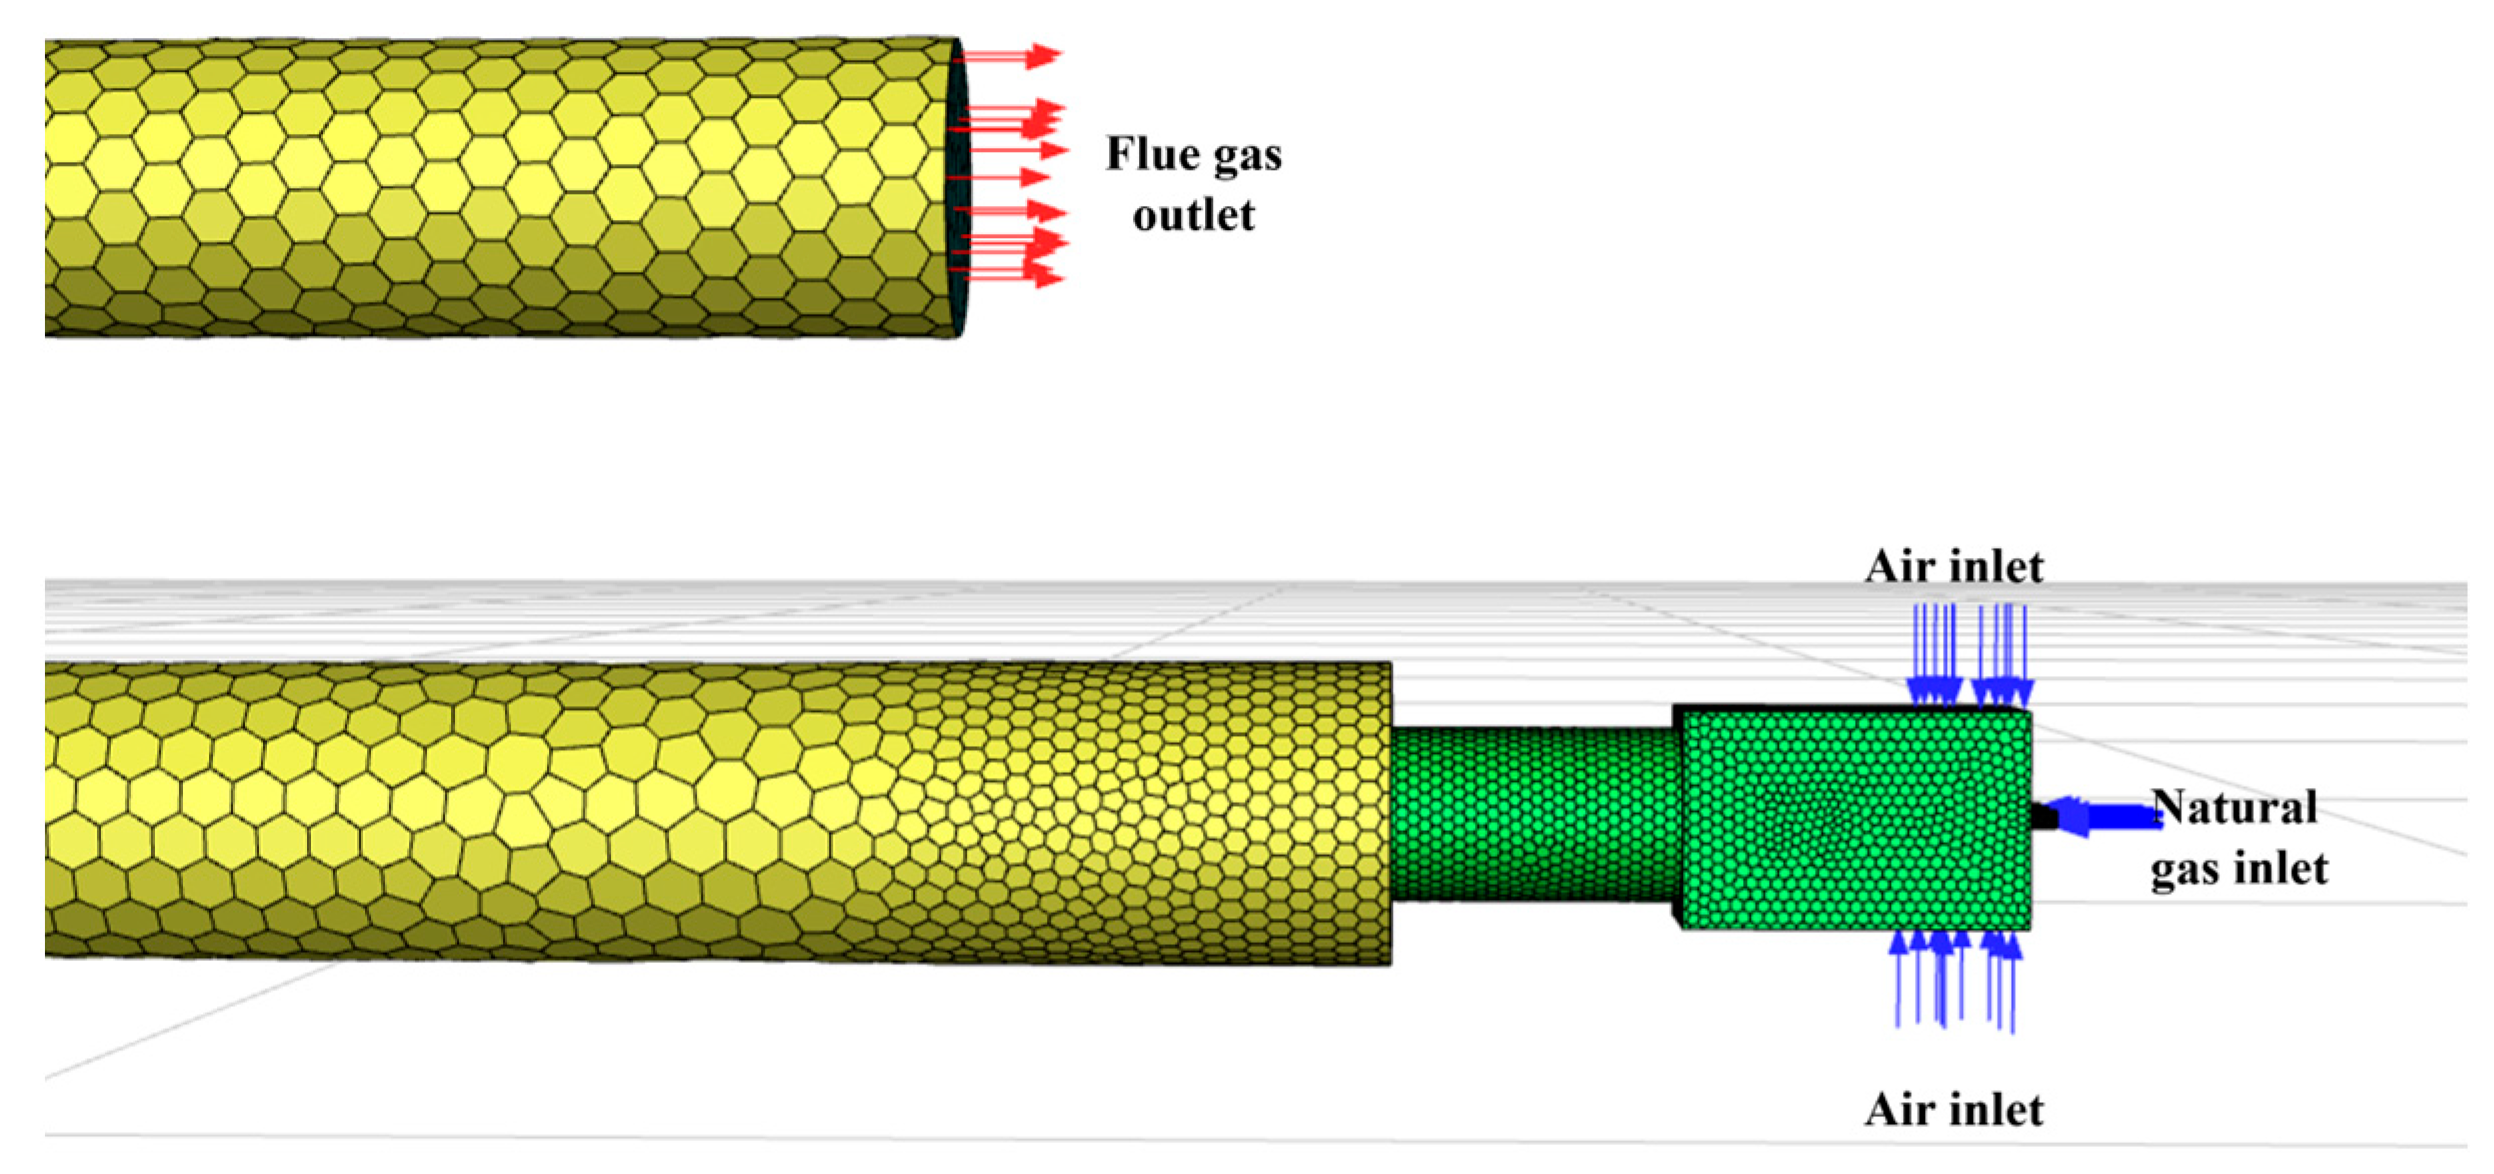
The rated operating conditions of the gas burner studied in this paper are as follows: gas flow rate, 28.59 m3/h; excess air ratio, 1.7; 100% load; and flue gas temperature, 100 °C. The simulation established inlet, outlet and wall boundary conditions according to the specified operational parameters. The schematic diagram of the gas inlet and outlet is shown in Figure 4. Due to the symmetrical design of the burner, this study employed a symmetry boundary condition to simulate the half-model. As shown in Figure S1, the symmetry plane was aligned with the burner’s central axis. This boundary condition allowed free transfer of fluid and heat across both sides of the symmetry plane, with zero normal velocity and free tangential velocity sliding. Using symmetry boundary conditions significantly reduced the size of the computational mesh, improving efficiency while maintaining the symmetry of the flow field, temperature field, and species distribution, consistent with physical reality. In this model, positioning the symmetry plane ensured that the simulation results matched those of the full model, confirming the suitability and effectiveness of the symmetry boundary condition.

2.4.1. Inlet Boundary Conditions

The gas inlet was configured as a mass-flow inlet boundary condition. Based on the gas burner’s structural design, the fuel supply is distributed through three equally sized inlet pipes, with uniform boundary conditions maintained across all three gas entry ports. With a gas flow rate of 28.59 m3/h when the gas burner is working at full load, the calculated mass flow rate of each gas inlet is 0.0019 kg/s. The hydraulic diameter was set to the diameter of the fuel inlet pipe (21.5 mm). The turbulence intensity was set to 5. The temperature was set to 300 K. In the gas burner, the air enters two streams through two inlets of different shapes. Since both streams of air come from the atmosphere and the negative pressure at the inlets is essentially the same, the ratio of the two streams of air is the area ratio. The gas burner’s two air intake channels demonstrated calculated mass flow rates of 0.135 kg/s and 0.031 kg/s when operating at its rated capacity with an excess air ratio of 1.7.

2.4.2. Outlet Boundary Conditions

According to the actual operating conditions, a smoke exhaust fan is installed at the pipeline outlet. The simulation employed a pressure outlet boundary condition maintaining 5.0 kPa backpressure. The mass fraction of oxygen was set at 0.2315. The hydraulic diameter was 350 mm from the pipe outlet diameter, the turbulence intensity was set to 5, and the temperature was set to 373 K.

2.4.3. Wall Boundary Conditions

The wall surfaces of both the burner and the pipe were set to be slip-free and mass-permeable. When there is significant convective heat transfer between the flue gas and the wall, a heat flux boundary condition needs to be set to simulate this heat transfer. In this work, the heat flux of the pipe wall was set through a user-defined function (UDF) compilation so that it varies with the flue gas temperature inside the pipe. The UDF defines a surface distribution function. Under the condition that the external temperature of the pipeline is kept at room temperature (25 °C), the real-time temperature of the flue gas inside the pipeline is obtained from the simulation first, and the corresponding heat flux is calculated on the basis of the flue gas temperature. The calculated heat flux is used to update the thermal conditions of the pipe wall, thereby controlling the wall heat flux according to the flue gas temperature in the pipeline.

2.5. Model Validation

To study the emission characteristics of the burner and the accuracy of the subsequent numerical simulation results, experimental tests and resultant data analyses are carried out for the burner studied in this work. The system is shown in Figure 5. The whole experimental system is mainly composed of a combustion chamber, burner, natural gas pump, fan, and flue gas external circulation pipe. The experimental conditions were set to the rated operating conditions of the gas burner (gas flow rate 28.59 m3/h, excess air ratio 1.7, 100% load). There is a temperature measurement point at the outlet of the pipeline, where type K thermocouples are arranged before starting the combustion furnace and sealed with a high-temperature resistant sealant for data recording. A testo-330-1L flue gas analyzer (Lindau, Germany) was used in this experiment to measure the NOx concentration at the outlet.
The actual measured results were compared in the field with the simulation results, and the results are shown in Table 3 below. As can be seen from the table, the gas burner’s actual operation measured pipeline flue gas outlet temperature of 373 K, the numerical simulation results for 364.3 K, and the relative error of 2.4%. The actual pipeline outlet NOx emission concentration of 9.8 mg/m3, the simulation results for the 9.4 mg/m3, the relative error of 4.1%. Although there is a certain error between the simulation results and the actual measured data on site, the relative errors of the pipeline outlet flue gas temperature and NOx emission concentration are within the acceptable range of 5%. It can be seen that the physical model of the gas burner and the regional model of fluid calculation used in this study are more reasonable and can simulate the real operation situation to meet the research needs.

3. Results

3.1. The Influence of the Excess Air Ratio on the Performance of Burners

The excess air ratio represents the proportion between the actual combustion air supply and the stoichiometric requirement (the minimum air needed for complete fuel combustion). This parameter governs flame characteristics by regulating air-fuel mixing intensity, directly affecting combustion stability, emission profiles, and thermal output efficiency. Expanding from the reference condition with a 1.7 excess air ratio at rated operation, this study comparatively examines fuel-rich (1.4 ratio) and oxygen-enriched (2.0 ratio) combustion regimes. While maintaining constant natural gas mass flow at 0.0019 kg/s across all simulations, the corresponding combustion air supply rates for different test cases are systematically regulated as documented in Table 4, enabling isolation of excess air ratio effects on burner performance.
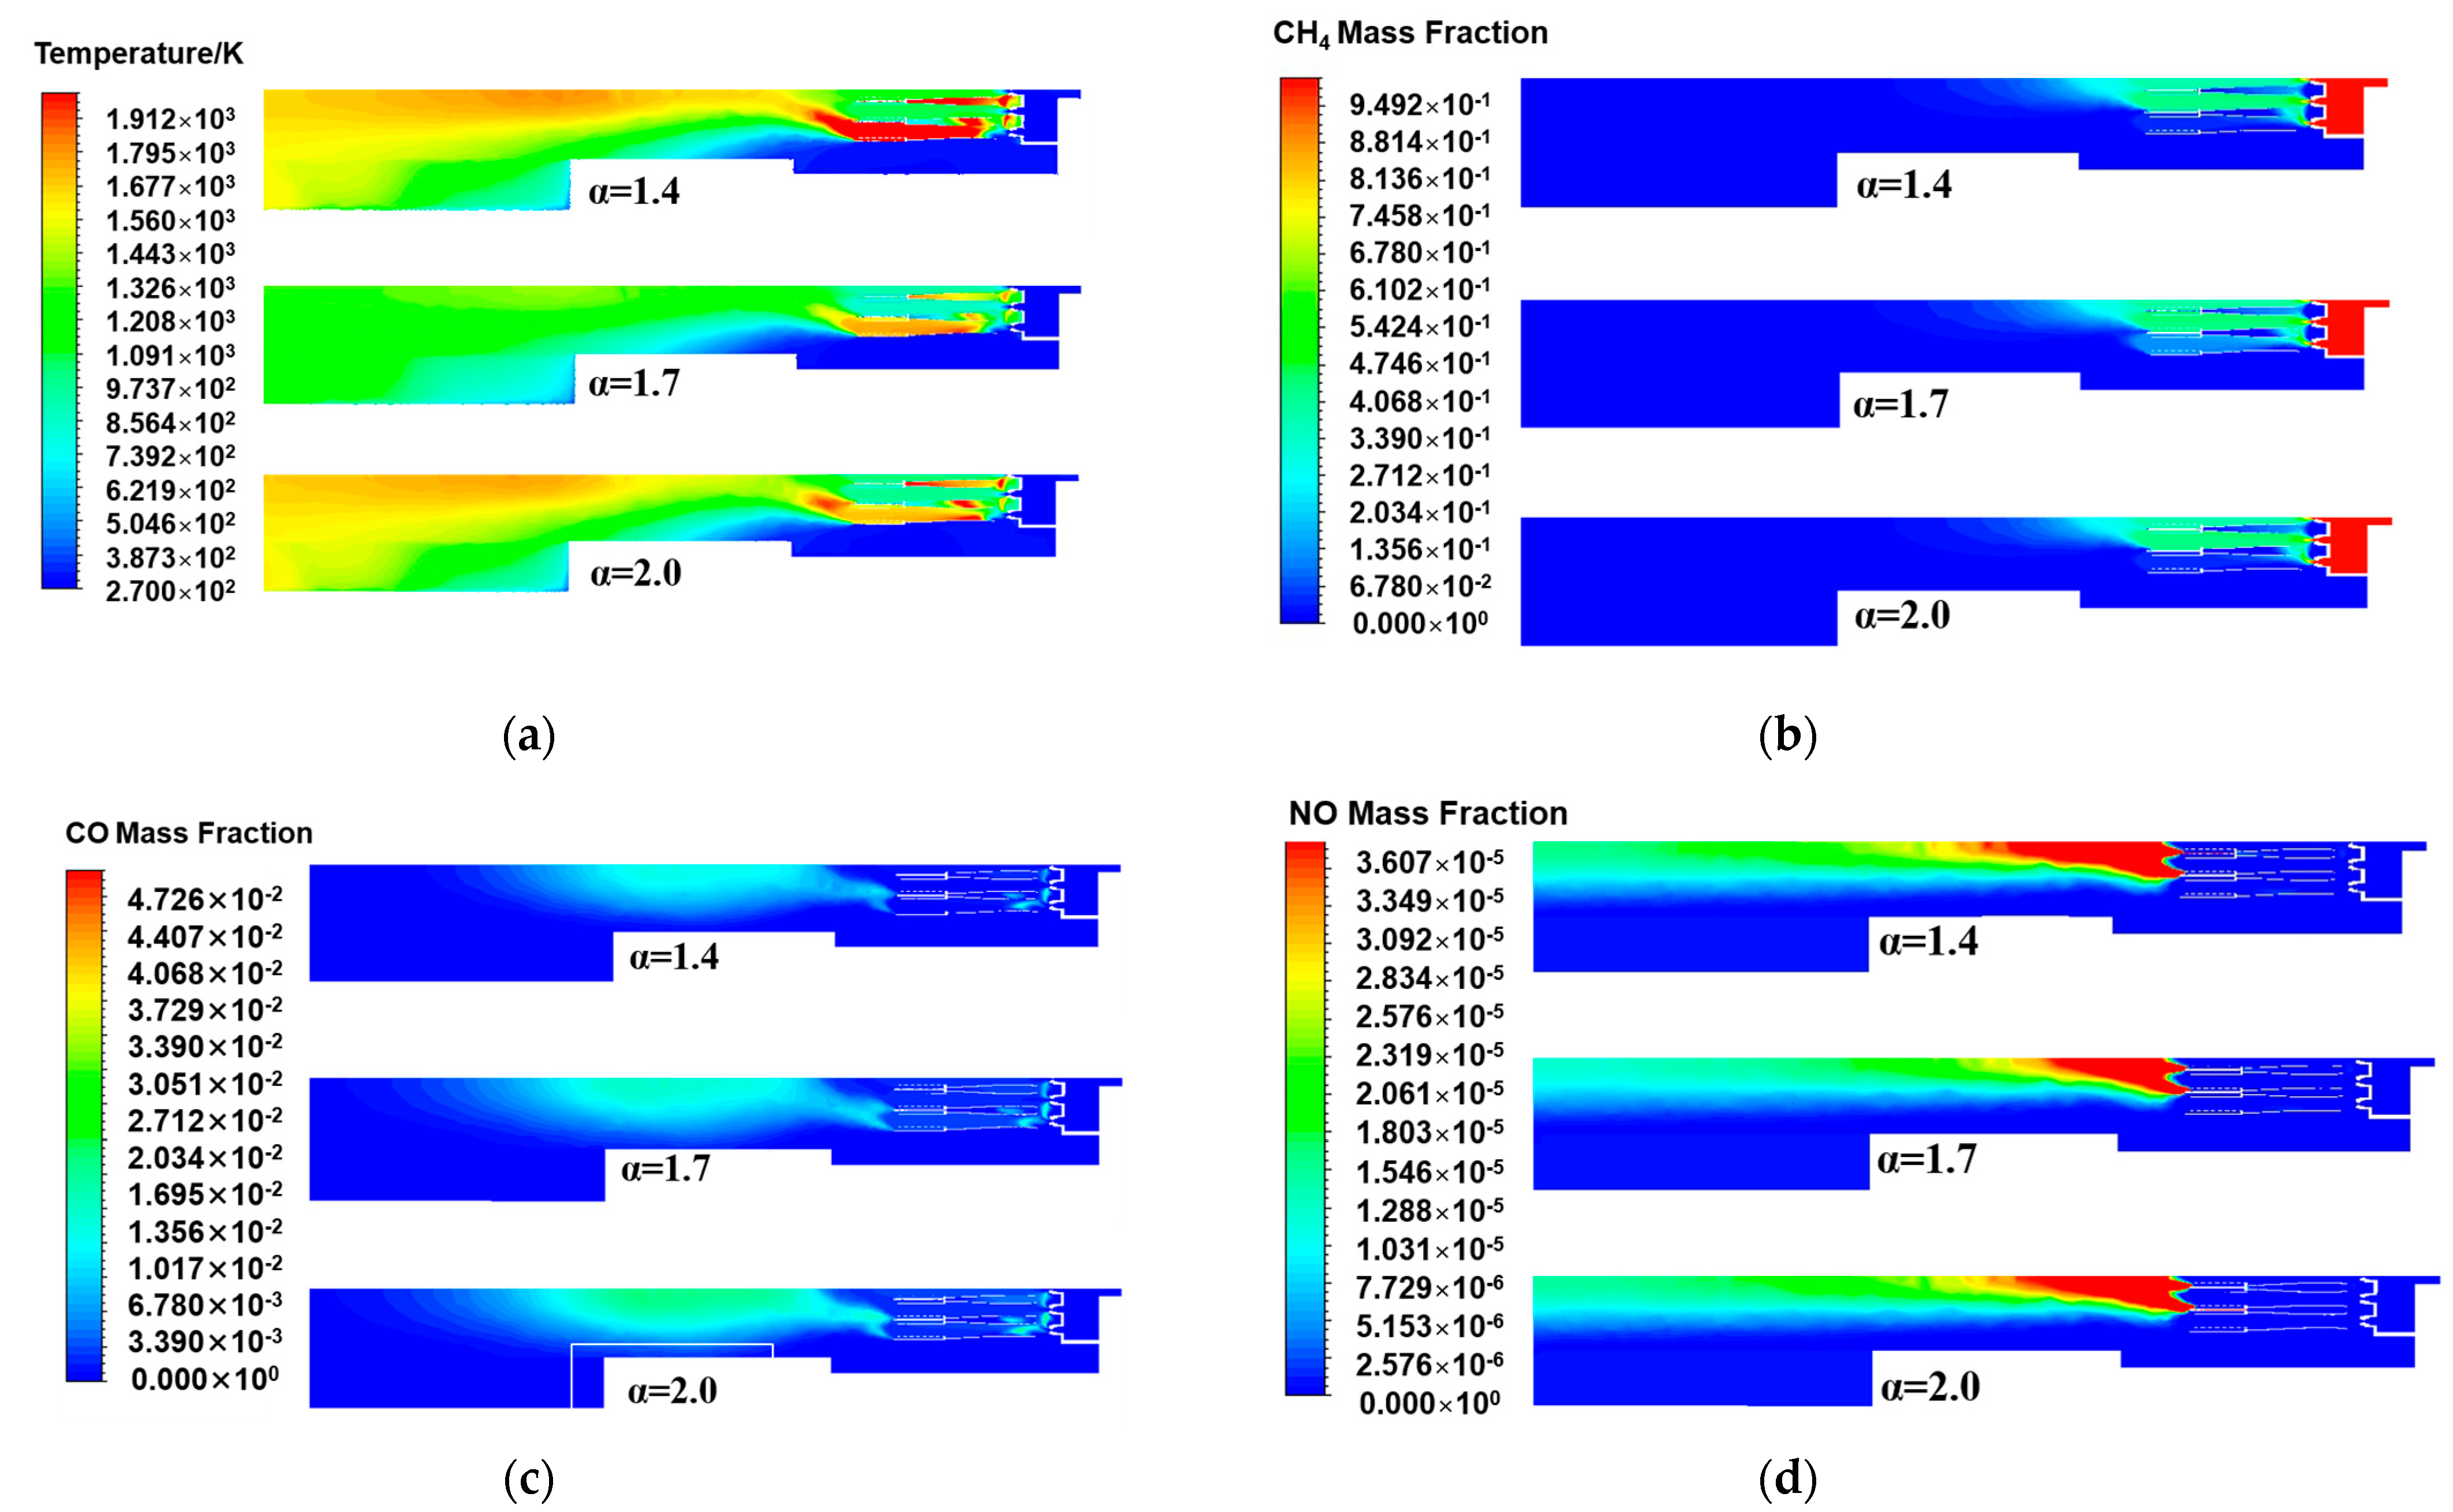
From the temperature distribution of the central cross-section of the burner axis direction under different excess air ratios in Figure 6a, the temperature changes in the central cross-section of the three excess air ratios were basically the same, presenting high temperatures in the burner head area. When most of the natural gas reacted, the temperature began to gradually decrease, and then the temperature increased at the rear of the burner. When the excess air ratio decreased from 1.7 to 1.4, the results revealed that the flame was significantly concentrated and hot, indicating that the temperature also increased accordingly. Specifically, the excess air ratio decreased, approaching the stoichiometric air volume of natural gas, making the combustion more complete, improving the combustion efficiency, and increasing the temperature at the center of the flame. When the excess air ratio increased to 2.0, compared with the excess air ratios of 1.4 and 1.7, the high-temperature range decreased, and the maximum temperature did not exceed 1800 K. It was indicated that although the total amount of oxygen increased, the air experienced a dilution effect. The temperature of the air entering the burner was 300 K, which was relatively low compared to that in the high-temperature combustion zone. This implied that in addition to the air participating in combustion, the excess low-temperature air continued to absorb heat, resulting in a smaller high-temperature zone and a decrease in the average temperature. Although there was still a temperature rise in the rear area of the burner, the recovery was significantly smaller. This is because natural gas underwent a second reaction in this area, which was more likely to occur under high-temperature conditions. However, two more cold air masses flooded into the middle and rear areas, harming the subsequent continuous reaction, resulting in a decrease in the overall temperature inside the burner.
Figure 6b show the distributions of the methane mass fraction at the central cross-section of the burner axis direction under different excess air ratios. The combustion efficiency and fuel utilization under different excess air ratios can be analyzed in more detail. Compared with the excess air ratio of 1.7 under the rated working condition, the methane concentration in the areas on both sides of the burner head scaling tube with excess air ratios of 1.4 and 2.0 decreased. This is because when the excess air ratio was 1.4, a lower excess air ratio made the air volume during the combustion process closer to the stoichiometric air volume, meaning that the supplied air volume more precisely matched the combustion requirements of the fuel. Under such conditions, methane molecules reacted with oxygen more rapidly and thoroughly, thereby forming a higher combustion temperature locally. The residual unburned methane was reduced, and the combustion efficiency was improved. In contrast, when the excess air ratio was 2.0, owing to the relatively large amount of introduced air, the temperature in the combustion area was relatively low. However, the oxygen supply on both sides of the burner head scaling tube was sufficient, promoting the complete combustion of methane. Therefore, the final goal was to maintain the remaining methane mass fraction at a relatively low level. In conclusion, increasing or decreasing the excess air ratio can effectively promote the combustion of methane and reduce the amount of unburned methane.
The mass fraction distribution of carbon monoxide in Figure 6c shows that as the excess air ratio increased, the concentration of carbon monoxide produced by the combustion reaction increased. When the excess air ratio was 1.4, the oxygen supply was more precise. In the head area of the gas burner, the methane combustion reaction was complete, ratio and the high-temperature area in the burner was also larger, which was more conducive to the conversion of carbon monoxide to carbon dioxide, reducing the residual carbon monoxide in the second step of the natural gas reaction, thereby resulting in less carbon monoxide and more carbon dioxide being produced. As the excess air factor increased to 1.7, the overall oxygen supply increased, facilitating complete combustion at this point from a theoretical standpoint. However, owing to the uneven distribution of oxygen or excessive oxygen in some local areas, the temperature in the burner head area decreased, and the methane in the burner head area failed to be fully oxidized into carbon dioxide, reducing the reaction rate of the second step in the middle area. The excess air ratio was further increased to 2.0. The excess air further decreased the temperature in the combustion zone, resulting in incomplete combustion reactions, promoting the generation of carbon monoxide, and reducing the efficiency of converting methane into carbon dioxide.
The NOx distribution of the central section of the burner axis direction when the excess air ratio was changed is shown in Figure 6d. The distribution trends of nitrogen oxides with different excess air ratios were the same. The high-nitrogen oxide concentration area began at the rear of the scaling tube, and then, the concentration continuously decreased along the axis direction. The high-value area of NOx with an excess air ratio of 1.4 was the largest, and the concentration decreased more slowly. This was attributed to the fact that natural gas was closer to the stoichiometric air volume of the reaction. The mixing and temperature distribution inside the burner resulted in the existence of local high-temperature and high-oxygen concentration areas, thereby promoting the generation of NOx. Moreover, the temperature in the rear area of the burner was generally relatively high, which made the generation of NOx last longer along the axis of the burner. Under three different excess air ratios, the interior of the burner was in an oxygen-rich state. The higher the excess air ratio, the greater the amount of excess air. When the excess air ratio increased to 2.0, the high-concentration area in the nitrogen oxide distribution decreased. Owing to the low temperature of the excess air and its continuous injection, the overall temperature level of the burner decreased, resulting in a reduction in the generation of thermodynamic NOx. On the other hand, although the concentration of carbon monoxide in the rear area of the burner increased, which was conducive to the generation of NOx, the inhibitory effect of temperature on NOx was more significant.
Table 5 demonstrates the correlation between excess air ratio and outlet parameters in pipeline systems, with all outlet data representing averaged values. Experimental observations reveal an inverse relationship between excess air ratio and flue gas temperature at the burner exit. This temperature reduction stems from increased cold air intake during combustion augmentation, a phenomenon corroborated by thermal imaging analysis. While a minor discrepancy (≤3.2%) exists between measured flue gas temperatures and the preset 373 K benchmark, such variation remains within acceptable experimental tolerance thresholds. Notably, NOx emission concentrations exhibit significant dependence on air ratio regulation. At α = 1.4, particulate emissions reach 16.2 mg/m3, exceeding standard limits. Progressive elevation to α = 1.7 and α = 2.0 reduces NOx concentrations by 42.1% and 51.2%, respectively, through thermal suppression mechanisms. This nonlinear response underscores the critical balance required in practical operation: sufficient oxygen supply must be maintained while mitigating adverse thermal effects and controlling NOx formation. Optimization strategies should prioritize achieving combustion efficiency and emission compliance through precise air ratio modulation.

3.2. The Influence of Air Temperature on the Performance of Burners

This natural gas burner relies on ambient air to supply oxygen for combustion. Given its primary application in winter heating systems across diverse geographical regions, the substantial impact of environmental temperature variations on both NOx emissions and combustion efficiency warrants thorough investigation. To assess burner performance under extreme climatic conditions, we conducted numerical simulations comparing three air intake temperatures: standard operating temperature (300 K) versus subfreezing conditions (243 K and 268 K). All simulations maintained identical operational parameters—100% fuel load and 1.7 excess air ratio—with only the combustion air temperature being modified. This controlled study enables precise evaluation of temperature-dependent combustion characteristics while predicting equipment stability under harsh environmental conditions.
Figure 7a displays the temperature distribution on the central cross-section of the burner’s axis direction for different air temperature conditions. As the air temperature decreased, the temperature in the burner head area also decreased, especially on both sides of the scaling tube, and the local high-temperature area also shrank. This indicates that a decrease in air temperature was not conducive to promoting the cracking of methane molecules for oxidation reactions. Part of the heat released by the combustion of methane was used to heat low-temperature air, thereby reducing the temperature in the head area. As a result, the flame length decreased, and the temperature at the center decreased [32]. In the rear area of the burner, as the air temperature decreased, the rewarming zone inside the burner gradually moved backward. The reason is that as the air temperature sent into the burner decreased, the air temperature diffusing into the middle and rear areas also decreased, and the corresponding enthalpy value of the air gradually decreased. Compared with those in the normal temperature state, the air kinetic energy and molecular activity of cold air decreased. The stability of the fluid was further enhanced, and the turbulence of the fluid was weakened, which was not conducive to the mixing of natural gas and air. This slowed the second-step combustion reaction occurring in the rear area, and the corresponding reaction zone between air and carbon monoxide was delayed [33]. Therefore, the warming zone was shifted backward.
Figure 7b displays the distribution characteristics of methane in the central section of the burner’s axis direction at different air temperatures. As the air temperature gradually decreased, the methane concentration in the burner head area and the methane distribution area significantly increased. This is because when the air temperature decreased, the temperature of the oxygen entering the burner to participate in combustion also decreased. As one of the main driving forces for the combustion reaction rate, temperature directly affects the activation energy state of molecules and the process of chemical reactions. A lower air temperature reduced the heat carried by the air entering the combustion zone, resulting in a slower decomposition and oxidation reaction rate of fuel molecules in the initial combustion stage. Unburned methane molecules accumulated in the head area of the burner, meaning that thermal energy was not effectively converted and the combustion efficiency decreased. Thus, the lower the air temperature, the more pronounced the accumulation of methane molecules. This phenomenon manifests as an increase in the methane concentration and an expansion of the distribution area. Figure 7c shows the distribution of carbon monoxide in the central section of the burner’s axis direction at different air temperatures. As the air temperature decreased, the concentration of carbon monoxide increased. This phenomenon was directly related to the slowdown of combustion reaction kinetics in a low-temperature environment. The lower air temperature delayed the complete conversion of methane to carbon dioxide combustion products in the burner. The complete oxidation reaction of the fuel was inhibited, and the incomplete oxidation reaction became more frequent, resulting in the accumulation of the intermediate product carbon monoxide and ultimately a decrease in the carbon dioxide concentration.
By observing the NOx distribution of the central cross-section of the burner axis direction at different air temperatures in Figure 7d, it was found that as the air temperature decreased, the high-concentration area of nitrogen oxide emissions inside the burner gradually decreased. Compared with the nitrogen oxide distribution at an air temperature of 300 K under the rated working conditions, the generation of nitrogen oxides at other air temperatures generally decreased. Combined with the generation mechanism of thermodynamic NOx, when the temperature is higher than 1500 K, thermodynamic NOx begins to be generated. When the temperature is higher than 1800 K, the generation rate of thermodynamic NOx increases exponentially with increasing temperature. As the air temperature gradually decreased, the area inside the burner above 1500 K decreased. In a low-temperature environment, the activity of nitrogen molecules reacting with oxygen decreased, thereby reducing the emission of nitrogen oxides. The simulation results of the pipe outlet parameters under different air temperatures are shown in Table 6. As the preheating temperature decreased, the generation of nitrogen oxides at the pipe outlet also gradually decreased. The emission concentrations of NOx at the pipe outlet when the air temperature was 268 K and 243 K were 7.6 mg/m3 and 6.2 mg/m3, respectively. Compared with the air temperature of 300 K, these values decreased by 1.8 mg/m3 and 3.2 mg/m3, respectively. The lower the air temperature, the less favorable the production of NOx. Although lowering the air temperature can reduce the formation of nitrogen oxides, the effect is to lower the combustion efficiency, thereby reducing the heat generated by the burner. Therefore, while ensuring that the internal temperature of the burner is moderate during practical applications, the air temperature can be appropriately reduced to reduce the generation of nitrogen oxides.

3.3. The Influence of Fuel Load on the Performance of Burners

The variable load operation capacity of gas burners is an indispensable part of the modern energy utilization system. From the perspective of energy efficiency, variable load operation allows burners to quickly adjust their output power according to actual needs, avoiding excessive or insufficient energy supply and achieving precise control of heating. The variation laws of the combustion performance of gas burners under fuel load conditions of 100%, 80% and 60% were explored and the influence of load on the performance of burners was deeply analyzed in this section, providing a scientific basis for the optimization of the combustion process in industrial production. During the simulation process, keeping the other working condition parameters unchanged, if the fuel load was altered, the corresponding air inlet mass flow rate also changed. The specific parameters are shown in Table 7.
Figure 8a shows the temperature distribution of the central section of the burner axis direction with fuel loads of 100%, 80%, and 60%. It was found that the reduction in the fuel load had a significant effect on the thermodynamic characteristics of the combustion process. Specifically, as the fuel load decreased, the area of the high-temperature zone in the internal temperature field of the burner decreased, and the peak temperature of the combustion chamber also decreased accordingly. This phenomenon suggested that the reduced fuel input at low fuel load conditions was not conducive to more intense chemical reactions. The chemical reaction rate slowed, and the total energy release correspondingly decreased, resulting in not only a reduction in the average temperature level of the burner but also a weakening trend in the internal temperature peak. This suggested that the combustion reaction was relatively weak and more dispersed in distribution. Under low fuel load conditions, owing to the reduced flow rate of the fuel and air mixture, the time required for the combustion reaction was prolonged, the flame propagation speed slowed, and the amount of combustion involved in combustion decreased, resulting in a reduction in the required combustion distance. Therefore, the length of the combustion flame decreased as the fuel load decreased, and the temperature at the center of the flame also decreased accordingly [34]. The chain reaction not only weakened the radiative heat transfer efficiency in the combustion area but also caused the overall temperature inside the burner to decrease.
Figure 8b,c show the distributions of the methane and carbon monoxide in the central cross-section of the burner axis direction under different fuel loads. Under the condition of reducing the combustion load, the amount of fuel entering the burner decreased, the initial methane concentration decreased, and the expected methane concentration decreased accordingly. However, the distribution of methane at the central cross-section of the burner axis direction under different fuel loads showed that when the fuel load decreased from 100% to 80%, the concentration of methane fuel did not decrease significantly, remaining basically unchanged. This phenomenon was attributed to the decrease in the combustion temperature. The decrease in combustion temperature not only affected the chemical reaction kinetics of methane oxidation but also may have a negative effect on the mixing efficiency and turbulence intensity in the combustion chamber [35]. Specifically, the lower combustion temperature slowed the chemical reaction rate between methane and oxygen, resulting in insufficient collision frequency and energy between fuel molecules and oxidant molecules to rapidly trigger an effective chain reaction, thereby reducing the conversion efficiency of methane. Moreover, the reduction in mixing efficiency and decrease in turbulence intensity caused the combustible ratio of the mixed gas to deviate from the optimal state, further limiting the effective contact between methane and oxygen and thereby affecting the integrity of combustion. Therefore, when the initial concentration of methane decreased and the proportion of unburned methane increased, the interaction between the two reached a dynamic equilibrium. Thus, the concentration of methane was essentially unchanged. In the central cross-section of the burner axis direction under different fuel loads, as shown in Figure 6c, the reduction in the high-temperature peak in the combustion area weakened the promoting effect of the high-temperature area on methane oxidation and aggravated the phenomenon of incomplete combustion, indicating that in a lower-temperature environment, the chemical combination process between fuel molecules and oxygen was hindered. Instead of fully converting methane into the complete combustion product carbon dioxide, a relatively large amount of carbon monoxide was produced. Carbon monoxide, a marker of incomplete combustion, had a significantly increased concentration in the distribution map, resulting in a decrease in combustion efficiency.
In Figure 8d, the simulation results of the NOx distribution at the central cross-section of the burner axis under different fuel load conditions show that as the fuel load decreased, the generation of nitrogen oxides in the combustion chamber tended to decrease. This phenomenon was attributed to the fact that when the fuel load decreased, the total energy released by the combustion reaction correspondingly decreased, resulting in a decrease in the overall temperature level in the combustion chamber. A lower combustion temperature had an inhibitory effect on the generation of nitrogen oxides and a significant inhibitory effect on the generation of thermodynamic NOx, which relied on high-temperature conditions [36]. In addition, a decrease in the combustion temperature affected the mixing characteristics between the fuel and the oxidant. Under conditions of lower temperatures, the time required for the fuel and oxidant to reach complete mixing and start effective combustion was prolonged, which led to a slowdown in the chemical reaction rate and a decrease in the probability of local high-temperature area formation, thereby reducing the possibility of nitrogen oxide generation overall. Table 8 details the pipeline outlet parameters obtained through numerical simulation under different fuel load conditions. As shown in the table, under partial load conditions, the fuel supply decreased, and the combustion became incomplete, resulting in a decline in combustion efficiency. Therefore, the flue gas temperature at the pipeline outlet gradually decreased as the fuel load decreased. Compared with full fuel load operation, that is, under the benchmark of nitrogen oxide emissions of 9.4 mg/m3, when the fuel load was 80%, the nitrogen oxide emission concentration at the pipeline outlet was 7.8 mg/m3, indicating that load adjustment had a positive effect on emission control. At this point, the fuel load was further reduced to 60%, and the nitrogen oxide emission concentration at the pipeline outlet was 6.7 mg/m3. These data further confirmed the positive correlation between reducing the fuel load and reducing nitrogen oxide emissions. Therefore, by adjusting the fuel load, the generation of nitrogen oxides during the combustion process can be effectively controlled, which provides important guidance for the optimization of burner operations and the control of NOx emissions.

4. Conclusions

  • The influence of the excess air ratio on combustion characteristics is evidently significant. As the excess air ratio approaches the theoretical air volume, while combustion efficiency remains relatively high, NOx emissions are observed to increase markedly. Specifically, at the pipeline outlet, NOx emissions have risen by 42.1% compared to those under rated operating conditions. Conversely, increasing the excess air ratio can effectively mitigate nitrogen oxide emissions; however, this adjustment typically results in a decrease in combustion efficiency.
  • A reduction in ambient air temperature effectively minimizes NOx emissions; however, it adversely impacts combustion efficiency. Simulation analyses indicate that temperatures within the combustion zone decline markedly under extreme environmental conditions. Consequently, the combustion system must implement adaptive measures to maintain optimal combustion performance in low-temperature air environments.
  • The adjustment of the fuel load directly affects the heat output and pollutant emissions of the burner. When the fuel load decreased from 100% to 60%, the NOx emission concentration decreased by 28.7%. A reduction in fuel load decreases nitrogen oxide emissions, but it also triggers a combustion dilution effect, causing the temperature in the combustion chamber to decrease and resulting in a decrease in combustion efficiency.

Supplementary Materials

The following supporting information can be downloaded at: https://www.mdpi.com/article/10.3390/fluids10090245/s1, Figure S1: Schematic drawing of symmetrical boundary; Figure S2: Temperature on the axial direction centerline; Figure S3: The result of meshing the nozzle area; Table S1: Burner nozzle size parameters.

Author Contributions

Conceptualization, J.L.; methodology, L.J.; software, Z.L.; validation, J.L.; formal analysis, Z.L.; investigation, L.J.; resources, L.J.; data curation, Z.L.; writing—original draft preparation, J.L.; writing—review and editing, J.L.; visualization, Z.L.; supervision, Y.D.; project administration, Y.D.; funding acquisition, Y.D. All authors have read and agreed to the published version of the manuscript.

Funding

This research was funded by the Natural Science Foundation of Shanxi Province, grant number 202303021212057 and the Fundamental Research Program of Shanxi Province, grant number 202303021212043.

Data Availability Statement

The original contributions presented in this study are included in the article. Further inquiries can be directed to the corresponding author.

Conflicts of Interest

The authors declare no conflicts of interest.

References

  1. Xu, J.; Wang, J.; Li, R.; Gu, M. Is Green Finance Fostering High-Quality Energy Development in China? A Spatial Spillover Perspective. Energy Strategy Rev. 2023, 50, 101201. [Google Scholar] [CrossRef]
  2. Hu, Y.; Man, Y. Energy Consumption and Carbon Emissions Forecasting for Industrial Processes: Status, Challenges and Perspectives. Renew. Sustain. Energy Rev. 2023, 182, 113405. [Google Scholar] [CrossRef]
  3. Zhu, H.; Cao, S.; Su, Z.; Zhuang, Y. China’s Future Energy Vision: Multi-Scenario Simulation Based on Energy Consumption Structure under Dual Carbon Targets. Energy 2024, 301, 131751. [Google Scholar] [CrossRef]
  4. Cheng, Z.; Li, L.; Liu, J.; Zhang, H. Research on Energy Directed Technical Change in China’s Industry and Its Optimization of Energy Consumption Pattern. J. Environ. Manag. 2019, 250, 109471. [Google Scholar] [CrossRef] [PubMed]
  5. Yanto, D.T.P.; Akhmadeev, R.; Hamad, H.S.; Alawadi, A.H.R.; Abdullayev, A.B.; Romero-Parra, R.M.; Fooladi, H. Development and Investigation of a Pollutants Emission Reduction Process from a Coal-Gasification Power Plant Integrated with Fuel Cell and Solar Energy. Int. J. Low-Carbon Technol. 2023, 18, 1120–1133. [Google Scholar] [CrossRef]
  6. Yan, X.; Ying, Y.; Li, K.; Zhang, Q.; Wang, K. A Review of Mitigation Technologies and Management Strategies for Greenhouse Gas and Air Pollutant Emissions in Livestock Production. J. Environ. Manag. 2024, 352, 120028. [Google Scholar] [CrossRef]
  7. Mason, J.A.; Oktawiec, J.; Taylor, M.K.; Hudson, M.R.; Rodriguez, J.; Bachman, J.E.; Gonzalez, M.I.; Cervellino, A.; Guagliardi, A.; Brown, C.M. Methane Storage in Flexible Metal–Organic Frameworks with Intrinsic Thermal Management. Nature 2015, 527, 357–361. [Google Scholar] [CrossRef] [PubMed]
  8. Feng, X.; Jiang, L.; Li, D.; Tian, S.; Zhu, X.; Wang, H.; He, C.; Li, K. Progress and Key Challenges in Catalytic Combustion of Lean Methane. J. Energy Chem. 2022, 75, 173–215. [Google Scholar] [CrossRef]
  9. Algayyim, S.J.M.; Saleh, K.; Wandel, A.P.; Fattah, I.M.R.; Yusaf, T.; Alrazen, H.A. Influence of Natural Gas and Hydrogen Properties on Internal Combustion Engine Performance, Combustion, and Emissions: A Review. Fuel 2024, 362, 130844. [Google Scholar] [CrossRef]
  10. Santos, A.A.; Torres, E.A.; Pereira, P.A. Critical Evaluation of the Oxygen-Enhanced Combustion in Gas Burners for Industrial Applications and Heating Systems. J. Braz. Chem. Soc. 2011, 22, 1841–1849. [Google Scholar] [CrossRef]
  11. Karyeyen, S.; Ilbas, M. Experimental and Numerical Analysis of Turbulent Premixed Combustion of Low Calorific Value Coal Gases in a Generated Premixed Burner. Fuel 2018, 220, 586–598. [Google Scholar] [CrossRef]
  12. Dudkiewicz, E.; Fidorów-Kaprawy, N.; Szałański, P. Environmental Benefits and Energy Savings from Gas Radiant Heaters’ Flue-Gas Heat Recovery. Sustainability 2022, 14, 8013. [Google Scholar] [CrossRef]
  13. Kurata, O.; Iki, N.; Inoue, T.; Matsunuma, T.; Tsujimura, T.; Furutani, H.; Kawano, M.; Arai, K.; Okafor, E.C.; Hayakawa, A. Development of a Wide Range-Operable, Rich-Lean Low-NOx Combustor for NH3 Fuel Gas-Turbine Power Generation. Proc. Combust. Inst. 2019, 37, 4587–4595. [Google Scholar] [CrossRef]
  14. Jia, K.; Liu, C.; Li, S.; Jiang, D. Modeling and Optimization of a Hybrid Renewable Energy System Integrated with Gas Turbine and Energy Storage. Energy Convers. Manag. 2023, 279, 116763. [Google Scholar] [CrossRef]
  15. Berger, L.; Attili, A.; Pitsch, H. Synergistic Interactions of Thermodiffusive Instabilities and Turbulence in Lean Hydrogen Flames. Combust. Flame 2022, 244, 112254. [Google Scholar] [CrossRef]
  16. GB 13271-2014; Emission Standard of Air Pollutants for Boiler. China Environmental Science Press: Beijing, China, 2014.
  17. Wang, J.; Wang, R.; Zhu, Y.; Li, J. Life Cycle Assessment and Environmental Cost Accounting of Coal-Fired Power Generation in China. Energy Policy 2018, 115, 374–384. [Google Scholar] [CrossRef]
  18. Swaminathan, S.; Spijker, C.; Raonic, Z.; Koller, M.; Kofler, I.; Raupenstrauch, H. Numerical Study of an Industrial Burner to Optimise NOx Emissions and to Evaluate the Feasibility of Hydrogen-Enriched Fuel. Int. J. Hydrogen Energy 2024, 49, 1210–1220. [Google Scholar] [CrossRef]
  19. Sekar, M.; Alahmadi, T.A.; Nithya, S. Numerical Simulation of Industrial Gas Burners Fueled with Hydrogen-Methane Mixtures for Enhanced Combustion Efficiency and Reduced Greenhouse Gas Emissions. Fuel 2024, 370, 131807. [Google Scholar] [CrossRef]
  20. Liu, T.; Wang, Y.; Zou, L.; Bai, Y.; Shen, T.; Wei, Y.; Li, F.; Zhao, Q. Numerical Investigation of Stable Combustion at Ultra-Low Load for a 350 MW Wall Tangentially Fired Pulverized-Coal Boiler: Effect of Burner Adjustments and Methane Co-Firing. Appl. Therm. Eng. 2024, 246, 122980. [Google Scholar] [CrossRef]
  21. Li, Y.; Li, H.; Guo, H.; Li, Y.; Yao, M. A Numerical Investigation on Methane Combustion and Emissions from a Natural Gas-Diesel Dual Fuel Engine Using CFD Model. Appl. Energy 2017, 205, 153–162. [Google Scholar] [CrossRef]
  22. Deng, J.; Wang, X.; Wei, Z.; Wang, L.; Wang, C.; Chen, Z. A Review of NOx and SOx Emission Reduction Technologies for Marine Diesel Engines and the Potential Evaluation of Liquefied Natural Gas Fuelled Vessels. Sci. Total Environ. 2021, 766, 144319. [Google Scholar] [CrossRef] [PubMed]
  23. Brändle, G.; Schönfisch, M.; Schulte, S. Estimating Long-Term Global Supply Costs for Low-Carbon Hydrogen. Appl. Energy 2021, 302, 117481. [Google Scholar] [CrossRef]
  24. Fan, H.; Ma, Y.; Zhang, H.; Zhou, D.; Jia, C.; Yang, H.; Zhang, S.; Luo, Z. Effect of Burner Structural Parameters on Combustion Characteristics and NOx Emission of Natural Gas. Fuel 2024, 372, 132155. [Google Scholar] [CrossRef]
  25. Lee, H.; Seo, D.M.; Jung, W.-N. Experimental Investigation of NOx Emission Reduction and Efficiency Improvement in a Reheating Furnace Using Multiple Fuel-Flow-Pulsed Burners. Fuel 2025, 394, 135131. [Google Scholar] [CrossRef]
  26. Huang, H.; Xue, X.; Liu, Y.; Zhao, J.; Tian, M.; Niu, Y. Numerical Studies of a Water-Cooled Premixed Burner for Low NOx Combustion of Natural Gas. J. Energy Inst. 2024, 114, 101647. [Google Scholar] [CrossRef]
  27. Pandey, B.; Ghimire, R.; Sapkota, N.; Dev, A. Numerical Investigation of Compatibility of Synthetic Natural Gas with Conventional Liquefied Petroleum Gas Burners. J. Phys. Conf. Ser. 2023, 2629, 012031. [Google Scholar] [CrossRef]
  28. Sarani, I.; Payan, S.; Payan, A.; Nada, S. Enhancement of Energy Storage Capability in RT82 Phase Change Material Using Strips Fins and Metal-Oxide Based Nanoparticles. J. Energy Storage 2020, 32, 102009. [Google Scholar] [CrossRef]
  29. Aydogdu, M. Analysis of the Effect of Rigid Vegetation Patches on the Hydraulics of an Open Channel Flow with Realizable K-ε and Reynolds Stress Turbulence Models. Flow Meas. Instrum. 2023, 94, 102477. [Google Scholar] [CrossRef]
  30. Deng, B.; Ge, D.; Lu, L.; Ge, D.; Li, J.; Guo, Y.; Kim, C.N. Use of P-1 Model with the Additional Source Term for Numerical Simulation of Ultraviolet Radiation in a Photoreactor. Korean J. Chem. Eng. 2014, 31, 956–960. [Google Scholar] [CrossRef]
  31. Winter, F.; Wartha, C.; Löffler, G.; Hofbauer, H. The NO and N2O formation mechanism during devolatilization and char combustion under fluidized-bed conditions. Symp. (Int.) Combust. 1996, 26, 3325–3334. [Google Scholar] [CrossRef]
  32. Abdullah, M.; Guiberti, T.F.; Alsulami, R.A. Experimental Assessment on the Coupling Effect of Mixing Length and Methane-Ammonia Blends on Flame Stability and Emissions. Energies 2023, 16, 2955. [Google Scholar] [CrossRef]
  33. Jo, S.; Cho, D. Effects of a Baffle and H2 Injection on Methane Combustion in a Turbulent Fluidized Bed. Fuel 2022, 307, 121883. [Google Scholar] [CrossRef]
  34. Guo, S.; Lei, Y.; Wang, X.; Qiu, T.; Pang, B.; Shi, L.; An, X. Experimental Research of High-Pressure Methane Pulse Jet and Premixed Ignition Combustion Performance of a Direct Injection Injector. Processes 2021, 9, 1977. [Google Scholar] [CrossRef]
  35. Tang, X.; Pu, W.; Wang, D.; Qu, S.; Rui, Y.; Zhao, X.; Liu, R. Experimental Study on Non-Isothermal Oxidative Characteristics and Kinetics of Methane in Accelerating Rate Calorimetry Tests. Fuel 2023, 332, 126035. [Google Scholar] [CrossRef]
  36. Cui, J.; Yu, R.; Wang, H.; Wang, Y.; Tong, J. A Comparative Study of Methanol and Methane Combustion in a Gas Turbine Combustor. Energies 2025, 18, 1765. [Google Scholar] [CrossRef]
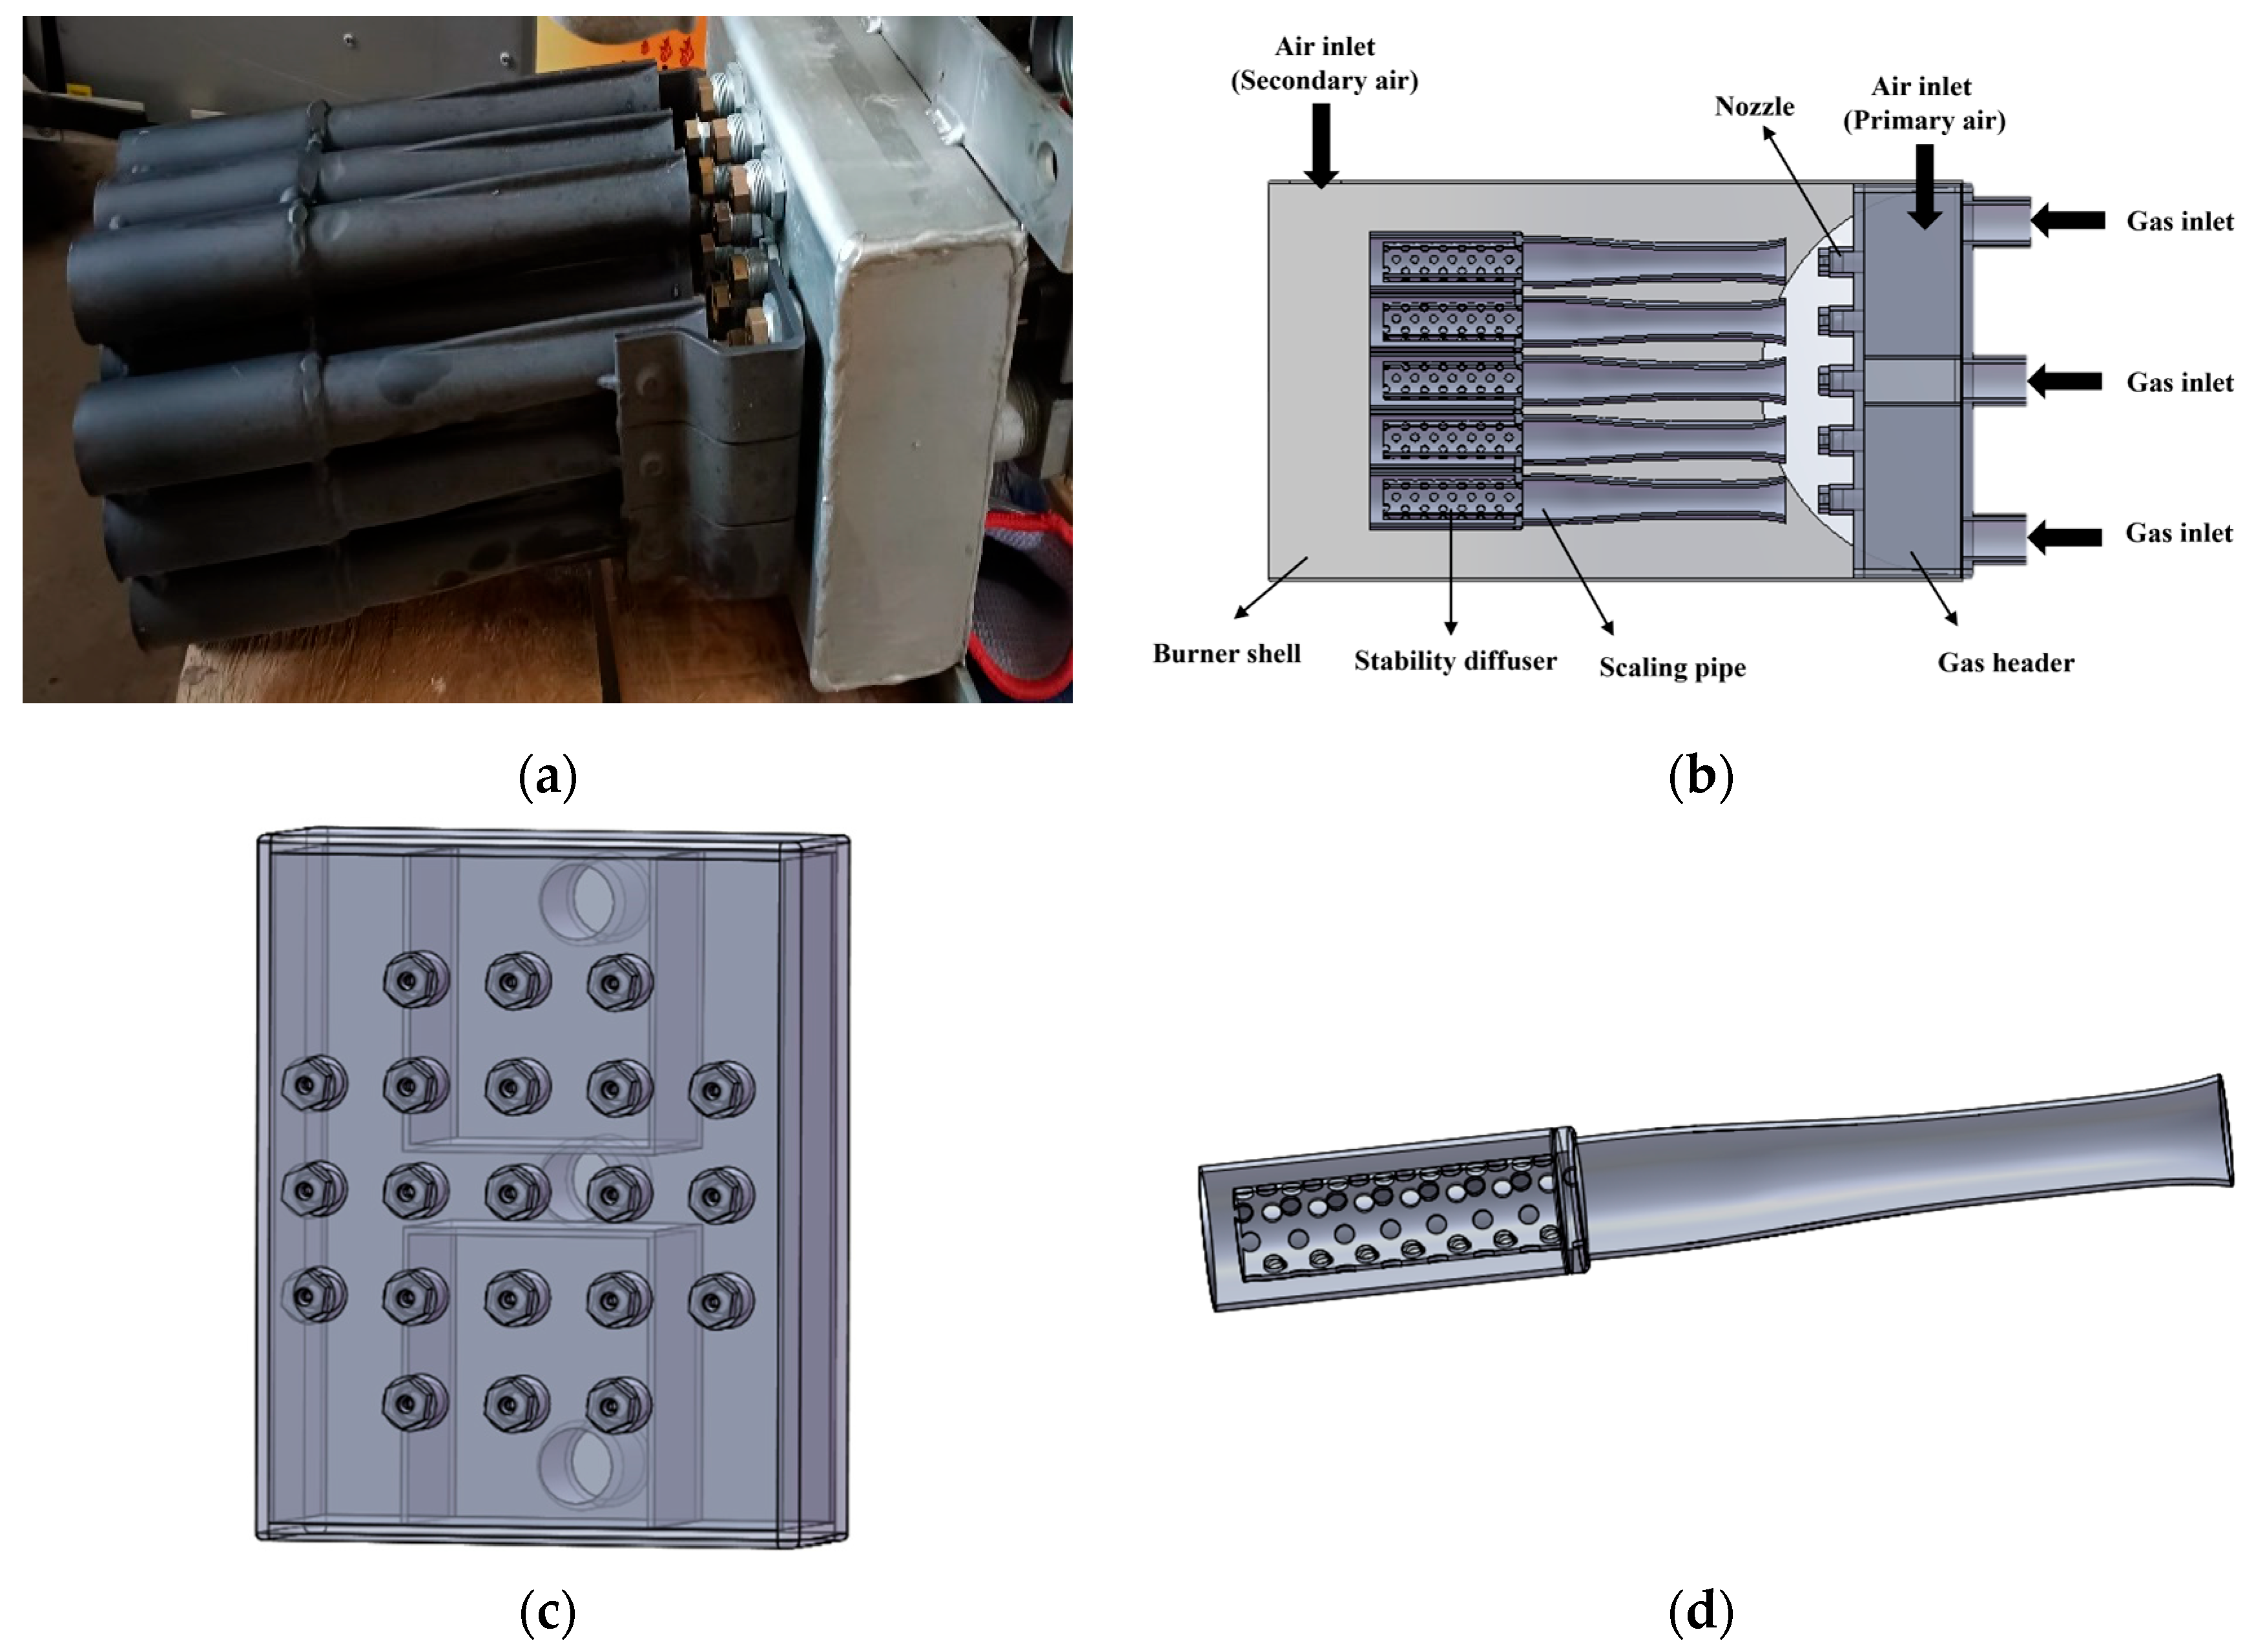
Figure 1. (a) The image of burner internal structure; (b) 3D structural model of the burner; (c) The arrangement of the natural gas manifold and nozzle system; (d) 3D structural model of the scaling tube and the internal stable diffuser.
Fluids 10 00245 g001
Figure 2. (a) Cross-section of the gas burner, (b) Symmetric model computational area.
Fluids 10 00245 g002
Figure 3. Schematic diagram of the computational grid for the burner area.
Fluids 10 00245 g003
Figure 4. The schematic diagram of gas inlet and outlet.
Fluids 10 00245 g004
Figure 5. Combustion experiment system. 1. Air cylinder; 2. Pressure Gauge; 3. Pressure Regulator; 4. Pressure Gauge; 5. Burner; 6. Pressure Gauge 7. Pressure Regulator; 8. Pressure Gauge; 9. Air cylinder; 10. Pressure Gauge; 11. Pressure Regulator; 12. CH4 cylinder; 13. pipeline; 14. Flue Gas Analyzer.
Fluids 10 00245 g005
Figure 6. The central cross-sectional distribution of the burner axis direction under different excess air ratios: (a) Temperature; (b) CH4 mass fraction; (c) CO mass fraction; (d) NO mass fraction.
Fluids 10 00245 g006
Figure 7. The central cross-sectional distribution of the burner axis direction under different air temperatures: (a) Temperature; (b) CH4 mass fraction; (c) CO mass fraction; (d) NO mass fraction.
Fluids 10 00245 g007
Figure 8. The central cross-sectional distribution of the burner axis direction under different fuel loads: (a) Temperature; (b) CH4 mass fraction; (c) CO mass fraction; (d) NO mass fraction.
Fluids 10 00245 g008
Table 1. Technical parameters of the burner.
ItemParameter
Rated power (kW)300
Rated gas flow (m3/h)28.59
Supply pressure (kPa)3–5
Fan power (kW)3.0
Input current (A)5
Exhaust pipe formDual-channel parallel
StructureMulti-nozzle subdivided flame integrated machine
Table 2. The calculation times of the four types of grids.
Grid TypeNumber of GridsCalculation Time of 4000 Steps (h)
grid 1800,0003.5
grid 21,000,0004.0
grid 31,200,0005.0
grid 41,500,0008.0
Table 3. Comparison of measurement results and simulation results.
ItemPipeline Outlet Flue Gas Temperature (K)Pipeline Outlet NOx Emission Concentration (mg/m3)
Measurement result373.09.8
Simulation result364.39.4
Relative error (%)2.44.1
Table 4. Operational parameters under simulated conditions.
Excess Air RatioPrimary Air Flow Rate (kg/s)Secondary Air Flow Rate (kg/s)
1.40.1110.025
1.70.1350.031
2.00.1590.036
Table 5. Simulation results of the pipe outlet parameters under different excess air ratios.
Excess Air RatioFlue Gas Temperature (K)NOx Emission Concentration (mg/m3)
1.4368.116.2
1.7364.39.4
2.0362.77.6
Table 6. Simulation results of the pipe outlet parameters under different air temperatures.
Environment Temperature (K)Flue Gas Temperature
(K)
NOx Emission Concentration
(mg/m3)
243360.76.2
268363.07.6
300364.39.4
Table 7. Simulated working condition parameters.
Fuel LoadFuel Flow Rate
(kg/s)
Primary Air Flow Rate
(kg/s)
Secondary Air Flow Rate
(kg/s)
60%0.001140.0820.018
80%0.001520.1060.024
100%0.00190.1350.031
Table 8. Simulation results of the pipe outlet parameters under different fuel loads.
Fuel LoadFlue Gas Temperature (K)NOx Emission Concentration (mg/m3)
60%359.96.7
80%361.77.8
100%364.39.4
Disclaimer/Publisher’s Note: The statements, opinions and data contained in all publications are solely those of the individual author(s) and contributor(s) and not of MDPI and/or the editor(s). MDPI and/or the editor(s) disclaim responsibility for any injury to people or property resulting from any ideas, methods, instructions or products referred to in the content.