Abstract
Nitrogen compression requires centrifugal compressors to operate under relatively high ambient pressure. However, the internal instability characteristics of compressors handling high-density working fluids remain unclear. Therefore, this study employs Dynamic Mode Decomposition (DMD) to investigate unsteady flow fluctuations within an isolated centrifugal impeller under both best efficiency and near-stall conditions at high ambient pressure. Results show that as the throttling process progresses, distinct unsteady phenomena emerge within the impeller. Under near-stall conditions, the frequency of the instability is 0.44 times the blade passage frequency (BPF), manifesting as periodic pressure fluctuations throughout the entire blade passage. This instability originates from periodic passage blockages caused by fluctuations in tip leakage flow. Additionally, the pressure fluctuations at the impeller inlet exhibit a noticeable lag compared to those in the latter half of the passage. Through DMD analysis, it is found that after the tip leakage vortex exits the blade, it interacts with the pressure surface of the adjacent blade, affecting the tip loading of the neighboring blade and forming a dynamic cycle. However, this vortex is not the primary flow structure responsible for the instability. These insights into the nature of unsteady disturbances provide valuable implications for future stall warning and instability prediction technologies.
1. Introduction
Compressed nitrogen is widely used in many industrial fields, such as energy storage, chemical processes and inert protection. As the core component in the nitrogen transport and storage system, the centrifugal compressor plays a key role in regulating the pressure and flow of nitrogen. Influenced by the diversification of application scenarios, this type of compressor often operates over a wide range of conditions; moreover, to meet varying demands, it must function under different environmental pressures, resulting in significant differences in density and pressure, which undoubtedly exacerbates the trade-off between efficiency and stability in the compressor. However, the instability phenomena under these operating conditions have become a critical bottleneck constraining performance.
As the compressor flow rate is continuously reduced, instability phenomena are observed, including surge and rotating stall [1]. The former is regarded as a one-dimensional oscillation at the system level, while the latter is characterized by pronounced circumferential non-uniformity. Based on the form of precursor waves, rotating stall is classified into modal-type and spike-type rotating stall. The occurrence location, mechanism, and intensity of these instability phenomena are influenced by structural differences in centrifugal compressors, such as the impeller leading edge [2,3], vaneless diffuser [4], and vaned diffuser [5]. To better understand these instabilities, the unsteady characteristics prior to stall have been extensively investigated in numerous studies. At this stage, the compressor is still operated stably but is found to exhibit significant unsteady phenomena under an adverse pressure gradient. Nevertheless, existing research has primarily been focused on the deep stall phase, while the internal mechanisms under pre-stall conditions remain to be explored in depth.
In axial compressors, the instability phenomena prior to stall are primarily manifested as dynamic oscillations in the tip region and have been extensively investigated. These instabilities are typically observed at half the blade passage frequency, often occurring under conditions with large tip clearances [6]. The underlying mechanisms are attributed to vortex breakdown [7], interactions between tip leakage flow and adjacent passages [8], and boundary layer instabilities [9]. However, in centrifugal compressors, due to radial flow and structural differences, the unsteady phenomena preceding rotating stall manifest differently. Specifically, some instabilities are primarily observed at the diffuser inlet. For instance, investigations by Everitt et al. [10] into the flow within the diffuser of a centrifugal compressor revealed that separation at the diffuser blade leading edge generates low-energy fluid. This fluid, under the influence of an adverse pressure gradient, undergoes reverse flow, thereby increasing inlet blockage and triggering instability phenomena. Similarly, unsteady flow was observed by Bousquet et al. [11] at the diffuser inlet of a centrifugal compressor. This instability propagates to the impeller inlet by affecting the impeller outlet pressure, resulting in circumferential distortion and ultimately inducing compressor stall. In contrast, Toyama’s research [12] indicated that non-uniformity in the outlet flow field caused by disturbances at the impeller inlet can inversely induce instability at the diffuser inlet. These findings highlight the critical role of diffuser inlet instability in the overall destabilization process. However, the instability mechanisms within the impeller passage require further exploration.
In addition to the diffuser inlet, several studies have been conducted to analyze instability phenomena within the impeller passage, which are typically associated with tip leakage flow, leading-edge separation, and high incidence angles. For instance, the characteristics of tip leakage vortices under near-stall conditions were investigated by Hong et al. in a centrifugal compressor used in a micro-turbine power generation system. The effects of flow passage contraction, passage vortex compression, and leakage flow translation on tip leakage vortices were analyzed [13]. Through experimental measurements of pressure fluctuations at different wall surfaces, Xue et al. found that relatively high-frequency fluctuations caused by the shedding of tip leakage vortices were the primary source of unsteadiness within the passage [14]. Furthermore, in a study of a supersonic centrifugal compressor, Iwakiri et al. observed that under near-stall conditions, the tip leakage vortex of the main blade underwent breakdown and interacted with the horseshoe vortex formed at the leading edge of the splitter blade, resulting in pronounced unsteady phenomena [15]. Additionally, self-excited instabilities induced by secondary flows have been explored in some studies. Li et al. investigated self-induced unsteady phenomena caused by secondary flows within the impeller passage of a centrifugal compressor. The results indicated that these phenomena, with frequencies ranging from 0.375 to 0.321 times the blade passage frequency (BPF), were primarily driven by instabilities at the interface between low-energy fluid caused by secondary flows and the jet flow within the blade passage [16]. Through full-annulus unsteady simulations of an isolated centrifugal impeller, Wang et al. found that during the throttling process, an unsteady phenomenon with a dominant frequency of approximately 0.657 BPF emerged at the tip position of 10% relative chord length. This phenomenon propagated in the same direction as the blade rotation at 48.2% of the blade speed and was attributed to the periodic interaction between the tip leakage flow of the splitter blade and the adjacent main blade [17]. Zhao et al. further revealed oscillations with a frequency of approximately 0.5 BPF, which were caused by a periodic dynamic cycle involving the leakage flow and blade loading [18]. Moreover, large-scale vortices formed by the backflow of the impeller passage outlet flow under an adverse pressure gradient also contribute to significant unsteadiness. Through experiments and simulations, Kowshik et al. investigated rotating instability phenomena in a shrouded centrifugal blower. The results showed that these instabilities were primarily located at the blade trailing edge and were caused by interactions between unsteady vortices and the impeller outlet flow [19]. Using large-eddy simulation (LES), Jyothishkumar et al. analyzed the flow within a centrifugal compressor and found that under near-surge conditions, vortex structures associated with low-pressure regions rotated in the same direction as the blades in the trailing edge region of the passage, while significant backflow was observed in the diffuser region [20].
When instability phenomena within the impeller passage affect adjacent passages and propagate across different blade passages, they evolve into rotating instability phenomena. These phenomena are typically characterized by a multi-hump structure at the blade passage frequency. For instance, rotating instability phenomena were observed by Grondin et al. [21] through experimental measurements in a high-speed centrifugal compressor. Numerical simulations identified tornado-like vortex structures, where tip leakage flow, under the influence of an adverse pressure gradient, spilled over at the leading edge, interacted with the vortex structures at the leading edge of adjacent blades, formed new vortices, and triggered rotating stall. Similarly, tornado-like vortex structures were identified by Tomita et al. on the suction surface of the impeller, exhibiting similarities with phenomena observed in axial compressors [22]. Simulations conducted by Zhang et al. on a high-speed centrifugal compressor revealed that, in flow regions significantly larger than stall conditions, pronounced unsteady phenomena, including weak backflow and leading-edge spillover, were observed in the tip region of the impeller inducer, while the compressor remained in a stable operating state [23]. Building on this, the effects of forward and aft loading designs on the stability of centrifugal compressors were compared by Yang et al. The results indicated that forward loading designs exacerbated the interaction between tip leakage flow and the main flow, thereby accelerating the onset of instability phenomena [24]. Furthermore, pre-stall disturbances in a centrifugal compressor under the influence of a volute were experimentally investigated by Zhang et al. The results showed that the pre-stall phase was dominated by rotating instability, with a dominant frequency of 43% of the blade passage frequency. Stall was induced by regional blockage caused by inlet recirculation vortices, closely related to the evolution of rotating instability [25]. Similarly to rotating instability caused by boundary layer instabilities, flow separation on the blade suction surface due to high incidence angles also generates unsteady phenomena, manifesting as Kelvin–Helmholtz instability. It was demonstrated by Boousquet et al. that low-momentum fluid resulting from leading-edge separation interacted with the main flow, periodically generating vortices under the influence of Kelvin–Helmholtz instability [11]. Comparable unsteady boundary layer fluctuations were also observed by Baltadjiev et al. in a study of a supercritical CO2 centrifugal compressor [26]. These mechanisms reveal the dynamic evolution of rotating instability during the pre-stall phase. However, due to structural differences, the manifestation of these phenomena varies significantly across different compressors.
It is evident that, due to structural differences, the manifestations of instability phenomena within centrifugal compressors exhibit significant variations, which have not yet been fully elucidated. These unsteady disturbances may be observed at the diffuser inlet, the trailing edge, or the leading edge of the blade passage. Such disturbances not only induce vibrations and noise in the compressor but may also trigger the onset of stall, thereby affecting overall stability and safety. Furthermore, most of the aforementioned studies were conducted with air as the working fluid under standard atmospheric pressure conditions. In contrast, for compressors using nitrogen as the working fluid, the density may differ from that of air under standard pressure by several to tens of times. This potential difference may further amplify the instability mechanisms. Therefore, further investigation into the instabilities within centrifugal compressors prior to rotating stall is expected to enhance the understanding of these phenomena. Such research will also provide a theoretical foundation for optimizing compressor design and developing early warning systems.
To enhance the understanding of these instability phenomena, the Dynamic Mode Decomposition (DMD) method is employed to capture the dynamic characteristics of the system. Recently, methods for extracting dynamic characteristics from a series of flow field snapshots, such as Proper Orthogonal Decomposition (POD) [27], Dynamic Mode Decomposition (DMD) [28], and Spectral Proper Orthogonal Decomposition (SPOD) [29], have been widely applied in the field of compressor research. Among these, the DMD method is particularly effective in capturing the dominant fluctuation frequencies and coherent structures in unstable flows. The DMD method was utilized by Yang [30] to analyze the flow field evolution from near-stall to stable stall conditions in the diffuser of a high-load centrifugal compressor. An improved DMD method was adopted by Xu [31] to investigate the dynamic characteristics of flow instability processes. Similarly, the relationship between noise and unstable flow characteristics in a radial compressor was analyzed by Broatch [32] using the DMD method. The application of the DMD method is found to significantly enhance the understanding of these instability phenomena.
The primary contribution of this study lies in the application of three-dimensional DMD to analyze the unsteady fluctuation characteristics within the impeller of a centrifugal compressor operating with nitrogen as the working fluid at an inlet density of 17 kg/m3 under near-stall conditions. The objective is to elucidate the mechanisms and evolution patterns of disturbances induced within the passage. The main research focuses of this paper are as follows: (1) The time-averaged and transient flow fields of the centrifugal impeller are studied, and the unsteady fluctuation characteristics inside the passage are clarified. (2) The induction mechanism of unsteady fluctuations is investigated, and the dominant contribution of tip leakage flow to unsteady fluctuations is clarified. (3) The evolution mechanism of tip leakage flow, induced vortex and the internal flow field induced by unsteady disturbances is examined. This paper is structured as follows: In the second part, the principles and applications of the numerical method and DMD method are introduced. In the third part, the accuracy of the numerical method is verified using experimental data. In the fourth part, FFT and DMD methods are combined to analyze and discuss the results obtained from numerical simulations. Finally, the key conclusions are presented in the fifth part.
2. Numerical Methodology
2.1. Computational Model
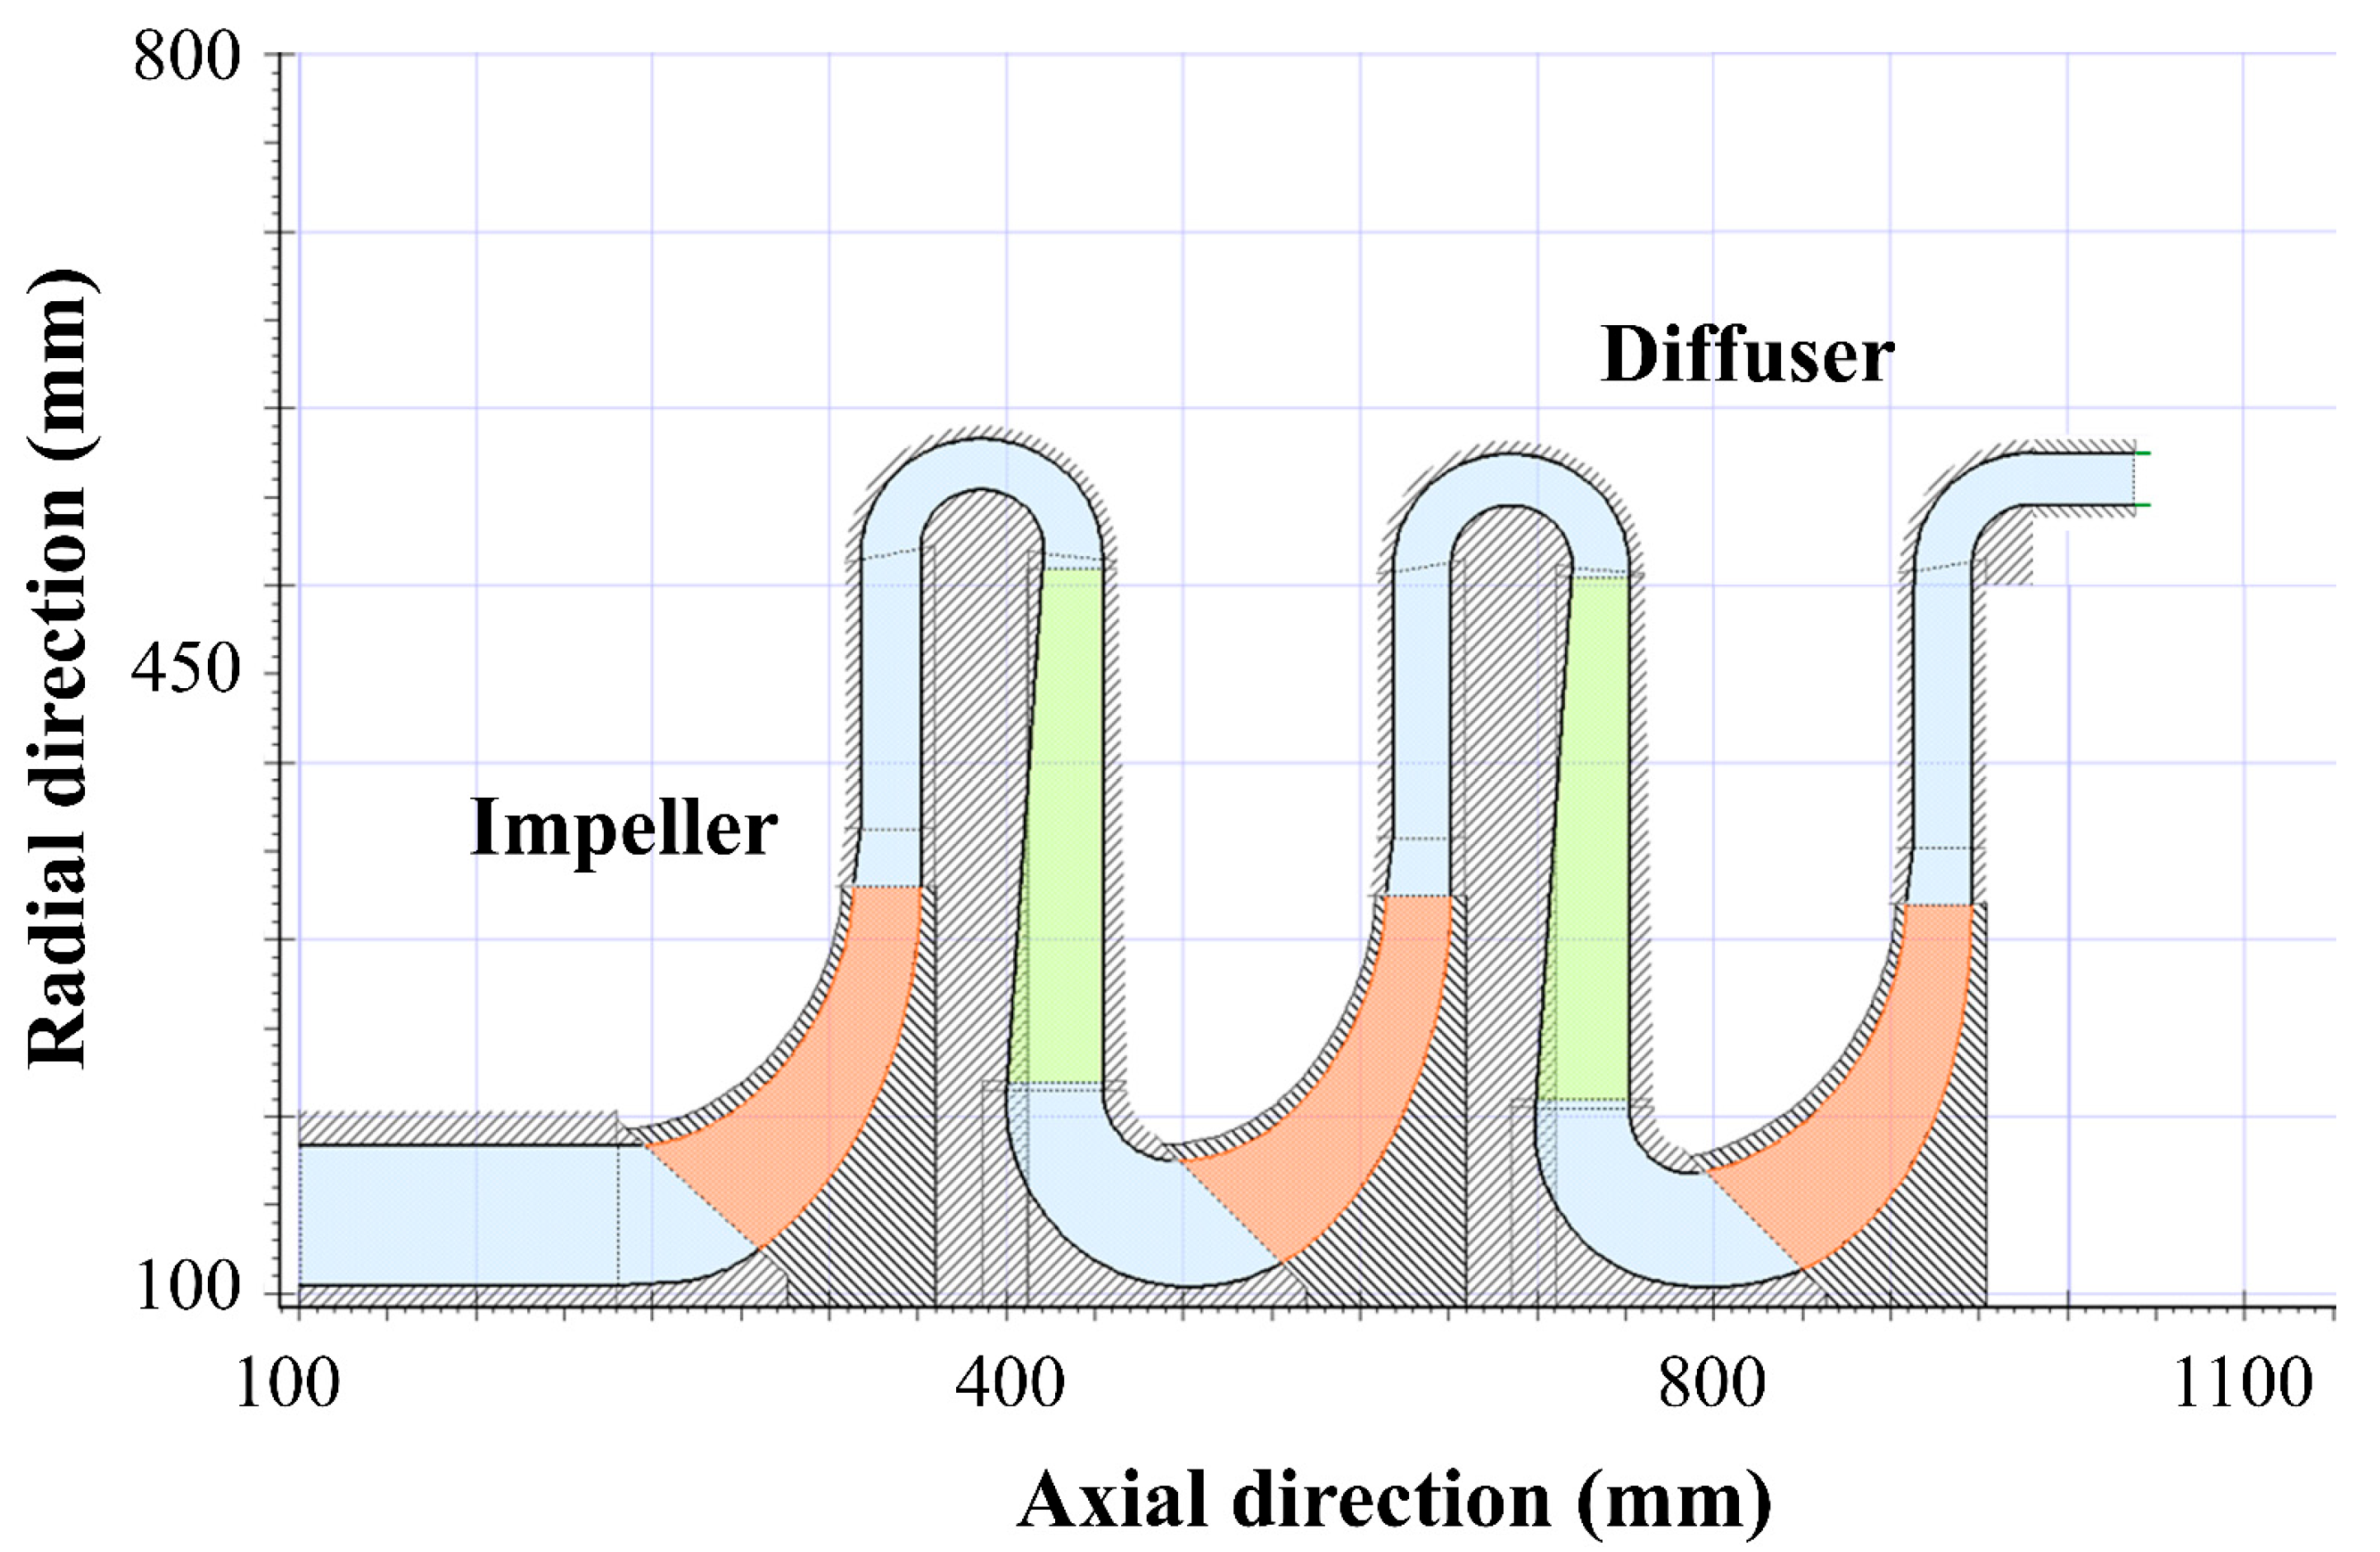
This study is conducted on a three-stage centrifugal compressor, which is used to pressurize the nitrogen gas. The structure schematic of the three-stage centrifugal compressor is shown in Figure 1, and several key parameters are listed in Table 1. Since the focus of this study is the origin of unstable flow inside the first-stage impeller, a steady-state simulation of the three-stage model is first performed to ensure the accuracy of the simulation. The actual throttling phenomenon of the compressor is simulated by adjusting the back pressure, and the radial distribution results at the interface are used as the boundary conditions for the single-impeller simulation. This method can accurately capture unsteady disturbances inside the impeller while minimizing computational costs. It has been applied in compressor studies by scholars [33].
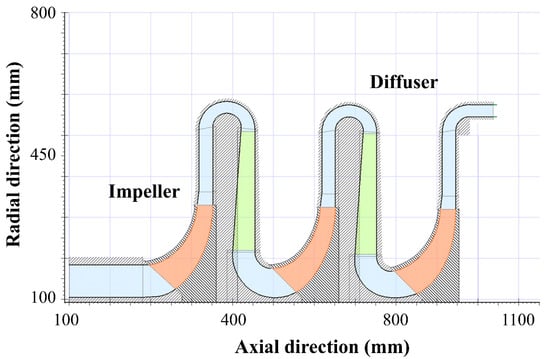
Figure 1.
Structure diagram of three-stage nitrogen centrifugal compressor.

Table 1.
Geometric parameters of the centrifugal compressor.
2.2. Modeling of Nitrogen as the Working Fluid
In this study, high-pressure nitrogen gas is selected as the working fluid. The specific parameters under the investigated conditions are summarized in Table 2. Compared to air (density ≈ 1.2 kg/m3 at standard temperature and pressure), the nitrogen in this case features an inlet pressure of 1511 kPa and a density of 17 kg/m3, resulting in an inlet Reynolds number (Re) approximately 1317% higher under the same velocity and characteristic length. This substantial difference promotes more pronounced turbulent characteristics, potentially amplifying pre-stall disturbances such as tip leakage vortices and passage flow evolution in the impeller passages.

Table 2.
Geometric parameters of the centrifugal compressor.
The ideal gas equation of state is employed to model the nitrogen, despite the elevated inlet pressure. With reduced pressure Pr = 0.44 (P/Pcr = 1511 kPa/3400 kPa) and reduced temperature Tr = 2.41 (T/Tcr = 303.25 K/126 K), the compressibility factor Z ≈ 0.995 (queried from thermodynamic tables), indicating that the gas properties deviate minimally from ideal behavior. This justifies the use of the ideal gas model in simulations.
2.3. Simulation Methods
The computational domain selected in this study is a single-passage with periodic boundaries. The pressure-based implicit solver provided by the commercial software ANSYS CFX 2021R1 is used to solve the three-dimensional viscous and compressible Reynolds-averaged Navier–Stokes equations. A single-passage simulation approach is employed in this study. Although the imposition of periodic boundary conditions may suppress low-frequency disturbances associated with circumferential propagation, this method was deemed appropriate, as the focus was placed on understanding the origins and dynamic processes of instabilities within the blade passage. The Shear Stress Transport (SST) turbulence model is commonly used in fluid machinery. Scholars’ research has demonstrated its advantages in predicting the interactions of complex vortices in the impeller channel. Therefore, the turbulence model selected in this paper is the SST k-ω turbulence model with automatic wall functions.
In the steady-state calculation, a second-order discretization scheme is employed, along with double-precision computation. To ensure the accuracy of the simulation, the inlet boundary conditions are set consistent with the experimental setup. The inlet is set as a total pressure boundary condition with a pressure of 1511 kPa, a temperature of 303.25 K, and a turbulence intensity of 5%. The outlet is specified as a fixed mass flow rate boundary. This configuration allows the pressure to vary circumferentially, which aligns with the physical phenomena under near-stall conditions. In the numerical model, the experimental outlet throttling is simulated by varying the mass flow rate through the domain. The impeller blade walls are designated as adiabatic no-slip boundary conditions, and the two sides of a single blade passage are modeled with periodic boundary conditions to represent full-annulus flow. Data transfer at the rotor-stator interface employs the mixing plane method. The convergence criteria require that the residuals of the continuity, energy, and momentum equations are less than 10−6, or that the fluctuations in inlet and outlet flow, pressure ratio, and efficiency are less than 0.1%. The near-stall point is determined by incrementally reducing the compressor outlet mass flow rate by 0.5% of the maximum flow rate in each step. This process continues until significant fluctuations in the simulated parameters are detected (maximum flow fluctuation exceeding 0.5% of the maximum flow rate, efficiency fluctuation of 0.005, or pressure ratio variation exceeding ±0.01) or until the computation diverges.
The first-stage impeller in a three-stage centrifugal compressor is selected to investigate the internal unsteady disturbances. CFX is also used to perform three-dimensional viscous, compressible time-marching simulations. A second-order discretization scheme is selected for both spatial and temporal domains. First, a steady-state simulation of the first-stage impeller is performed, and the results are used as the initial conditions for the transient calculation. The time step for the transient simulation is set to 2.5518 × 10⁻⁶ s, corresponding to 30 time steps per blade channel; additionally, 20 virtual time steps are set within each physical time step to achieve convergence. To ensure that the time step can capture the main flow structures in the impeller channel, the time step setting is verified. The specific details are presented in Section 3.2. The static pressure is set at the outlet boundary to control the mass flow rate and achieve the target operating point. Other settings are configured to be identical to those used in the steady-state calculation.
2.4. Mesh Generation
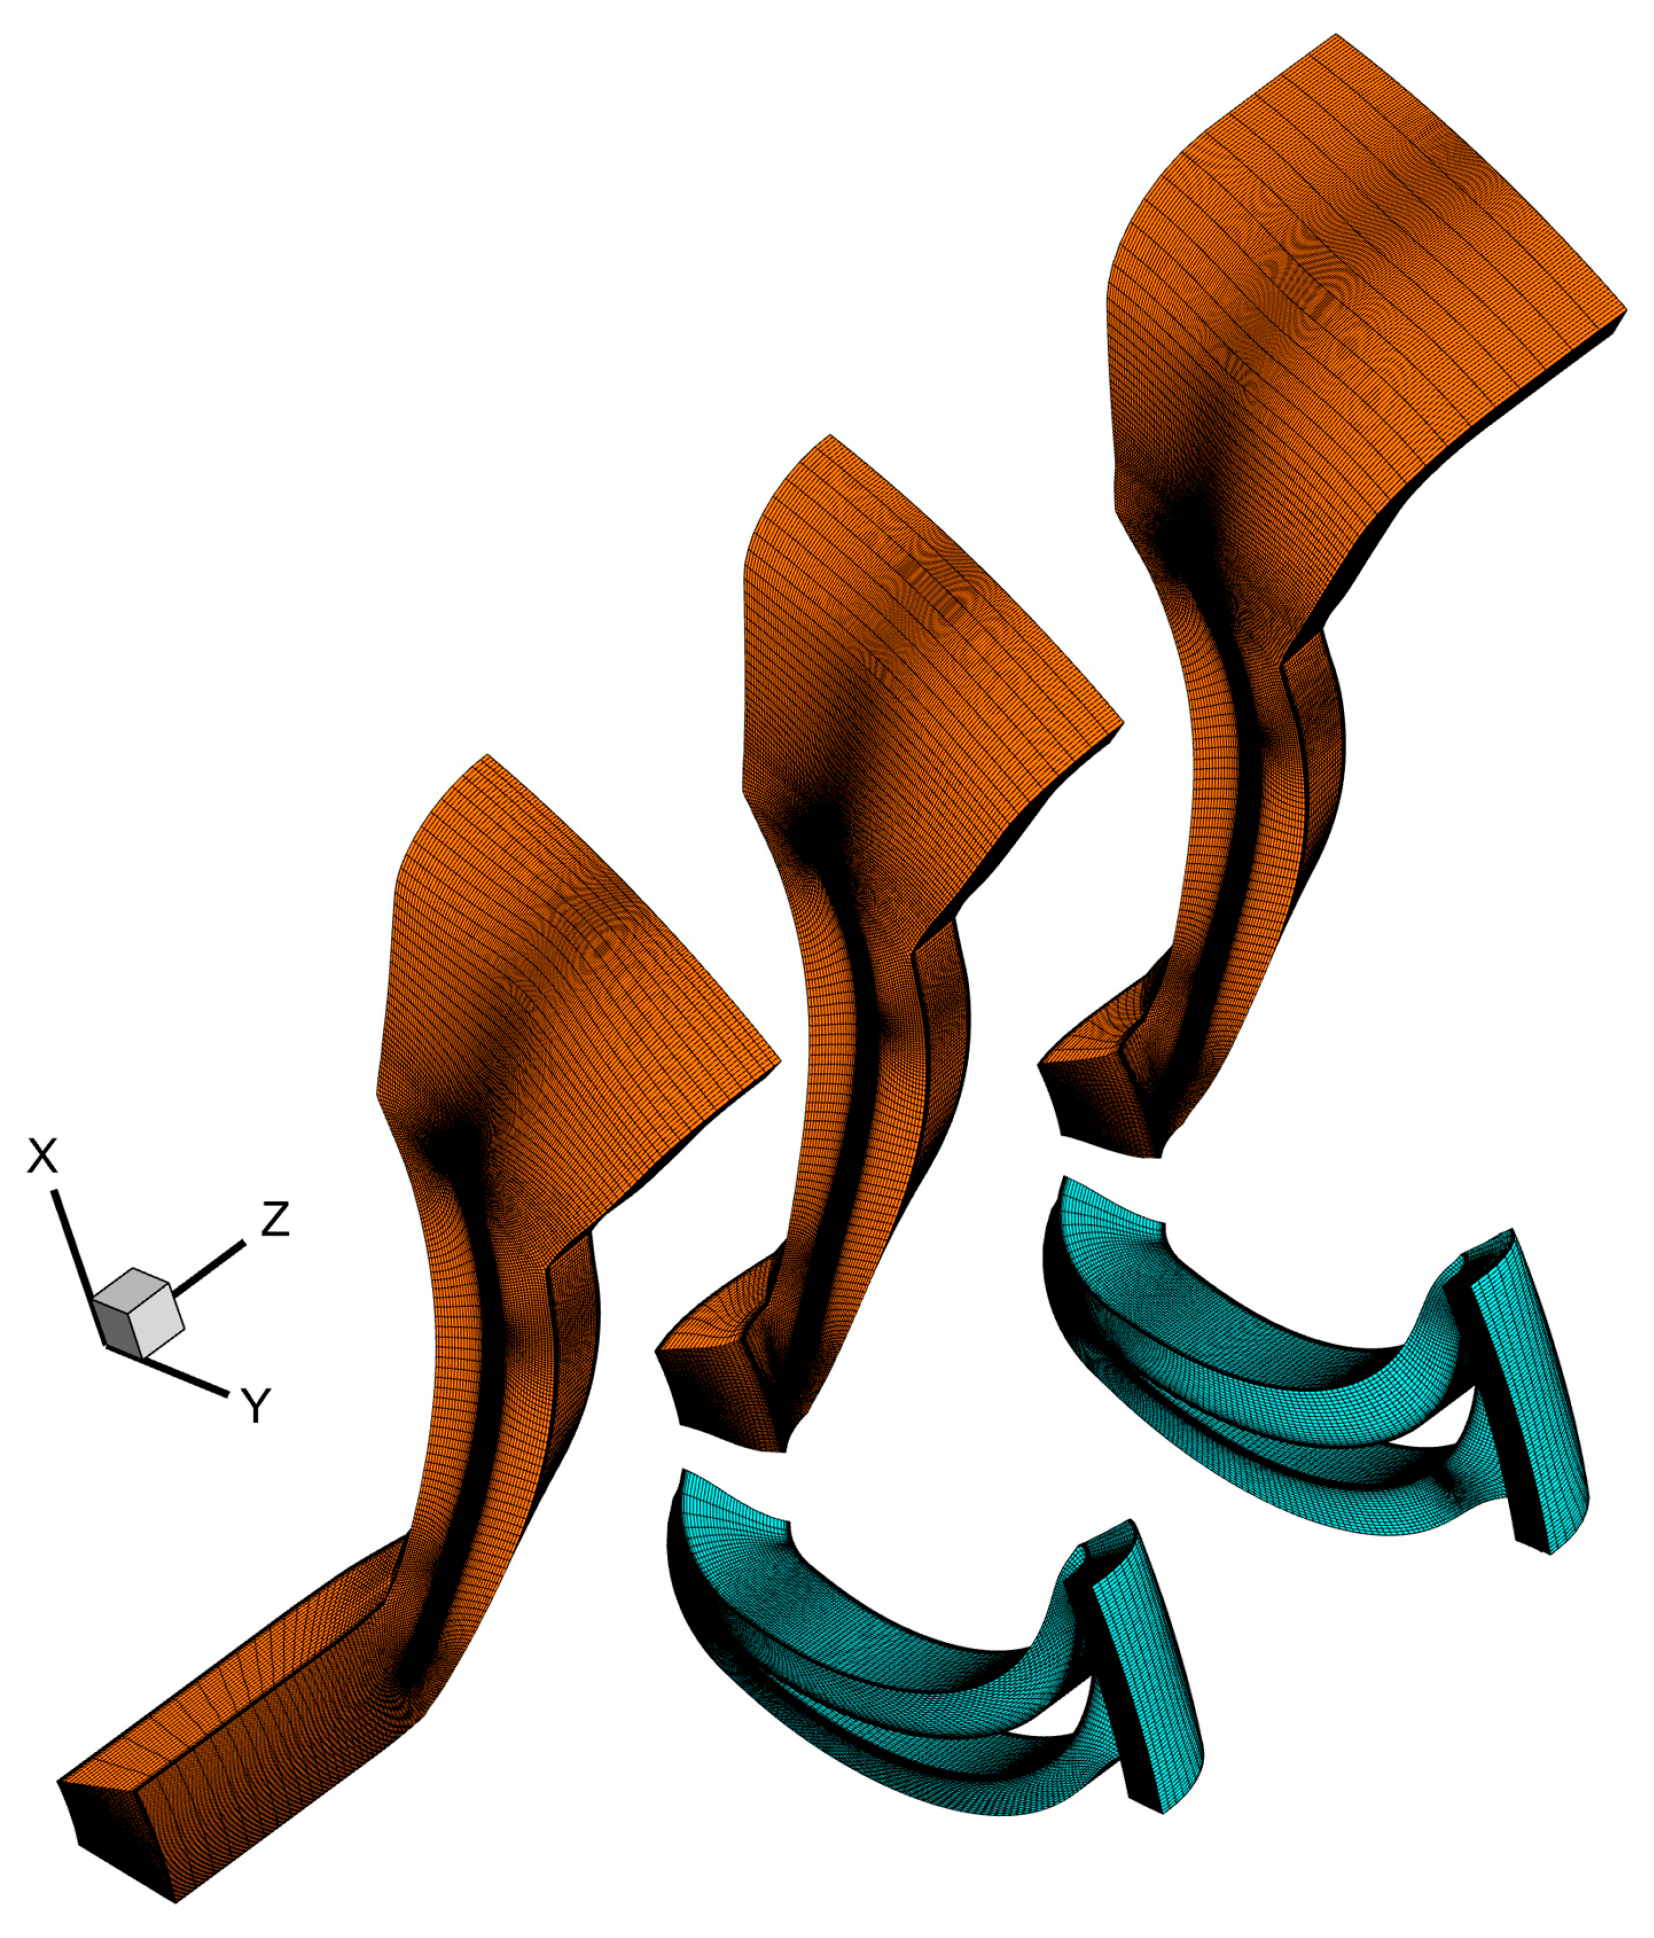
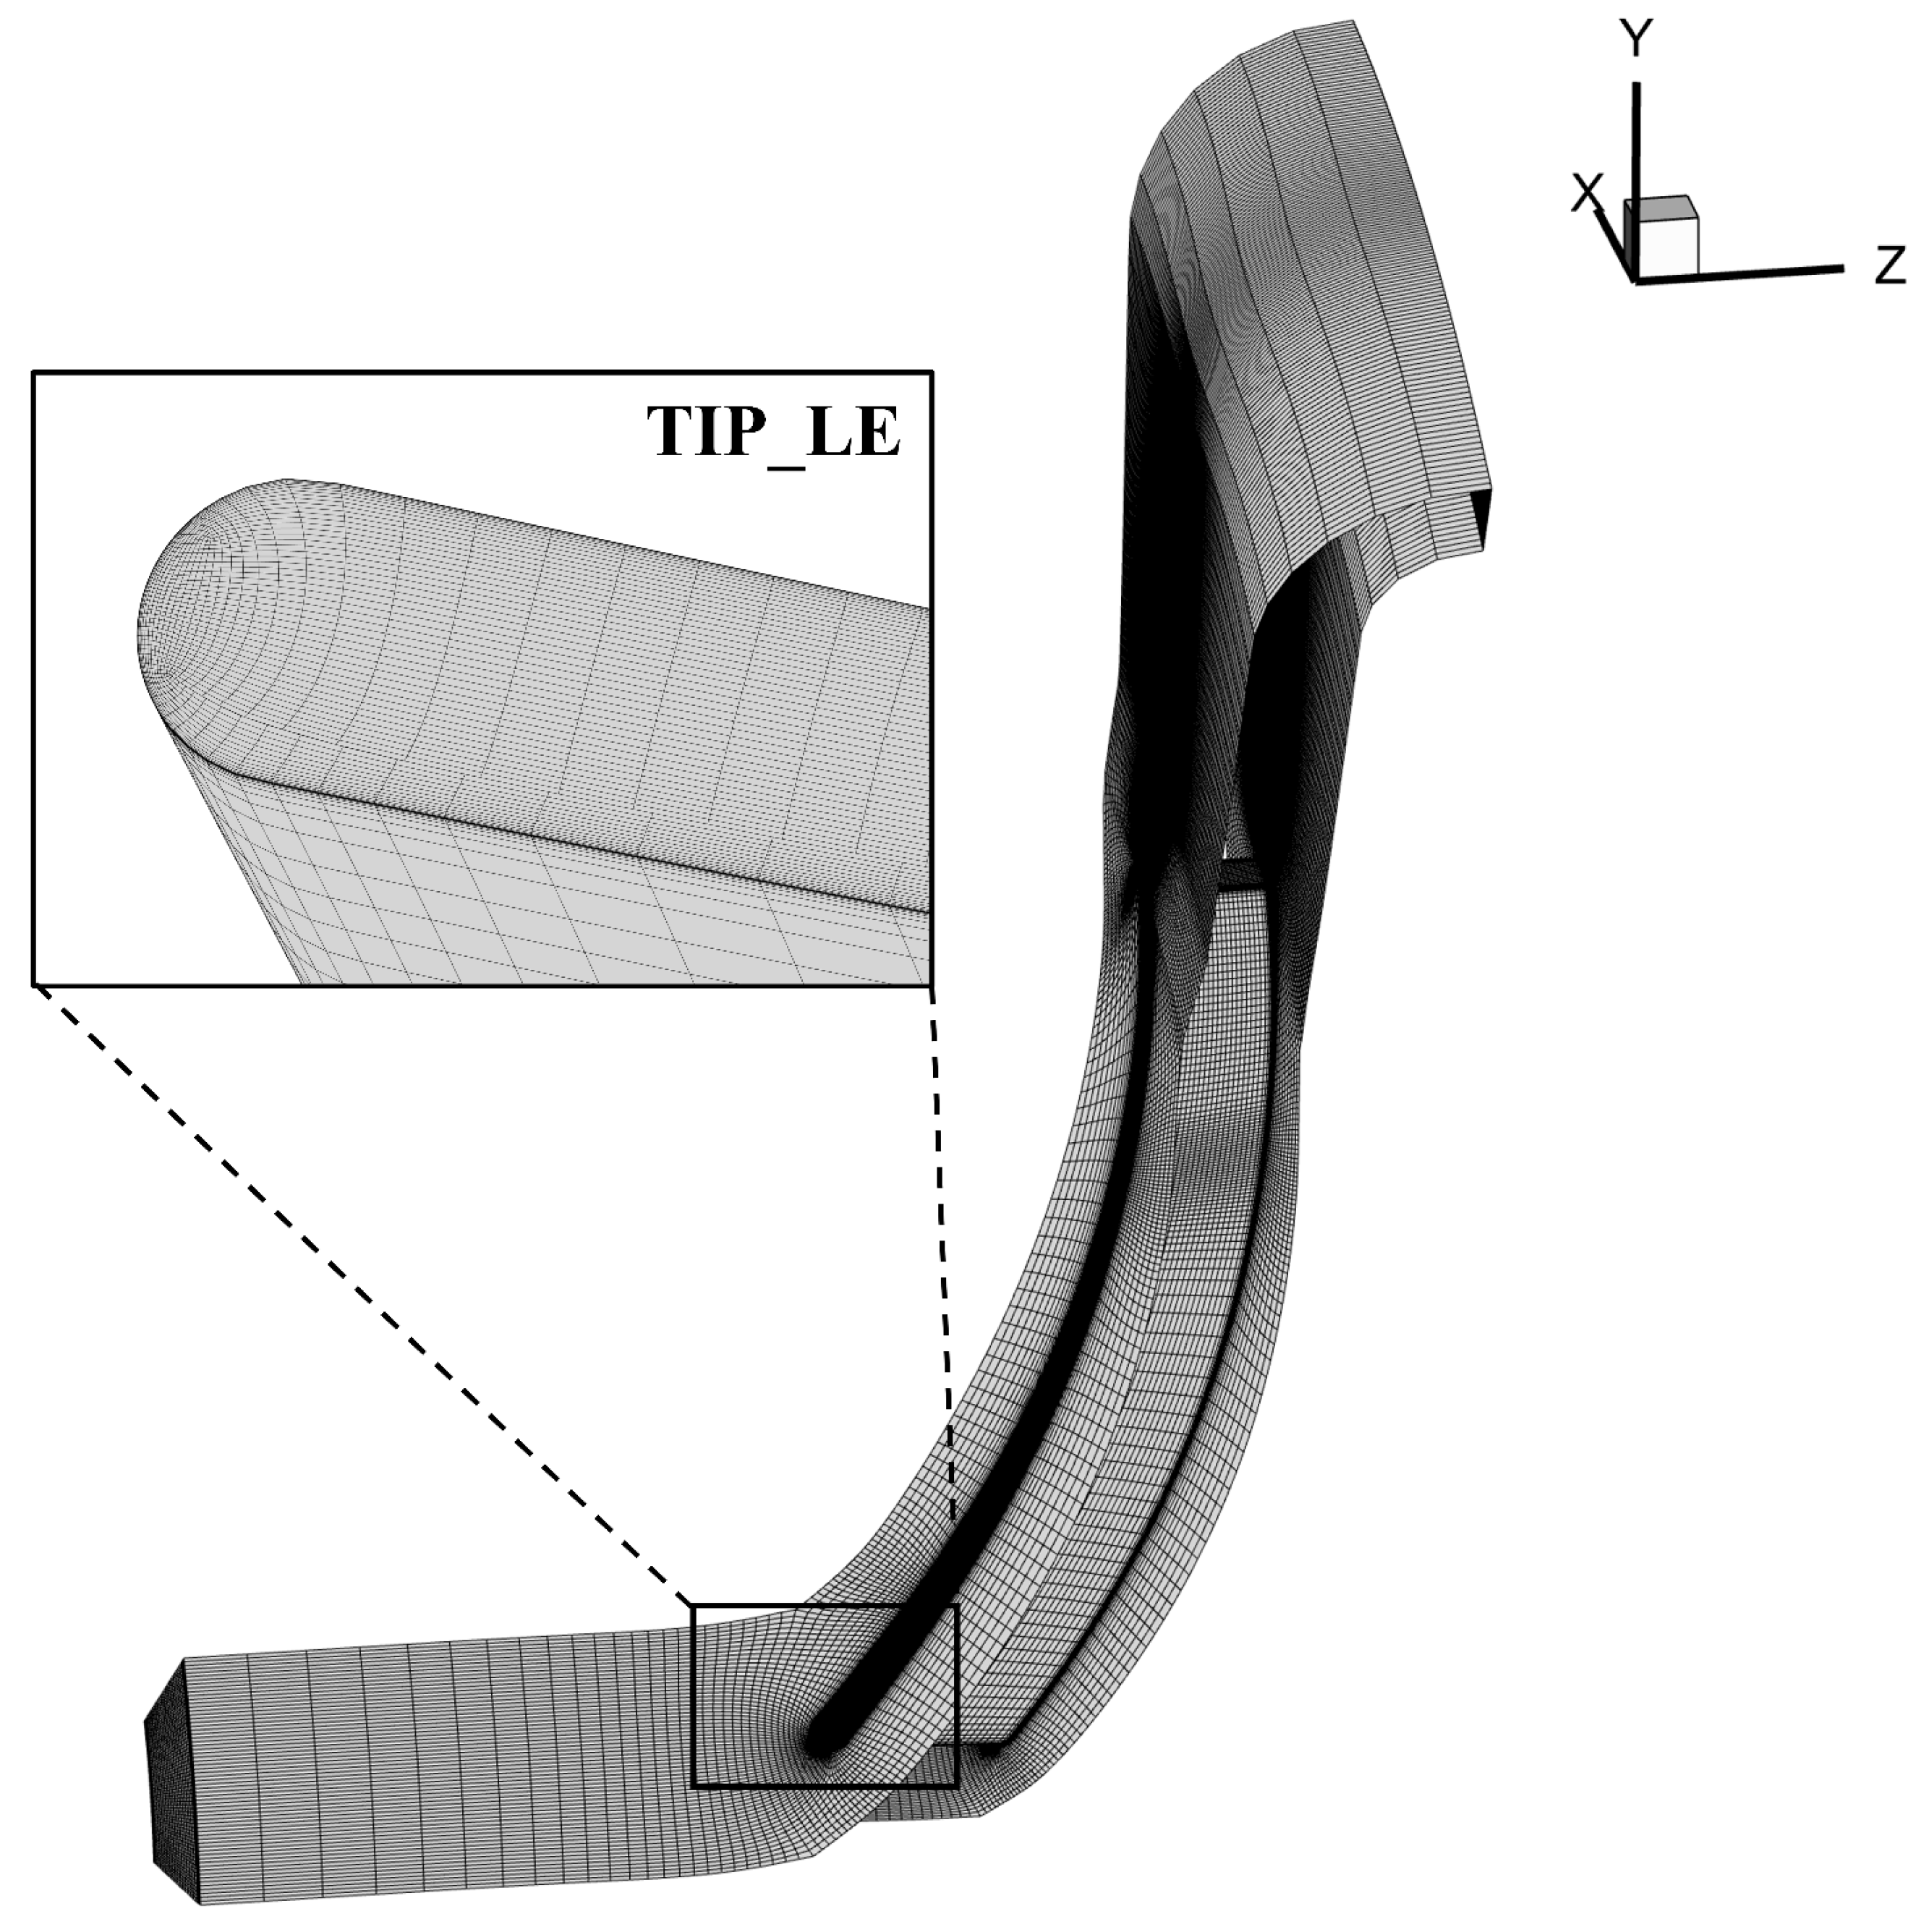
For the steady-state calculation of a three-stage centrifugal compressor, the computational domain is divided into five parts for meshing, as shown in Figure 2. The NUMECA/AutoGrid5 module is used to generate structured grids. The entire passage uses structured grids, and the blade passage is meshed using O4H topology; specifically, the inlet and outlet sections employ H-type grids, the blade area uses O-grid topology, and the tip clearance is meshed with butterfly grids. To ensure simulation accuracy in the boundary layer region, the height of the first-layer grid is set to 1 × 10⁻⁶ m, achieving y+ ≈ 1 at the solid walls. Following grid independence verification, the grid distribution in the blade region consists of 97 streamwise nodes, 91 radial nodes (including 20 layers in the tip clearance), and 67 circumferential nodes. The isolated impeller channel model is shown in Figure 3, which is consistent with the three-stage centrifugal compressor model. Specific details of the grid independence verification are provided in Section 3.2.
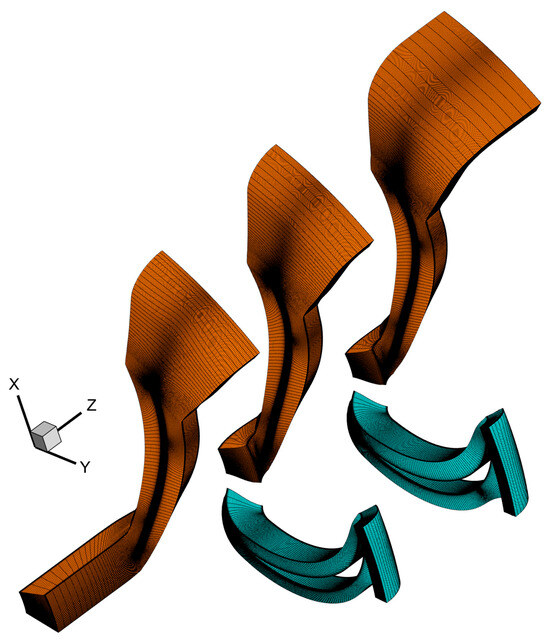
Figure 2.
Computational mesh of the three-stage centrifugal compressor domain.
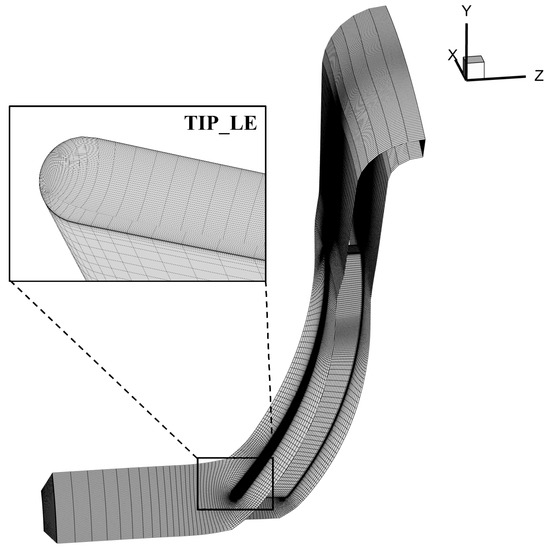
Figure 3.
Computational mesh of the impeller domain.
2.5. DMD Implementation
DMD, a data-driven technology proposed in 2010, extracts dynamic information from a series of flow field snapshots and can be used to describe the underlying physical mechanisms captured. This method has been widely used by scholars to capture various disturbances inside rotating machinery, thereby understanding the spatio-temporal evolution of internal instability.
Before the DMD calculation, it is necessary to conduct spatio-temporal discrete sampling of the three-dimensional unsteady flow field inside the compressor at various time instances, to capture a complete state vector that includes physical quantities such as pressure and velocity, and to assemble these into a snapshot matrix comprising M flow field snapshots .
In the formula, represents the column vector comprising M space point number. In general fluid mechanics problems, when the time interval is small, a linear mapping relationship exists between consecutive flow field snapshots. Thus, the flow field evolution can be approximately described by the linear operator A.
To this end, the snapshot matrix can be divided into two matrices and of time offset:
It should be noted that in the actual calculation, is a high-dimensional matrix. In order to avoid the curse of dimensionality, singular value decomposition (SVD) is performed on :
By retaining the first r dominant singular values, the reduced dimension is obtained. This reduces the computational complexity from to .
By approximating the matrix in the low-dimensional space:
Solve the characteristic decomposition of , where is the eigenvalue and W is the eigenvector matrix.
The DMD mode is:
The eigenvalues of the discrete system can be converted to the continuous system form by a fixed time step . The imaginary part of the eigenvalue can be converted to the ordinary frequency associated with each DMD mode:
The amplitude b is a parameter used to measure the modal contribution, and it is also a key parameter for reconstructing the flow field using the DMD mode.
The snapshot of the flow field at time i can be reconstructed in the following way.
The reconstructed flow field sequence matrix is:
A key challenge in DMD is sorting the modes according to their contribution to the flow field and selecting the dominant modes. The energy extraction method adopted in this study, as presented below, effectively evaluates the contributions of modes to the flow field at different time points [34].
3. Experiment and Verification of Simulation
3.1. Experimental Instruments and Procedures
Experimental measurements were conducted on a closed three-stage centrifugal compressor test rig. The entire test bench consists of a gas supply system, test section, exhaust and throttling system, measurement system, and auxiliary system. The test medium is nitrogen. The experimental section is a three-stage centrifugal compressor, with specific parameters identical to those introduced in Section 2.1.
The test measured the performance of the compressor under design conditions. At the inlet and outlet pipes of the compressor, 15 static pressure sensors were, respectively, arranged to measure the upstream and downstream static pressures. Resistance temperature detectors (RTDs) were, respectively, arranged at the inlet and outlet to measure the temperatures. The rotational speed is measured by an electromagnetic sensor, and the flow rate was measured by an electromagnetic flowmeter installed in the inlet section. To verify the measurements, an uncertainty analysis was performed. The uncertainty in static pressure measurement was ±0.5%, that in temperature measurement was ±1 K, and that in mass flow rate measurement was ±0.8%.
3.2. Validation of Numerical Simulation
The following Table 2 presents a comparison between the experimental and numerical simulation data under design conditions. For the three-stage centrifugal compressor under design conditions, the isentropic efficiency relative error between the numerical simulation and experimental results is 4.37%, the pressure ratio relative error is 6.98%, and these errors fall within an acceptable range. However, due to cost constraints and the limited availability of experimental data, the predicted characteristic line of the DDA404-III centrifugal compressor is compared with published experimental data to further validate the effectiveness of the numerical method used in this paper [35].
Table 3 comparison between the experimental and numerical simulation data under design conditions.

Table 3.
Comparison between the experimental and simulation data under design conditions.
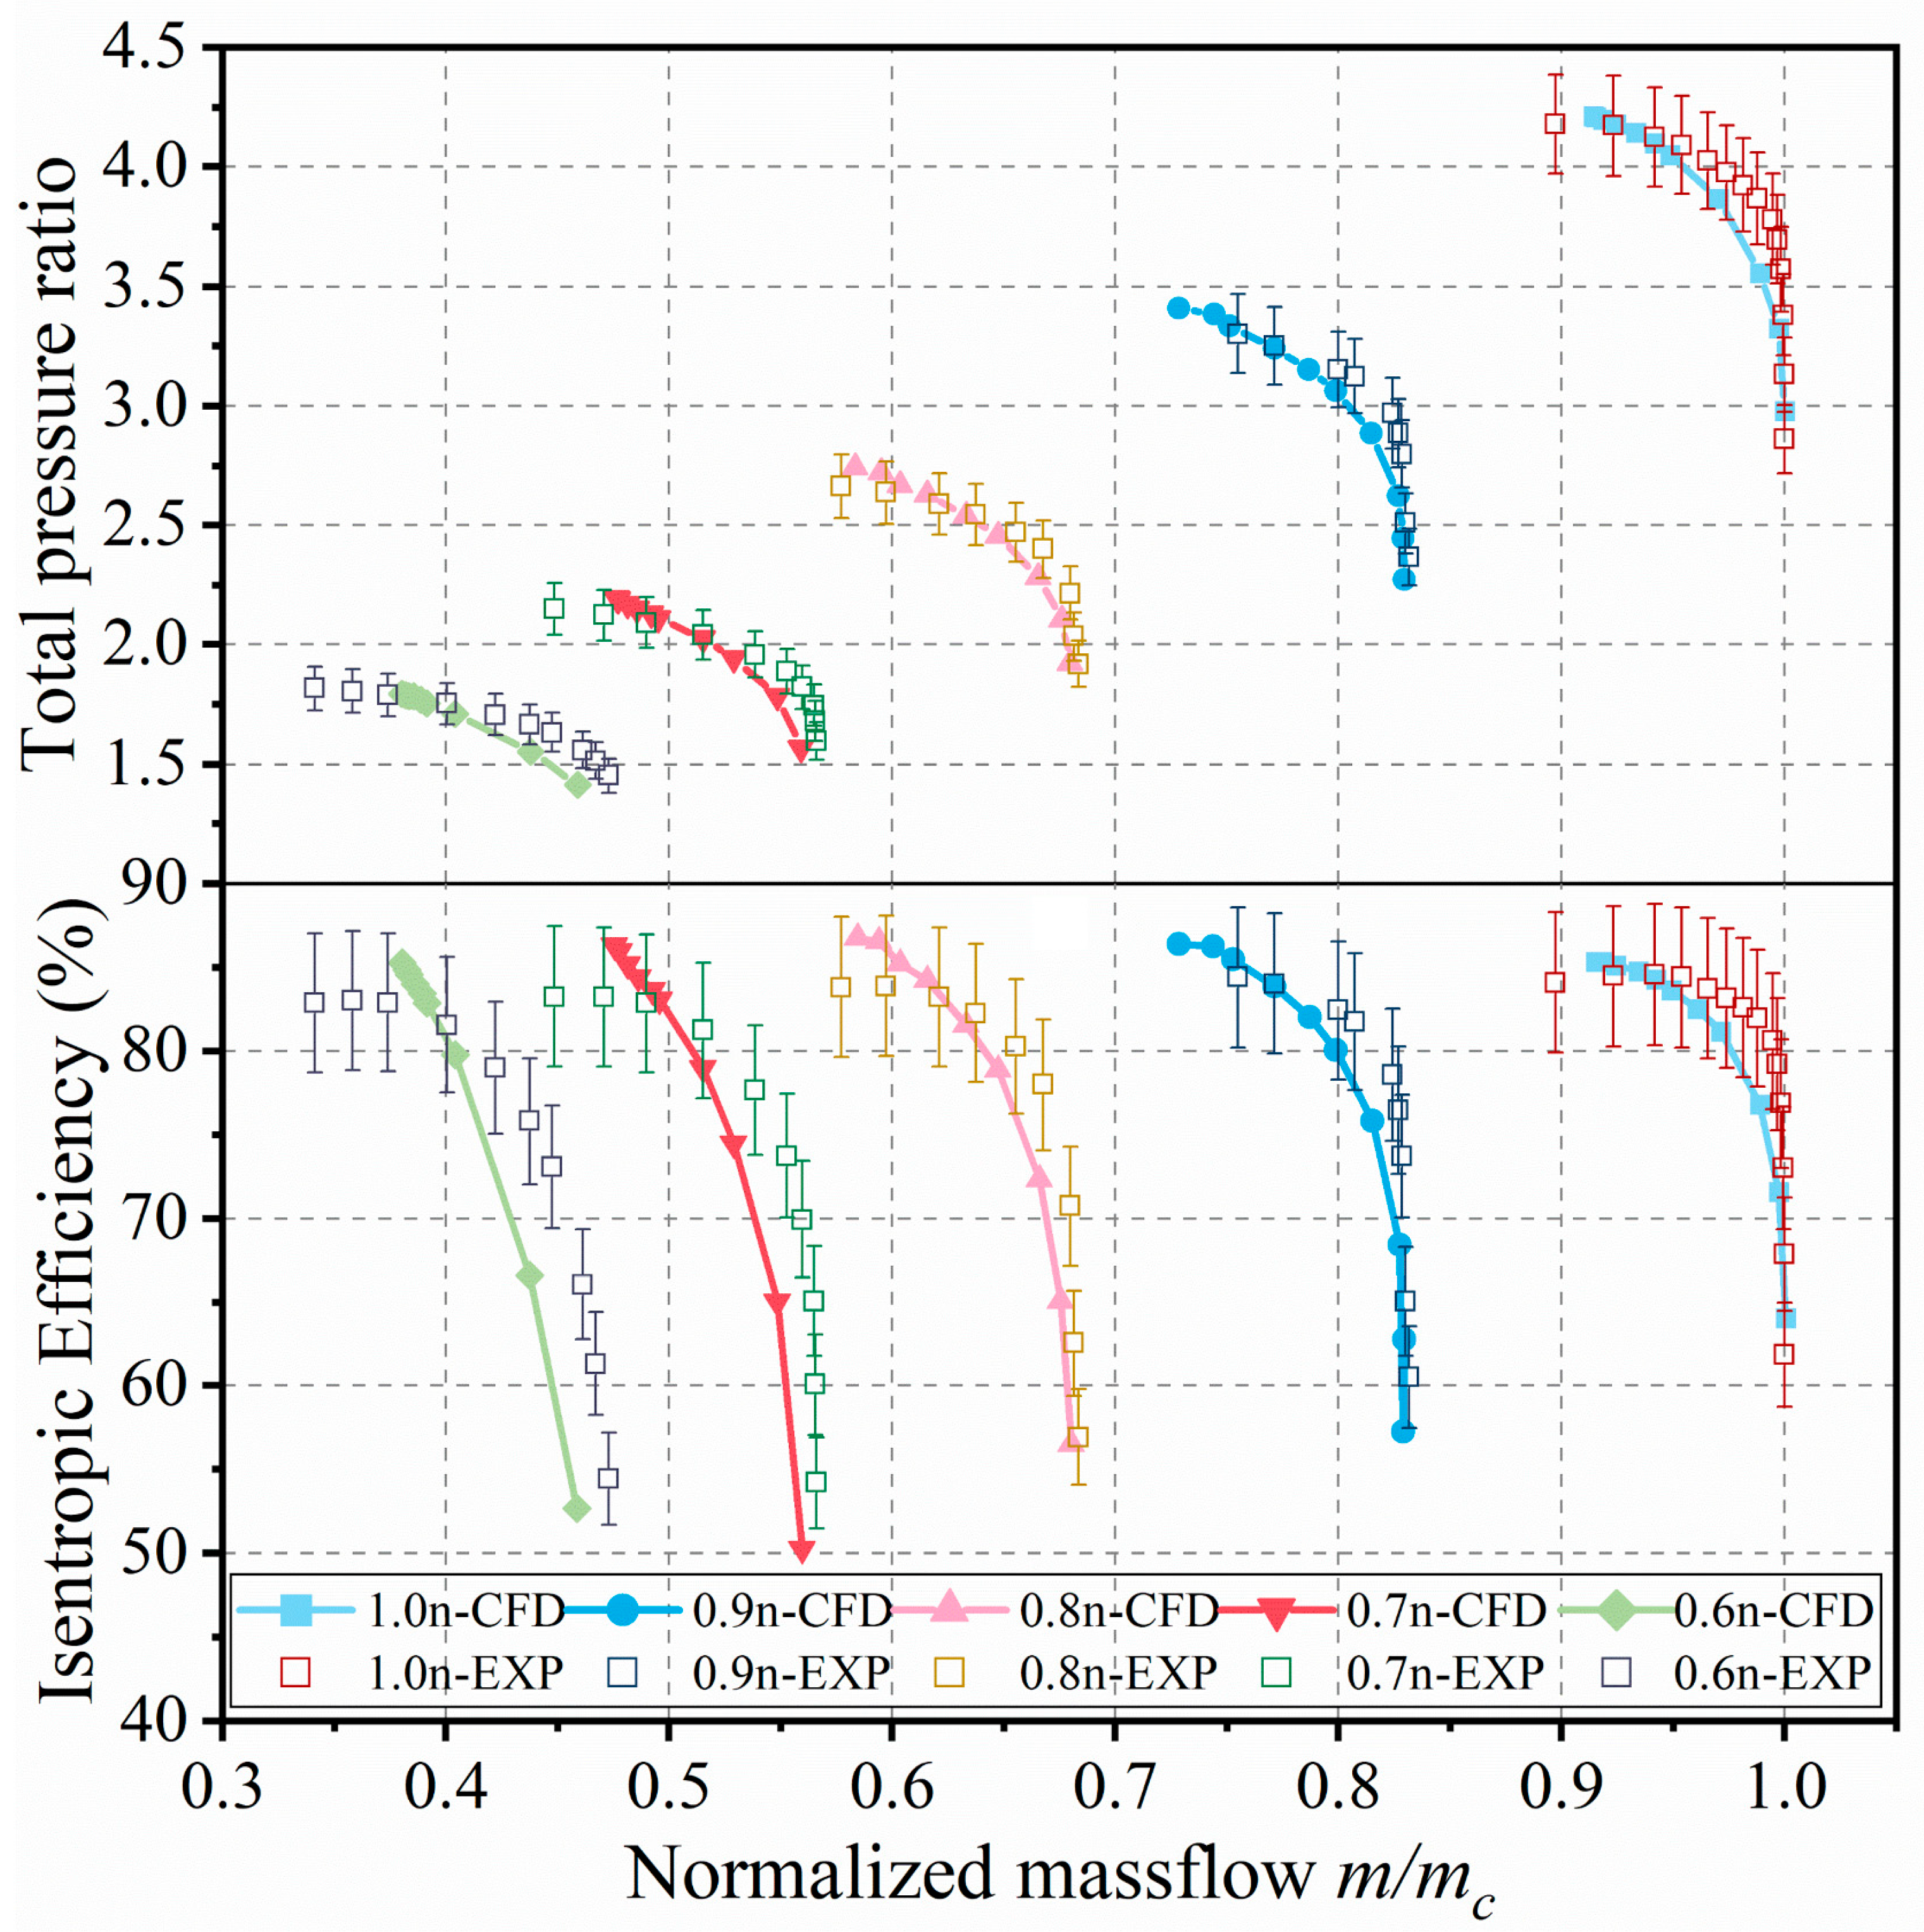
The DDA404-III exhibits inlet Reynolds and Mach numbers similar to those of the model studied in this paper under low-speed conditions. The calculated operating characteristics of the compressor are compared with the experimental results in Figure 4. The mass flow rate is normalized using the blockage flow rate at 1.0 speed. Figure 4 shows that the simulation results are in good agreement with the experimental results at different speeds, with the maximum error less than 5%. After comparing the two sets of experimental data with the simulation data, although some differences exist, the overall consistency is good, confirming the reliability of the numerical method used in this paper.
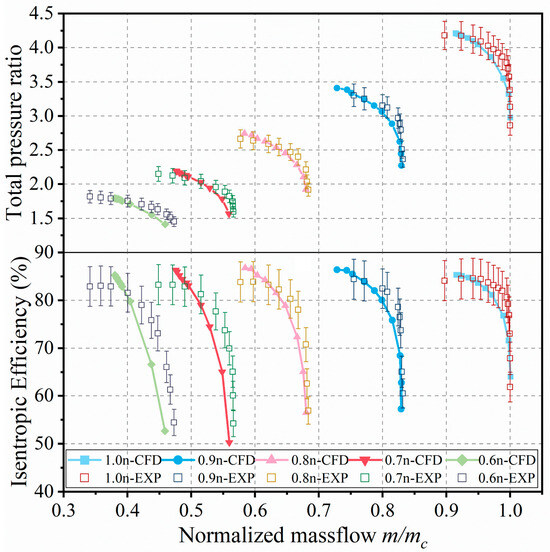
Figure 4.
Comparison of the experiment and simulation data of DDA404-III.
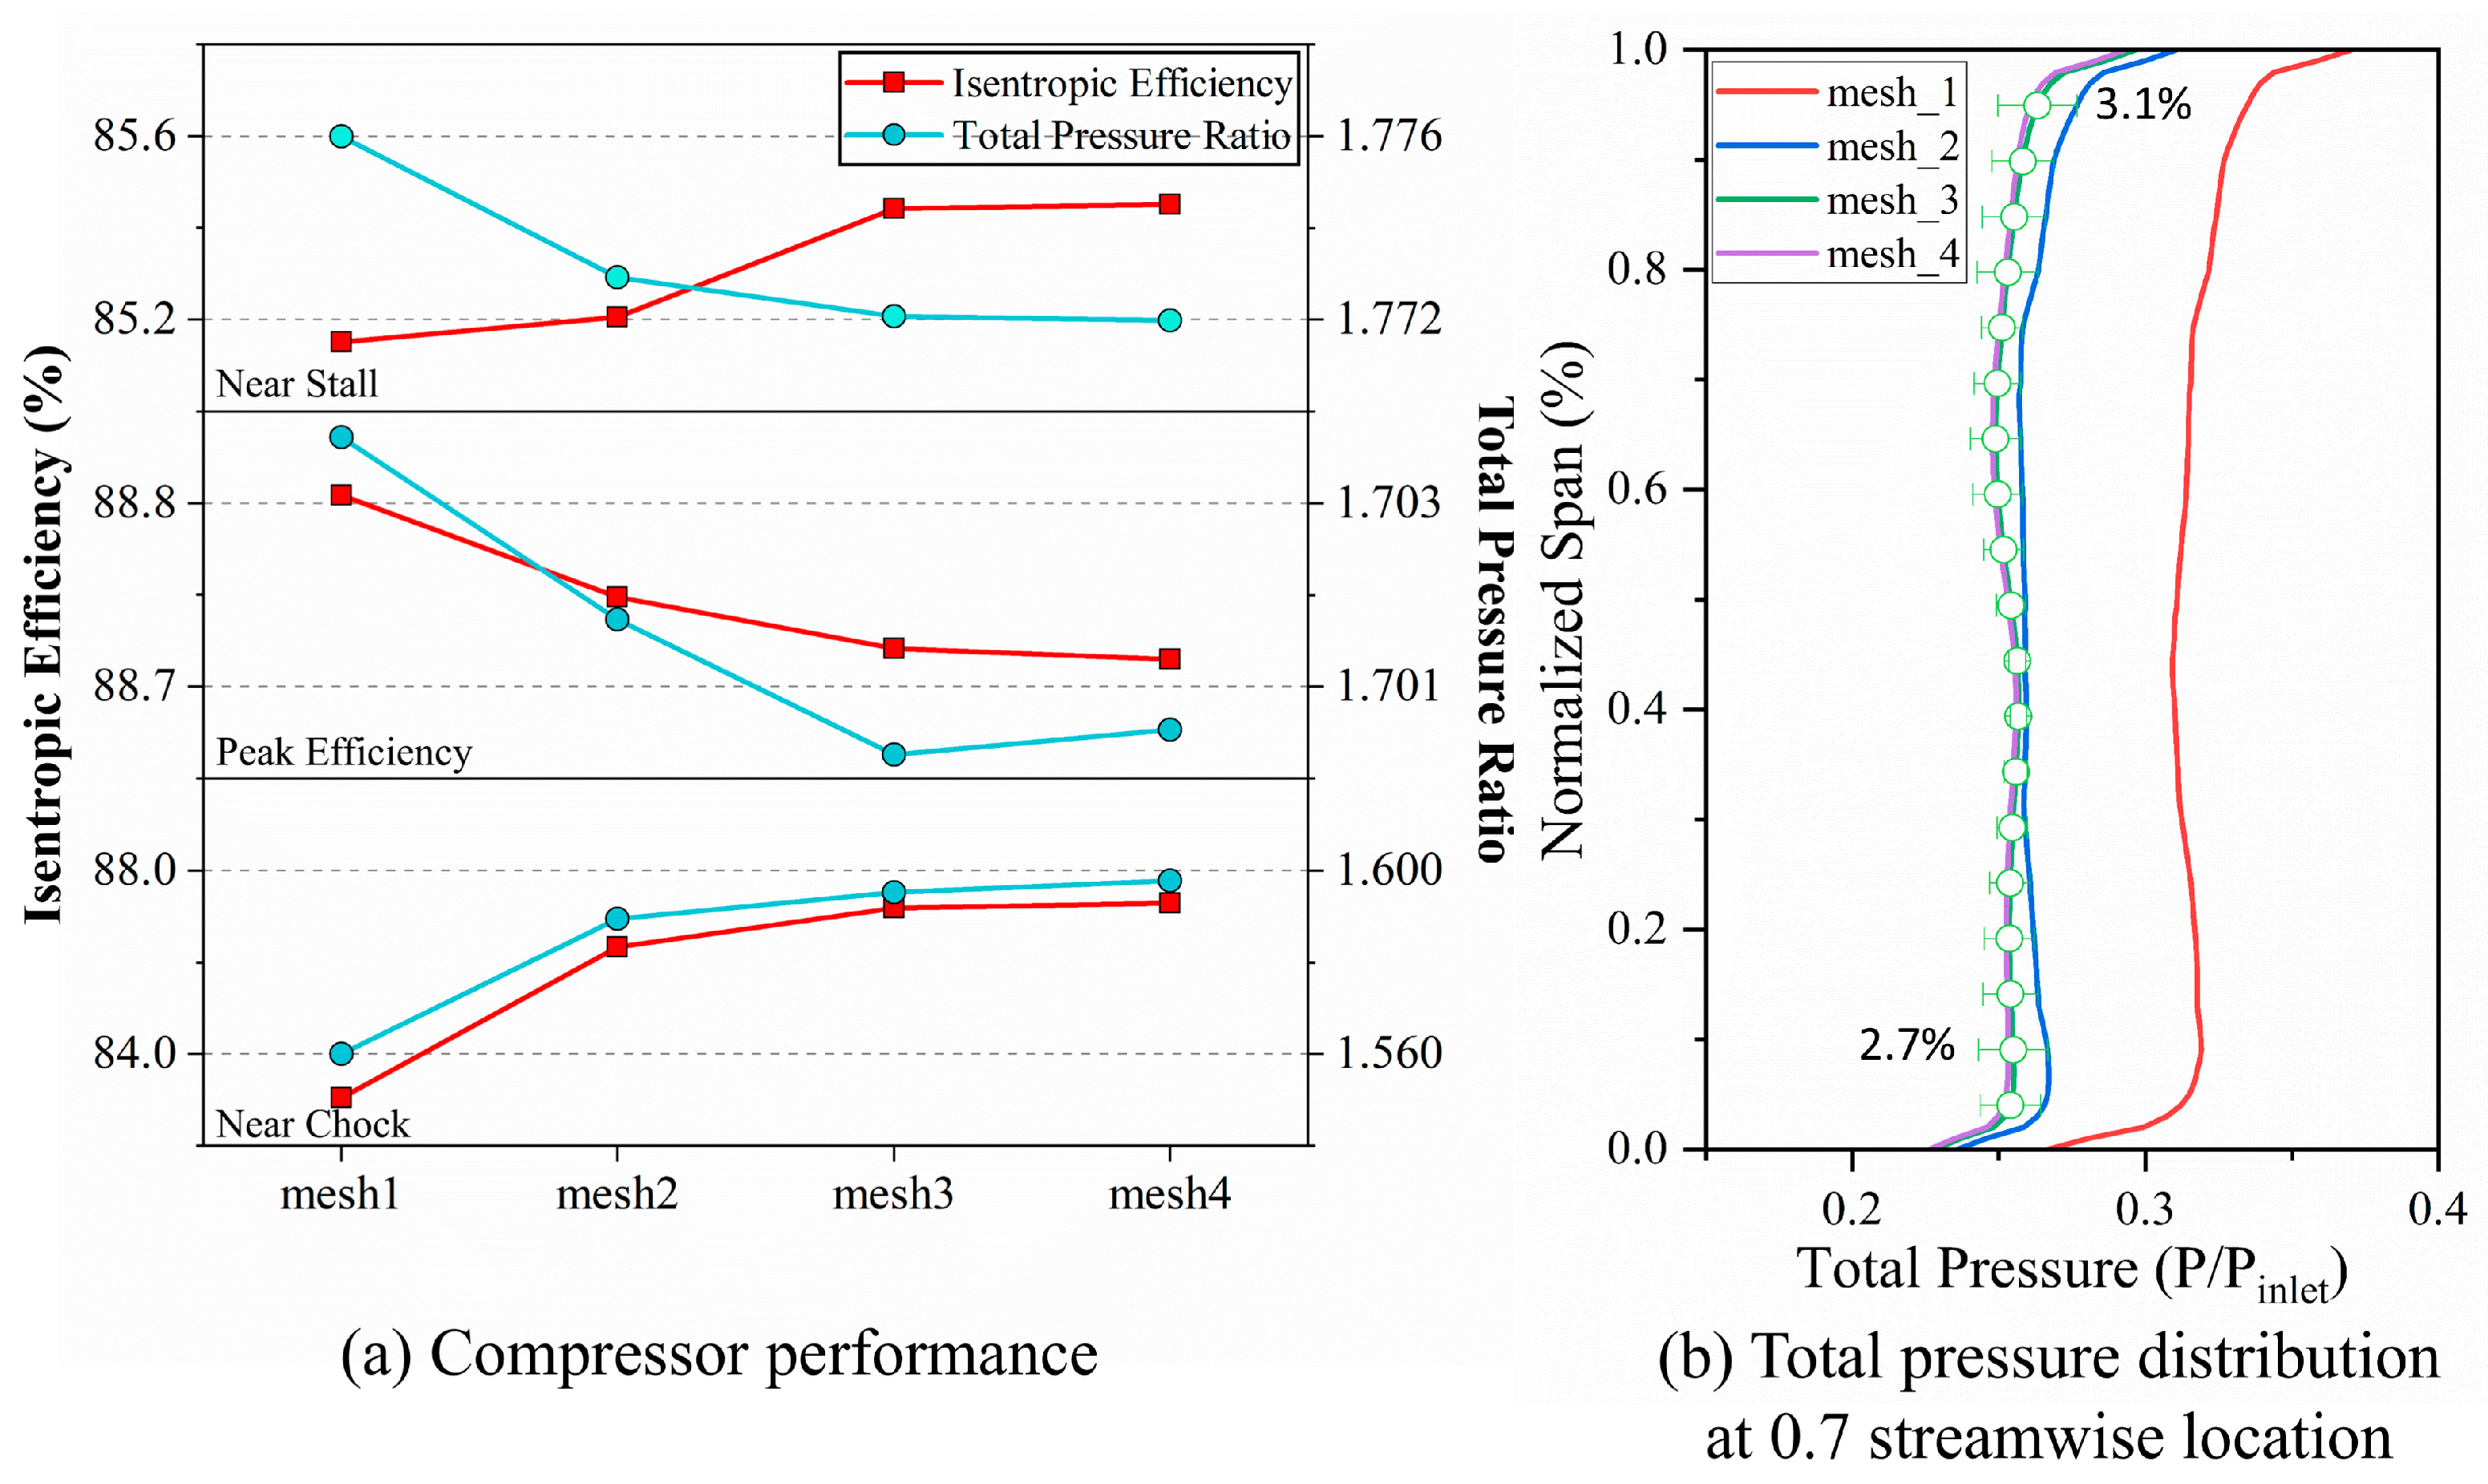
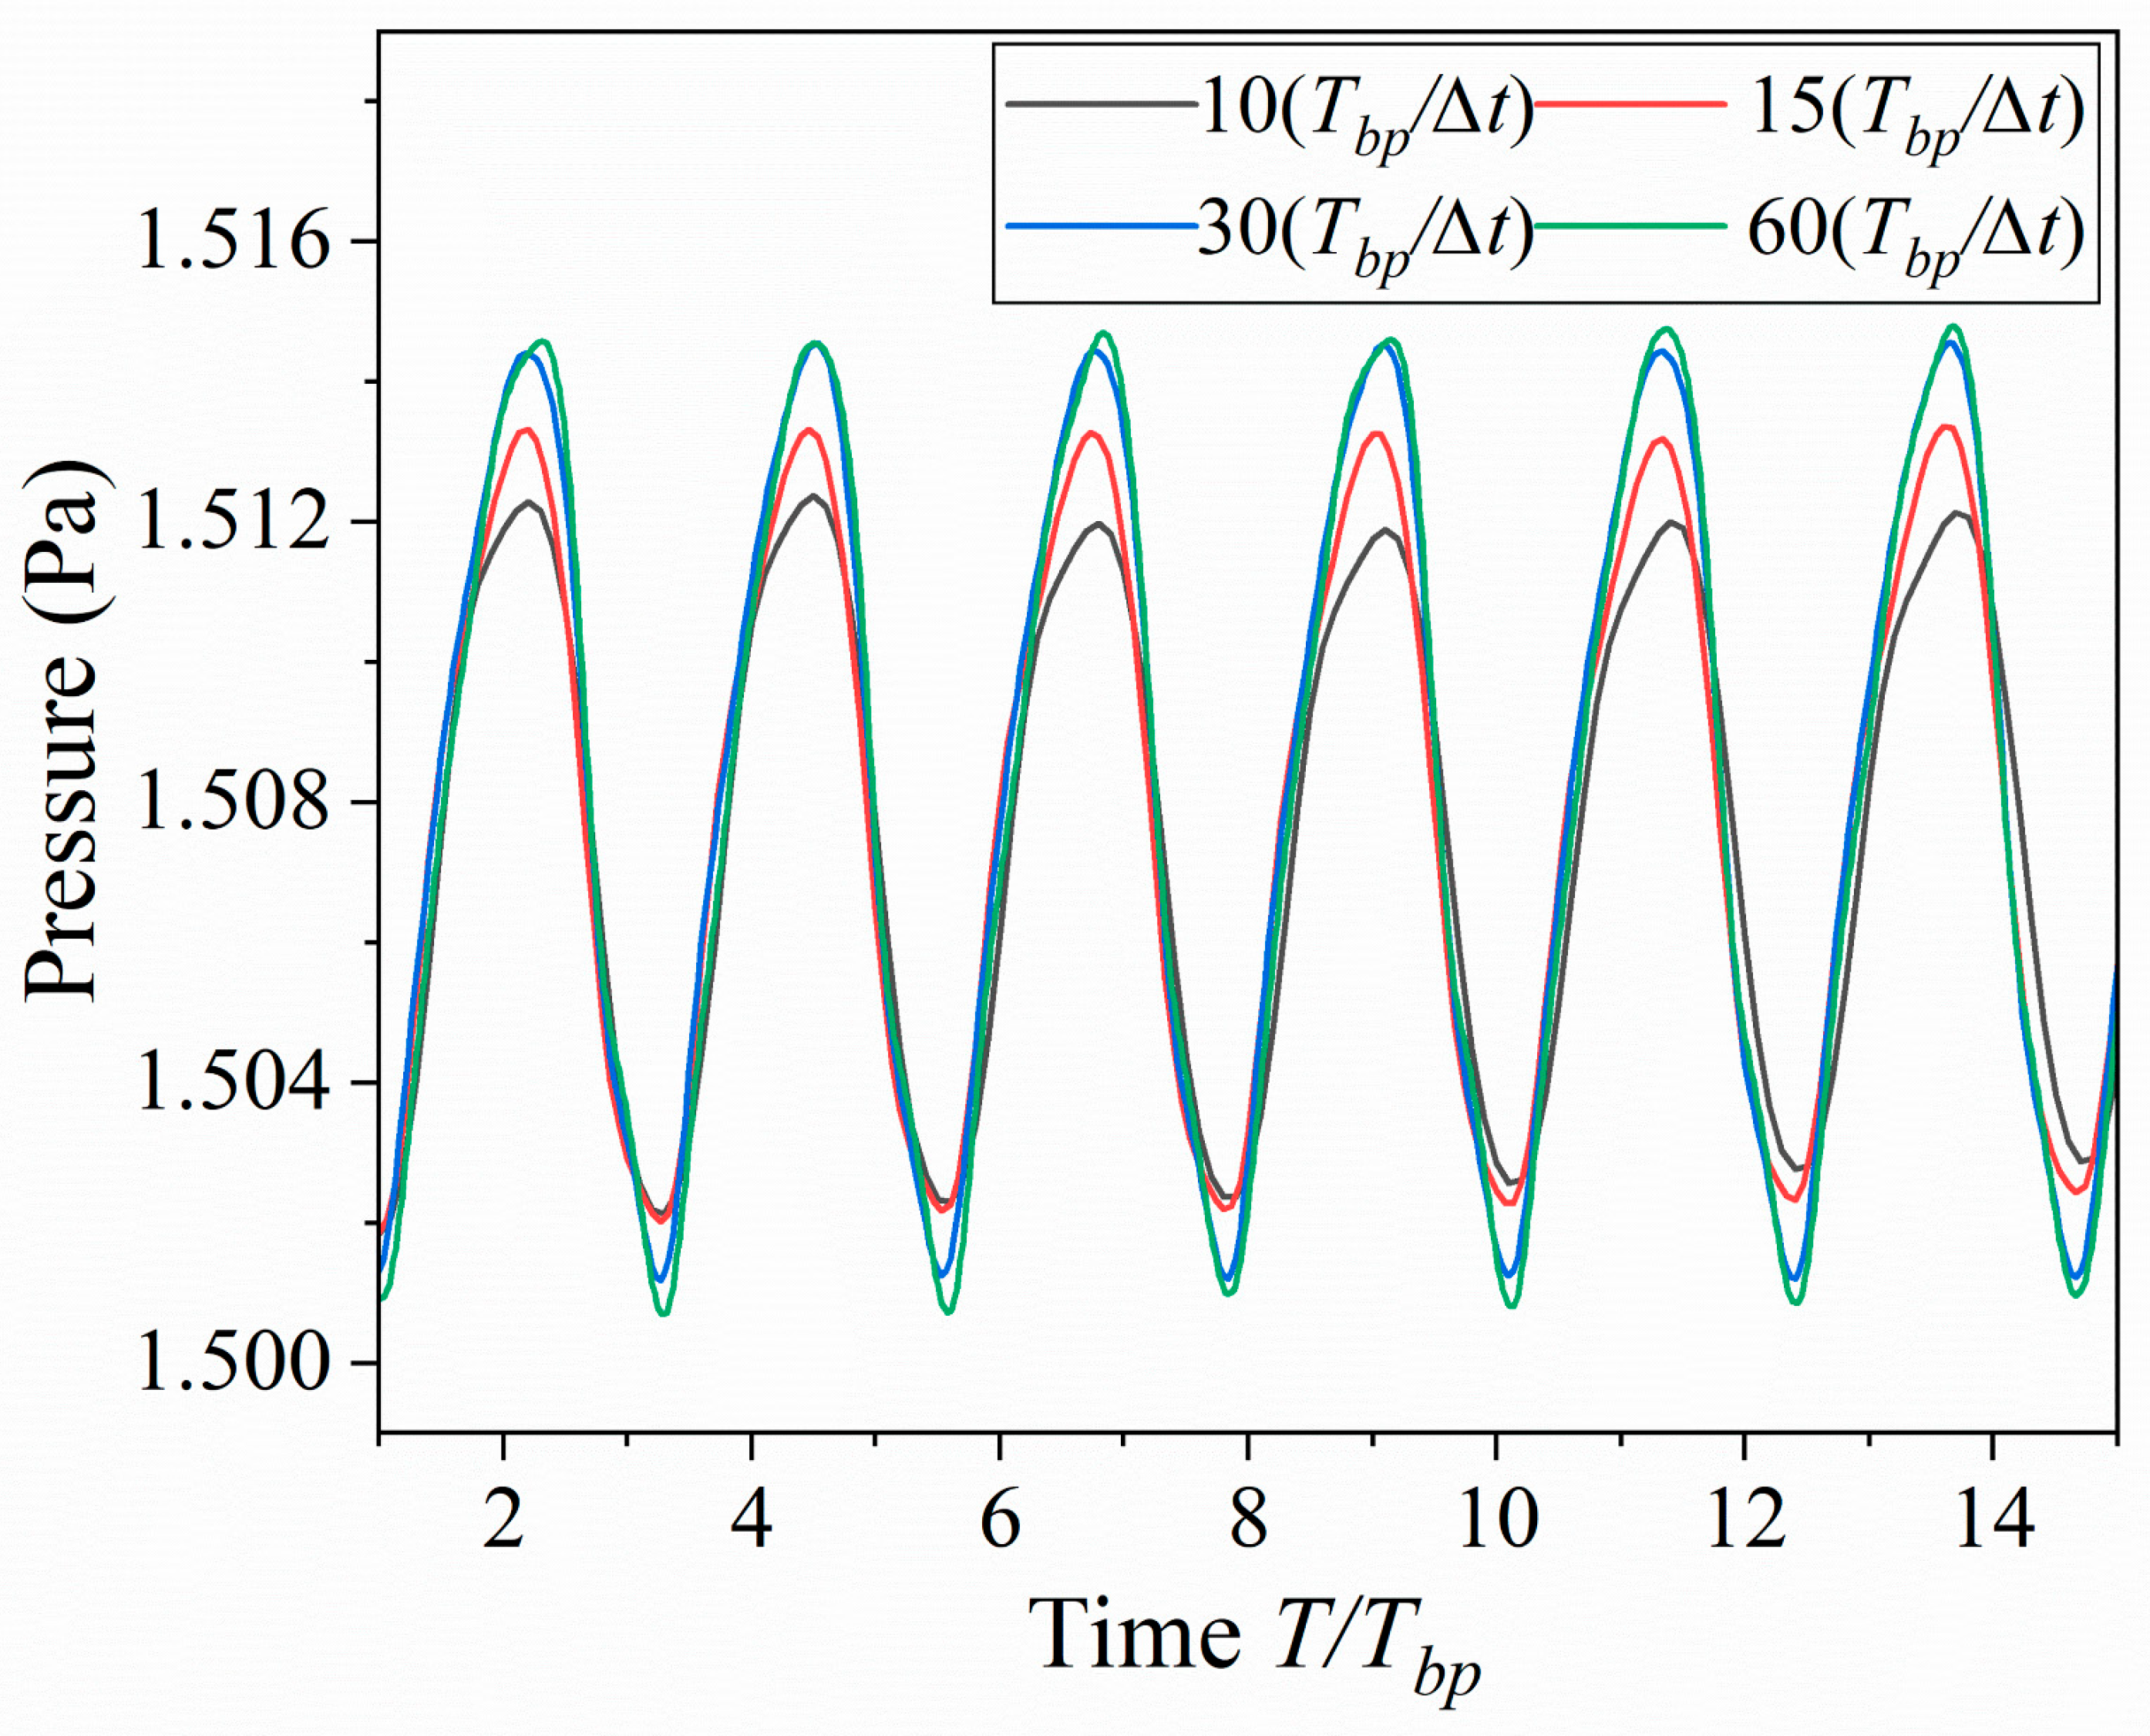
Simulations of a three-stage centrifugal compressor were conducted at the choke point, peak efficiency point, and near-stall point using four different grid scales to eliminate uncertainties arising from grid resolution, as shown in Figure 5a. The grid scales were designated as mesh1 (1.45 million nodes), mesh2 (3.15 million nodes), mesh3 (6.24 million nodes), and mesh4 (11.23 million nodes). It was observed that when the grid size exceeded 6.24 million nodes (mesh3), the overall compressor performance at the choke point, peak efficiency point, and near-stall point exhibited minimal variation. To systematically evaluate the impact of grid size on computational accuracy, the Grid Convergence Index (GCI) method was employed. The total pressure distribution at 10% relative chord length downstream of an isolated blade under near-stall conditions was analyzed to assess the computational accuracy influenced by the grid, as shown in Figure 5b. It was found that, when using the mesh3 grid, the maximum error in the downstream total pressure distribution was concentrated at the blade tip and root, with a maximum error of 3.1%. Considering both computational accuracy and resource consumption, the mesh3 grid, with 1.26 million nodes for the isolated impeller, was selected for subsequent simulations of the isolated impeller. Additionally, four time step sizes are selected, 10, 15, 30, and 60 time steps per blade, as shown in Figure 6. When the number of time steps exceeds 30, the difference in pressure fluctuations at the blade tip is small; therefore, 30 time steps per blade channel are set for subsequent simulations, corresponding to 2.5518 × 10⁻⁶ s.
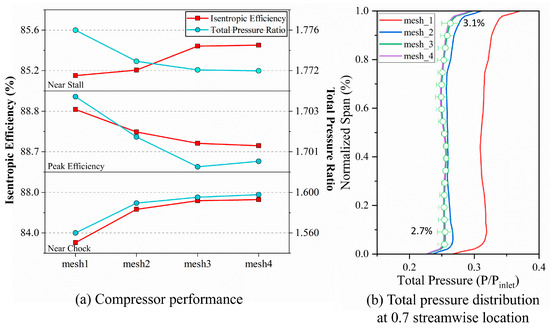
Figure 5.
Validation of mesh independence.
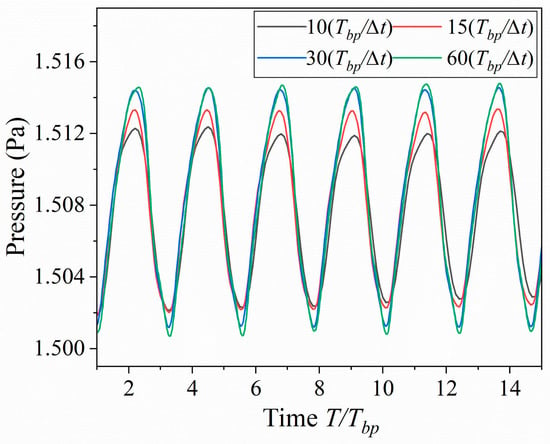
Figure 6.
Validation of temporal resolution impact on pressure fluctuations (T/Tbp scaling).
4. Result and Discussion
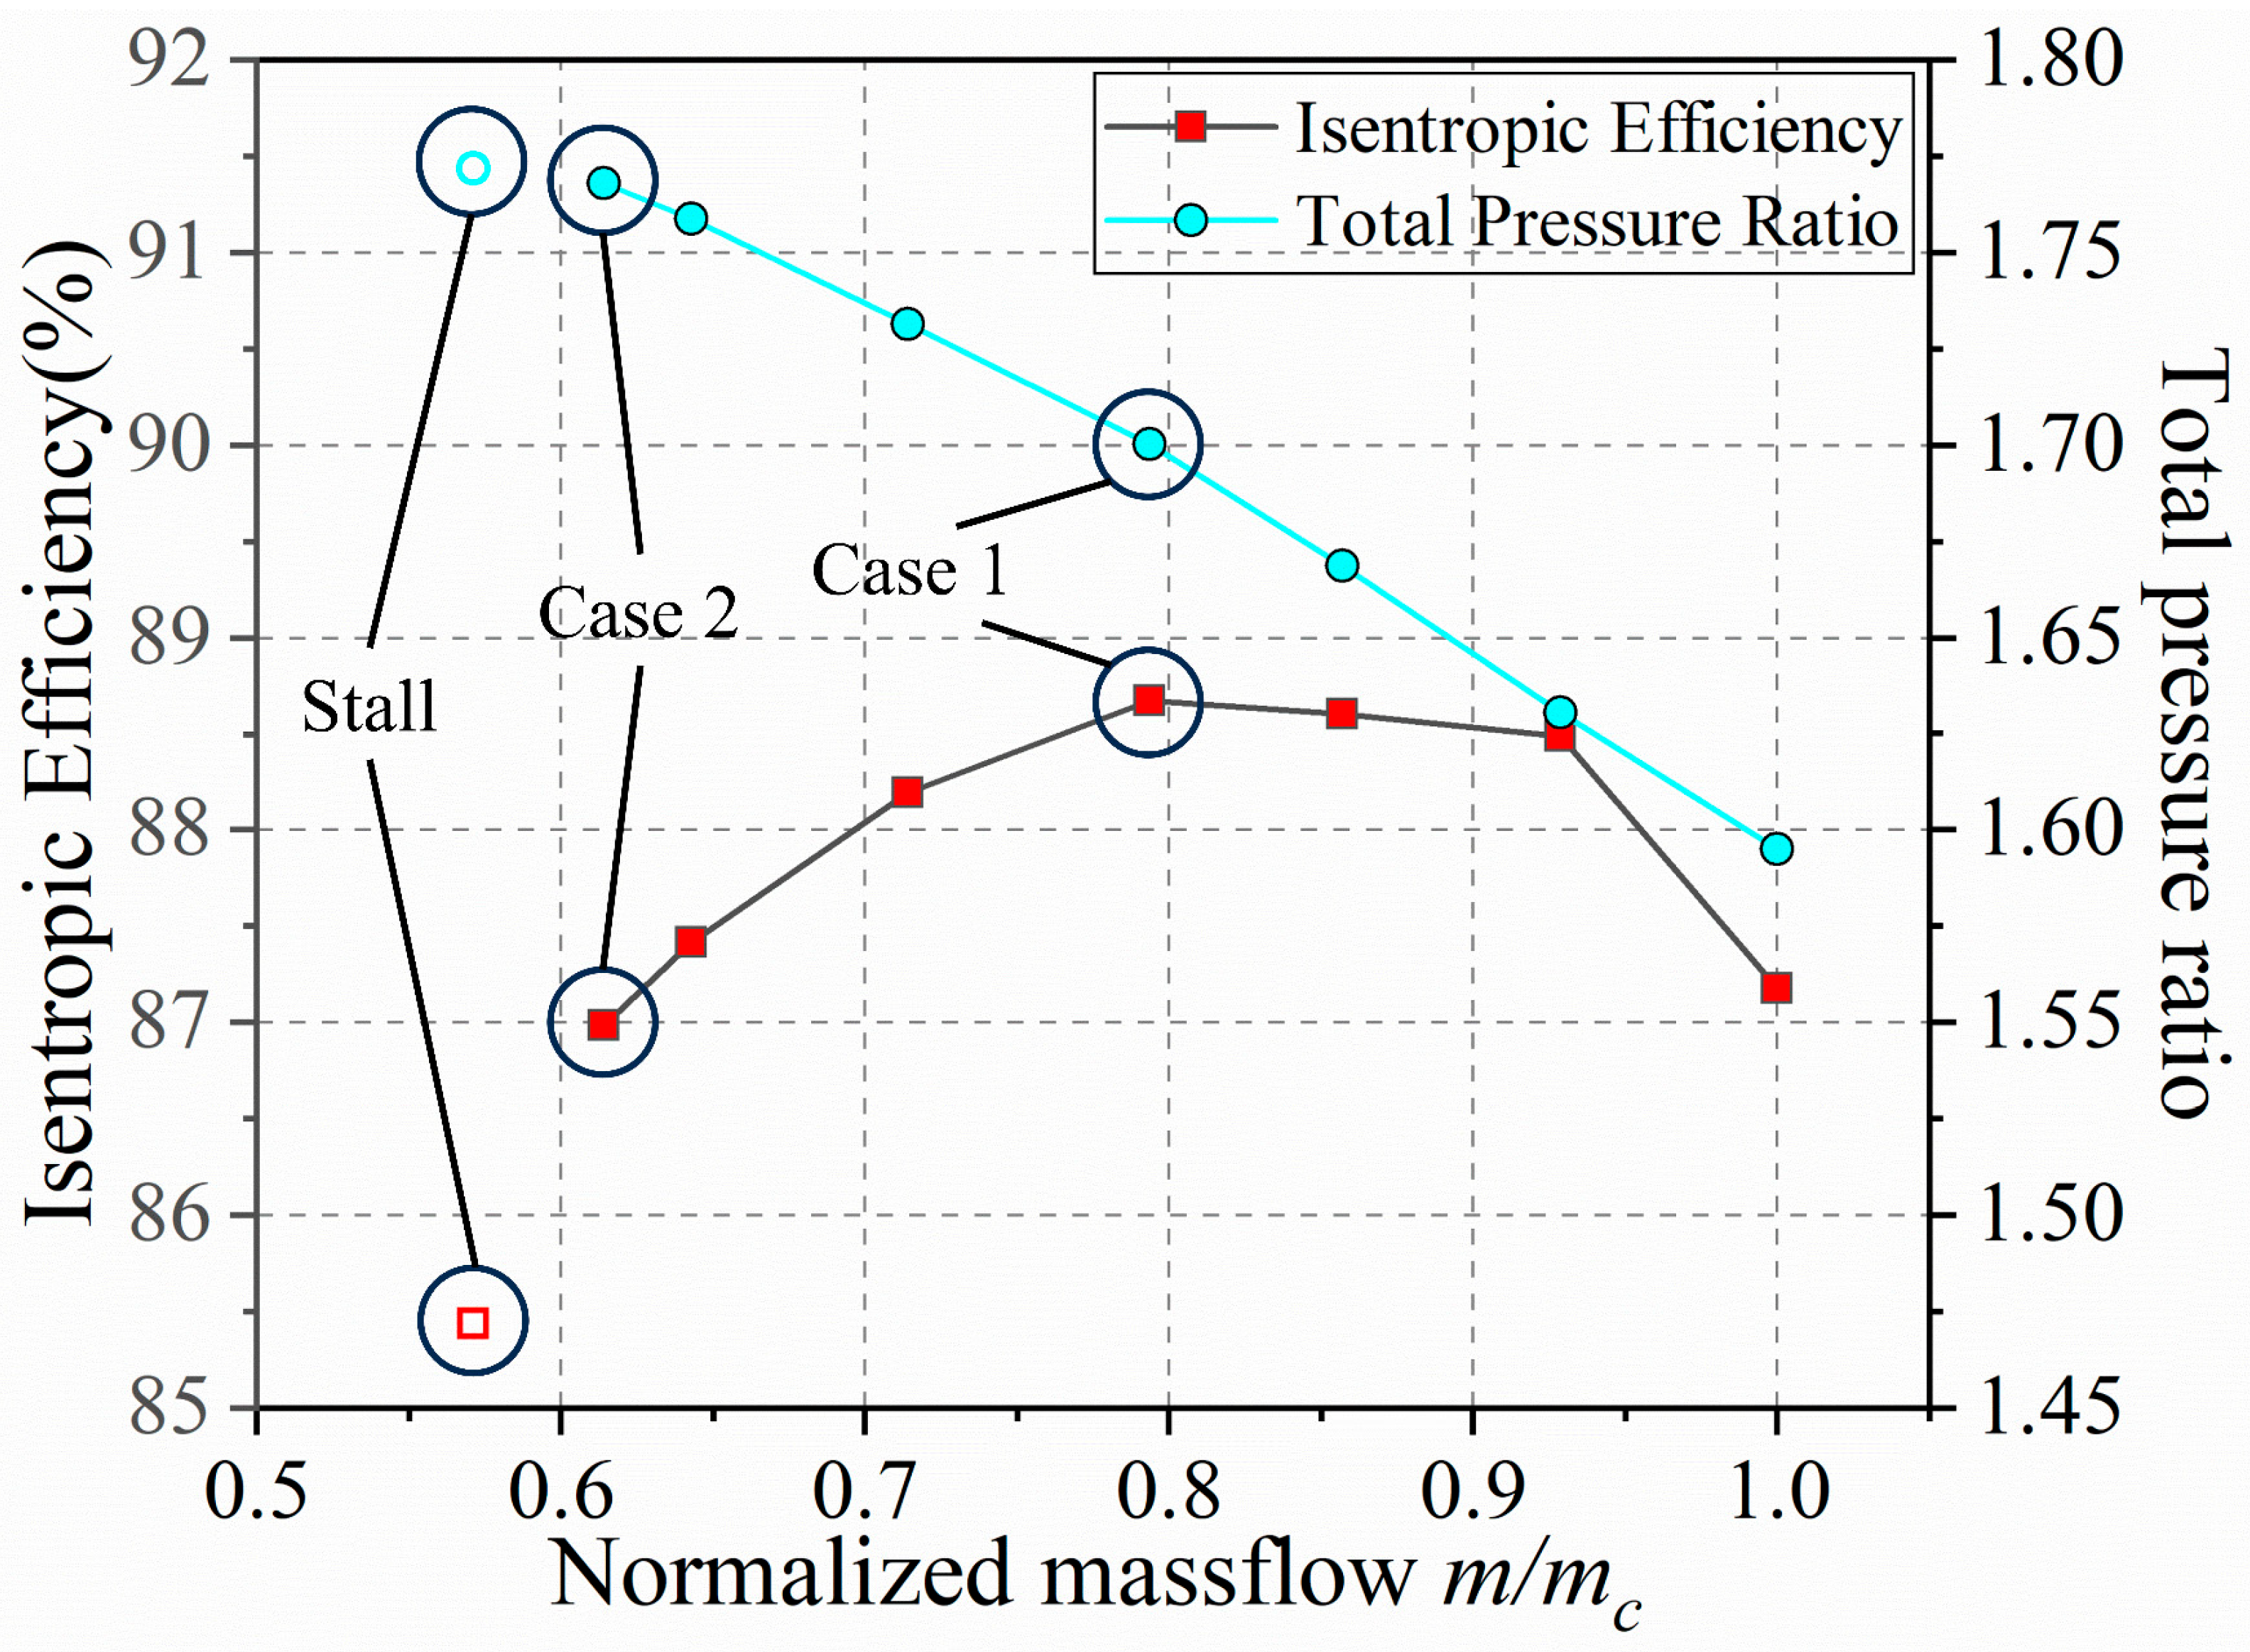
In Figure 7, the performance characteristic curve of the centrifugal compressor under investigation is presented. The abscissa represents the normalized mass flow rate, based on the choking flow rate. It is shown that, as the throttling process progresses, the pressure ratio of the compressor is continuously increased. Pronounced instability is observed when the normalized flow rate falls below 0.571, indicating the primary instability of the compressor. It should be noted that, due to the structural characteristics of the centrifugal compressor, simulations can still be conducted at lower flow rates. However, as the focus of this study is to analyze the origin of instability within the impeller passage, a normalized flow rate of 0.571 was selected. The transient flow field analysis within the isolated impeller is designated as Case 2 in the figure. To facilitate a detailed analysis of the flow characteristics inside the centrifugal impeller, the best efficiency point was chosen as the control case, designated as Case 1 in the figure.
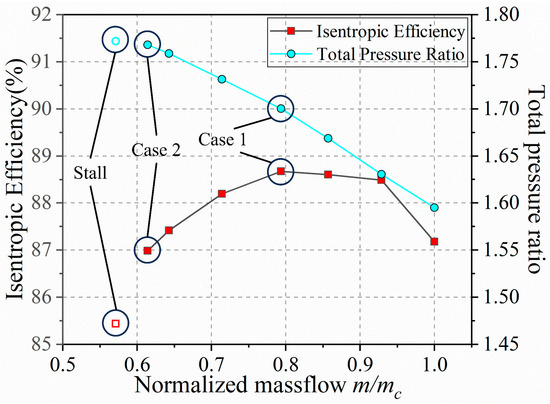
Figure 7.
Compressor characteristic map showing total-to-total pressure ratio and isentropic efficiency versus mass flow rate. The investigated operating points, including the best efficiency point (Case 1) and near-stall (Case 2) condition, are marked.
4.1. Time-Averaged Flow Analysis in Passage
To elucidate the fluctuations within the centrifugal impeller, the time-averaged flow field within the impeller is presented first. The entropy distribution is considered highly effective for analyzing losses within the compressor, as regions with high entropy gradients are often indicative of interactions among various flow structures. In this study, following the methodology of Denton [36], the entropy is non-dimensionalized based on the compressor work input, yielding a form analogous to isentropic efficiency. In regions with low losses, the non-dimensional entropy value approaches 1, whereas lower values correspond to more significant losses.
Among them, represents the enthalpy rise inside the entire compressor, and represents the entropy difference between a certain position in the passage and the inlet.
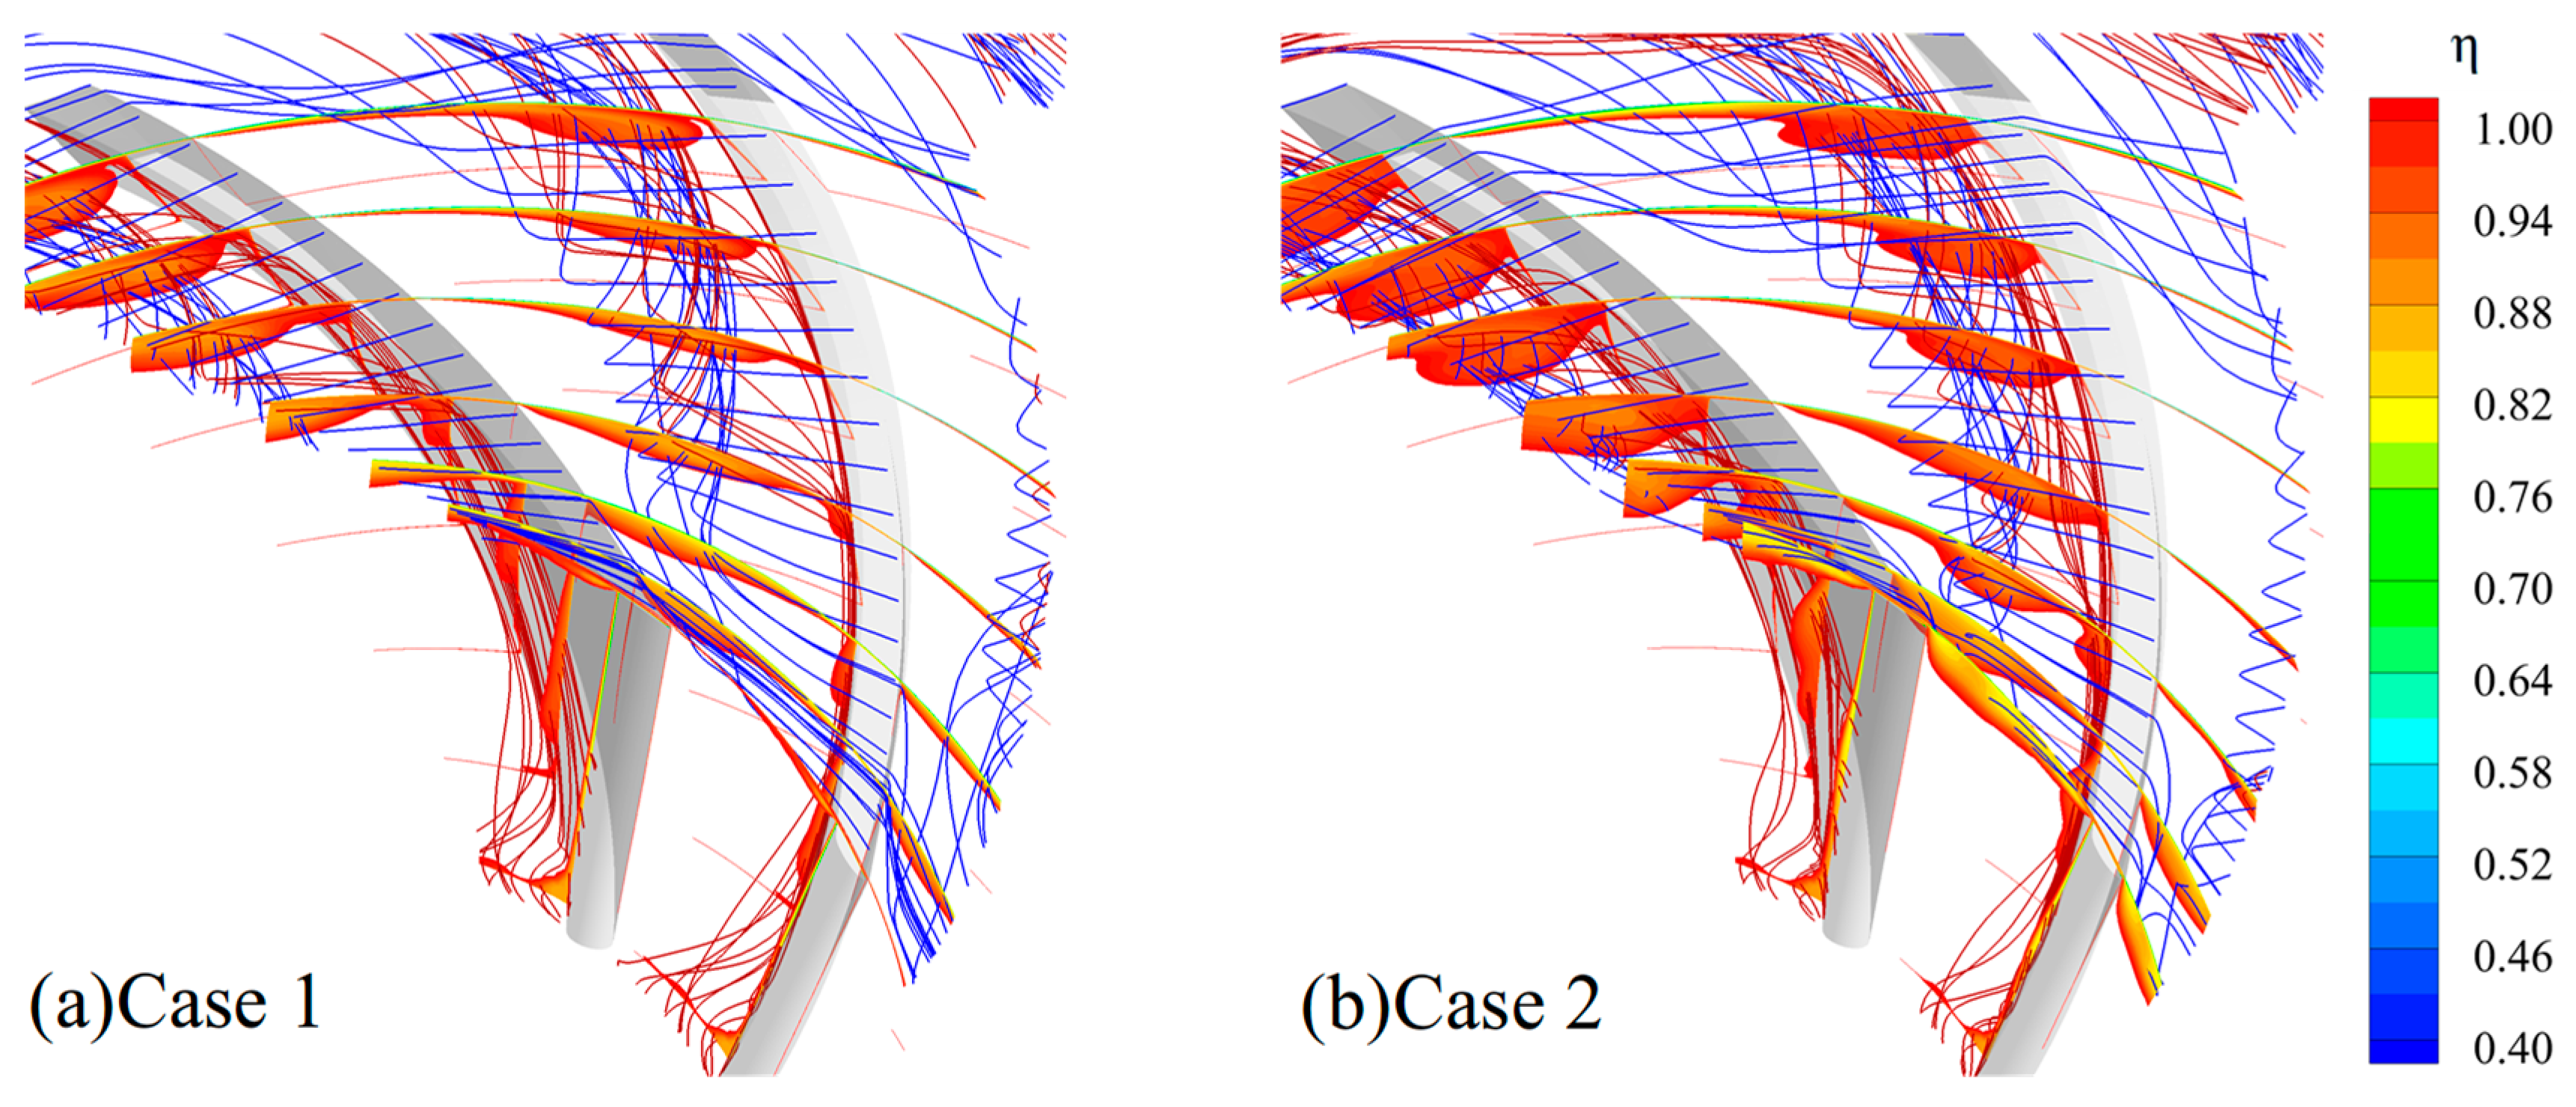
In Figure 8, the dimensionless time-averaged entropy field and streamline distribution for Case 1 and Case 2 are compared. High-entropy regions within the centrifugal impeller are primarily observed in the blade tip region and on the impeller suction surface. The losses on the impeller suction surface are mainly attributed to flow separation in the hub-corner region, formed by the hub and the suction surface. When this fluid enters the impeller, it is affected by the impeller passage geometry and undergoes significant radial turning. Under the combined influence of centrifugal force and the main flow, the low-energy fluid is directed along the mid-section of the impeller suction surface toward the rear of the passage. Concurrently, at the blade tip, tip leakage flow is observed to emerge from the suction surface and approach the pressure surface of the adjacent blade. As the flow progresses, the centrifugal force is intensified, causing the tip leakage flow to roll up in the mid-blade region. This results in the entrainment of low-energy fluid from the hub-corner separation, which is subsequently directed toward the rear of the impeller suction surface. Based on the analysis of the main flow within the impeller passage, a comparison between Figure 8a,b indicates that, as the compressor throttling process progresses, the high-entropy region in the leading-edge tip area is significantly advanced. Simultaneously, the high-entropy area resulting from hub-corner separation on the mid-blade suction surface is increased, leading to a reduction in the effective flow area within the passage and indirectly contributing to passage instability. However, it is established that the primary source of unsteady fluctuations is derived from the interaction between tip leakage flow and the adjacent blade loading, as corroborated by previous studies [16,18].
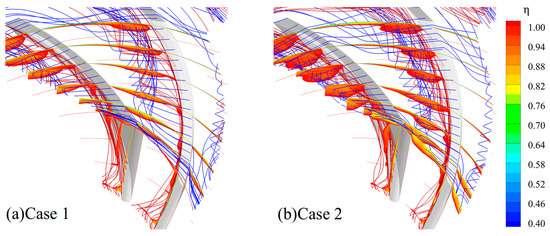
Figure 8.
Non-dimensional entropy and streamlines on the S3 streamsurface for Case 1 and Case 2.
The Mach number and static pressure distribution in the tip region can well observe the shape of the tip leakage flow. In this paper, the pressure coefficient was used to treat the static pressure dimensionlessly:
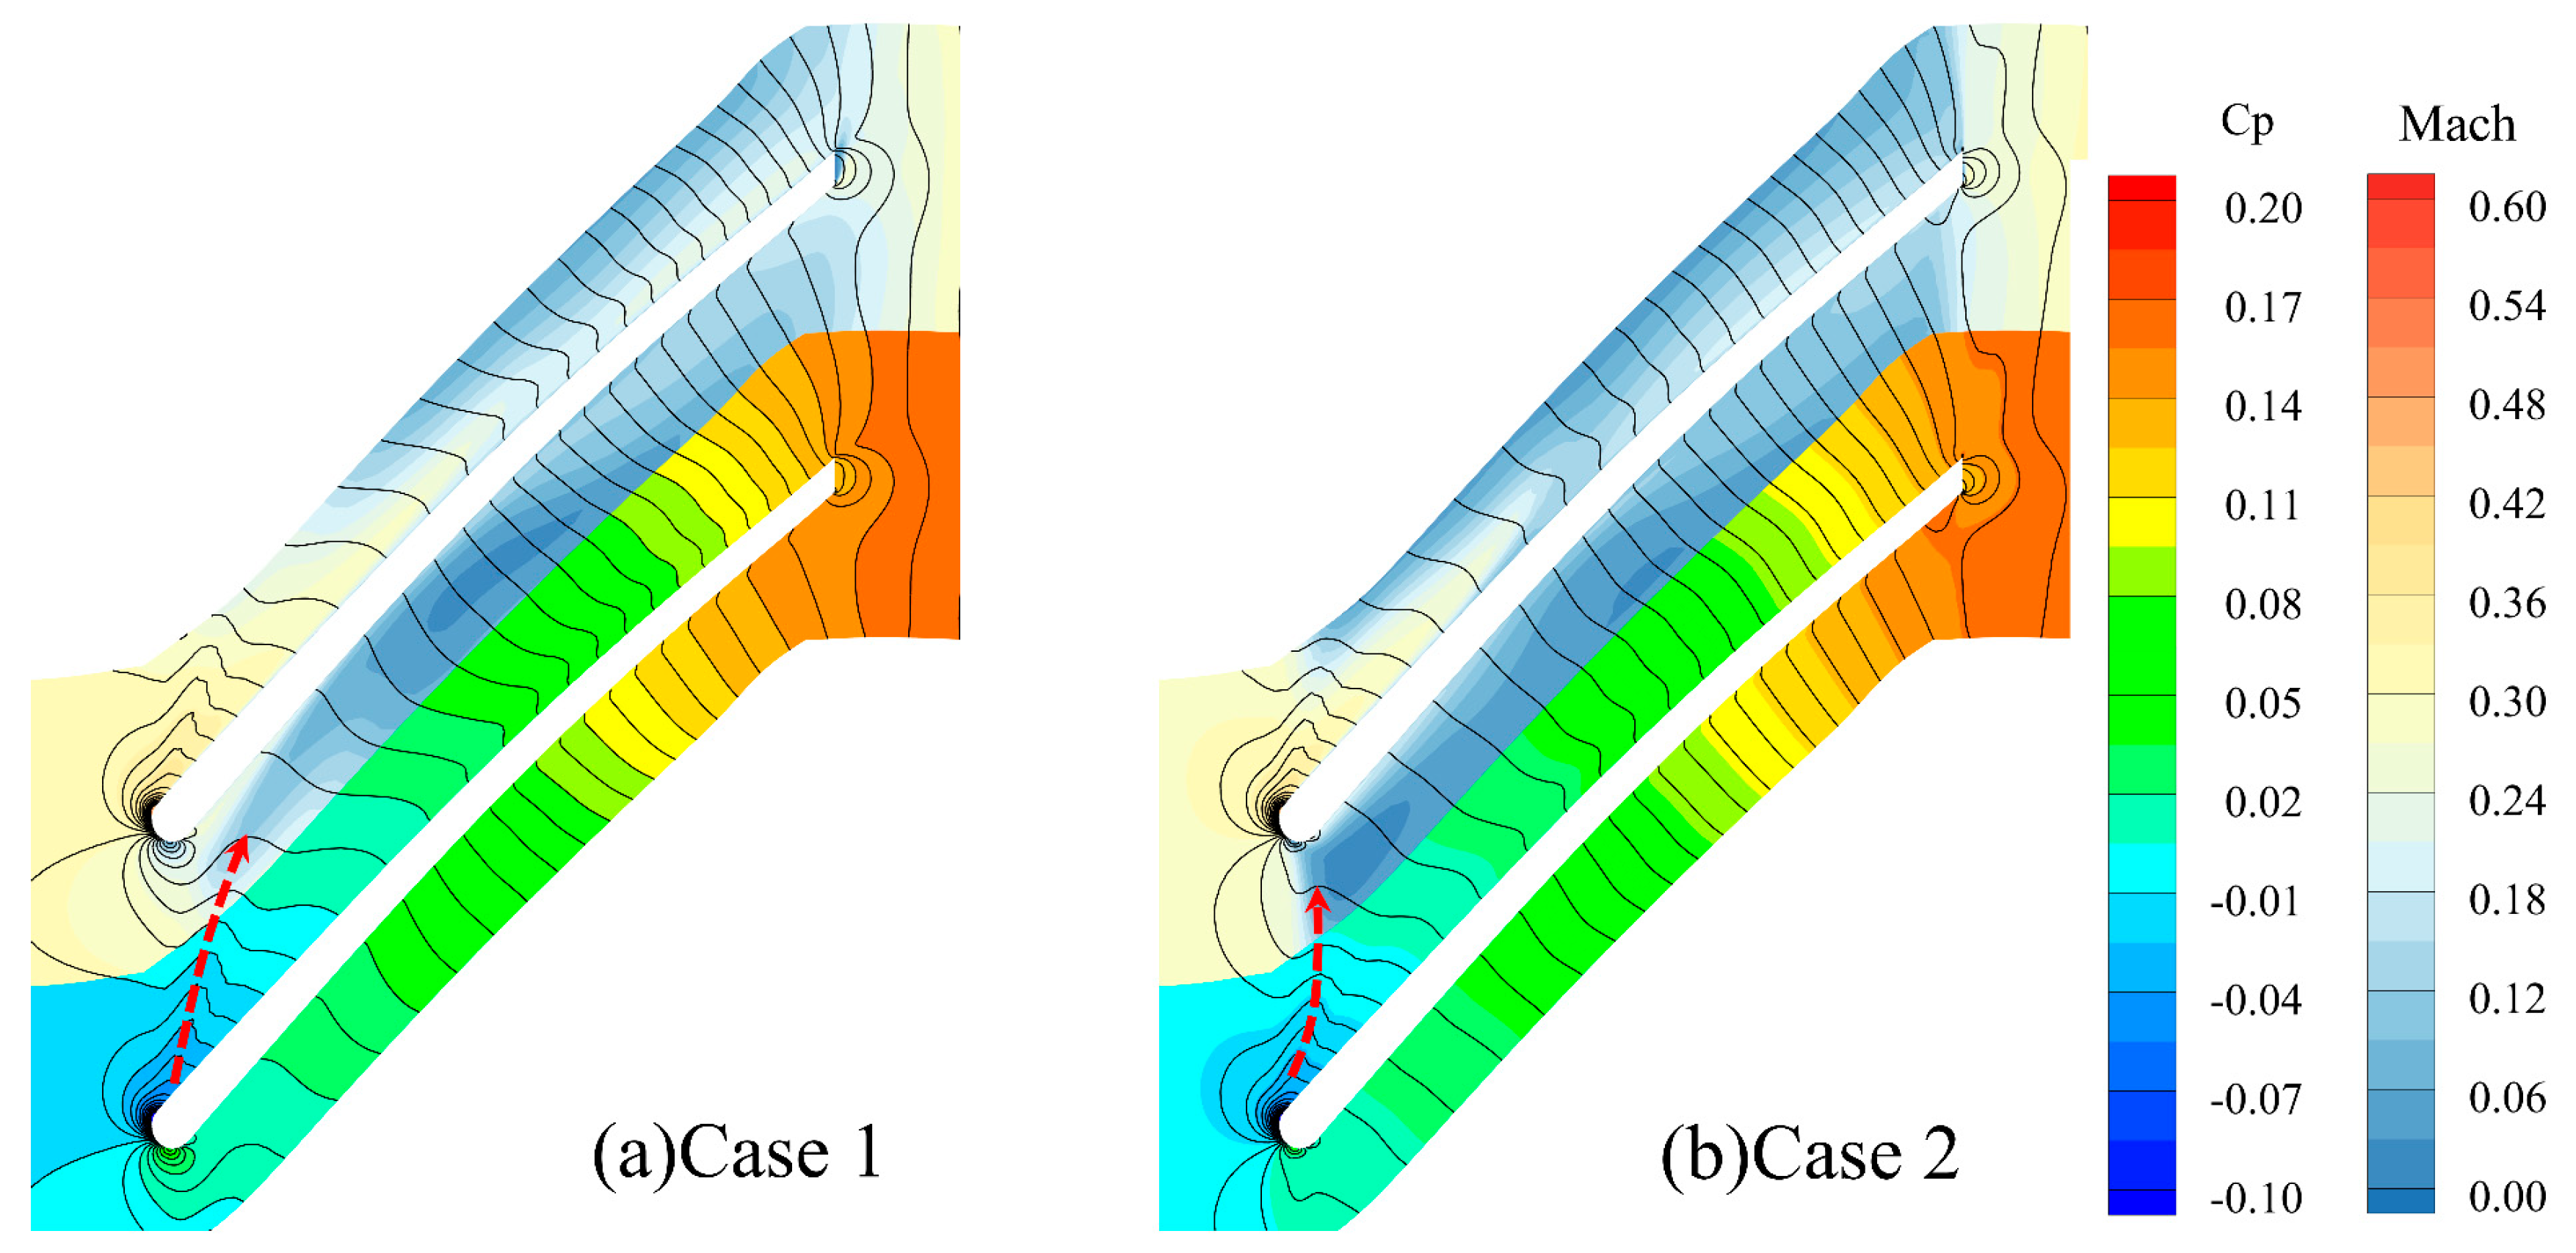
where is the static pressure distribution at a certain point in the passage, and represent the time-averaged static pressure and total pressure at the entrance of the passage, respectively. In Figure 9, the distributions of Mach number and static pressure coefficient at 95% relative blade height are presented. After the tip leakage flow exits the suction surface, a low-speed zone is formed in the front half of the passage near the pressure side of the adjacent blade. As the compressor throttling process progresses, the area of this low-speed zone is significantly expanded and shifted forward. Furthermore, the trajectory of the tip leakage flow, indicated by the bulge in the pressure contour lines, is observed to deflect toward the leading edge as the compressor flow rate is reduced. The pressure in the blade leading-edge passage is significantly increased due to the high adverse pressure gradient originating from the split flow field in the rear half of the passage.
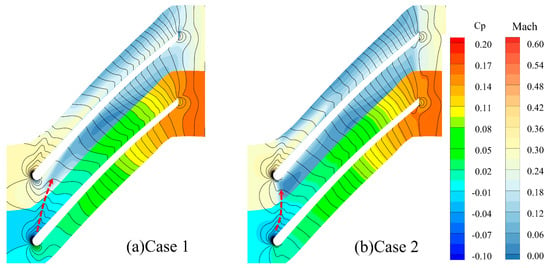
Figure 9.
Static pressure coefficient and Mach number at 95% span for Case 1 and Case 2. Dashed arrows indicate tip leakage trajectories.
4.2. Transient Characteristics in the Passage
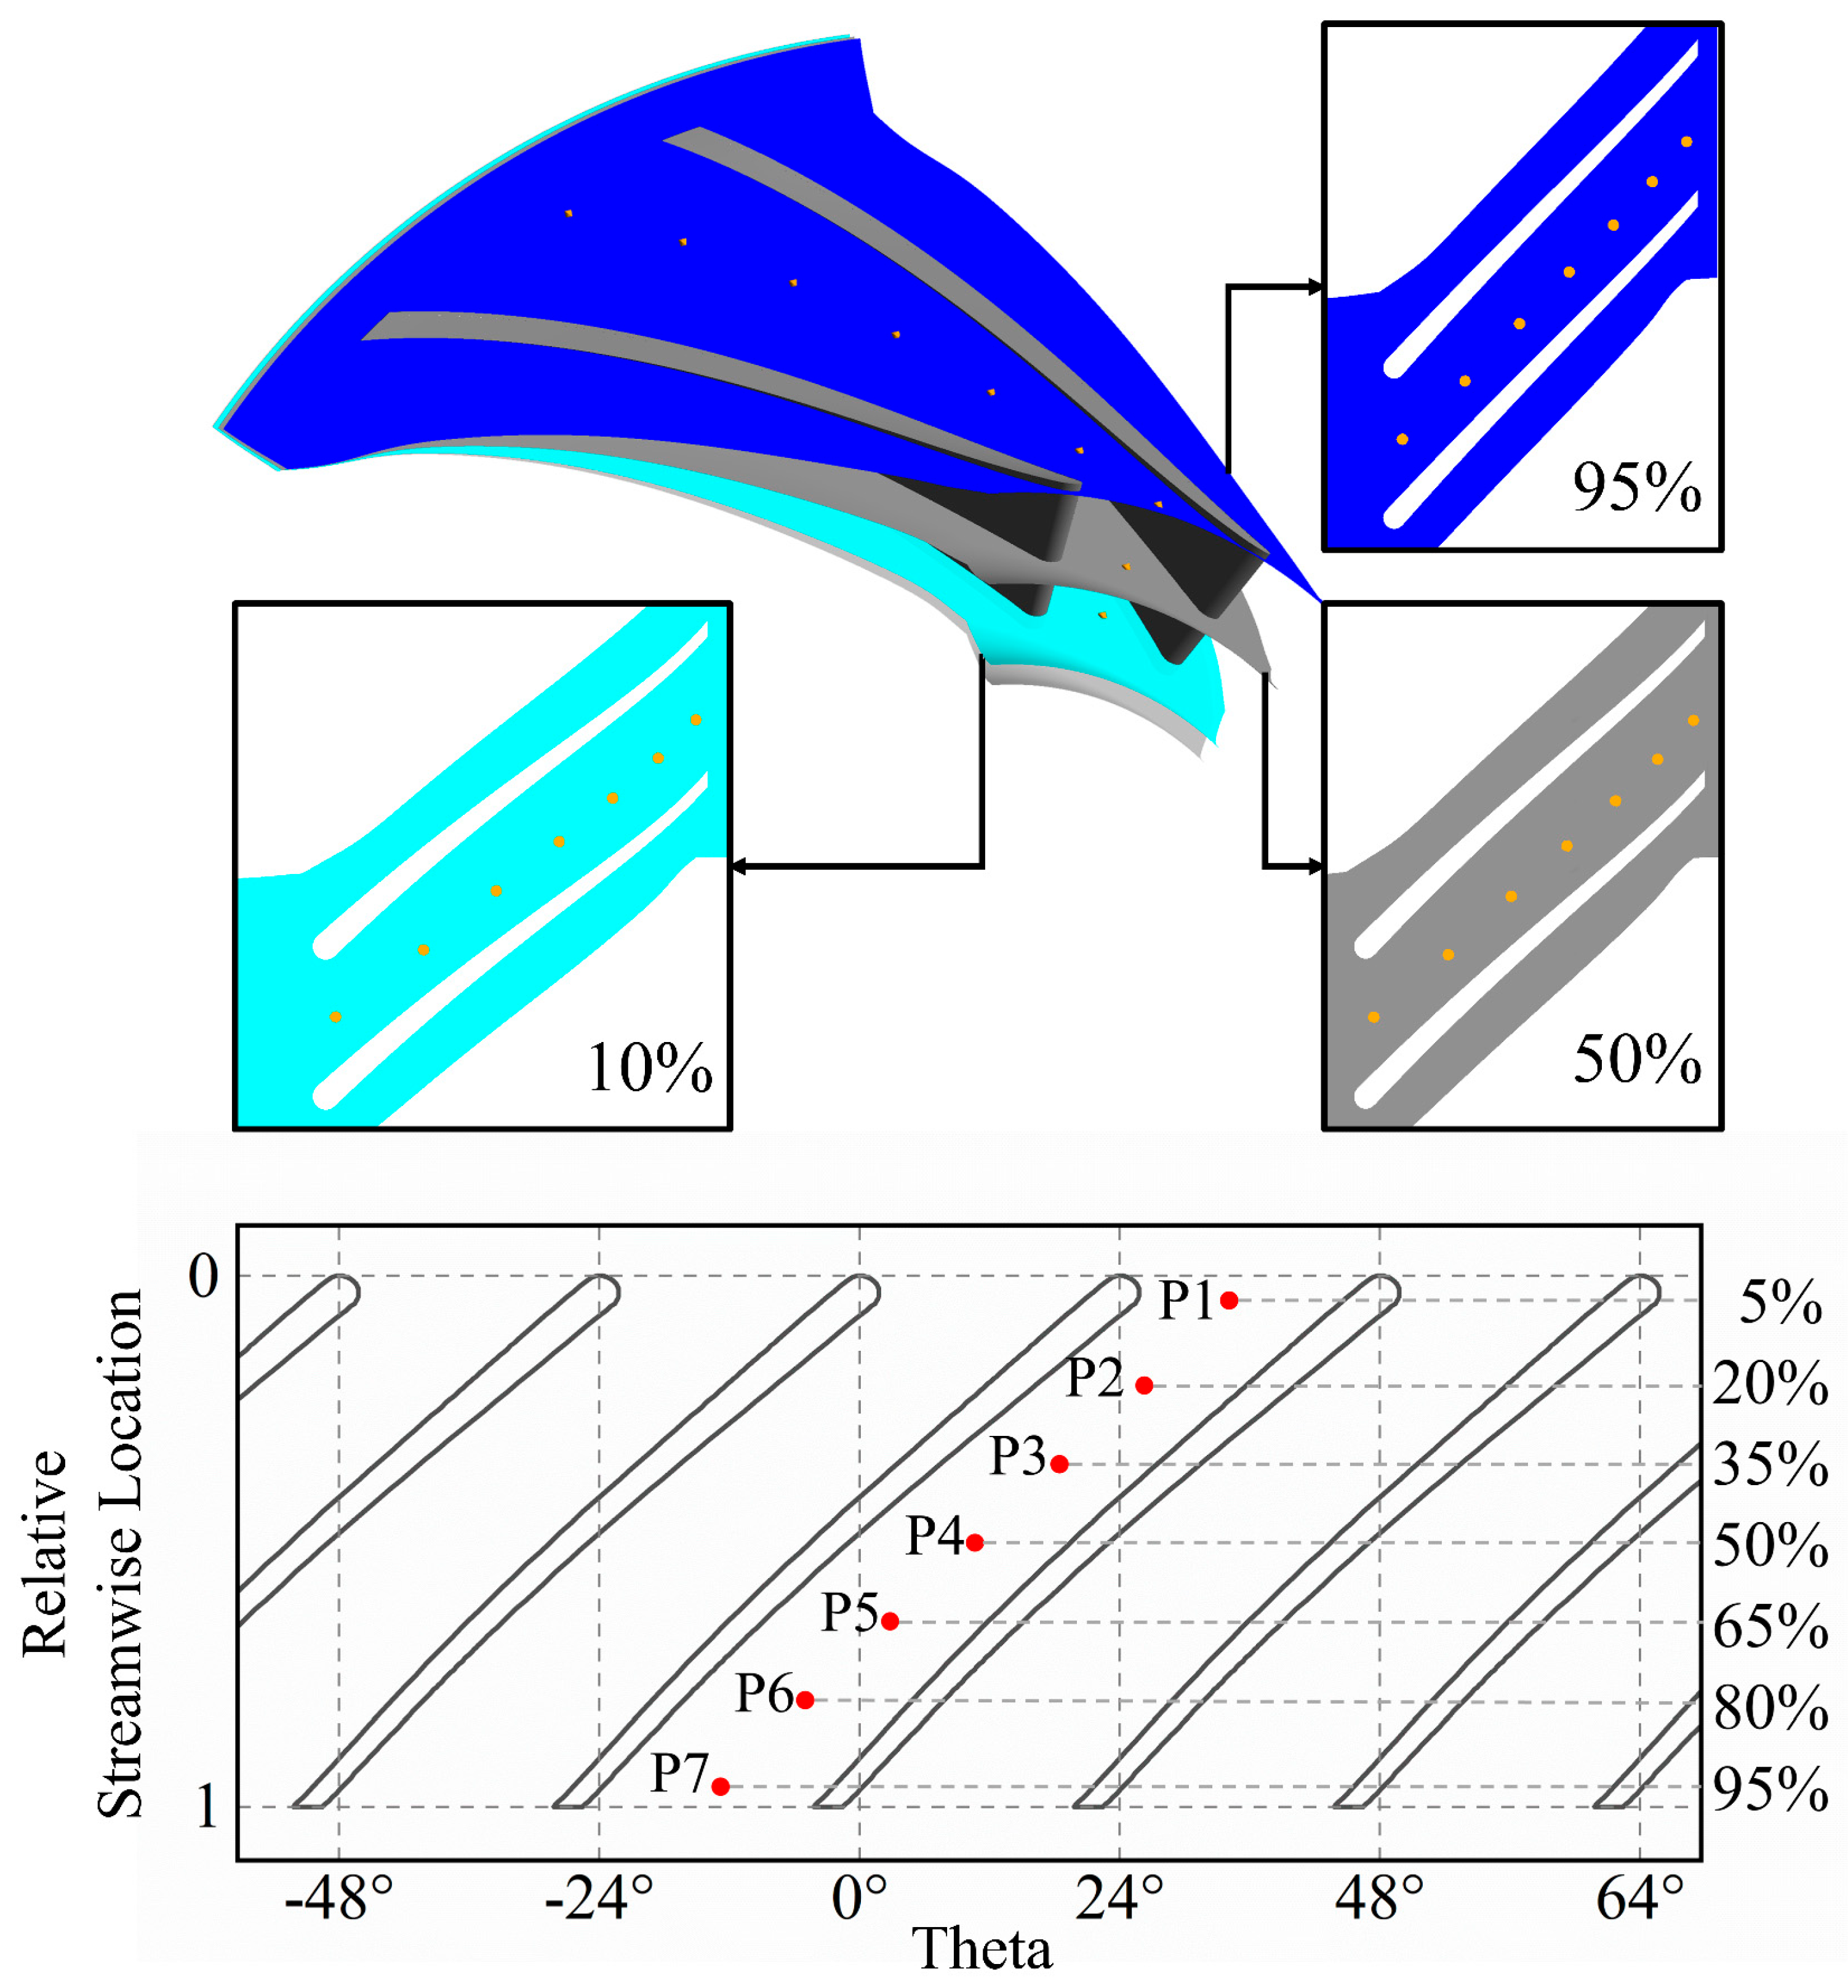
To capture the unsteady characteristics inside the passage, static pressure measuring points were selected at 95%, 50%, and 5% relative blade heights. In the middle of the blade passage, seven measuring points were arranged at each of these radial positions, from the leading edge to the trailing edge, labeled P1 to P7, respectively, as shown in Figure 10.
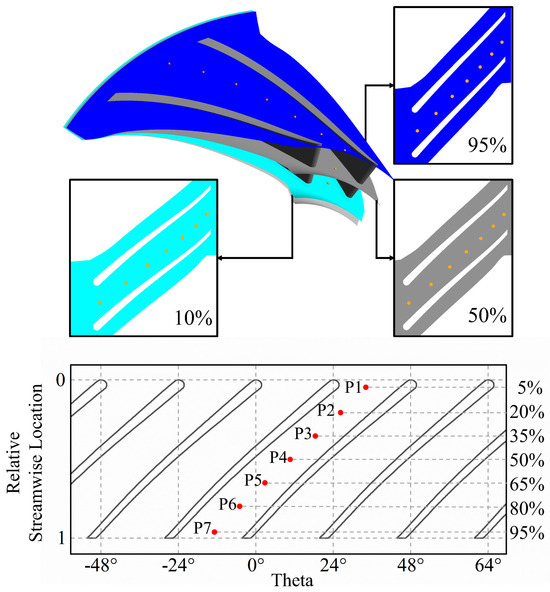
Figure 10.
Arrangement of monitoring points in the flow passage.
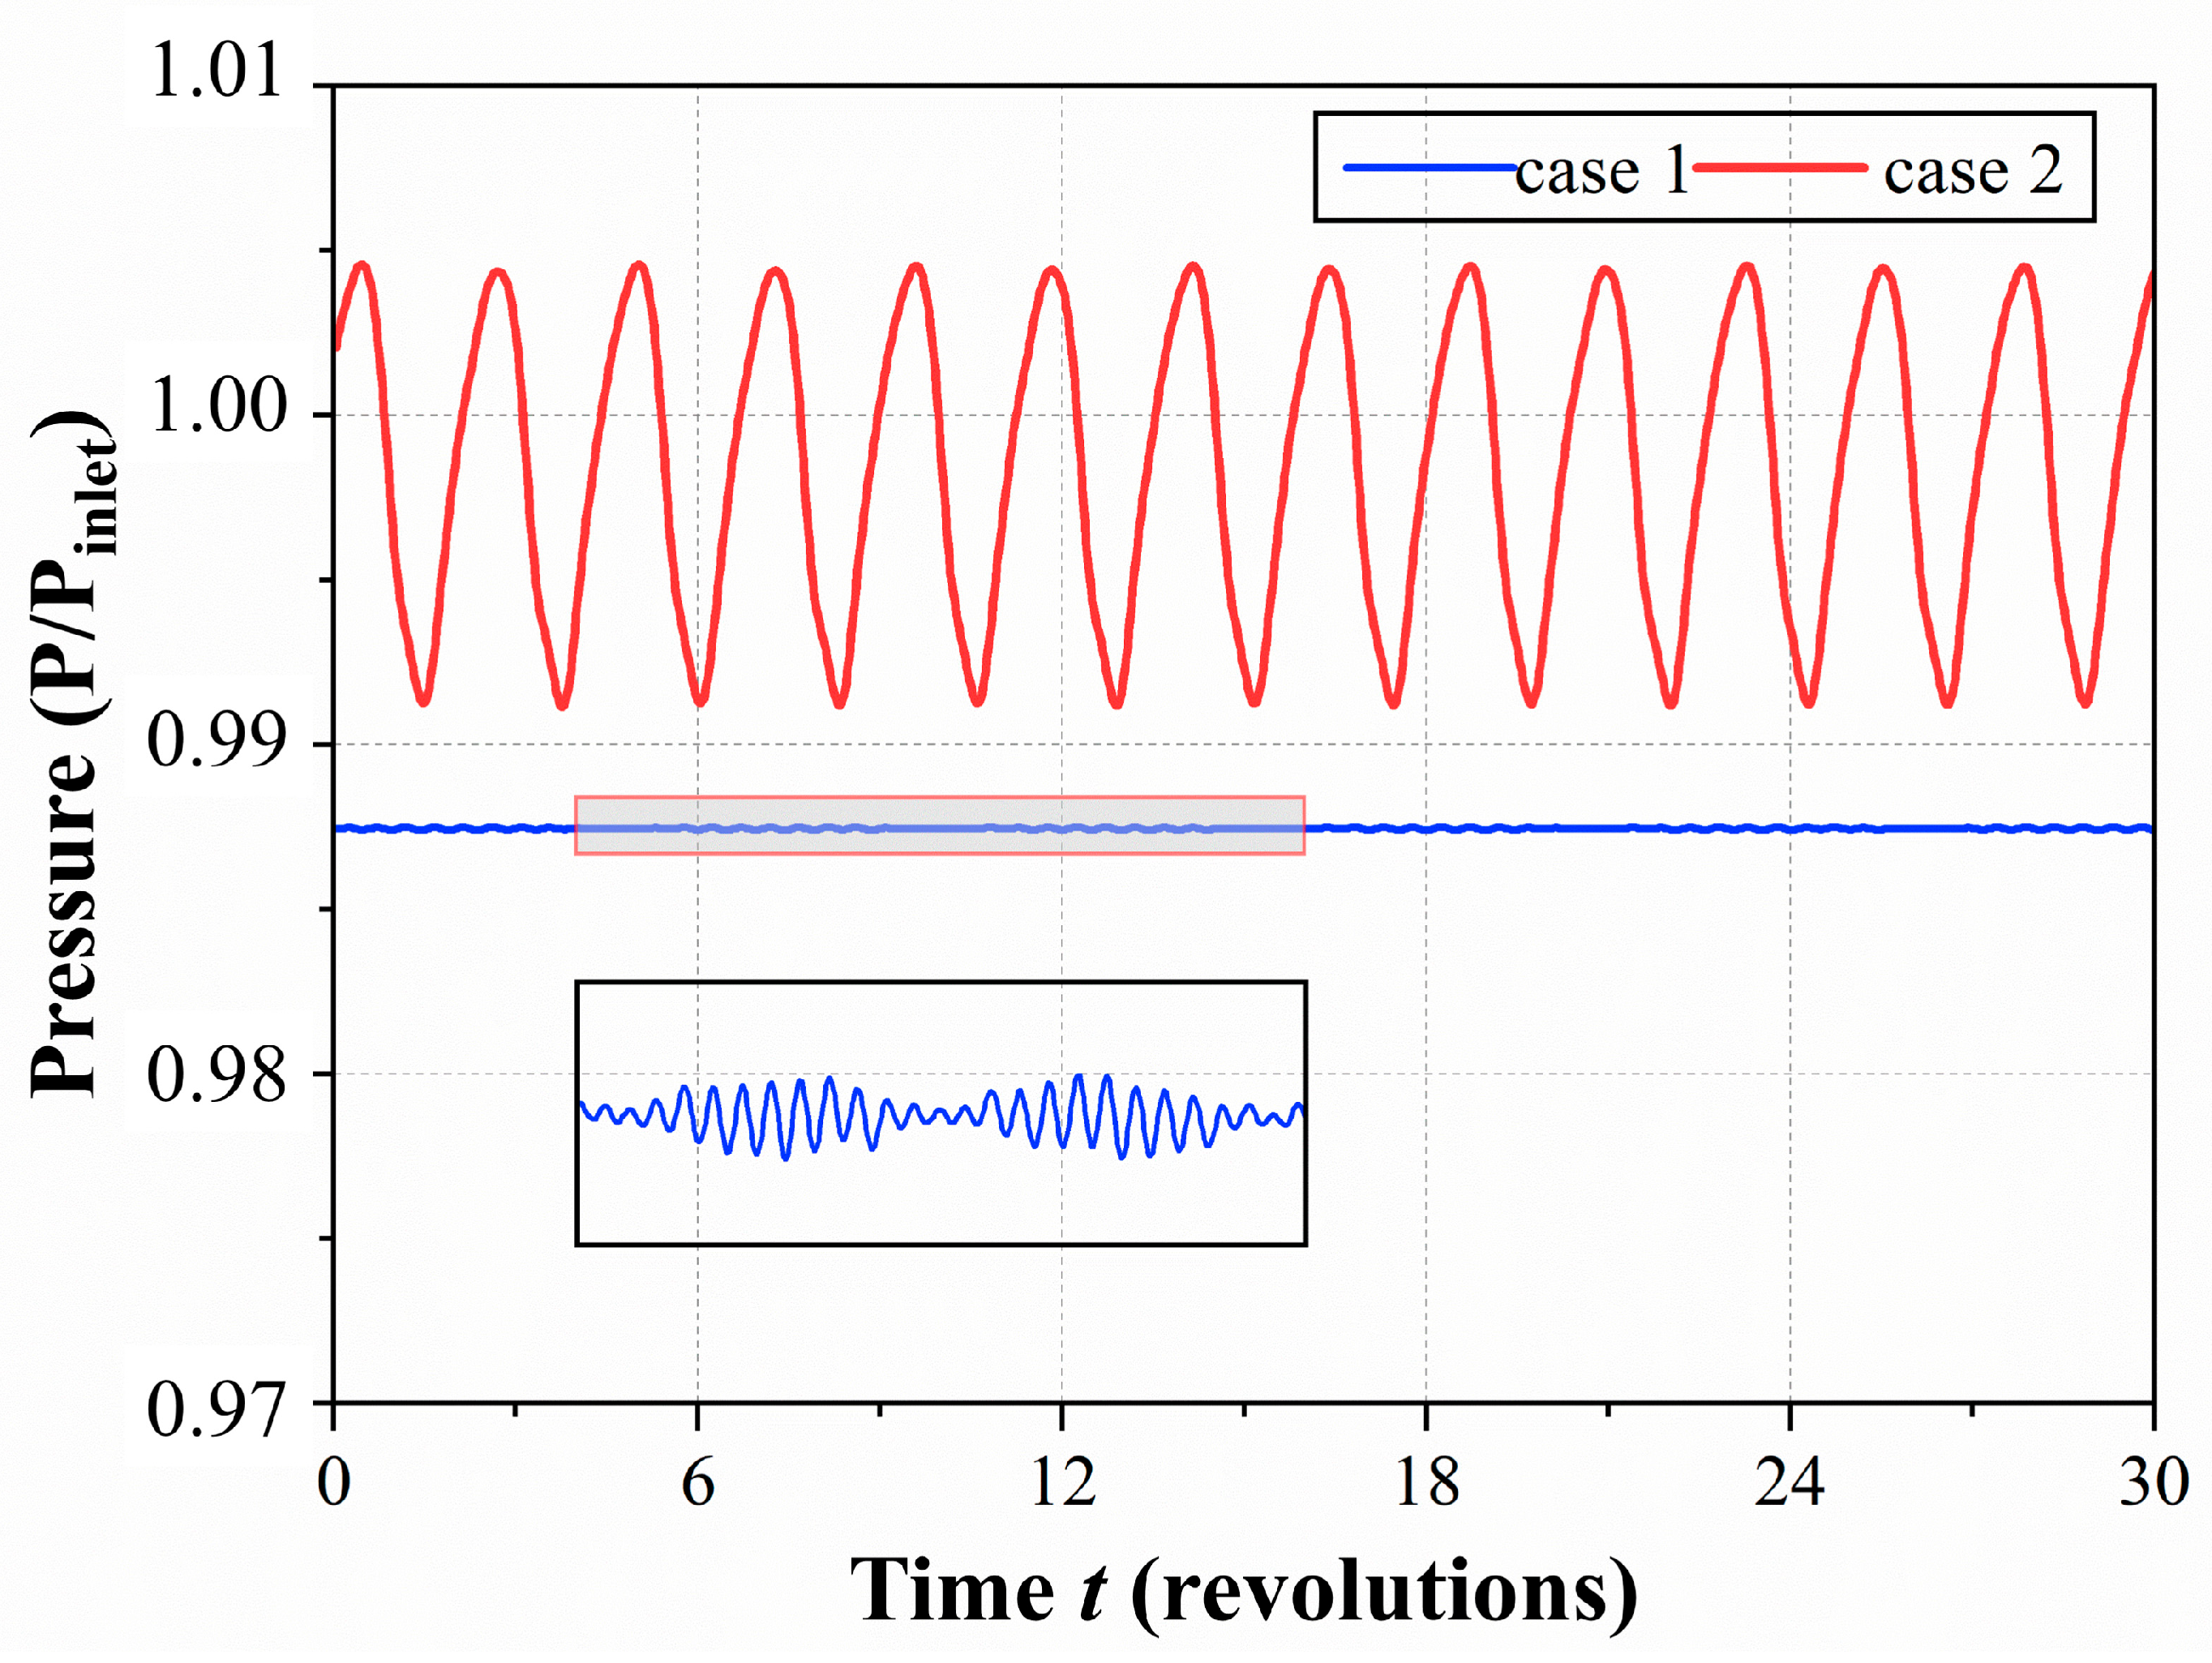
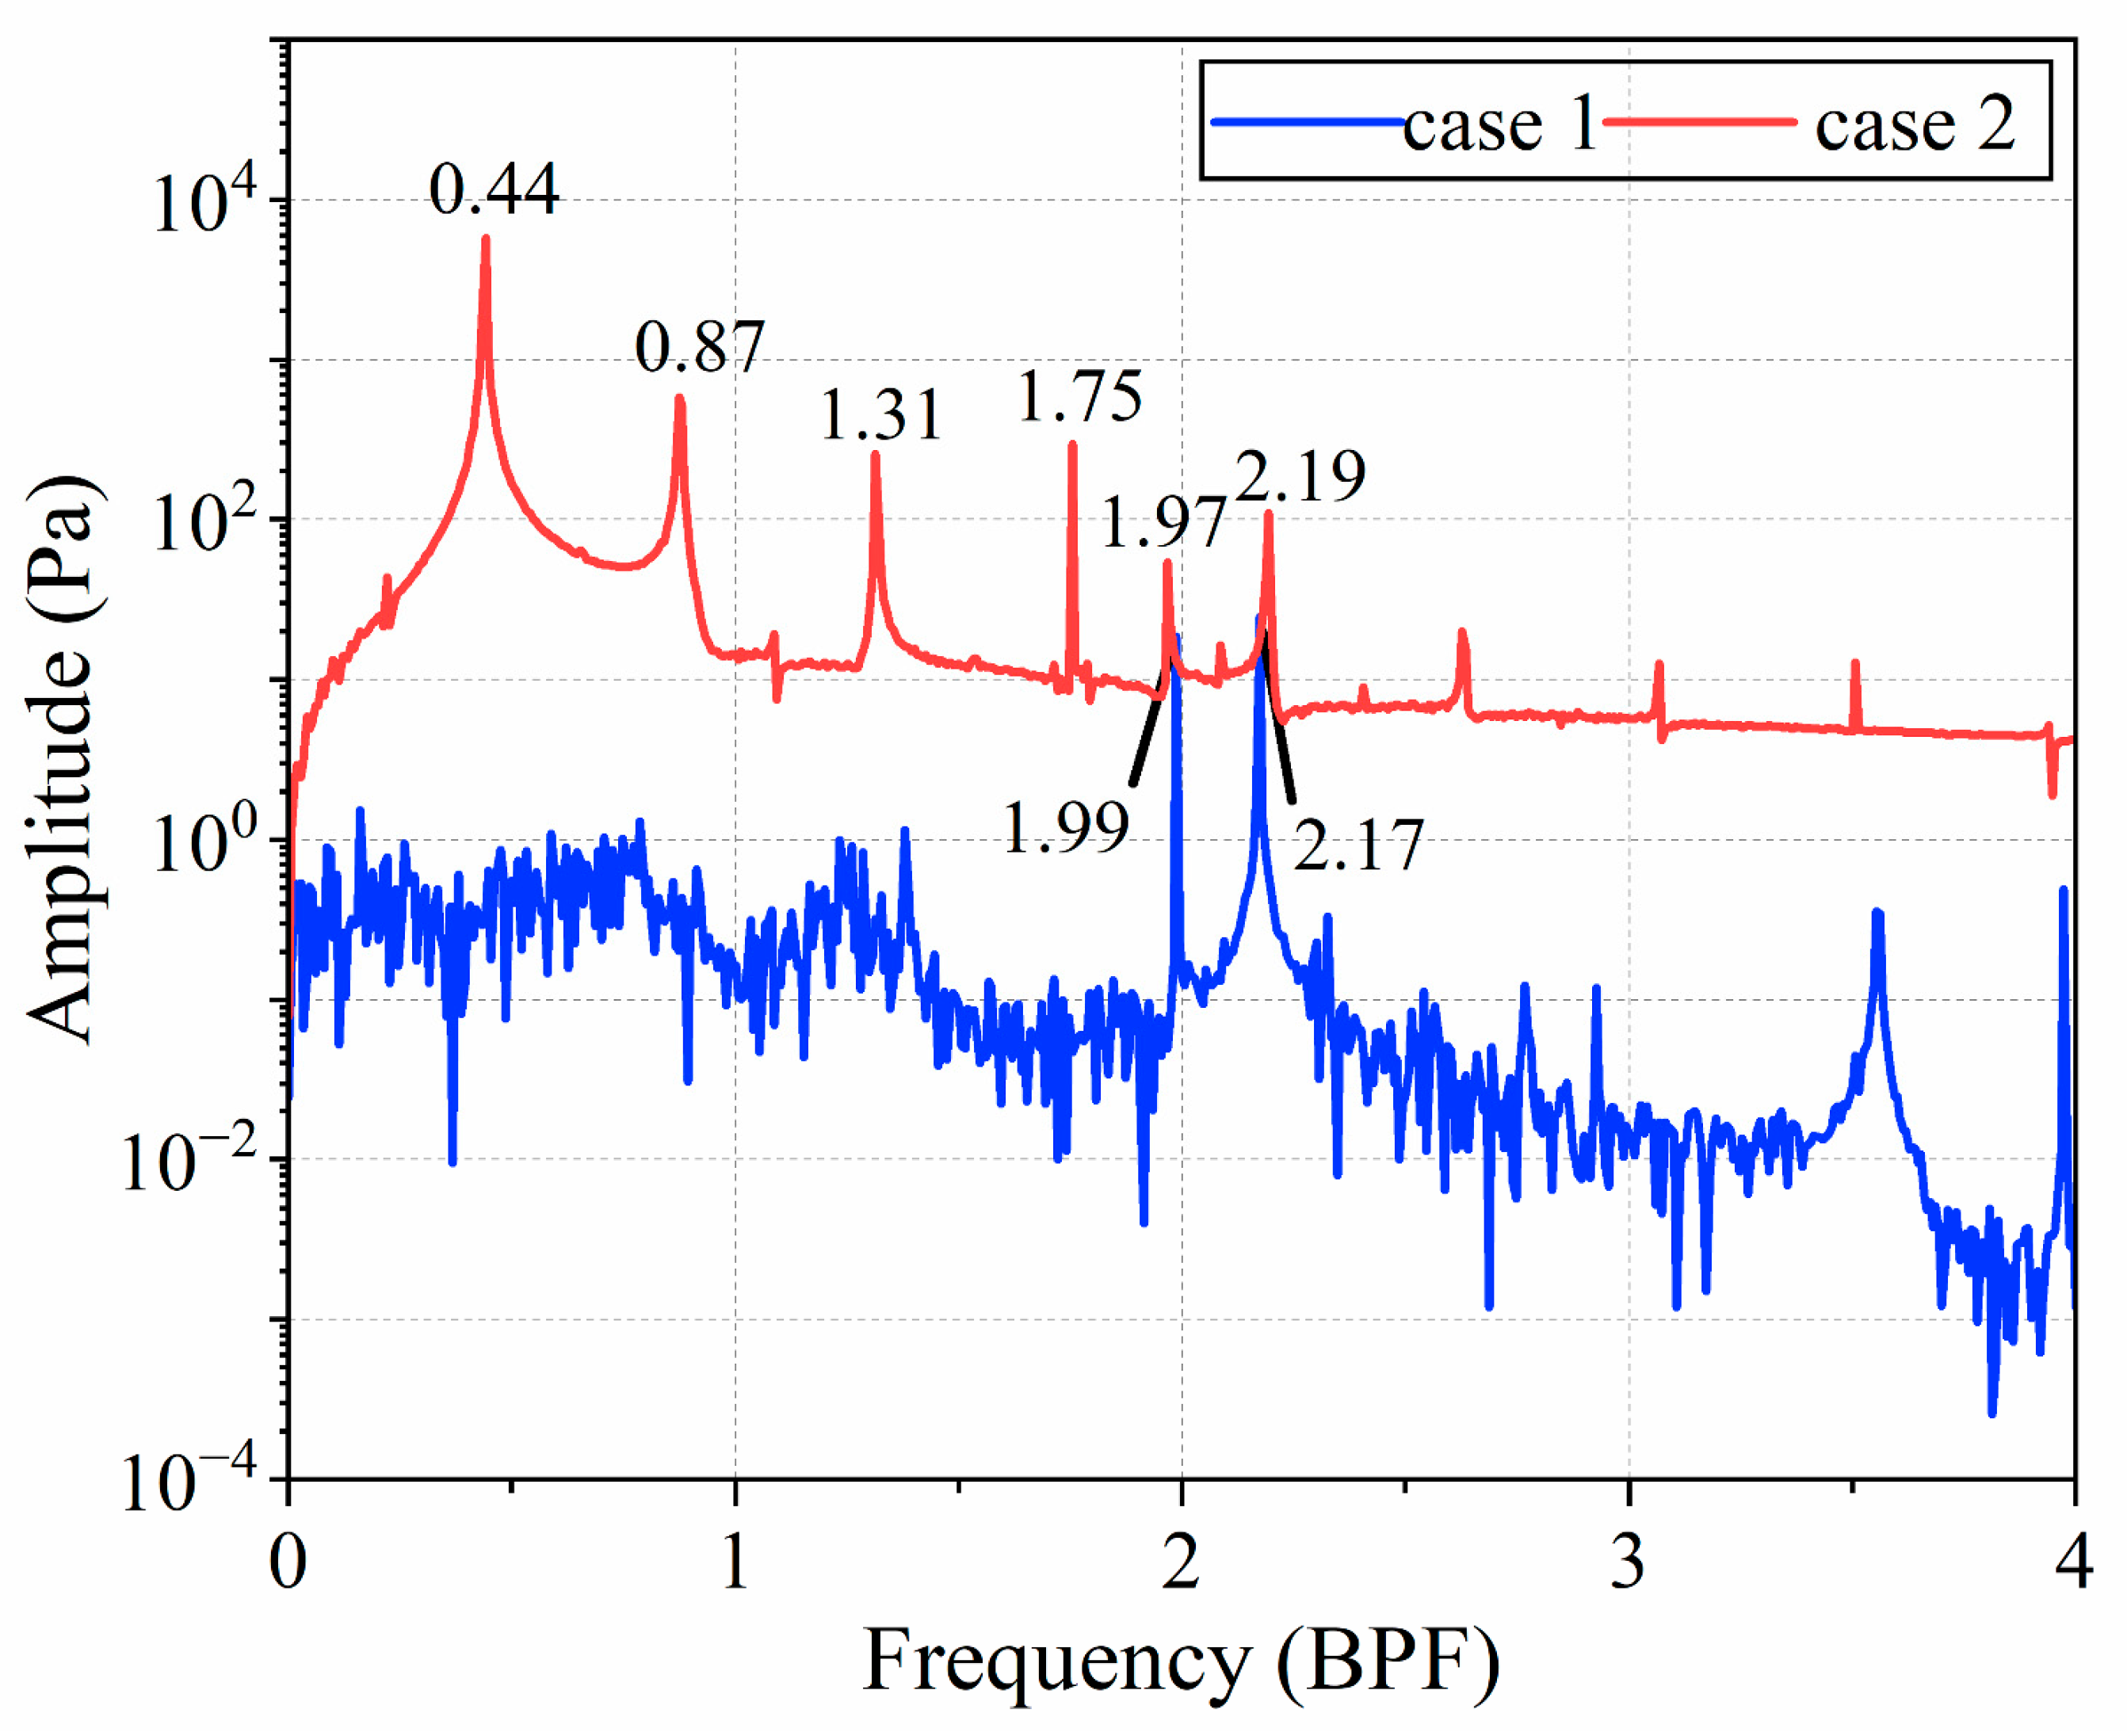
In Figure 11, the static pressure fluctuation curve at the tip position P1 over 30 rotor rotation cycles is presented. Under Case 1 conditions, the amplitude of static pressure fluctuations is observed to be low, with a high frequency. In contrast, under Case 2 conditions, the amplitude in the tip region is significantly increased, with a time interval of 2.3 rotor rotation cycles between adjacent peaks. The static pressure fluctuations from both cases are transformed using Fast Fourier Transform (FFT), as illustrated in Figure 12. For Case 1, the amplitude is found to be small, with dominant frequencies concentrated at 1.99 BPF and 2.17 BPF, attributed to the high-frequency fluctuations of the tip leakage flow induced by turbulence characteristics. For Case 2, the dominant frequency is determined to be 0.44 BPF, with other high-amplitude frequencies primarily consisting of harmonics of 0.44 BPF. These frequency distribution characteristics, exhibiting harmonic multiples, are indicative of interactions among flow structures at the tip position.
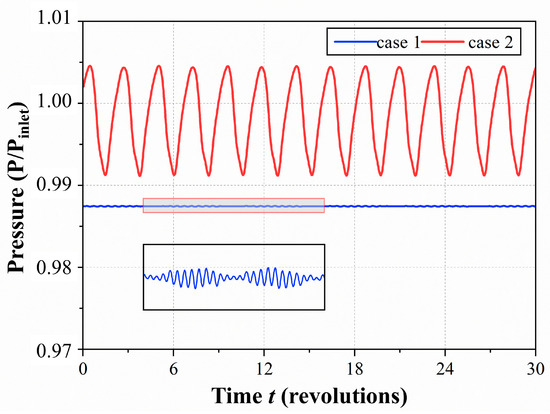
Figure 11.
Periodic fluctuations about the static pressure.
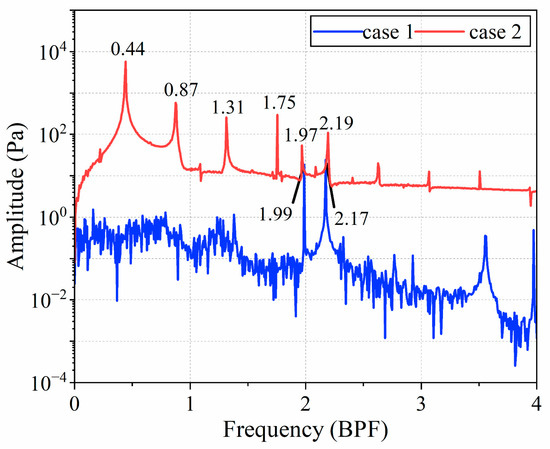
Figure 12.
Pressure spectrum in the tip region for Case 1 and Case 2.
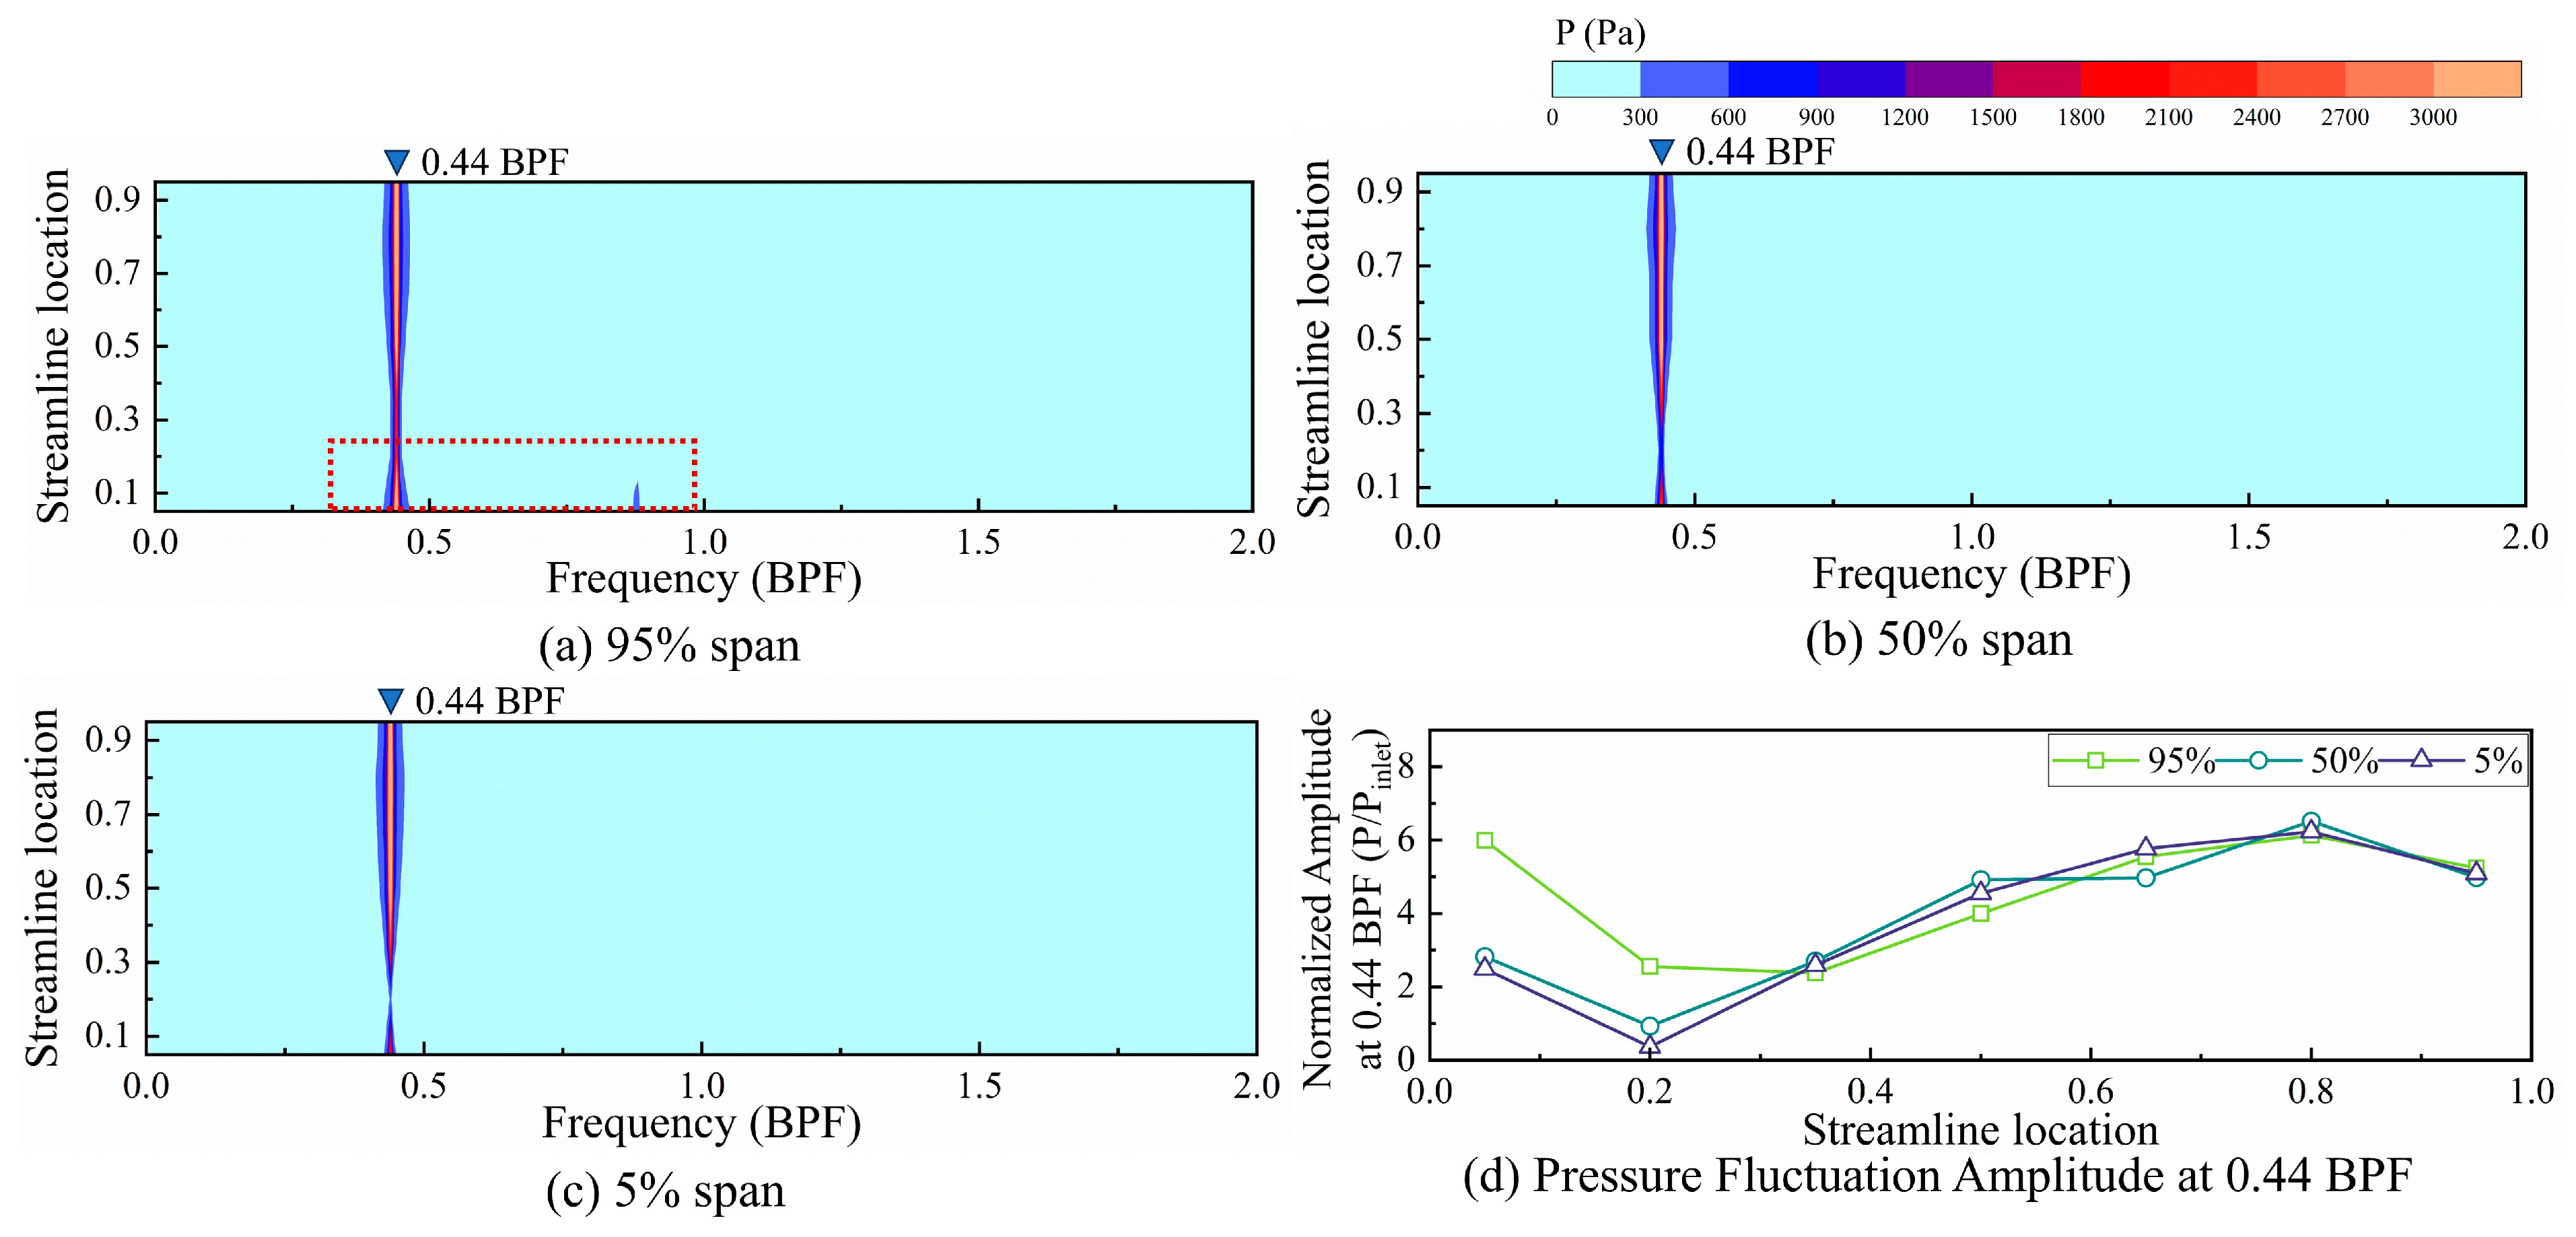
In Figure 13, the frequency-domain characteristics of static pressure fluctuations at different locations within the passage were analyzed, specifically at 95%, 50%, and 10% relative blade heights. As observed in Figure 13a–c, pronounced pressure fluctuations with a frequency of 0.44 BPF were identified throughout the entire passage. It was noted that at the leading edge, pressure fluctuations were primarily concentrated at the blade tip, with significantly reduced fluctuations at the blade root. In the downstream portion of the passage, significant pressure fluctuations were observed across all blade heights. Moreover, only at the leading-edge blade tip were frequency characteristics exhibiting harmonic multiples detected. Figure 13d illustrates the amplitude distribution of the 0.44 BPF at different spatial locations. It was found that the amplitude of pressure fluctuations at the leading edge blade tip was significantly higher than at other blade heights. However, within the passage beyond 30% relative chord length, the fluctuation patterns were largely consistent across different locations.
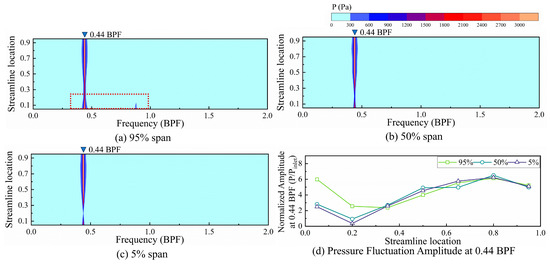
Figure 13.
Pressure spectrum at different spanwise and streamwise locations for Case 2.
4.3. Unstable Flow Structure in Passage
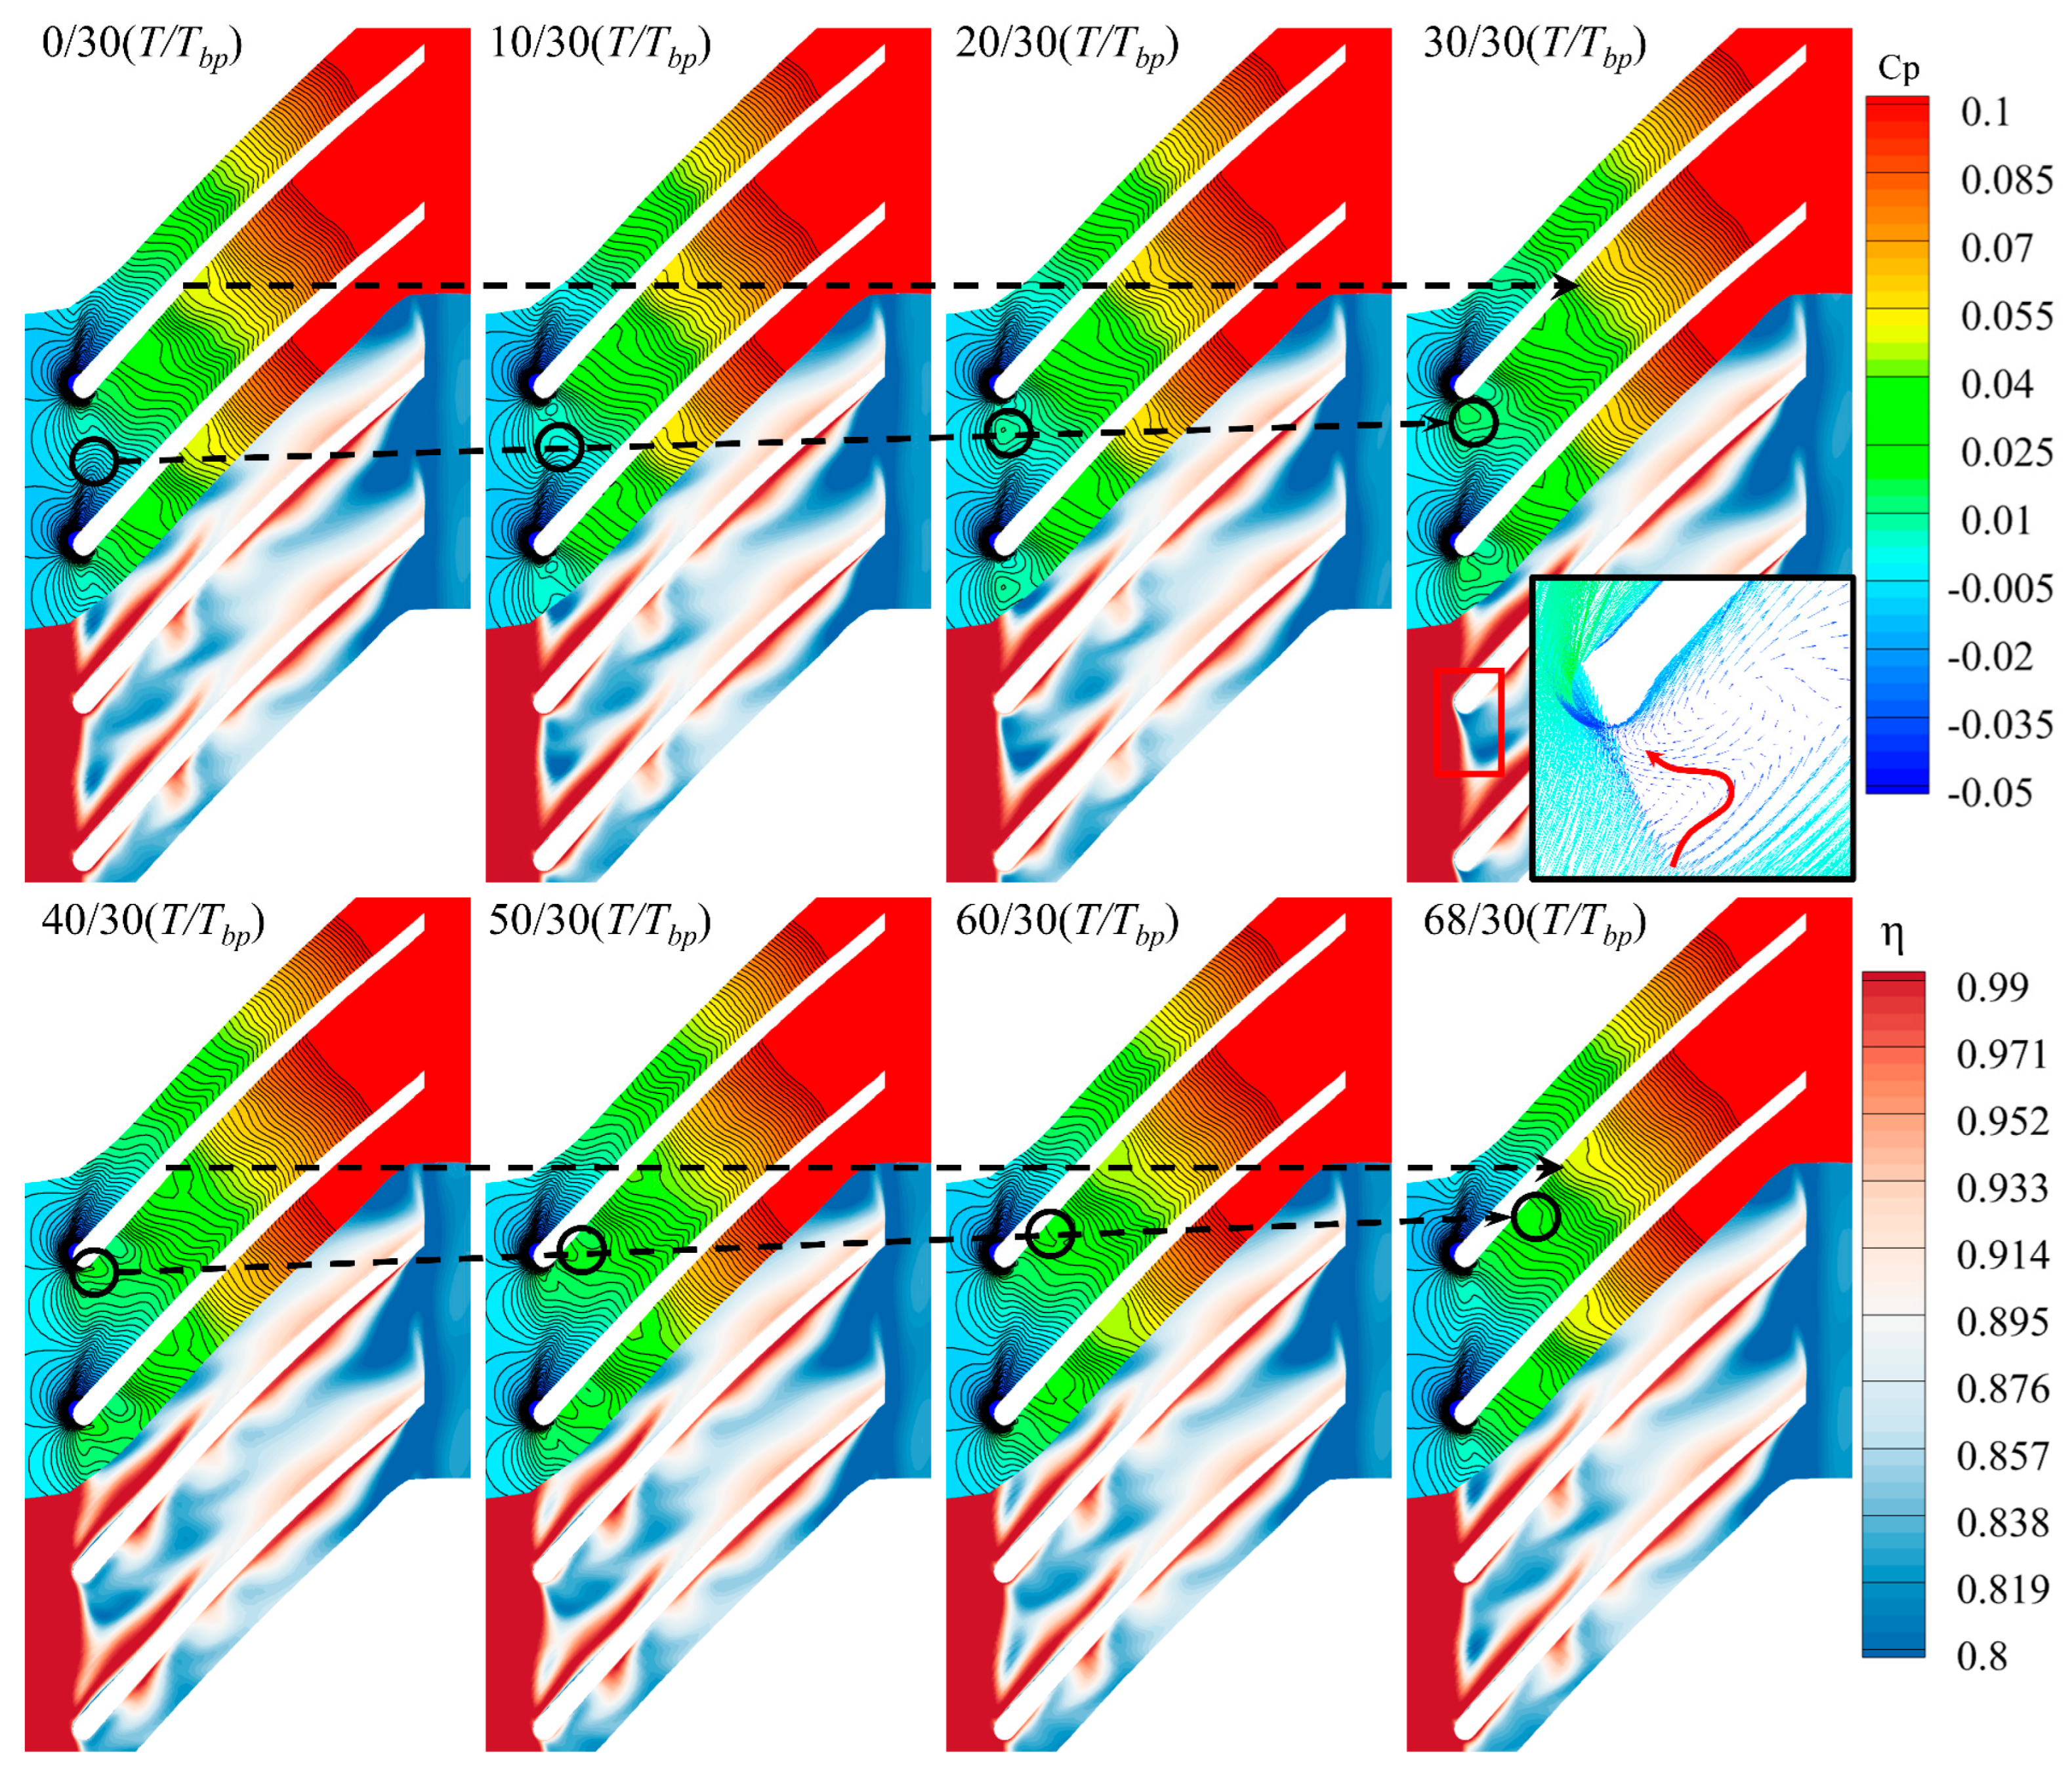
In the upper part of Figure 14, the evolution of the static pressure coefficient within the blade passage over one fluctuation period is illustrated. A thick dotted line is employed to highlight the pressure fluctuations within the blade passage at a specific location. It is observed that, over time, the static pressure contours within the passage exhibit periodic oscillations, consistent with the pressure fluctuations analyzed across the entire blade passage in previous sections. This behavior is attributed to the following mechanism: during one fluctuation period, work is imparted to the airflow by the blade, resulting in an increase in passage internal pressure and a rise in the adverse pressure gradient. Consequently, the tip leakage flow trajectory is shifted forward. Low-energy fluid is accumulated on the pressure surface of the adjacent blade’s leading edge and is spilled into the flow passage. As a result, the blade’s work capacity is reduced, the passage pressure is decreased, and the tip leakage flow is redirected back into the blade passage.
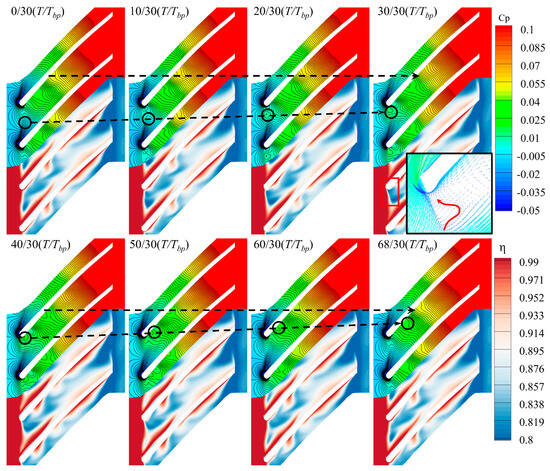
Figure 14.
Temporal evolution of pressure coefficient and non-dimensional entropy at 95% span.
In Figure 14, the evolution of the tip leakage flow is depicted using thin dashed lines and circles. At the instant of (10/30) T, the tip leakage flow is observed to impinge on the pressure surface of the adjacent blade. At (20/30) T, it is found to interact with the mainstream flow, resulting in the formation of a local high-pressure zone at the passage inlet. At (30/30) T, the tip leakage flow is observed to migrate to the leading edge of the pressure surface of the adjacent blade, inducing leading-edge spillage. At this point, the blade’s work capacity is reduced, while the adverse pressure gradient within the passage is minimized. The low-energy fluid, formed through the interaction between the tip leakage flow and the mainstream flow, is redirected back into the passage. This is manifested as a low-pressure region that is propagated rearward along the blade pressure surface and approaches the blade suction surface near the mid-chord, influenced by the intensified centrifugal force.
In the lower half of Figure 14, the evolution of the dimensionless entropy field is illustrated, exhibiting a distribution analogous to that of the static pressure coefficient. It is observed that the high-loss fluid mass, generated by the tip leakage flow, is accumulated at the impeller’s leading edge under the influence of elevated pressure within the passage. This fluid mass is then impinged on the pressure surface of the adjacent blade and spilled over at the leading edge. Upon the reentry of the high-loss fluid into the blade passage, the high-entropy gradient interface is propagated rearward. Concurrently, the mainstream flow is reattached to the blade’s pressure surface, thereby separating the tip leakage flow from the pressure surface.
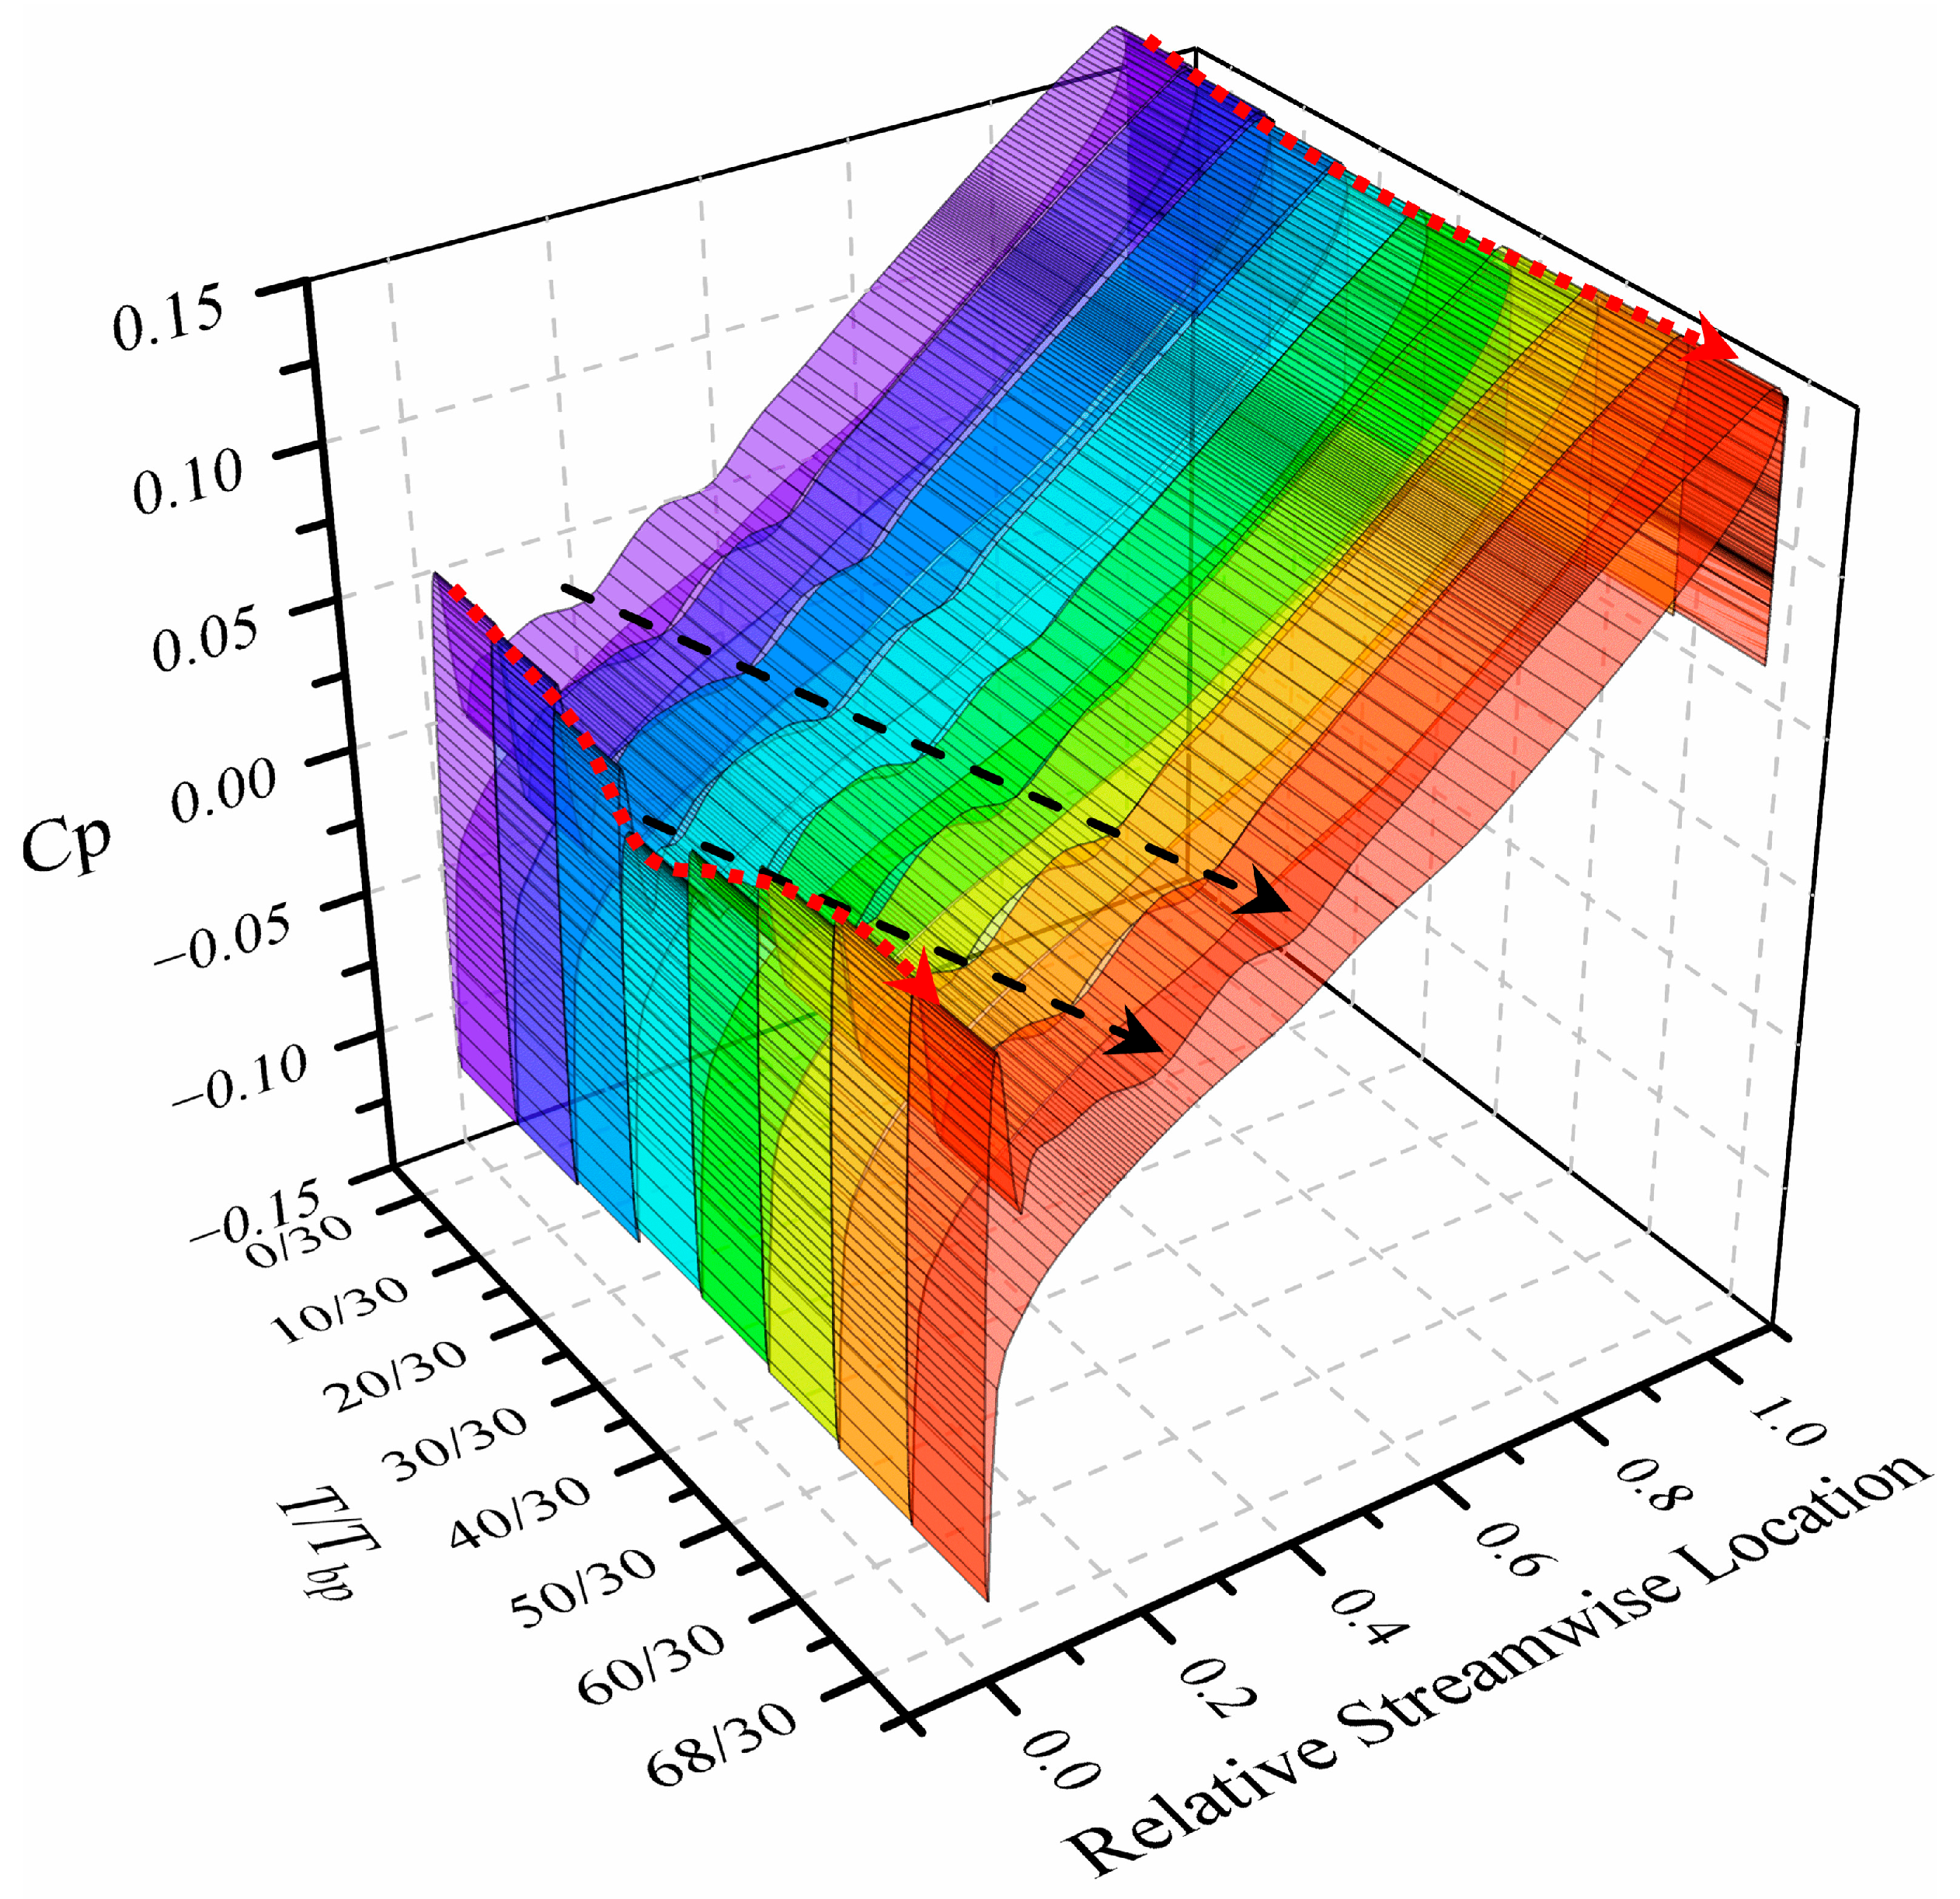
In Figure 15, the static pressure distribution at 95% relative blade height over one fluctuation period is presented. Red dotted lines are employed to highlight the pressure fluctuations at the leading and trailing edge positions of the blade. It is observed that when the low-energy fluid, generated by the tip leakage flow, comes into contact with the leading-edge pressure surface of the blade, the static pressure on that surface is slightly reduced. The amplitude of this reduction is observed to surge abruptly at (30/30) T. In other words, during the leading-edge spillage phenomenon, as noted in the preceding figure, the passage pressure is reduced to its minimum value. Upon the cessation of the leading-edge spillage, the static pressure on the leading-edge pressure surface is rapidly increased. The pressure distribution in the latter half of the blade passage is analyzed, revealing that as the tip leakage flow comes into contact with the blade’s pressure surface, the blade’s work capacity is diminished. Consequently, the static pressure on the latter-half pressure surface is decreased, reaching its minimum at the onset of leading-edge spillage. As the leading-edge pressure is increased, the static pressure in the latter half is gradually recovered, the passage pressure is elevated, and the subsequent fluctuation period is initiated.
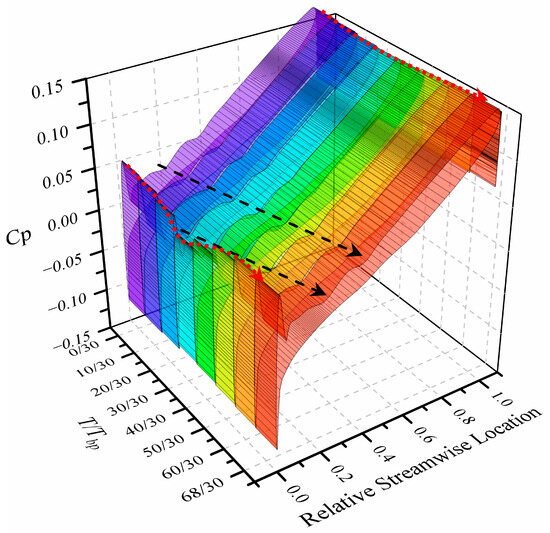
Figure 15.
Temporal evolution of static pressure on the blade surface at 95% span.
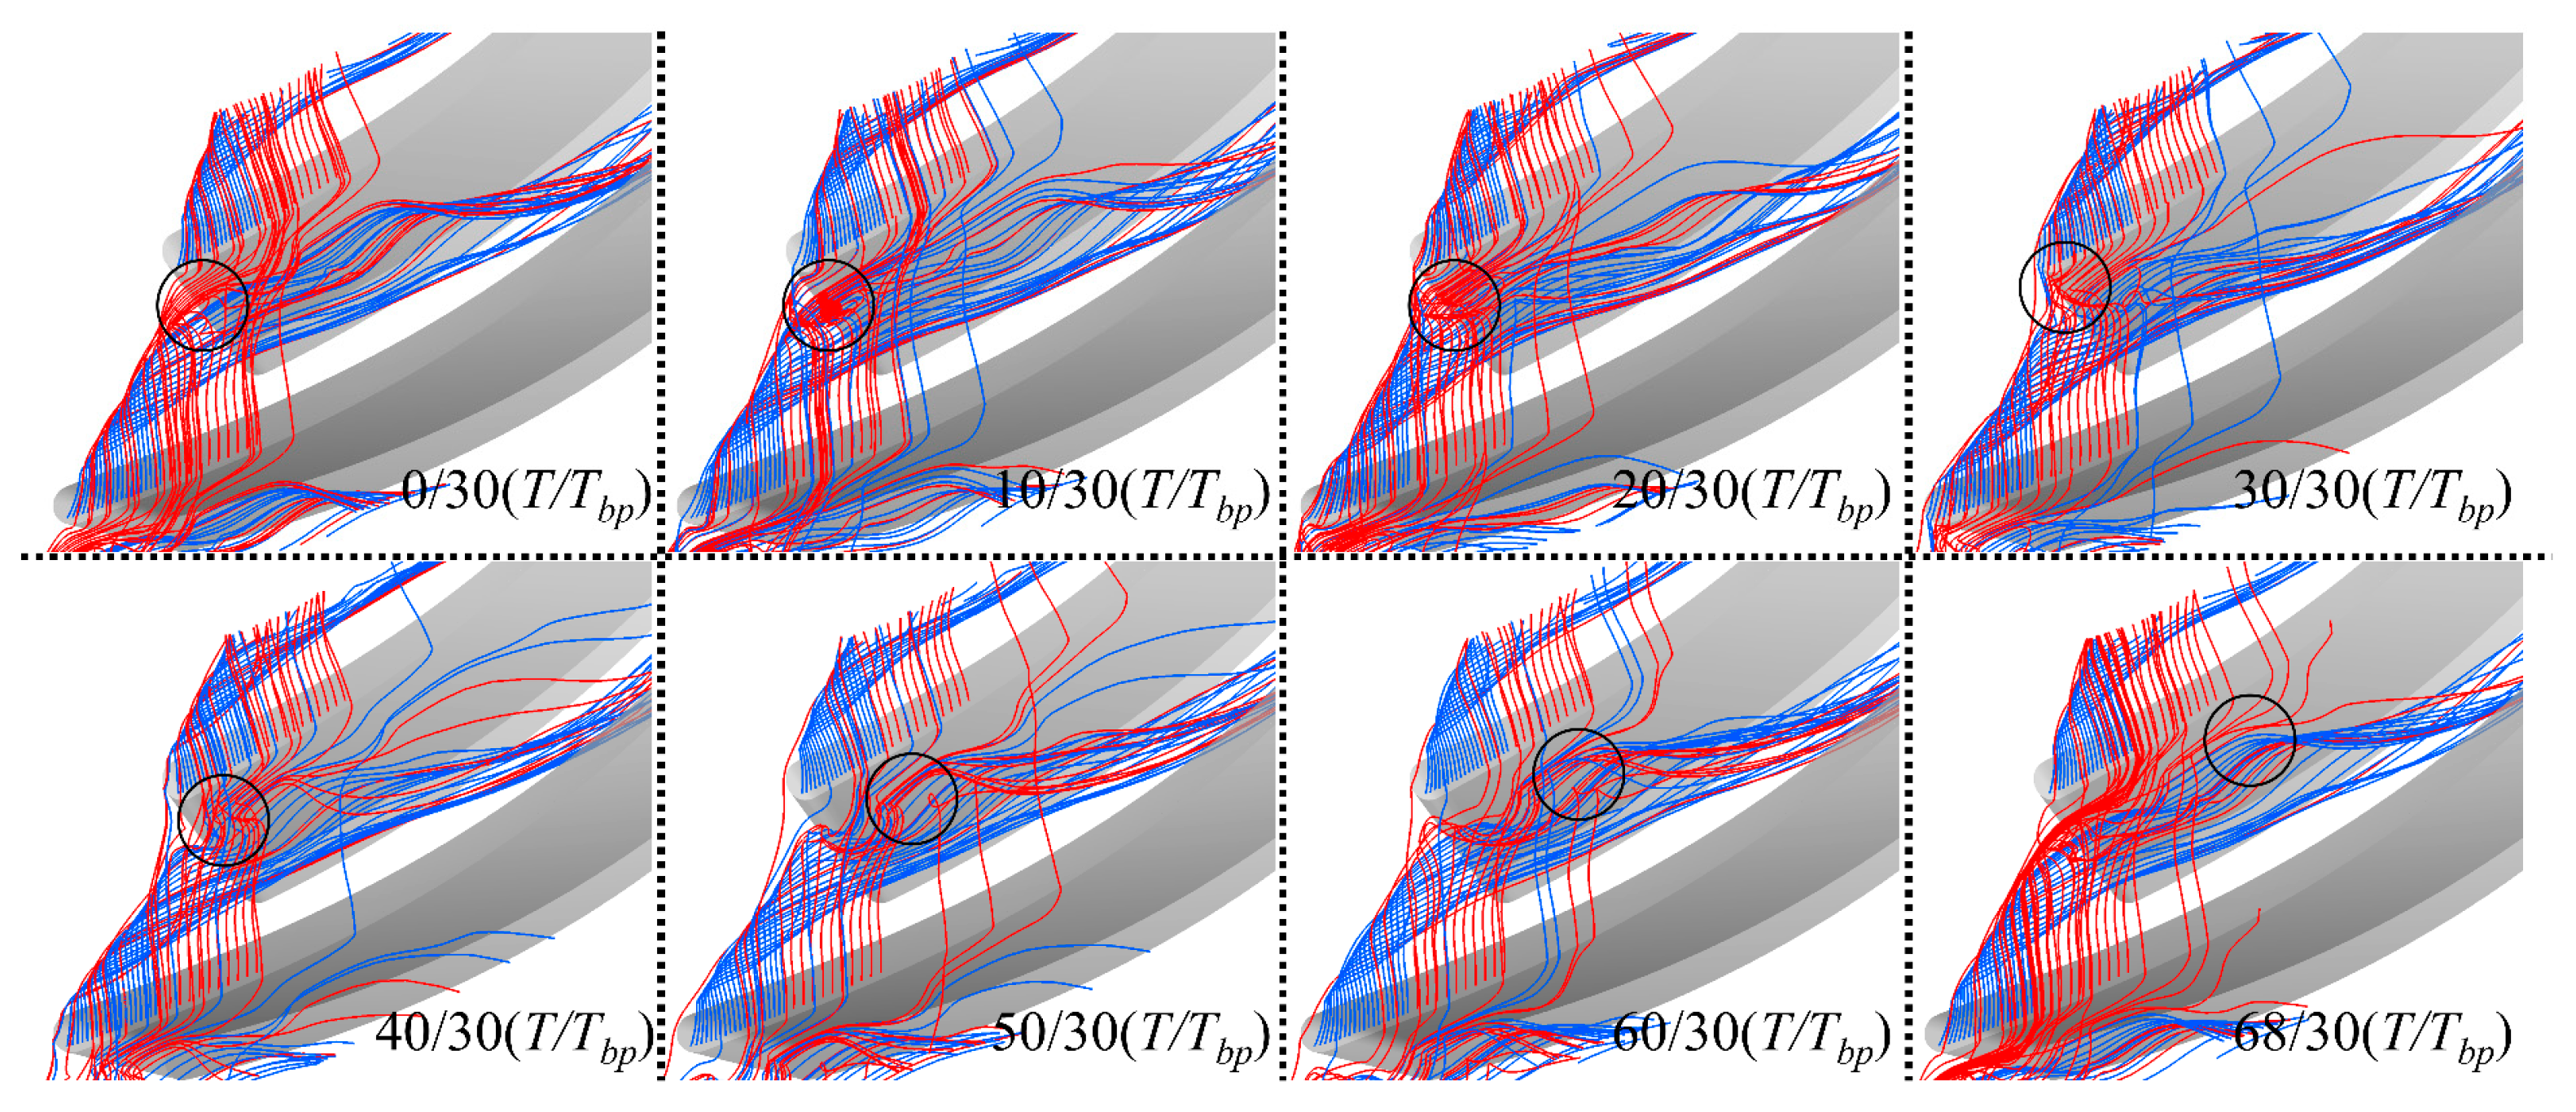
Based on the preceding analysis, the unstable fluctuation structure in the tip region is elucidated. The entire fluctuation period is determined to span (68/30) T, corresponding to a frequency of 0.44 BPF, indicating that the predominant unstable structure within the passage is driven by periodic pressure fluctuations therein. The pressure gradient within the passage is found to induce periodic spillage of the tip leakage flow from the leading edge, resulting in the primary oscillation frequency of 0.44 BPF observed at the leading edge. However, the origins of other high-amplitude frequency fluctuations at the leading edge of the blade tip, such as 0.87 BPF, 1.31 BPF, and additional harmonic frequencies of 0.44 BPF, remain unaccounted for. A three-dimensional streamline diagram of the tip clearance over the entire fluctuation period is presented in Figure 16, where streamlines at the top 10% streamwise position are marked in blue, and those at the 10-20% streamwise position are distinguished in red.
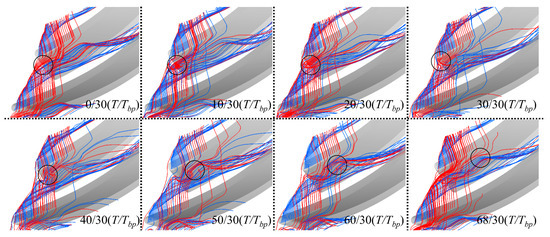
Figure 16.
Streamline evolution of tip leakage flow.
In Figure 16, the evolution of streamlines associated with tip leakage flow is presented. At (0/30) T, the streamline distribution reveals that the leading-edge leakage flow is characterized by a larger deflection angle. At this instant, no impingement of the leading-edge leakage flow on the pressure surface of the adjacent blade is observed, whereas the leakage flow at the 10–20% streamwise position is found to impinge on the pressure surface above the tip leakage flow. This induces secondary leakage at the leading edge of the adjacent blade, which is propagated rearward along the passage with the tip leakage flow. As blockage within the passage is intensified at (10/30) T, the leakage flow at the 10–20% streamwise position, under the combined influence of passage pressure, leakage flow, and mainstream flow, is observed to form a distinct vortex on the pressure surface of the adjacent blade, referred to as an induced vortex. This vortex is enlarged at (20/30) T and spilled over at (30/30) T. Following the spillage of the low-energy fluid mass at the leading edge, the passage pressure is reduced to its minimum, allowing the mainstream and leakage flows to be redirected back into the passage. The induced vortex is then propagated rearward within the passage with the mainstream flow and gradually dissipated. As depicted in the diagram, the induced vortex is formed within the passage at (10/30) T. From (20/30) T to (60/30) T, it is observed to migrate from the leading edge of the blade’s pressure surface to approximately the 20% streamwise position. During this migration, the pressure differential across the blade’s pressure and suction surfaces is altered, which in turn influences the tip leakage flow and modifies its trajectory. For instance, from (10/30) T to (30/30) T, the leading-edge leakage flow trajectory, depicted by the blue streamline, is shifted significantly rearward. Conversely, from (50/30) T to (60/30) T, when the vortex reaches the 10–20% streamwise position, the momentum of the leakage flow is diminished, resulting in a rearward shift in this leakage flow trajectory segment, accompanied by a noticeable rearward displacement of the secondary leakage position on the pressure surface of the adjacent blade. It is this periodic spillage-induced vortex that influences the pressure distribution on the adjacent blade’s pressure surface, thereby affecting the adjacent blade’s leakage flow and establishing a dynamic oscillation cycle. In this study, the original leakage flow is perturbed through periodic surface interactions, resulting in frequency characteristics with high-amplitude fluctuations at multiples of 0.44 BPF. Moreover, the pronounced oscillations induced by this vortex are found to resemble those reported by Hah [37]. When interactions across different passages encounter interference, the resulting phase differences are propagated in the blade’s rotational direction at a sub-rotational speed, exhibiting characteristics of rotational instability.
4.4. DMD Analysis of Unstable Flow in the Passage
As described in the preceding sections, the unsteady fluctuations and the origins of unstable flow within the centrifugal impeller passage are analyzed. The spatiotemporal evolution of flow structures associated with the primary oscillation frequency in the impeller passage under near-stall conditions is determined. Additionally, the frequency characteristics of the tip flow field are evaluated. However, frequency characteristics obtained solely through FFT analysis are limited to describing the flow field fluctuations. The interpretation of flow structures remains dependent on subjective understanding of the flow. Therefore, multiple methods are deemed necessary to investigate the unstable flow and enhance the credibility of the research. In this section, the DMD method, as introduced in Section 2, is utilized to analyze pressure fluctuation data over four rotor cycles, encompassing 1800 flow field snapshots, to capture the internal dynamic evolution characteristics. For the computation, the first 100 modes are selected for singular value decomposition truncation. The flow field reconstructed using these 100 modes results in a relative error of 0.24% compared to the original flow field, which is considered sufficient to meet the research requirements. To further evaluate the robustness of the DMD modal decomposition with respect to varying truncation levels, the dominant frequencies of the high-energy modes for Case 2 were compared across different numbers of retained modes (50, 100, and 150). The leading modes were found to exhibit consistent frequencies across these truncation levels: for 50 modes, the first three modes were identified at 572.541 Hz, 1717.372 Hz, and 2287.152 Hz; for 100 modes, the frequencies were 572.542 Hz, 1717.389 Hz, and 2290.063 Hz; and for 150 modes, the frequencies were 572.544 Hz, 1717.481 Hz, and 2290.025 Hz, respectively. The maximum relative frequency shift was determined to be only 0.13%, observed in the third mode, indicating the stability of the DMD method across different truncation levels.
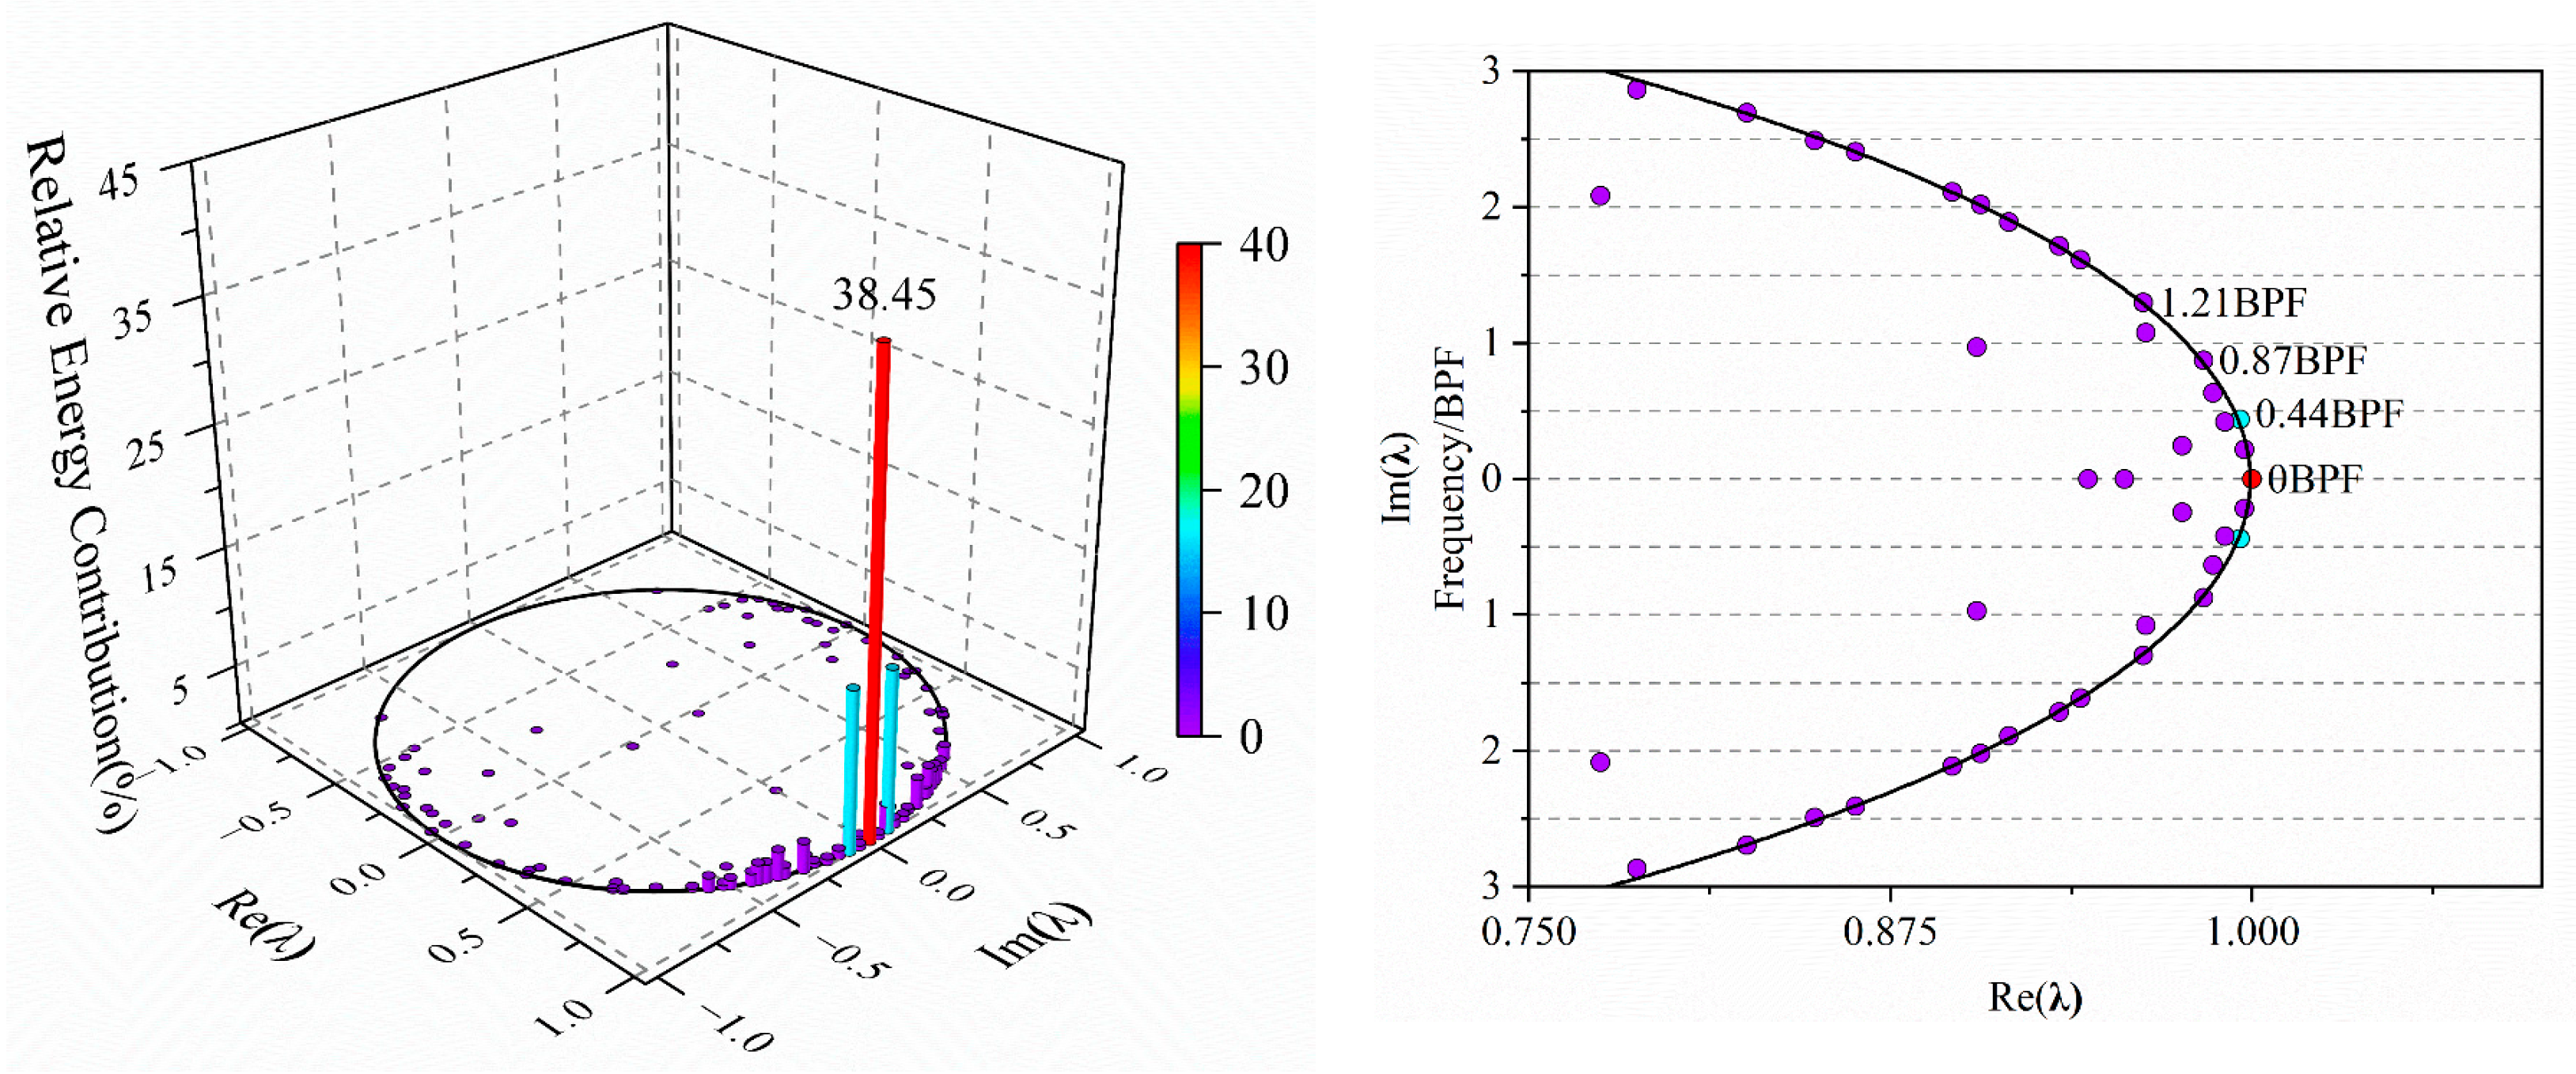
Through DMD analysis of pressure fluctuation data in the rotor’s relative coordinate system across the entire domain, the eigenvalues of the continuous system associated with each mode are obtained, as presented in Figure 17. The color and height of the modes represent the relative energy ratio of each DMD mode, normalized by the total energy of the first 100 modes. A higher relative energy ratio indicates a greater contribution of the corresponding flow structure to the unsteady fluctuations in the flow field. Each mode is characterized by a corresponding frequency. Notably, the high relative energy ratios of the 0.438 BPF mode and its harmonic multiples are observed. The zeroth-order mode, representing the background mode, is found to account for 38.45% of the energy. The first-order mode at 0.438 BPF contributes 26.72% to the energy (encompassing the combined energy ratio of a conjugate mode pair), followed by the second- and third-order modes at 1.315 BPF and 1.753 BPF, with energy ratios of 4.8% and 4.61%, respectively. Furthermore, the eigenvalues of the initial modes are observed to lie on the unit circle (radius = 1), indicating low dynamic damping and decay rates. A comparison between the FFT results and the modal frequencies reveals that the error for the 0.44 BPF mode, which exhibits the maximum amplitude, is determined to be 0.45%, with its harmonic multiples aligning closely with the modal frequencies.
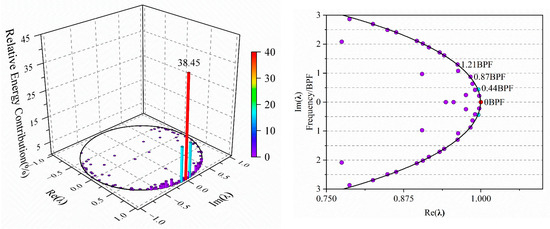
Figure 17.
DMD eigenvalue distribution of impeller pressure in the rotating frame for Case 2.
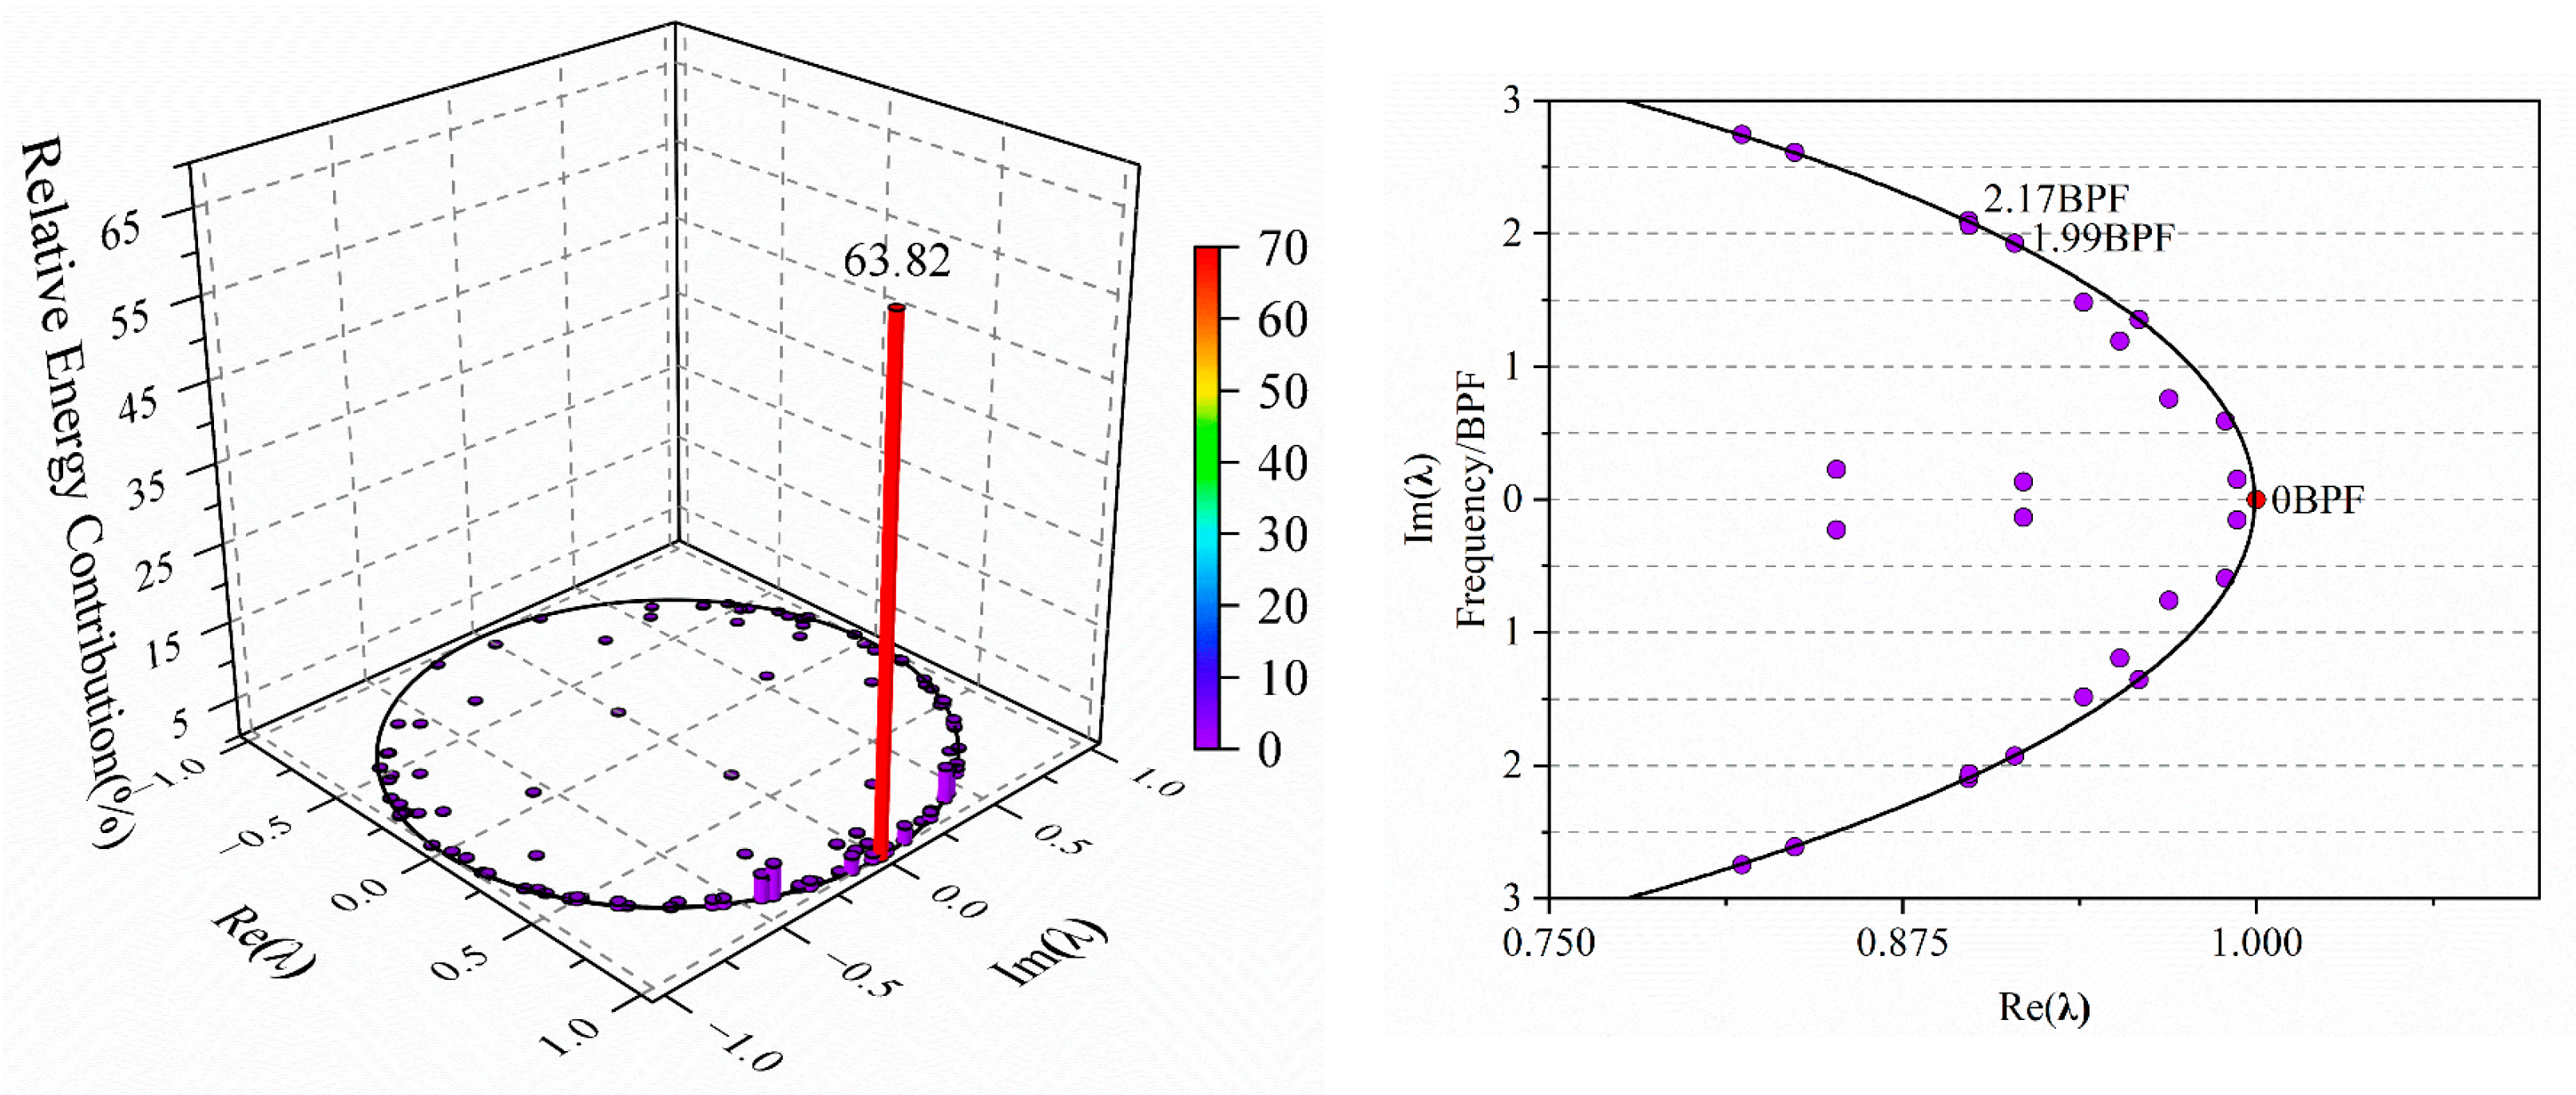
In Figure 18, the DMD analysis of the flow under Case 1 conditions is presented, alongside the eigenvalue distribution of the continuous system for comparison with the results obtained under Case 2. It is observed that under Case 1 conditions, the energy ratio of the zeroth-order mode is determined to be 63.82%, while those of the first- and second-order modes are found to be 8.35% and 6.28%, respectively. The corresponding frequencies are identified as 1.986 BPF and 2.172 BPF, respectively, aligning closely with the high-amplitude frequencies observed in the spectrum. As the compressor throttling process progresses, the internal instability fluctuations within the impeller passage are intensified, resulting in a significant reduction in the energy proportion of the zeroth-order mode and a corresponding increase in that of the first-order mode. Furthermore, the cumulative energy ratios under both operating conditions are presented in the figure. The energy ratios of the first 10 modes are found to reach 96.36% under Case 1 and 92.72% under Case 2, indicating a typical low-rank flow phenomenon. The fluctuations in the flow field are primarily driven by a limited number of flow structures.
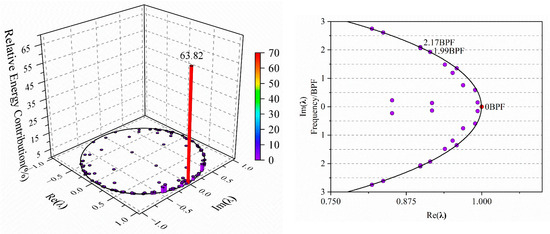
Figure 18.
DMD eigenvalue distribution of impeller pressure in the rotating frame for Case 1.
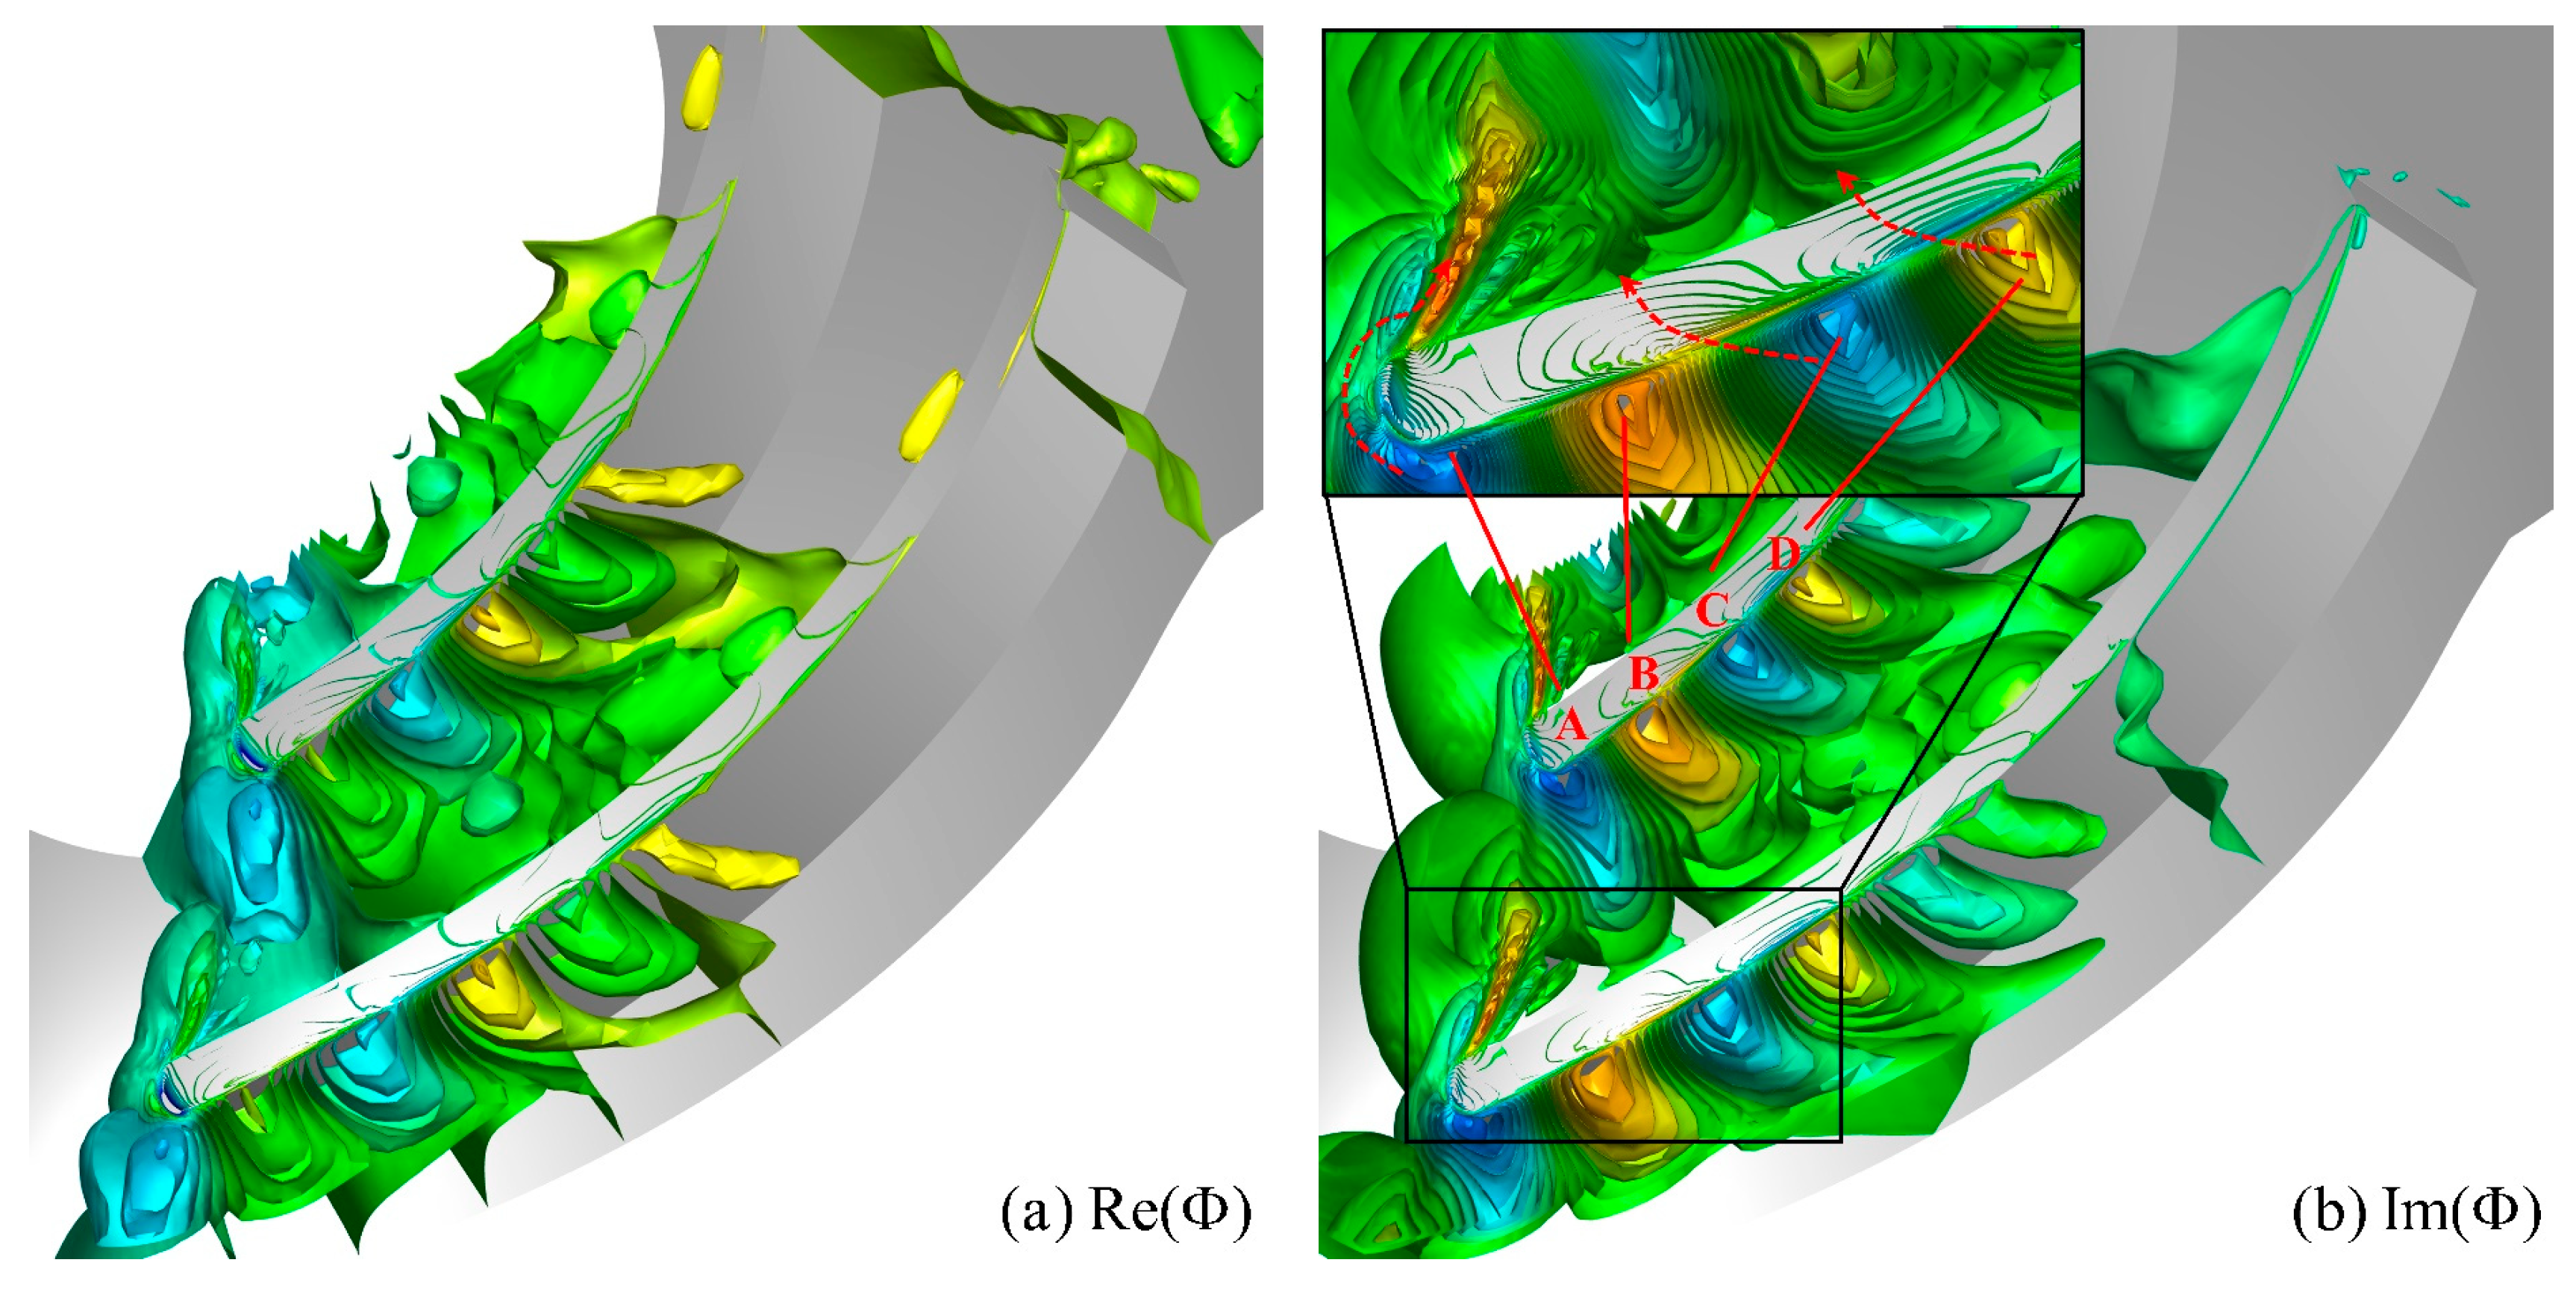
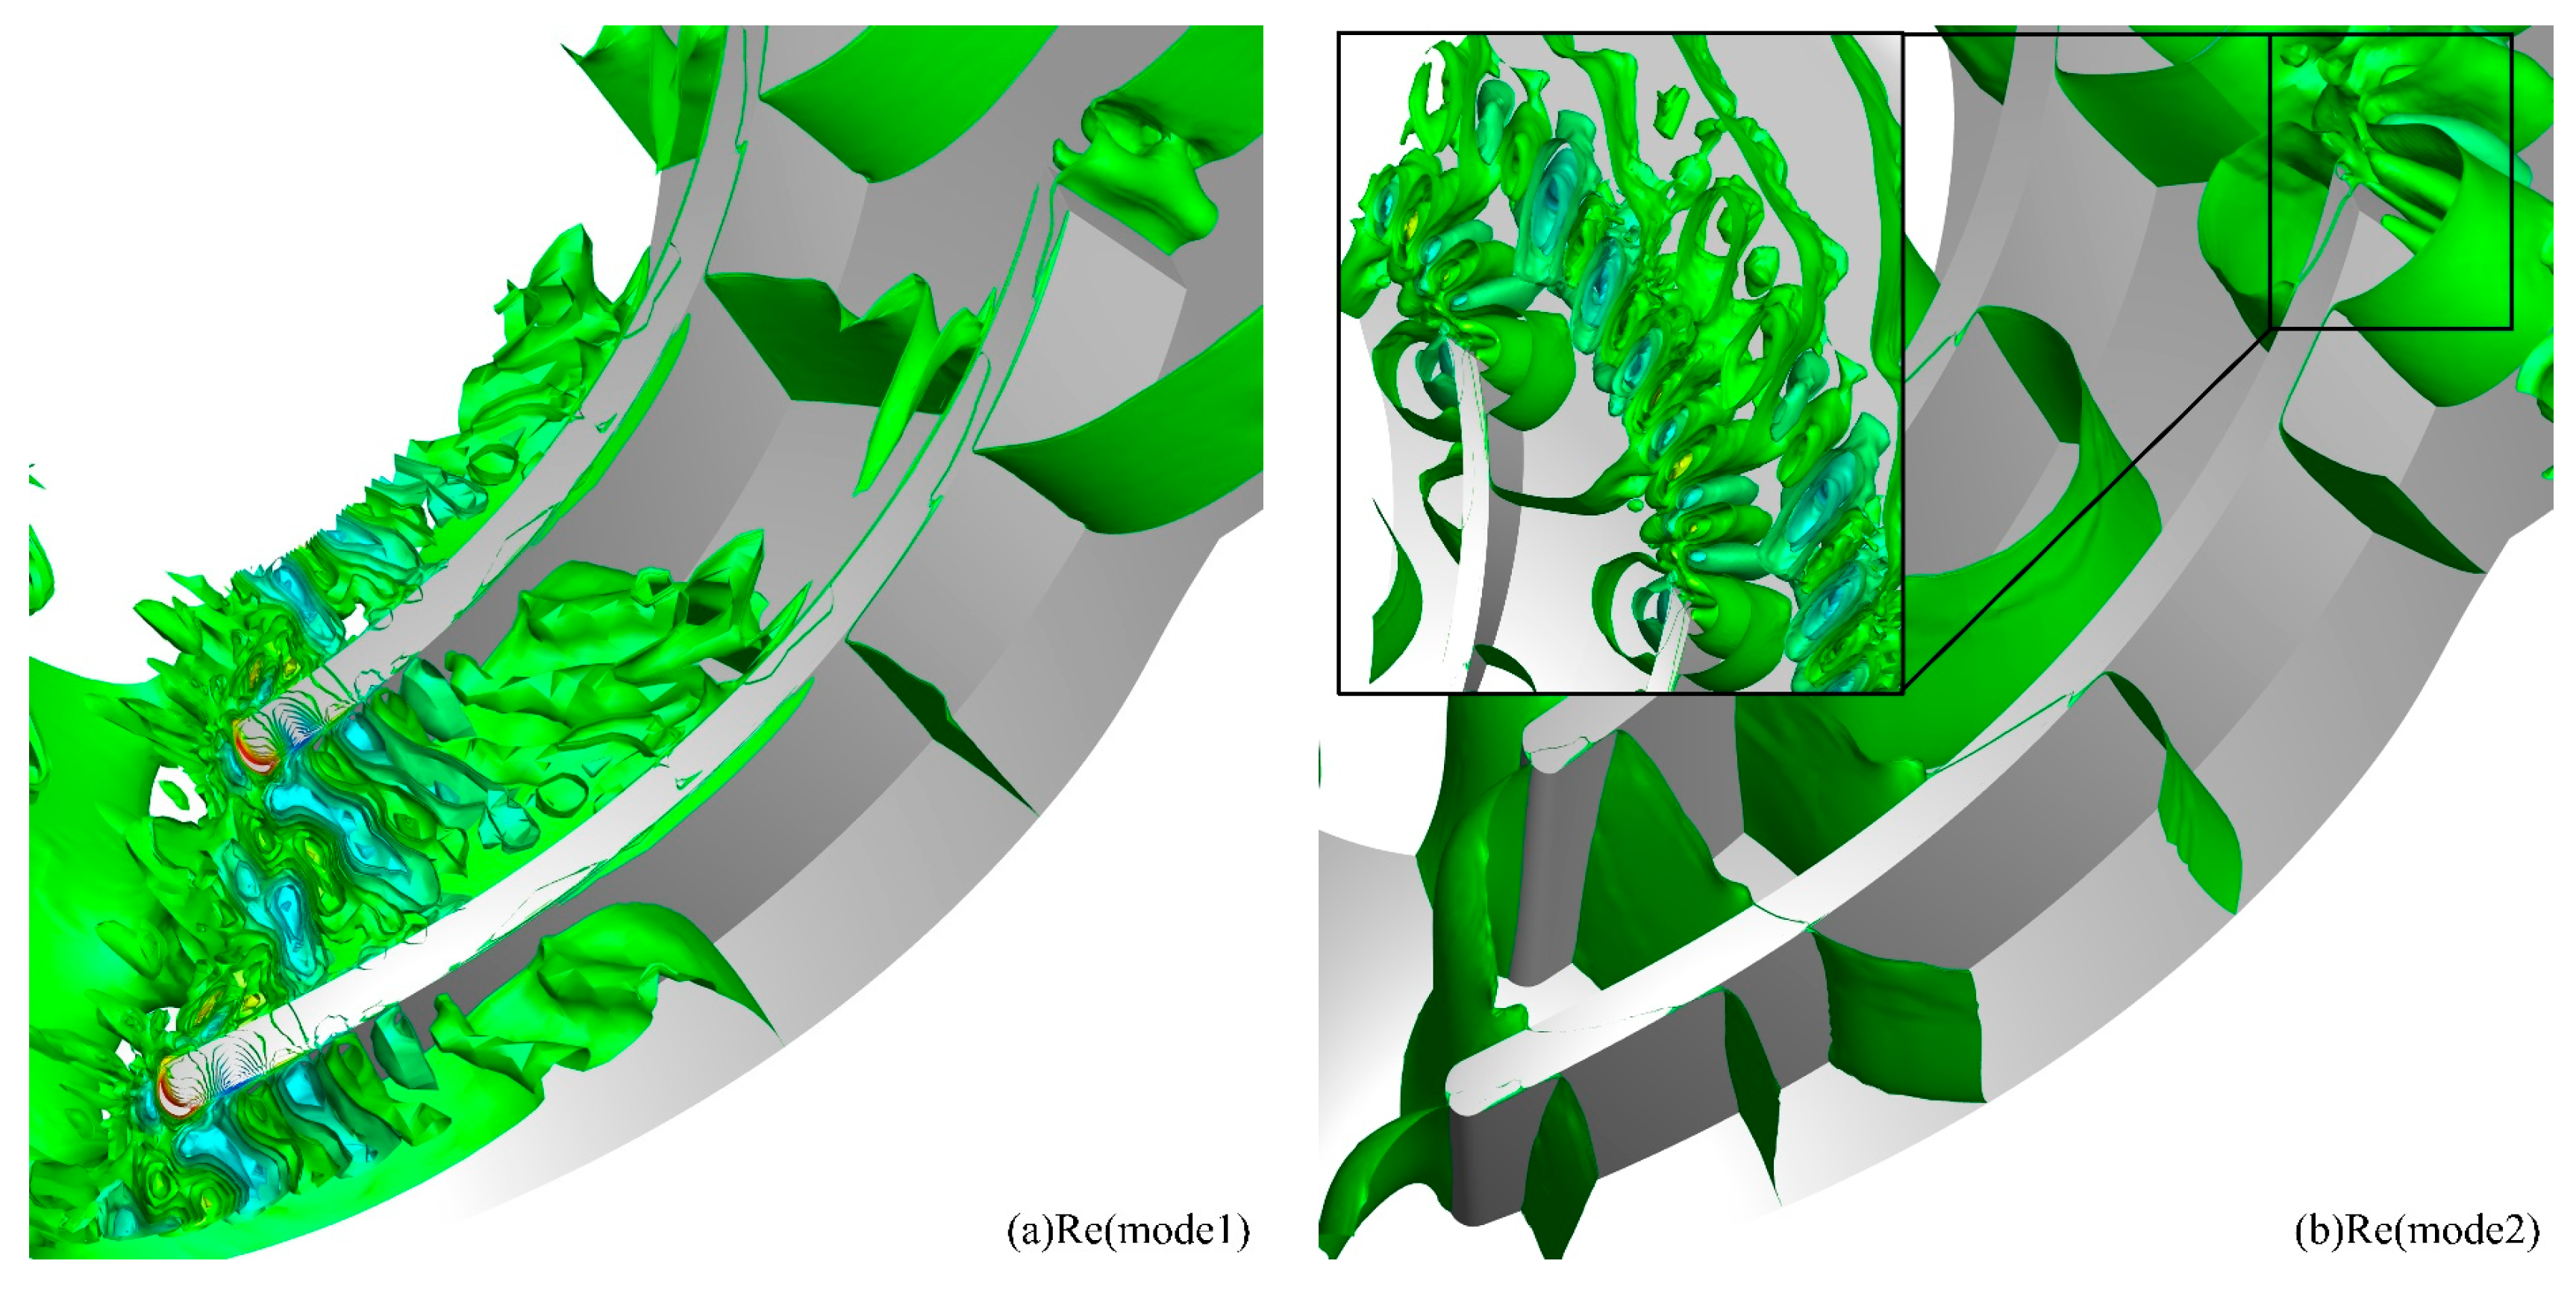
To investigate the spatial evolution characteristics of various modes, the spatial distribution of the real part of the first-order mode under Case 2 is presented in Figure 19a. In the reconstruction of the DMD modal flow field, modes serve as basis vectors, and their spatial distribution is directly indicative of the spatiotemporal evolution characteristics of the corresponding flow structures. The real part of a mode represents the magnitude of static pressure oscillations, while the imaginary part reflects the temporal differences in fluctuations across various spatial locations. The spatial isosurface fluctuations of the first-order pressure mode are analyzed, revealing that significant high-gradient variations are observed on the blade pressure surface side. In contrast, the rear region of the blade passage exhibits larger amplitude but smaller modal gradients.
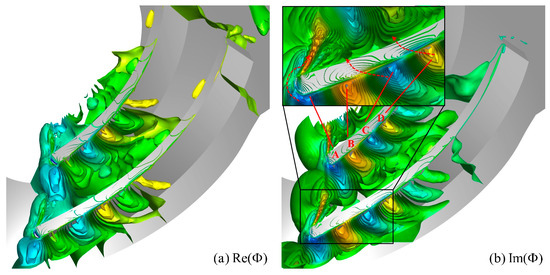
Figure 19.
Spatial structure of DMD mode 1 for Case 2: (a) real part, (b) imaginary part.
In the spatial distribution of the real part of the mode, modes exhibiting equal magnitude but opposite signs are indicative of a 180° phase difference, thereby enabling the derivation of the spatiotemporal evolution characteristics of the flow structures. However, more detailed phase angle information is captured through the spatial distribution of the mode’s imaginary part, as presented in Figure 19b, where the gradient of the imaginary part is indicative of the wave propagation direction. To facilitate analysis, regions with high real-part values and opposing phase angles on the impeller’s pressure surface are designated as zones A, B, C, and D along the streamwise direction. It is observed from the diagram that the phase difference between the pressure fluctuations induced by the tip leakage flow and those at the leading-edge pressure surface is 180°. When the pressure at position A on the leading-edge pressure surface is reduced to its minimum, the intensity of the tip leakage flow is increased. Consequently, the high-pressure region, formed by the interaction of the mainstream flow, tip leakage flow, and induced vortex, is propagated rearward within the passage, resulting in corresponding fluctuations in zones B, C, and D of the pressure surface. Simultaneously, the tip clearance region is analyzed, revealing how pressure fluctuations on the blade pressure surface influence the leakage flow at various positions over time. As illustrated in the figure, pressure fluctuations at position A are found to affect those of the tip leakage flow through leading-edge spillage and the leading-edge tip clearance, while fluctuations in zones B, C, and D influence those in positions A and B of adjacent passages through the tip clearance. Furthermore, the modal distribution within the tip clearance is observed to exhibit distinct phase differences, indicating that temporal fluctuations in the periodic pressure on the pressure surface induce variations in the intensity and position of the leakage flow within the tip clearance.
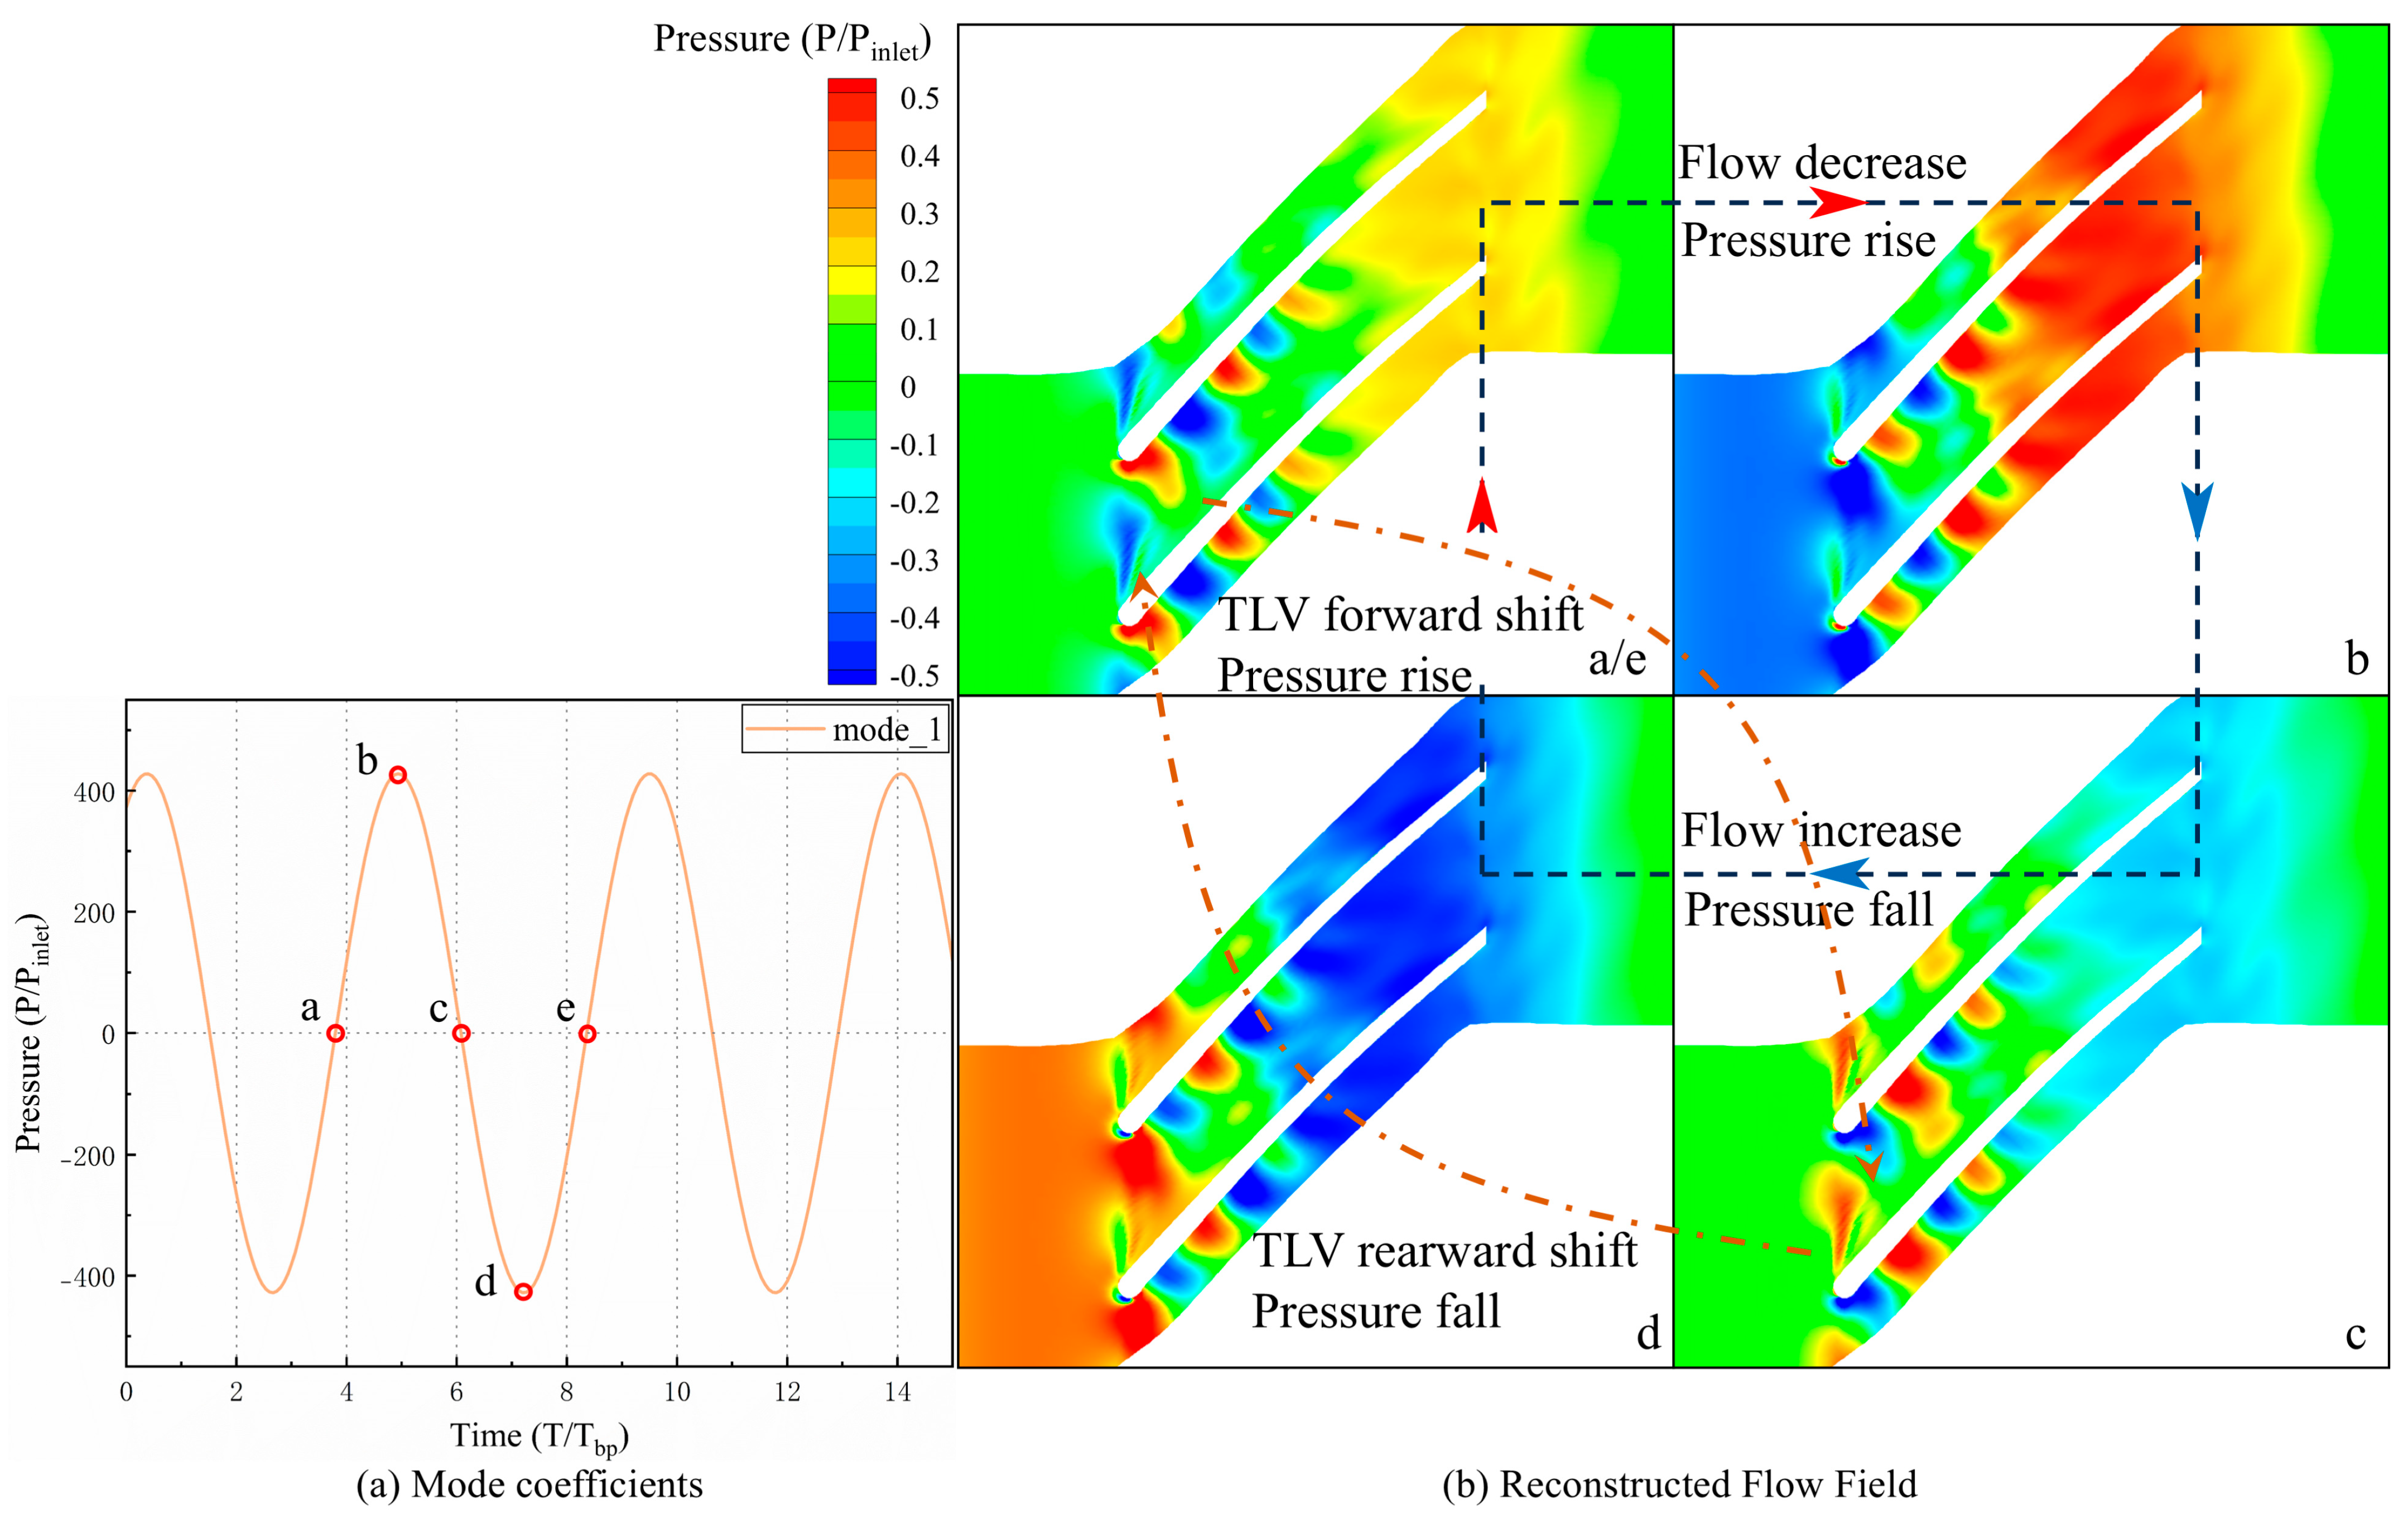
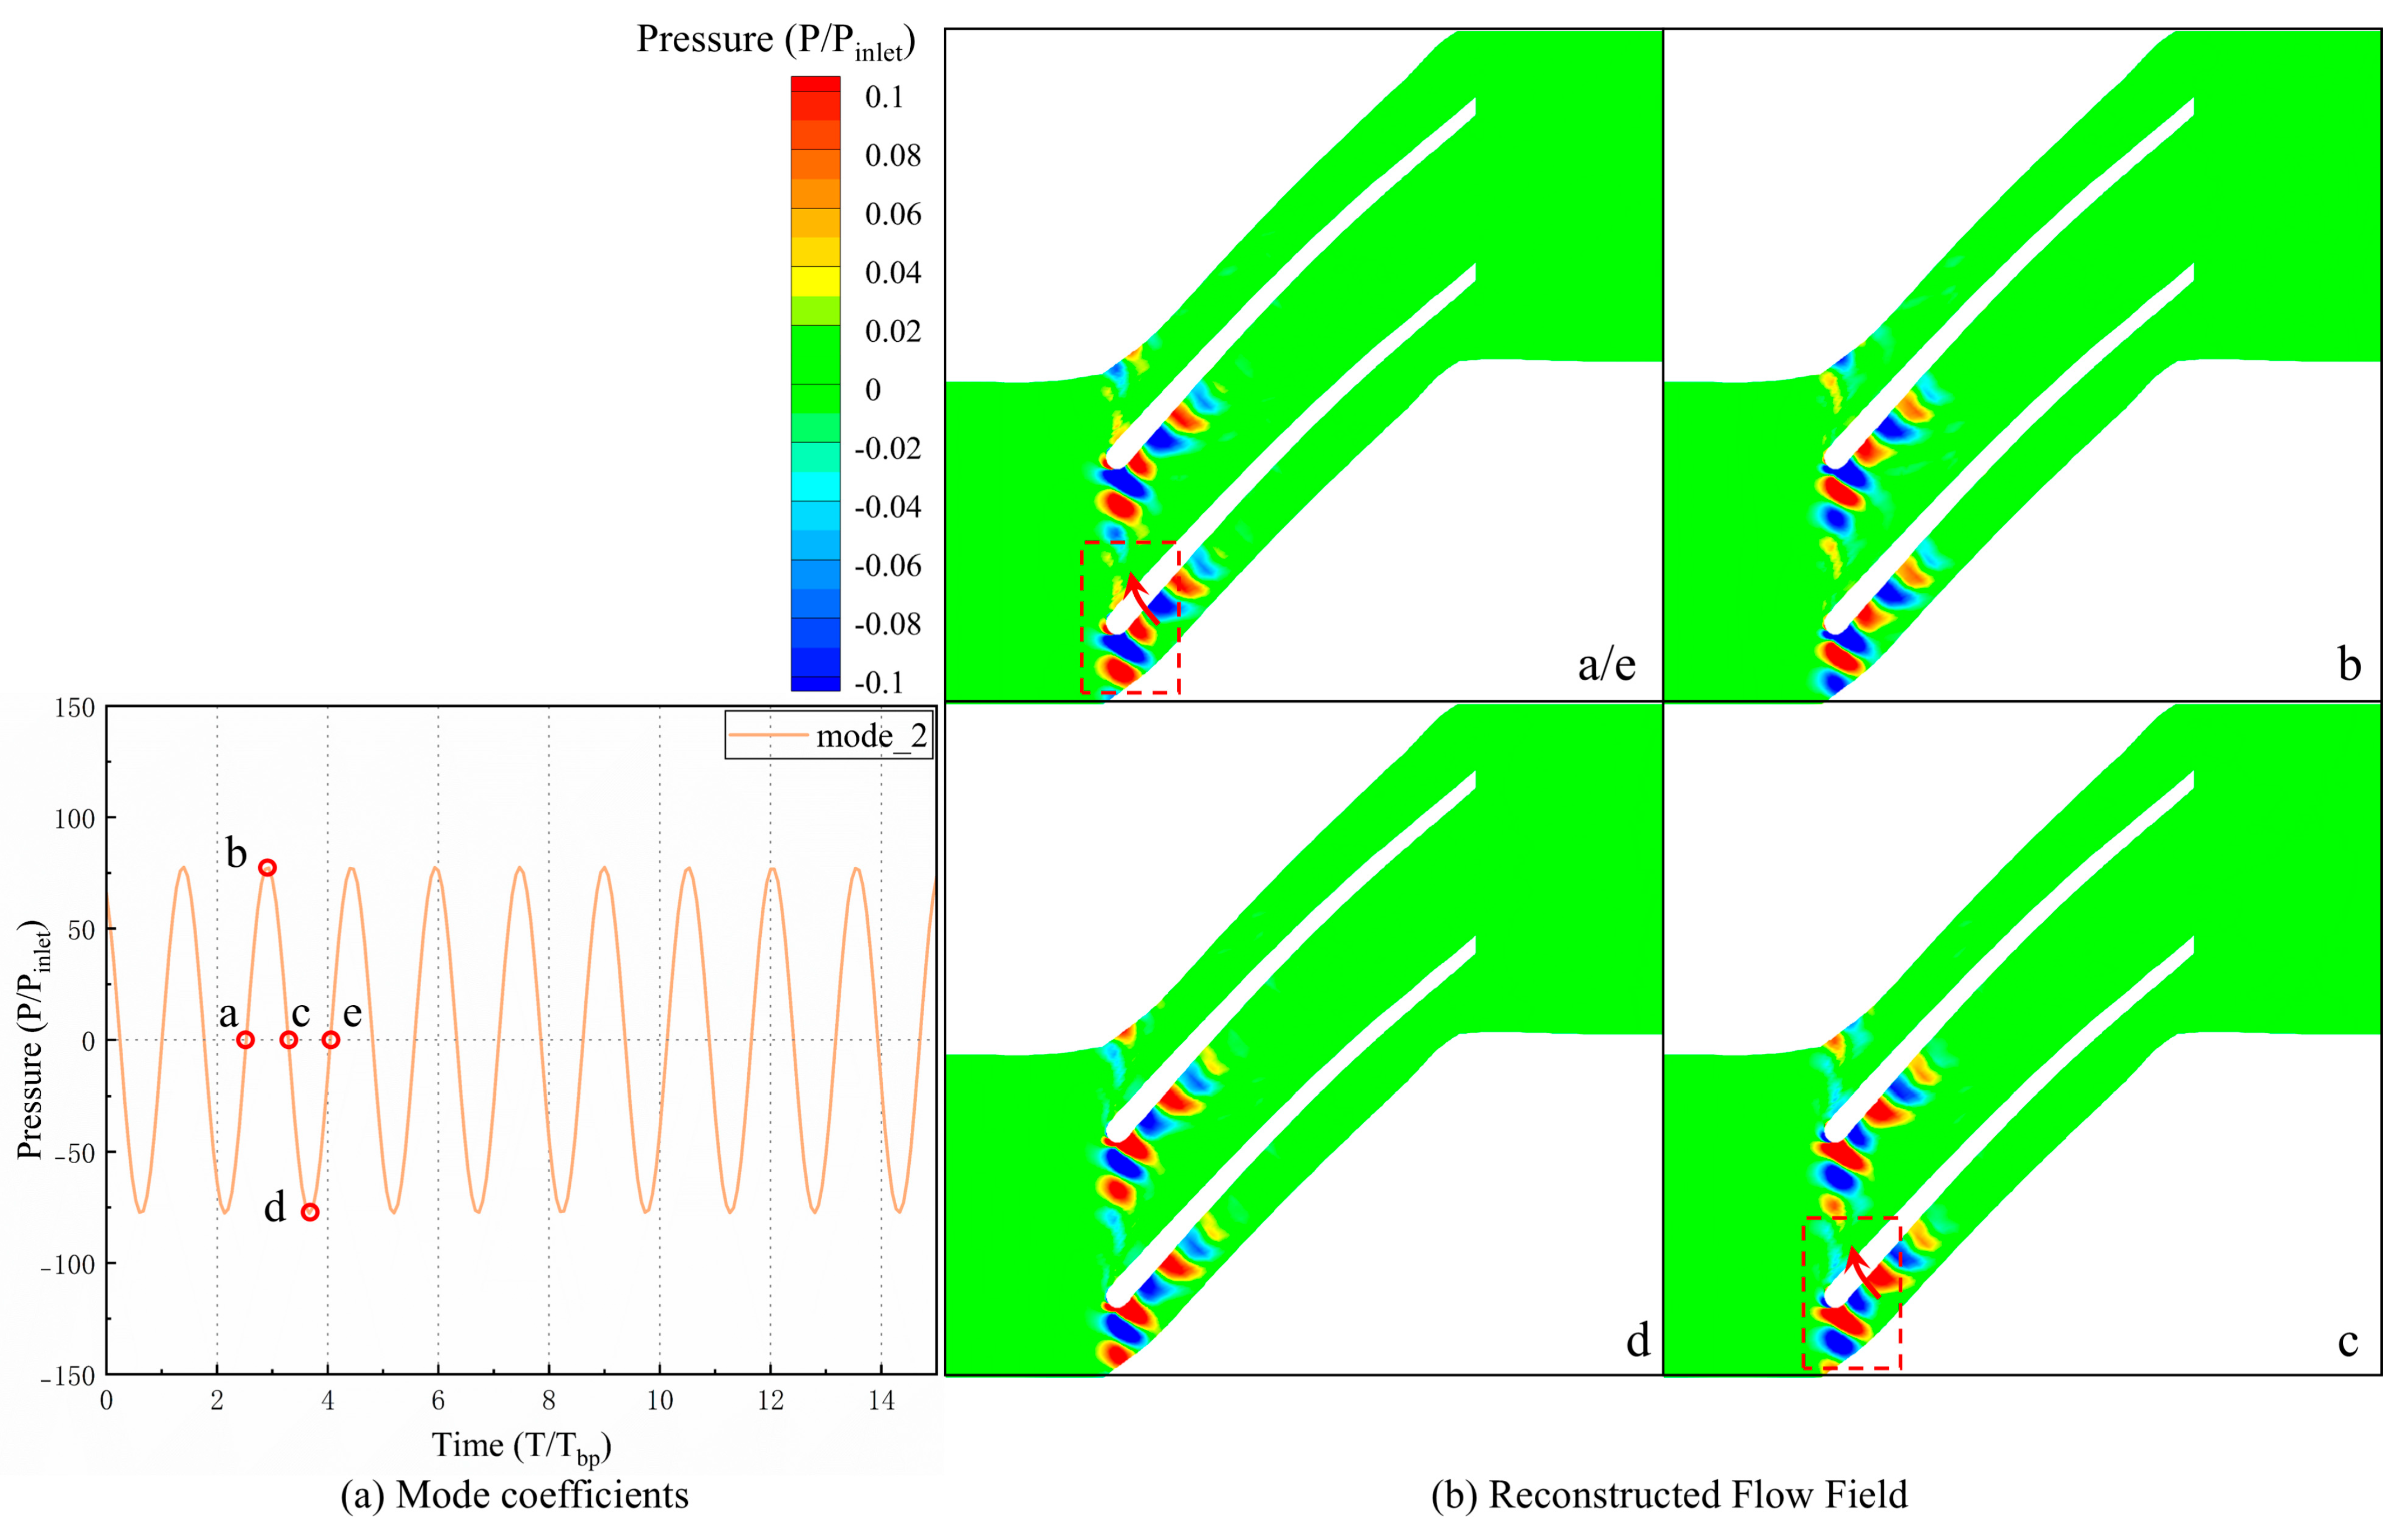
To better elucidate the fluctuation mechanism of mode 1, the modal coefficient fluctuations and the reconstructed pressure flow field of mode 1 are presented in Figure 20. As the DMD modes are normalized during computation, the fluctuations in the modal coefficients are indicative of pressure fluctuations. As illustrated in Figure 20a, mode 1 exhibits pronounced periodic fluctuations with a period of (68/30) T/Tbp, consistent with the fluctuation periods observed in Figure 14 and Figure 16. This indicates that the flow structure corresponding to mode 1 is the primary cause of flow field fluctuations. Five time points (a–e) within one fluctuation cycle are selected, and the pressure field is reconstructed using mode 1, as shown in Figure 20b. It is observed that the entire passage is characterized by a distinct cyclic behavior. At time point a, the pressure at the passage inlet is minimized, reflecting a typical feature of tip leakage flow, accompanied by pronounced alternating high- and low-pressure fluctuations on the pressure surface of the adjacent passage. At time point b, the pressure at the tip leakage flow position is observed to increase, while the pressure at the leading-edge pressure surface of the adjacent blade is reduced, and the pressure in the rear half of the passage is elevated. This is attributed to the low-energy fluid generated by the tip leakage flow entering the passage, causing blockage and reducing flow rate, which leads to a significant pressure rise in the rear half of the passage. At this stage, the tip leakage flow, under the influence of the adverse pressure gradient in the rear, is deflected upstream. In conjunction with the mainstream flow, this results in a pressure increase, reaching a peak at time point c. As the tip leakage flow further blocks the passage inlet, the high-pressure gas within the passage is released through rearward propagation and leading-edge spillage (as shown in Figure 14), alleviating the high-pressure region in the rear half of the passage and gradually reducing the static pressure. At time point d, the pressure in the rear half of the passage is minimized, and the adverse pressure gradient within the passage is reduced. By time point e, the incoming flow and tip leakage flow are redirected back into the blade passage, completing a full fluctuation cycle. It is further observed that a phase lag exists between the pressure fluctuations at the passage inlet (upstream) and the downstream region. When the downstream pressure is elevated and the flow rate is reduced, the passage inlet remains in a low-pressure, high-flow state, with a phase difference of 180°. This suggests that the fluctuations associated with mode 1 represent a holistic oscillation within the passage, with the tip leakage flow serving as a contributing factor rather than the primary structure driving the fluctuations.
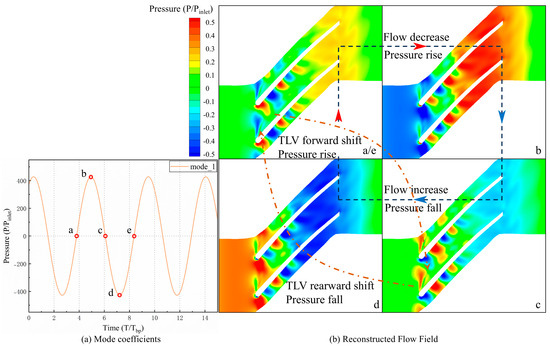
Figure 20.
Reconstructed Pressure Field of DMD Mode 1 for Case 2 (95% Span).
In Figure 21, the modal coefficient fluctuations and the reconstructed pressure flow field for mode 2 are presented. It is observed that, compared to mode 1, the modal coefficient of mode 2 exhibits a higher frequency and a smaller amplitude. As shown in Figure 21b, the pressure fluctuations associated with mode 2 are primarily concentrated at the blade leading-edge position, corresponding to the periodic shedding of the tip leakage flow and its interaction with the pressure surface of the adjacent blade. Furthermore, it is evident from Figure 21a,c that the pressure fluctuations at the 10% relative chord length position, marked by a red arrow in the figure, significantly influence the outflow process of the tip leakage flow. When the pressure at the 10% relative chord length position is elevated, the tip leakage flow is deflected upstream, interacting with the mainstream flow to cause an increase in static pressure. Conversely, when the pressure on the pressure surface side is reduced due to the influence of the induced vortex, the axial momentum of the tip leakage flow is diminished, resulting in a decrease in static pressure at the outflow position. This observation is consistent with the phenomena observed in Figure 16.
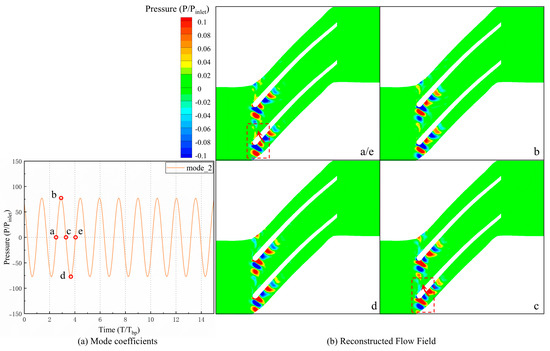
Figure 21.
Reconstructed Pressure Field of DMD Mode 2 for Case 2 (95% Span).
Although the fluctuation phenomena are all generated by internal dynamics within the passage and exhibit similar frequencies, approximately half the blade passage frequency, their underlying mechanisms differ from those observed by Li [16] and Zhao et al. [18]. The self-induced instability described by Li is attributed to the destabilization of the interface formed between secondary leakage and the mainstream flow at the splitter blade’s leading edge, with fluctuations primarily concentrated in the mid-to-rear portion of the passage. This unstable flow is identified as the primary source of fluctuations. In the study by Zhao et al., fluctuations are similarly induced by the interaction between tip leakage flow and the pressure surface of the adjacent blade but are confined to the leading-edge tip region. In contrast, the instability observed in this study is driven by periodic flow rate fluctuations throughout the entire passage, resulting from oscillations of the induced vortex formed by the interaction between tip leakage flow and the mainstream flow. Although pronounced fluctuations are also observed at the leading-edge tip, the corresponding mode is not dominant, exhibiting characteristics more akin to the formation mechanism of modal-type stall precursors.
To elucidate the variations in the internal flow structures within the impeller passage during the compressor’s throttling process, the spatial distributions of the first- and second-order modes under Case 1 are presented in Figure 22, corresponding to 1.986 BPF and 2.172 BPF, respectively. As observed in the diagram, these two high-frequency flow structures correspond to unsteady vortex shedding from the tip leakage flow and at the trailing edge, respectively. The unsteady flow at the trailing edge periodically influences the outlet flow area, thereby inducing minor fluctuations in the channel’s flow rate and pressure, which also accounts for the high-amplitude oscillations at 1.99 BPF and 2.17 BPF in the diagram. As the operating condition approaches the instability boundary, these high-frequency structures are masked by the unstable flow fluctuations generated within the passage.
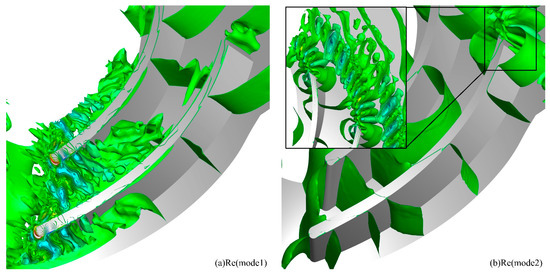
Figure 22.
Spatial structure of DMD modes for Case 1: (a) mode 1, (b) mode 2 (real parts).
5. Conclusions
In this study, the characteristics of unstable disturbances within the isolated centrifugal impeller passage are numerically investigated. The accuracy of the numerical method is validated against various experimental data. Building on this foundation, the unsteady fluctuations and the evolution of flow structures at the peak efficiency point and near-stall condition are analyzed. Integrating the DMD method, the primary causes of the impeller’s internal instability are identified. The principal conclusions are summarized as follows:
- 1
- Under stable conditions, high-frequency oscillations exceeding the blade passing frequency (1.983 BPF and 2.17 BPF) predominate within the impeller. The peak amplitudes are concentrated around twice the blade passing frequency. The former originates from tip leakage vortex shedding, while the latter arises from trailing-edge vortex shedding.
- 2
- Under near-stall conditions, unstable fluctuations are induced by the periodic passage blockage caused by the interaction of tip leakage flow and induced vortices entering the passage. These fluctuations correspond to the first-order DMD mode, manifesting as a dynamic cycle of high- and low-pressure fluctuations throughout the entire passage, with a frequency of 0.44 BPF. The tip leakage flow is identified as a triggering factor for the fluctuations but is not considered the primary source of the oscillations.
- 3
- Under near-stall conditions, the periodic dynamic cycle formed by the interaction between the tip leakage flow and the pressure surface of the adjacent blade is associated with the second-order DMD mode. After the tip leakage flow is discharged, it is observed to interact with the mainstream flow and is directed rearward along the pressure surface of the adjacent blade. The low-energy fluid at the 10% chord length position on the pressure surface is found to significantly influence the tip leakage flow.
- 4
- The DMD method effectively captures the unsteady flow structures within the impeller passage. The spatial distribution of the modal real part directly reflects regions of high-amplitude fluctuations, while the imaginary part elucidates the wave propagation process. Under stable conditions, high-frequency oscillations are primarily induced by tip leakage vortex shedding and trailing-edge vortex shedding. Upon throttling to near-stall conditions, the low-frequency modal energy increases substantially, with the dominant frequency centering on half the blade passing frequency and its harmonics; consequently, the high-frequency, small-amplitude oscillations induced by vortex shedding become masked.
In this study, the SST k-omega turbulence model combined with the Unsteady Reynolds-Averaged Navier–Stokes method was employed to simulate the flow within a single passage of a centrifugal compressor. The validity of this approach was demonstrated through experimental data. However, limitations are acknowledged in the model’s ability to resolve complex vortex interactions. Due to its reliance on Reynolds averaging, this method inevitably overlooks small-scale turbulent fluctuations and vortex structures. For interactions involving tip leakage vortices, induced vortices, and flow separation within the passage, this approach may oversimplify these processes, potentially masking the intricate features of internal instabilities. To address these limitations, future research is recommended to adopt hybrid methods, such as Detached Eddy Simulation (DES) or Large Eddy Simulation (LES), to more accurately resolve the unstable flow structures within the impeller passage.
Author Contributions
Conceptualization, X.F., M.W. and Z.Z.; methodology, M.W. and H.C.; software, Y.C., X.L. and M.W.; validation, X.F., Z.Z. and H.C.; formal analysis, Y.C.; investigation, H.C., X.L.; resources, Y.C.; data curation, H.C.; writing—original draft preparation, Z.Z.; writing—review and editing, Z.Z.; visualization, X.F.; supervision, X.F.; project administration, X.F.; funding acquisition, X.F. All authors have read and agreed to the published version of the manuscript.
Funding
This research was funded by the State Key Laboratory of Clean and Efficient Turbomachinery Power Equipment (NO. EE280519).
Institutional Review Board Statement
Not applicable.
Informed Consent Statement
Not applicable.
Data Availability Statement
The data that support the findings of this study are available from the corresponding author upon reasonable request.
Conflicts of Interest
Author Xiaoping Fan, Zhuhai Zhong, Hongfen Chen, and Yang Chen were employed by Dongfang Electric Corporation Dongfang Turbine Co. The remaining authors declare that the research was conducted in the absence of any commercial or financial relationships that could be construed as a potential conflict of interest.
Abbreviations
The following abbreviations are used in this manuscript:
| DMD | Dynamic Mode Decomposition |
References
- Day, I.J. Stall, Surge, and 75 Years of Research. J. Turbomach. 2016, 138, 011001. [Google Scholar] [CrossRef]
- Zhang, H.; Yang, C.; Wang, W.; Yang, C.; Li, Y. Experimental Investigation of the Pre-Stall and Stall Evolution in a Centrifugal Compressor With a Volute. J. Turbomach. 2022, 144, 081012. [Google Scholar] [CrossRef]
- Yamada, K.; Furukawa, M.; Fukushima, H.; Ibaraki, S.; Tomita, I. The Role of Tip Leakage Vortex Breakdown in Flow Fields and Aerodynamic Characteristics of Transonic Centrifugal Compressor Impellers. In Proceedings of the ASME 2011 Turbo Expo: Turbine Technical Conference and Exposition, Volume 7: Turbomachinery, Parts A, B, and C. Vancouver, BC, Canada, 6–10 June 2011; pp. 2111–2123. [Google Scholar] [CrossRef]
- Marconcini, M.; Bianchini, A.; Checcucci, M.; Ferrara, G.; Arnone, A.; Ferrari, L.; Biliotti, D.; Rubino, D.T. A 3D Time-Accurate CFD Simulation of the Flow Field Inside a Vaneless Diffuser During Rotating Stall Conditions. In Proceedings of the ASME Turbo Expo 2016: Turbomachinery Technical Conference and Exposition, Volume 2D: Turbomachinery. Seoul, Republic of Korea, 13–17 June 2016; p. V02DT42A029. [Google Scholar] [CrossRef]
- Dehner, R.; Selamet, A. Three-Dimensional Computational Fluid Dynamics Prediction of Turbocharger Centrifugal Compression System Instabilities. J. Turbomach. 2019, 141, 081004. [Google Scholar] [CrossRef]
- Wu, Y.; Zhang, X.; Yang, F.; Spence, S. Review of unsteady aerodynamic problems and control strategies for the blade tip flow of axial compressors. Prog. Aerosp. Sci. 2025, 152, 101063. [Google Scholar] [CrossRef]
- Yamada, K.; Kikuta, H.; Furukawa, M.; Gunjishima, S.; Hara, Y. Effects of Tip Clearance on the Stall Inception Process in an Axial Compressor Rotor. In Proceedings of the ASME Turbo Expo 2013: Turbine Technical Conference and Exposition, Volume 6C: Turbomachinery. San Antonio, TX, USA, 3–7 June 2013; p. V06CT42A035. [Google Scholar] [CrossRef]
- Mailach, R.; Lehmann, I.; Vogeler, K. Rotating Instabilities in an Axial Compressor Originating From the Fluctuating Blade Tip Vortex. J. Turbomach. 2001, 123, 453–460. [Google Scholar] [CrossRef]
- Benjamin, P.; Ulf, T.; Lars, E. Time-resolved Rotating Instability Waves in an annular Cascade. In Proceedings of the 18th AIAA/CEAS Aeroacoustics Conference (33rd AIAA Aeroacoustics Conference), Colorado Springs, CO, USA, 4–6 June 2012. [Google Scholar] [CrossRef]
- Everitt, J.N.; Spakovszky, Z.S. An Investigation of Stall Inception in Centrifugal Compressor Vaned Diffuser. J. Turbomach. 2013, 135, 011025. [Google Scholar] [CrossRef]
- Bousquet, Y.; Binder, N.; Dufour, G.; Carbonneau, X.; Roumeas, M.; Trebinjac, I. Numerical Simulation of Stall Inception Mechanisms in a Centrifugal Compressor With Vaned Diffuser. J. Turbomach. 2016, 138, 121005. [Google Scholar] [CrossRef]
- Toyama, K.; Runstadler, P.W.; Dean, R.C. An Experimental Study of Surge in Centrifugal Compressors. J. Fluids Eng. 1997, 99, 115–131. [Google Scholar] [CrossRef]
- Hong, S.; Chi, J.; Xiang, X.; Lu, W. Theoretical Model and Numerical Analysis of the Tip Leakage Vortex Variations of a Centrifugal Compressor. Aerospace 2022, 9, 830. [Google Scholar] [CrossRef]
- Xiang, X.; Tong, W.; Bo, Y. Mechanism of stall and surge in a centrifugal compressor with a variable vaned diffuser. Chin. J. Aeronaut. 2018, 31, 1222–1231. [Google Scholar] [CrossRef]
- Iwakiri, K.; Furukawa, M.; Ibaraki, S.; Tomita, I. Unsteady and Three-Dimensional Flow Phenomena in a Transonic Centrifugal Compressor Impeller at Rotating Stall. In Proceedings of the ASME Turbo Expo 2009: Power for Land, Sea, and Air, Volume 7: Turbomachinery, Parts A and B. Orlando, FL, USA, 8–12 June 2009; pp. 1611–1622. [Google Scholar] [CrossRef]
- Li, Z.L.; Cheng, H.Z.; Wu, Y.F.; Lu, X.G.; Han, G. Numerical investigation of the self-induced unsteadiness phenomenon in the impeller of a high-loading centrifugal compressor. Phys. Fluids 2023, 35, 106119. [Google Scholar] [CrossRef]
- Wang, W.L.; Yang, C.; Hu, C.X.; Zhang, H. Investigation of tip leakage flow unsteadiness and rotating instability in a centrifugal compressor impeller. Proc. Inst. Mech. Eng. Part D J. Automob. Eng. 2022, 236, 621–638. [Google Scholar] [CrossRef]
- Zhao, H.; Wang, Z.; Xi, G. Unsteady flow structures in the tip region for a centrifugal compressor impeller before rotating stall. Sci. China Technol. Sci. 2017, 60, 924–934. [Google Scholar] [CrossRef]
- Kowshik, C.K.P.; Tsugita, D.; Takeyama, Y.; Ohta, Y. Rotating Instability in a Centrifugal Blower With Shrouded Impeller. In Proceedings of the ASME Turbo Expo 2012: Turbine Technical Conference and Exposition, Volume 3: Cycle Innovations; Education; Electric Power; Fans and Blowers; Industrial and Cogeneration. Copenhagen, Denmark, 11–15 June 2012; pp. 685–694. [Google Scholar] [CrossRef]
- Jyothishkumar, V.; Mihaescu, M.; Senmlitsch, B.; Fuchs, L. Numerical flow analysis in centrifugal compressor near surge condition. In Proceedings of the 43rd Fluid Dynamics Conference, San Diego, CA, USA, 24–27 June 2013. [Google Scholar] [CrossRef]
- Grondin, J.; Trébinjac, I.; Rochuon, N. Rotating Instabilities Versus Rotating Stall in a High-Speed Centrifugal Compressor. In Proceedings of the ASME Turbo Expo 2018: Turbomachinery Technical Conference and Exposition, Volume 2B: Turbomachinery. Oslo, Norway, 11–15 June 2018; p. V02BT44A025. [Google Scholar] [CrossRef]
- Tomita, I.; Ibaraki, S.; Furukawa, M.; Yamada, K. The Effect of Tip Leakage Vortex for Operating Range Enhancement of Centrifugal Compressor. J. Turbomach. 2013, 135, 051020. [Google Scholar] [CrossRef]
- Inoue, M.; Kuroumaru, M.; Tanino, T.; Yoshida, S.; Furukawa, M. Comparative Studies on Short and Long Length-Scale Stall Cell Propagating in an Axial Compressor Rotor. J. Turbomach. 2001, 123, 24–30. [Google Scholar] [CrossRef]
- Zhang, M.; Wu, W. Role of the Inducer in Flow Instability of a High-Speed Centrifugal Compressor Impeller. In Proceedings of the ASME Turbo Expo 2023: Turbomachinery Technical Conference and Exposition, Volume 13D: Turbomachinery—Multidisciplinary Design Approaches, Optimization, and Uncertainty Quantification; Radial Turbomachinery Aerodynamics; Unsteady Flows in Turbomachinery. Boston, MA, USA, 26–30 June 2023; p. V13DT35A016. [Google Scholar] [CrossRef]
- Yang, B.; Cao, T.; Hayashi, Y.; Kanzaka, T.; Tomita, I. Effects of the Blade Tip Loading Distribution on Transonic Centrifugal Impeller Stability. In Proceedings of the ASME Turbo Expo 2024: Turbomachinery Technical Conference and Exposition, Volume 12D: Turbomachinery—Multidisciplinary Design Approaches, Optimization, and Uncertainty Quantification; Radial Turbomachinery Aerodynamics; Unsteady Flows in Turbomachinery. London, UK, 24–28 June 2024; p. V12DT35A017. [Google Scholar] [CrossRef]
- Baltadjiev, N.D.; Lettieri, C.; Spakovszky, Z.S. An Investigation of Real Gas Effects in Supercritical CO2 Centrifugal Compressors. J. Turbomach. 2015, 137, 091003. [Google Scholar] [CrossRef]
- Wang, Y.; Song, M.; Xin, J.; Yang, B. Analysis of the Flow Field at the Tip of an Axial Flow Compressor during Rotating Stall Process Based on the POD Method. Processes 2023, 11, 69. [Google Scholar] [CrossRef]
- Schmid, P. Dynamic mode decomposition of numerical and experimental data. J. Fluid Mech. 2010, 656, 5–28. [Google Scholar] [CrossRef]
- He, X.; Fang, Z.; Rigas, G.; Vahdati, M. Spectral proper orthogonal decomposition of compressor tip leakage flow. Phys. Fluids 2021, 33, 105105. [Google Scholar] [CrossRef]
- Yang, Z.R.; Liu, Y.M.; Sun, S.J.; Wang, J.H. Investigation of modal evolution and flow instability characteristics during radial diffuser stall in high-load centrifugal compressor with a throttle model. Phys. Fluids 2025, 37, 075221. [Google Scholar] [CrossRef]
- Xu, L.C.; Liu, Z.X.; Li, X.J.; Zhao, M.; Zhao, Y.J.; Zhou, T. Dynamic mode characteristics of flow instabilities in a centrifugal compressor impeller. Aerosp. Sci. Technol. 2023, 142, 108707. [Google Scholar] [CrossRef]
- Broatch, A.; García-Tíscar, J.; Roig, F.; Sharma, S. Dynamic mode decomposition of the acoustic field in radial compressors. Aerosp. Sci. Technol. 2019, 90, 388–400. [Google Scholar] [CrossRef]
- Sun, L.H.; Yang, J.; Liu, X.H.; Sun, D.K.; Dong, X. Diagnosis of unsteady disturbance characteristics induced by the tip leakage vortex in a compressor based on data-driven modal decomposition methods. Phys. Fluids 2024, 36, 055151. [Google Scholar] [CrossRef]
- Kou, J.Q.; Zhang, W.W. An improved criterion to select dominant modes from dynamic mode decomposition. Eur. J. Mech. B/Fluids 2017, 62, 109–129. [Google Scholar] [CrossRef]
- Brokopp, R.; Gronski, R. Small engine components test facility compressor testing cell at NASA Lewis Research Center. In Proceedings of the 17th Aerospace Ground Testing Conference, Nashville, TN, USA, 6–8 July 1992; p. 3980. [Google Scholar] [CrossRef]
- Denton, J.D. Loss Mechanisms in Turbomachines. In Proceedings of the ASME 1993 International Gas Turbine and Aeroengine Congress and Exposition, Volume 2: Combustion and Fuels; Oil and Gas Applications; Cycle Innovations; Heat Transfer; Electric Power; Industrial and Cogeneration; Ceramics; Structures and Dynamics; Controls, Diagnostics and Instrumentation; IGTI Scholar Award. Cincinnati, OH, USA, 24–27 May 1993; p. V002T14A001. [Google Scholar] [CrossRef]
- Hah, C.; Bergner, J.; Schiffer, H. Tip Clearance Vortex Oscillation, Vortex Shedding and Rotating Instabilities in an Axial Transonic Compressor Rotor. In Proceedings of the ASME Turbo Expo 2008: Power for Land, Sea, and Air, Volume 6: Turbomachinery, Parts A, B, and C. Berlin, Germany, 9–13 June 2008; pp. 57–65. [Google Scholar] [CrossRef]
Disclaimer/Publisher’s Note: The statements, opinions and data contained in all publications are solely those of the individual author(s) and contributor(s) and not of MDPI and/or the editor(s). MDPI and/or the editor(s) disclaim responsibility for any injury to people or property resulting from any ideas, methods, instructions or products referred to in the content. |
© 2025 by the authors. Licensee MDPI, Basel, Switzerland. This article is an open access article distributed under the terms and conditions of the Creative Commons Attribution (CC BY) license (https://creativecommons.org/licenses/by/4.0/).

