Abstract
This article presents an experimental study on the hydrodynamics of coolant flow within the pressure vessel of a small modular reactor (SMR) cooled with water, including areas such as the annular downcomer, bottom chamber, and core-simulating channels that are being developed for use in land-based nuclear power plants. This paper describes the experimental setup and test model, measurement techniques used, experimental conditions under which this research was conducted, and results obtained. This study was conducted at the Nizhny Novgorod State Technical University (NNSTU) using a high-pressure aerodynamic testing facility and a scale model that included structural components similar to those found in loop-type reactors. Experiments were performed with Reynolds numbers (Re) ranging from 20,000 to 50,000 in the annular downcomer space of the test model. Two independent techniques were used to simulate the non-uniform flow field in the pressure vessel: passive impurity injection (adding propane to the airflow) and hot tracer (heating one of the reactor circulation loops). The axial velocity field at the inlet to the reactor core was also investigated. This study provided information about the spatial distribution of a tracer within the coolant flow in the annular downcomer and bottom chamber of the pressure vessel. Data on the distribution of the contrasting admixture are presented in plots. The swirling nature of the coolant flow within the pressurized vessel was analyzed. It was shown that the intensity of mixing within the bottom chamber of the pressure vessel is influenced by the presence of a central vortex. Parameters associated with the mixing of admixtures within the model for the pressure vessel were estimated. Additionally, the possibility for simulating flow with different temperature mixing processes using isothermal models was observed.
1. Introduction
The development of SMRs requires innovative design solutions to ensure both efficiency and safety. Specifically, the Russian project for a ground-based SMR nuclear power plant using water as a coolant assumes the possibility of partially shutting down the heat exchange surfaces of the steam generator under normal operating conditions [1]. This operational strategy inevitably leads to the co-existence of coolant streams with significant temperature and physical property differences within the reactor pressure vessel.
The implementation of such operational modes requires a rigorous safety justification. Traditional, conservative approaches that do not take into account the effects of turbulent mixing of nonuniform flows within the reactor vessel may lead to unjustified restrictions on operating conditions and power levels. While the design analysis of new structures and operating conditions offers an alternative approach, its reliability depends directly on the accuracy of input data. Critical parameters for ensuring the thermal integrity of the core include detailed measurements of velocity, temperature, and impurity concentration fields in mixing areas.
The study of turbulent mixing in complex configurations, which are typical of reactor vessels, remains an urgent task. International projects such as the European FLOWMIX-R project at the ROCOM facility have made a significant contribution by creating a database of high-precision experimental data for verifying CFD methods used in pressurized water reactors [2,3,4,5,6,7,8]. These data have been widely used to validate CFD codes [9,10,11,12,13,14]. However, there are still some important limitations. On the one hand, the influence of key physical parameters on the mixing process (dimensionless concentration and dimensionless flow velocity) under conditions that correspond to partial shutdowns of heat exchangers has not been studied in sufficient detail. On the other hand, additional research is needed to scale the results from model installations to full-scale reactor systems.
The wide range of CFD techniques (different sampling methods, grid generation methods, and turbulence models) results in significant variations in predictions even for the same conditions, highlighting the complexity of the modeling process and the crucial role of experimental validation. Experiments on large-scale reactor vessel models provide a powerful tool for characterizing complex flow structures and simulating non-uniform temperature fields at the core entrance due to mixing flows.
The aim of this study was to collect detailed experimental data on the hydrodynamics and turbulent mixing in an annular downcomer of the test model under conditions that simulate a partial shutdown of the heat exchange surface. To conduct a comprehensive analysis, we used both isothermal and non-isothermal methods of measurement, followed by a comparative analysis of the results. This allowed us to assess the suitability of the isothermal approach for modeling temperature mixing.
2. Experimental Setup
2.1. Aerodynamic Test Facility
One of the phases of a comprehensive research project aimed at investigating the hydrodynamic aspects of coolant flow interactions within a nuclear reactor’s annular downcomer involved an aerodynamic experiment performed on a high-pressure, aerodynamic test bench at NNSTU (Figure 1). This bench is an open-loop aerodynamic facility consisting of the following key components:
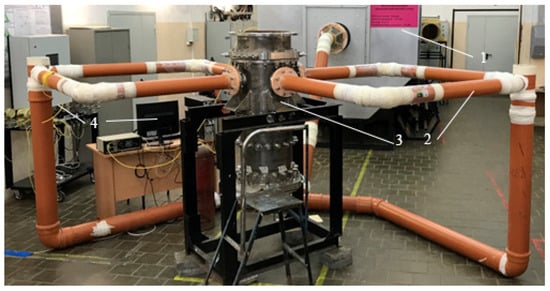
Figure 1.
Experimental facility: (1) surge tank, (2) flow distribution system, (3) test section, and (4) instrumentation and data acquisition system.
- High-Pressure Centrifugal Fan: Provides the motive force for the airflow.
- Surge Tank: Dampens flow pulsations and ensures stable inlet conditions.
- Flow Distribution System: A system of geometrically identical pipelines branching from the surge tank outlet; inner diameter is 100 mm.
- Test Section: Includes the scaled reactor pressure vessel test model.
- Instrumentation and Data Acquisition System: Measures flow parameters.
The symmetric flow distribution system ensures uniform flow delivery and precise control of individual circuit flow rates to the model inlets. During steady-state operation, fluctuations in key operating parameters (flow rate and pressure) were maintained below 3%.
2.2. Scaled Annular Downcomer Test Model
The test section features a non-transparent, scaled model (1:5) of a water-cooled SMR pressure vessel (Figure 2), replicating essential geometric features relevant to downcomer hydrodynamics, as follows:
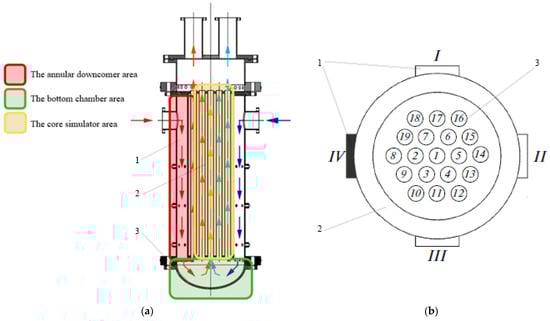
Figure 2.
Test model. (a) Scheme of the test model: (1) annular downcomer area, (2) bottom chamber area, and (3) core simulator area. (b) Cross-sectional view with channel numbers: (1) inlet nozzles, (2) annular downcomer, and (3) core simulator. These colored arrows represent different inlet flows.
- Inlet Configuration: Four radial nozzles positioned at 90° intervals with inner diameters of 100 mm.
- Annular Downcomer: Outer\inner diameters of 400\270 mm.
- Bottom Chamber: Formed by an elliptical bottom head and the lower core support structure.
- Core Simulator: Consists of 19 vertical flow channels. Calibrated orifices installed at the inlet of each channel provide precise hydraulic resistance, simulating the pressure drop characteristics of a reactor core.
- Upper Outlet Chamber: Collects flow exiting the core channels.
Air enters via the radial nozzles, flows downwards through the annular downcomer, turns 180° into the bottom chamber, flows upwards through the core simulator channels, and exits via the upper outlet chamber.
3. Methodologies and Devices
Two independent methodologies were used to study turbulent mixing processes within the downcomer under simulated partial heat exchanger shutdown operating modes.
3.1. Isothermal Tracer Gas Method (Case 1)
The purpose of this method was to simulate mixing flows with different scalar properties (concentration) under isothermal conditions. Propane (C3H8) was introduced as a passive indicator gas into one input circuit. The concentration fields of the indicator downstream were measured.
Control and measuring devices were as follows:
- Indicator feed: Controlled by a precision flow meter Bronkhorst El-Flow F-201CV with an accuracy of ±0.5% of readings.
- Concentration measurement: Non-dispersive infrared gas analyzers ADK-03P. The system was calibrated using certified reference mixtures; measurement error: <±15 ppm by volume.
- Maximum tracer concentration ≤ 0.15% vol (1500 ppm). Tracer-to-main-flow ratio ≤ 0.05 (5 L/s tracer and 0.1 m3/s main flow per circuit), ensuring negligible impact on flow hydrodynamics (density change < 0.1%).
3.2. Non-Isothermal Heat Tracer Method (Case 2)
In this study, the main focus was investigating the flow of mixing with significant differences in temperature and density. Heated air was supplied to one inlet circuit. Resulting temperature fields were measured.
Control and measuring devices were as follows:
- Heating and low control: Precision flowmeter (accuracy: ±0.5%) and electrical heaters.
- Temperature measurement: Type K thermocouples with a diameter of 0.5 mm and NTC 2K thermistors. These devices were individually calibrated to an accuracy of ±0.2 °C using the temperature calibrator ELEMER-KT-650K. During the experiment, data were collected using a digital multimeter A34980 from Keysight Technologies. This device uses a thermal insulation and compensation design to provide precise temperature control for high-resolution scanning probe microscopy.
The temperature difference between the cold and hot streams during the experiment was approximately 40 °C. This is why the density difference between the two streams was approximately 12–15%. This can be seen in the example of actual operating conditions at the Russian SMR nuclear power plant, where there was a partially damaged heat exchange surface. In this instance, the temperature of the primary coolant entering the reactor core was 277 °C and the temperature at the outlet from the core was 313 °C. Therefore, the difference in density between coolants at these different temperatures was approximately 10–15%.
3.3. Sensor Locations
In each of these cases, sensors were installed at the same locations in the test model (Figure 3). The first row was located 270 mm from the inlet of the nozzles. In total, there were three sensor levels in the experimental model, spaced 230 mm apart. Each level had 18 sensor installation points, so at each level, the sensors were positioned 20 degrees apart from each other in the azimuthal direction. Additionally, each sensor level was rotated 13 degrees relative to the previous one. The sensitive parts of the sensors were placed in the center of the annular gap of the downcomer.
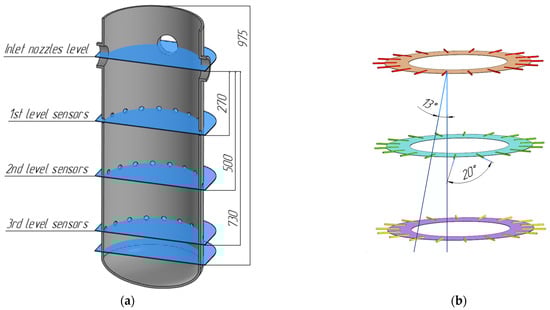
Figure 3.
Sensor locations of the test model: (a) location of test measuring levels and (b) relative positions of sensors in three planes.
3.4. Velocity Field Characterization
The flow rate was measured in the pipeline system before the test model in order to confirm the operating parameters, as well as directly within the experimental model to measure the axial bulk velocity field using a core simulator.
A thermoanemometer (E+E elektronik, Engerwitzdorf, Austria) E + E OmniPort 30 equipped with a LogProbe 60 sensor was used to measure the airflow velocity in sections of the pipe before the test model. This device has a resolution of ±0.2 m/s ± 2% of the measured velocity.
Inside the experimental model, the airflow velocity was measured in the lower elliptical bottom and in the channels simulating the core. For this purpose, the sensitive part of the Pitot–Prandtl tube was wound through the upper drain chamber of the test model sequentially into each of the 19 channels simulators of the core. These Pitot–Prandtl tubes had a small diameter on the sensitive part (diameter 4 mm), so their installation as imitation channels did not significantly affect the flow of the coolant. These devices were also individually calibrated using a high-precision calibrator (StreamLine Pro by Dantec Dynamics A/S, Skovlunde, Denmark). This ensured the measurement accuracy of the sensors was within ±2% of the measured velocity.
3.5. Test Matrix and Operating Conditions
The Reynolds number (Re) was varied across 20,000, 30,000, and 50,000 based on the downcomer hydraulic diameter, controlled by the fan speed. The maximum total flow rate was 0.4 m3/s for the Re = 50,000 operational mode. The main flow temperature was 20 °C, and the maximum pressure drop across the model was ≤4 kPa (Ma < 0.12, confirming the incompressible flow assumption).
For each of these operational modes, we conducted
- One isothermal tracer gas experiment (propane injection into one loop).
- One non-isothermal experiment (heating one loop to ΔT ≈ 40 °C, which represents the temperature difference between the cold and hot loops).
4. Representativeness of Experimental Studies
One of the key issues raised by these studies is the possibility and correctness of modeling the processes of non-isothermal mixing of highly turbulent liquid flows on simple isothermal models using the contrast admixture method.
The use of the impurity diffusion technique in experimental research allows the investigation of temperature and concentration field distributions in the coolant stream using isothermal aerodynamic models. The addition of an admixture to the main flow has been extensively employed in studies of thermal–hydraulic and mass transfer processes [15,16,17]. The theoretical foundation for this technique is based on similar types of differential equations for heat and mass transfer.
In a moving, highly turbulent fluid flow, temperature and concentration fields away from the boundaries are influenced by the velocity field. This velocity field is governed by hydrodynamic equations and is affected by the generation of large vortices determined by the channel’s geometry.
The main question addressed in this paper is the validity of using isothermal tracer methods to model non-isothermal mixing processes in highly turbulent flows. This approach is based on the Reynolds analogy between heat and mass transfer, which is expressed through a generalized scalar transport equation [18,19,20,21,22].
where p and u are the fluid density (kg/m3) and the fluid velocity (m/s) of the flow, Φ—transported scalar, Гeff is the diffusion coefficient (m2/s), and Sφ—source term for this scalar.
This equation for these specific cases will change.
- -
- For the heat transfer:
- -
- For the mass transfer:
The equivalence of thermal and concentration fields requires the simultaneous fulfillment of three conditions, as follows:
- Turbulent transport similarity:
- 2.
- Dominance of turbulent diffusion:
For a highly turbulent flow (Re >> 104) far from the walls, the following condition applies:
- 3.
- Negligible buoyancy effects:
The value of the Richardson number being less than 0.1 suggests that the influence of buoyancy forces on the turbulent structure is negligible. Therefore, under these conditions (high Re, low Ri), the transport and mixing of scalars (heat and mass) are primarily governed by turbulent diffusion mechanisms, while the overall flow dynamics remain dominated by the mean velocity field and Reynolds number. The effective diffusion coefficient is primarily influenced by the turbulent component, which is determined by flow parameters rather than flow properties.
The experiment provided data on the distribution of moving flow velocity, as well as a description of the temperature field and concentration of admixtures in different areas of the model. These results are presented below in the form of dimensionless relative concentrations, temperatures, and velocities.
The dimensionless concentrations and dimensionless temperatures were calculated using the following formulas:
where max and min are the maximum and minimum admixture concentrations/flow temperature and meas is the measured current admixture concentration/flow temperature.
The values φ or θ can be considered to be the scalar of Φ in Equation (1).
The dimensionless velocity is determined in the following way:
where wi is the axial velocity in the current channel simulating the core and wave is the cross-section-averaged velocity.
5. Results
During the investigation into the flow patterns of the coolant as it moves through the annular downcomer from the inlet nozzles to the core simulator, several important observations were made, as follows:
- -
- Swirling Motion: In all experimental conditions, a hot temperature spot and propane impurity were detected in the region opposite the injection point, confirming the presence of swirling flow during its passage through the annular downcomer. The downcomer’s geometry caused significant flow deflection, with angles ranging from ~120° at a Reynolds number of 20,000 to 170° to 180° at other Reynolds numbers. This deflection led to a helical motion of the coolant, as seen in contrast distribution charts (Figure 4 and Figure 5). All measurements were taken under steady-state conditions (fluctuations < 3%).
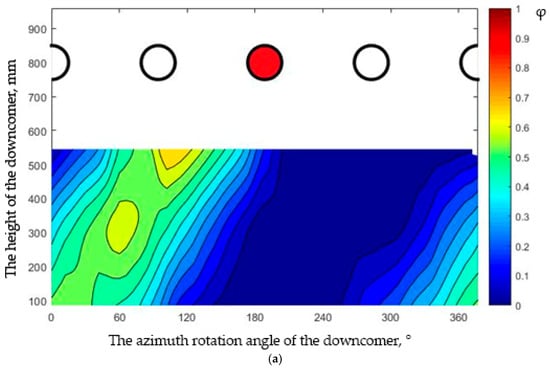
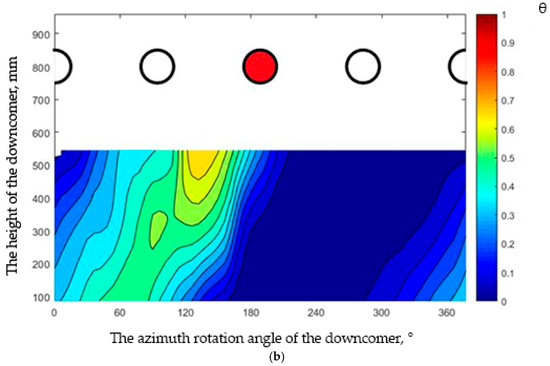 Figure 4. A chart of the flow-mixing process in the annular downcomer area at a Reynolds number of 30,000. The red circle is the inlet loop with the admixture: (a) Case 1 and (b) Case 2.
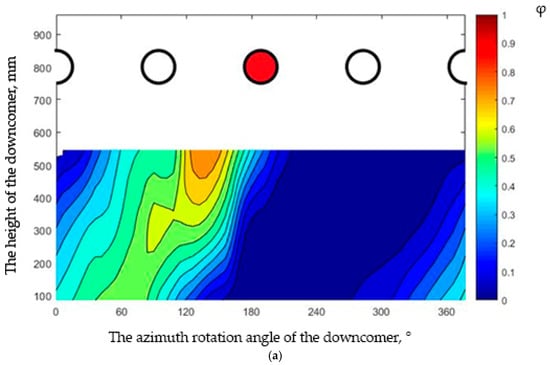
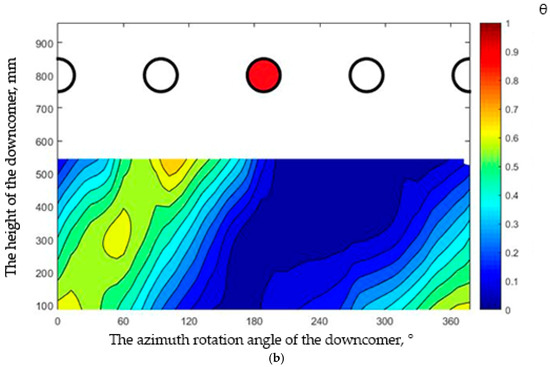 Figure 5. A chart of the flow-mixing process in the annular downcomer area at a Reynolds number of 50,000. The red circle is the inlet loop with the admixture: (a) Case 1 and (b) Case 2.
- -
- Contrast Jet Dynamics: The opening angle of the contrast jet ranged from 15° to 20°, highlighting the stability of flow redirection within the annular downcomer regardless of any influence from the type of admixture during the mixing process.
- -
- Toroidal Vortex Formation: A sudden change in direction at the outlet of the annular downcomer into the bottom chamber, which has a large volume geometry, triggered the formation of a toroidal vortex. This phenomenon is consistent with previous studies [22].
- -
- Axial Vortex Effect: The admixture dimensionless value maps (Figure 6) show a shift in the position of maximum concentration as the coolant moved from the outlet of the annular downcomer to the core-simulating channels. The angle of rotation of the contrasting spot in the bottom chamber, relative to the outlet of the annular downcomer, ranged from 50 to 60 degrees for all tested Reynolds numbers, regardless of the type of admixture used. This shift may have been caused by the formation of an additional axial vortex in the bottom chamber.
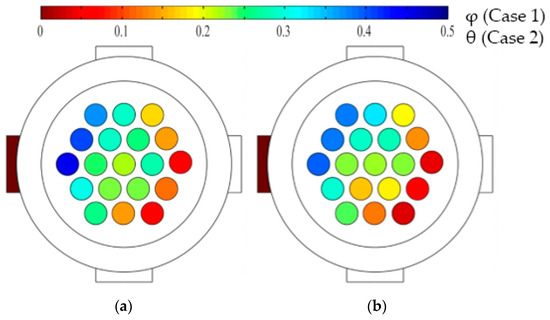 Figure 6. A chart of the flow-mixing process in the bottom chamber area. The dark red leg is the inlet loop with the admixture: (a) Case 1, Re = 30,000 and (b) Case 2, Re = 50,000.
- -
- Non-uniform Mixing: Both propane and hot jet experiments demonstrated incomplete mixing of the contrast admixture. Significant variations in relative concentration were observed at the core channel inlets. For example, at Re = 30,000, the minimum relative concentration (0.05) occurred in channel 8, while channel 12 exhibited a peak concentration of 0.44.
The measurement of velocity in the core simulation channels allowed us to identify two main areas with different velocity distributions (Figure 7), as follows:
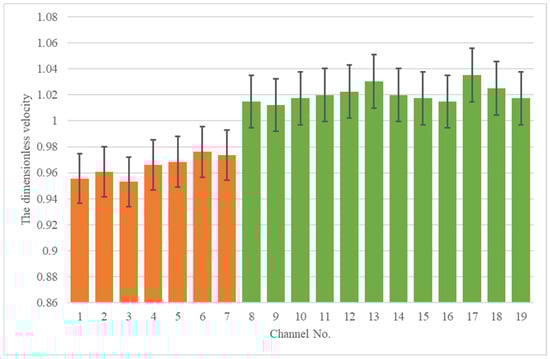
Figure 7.
Distribution of axial velocities in the channels of the core simulator Re = 50,000.
- -
- Central Channels: The flow velocities in the seven central channels were consistently below the average across the cross-section.
- -
- Peripheral Channels: The flow velocities in the outer row exceeded the average cross-sectional value.
These differences in velocity were linked to variations in the pressure field in the bottom chamber. The pronounced total pressure drops at the inlet of the core simulator, caused by a dominant central vortex, was crucial in shaping this hydrodynamic asymmetry.
Generalized experimental results, which include quantitative measurements of velocity and pressure, are presented in Table 1.

Table 1.
Comparison of results of all experimental modes.
6. Conclusions
This experimental study provided valuable insights into hydrodynamic behavior and mixing mechanisms through its investigation of coolant flow-mixing phenomena in an SMR model, employing both isothermal and non-isothermal approaches. The mathematical foundation rested on the equivalence of turbulent Schmidt (Scturb) and Prandtl (Prturb) numbers. Principal findings and conclusions are summarized below.
- (1)
- Flow Swirling and Mixing Dynamics
- -
- The annular downcomer area was dominated by swirling motion, with observed angles ranging from 120 degrees to 180 degrees under varying experimental conditions.
- -
- An additional 60° flow rotation was consistently induced in the bottom chamber, independent of the Reynolds number.
- -
- Convective turbulent transfer in the annular downcomer emerged as the primary driver of interloop mixing, underscoring the limited efficacy of mixing devices in the bottom chamber.
- (2)
- Dependence on Reynolds Number
- -
- Increasing the Reynolds number from 20,000 to 50,000 had a negligible impact on the key turbulent mixing parameters, such as the maximum and minimum relative concentrations and temperature, the contrast jet opening angle (between 15° and 20°), and the flow deflection in the bottom chamber.
- -
- However, there was some sensitivity in the swirling angle in the downcomer to the Reynolds number, particularly within the range between 20,000 and 30,000.
- (3)
- Validation of Isothermal Modeling ApproachThe remarkable coincidence of dimensionless concentration (isothermal) and temperature (non-isothermal) distributions provides strong experimental validation, as follows:
- -
- Isothermal tracer experiments with a passive scalar accurately simulated non-isothermal mixing for reactor hydrodynamics under conditions of a high Reynolds number (Re > 104) and weak buoyancy (Richardson number Ri < 0.1).
- -
- This equivalence demonstrates that turbulent scalar transfer (mass and heat) is governed by a single dominant mechanism in these flows.
- -
- Differences in molecular diffusion processes are compensated for by the similarity in turbulent transport, confirming that Scturb = Prturb holds under the specified conditions.
- (4)
- Method LimitationsThe Reynolds analogy (Scturb = Prturb) breaks down
- -
- Where molecular transfer dominates if the molecular Prandtl number differs significantly from the molecular Schmidt number.
- -
- In flows with strong buoyancy effects (Ri > 0.1) where stratification distorts the turbulent structure.
- (5)
- Project Design Changes
- -
- To optimize coolant mixing in SMR designs that require a uniform flow property distribution, additional mixing devices should be placed in the annular downcomer rather than in the bottom chamber of the pressure vessel.
- (6)
- Further Research Directions
- -
- The consistency of mixing characteristics across the tested Re range suggests findings may be scalable; however, validation at significantly higher Reynolds numbers is required.
- -
- Detailed characterization of the velocity field, particularly within the downcomer, is essential. To this end, an optically transparent experimental model of the pressure vessel is currently under development for future LDV studies.
- -
- The experimental dataset generated in this study—detailing velocity, concentration, and temperature fields under controlled high-Re and low-Ri conditions—provides a benchmark for validating CFD codes applied to coolant mixing in SMR downcomer geometries.
Author Contributions
Data curation, A.R.; formal analysis, A.R. and A.D.; funding acquisition, D.S.; investigation, A.R., D.K., and D.N.; methodology, D.D. and A.P.; project administration, A.R.; software, A.R. and A.D.; supervision, S.D.; visualization, A.P. and T.D.; writing—original draft, A.R. and D.D.; writing—review and editing, A.R. All authors have read and agreed to the published version of the manuscript.
Funding
This research was funded by the Ministry of Science and Higher Education of the Russian Federation (project No. FSWE-2024-0003).
Institutional Review Board Statement
Not applicable.
Informed Consent Statement
Not applicable.
Data Availability Statement
Original contributions presented in this study are included in the article; further inquiries can be directed to the corresponding author.
Conflicts of Interest
The authors declare no conflicts of interest.
Abbreviations
The following abbreviations are used in this manuscript:
| CFD | Computational Fluid Dynamics |
| LDV | Laser Doppler Velocimetry |
| NNSTU | Nizhniy Novgorod State Technical University |
| ROCOM | Rosendorf Coolant Mixing Model |
| SMR | Small Modular Reactor |
References
- Petrunin, V.V.; Sheshina, N.V.; Fateev, S.A.; Kurachenkov, A.V.; Shchekin, D.V.; Brykalov, S.M.; Bezrukov, A.A. Scientific and technical aspects of developing a RITM-200N innovative reactor for SNPPs. At. Energy 2023, 134, 1–10. [Google Scholar] [CrossRef]
- Rohde, U.; Kliem, S.; Hohne, T.; Karlsson, R.; Hemstrom, B.; Lillington, J.; Toppila, T.; Elter, J.; Bezrukov, Y. Fluid mixing and flow distribution in the reactor circuit, measurement data base. Nucl. Eng. Des. 2005, 235, 421–443. [Google Scholar] [CrossRef]
- Bieder, U.; Fauchet, G.; Betin, S.; Kolev, N.; Popov, D. Simulation of mixing effects in a VVER-1000 reactor. Nucl. Eng. Des. 2007, 237, 1718–1728. [Google Scholar] [CrossRef]
- Kleim, S.; Suhnel, T.; Rohde, U.; Hohne, T.; Prasser, H.-M.; Weiss, F.-P. Experiments at the mixing test facility ROCOM for benchmarking of CFD codes. Nucl. Eng. Des. 2008, 238, 566–576. [Google Scholar] [CrossRef]
- Suikkanen, H.; Telkkä, J.; Räsänen, A.; Kotro, E.; Böttcher, M.; Rueda-Villegas, L.; Sunkova, V. SMR core thermal hydraulic experiments and code validation with the MOTEL test facility. Nucl. Eng. Des. 2025, 439, 114056. [Google Scholar] [CrossRef]
- Prasser, H.-M.; Kliem, S. Coolant mixing experiments in the upper plenum of the ROCOM test facility. Nucl. Eng. Des. 2014, 276, 30–42. [Google Scholar] [CrossRef]
- Truong, T.; Suikkanen, H.; Hyvärinen, J. Reactor Core Conceptual Design for a Scalable Heating Experimental Reactor, LUTHER. J. Nucl. Eng. 2021, 2, 207–214. [Google Scholar] [CrossRef]
- Sanchez-Espinoza, V.H.; Gabriel, S.; Suikkanen, H.; Telkkä, J.; Valtavirta, V.; Bencik, M.; Kliem, S.; Queral, C.; Farda, A.; Abéguilé, F.; et al. The H2020 McSAFER project: Main goals, technical work program, and status. Energies 2021, 14, 6348. [Google Scholar] [CrossRef]
- Hu, P.; Chen, G.; Tian, Z.; Kang, H.; Jin, Y. Appah Investigating on multi-RANS models coupling simulation for flow mixing experiments. Ann. Nucl. Energy 2020, 142, 107389. [Google Scholar] [CrossRef]
- Kim, Y.I.; Bae, Y.; Chung, Y.J.; Kim, K.K. CFD simulation for thermal mixing of a SMART flow mixing header assembly. Ann. Nucl. Energy 2015, 85, 357–370. [Google Scholar] [CrossRef]
- Farkas, I.; Hutli, E.; Farkas, T.; Takács, A.; Guba, A.; Tóth, I. Validation of computational fluid dynamics calculation using Rossendorf coolant mixing model flow measurements in primary loop of coolant in a pressurized water reactor model. Nucl. Eng. Technol. 2016, 48, 941–951. [Google Scholar] [CrossRef]
- Heib, C.; Swiecicki, L.; Glantz, T.; Freitas, R. Validation of ANSYS CFX code on ROCOM tests performed in the framework of the OECD PKL2 project. In Proceedings of the 15th International Topical Meeting on Nuclear Reactor Thermalhydraulics (NURETH-15), Pisa, Italy, 12–17 May 2013. [Google Scholar]
- Höhne, T.; Kliem, S. Rohde Buoyancy-driven mixing studies of natural circulation flows using rossendorf coolant mixing model experiments and CFD. Chem. Ing. Tech. 2011, 83, 1282–1289. [Google Scholar] [CrossRef]
- Li, J.; Wang, M.; Fang, D.; Wang, J.; Liu, D.; Tian, W.; Qiu, S.; Su, G. CFD simulation on the transient process of coolant mixing phenomenon in reactor pressure vessel. Ann. Nucl. Energy 2021, 153, 108045. [Google Scholar] [CrossRef]
- Dmitriev, S.; Demkina, T.; Dobrov, A.; Doronkov, D.; Kuritsin, D.; Nikolaev, D.; Pronin, A.; Riazanov, A.; Solntsev, D. Modeling and Visualization of Coolant Flow in a Fuel Rod Bundle of a Small Modular Reactor. Fluids 2024, 9, 235. [Google Scholar] [CrossRef]
- Castellani, F.; Curzio, G.; Pieve, L.; Grazzini, R. Experimental tests on the applicability of a radioactive tracer technique for measuring coolant mixing in nuclear reactor fuel subassemblies. Nucl. Eng. Des. 1975, 32, 105–109. [Google Scholar] [CrossRef]
- Samoilov, O.B.; Shipov, D.L.; Kupriyanov, A.V.; Sholin, E.V.; Vishneva, T.Y.; Molodtsov, A.A.; Osin, A.B.; Dmitriev, S.M.; Khrobostov, A.E.; Doronkov, D.V.; et al. Efficiency studies of heat-transfer intensifier grids in TVSA-T model fuel assemblies. At. Energy 2020, 128, 17–23. [Google Scholar] [CrossRef]
- Yu, A. Snegirev, High-Performance Computing in Technical Physics. In Numerical Modeling of Turbulent Flows: Training Manual; Politekhnicheskii Universitet: St. Petersburg, Russia, 2009. [Google Scholar]
- Kays, W.M. Turbulent Prandtl number—Where are we? ASME J. Heat Transf. 1994, 116, 284–295. [Google Scholar] [CrossRef]
- Jørgensen, F.E. How to Measure Turbulence with Hot-Wire Anemometry; Dantec Dynamics: Skovlunde, Denmark, 2007. [Google Scholar]
- Monin, A.S.; Yaglom, A.M. Statistical Fluid Mechanics; MIT Press: Cambridge, MA, USA, 1971; Volume 1. [Google Scholar]
- Mitrofanova, O.V. Hydrodynamics and Heat and Mass Transfer of Swirling Flows in the Channels of Nuclear Power Facilities; Fizmatlit: Moscow, Russia, 2010. [Google Scholar]


Disclaimer/Publisher’s Note: The statements, opinions and data contained in all publications are solely those of the individual author(s) and contributor(s) and not of MDPI and/or the editor(s). MDPI and/or the editor(s) disclaim responsibility for any injury to people or property resulting from any ideas, methods, instructions or products referred to in the content. |
© 2025 by the authors. Licensee MDPI, Basel, Switzerland. This article is an open access article distributed under the terms and conditions of the Creative Commons Attribution (CC BY) license (https://creativecommons.org/licenses/by/4.0/).