Article

Analysis of Disruption of Airflow and Particle Distribution by Surgical Personnel and Lighting Fixture in Operating Rooms

by
Vikas Valsala Krishnankutty
*,
Chandrasekharan Muraleedharan
and
Arun Palatel
Department of Mechanical Engineering, NIT Calicut, Kozhikode 673601, Kerala, India
*
Author to whom correspondence should be addressed.
Fluids 2025, 10(9), 225; https://doi.org/10.3390/fluids10090225
Submission received: 11 June 2025 / Revised: 29 July 2025 / Accepted: 7 August 2025 / Published: 27 August 2025
(This article belongs to the Section Geophysical and Environmental Fluid Mechanics)

Abstract

Surgical procedures have significantly contributed to the increased life expectancy of the global population. The surgical procedures are carried out in specialised rooms within a healthcare facility normally designated as operating rooms or operating theatres. These rooms require meticulously designed heating, ventilating, and air conditioning systems to ensure optimal thermal comfort, strict sterility, and effective removal of airborne contaminants and anaesthetic gases. The performance of the system directly affects the risk of surgical site infections and associated post-operative complications. This study presents a computational fluid dynamics analysis of disturbance on airflow and particulate distribution within a representative operating room by the surgical staff and lighting fixtures concerning supply air velocity. The removal of the maximum possible particulate matter, precise control of air temperature and humidity, and unidirectional airflow in the surgical field were incorporated as key design strategies. The species transport model simulations revealed that while laminar airflow offers superior protection in terms of surgical site sterility, its performance is sensitive to disruptions caused by surgical lighting configurations and variations in supply air velocity. The findings highlight the complexities involved in maintaining optimal airflow conditions and underscore the need for integrative air conditioning design approaches that account for optimal design of surgical lighting and operational setups.

1. Introduction

Surgical operating rooms (ORs) are specialised areas in healthcare facility where a team of experts containing surgeons, anaesthesiologists, nursing assistants, and technical staff carry out surgically invasive procedures on a patient. Such procedures may be for diagnostics, correcting abnormalities, removal of certain portions of body, placement of implants, etc. Surgical interventions breach the natural protective barrier of the skin, exposing internal tissues to the surrounding environment. The heating, ventilating, and air conditioning (HVAC) system in such a room should provide an extremely sterile environment to avoid any possible surgical site infection (SSI) for the patient and cross-infection to the surgical team, and, at the same time, provide comfort for the team members.
According to the American Society for Heating, Refrigerating, and Air Conditioning Engineers (ASHRAE) Handbook [1] and ASHRAE HVAC Design Manual for Hospitals and Clinics [2], the recommended indoor conditions for operating rooms include a temperature range of 18–22 °C and relative humidity (RH) between 50 and 60%. These parameters are designed to balance thermal comfort and infection control. The location of diffusers and air distribution is also important in deciding the thermal comfort in health care facilities [3]. One of the most serious risks in post-operative care is SSI, which may occur within thirty days of the procedure. SSIs are often caused by microbial contamination introduced during or after surgery, with airborne particulate matter—such as dust, skin flakes, and bacteria—being significant contributors.
To mitigate such risks, ORs typically employ specialised ventilation systems that use high-efficiency filtration, laminar or turbulent air distribution, positive pressure differentials, and controlled air exchange rates to maintain a sterile field.
Additional challenges arise from dynamic factors within the OR itself. The movement of surgical personnel, frequency of door openings, and equipment layout can all influence air turbulence and contaminant distribution. Even with a well-designed HVAC system, the surgical team remains a potential source of pathogens, notably Staphylococcus aureus [4], a bacterium commonly present on human skin. Skin scales shed by staff can become airborne and settle onto sterile surfaces, compromising the surgical field.
The HVAC system in an OR must fulfil dual objectives: providing thermal comfort and minimising airborne contaminants in the surgical site. The effectiveness of this largely depends on the air distribution strategy employed in the OR. Various airflow strategies are used in operating rooms, including turbulent mixing flow, temperature-controlled displacement flow, and laminar airflow (LAF) systems. Among these, laminar airflow is widely favoured, as detailed in the work of Whitcomb and Clapper [5], due to its capability to scavenge the internally generated contaminants away from the sterile zone and to preserve surgical site sterility.
The core principle of LAF systems is to establish a uniform, unidirectional air stream. However, the performance of this ideal unidirectional airflow system is often hindered by physical obstructions within the OR, such as surgical lamps, equipment, and staff movement, which introduce turbulence and disrupt clean airflow.
The factors to be considered while designing an operating room are temperature and velocity of airflow [2,6]. The air change rate may be around 20 ACH with a relatively small velocity in order to avoid the recirculation of micro-particles. The room must be maintained at a positive pressure to prevent entry of outside particles during door opening.

1.1. Air Cleanliness

The standard used as the basis for the operation and design of clean rooms is the International Organisation of Standardisation, ISO 14644-1 [7]. According to the standard, there are nine levels of particulate count, as shown in Table 1. An OR should be at least class 7 of ISO-14644-1 or higher.

1.2. Air Distribution Systems of the Operating Room

The air conditioning system in an OR plays a pivotal role in infection control. Depending on the airflow distribution pattern, it can either reduce the risk of SSI or inadvertently promote the transmission of airborne contaminants. Hence, the selection of an appropriate air distribution strategy is of paramount importance in OR design and operation.
In a comprehensive study, Ho et al. [8] conducted a series of three-dimensional CFD analyses to evaluate both thermal comfort and contaminant removal performance within a hospital operating room. Their findings underscored that airflow pattern is a dominant factor influencing the effectiveness of HVAC systems in meeting both comfort and sterility requirements.
The commonly employed air distribution systems in operating rooms are the following:
  • Laminar air flow (LAF);
  • Turbulent mixed flow;
  • Temperature-controlled airflow (TCAF).
Each system presents unique flow characteristics that influence velocity distribution, particle transport, and thermal uniformity, thereby affecting the surgical environment’s overall quality and safety.

1.2.1. Laminar Airflow

The idea of laminar airflow (LAF) is to sweep away any microbiological contaminant or dust present in the surgical area by passing ultra-clean air with a high air change rate. It is the most common type of distribution used in operating rooms. In this system, air is supplied in a parallel manner with low velocities. Laminar flow is basically of two types—horizontal flow and vertical flow. In a horizontal flow system, air is passed from a diffuser placed on the wall, whereas in a vertical flow system, air is supplied from a diffuser mounted on the ceiling. The problems with LAF are the presence of obstacles which disturb the flow patterns and the reverse flow of low-density air, which is present due to the heat loads of various occupants and equipment.

1.2.2. Turbulent Mixed Airflow

This flow is based on the dilution principle. Fresh air entering the room becomes mixed with the contaminants and reduces the concentration. A high-efficiency particulate air (HEPA) filter is used for effective filtration of air before entering the room. A high air change rate is required, which may lead to high energy consumption. The chance of microbial entrapment is also high, which may lead to cross-infections.

1.2.3. Temperature-Controlled Airflow

In this type of flow distribution, cooled and cleaned air coming from the central diffuser is surrounded by clean and warm air coming from another set of diffusers. The warm air prevents the stagnation zones and helps to maintain a temperature difference that helps in the smooth flow of central air, which is cooled without recirculation in the room.
Figure 1 shows a typical ventilation arrangement in an OR indicating the positions of diffusers, grilles, the operating table, etc.
The ventilation arrangement shown in Figure 1 is similar to that of LAF, in which treated supply air enters the OR from the diffuser placed at the centre of the ceiling to supply air vertically downward and is exhausted through the grilles placed on the side walls at a lower level.
Agodi et al. [9] evaluated airborne microbial contamination in ORs during hip and knee replacement surgery and compared the findings with values recommended for joint replacement surgery. Their findings challenged the belief that unidirectional systems always provide acceptable airborne bacterial counts.
The impact of surgical lights on the velocity distribution and airborne contamination level in an operating room was shown by Aganovic et al. [10] with a laminar airflow system. They recorded the velocity and turbulence intensity distributions through a cross-sectional grid of points under surgical lights during non-operating conditions. They also conducted four mock surgeries to detect the microbiological contamination during operating conditions. They found that the mean velocity is significantly reduced from 0.24 m/s to 0.07 m/s when LAF was obstructed by lights.
A numerical investigation of different airflow schemes was carried out by Balacco et al. [11] in a real operating room. They conducted a numerical simulation of airflow and contaminant concentration distribution in a real OR. The results confirmed thermal comfort, indoor air quality (IAQ) level guarantee, and a satisfactory contaminant removal rate in the case of laminar airflow.
Chow et al. [12] integrated the effect of medical lamp position and diffuser discharge velocity on ultra-clean ventilation performance in an operating room. They analysed the effect of the position of the surgical lamp on the flow distribution by considering two different positions of the lamp and conducted experimental studies to find the best orientation.
Romano et al. [13] presented measurement procedures and results obtained during Inspection and Periodic Performance Testing (1228 observations) in a large sample of Italian ORs (175 ORs in 31 Italian hospitals) in their operative life (period from 2010 to 2018). The results confirmed that the ventilation systems were able to maintain the targeted performance levels in the OR operative life. However, they attested that significant differences in real OR contamination control capabilities do exist and could be ascribed to various design choices and different operation and maintenance practices.
Khalil et al. [14] analysed thermal management in hospitals—comfort, air quality and energy utilisation—and found that horizontal flow is an inferior design, whereas downward flow with a central ceiling supply and perforated diffuser over the operating area is better for contaminant removal purposes.
Temperature-controlled airflow ventilation in operating rooms was compared with laminar airflow and turbulent mixed airflow by Alsved et al. [15]. They evaluated three types of ventilation systems for operating rooms with respect to air cleanliness, energy consumption, and comfort of the working environment. They also conducted a working environment survey with questions concerning temperature, draught, noise, etc. They found that LAF and temperature-controlled airflow remove bacteria more efficiently from air compared with turbulent mixed airflow.
James et al. [16] presented a review on the use of laminar flow operating room ventilation during total joint arthroplasty and examined the effectiveness of laminar-flow ventilated operating rooms in preventing post-operative wound infection. They suggested that while bacteria and air particulates are reduced by laminar airflow systems, there is no conclusive effect on the reduction of post-operative wound infections following total joint arthroplasty. They concluded that a combination of strict aseptic technique, prophylactic antibiotics, and good anaesthetic control during surgery remains crucial to reduce post-operative surgical infections.
A comparison of operating room ventilation systems was given by Memarzadeh and Manning [17] in the protection of the surgical site. They modelled the airflow and simulated the contaminant particle distribution within an operating room. They found that airflow patterns significantly affect the performance of both contaminant removal and thermal comfort. They concluded that ventilation systems with laminar flow distribution are the best choice. There are mainly two types of laminar flow available: one is horizontal flow and the other is vertical flow of air.
Stevenson and Jeter [18], in their work, experimentally investigated hospital operating room air distribution using the particle image velocimetry technique. They studied different flow distribution systems. A detailed explanation of particle image velocimetry was given in the work.
In the study carried out by Lin et al. [19], the application of ceiling returns and skirts in order to prevent recirculation was experimentally investigated. Airflow patterns were analysed using smoke flow visualisation and particle image velocimetry (PIV). A novel laser sheet generator was used for illumination of the smoke particles. The effects of the supply flow rate, skirt length, and percentage of ceiling-return flow rate on the recirculation were assessed using the Taguchi method.
Ouyang et al. [20] analysed laminar airflow ventilation capacity to reduce orthopaedic surgery-related SSIs. They determined that the implementation of LAF systems does not result in a significant reduction in the incidence of SSI, bacterial count in the air, or SSI occurrence in orthopaedic operating rooms.
The main requirement in designing the OR is the minimisation of contaminants within the room. It has been found that laminar flow is the best choice for a ventilation system among different flow conditions. Though turbulent airflow increases the effectiveness of air exchange and distribution, it spreads microbial contamination. The influence of geometrical features of ORs and the impact of surgical lights on LAF are not mentioned in the literature.
The present study is a computational fluid dynamics (CFD) analysis of laminar airflow within a typical operating room layout, with a specific focus on the influence of surgical lamp geometry, positioning, and supply air velocity on airflow patterns. In parallel, experimental validation is carried out in a real OR environment to measure parameters such as airborne particle concentration and carbon dioxide (CO2) levels. These results are then compared with the measured data to evaluate the correlation between predicted and observed airflow characteristics. The flow characteristics are compared with the results from published literature also.

2. Methodology

Computational fluid dynamics (CFD)-based analysis on a three-dimensional model of an operating room having LAF using ANSYS Fluent 19.2 is carried out. The flow patterns taken along the length and width of the room separately are considered for analysis. Flow patterns from previously published literature are compared with the present results. Temperature, air velocity, carbon dioxide concentration, and particulate count are measured inside a real operating room as part of a mock procedure and used to validate the results. The particle distribution is simulated using a discrete phase model and carbon dioxide, using a species transport model.

2.1. CFD Modelling

2.1.1. Computational Domain and Modelling Assumptions

The airflow and thermal characteristics within the operating room were investigated through numerical simulations governed by the conservation equations of mass, momentum, and energy. These fundamental transport equations were solved to evaluate the indoor airflow distribution and thermal comfort parameters under varying configurations.
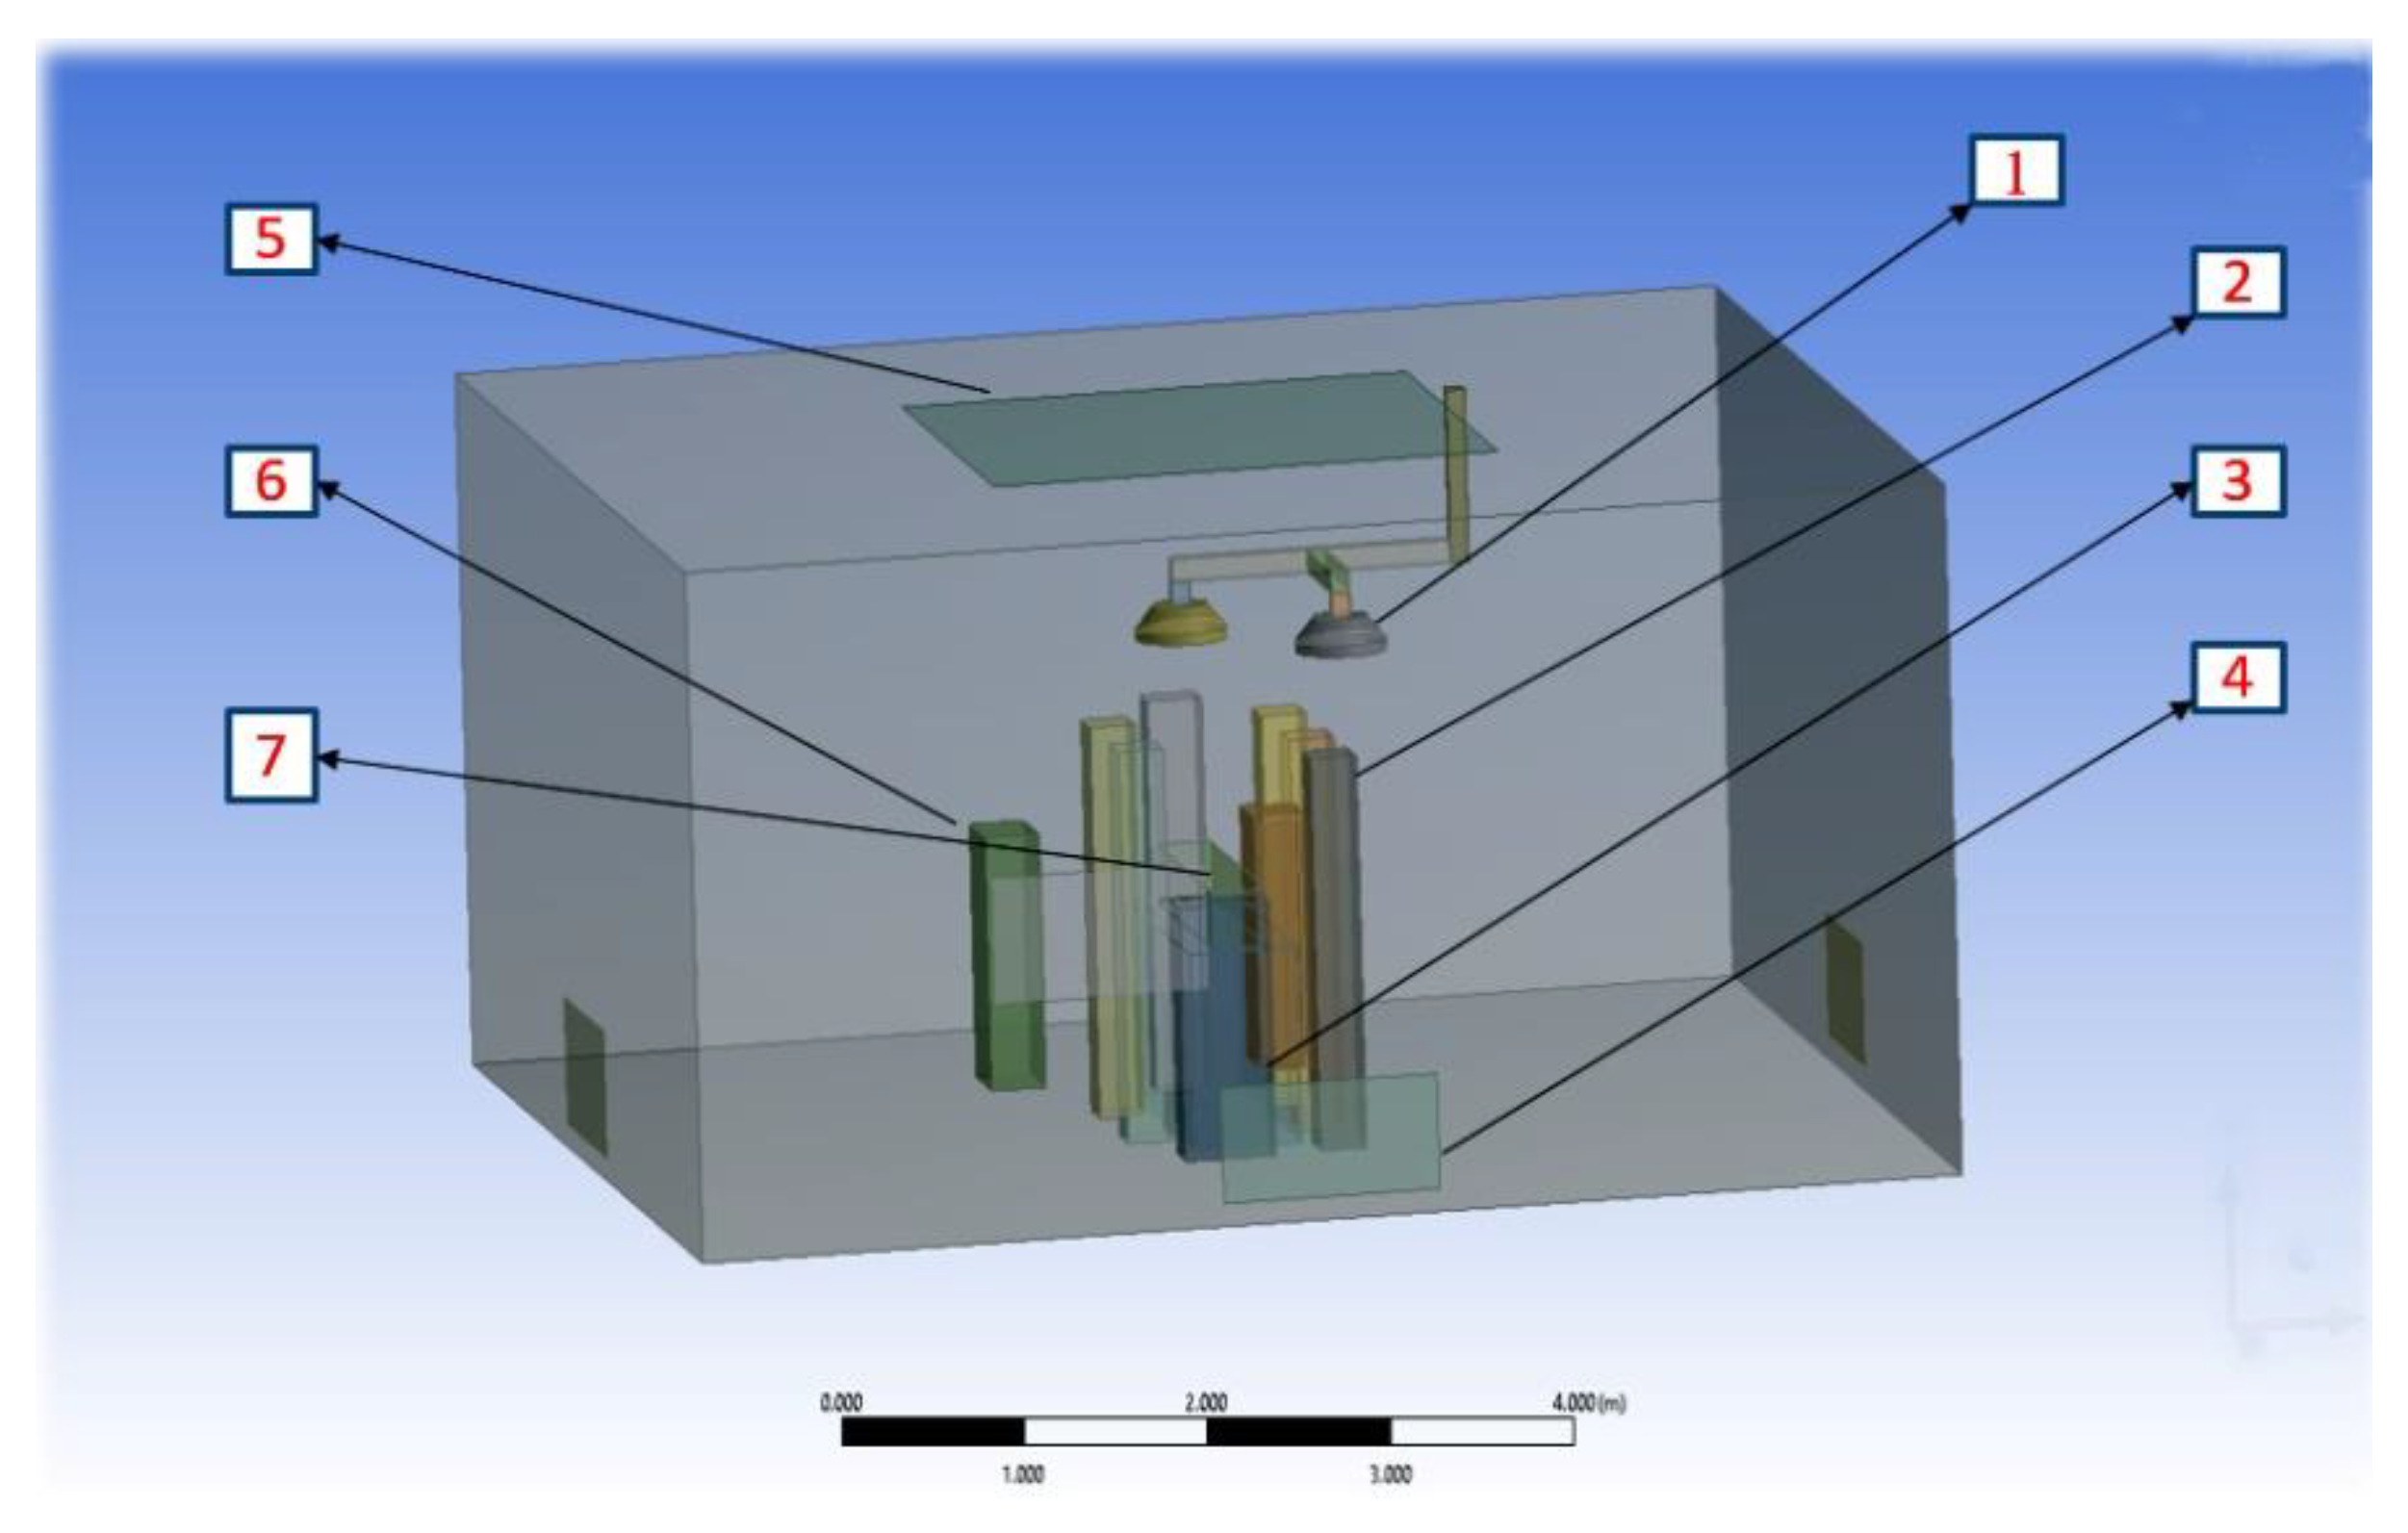
A full-scale 3D model of a typical operating room—with the dimensions of the OR in which the experiments are conducted—was modelled using Design Modeller in ANSYS 19.2. For the analysis, ANSYS Fluent 19.2, a finite volume-based CFD solver, is used. The dimensions of the simulated OR were set to 7 m × 7 m × 3 m (length × width × height), representing a realistic surgical environment. The supply air temperature was specified at 20 °C, consistent with ASHRAE recommendations for thermal comfort in surgical settings.
For computational efficiency and geometric simplification, the surgical staff, patient, and medical equipment were modelled as rectangular volumetric blocks with material properties approximating those of human tissue and medical-grade equipment. This abstraction preserves the essential thermal and flow interaction characteristics while reducing meshing complexity and simulation overhead.

2.1.2. CFD Parameters

  • Turbulence model: Realisable k–ε model with enhanced wall treatment.
  • Discretisation schemes: Second-order upwind for momentum, energy, turbulence quantities; SIMPLE algorithm for pressure-velocity coupling.
  • Gradient calculation: Least-squares cell-based.
  • Gravity: −9.81 m·s−2 along the z axis.
  • Meshing: Tetrahedron, refined at surfaces inside the LAF volume.
Boundary conditions:
Supply diffusers: Constant velocity inlet.
Return diffusers: Outflow or pressure outlet boundary.
Walls and equipment: No-slip adiabatic or prescribed heat flux (for heated components).
Convergence criteria:
Convergence was assessed based on residual monitoring. A residual target of 1 × 10⁻⁴ was set for all governing equations, including continuity, momentum, energy, and turbulence (k, ε).

2.1.3. Grid Independence Study

To ensure the reliability and accuracy of the numerical simulations, a grid independence study was conducted. The objective was to verify that the computed results remain invariant concerning mesh refinement. Several mesh configurations were evaluated by varying the number of computational cells, and their influence on the solution was assessed.
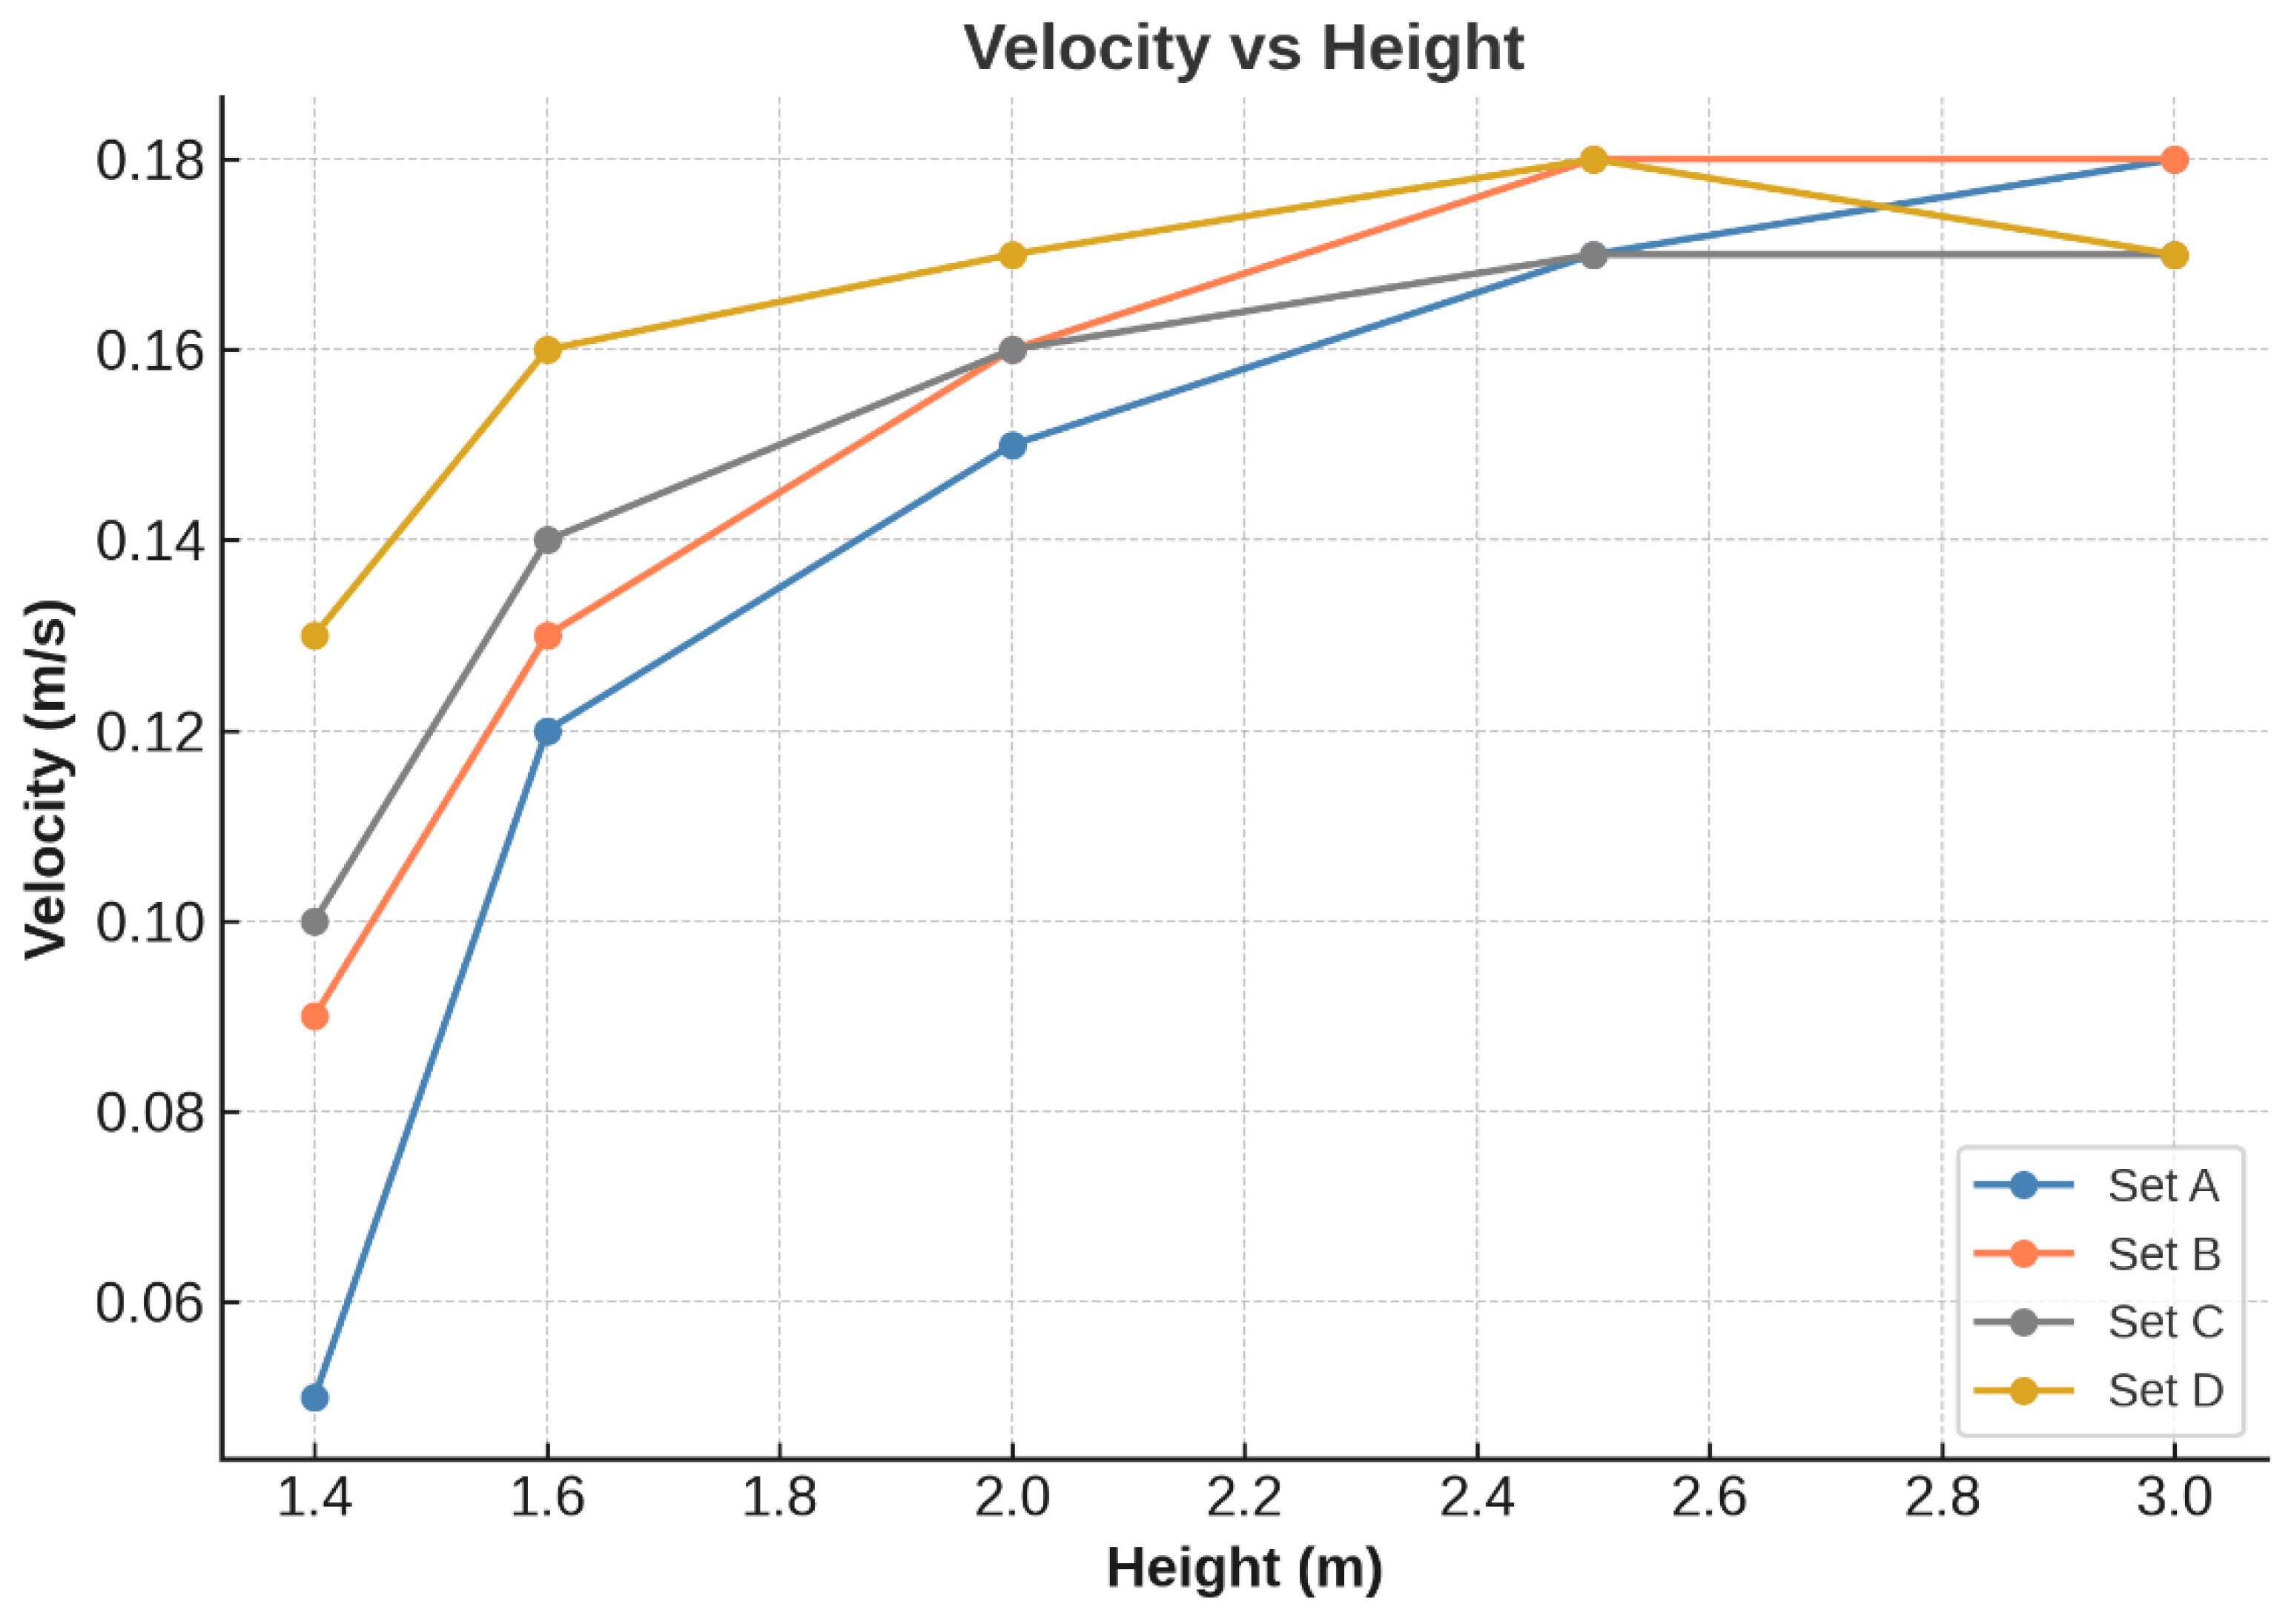
Specifically, the variation in air velocity along the vertical centreline of the operating room was examined for each grid configuration. The velocity profiles obtained from four different mesh densities are illustrated in Figure 2, and the corresponding number of elements used in each case is summarised in Table 2.
The comparison revealed negligible differences in the velocity distributions beyond a certain mesh density, thereby confirming that the selected grid size yields mesh-independent results suitable for subsequent analysis.
For sets B and C, the variation in velocity shows the same trend, so the final grid size is fixed to be 479,564 elements with 91,138 nodes.
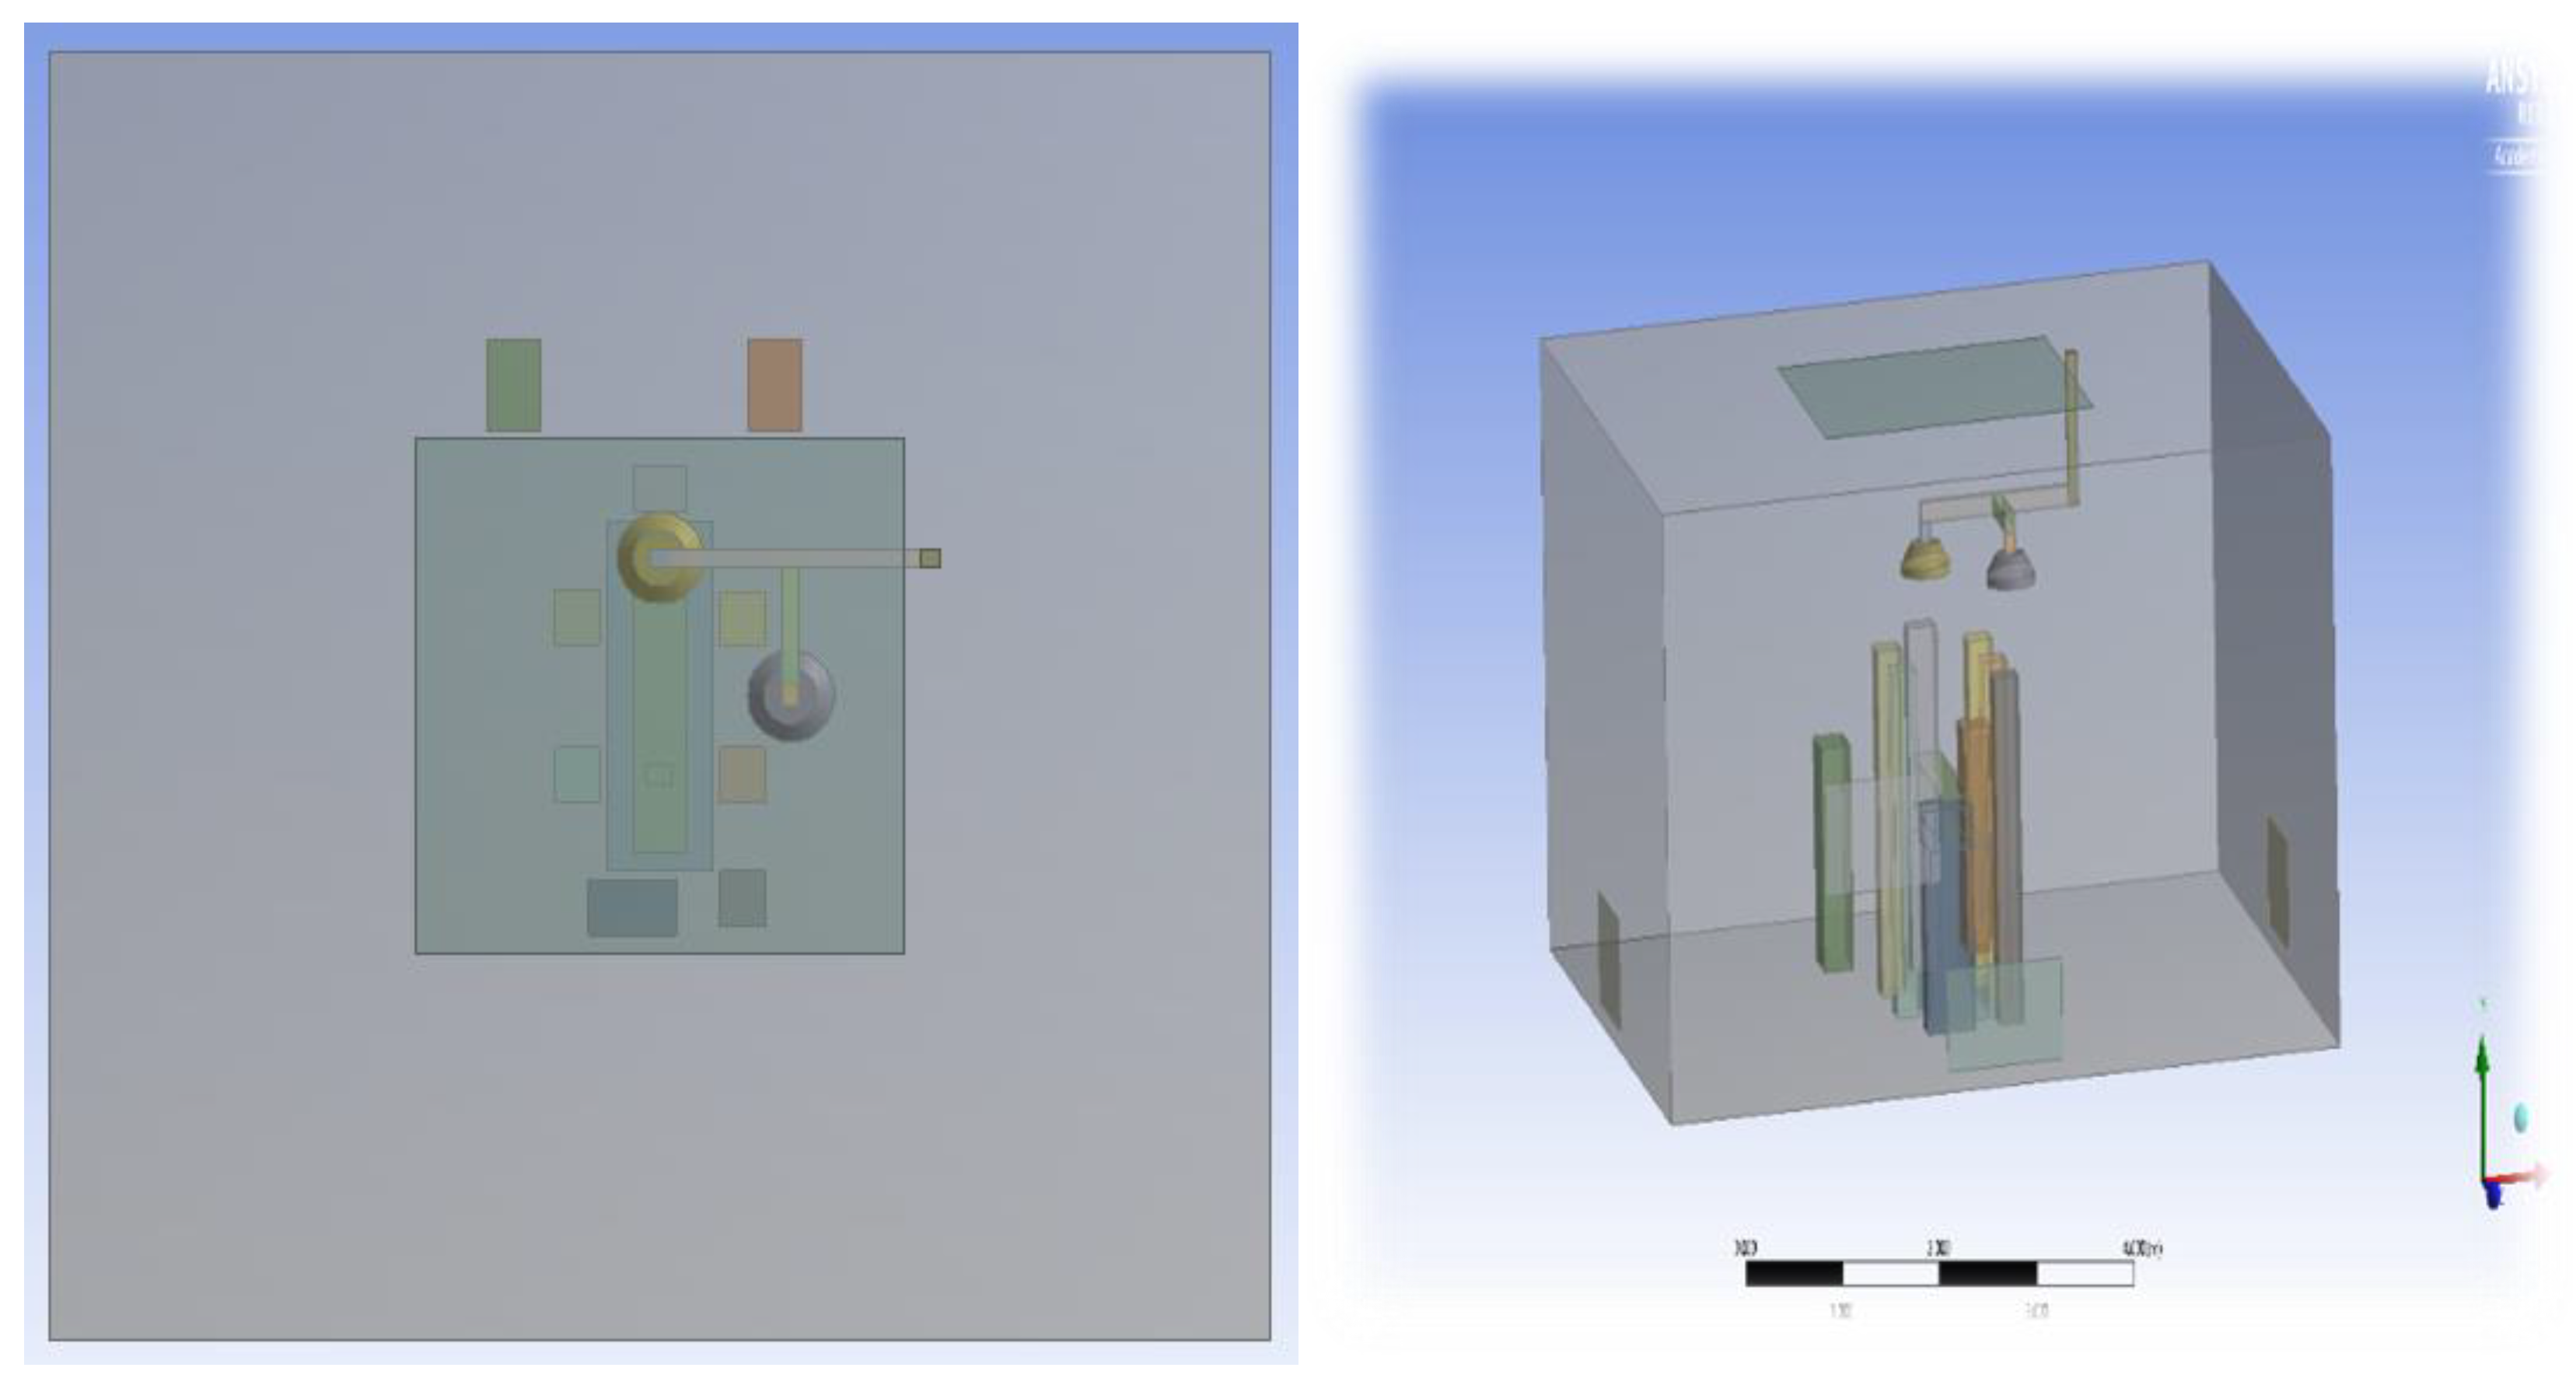
The operating room consists of six members in the surgical crew, along with the patient and bed, tables, and surgical lights as equipment. The three-dimensional model is shown in Figure 3, and the details are presented in Table 3.

2.1.4. Modelling of Equipment and Occupants

To optimise computational efficiency without significantly compromising accuracy, occupants and equipment were modelled using geometrically simplified block shapes. Complex anatomical representations were avoided to reduce computational resource demands and simulation time.
The modelled scenario includes one patient and six surgical staff members, each represented as rectangular volumetric blocks with base dimensions of 0.3 m × 0.25 m and a height of 1.7 m. Each human model was assumed to emit a uniform surface heat flux of 100 W/m2, consistent with typical metabolic heat generation. Similarly, medical equipment was abstracted as block-type volumes occupying realistic spatial configurations within the operating room.

2.1.5. Modelling of Gaseous Contaminants

The gaseous contaminant modelled in the study was carbon dioxide (CO2), representing the exhaled breath of the surgical staff and patient. CO2 transport was simulated using the species transport model available in ANSYS Fluent. A custom field function was implemented to compute the concentration of CO2 in parts per million (ppm) from the computed mass fraction.
CO2 was introduced at boundary zones corresponding to human breathing locations, with injection velocity and temperature matching standard human exhalation values—approximately 1 m/s and 34 °C, respectively.

2.1.6. Modelling of Particle Tracking

The dispersion of airborne particulate contaminants was analysed using the discrete phase model (DPM) under the assumption of inert spherical particles with a mean diameter of 6 μm, typical of respiratory droplets. Particles were injected from a designated surface above the level of patient’s bed from the head end of the surgeon, simulating droplet release.
All surrounding solid surfaces were treated as reflective, with a coefficient of restitution equal to 1.0, while the air outlet boundary was configured to allow particle escape. A contour plot was generated to visualise particle concentration and dispersion across the domain.

2.1.7. Boundary Conditions

The simulations incorporated realistic boundary conditions based on operational settings observed in hospital environments. Key boundary parameters included the following:
  • Inlet air velocity, temperature, and pressure, which were varied across simulation cases to study airflow sensitivity.
  • Outlet boundaries were defined using a pressure outlet condition.
  • Thermal and metabolic heat loads applied to human and equipment surfaces were specified based on empirical values, as detailed in Table 3.

2.2. Field Measurement

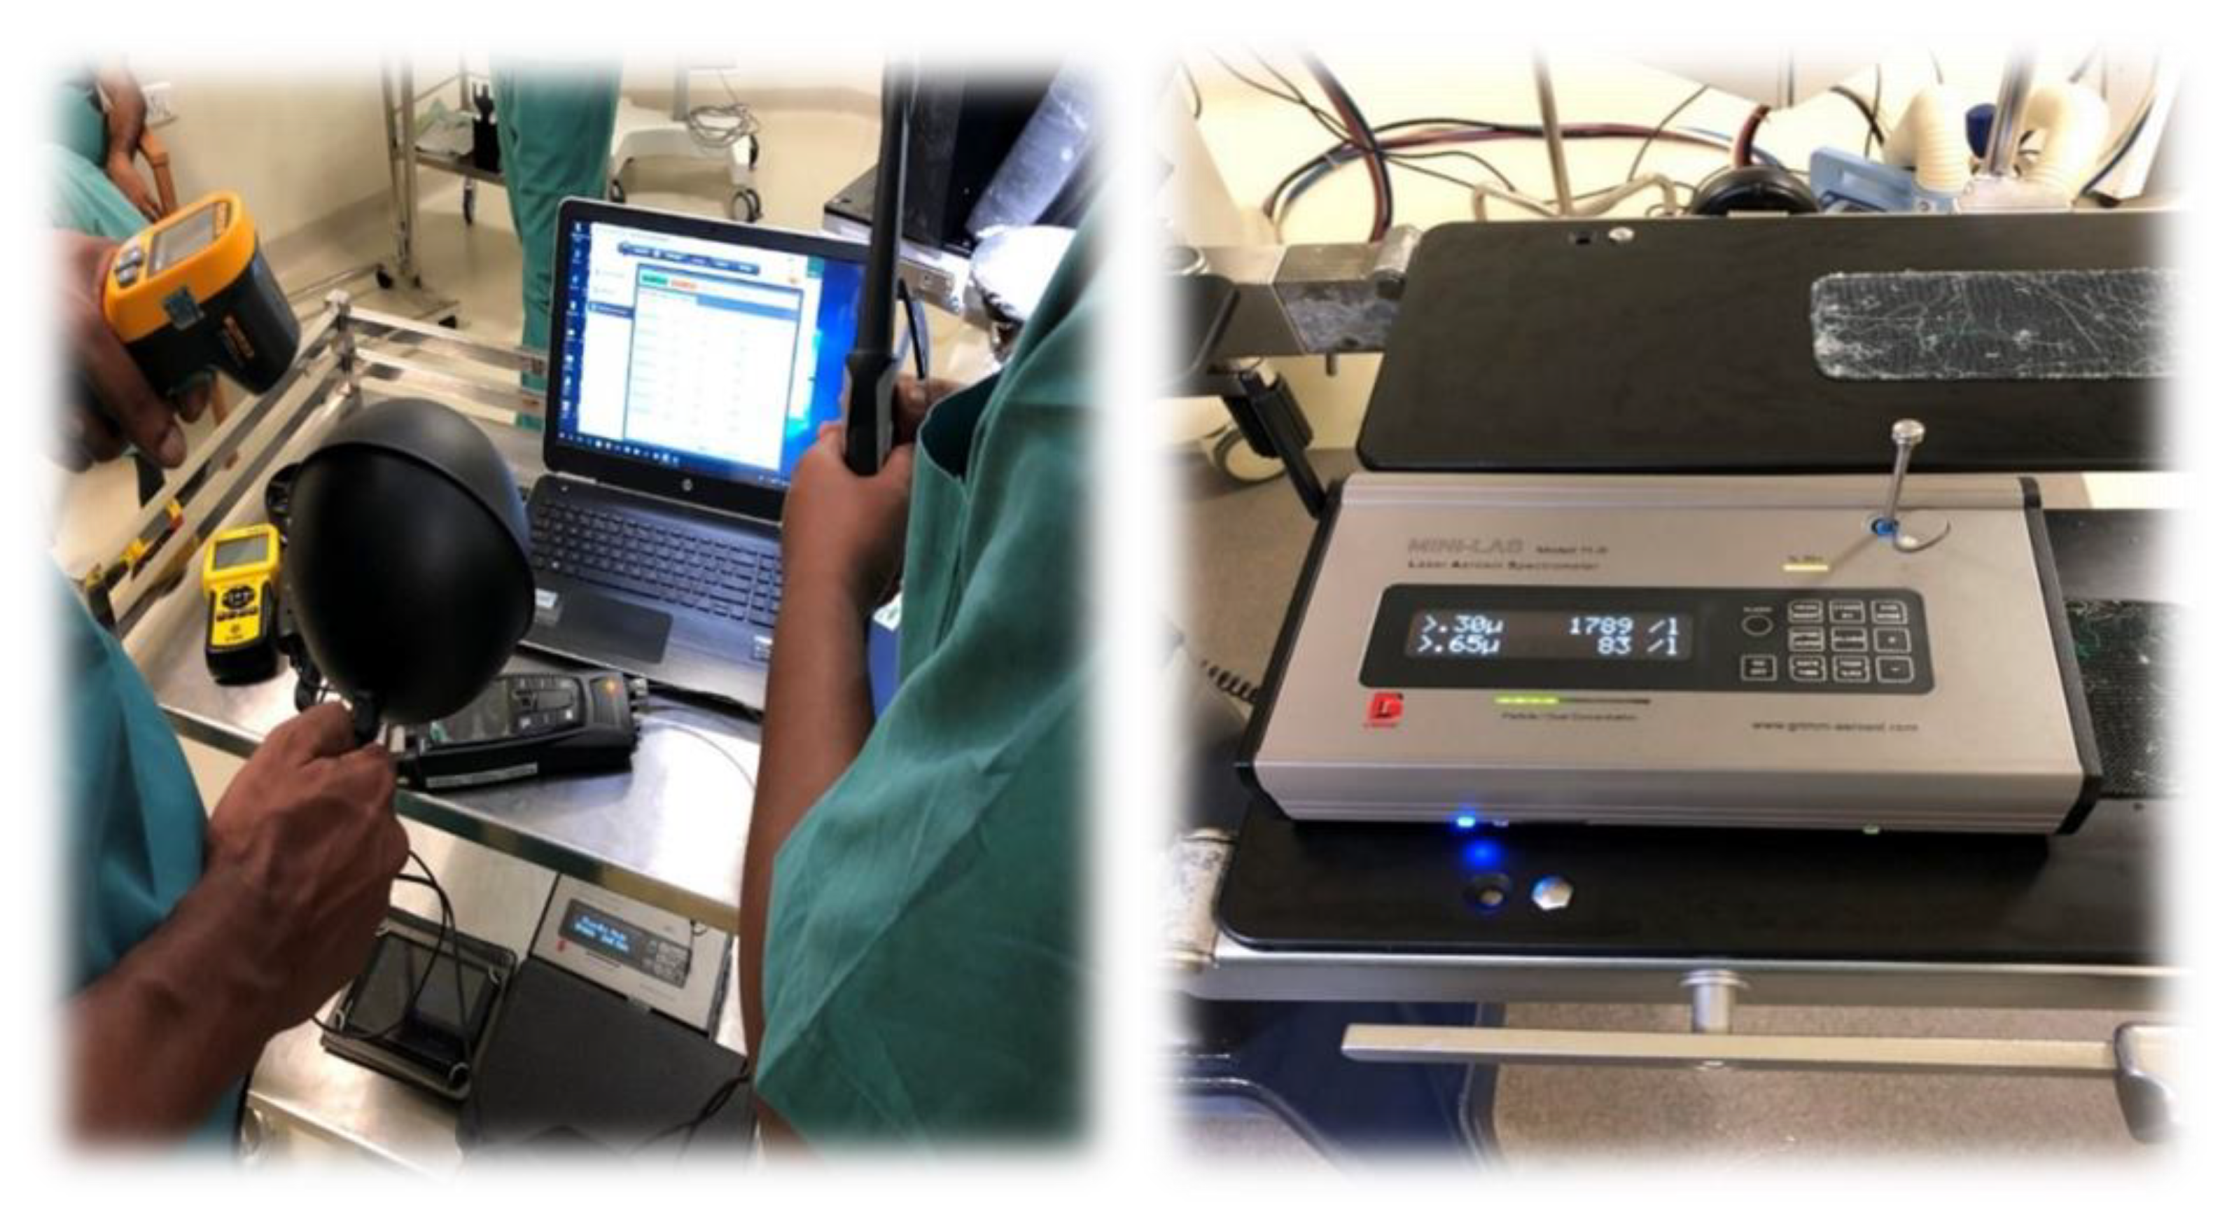
Experimental validation was conducted through on-site measurement conducted at a multispecialty hospital during a mock procedure. The thermal–hygrometric conditions at different locations in the room were noted, and particulate counts at different regions were measured. The mean radiant temperature was recorded at full intensity of the surgical lamp using a globe thermometer. The air velocity at three locations, that is, just under the diffuser, under the surgical lamp, and at the bed level, was noted to study the effect of the presence of the surgical lamp on flow velocity.
The details of the equipment used for measurement are given in Table 4.
Figure 4 shows the photographs taken during measurement in the operating room.

3. Results and Discussion

This section presents the findings from the numerical simulations and experimental investigations focused on evaluating the impact of surgical lamp positioning and its shape on airflow distribution within the operating room. The study further incorporates the results from particle tracking simulations, which provide insight into the transport and dispersion of contaminants under varying ventilation and equipment configurations.
A three-dimensional CFD model of the operating room was employed to analyse velocity fields, temperature distribution, and particulate behaviour. The influence of physical obstructions, such as surgical lamps, on laminar flow integrity was assessed, along with the effect of air supply velocity and lamp design on airflow uniformity in the sterile field.
Comparative results are discussed in the context of cleanroom airflow criteria, thermal comfort, and contaminant dilution effectiveness, with a particular focus on critical surgical zones.

3.1. Effect of Position of Surgical Lamp on Flow Distribution

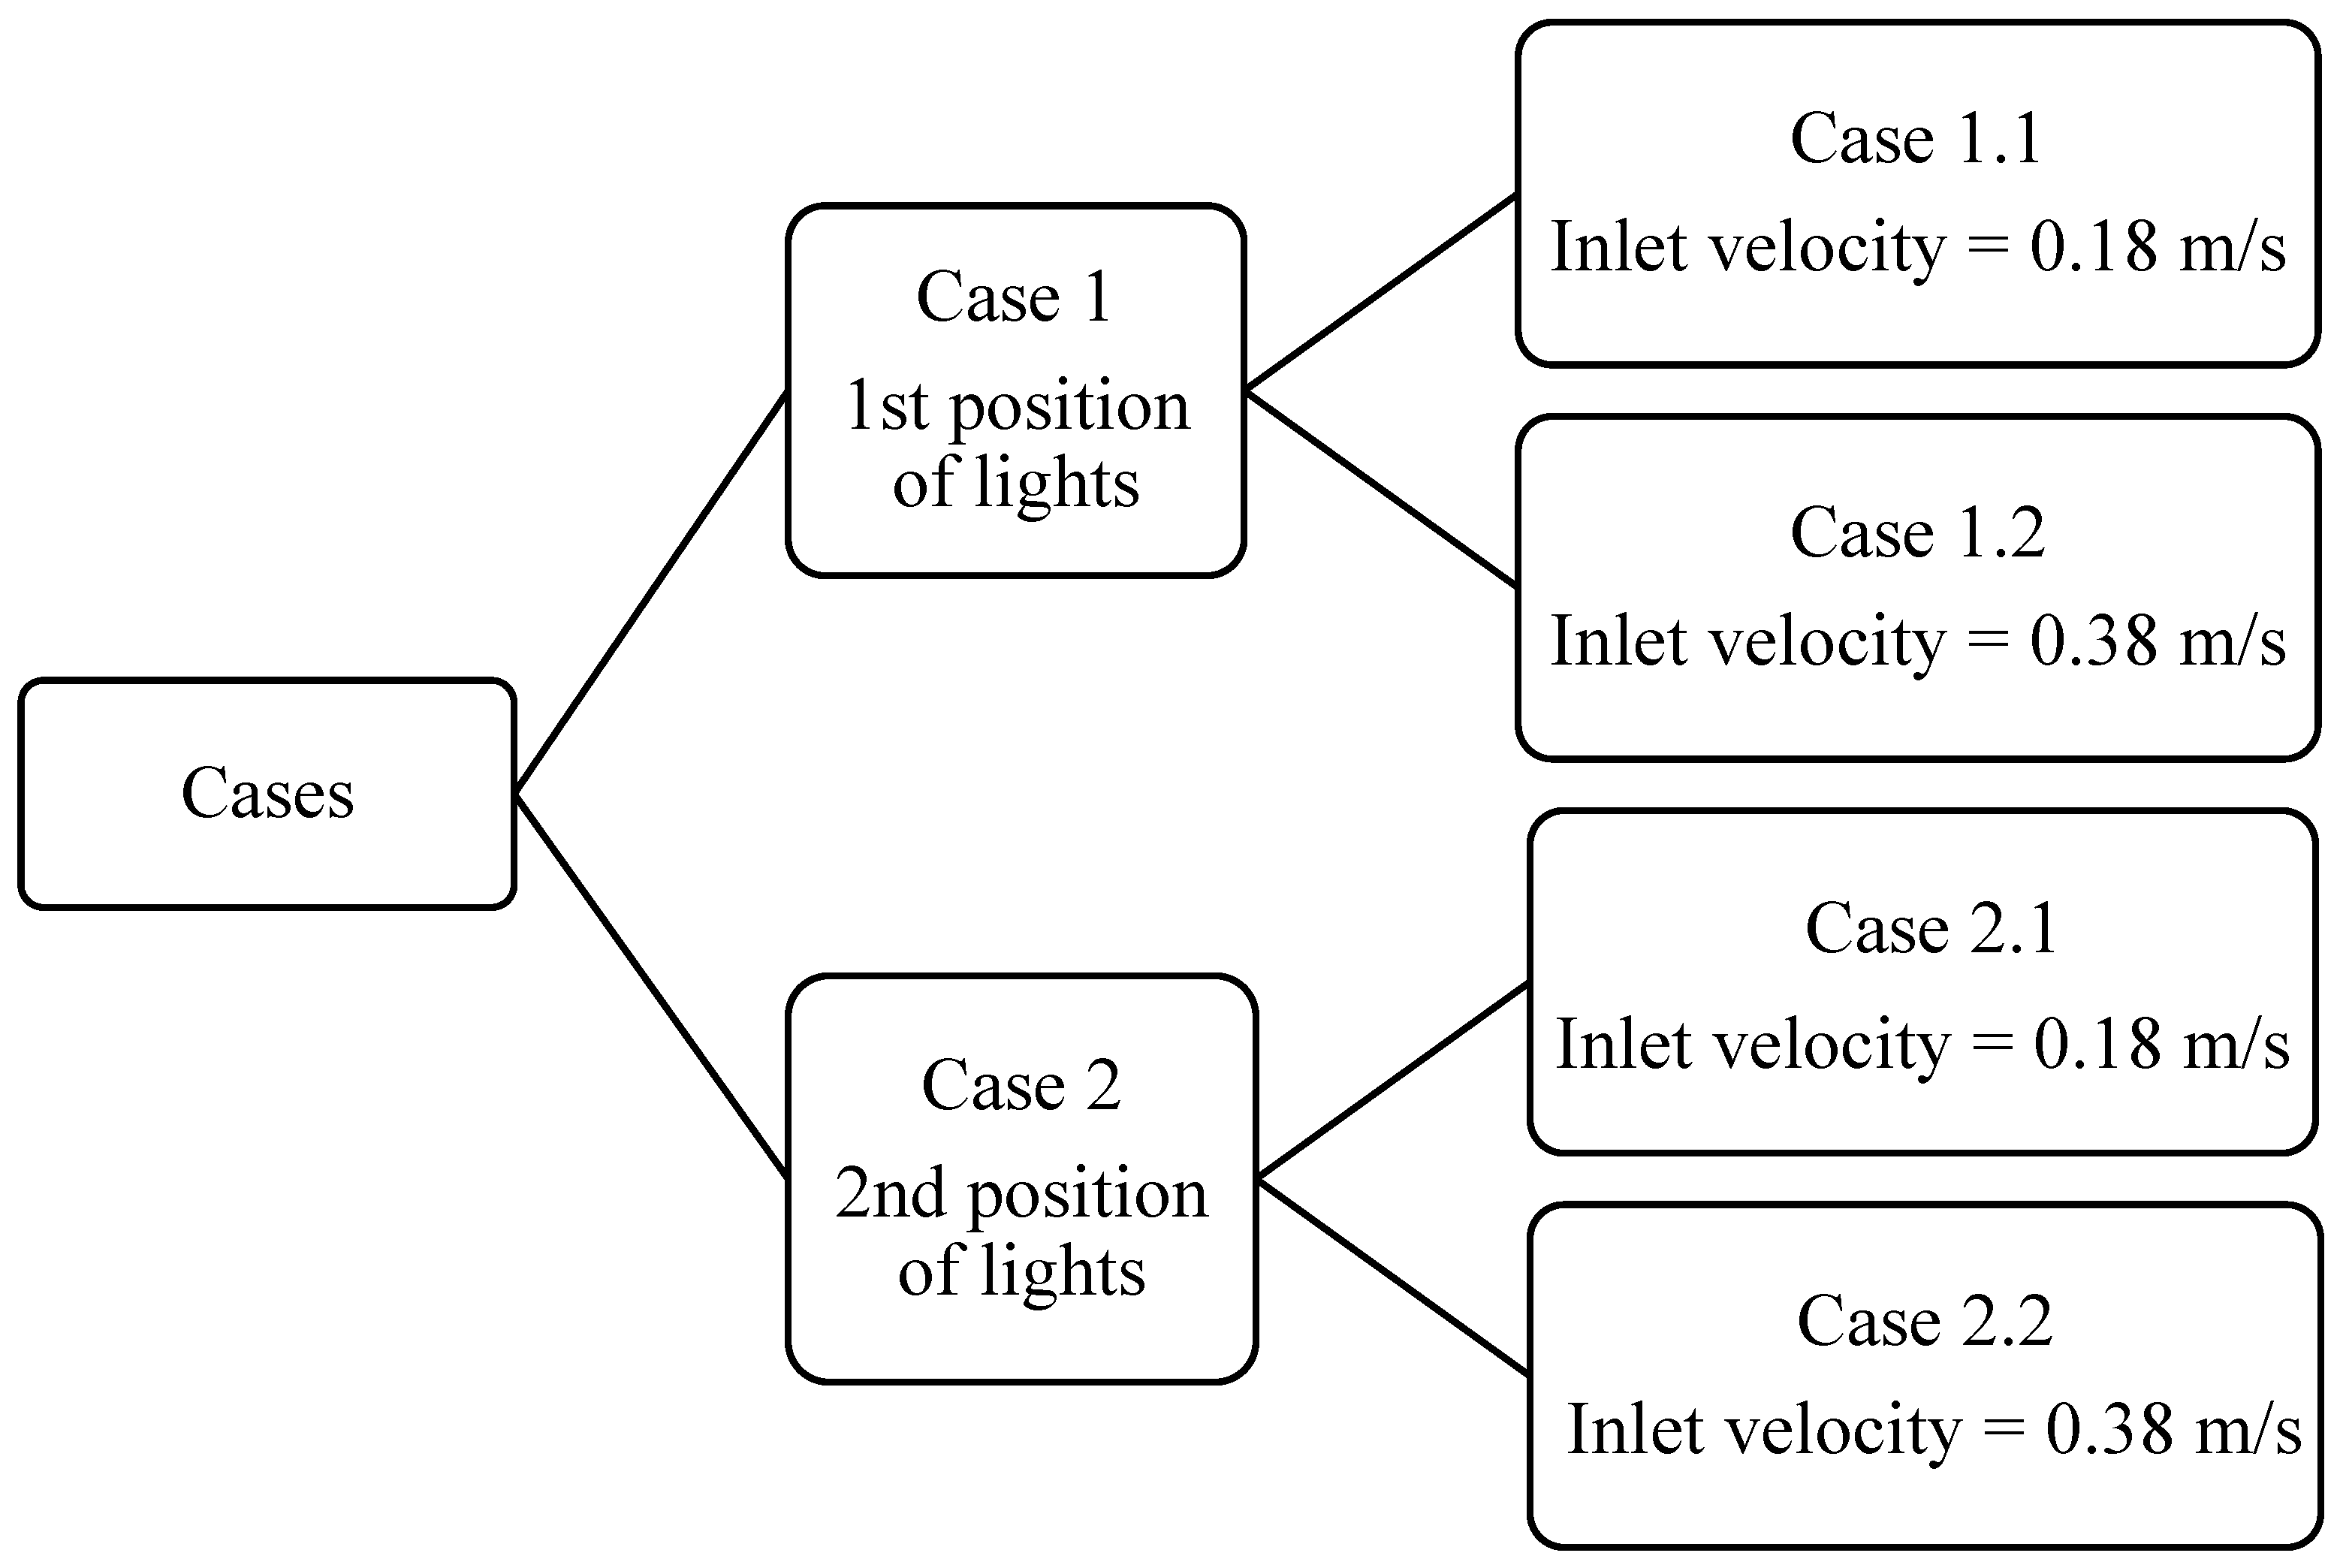
The effect of the position of surgical lights on flow patterns was analysed with two different configurations of the lights at two different inlet velocities. The simulation was carried out in four cases, as presented in Figure 5.
In this study, two distinct surgical lamp configurations were evaluated to assess their influence on airflow distribution within the operating room. The first configuration, which reflects a commonly adopted hospital standard, places one surgical lamp above the patient’s head and the second above the surgical staff positioned laterally. This arrangement was designed to optimise illumination while minimising disruption to laminar airflow.
In contrast, the second configuration positions both surgical lamps directly above the patient, with one aligned over the facial region and the other above the abdominal region. While this setup may improve localised lighting, it potentially introduces more obstruction in the critical airflow path.
A total of four simulation cases were conducted, incorporating variations in airflow velocity and boundary conditions for each configuration. The objective was to identify the most effective layout for maintaining clean, uniform airflow in the sterile field. The comparative analysis demonstrates that the first configuration yields superior flow uniformity, reducing turbulence and particle stagnation in the surgical zone.
The spatial arrangements of the surgical lamps in both configurations are illustrated in Figure 6 and Figure 7, respectively.
The airflow within the operating room was analysed under the assumption of a steady-state condition with uniform inlet air velocity and temperature. Two inlet velocity scenarios were considered: 0.18 m/s and 0.38 m/s, representing typical supply velocities encountered in laminar airflow systems. In both cases, the supply air temperature was maintained at 20 °C, consistent with thermal comfort requirements in surgical environments.
Thermal loads from occupants and medical equipment were incorporated into the simulation as boundary heat fluxes. The specific heat contributions from each component are detailed in Table 3.
The resulting airflow fields were visualised using velocity contour and vector plots, illustrating the influence of inlet conditions and equipment placement on the overall air distribution. These results are presented in Figure 8, Figure 9, Figure 10 and Figure 11, corresponding to the various inlet velocity and lamp configuration combinations. The vector plots offer additional insights into airflow directionality and potential recirculation zones within the sterile field.
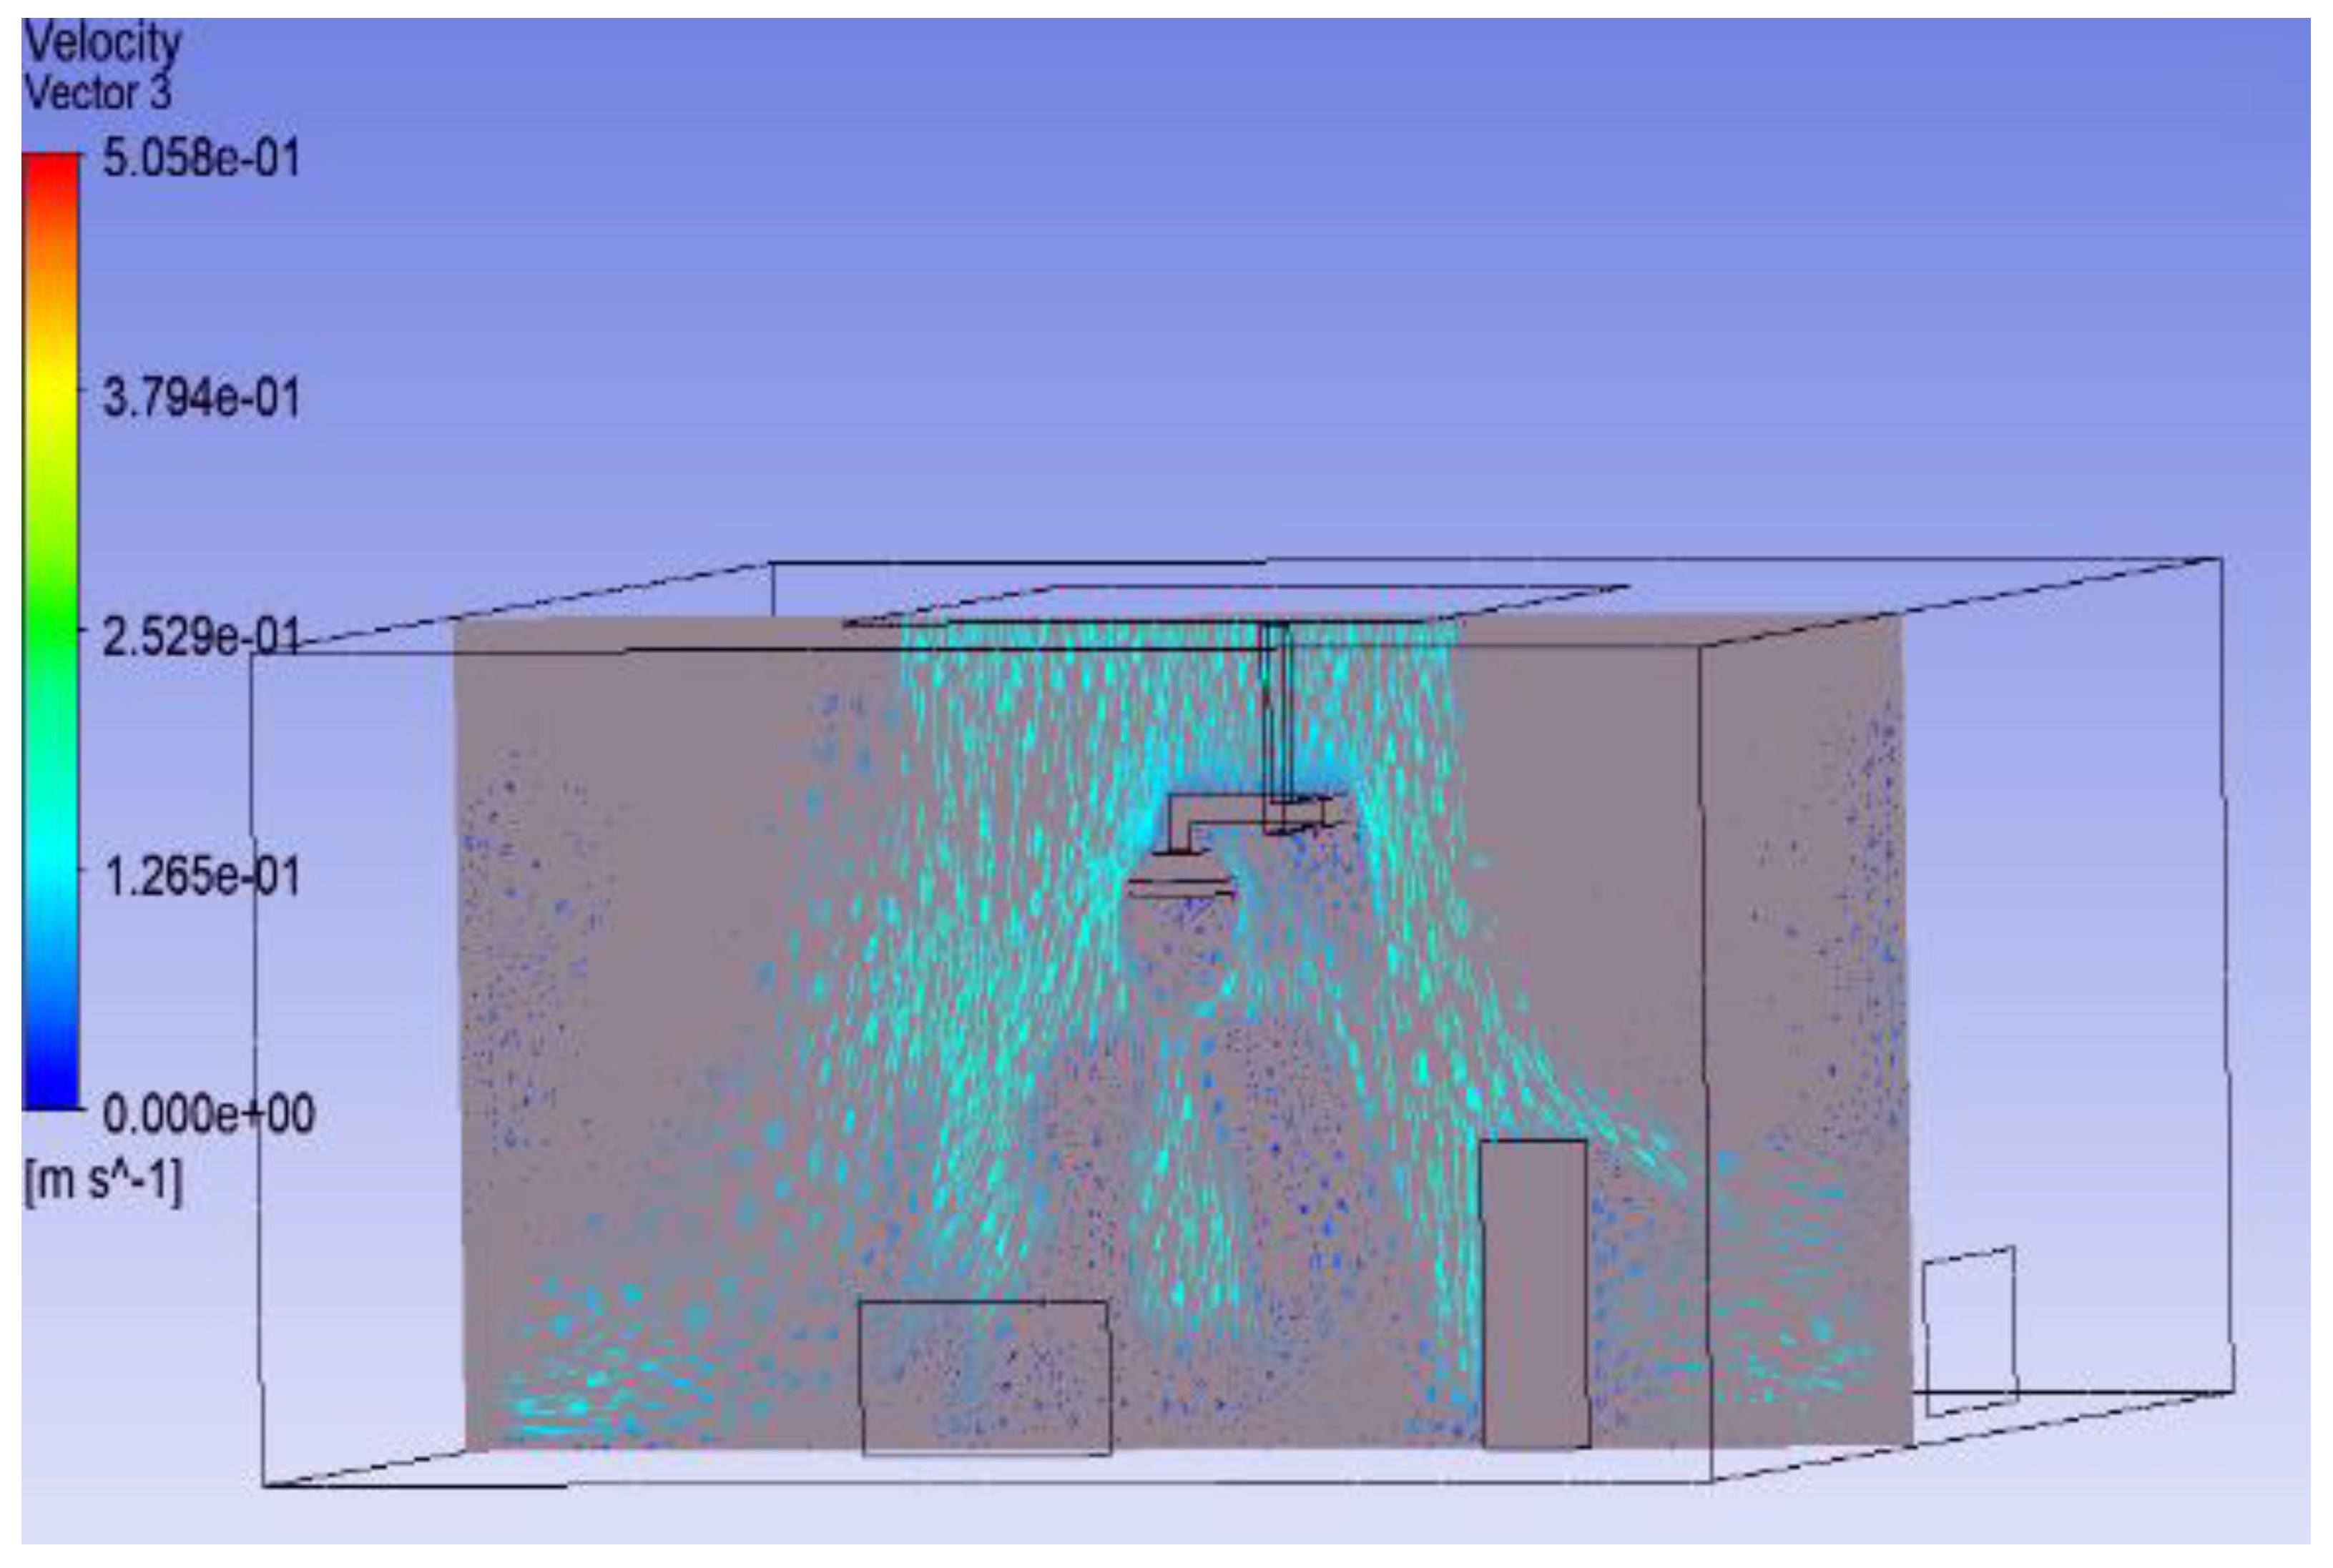
The simulation results reveal that the airflow becomes locally disturbed beneath the surgical lamp as shown in Figure 8, where the presence of the fixture interrupts the otherwise uniform laminar stream. Despite this localised disruption, the overall airflow pattern remains coherent and continues along its intended path throughout the room.
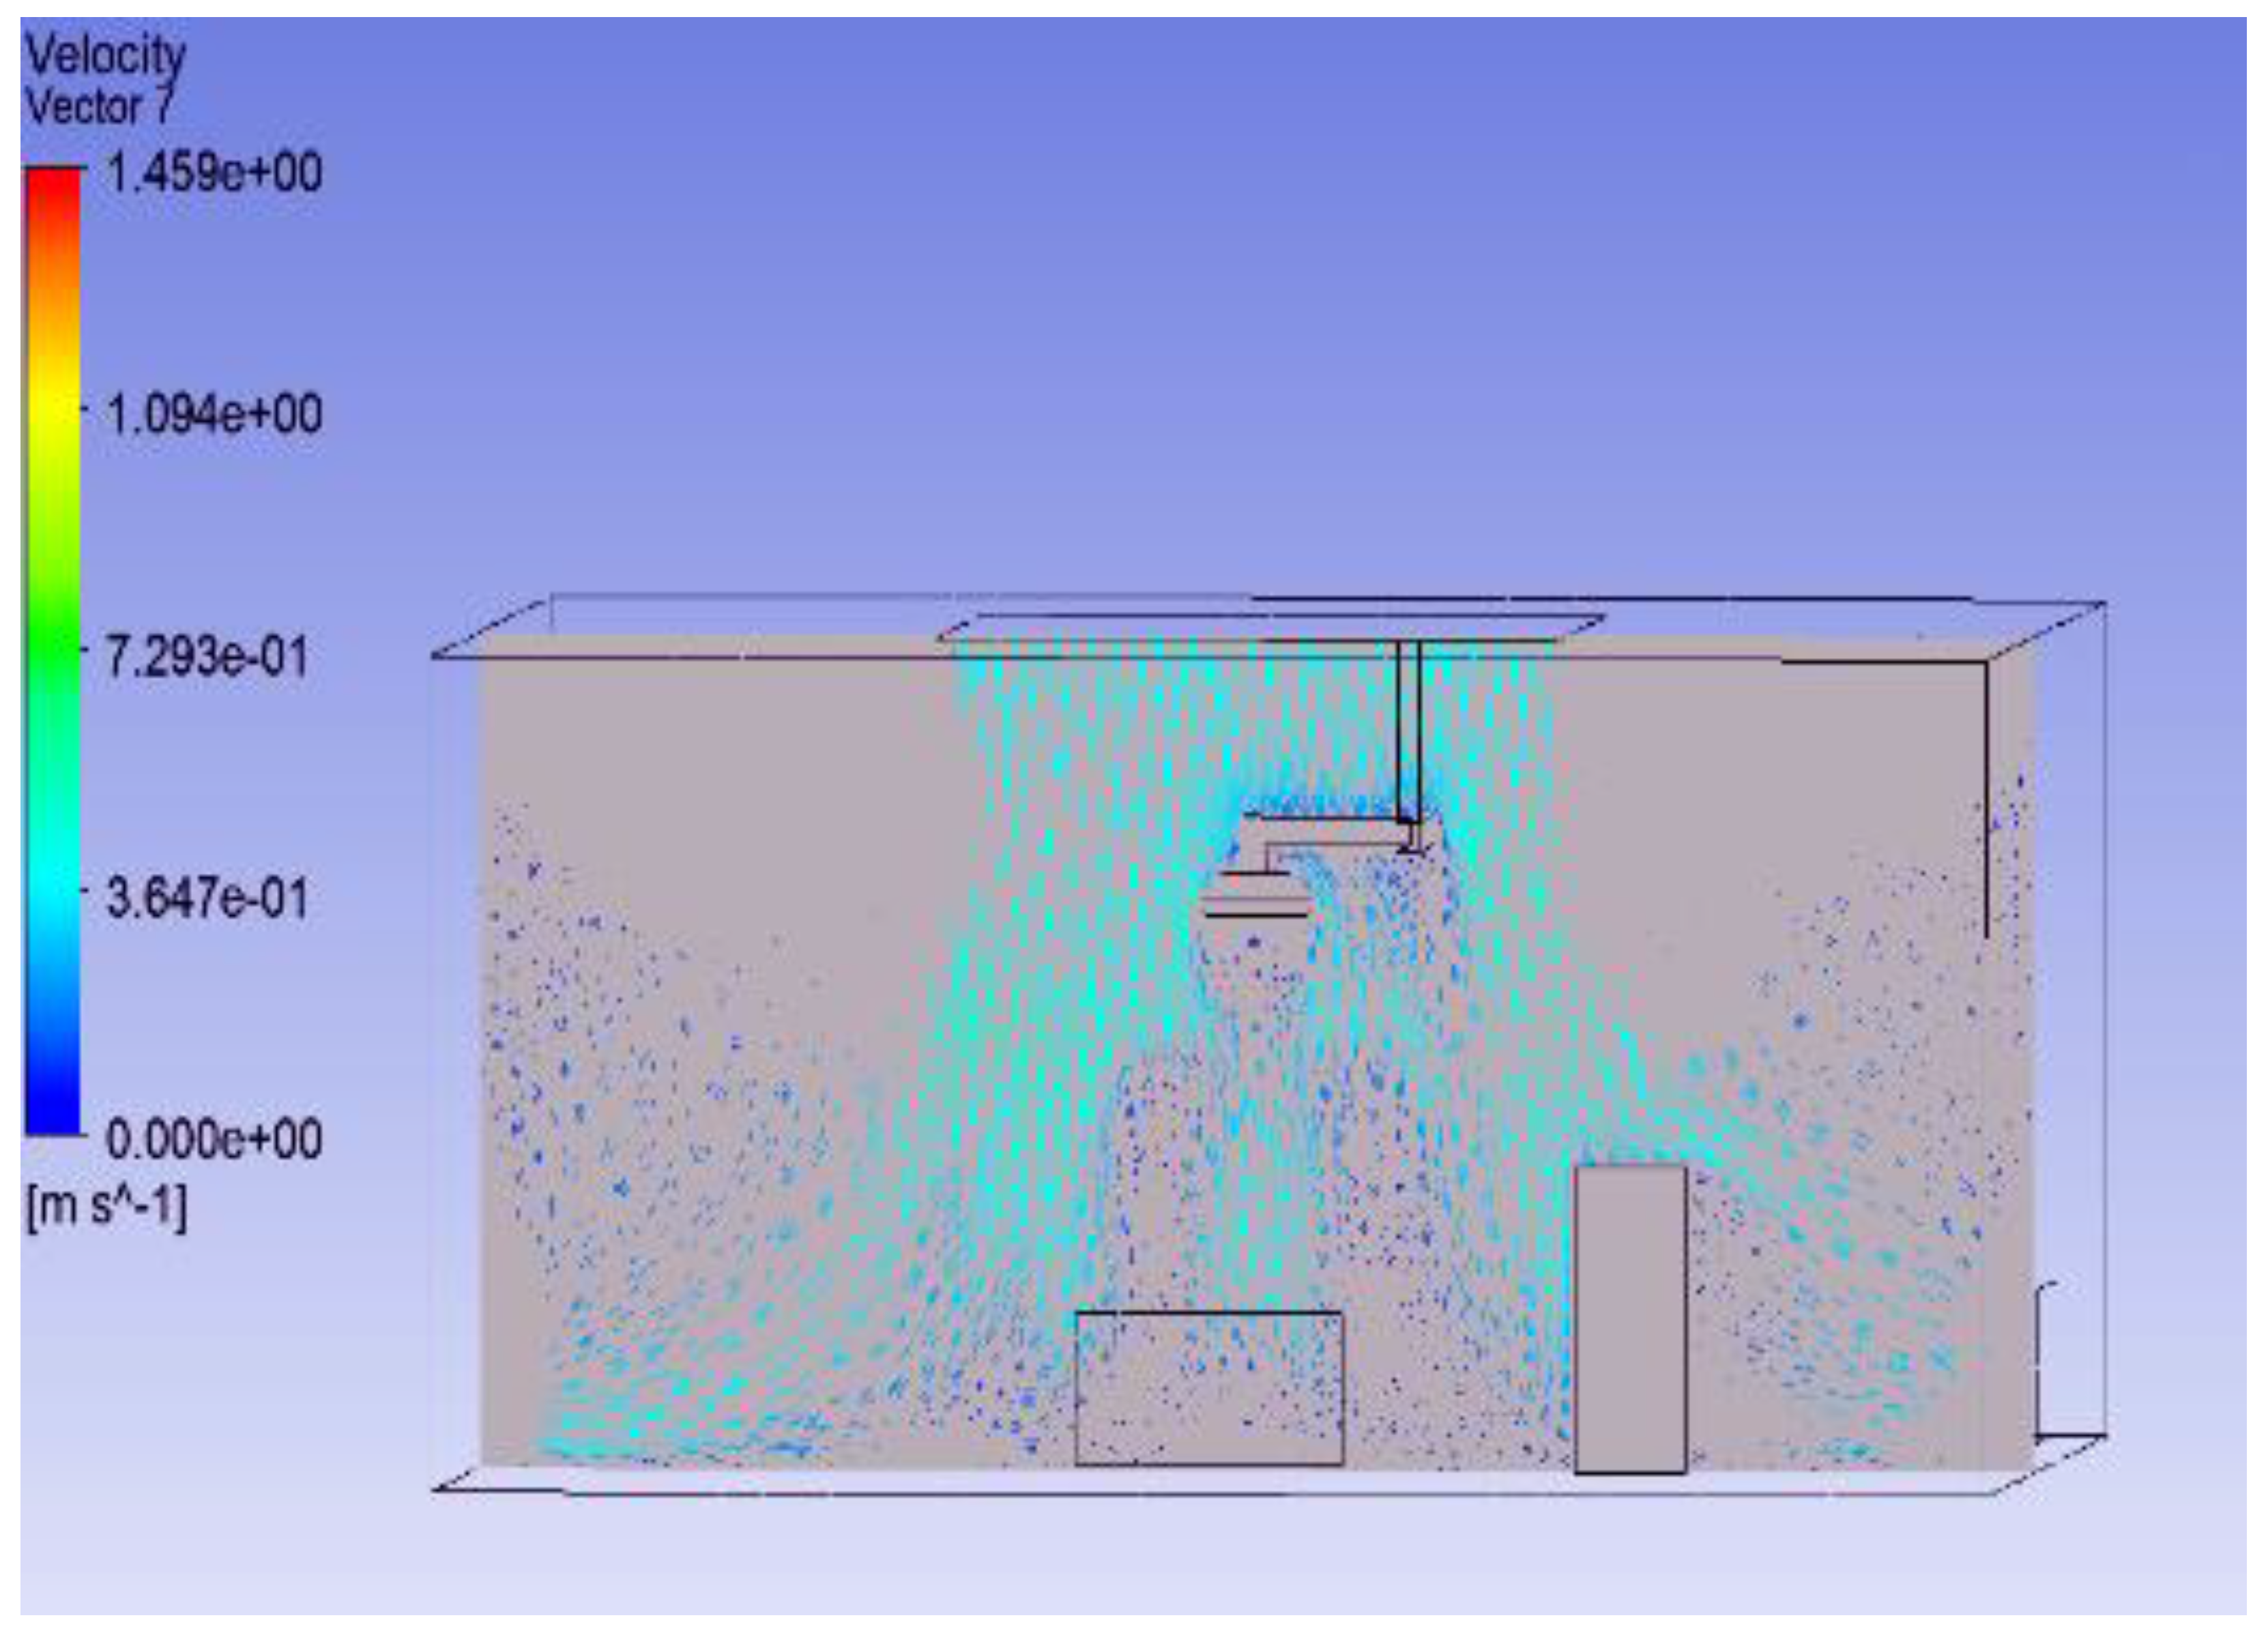
A similar behaviour is observed in Case 1.2, as illustrated in Figure 9, which corresponds to the configuration where one surgical lamp is positioned directly above the patient bed and the other is placed laterally above the surgical team. In this scenario, the airflow disturbance is once again confined to the immediate vicinity beneath the lamp, with minimal impact on the general flow field across the surgical zone.
These findings suggest that the presence of surgical lamps does not significantly compromise laminarity if appropriately positioned, though their design and placement must be carefully considered to prevent localised stagnation or recirculation near critical sterile areas.
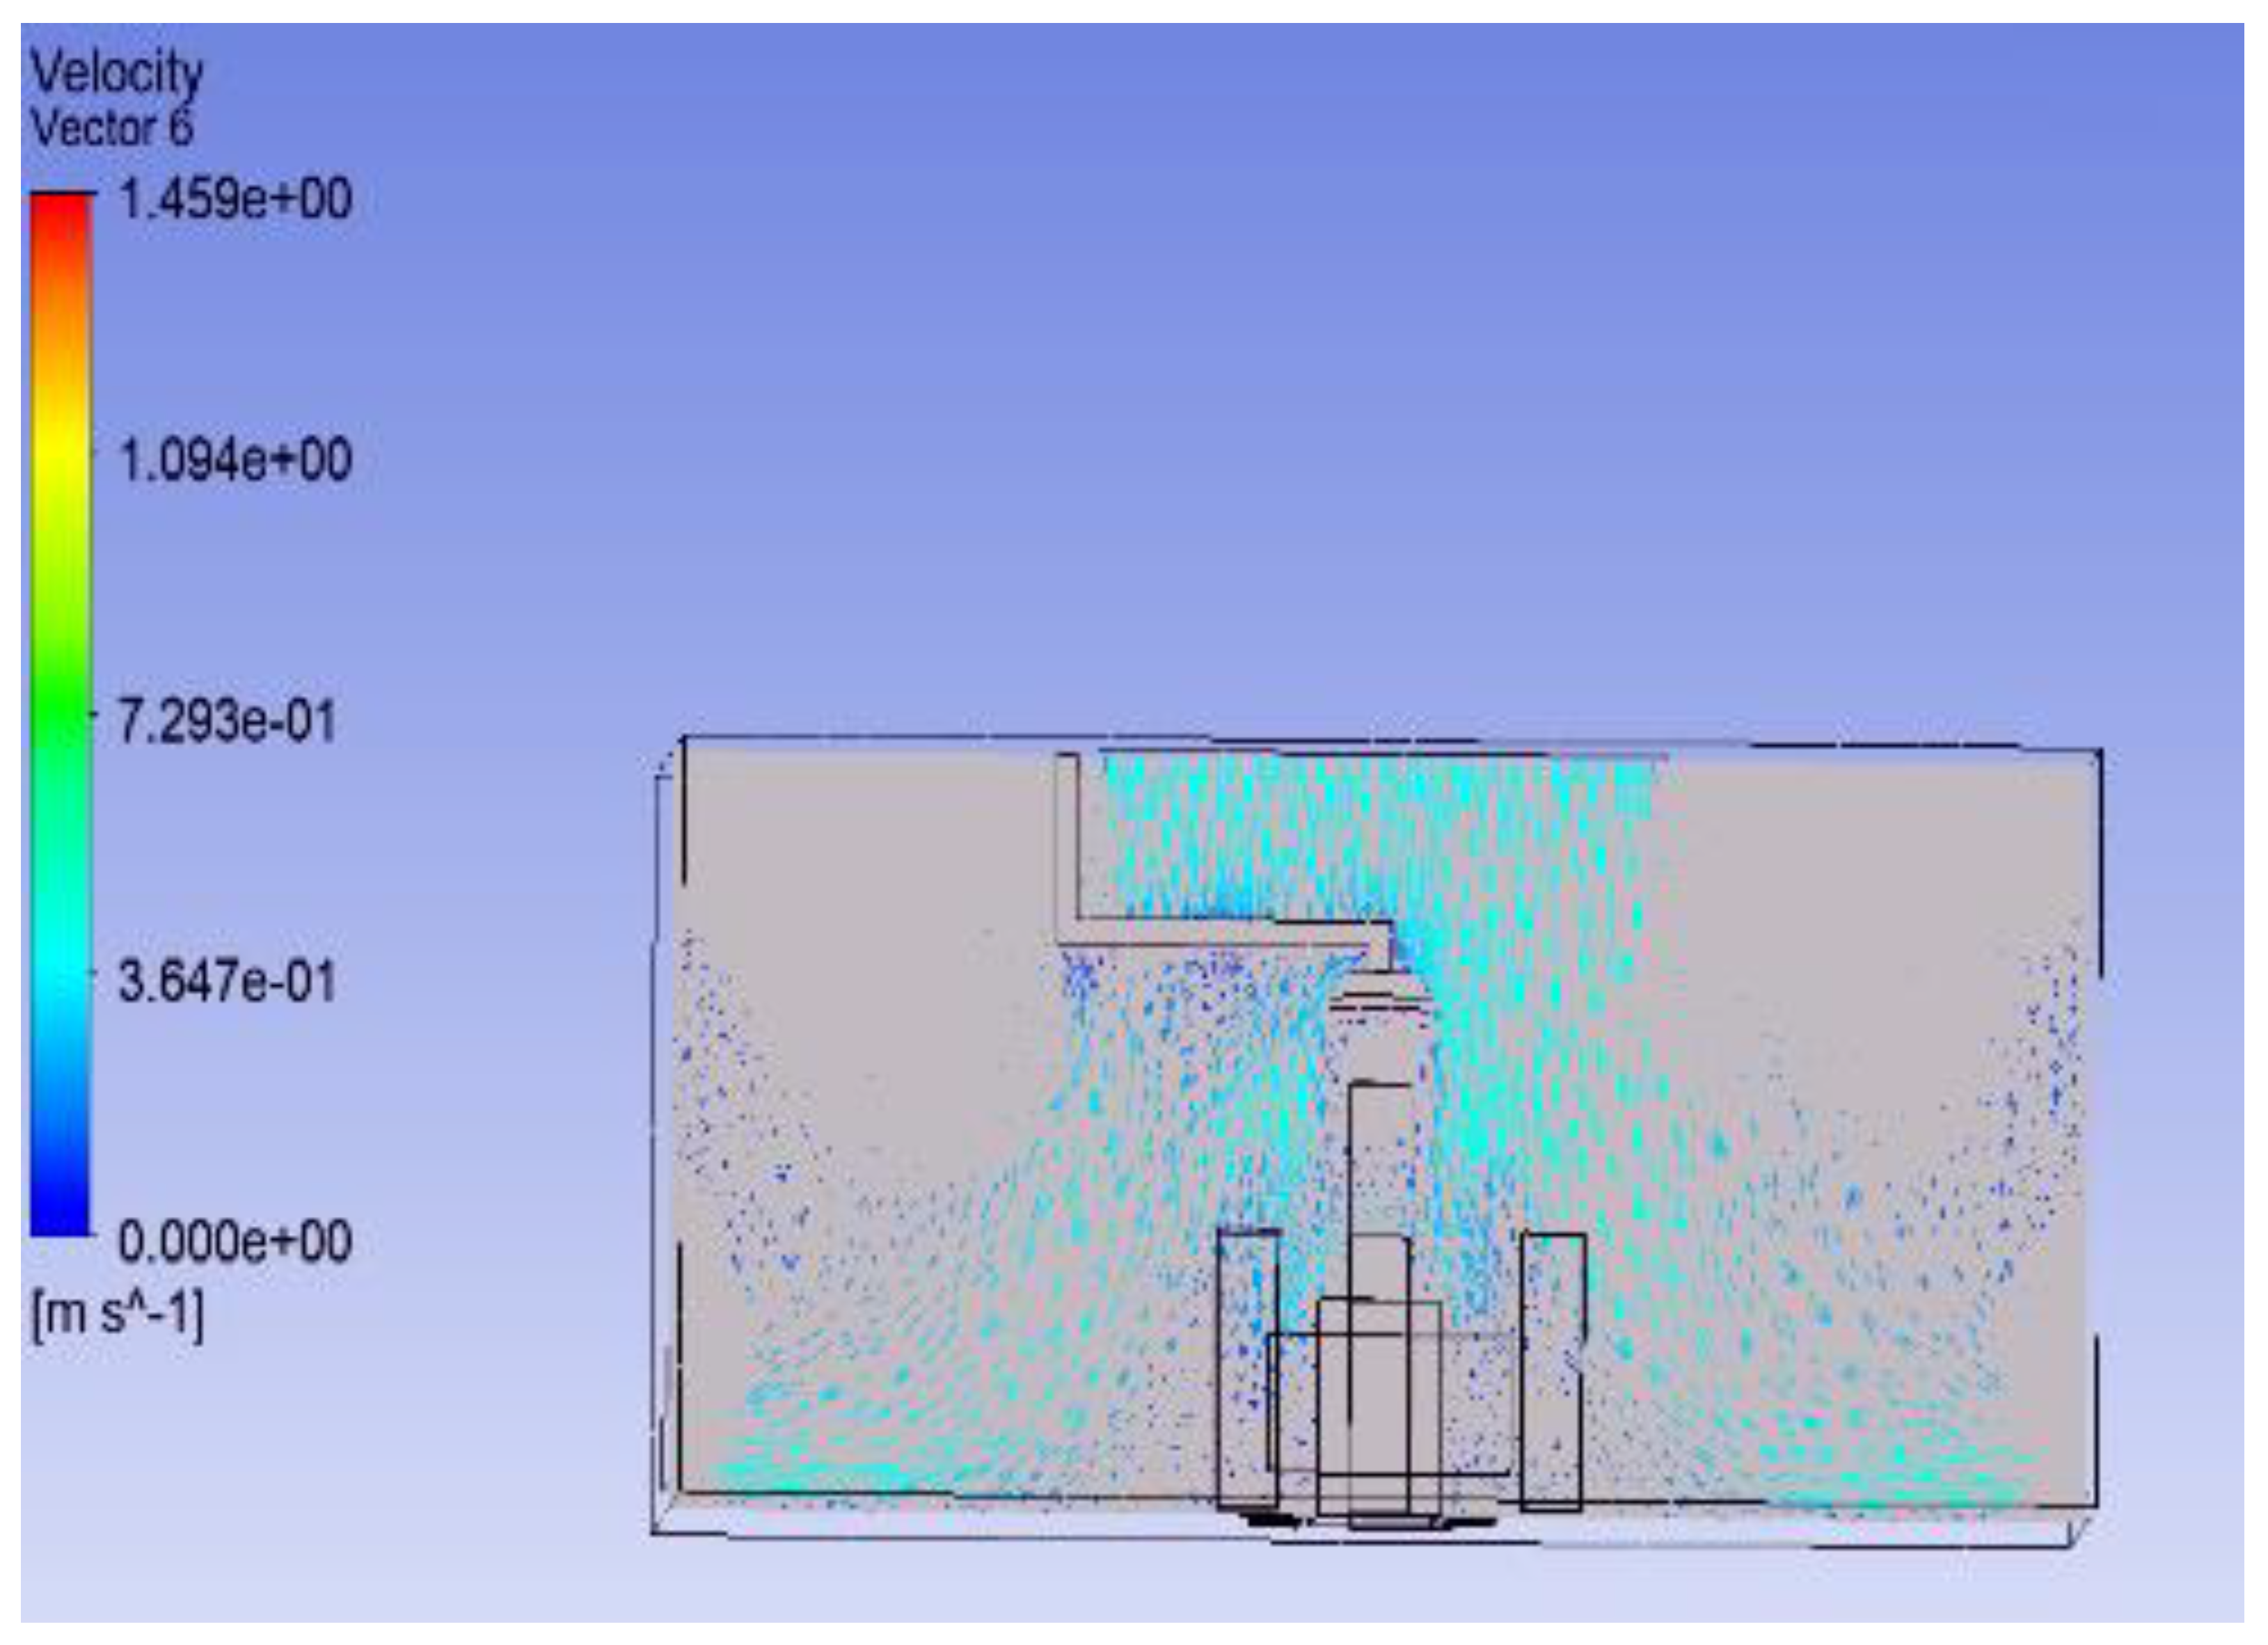
The flow pattern is different in the second configuration, in which both lamps are above the bed. The flow distribution at velocity 0.18 m/s is shown in Figure 10.
It can be observed that there is a stagnation region under the surgical lamp, which always occurs. In comparison with the first configuration, here the flow will be completely diminished at all times under the lamp as shown in Figure 10. A similar flow pattern is obtained for Case 2.2, in which velocity is kept at a high value, as shown in Figure 11.
The comparative analysis confirms that the first surgical lamp configuration—with one lamp located directly above the patient bed and the other positioned laterally above the surgical staff—demonstrates superior airflow performance within the operating theatre. For both inlet air velocities examined (0.18 m/s and 0.38 m/s), the overall flow distributions remain largely consistent, with only minor, localised disturbances observed beneath the lamp structures.
The average velocity at which clean air is supplied into the region to displace or remove airborne contaminants, maintaining a clean environment over the surgical site, is termed as washing velocity. For effective laminar airflow (LAF) washing action, the results indicate that a minimum supply velocity exceeding 0.20 m/s is necessary to ensure adequate momentum for contaminant removal. As shown in Figure 12, the second configuration, with both lamps mounted directly above the patient, exhibits reduced washing velocity—the velocity at which clean air is supplied into the region to displace or remove airborne contaminants, maintaining a clean environment over the surgical site—falling below the 0.20 m/s threshold in critical regions. In contrast, the first configuration consistently maintains washing velocities above 0.20 m/s, thereby upholding clean airflow delivery to the sterile field.
These findings lead to the conclusion that the first lamp configuration, coupled with an appropriately elevated inlet velocity, offers the most effective solution for maintaining sterile conditions and supporting surgical site protection through uninterrupted laminar flow and maintaining an effective washing velocity.

3.2. Shape of Surgical Lamp on Flow Distribution

To investigate the impact of surgical lamp geometry on airflow distribution in the operating room, two commonly used lamp designs were analysed:
  • A classic closed-shape lamp, and
  • A semi-open shape featuring ventilation gaps between its structural elements.
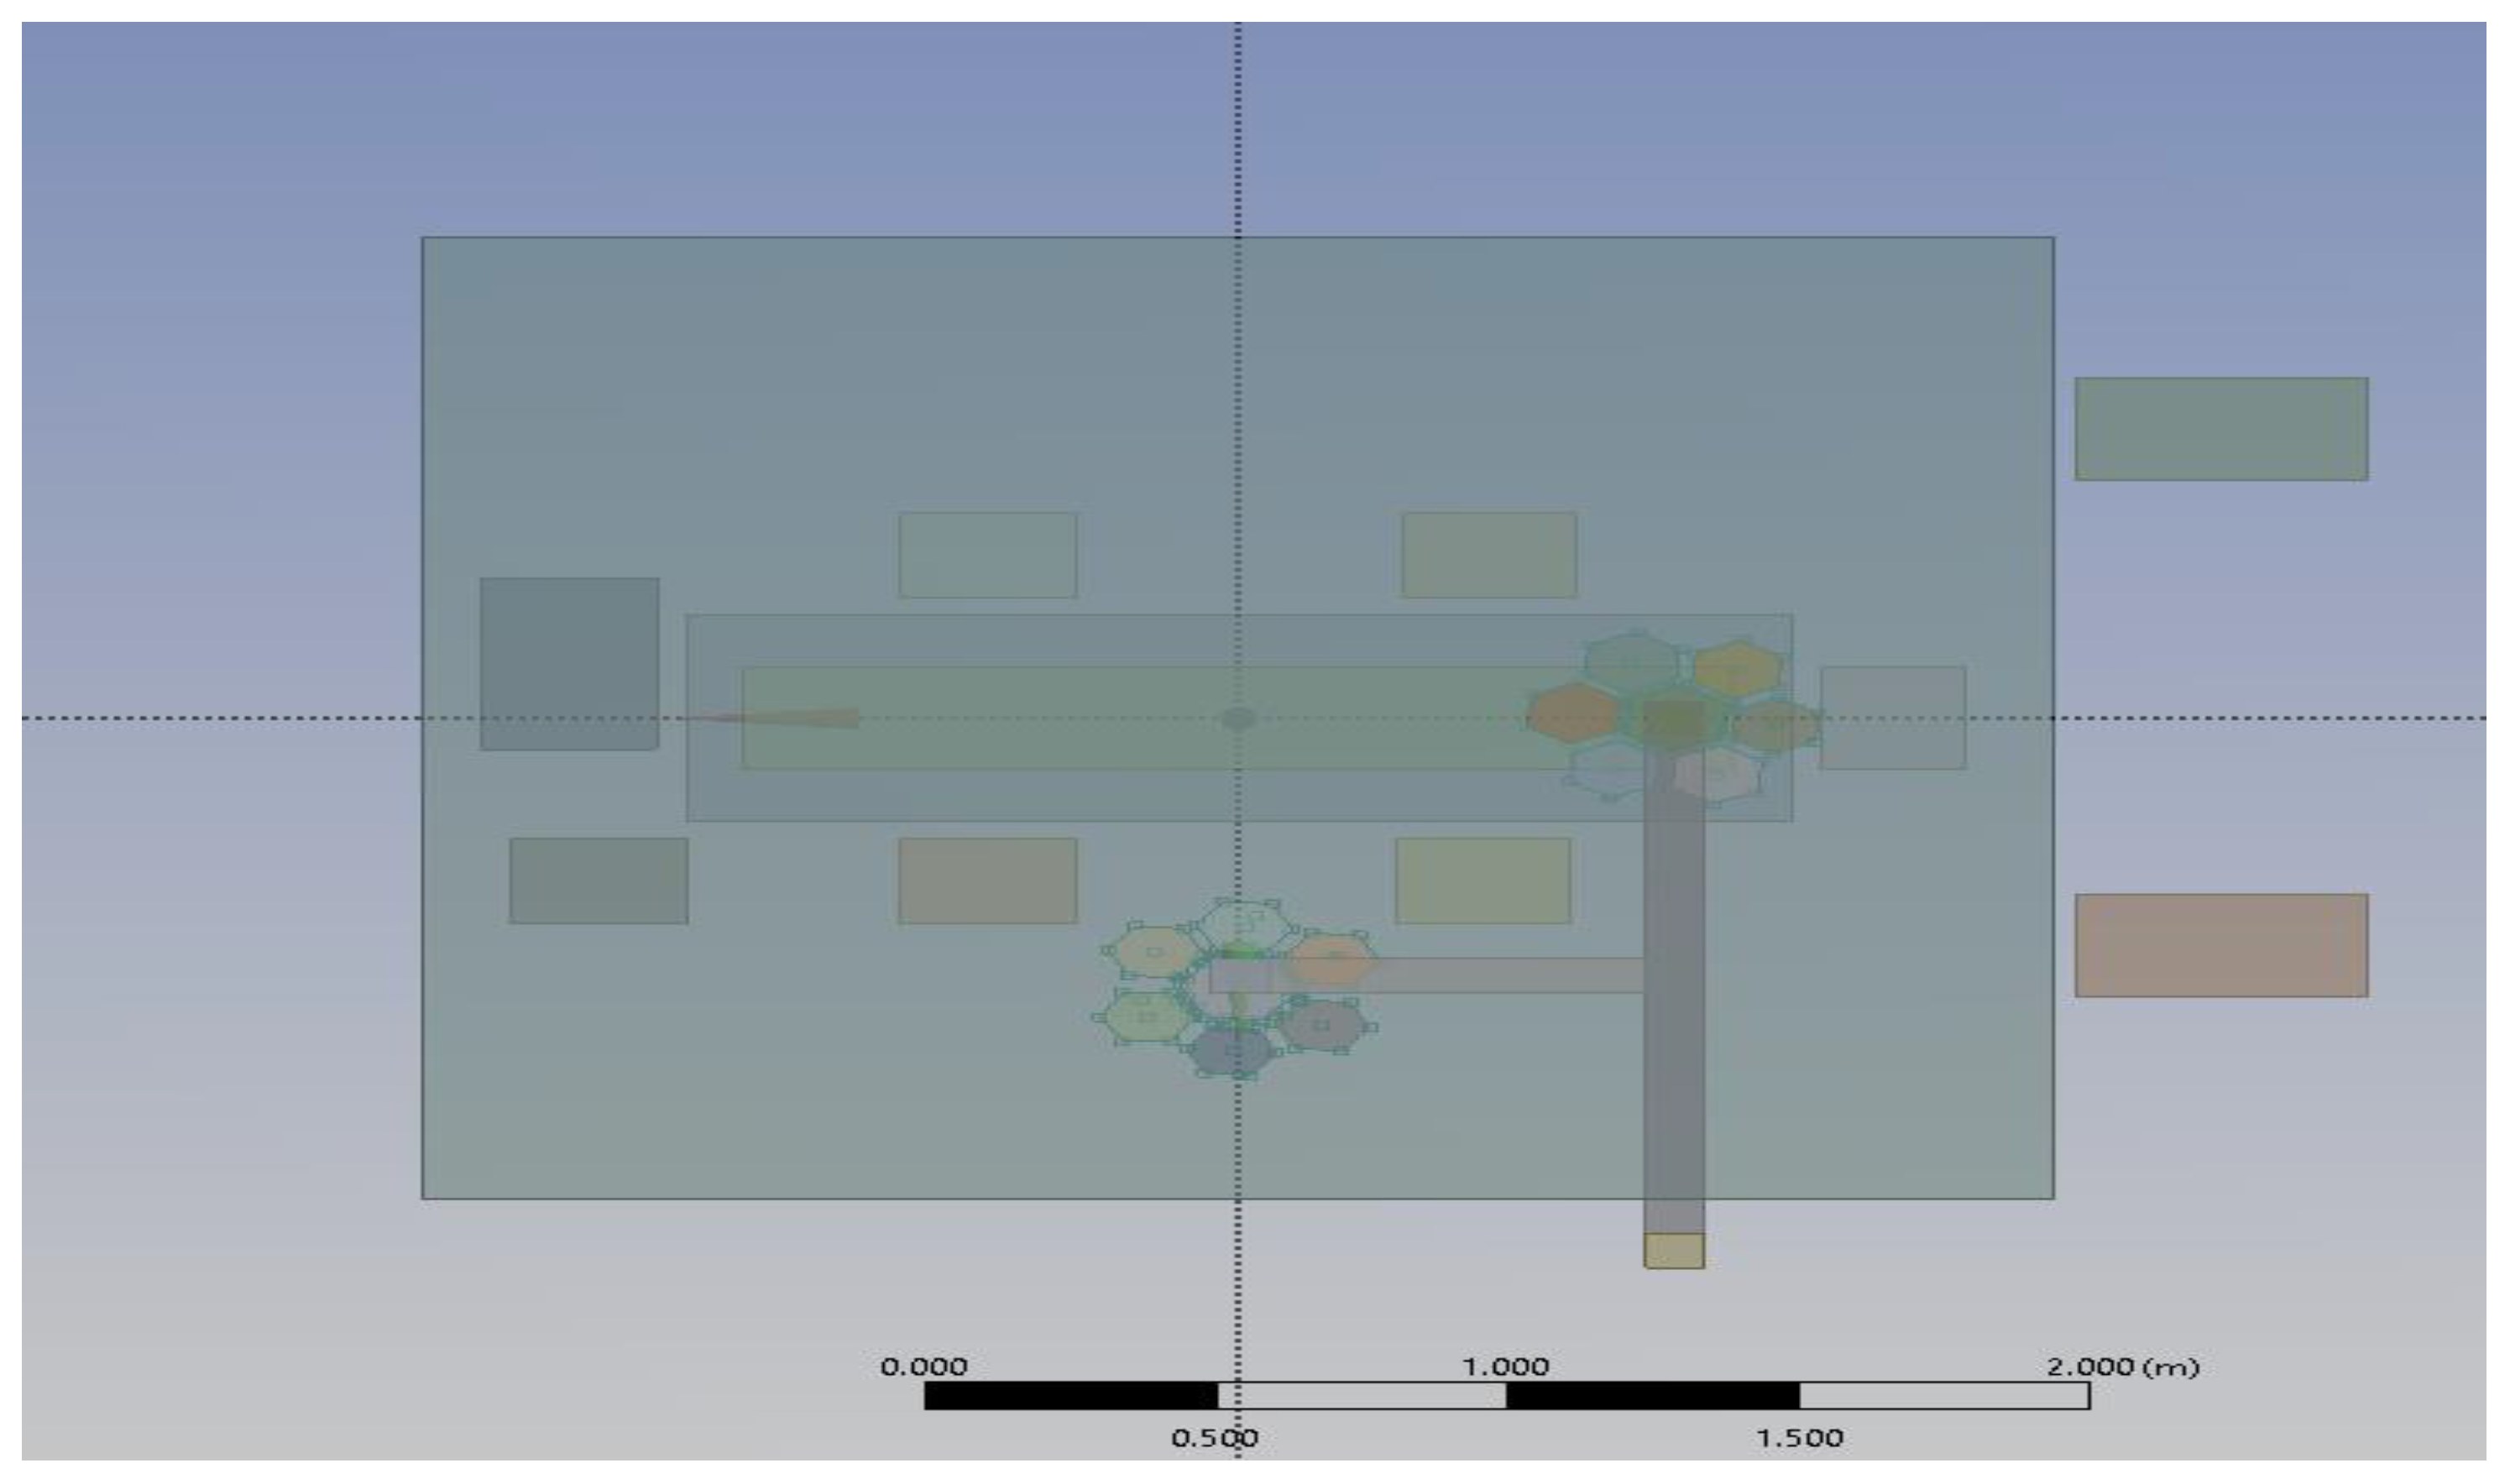
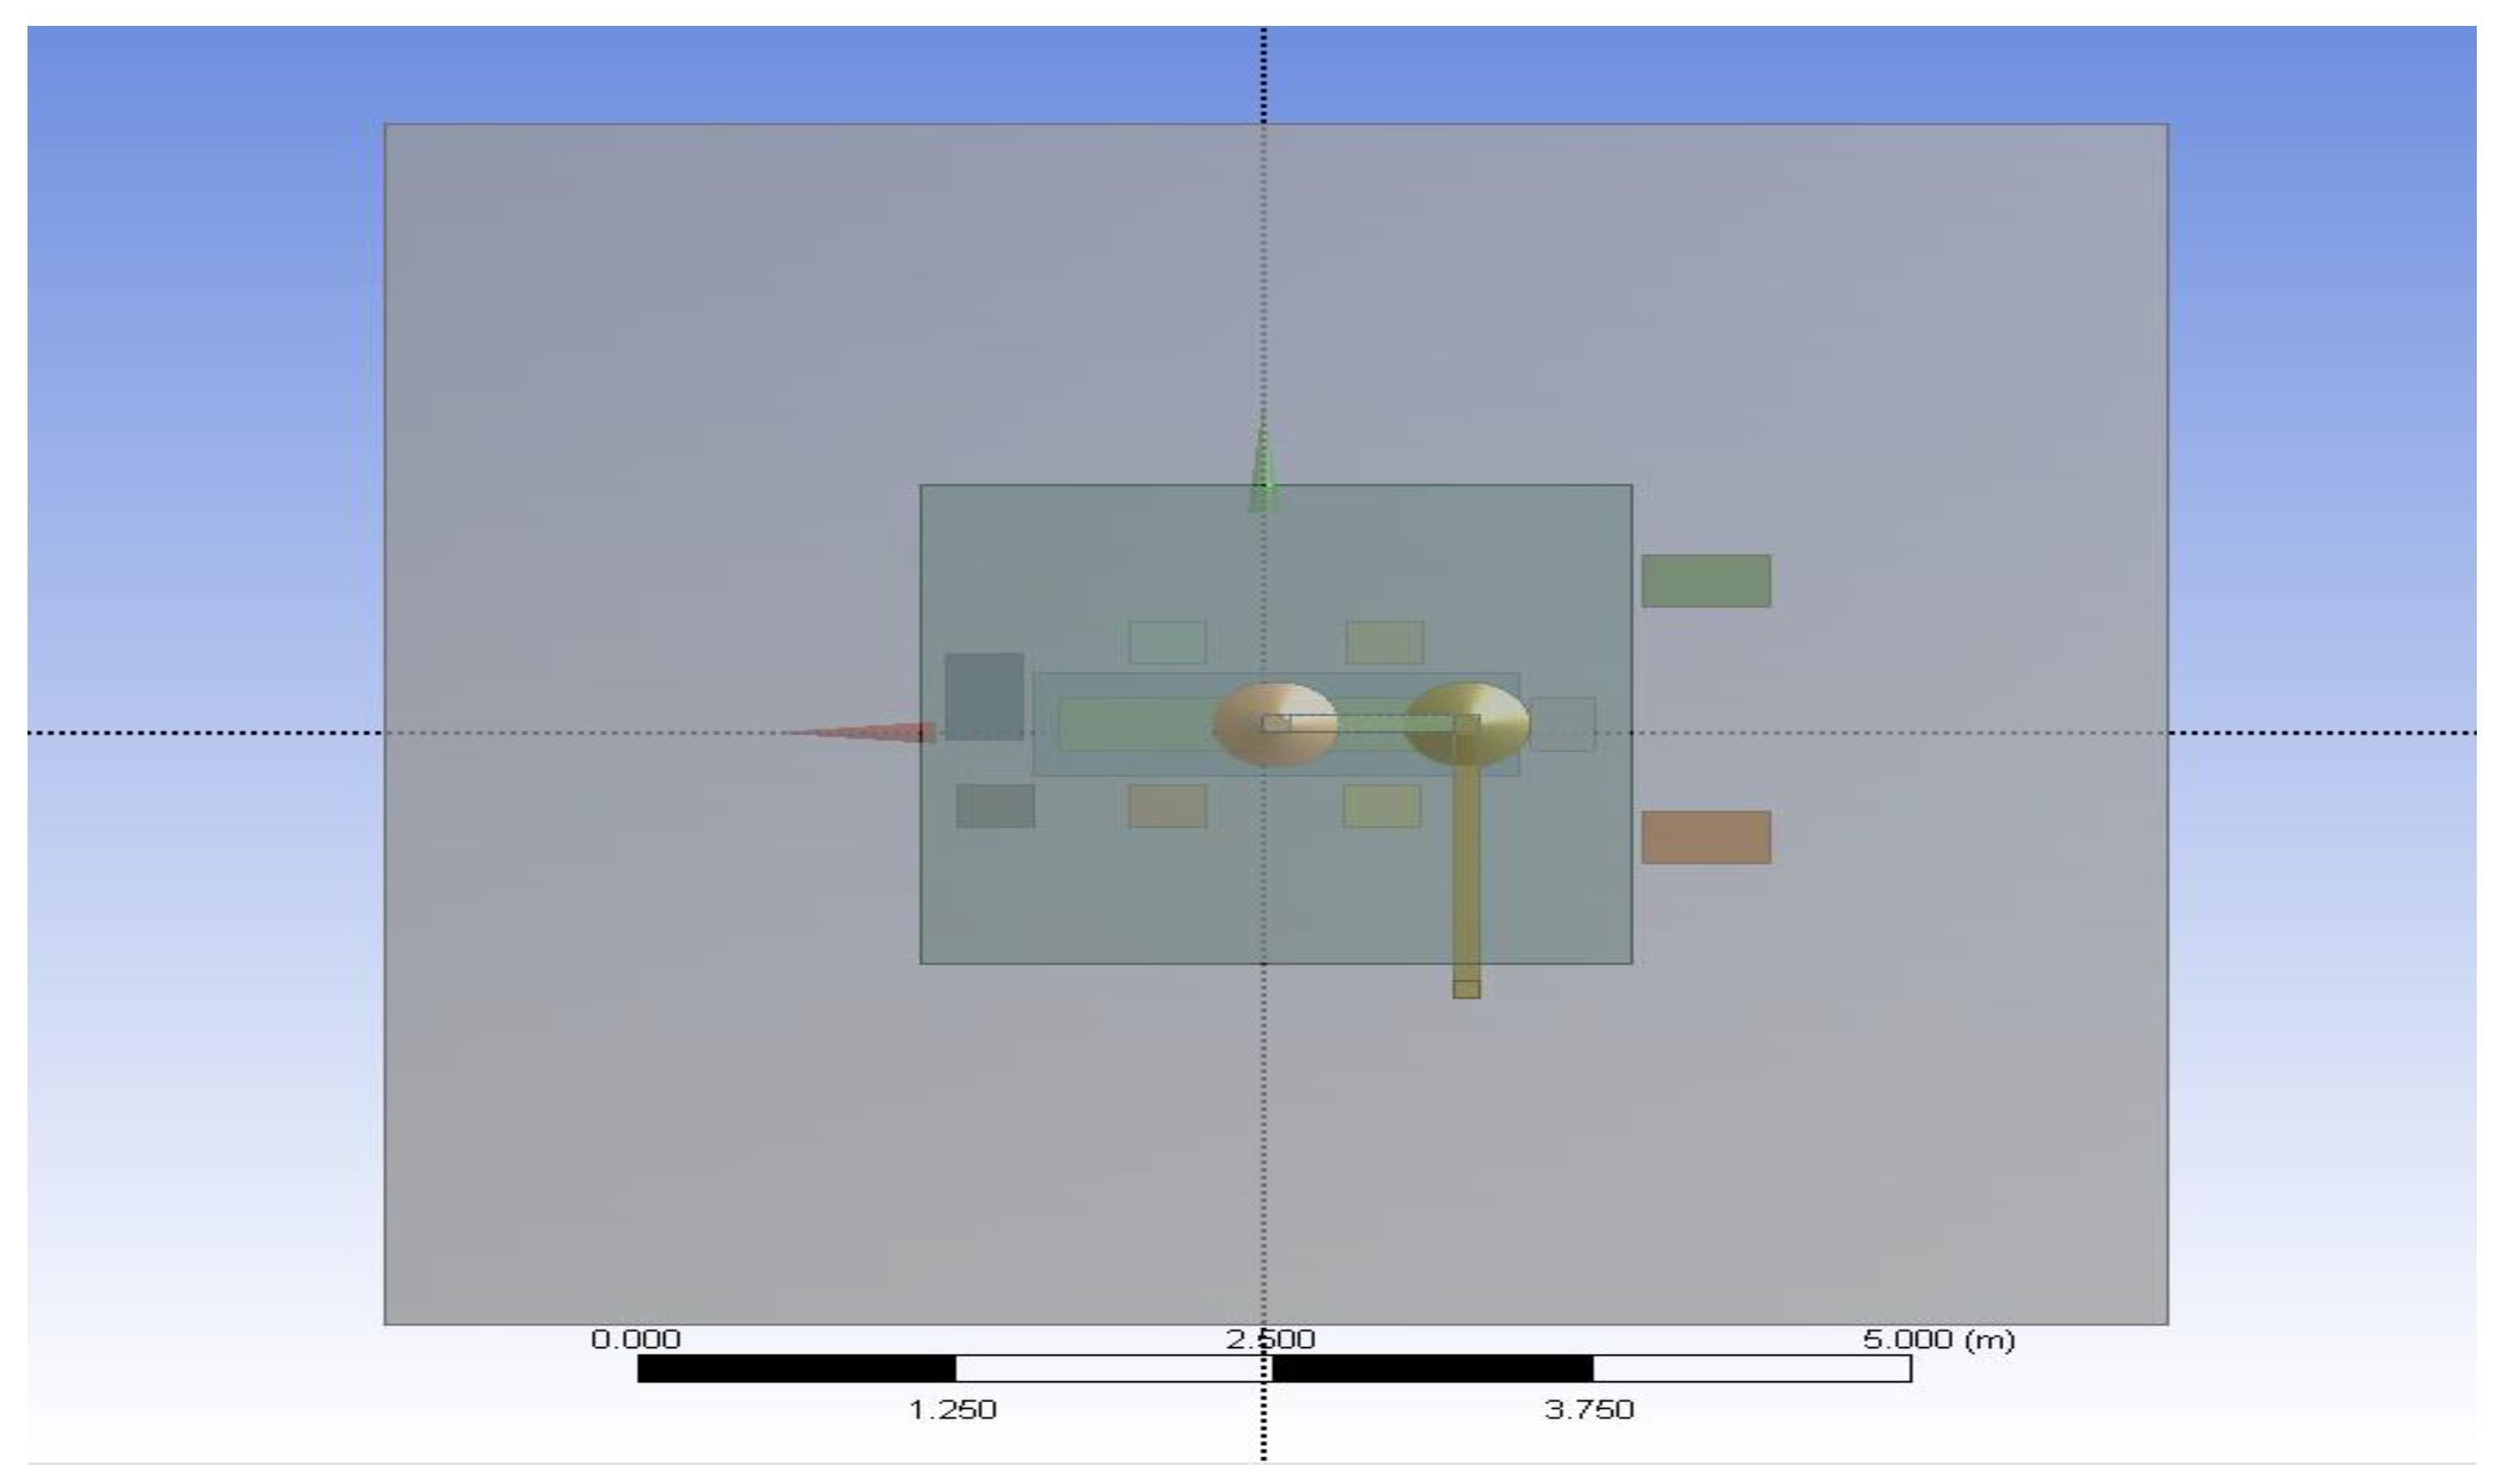
Numerical simulations were conducted using ANSYS Fluent, where the airflow fields were examined under steady-state conditions. Figure 13 illustrates the top view of the OR with the semi-open lamp configuration, while Figure 14 shows the corresponding arrangement for the classic closed-shape lamp.
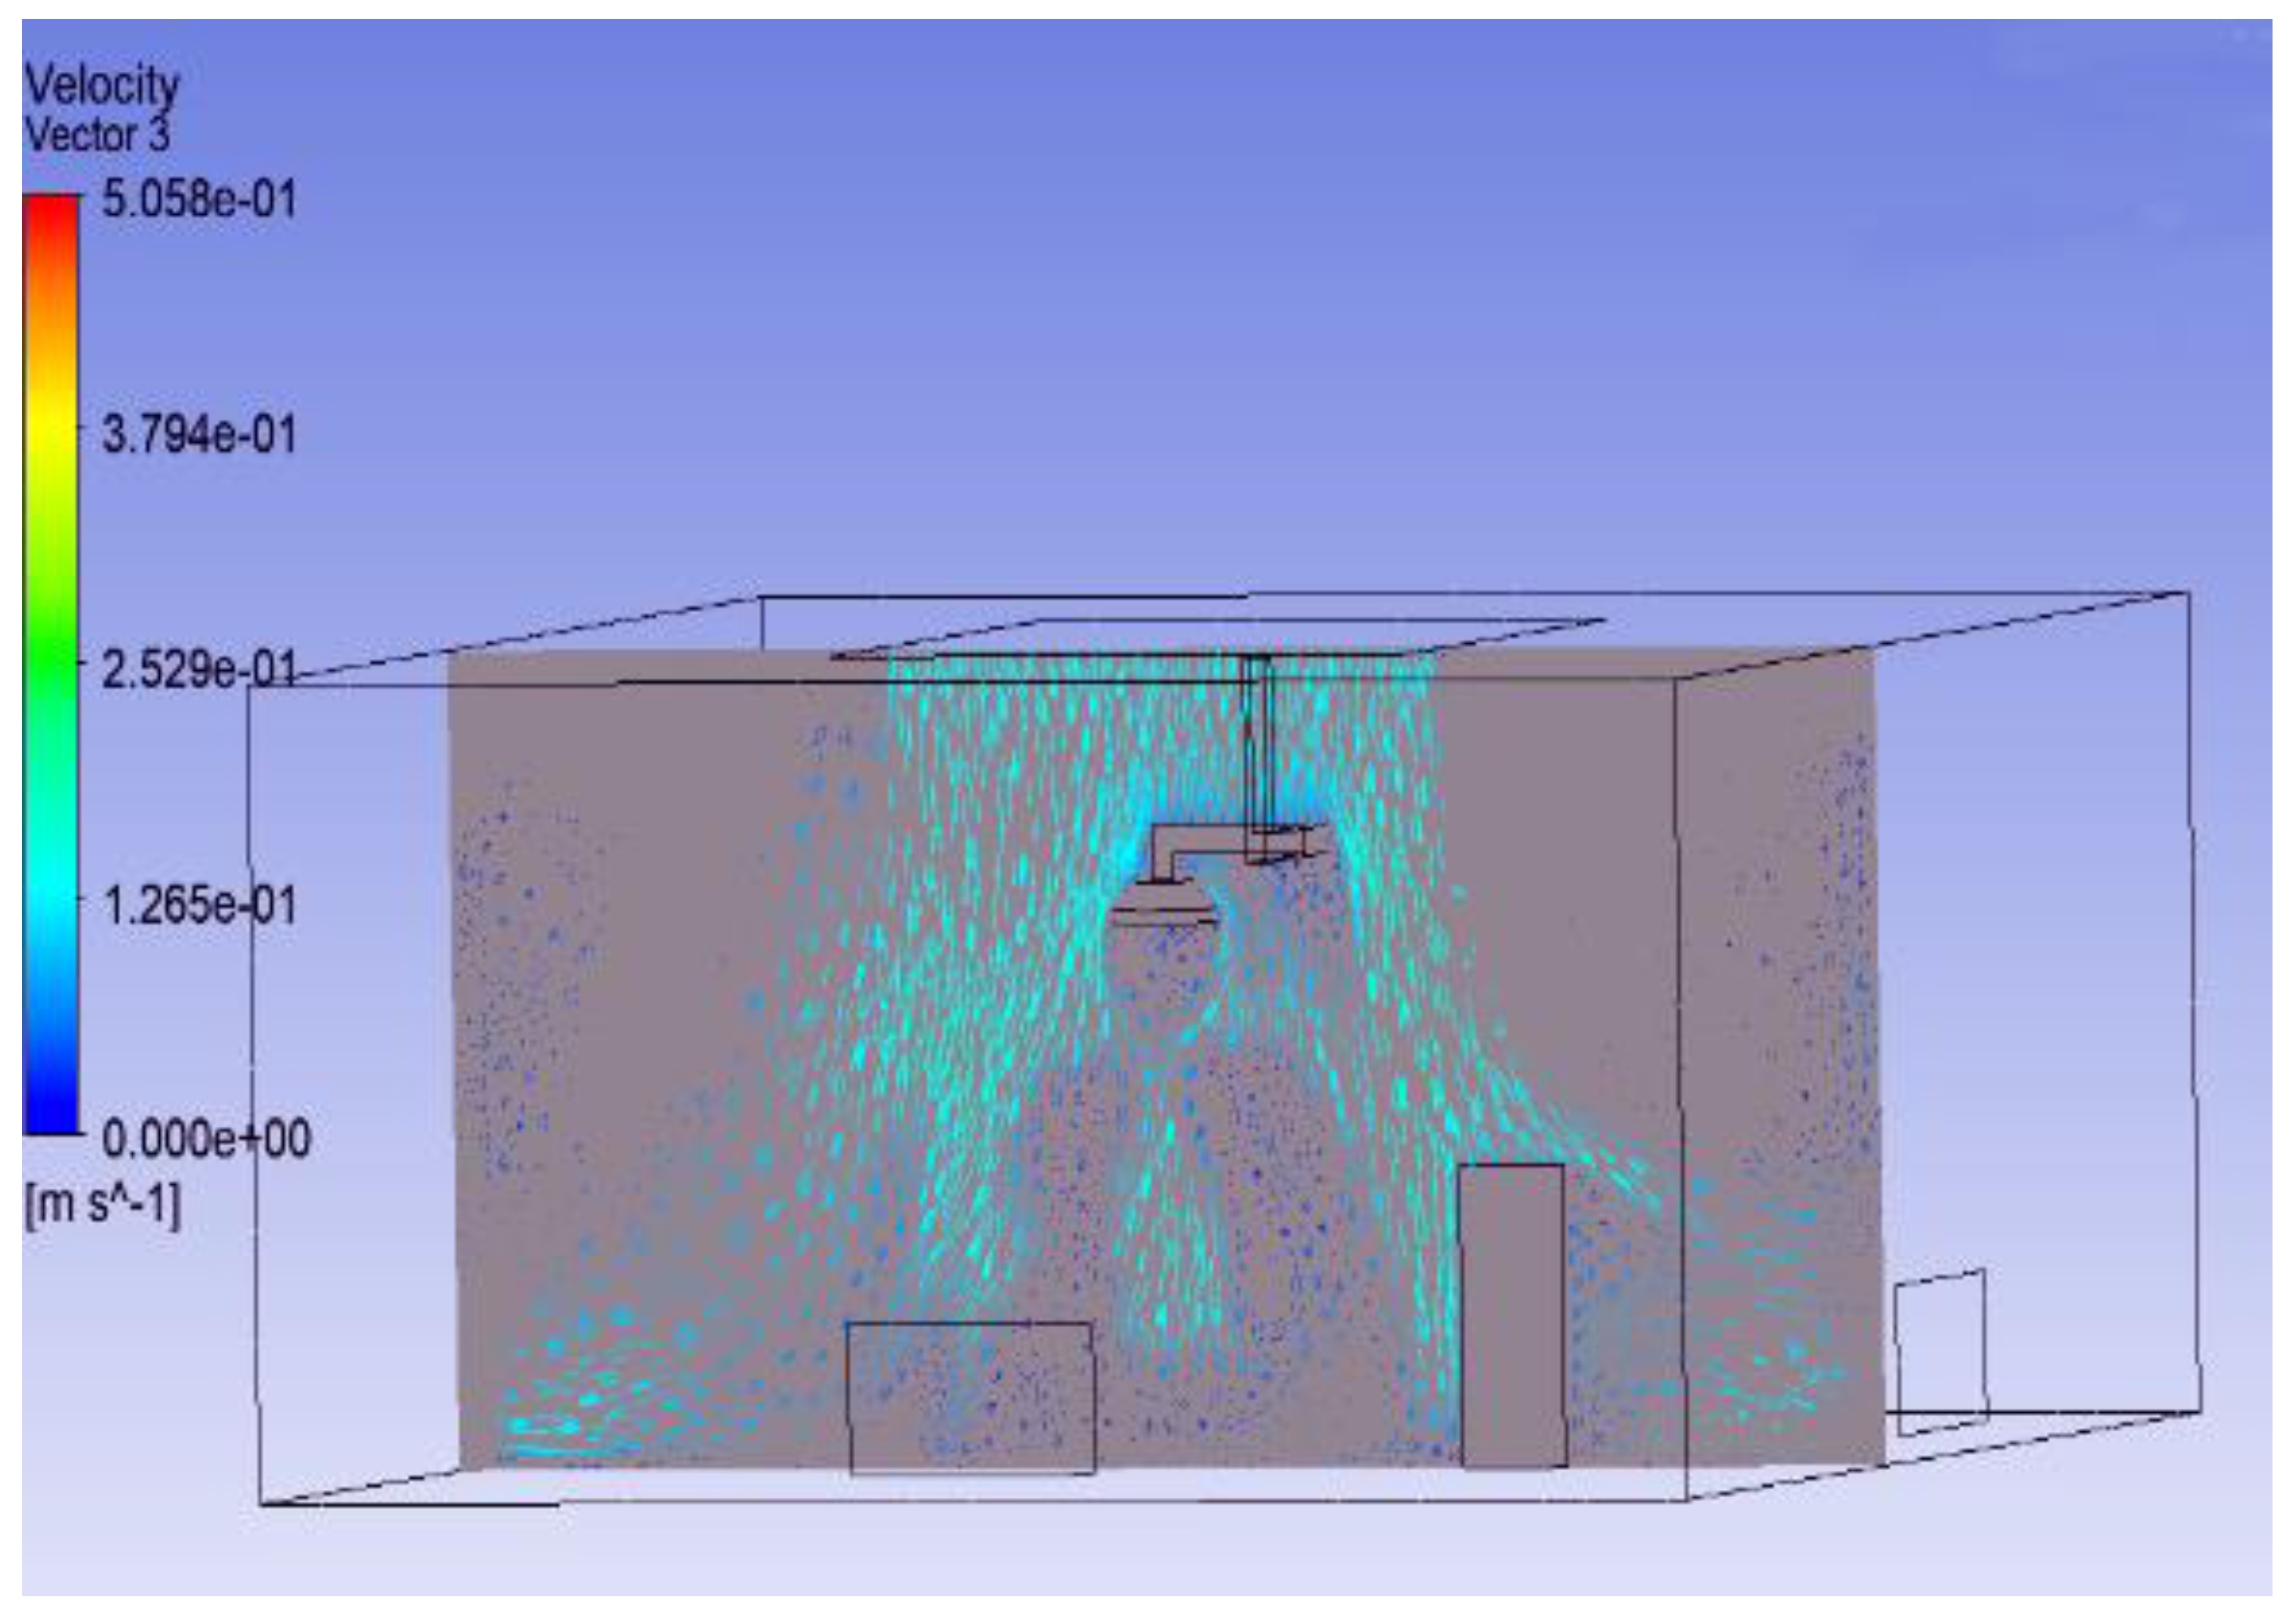
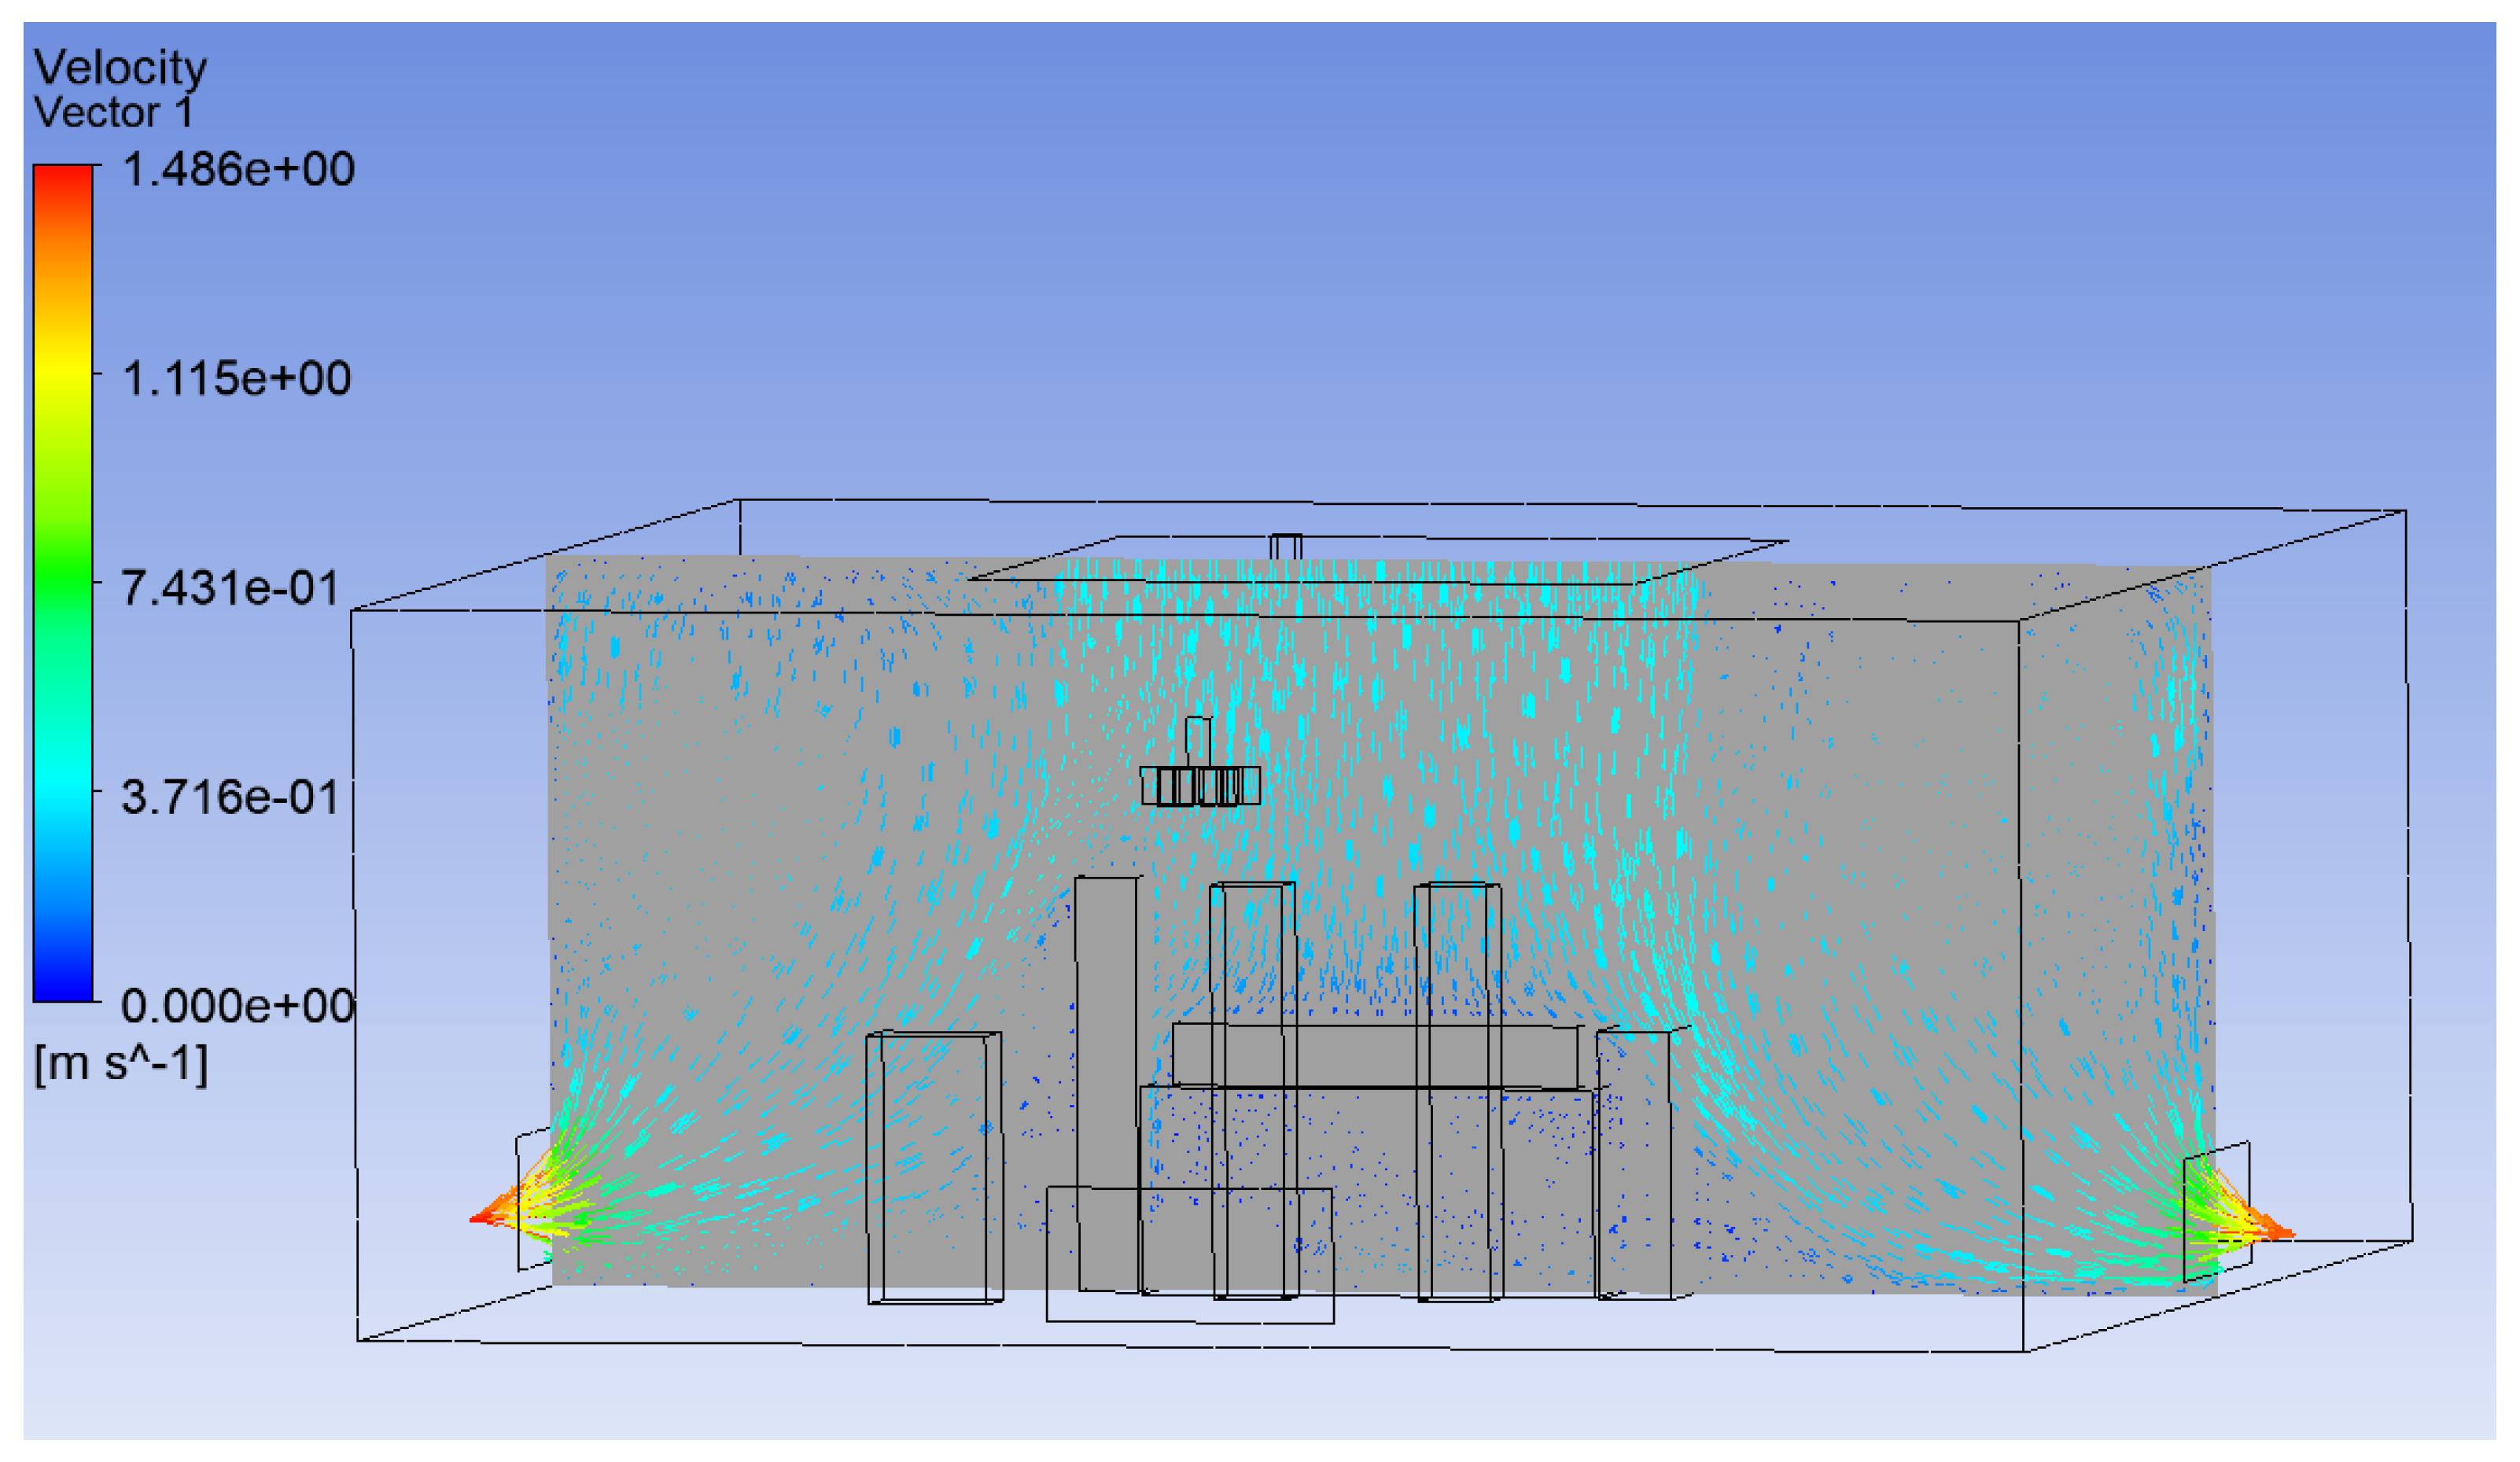
The simulation results indicated that the semi-open lamp introduces minimal disruption to the laminar flow. In contrast, the classic closed-shape lamp causes a significant deterioration of airflow directly beneath its structure. This effect is clearly visible in the vector plots provided in Figure 15 and Figure 16.
  • Figure 15 demonstrates that the airflow is markedly reduced beneath the closed lamp, leading to stagnation zones.
  • Figure 16, on the other hand, shows that the semi-open lamp allows airflow to maintain its uniformity, with minimal distortion observed below the fixture.
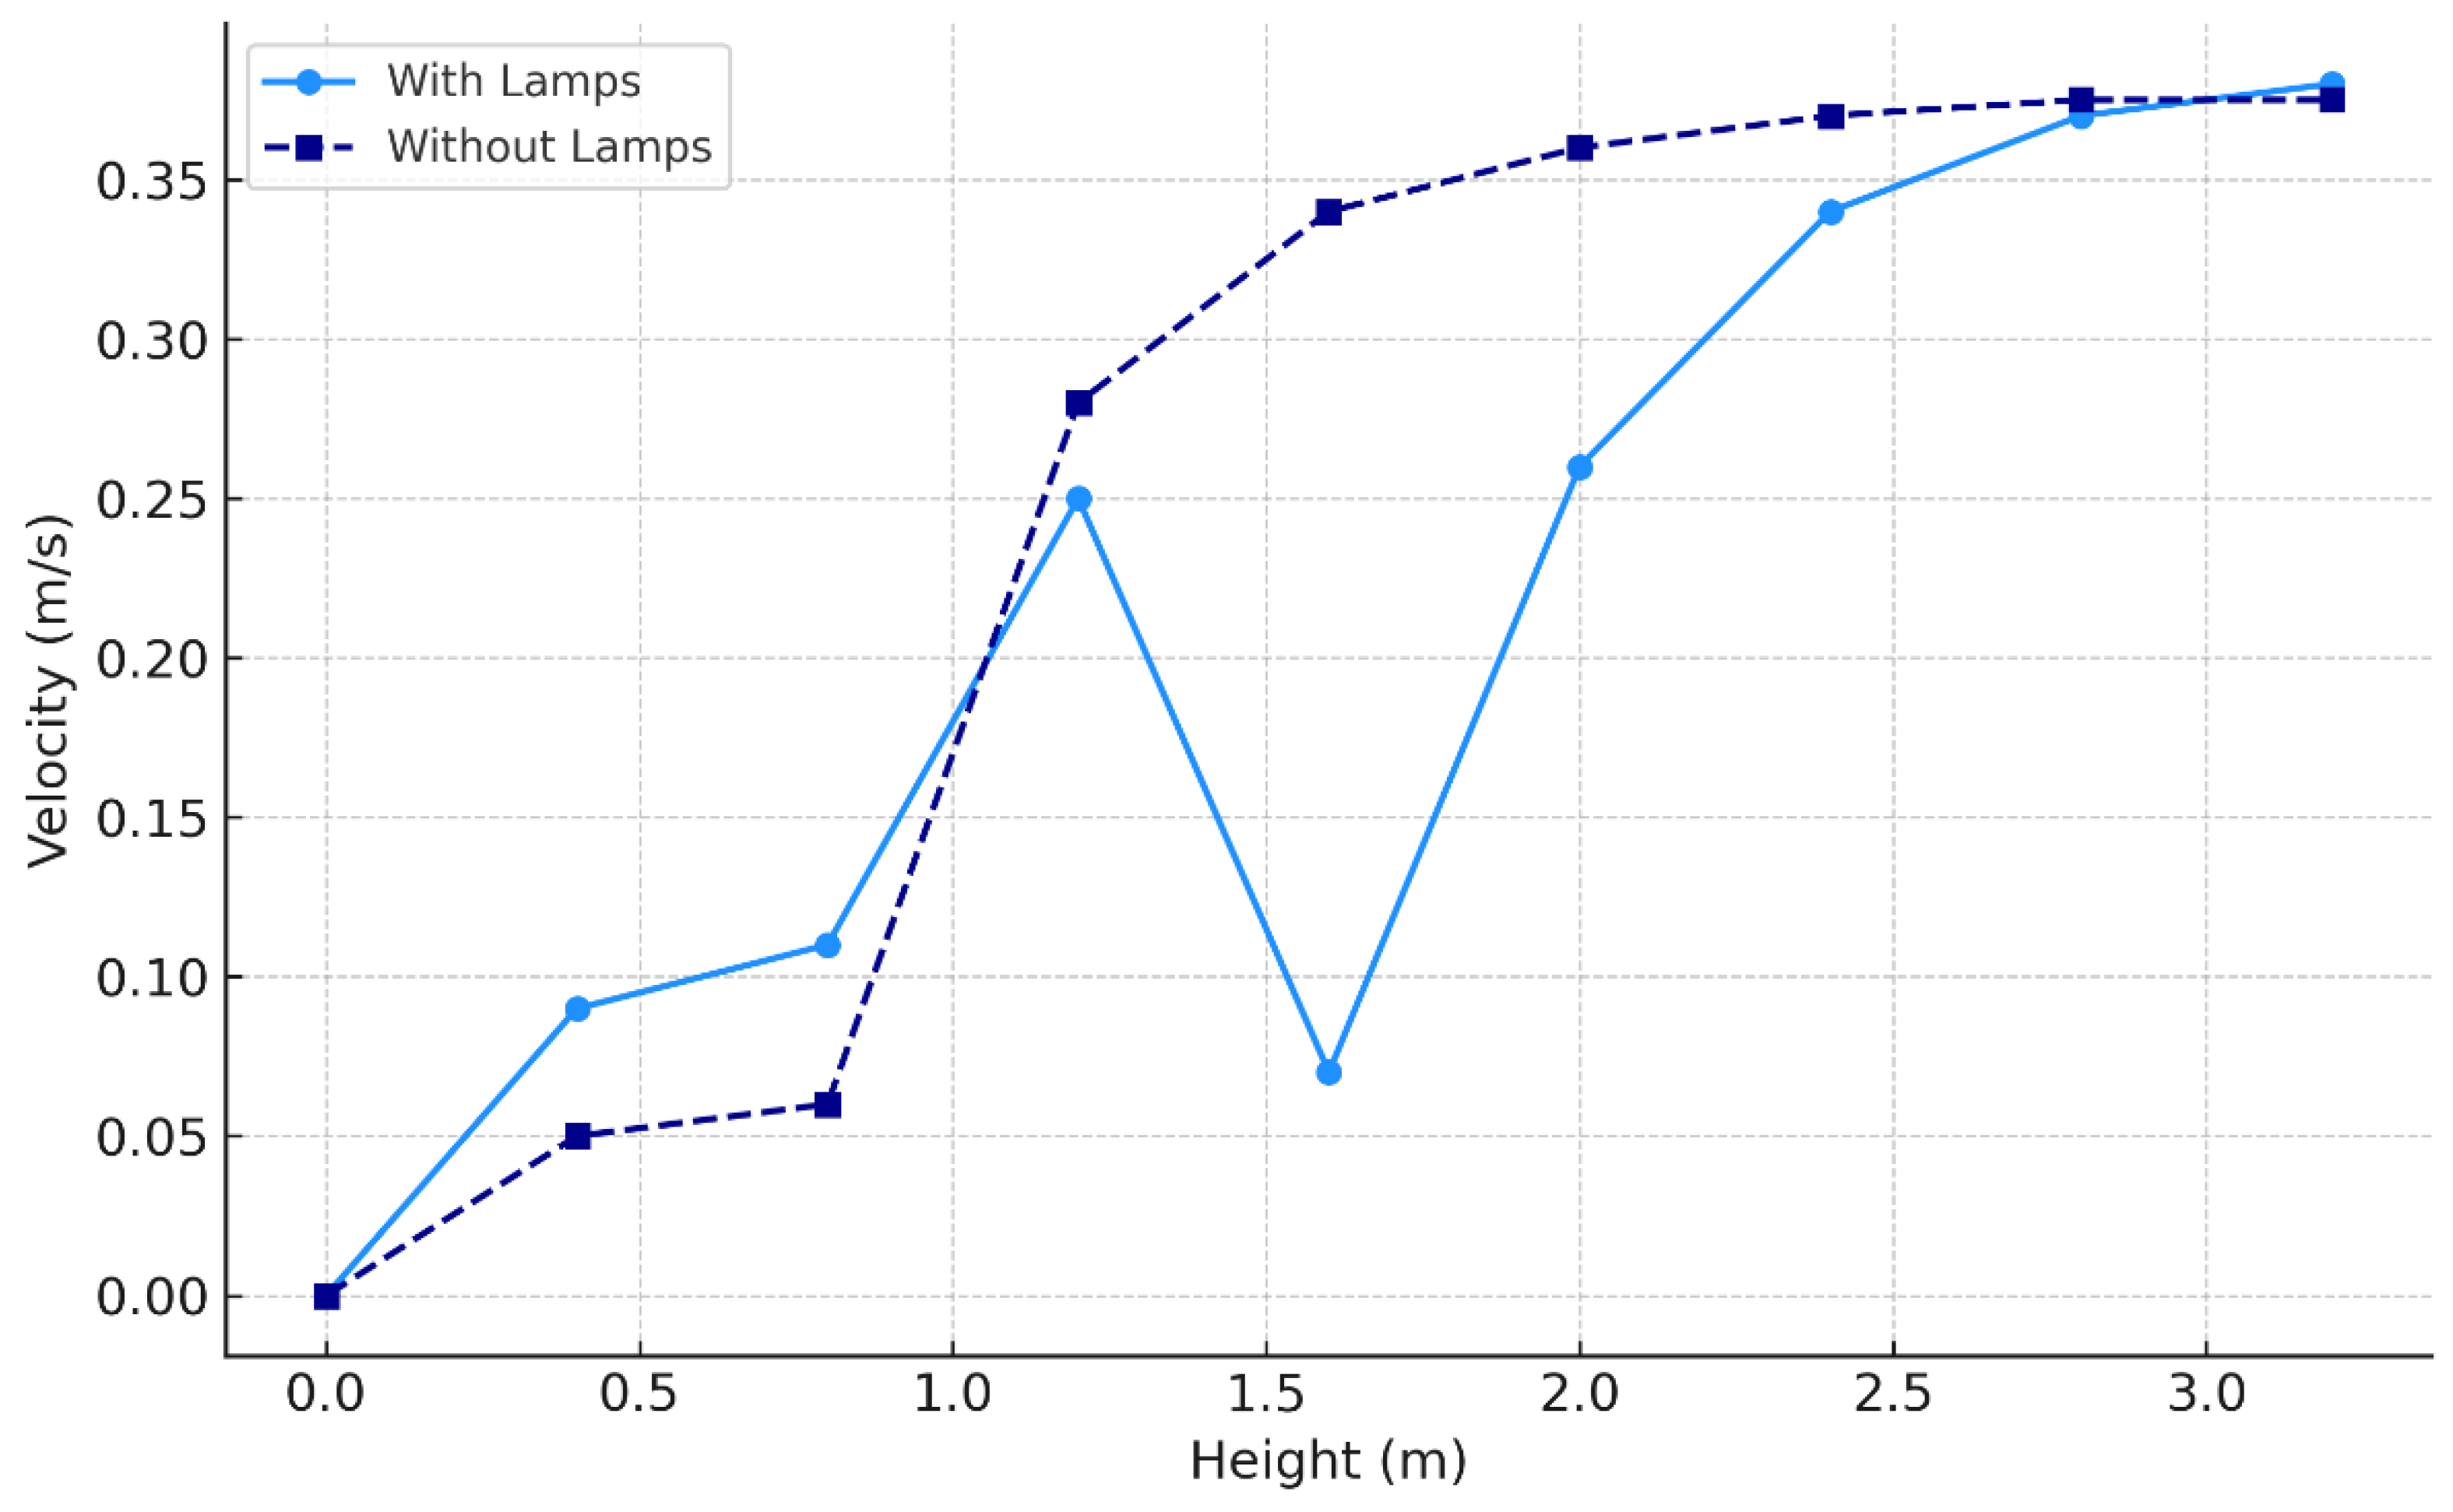
For a more quantitative comparison, the vertical variation in air velocity was plotted along a reference line passing through the centre of the surgical lamp, as illustrated in Figure 17. The corresponding velocity profiles are presented in Figure 18.
Analysis of the results revealed a sharp velocity drop at a height of approximately 1.8 m in the case of the classic closed-shape lamp, indicating airflow obstruction. In contrast, the semi-open lamp exhibited a smooth velocity profile with no significant reduction, thereby preserving airflow continuity in the surgical zone.
These findings suggest that lamp geometry plays a critical role in determining the effectiveness of laminar airflow systems, and that semi-open surgical lamps may offer superior performance in maintaining sterile airflow conditions by avoiding localised very low air velocities above the surgical site.

3.3. Comparison of the Results with Literature

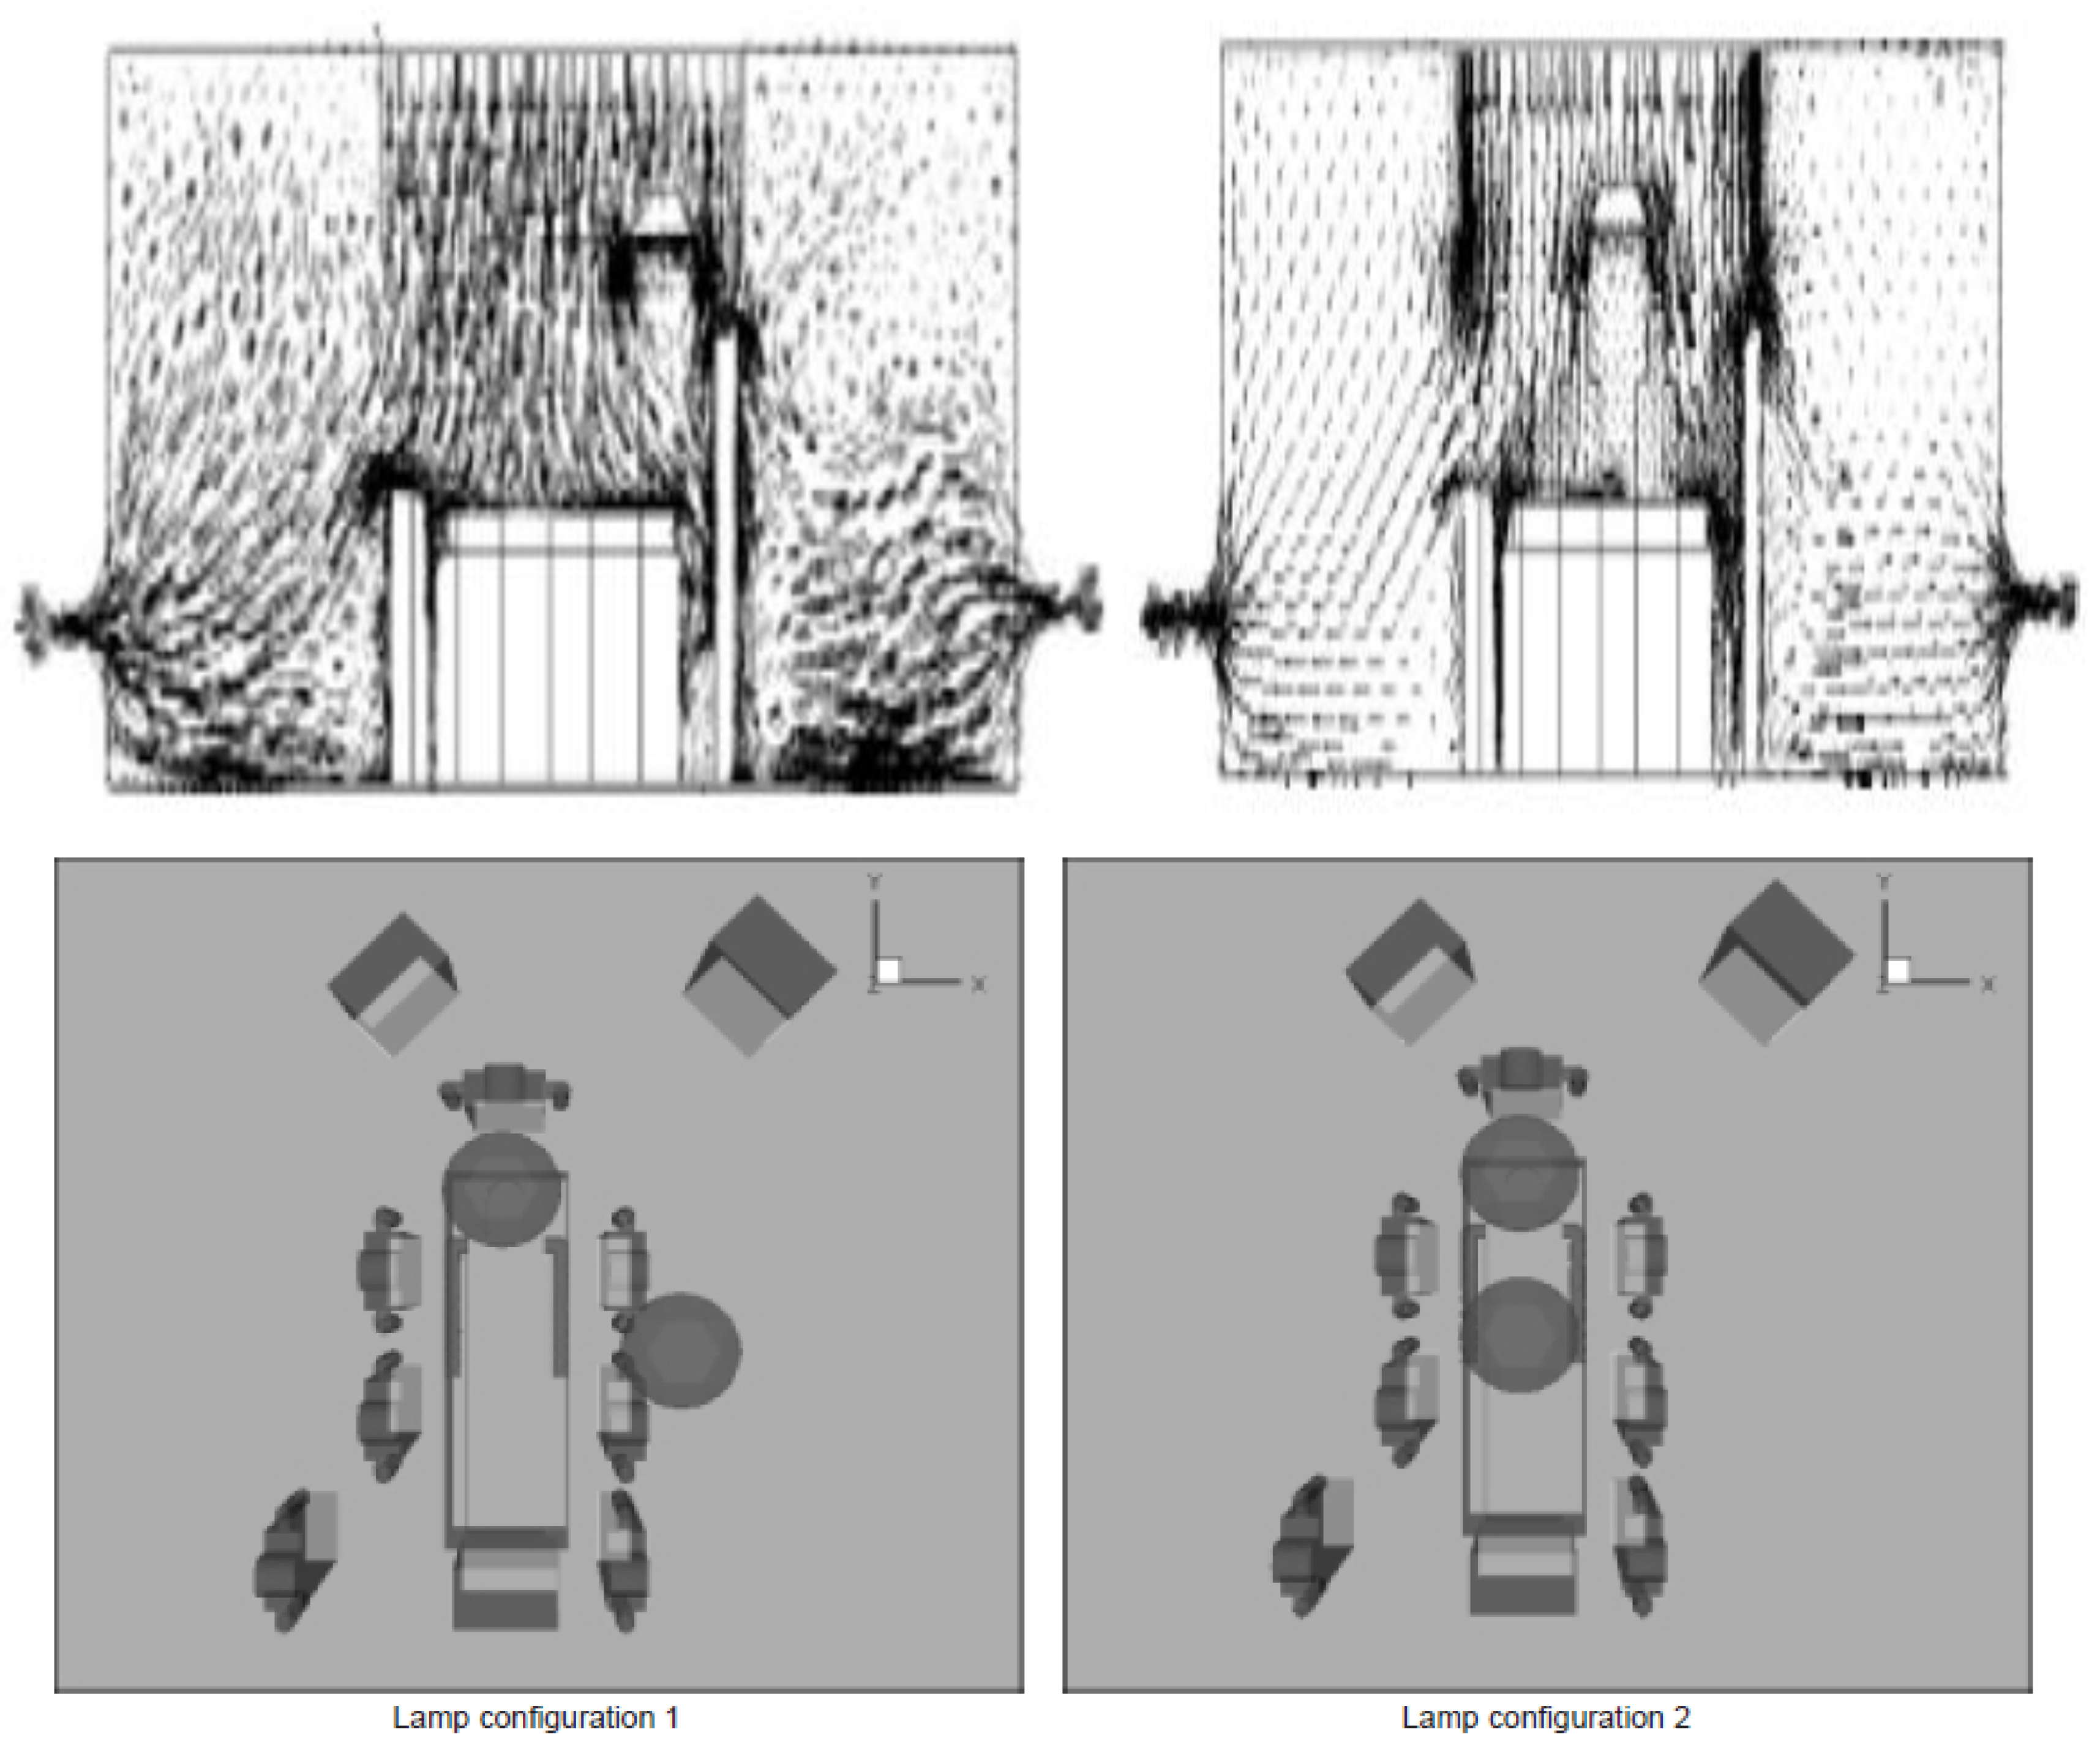
In Figure 19, the results from the literature are shown. The position of the lamp, along with the corresponding flow distribution, is represented.
The results of the simulation match the results from the literature. In the first configuration, the streamlines are deflected when the flow approaches the lamp, but re-align at some distance downstream, whereas in the second configuration, the flow does not re-align until it reaches the surgical site. Therefore, from the results of the simulation and the literature [12], it can be concluded that the first configuration of the lamp, that is, one lamp above the bed and one at the side of the bed, is the better configuration.
The results of the dependency of flow on the surgical lamp’s shape are compared with those of the literature. Figure 20 shows the result from the literature, in which a tracer gas is applied from the bottom, and the flow pattern of the tracer gas is noted.
From Figure 20, it is clear that in the classic closed shape (Figure 20b), the tracer gas was scavenged by the air coming from the supply diffuser. But in the lamp with a semi-open shape (Figure 20a) with ventilation gaps, the turbulence created by the air keeps a distributed pattern of the tracer gas. The intensity of disturbance created by the first configuration is less than the second closed-shaped lamp. It can be concluded that the classic closed shape is better compared with the other configurations. The result obtained from the simulation supports this.

3.4. Modelling of Particle Tracking

Particle tracking is performed using a discrete phase model, in which the particles are modelled with a mean particle size of 6 µm. Particles are assumed to be inert and follow the spherical drag law.
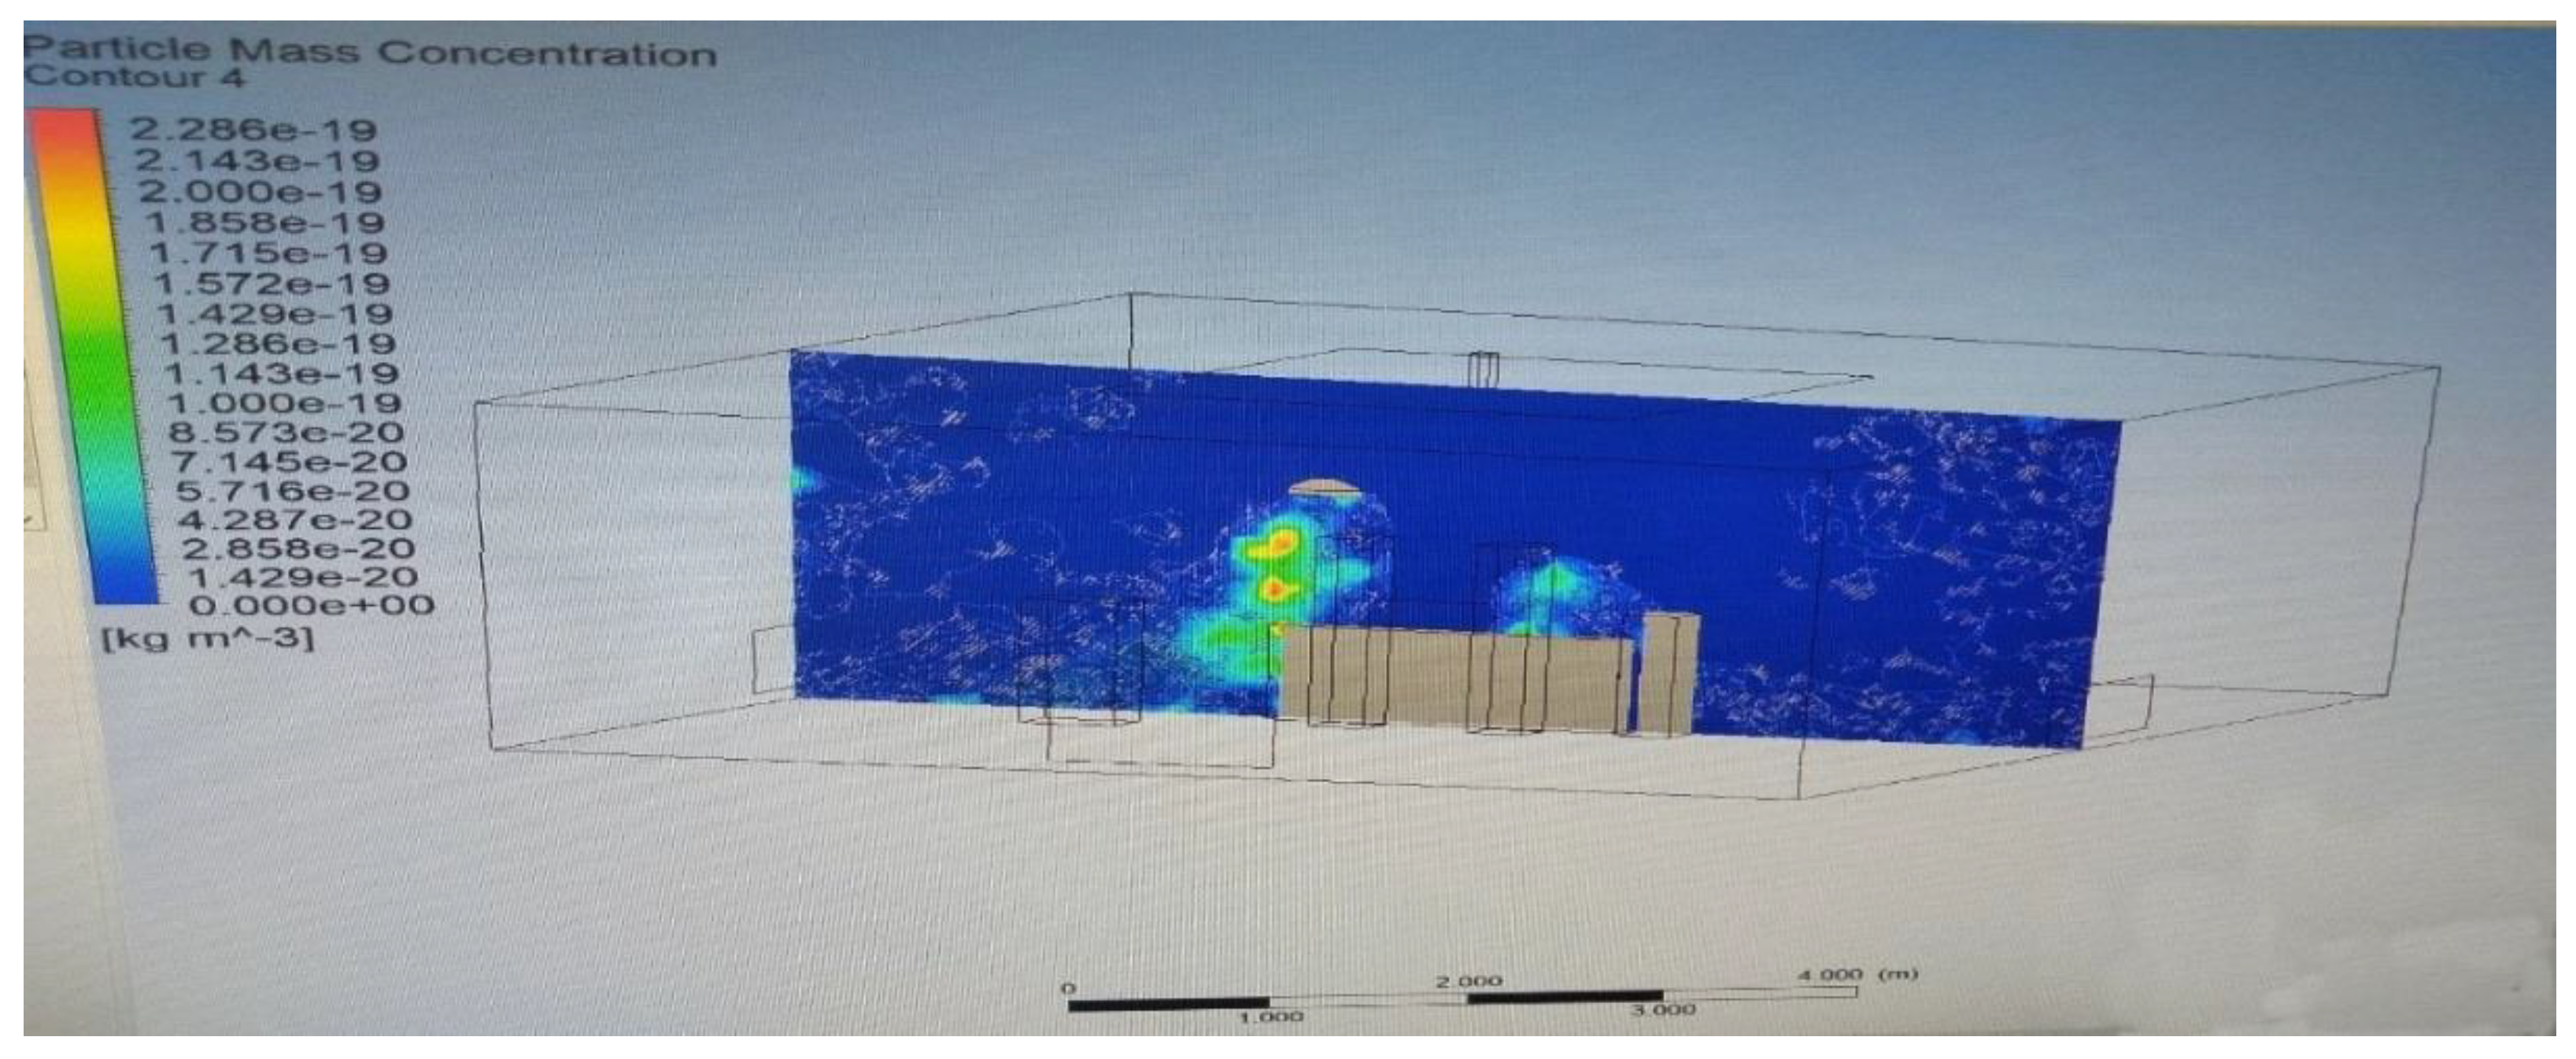
The distribution of particles under the surgical lamp is shown in Figure 21, where the green colour represents the particle distribution. The particles are washed out from the surgical zone by the LAF. However, there will be some regions in which the concentration of particles will be high due to the obstruction to the LAF, especially under the surgical lamp, as shown in Figure 22.
As mentioned before, under the surgical lamp, the airflow was diminished because the washing effect of LAF ceases, which is clear in Figure 21. That is, just under the lamp, the concentration of particles is very high. This may increase the risk of infection during surgery. So the position and shape of the surgical lamp are chosen to reduce the disturbance of flow distribution, as the reduction in SSI is crucial.

3.5. Experimental Results

On-Site Measurement

The important parameters accounted for in this study—temperature, velocity of air, and the carbon dioxide concentration—are observed continuously for 100 s. The mean supply velocity of air is obtained as 1 m/s; the mean temperature of air, 23.35 °C; and the carbon dioxide concentration is about 700 ppm as per Table 5. But under the surgical lamp, the velocity diminishes to 0.9 m/s as per Table 6, which validates the simulation result. The particulate count concentration at three different regions was found by ISO-14644. The OR comes in the class 7 clean room, which is the required class for an OR. The particulate count (counts per litre) readings at three different locations are shown in Table 7, Table 8 and Table 9.
The particulate count readings prove the efficiency of LAF. Under the diffuser, the particulate count is very low compared with the other regions. But at the exit region, the particulate count value is very high, which shows the effectiveness of the washing effect of LAF. Hence, from the particulate count reading, it is ensured that LAF is a proper flow distribution system.

3.6. Modelling of Contaminant Concentration Using Species Transport

The dispersion of exhaled carbon dioxide (CO2) within the operating room was simulated using the species transport model in ANSYS Fluent. The objective was to evaluate the spatial concentration of gaseous contaminants and compare the numerical results with experimental data obtained from field measurements.
CO2, released during human respiration, was considered the representative contaminant. The analysis involved computing the mass fraction of CO2 within the indoor air mixture, defined as:
Mass fraction of carbon dioxide in the air within the model,
m f c = m c m a + m c
m a : Mass of air, kg
m c : Mass of CO2, kg
m f c : Mass fraction of CO2
Density of CO2 = 1.98 kg/m3
Density of air = 1.2 kg/m3
Velocity of air = 1 m/s
Velocity of CO2 = 1 m/s
The exhalation velocity of human beings lies in the range of 0.6–1.4 m/s. So, on average, 1 m/s is taken.
Using these values, the calculated mass fraction of CO2 was approximately 0.8082%. A user-defined function (UDF) was implemented to convert this value to concentration in parts per million (ppm) using the relationship:
ppm = mass fraction × 106
The spatial distribution of contaminant concentration is shown in Figure 23, where arrow indicates CO2 exhalation from the nasal region of an occupant. The occupant and staff positioning were referenced from previous figures. The surgical staff was modelled standing beside the patient bed, positioned outside the direct path of the inlet diffuser.
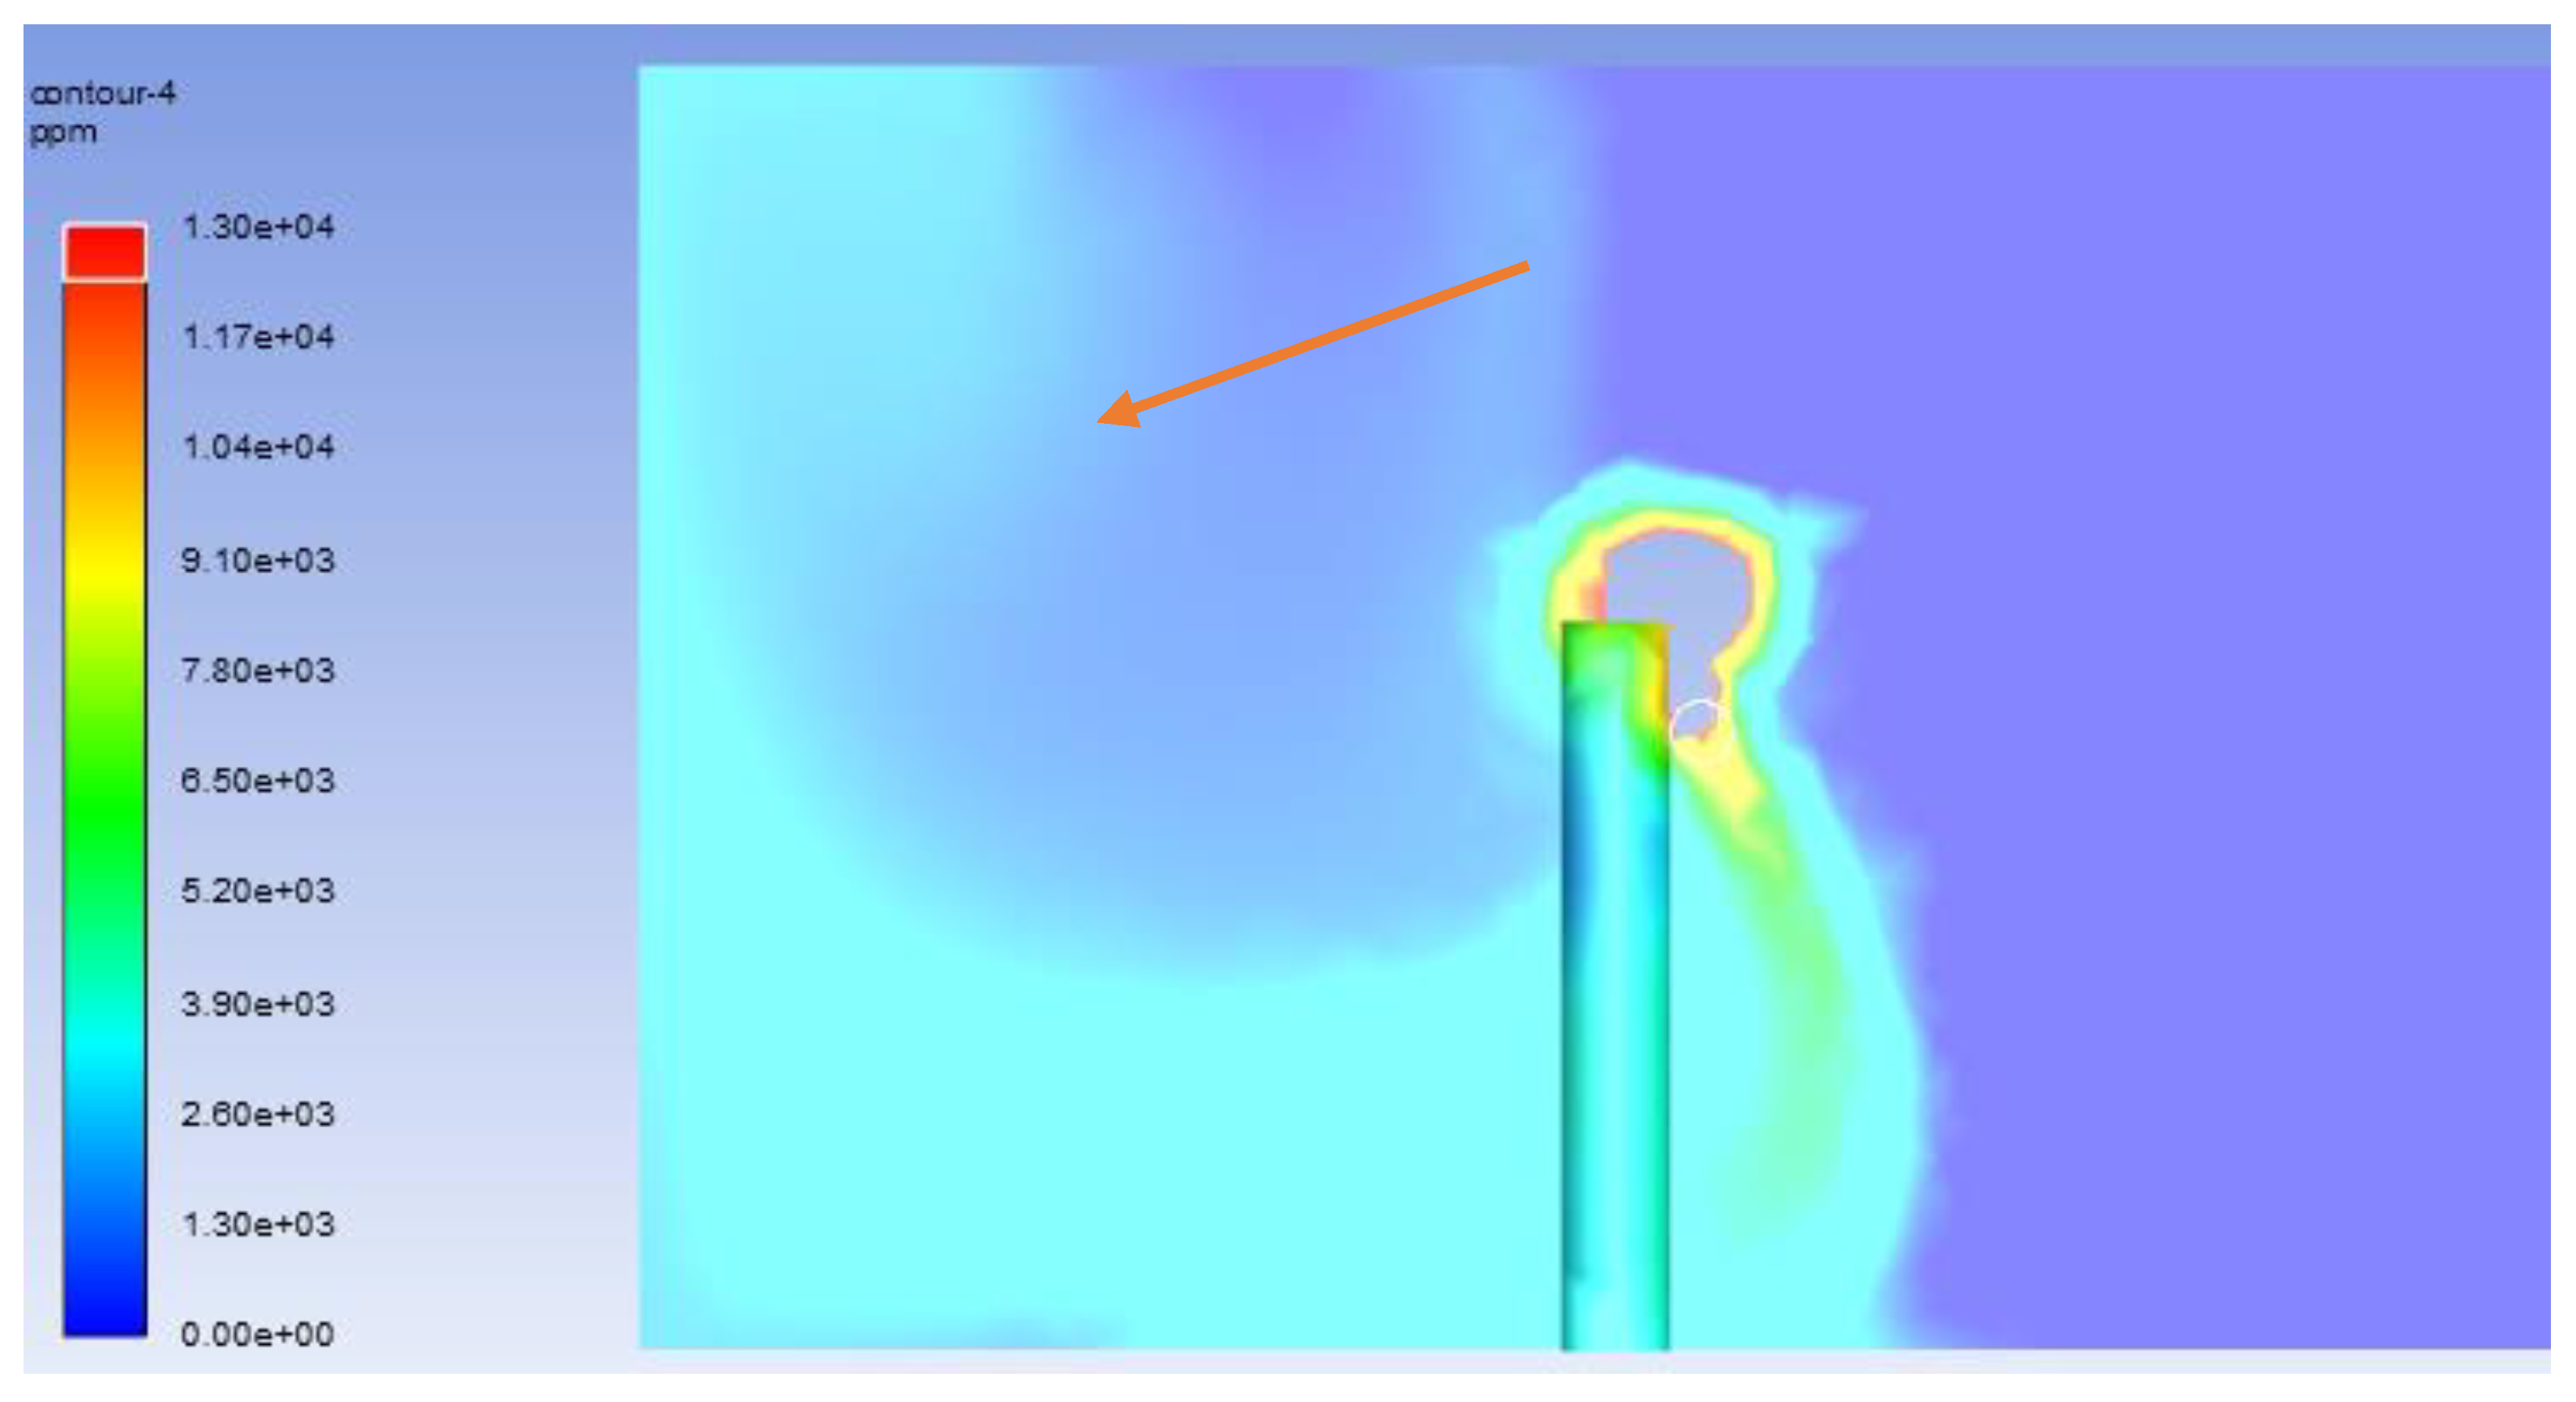
To assess the effectiveness of laminar airflow (LAF) in diluting and removing contaminants, the CO2 concentration was evaluated directly beneath the LAF region, as illustrated in Figure 24. A probe located in the central airflow zone—indicated by a small circular marker—registered CO2 concentrations ranging between 0 and 600 ppm.
These values fall well within acceptable indoor air quality limits, indicating that the LAF system effectively reduces contaminant concentrations in the sterile field, even in the presence of exhaled gases from nearby occupants.

4. Conclusions

The successful operation of a surgical operating room hinges on meeting four critical environmental parameters: temperature, humidity, air change rate, and pressure, all of which must align with established international standards. Laminar airflow systems are widely adopted to maintain sterile conditions. On-site measurements conducted in this study revealed that the reference OR failed to fully meet recommended operational conditions. Notably, humidity control was inadequate, and both air velocity and temperature exceeded the desirable limits.
Although the particulate count in the surgical zone met the criteria for an ISO Class 7 cleanroom, this falls short of the ISO Class 5 standard required for surgical environments. The elevated particle concentration is likely attributed to the high supply air velocity, which lowers local pressure and potentially draws contaminants from adjacent zones into the critical field. Furthermore, air recirculation patterns observed in simulations highlight a possible contamination risk, necessitating improved airflow strategies.
To address these challenges, the study examined two surgical lamp configurations and two distinct lamp geometries to assess their impact on airflow patterns:
  • Position 1: One lamp positioned above the patient’s bed and the other laterally above the surgical staff.
  • Position 2: Both lamps placed directly above the patient, over the head and abdominal region.
Simulation results revealed that position 1 produces less disruption in airflow patterns, supporting a more uniform laminar flow across the surgical field. These findings were consistent with trends observed in previous literature.
Subsequently, the effect of lamp shape was investigated by modelling: (i) a classic closed-shape lamp, and (ii) a semi-open lamp with ventilation gaps. Simulations indicated that the semi-open design produced slightly improved airflow characteristics.
In the final model, the classic closed-shape lamp was retained and deployed in the first position orientation. Additional simulations using species transport analysis were performed to assess CO2 concentration, representing exhaled contaminants from occupants. The improved configuration demonstrated significantly lower contaminant concentrations, with values well below the recommended upper threshold.
These results underscore the importance of optimised lamp position, selection of the lamp fixture, and velocity control in maintaining air quality in critical surgical environments.

Author Contributions

V.V.K.: Conceptualisation, methodology, formal analysis, preparation of the original draft of the paper. C.M.: Methodology, review and editing of the paper. A.P.: Validation, review and editing of the paper. All authors have read and agreed to the published version of the manuscript.

Funding

The authors received no financial support for the research, authorship, and/or publication of this article.

Data Availability Statement

The data presented in this study are available from the corresponding author upon request.

Conflicts of Interest

The authors declare no conflict of interest.

References

  1. American Society of Heating, Refrigerating and Air-Conditioning Engineers. ASHRAE Handbook—Fundamentals; ASHRAE: Atlanta, GA, USA, 2017. [Google Scholar]
  2. Geshwiler, M. HVAC Design Manual for Hospitals and Clinics; ASHRAE: Atlanta, GA, USA, 2003. [Google Scholar]
  3. Alkhalaf, M.; Ilinca, A.; Hayyani, M.Y.; Martini, F. Impact of Diffuser Location on Thermal Comfort Inside a Hospital Isolation Room. Fluids 2024, 8, 19. [Google Scholar] [CrossRef]
  4. Owens, C.D.; Stoessel, K. Surgical site infections: Epidemiology, microbiology and prevention. J. Hosp. Infect. 2008, 70 (Suppl. 2), 3–10. [Google Scholar] [CrossRef] [PubMed]
  5. Whitcomb, J.G.; Clapper, W.E. Ultraclean operating room. Am. J. Surg. 1966, 112, 681–685. [Google Scholar] [CrossRef] [PubMed]
  6. American Society of Heating, Refrigerating and Air-Conditioning Engineers. ASHRAE Handbook—Heating, Ventilating, and Air-Conditioning Systems and Equipment; ASHRAE: Atlanta, GA, USA, 2008. [Google Scholar]
  7. ISO 14644-1:2015; Cleanrooms and Associated Controlled Environments, Part 1: Classification of Air Cleanliness by Particle Concentration. International Organization for Standardization: Geneva, Switzerland, 2015; Volume 1.
  8. Ho, S.H.; Rosario, L.; Rahman, M.M. Three-dimensional analysis for hospital operating room thermal comfort and contaminant removal. Appl. Therm. Eng. 2009, 29, 2080–2092. [Google Scholar] [CrossRef]
  9. Agodi, A.; Auxilia, F.; Barchitta, M.; Cristina, M.L.; D’Alessandro, D.; Mura, I.; Nobile, M.; Pasquarella, C.; Avondo, S.; Bellocchi, P.; et al. Operating theatre ventilation systems and microbial air contamination in total joint replacement surgery: Results of the GISIO-ISChIA study. J. Hosp. Infect. 2015, 90, 213–219. [Google Scholar] [CrossRef] [PubMed]
  10. Aganovic, A.; Cao, G.; Stenstad, L.-I.; Skogås, J.G. Impact of surgical lights on the velocity distribution and airborne contamination level in an operating room with laminar airflow system. Build. Environ. 2017, 126, 42–53. [Google Scholar] [CrossRef]
  11. Balocco, C.; Petrone, G.; Cammarata, G. Numerical Investigation of Different Airflow Schemes in a Real Operating Theatre. J. Biomed. Sci. Eng. 2015, 8, 73–89. [Google Scholar] [CrossRef]
  12. Chow, T.T.; Lin, Z.; Bai, W. The integrated effect of medical lamp position and diffuser discharge velocity on ultra-clean ventilation performance in an operating theatre. Indoor Built Environ. 2006, 15, 315–331. [Google Scholar] [CrossRef]
  13. Romano, F.; Milani, S.; Ricci, R.; Joppolo, C.M. Operating theatre ventilation systems and their performance in contamination control: ‘at rest’ and ‘in operation’ particle and microbial measurements made in an Italian large and multi-year inspection campaign. Int. J. Environ. Res. Public Health 2020, 17, 7275. [Google Scholar] [CrossRef] [PubMed]
  14. Kameel, R.; Khalil, E.E. Air flow regimes in operating theatres for energy efficient performance. In Proceedings of the 41st Aerospace Sciences Meeting and Exhibit, Reno, NV, USA, 6–9 January 2003; pp. 1–11. [Google Scholar] [CrossRef]
  15. Alsved, M.; Civilis, A.; Ekolind, P.; Tammelin, A.; Andersson, A.E.; Jakobsson, J.; Svensson, T.; Ramstorp, M.; Sadrizadeh, S.; Larsson, P.-A.; et al. Temperature-controlled airflow ventilation in operating rooms compared with laminar airflow and turbulent mixed airflow. J. Hosp. Infect. 2018, 98, 181–190. [Google Scholar] [CrossRef] [PubMed]
  16. James, M.; Khan, W.; Nannaparaju, M.; Bhamra, J.; Morgan-Jones, R. Current Evidence for the Use of Laminar Flow in Reducing Infection Rates in Total Joint Arthroplasty. Open Orthop. J. 2015, 9, 495–498. [Google Scholar] [CrossRef] [PubMed]
  17. Memarzadeh, F.; Manning, A.P. Comparison of operating room ventilation systems in the protection of the surgical site. ASHRAE Trans. 2002, 108 Pt 2, 3–15. [Google Scholar]
  18. Stevenson, T.C.; Jeter, S.M. Comparison of CFD simulations of hospital operating room air distribution with experimental PIV results. ASHRAE Trans. 2013, 119, 63–74. [Google Scholar]
  19. Lin, T.; Zargar, O.A.; Lin, K.-Y.; Juiña, O.; Sabusap, D.L.; Hu, S.-C.; Leggett, G. An experimental study of the flow characteristics and velocity fields in an operating room with laminar airflow ventilation. J. Build. Eng. 2020, 29, 101184. [Google Scholar] [CrossRef]
  20. Ouyang, X.; Wang, Q.; Li, X.; Zhang, T.; Rastogi, S. Laminar airflow ventilation systems in orthopaedic operating room do not prevent surgical site infections: A systematic review and meta-analysis. J. Orthop. Surg. Res. 2023, 18, 572. [Google Scholar] [CrossRef] [PubMed]
Figure 1. Ventilation arrangements in an OR (National Health Services Estate, 1994).
Fluids 10 00225 g001
Figure 2. Variation of velocity along the vertical dimension for checking grid independency.
Fluids 10 00225 g002
Figure 3. Schematic of a full-scale operating room. (1) Surgical lights; (2) Surgical staff; (3) Back table; (4) Exhaust grille; (5) Inlet diffuser; (2.8 m × 2.8 m); (6) Anaesthesia machine; (7) Patient.
Fluids 10 00225 g003
Figure 4. Photographs taken during measurement.
Fluids 10 00225 g004
Figure 5. Details of the simulations carried out.
Fluids 10 00225 g005
Figure 6. First configuration—One lamp is placed above the bed and others at the side of the bed.
Fluids 10 00225 g006
Figure 7. Second configuration—both lamps are above the bed.
Fluids 10 00225 g007
Figure 8. Vector plot for case 1.1.
Fluids 10 00225 g008
Figure 9. Vector plot for case 1.2.
Fluids 10 00225 g009
Figure 10. Vector plot for case 2.1.
Fluids 10 00225 g010
Figure 11. Vector plot for case 2.2.
Fluids 10 00225 g011
Figure 12. Comparison of washing velocity at inlet velocity 0.38 m/s.
Fluids 10 00225 g012
Figure 13. Top view of the OR with a lamp of semi-open shape.
Fluids 10 00225 g013
Figure 14. Top view of the OR with lamp of classic closed shape.
Fluids 10 00225 g014
Figure 15. Vector plot of classic closed shape.
Fluids 10 00225 g015
Figure 16. Vector plot of semi-open shape with ventilation gaps.
Fluids 10 00225 g016
Figure 17. Position of the line along which the variation of velocity with height.
Fluids 10 00225 g017
Figure 18. Variation of velocity with respect to height.
Fluids 10 00225 g018
Figure 19. Comparison of the position of surgical lamp.
Fluids 10 00225 g019
Figure 20. Comparison of the effect of the shape of the lamp from the literature. (a) Open; (b) Closed.
Fluids 10 00225 g020
Figure 21. Contour plot of particle distribution.
Fluids 10 00225 g021
Figure 22. Contour plot of particle distribution under the surgical lamp.
Fluids 10 00225 g022
Figure 23. Contaminant concentration distribution.
Fluids 10 00225 g023
Figure 24. Contaminant concentration under the inlet diffuser.
Fluids 10 00225 g024
Table 1. ISO 14644-1: Air cleanliness limits and classes (ISO, 2015).
ISO CLASS0.1 μm0.2 μm0.3 μm0.5 μm1.0 μm5.0 μm
1102----
210024104--
31000237102358-
410,0002370102035283-
5100,00023,70010,200352083229
61,000,000237,000102,00035,2008320293
7---352,00083,2002930
8---3,520,000832,00029,300
9---35,200,0008,320,000293,000
Table 2. Number of nodes and elements used for grid independence checking.
No.SetNodesElements
1A92,776488,978
2B91,138479,564
3C89,395470,395
4D87,291465,236
Table 3. Dimensions of various equipment and occupants and their heat dissipation.
ItemsDimensionsHeat Dissipation
Operating table1.9 × 0.6 × 0.85 mNone
Surgical lights (1)0.5 m in diameter150 W each
Surgical staff (2)0.3 × 0.25 × 1.7 m high100 W each
Anaesthesia machine0.5 × 0.3 × 1.2 m high200 W
Patient0.3 × 0.25 × 1.7 m high46 W
Back table0.5 × 0.3 × 1.1 m highNone
Table 4. Equipment used for measurement.
No.Instrument UsedSpecifications
1Vane anemometer
Testo-400
measuring range +0.3 to +35 m/s,
(−20 to +70 °C)
2Testo-480Accuracy (Temp)±0.2 °C (with high-precision probe)
Accuracy (Humidity)±1.0% RH
CO2 Measurement Range0 to 10,000 ppm
Flow Velocity0 to 100 m/s (with pitot tube/anemometer probe)
3IAQ ProbeTemperature—NTC
Measuring range—0 to +50 °C
Accuracy—±0.5 °C
Resolution—0.1 °C
Humidity—Capacitive
Measuring range
0 to +100% RH
Accuracy
±(1.8% RH + 0.7% of mv)
Resolution
0.1% RH
Absolute Pressure
Measuring range
+700 to +1100 hPa
Accuracy ±3.0 hPa
Resolution
0.1 hPa
Ambient CO2
Measuring range
0 to +10,000 ppm
Accuracy
±(75 ppm + 3% of mv)
±(150 ppm + 5% of mv)
0 to +5000 ppm
5001 to +10,000 ppm
Resolution 1 ppm
4Black globe thermometerThermocouple type K
Measuring range: 0 to +120 °C
5Mini Laser Aerosol Spectrometer (Mini-LAS) 11-RCount range:
1 to 2,000,000 particles/L
Particle mass:
From 0.1 μg/m3 to 100 mg/m3
Size channels: 31 channels
Table 5. Parameters above the lamp under the supply diffuser.
Time StampRuntime (s)hPa AbshPa
Diff
VelocityTemp (°C)RH (%)hPa AbsCO2 (ppm)g/m3
19:55:1101005.7−0.0061.022.980.51005.377016.5
19:55:21101005.7−0.0061.023.080.81005.377416.6
19:55:31201005.7−0.0061.023.080.41005.377816.5
19:55:41301005.7−0.0061.023.080.51005.379216.6
19:55:51401005.7−0.0061.023.080.11005.379816.5
19:56:01501005.7−0.0061.023.080.11005.379116.5
19:56:11601005.7−0.0061.023.080.21005.378116.5
19:56:21701005.7−0.0061.023.180.11005.378316.6
19:56:31801005.8−0.0061.023.180.21005.378616.6
19:56:41901005.8−0.0061.023.180.41005.379216.6
19:56:511001005.8−0.0061.023.180.21005.378516.6
Table 6. Parameters below the surgical lamp.
Time StampRuntime (s)hPa AbshPa
Diff
VelocityTemp (°C)RH (%)hPa AbsCO2 (ppm)g/m3
20:10:23−11006.0−0.0050.923.478.11005.575516.5
20:10:3391006.0−0.0050.923.378.41005.575616.5
20:10:43191006.0−0.0050.923.478.81005.676516.6
20:10:53291006.0−0.0050.923.578.41005.676116.6
20:11:03391006.0−0.0050.923.578.31005.677016.5
20:11:13491006.0−0.0050.923.578.21005.577316.5
20:11:23591006.0−0.0050.923.578.41005.677016.6
20:11:33691006.0−0.0050.923.578.41005.577016.6
20:11:43791006.0−0.0050.923.578.31005.677016.6
20:11:53891006.0−0.0050.923.578.21005.677416.6
20:12:03991006.0−0.0050.923.578.11005.676816.6
Table 7. Particulate count reading at the bed of the OR.
0.25 µm0.28 µm0.30 µm0.35 µm0.40 µm0.45 µm0.50 µm
200100200505000
1002000500500
200015000050
150050000100
1501502001005000
2502000010000
250300300150501000
200010050000
150502502505000
5000100000
Table 8. Particulate count reading near the inlet diffuser.
0.25 µm0.28 µm0.30 µm0.35 µm0.40 µm0.45 µm0.50 µm
700150300100000
1502001000000
200150100150000
2501502502505000
2001502002005000
20015015050000
1501501001500500
20020010000500
350150200200500100
250150200500500
Table 9. Particulate count reading near the outlet diffuser.
0.25 µm0.28 µm0.30 µm0.35 µm0.40 µm0.45 µm0.50 µm
28501550950100035010050
20001650155015001005050
2000185016001150250300100
20501450120010503005050
2750195018001200400150150
205015001450100030050150
1750135095012002001000
2050155020001250150200250
165010501450120035030050
215014009501100500100100
Disclaimer/Publisher’s Note: The statements, opinions and data contained in all publications are solely those of the individual author(s) and contributor(s) and not of MDPI and/or the editor(s). MDPI and/or the editor(s) disclaim responsibility for any injury to people or property resulting from any ideas, methods, instructions or products referred to in the content.