1. Introduction
Increasing turbine inlet temperatures is a fundamental strategy for improving the thermal efficiency of gas turbines and aero engines. In modern H/J-class turbines, the inlet temperature has exceeded 1650 °C, which is well beyond the thermal limits of conventional blade materials. This necessitates the application of advanced cooling technologies, among which film cooling is one of the most widely adopted approaches due to its practicality and efficiency. The performance of film cooling is known to depend on several key parameters, such as the blowing ratio, hole geometry, and mainstream turbulence intensity [
1]. Beyond these design-related factors, recent research has emphasized the importance of mainstream flow characteristics, including pressure gradients and blade curvature [
2].
In practical gas turbine applications, the flow field around turbine blades is inherently non-uniform due to blade curvature and passage geometry. As the working fluid accelerates along the suction surface of the blade, a favorable pressure gradient (FPG) typically develops, while an adverse pressure gradient (APG) may form near the pressure side or further downstream. These streamwise pressure gradients will influence the interaction between the coolant jet and the mainstream and have a profound impact on film cooling performances [
3]. The effect of streamwise pressure gradients (SPGs) is typically quantified using the acceleration parameter
K:
where
U represents the freestream velocity along the streamwise direction, and
is the kinematic viscosity. A positive value denotes a favorable pressure gradient, and a negative value indicates an adverse pressure gradient. In typical turbine blade environments,
K ranges from
to
[
4]. Experimental and numerical investigations [
5,
6] have shown that APG enhances the boundary layer thickness and promotes turbulent mixing between the jet and the mainstream, often resulting in reduced cooling effectiveness near the hole, though some improvements may appear downstream. Overall, the impact of the APG is typically neutral or detrimental, and its mechanisms have been reasonably well characterized.
In contrast, the influence of favorable pressure gradients (FPGs) on film cooling remains less well understood and continues to be a subject of debate. Some experimental and numerical studies suggest that FPGs can suppress freestream turbulence, reduce the intensity of jet–mainstream interaction, and draw the counter-rotating vortex pair (CRVP) closer to the wall [
4,
7,
8]. These effects are often associated with improved coolant attachment and reduced jet lift-off, particularly at moderate blowing ratios. In addition, FPG has been observed to alter the velocity profile near the wall and suppress turbulence production in the shear layer, both of which can favorably influence cooling behavior near the hole exit. Schmidt et al. [
9] further showed that the FPG enhances film effectiveness at low blowing ratios (
), but this benefit diminishes once the jet fully detaches at higher momentum ratios. Zhang et al. [
10] examined film cooling on the suction surface of turbine blades and reported that favorable pressure gradients promote improved coolant coverage compared to adverse and transitional pressure zones.
However, other investigations have reported contradictory findings. Several studies indicate that the FPG may limit the lateral spread of the coolant film or promote jet dilution into the mainstream [
11,
12], thereby weakening surface coverage and reducing overall cooling effectiveness. Yan et al. [
13] showed that FPG enhances the kidney vortex and improves coolant attachment near the wall, but the overall benefit is constrained by the coolant viscosity and surface curvature. In some cases, the FPG was found to benefit cooling only in the immediate vicinity of the hole, with diminishing influence farther downstream. These discrepancies may be attributed to differences in hole geometry, injection angle, flow acceleration rate, and especially the blowing ratio. For instance, the interaction between the FPG and jet momentum can lead to markedly different flow structures under low versus high blowing ratios, influencing both the stability of the shear layer and the evolution of vortical structures.
Existing studies on SPG often rely on experiments or Reynolds-Averaged Navier–Stokes (RANS) simulations. Although experiments provide valuable validation data, they are typically limited in spatial and temporal resolutions. RANS simulations, while computationally efficient, struggle to accurately capture vortex structures and turbulent mixing. In contrast, Large Eddy Simulation (LES) has proven capable of resolving unsteady features such as shear layer roll-up and vortex breakdown with much greater fidelity. Recent applications of LES in turbine film cooling—such as the simulation of double-swirling holes at the blade leading edge [
14] and crossflow-cooled diffusion slot holes [
15]—demonstrate its capability to reveal the formation of complex vortical structures and flow asymmetries under varying blowing ratios. Prior comparisons between LES, RANS, and DNS have shown that LES offers a good balance between accuracy and computational cost and is more reliable for predicting key flow characteristics such as turbulence intensity and jet penetration [
16,
17].
Overall, the current literature offers no consistent conclusion regarding the net effect of FPG on film cooling. The complex interplay between local flow acceleration, turbulence suppression, and vortex dynamics under FPG conditions necessitates a more detailed investigation based on high-fidelity simulations capable of resolving unsteady flow phenomena.
In this study, Large Eddy Simulation (LES) is employed to investigate the effect of streamwise pressure gradients on film cooling performance over a shaped cooling hole with a density ratio of . Two blowing ratios, and , are considered under both zero pressure gradient (ZPG) and favorable pressure gradient (FPG) conditions. LES predictions for the high blowing ratio case are validated against experimental data to ensure the credibility of the numerical method. The analysis focuses on both time-averaged and instantaneous flow fields to characterize key flow phenomena. Time-averaged results are used to evaluate coolant attachment, boundary layer development, and vortex organization. Instantaneous flow features are further examined using the Q criterion to identify coherent vortex structures, the gradient Richardson number to assess the onset of Kelvin–Helmholtz instability, and the density gradient to visualize hairpin vortex evolution. In addition, spectral analysis based on Fast Fourier Transform (FFT) is performed on pressure signals to investigate the dominant frequencies associated with unsteady flow dynamics.
The remainder of this paper is organized as follows.
Section 2 describes the numerical setup and validation of LES results.
Section 3 and
Section 4 present detailed analyses of instantaneous and time-averaged flow features, respectively. Finally,
Section 5 summarizes the main findings.
2. Numerical Methodology
In turbine blade cooling passages, flow characteristics are influenced not only by the streamwise pressure gradient (SPG) but also by geometrical effects such as surface curvature and secondary flows. These factors often obscure the isolated role of SPG. To address this issue, simplified channel geometries are commonly used to decouple the influence of pressure gradients.
In the present work, the mainstream flow domain is shaped as a converging nozzle, illustrated in
Figure 1a, enabling a favorable pressure gradient (FPG) to develop naturally, while avoiding disturbances from curvature or lateral flow structures. The domain consists of a rectangular plenum, the converging duct, and a film cooling hole. The upper surface of the nozzle is treated as inviscid, and periodicity is applied in the lateral direction. A widely used 7-7-7 shaped film hole [
18] is employed in all configurations, as this geometry has demonstrated favorable cooling effectiveness and is commonly adopted in studies involving streamwise pressure gradients [
10].
High-resolution meshing is applied near the cooling hole to adequately capture the turbulent structures relevant to film behavior. The area-averaged film cooling effectiveness
within X/D ∈ [0, 50] is selected as the representative quantity for mesh independence test with four grid densities (5.013 M, 7.334 M, 9.275 M, and 12.476 M). The results obtained from the 9.275 M and 12.476 M grids meet the accuracy requirements for the present LES, as shown in the
Figure 1b. Considering computational efficiency, the final grid comprises
elements. In the wall-normal direction, the first layer of cells satisfies
. The streamwise and spanwise grid spacings satisfy
and
, respectively.
The boundary conditions for all simulations are listed in
Table 1, two distinct blowing ratios are selected,
and
, with the density ratio kept the same at DR = 1.5. A zero pressure gradient (ZPG) case was also simulated for each
M value as reference. The characteristic Reynolds number based on the film cooling hole diameter, i.e.,
, where
and
are the coolant bulk velocity and kinematic viscosity at the hole outlet, respectively. The values of
under the two blowing ratios were both significantly higher than the typical transition threshold, confirming a fully turbulent jet flow.
The pressure gradient along the streamwise direction (
x) is estimated using the quasi-one-dimensional compressible Euler formulation:
where
is the mass flux,
u is the local velocity, and
A denotes the flow area. The nozzle profile is carefully designed to achieve an acceleration parameter of approximately
over the region
, which corresponds to actual gas turbine blade conditions [
19], as shown in
Figure 2.
The simulations solve the compressible Navier–Stokes equations using ANSYS Fluent 2024. Convective terms are discretized using a bounded central-differencing scheme, and temporal advancement uses a second-order implicit method. Subgrid-scale stresses were modeled using the WALE approach. The physical time step was set to
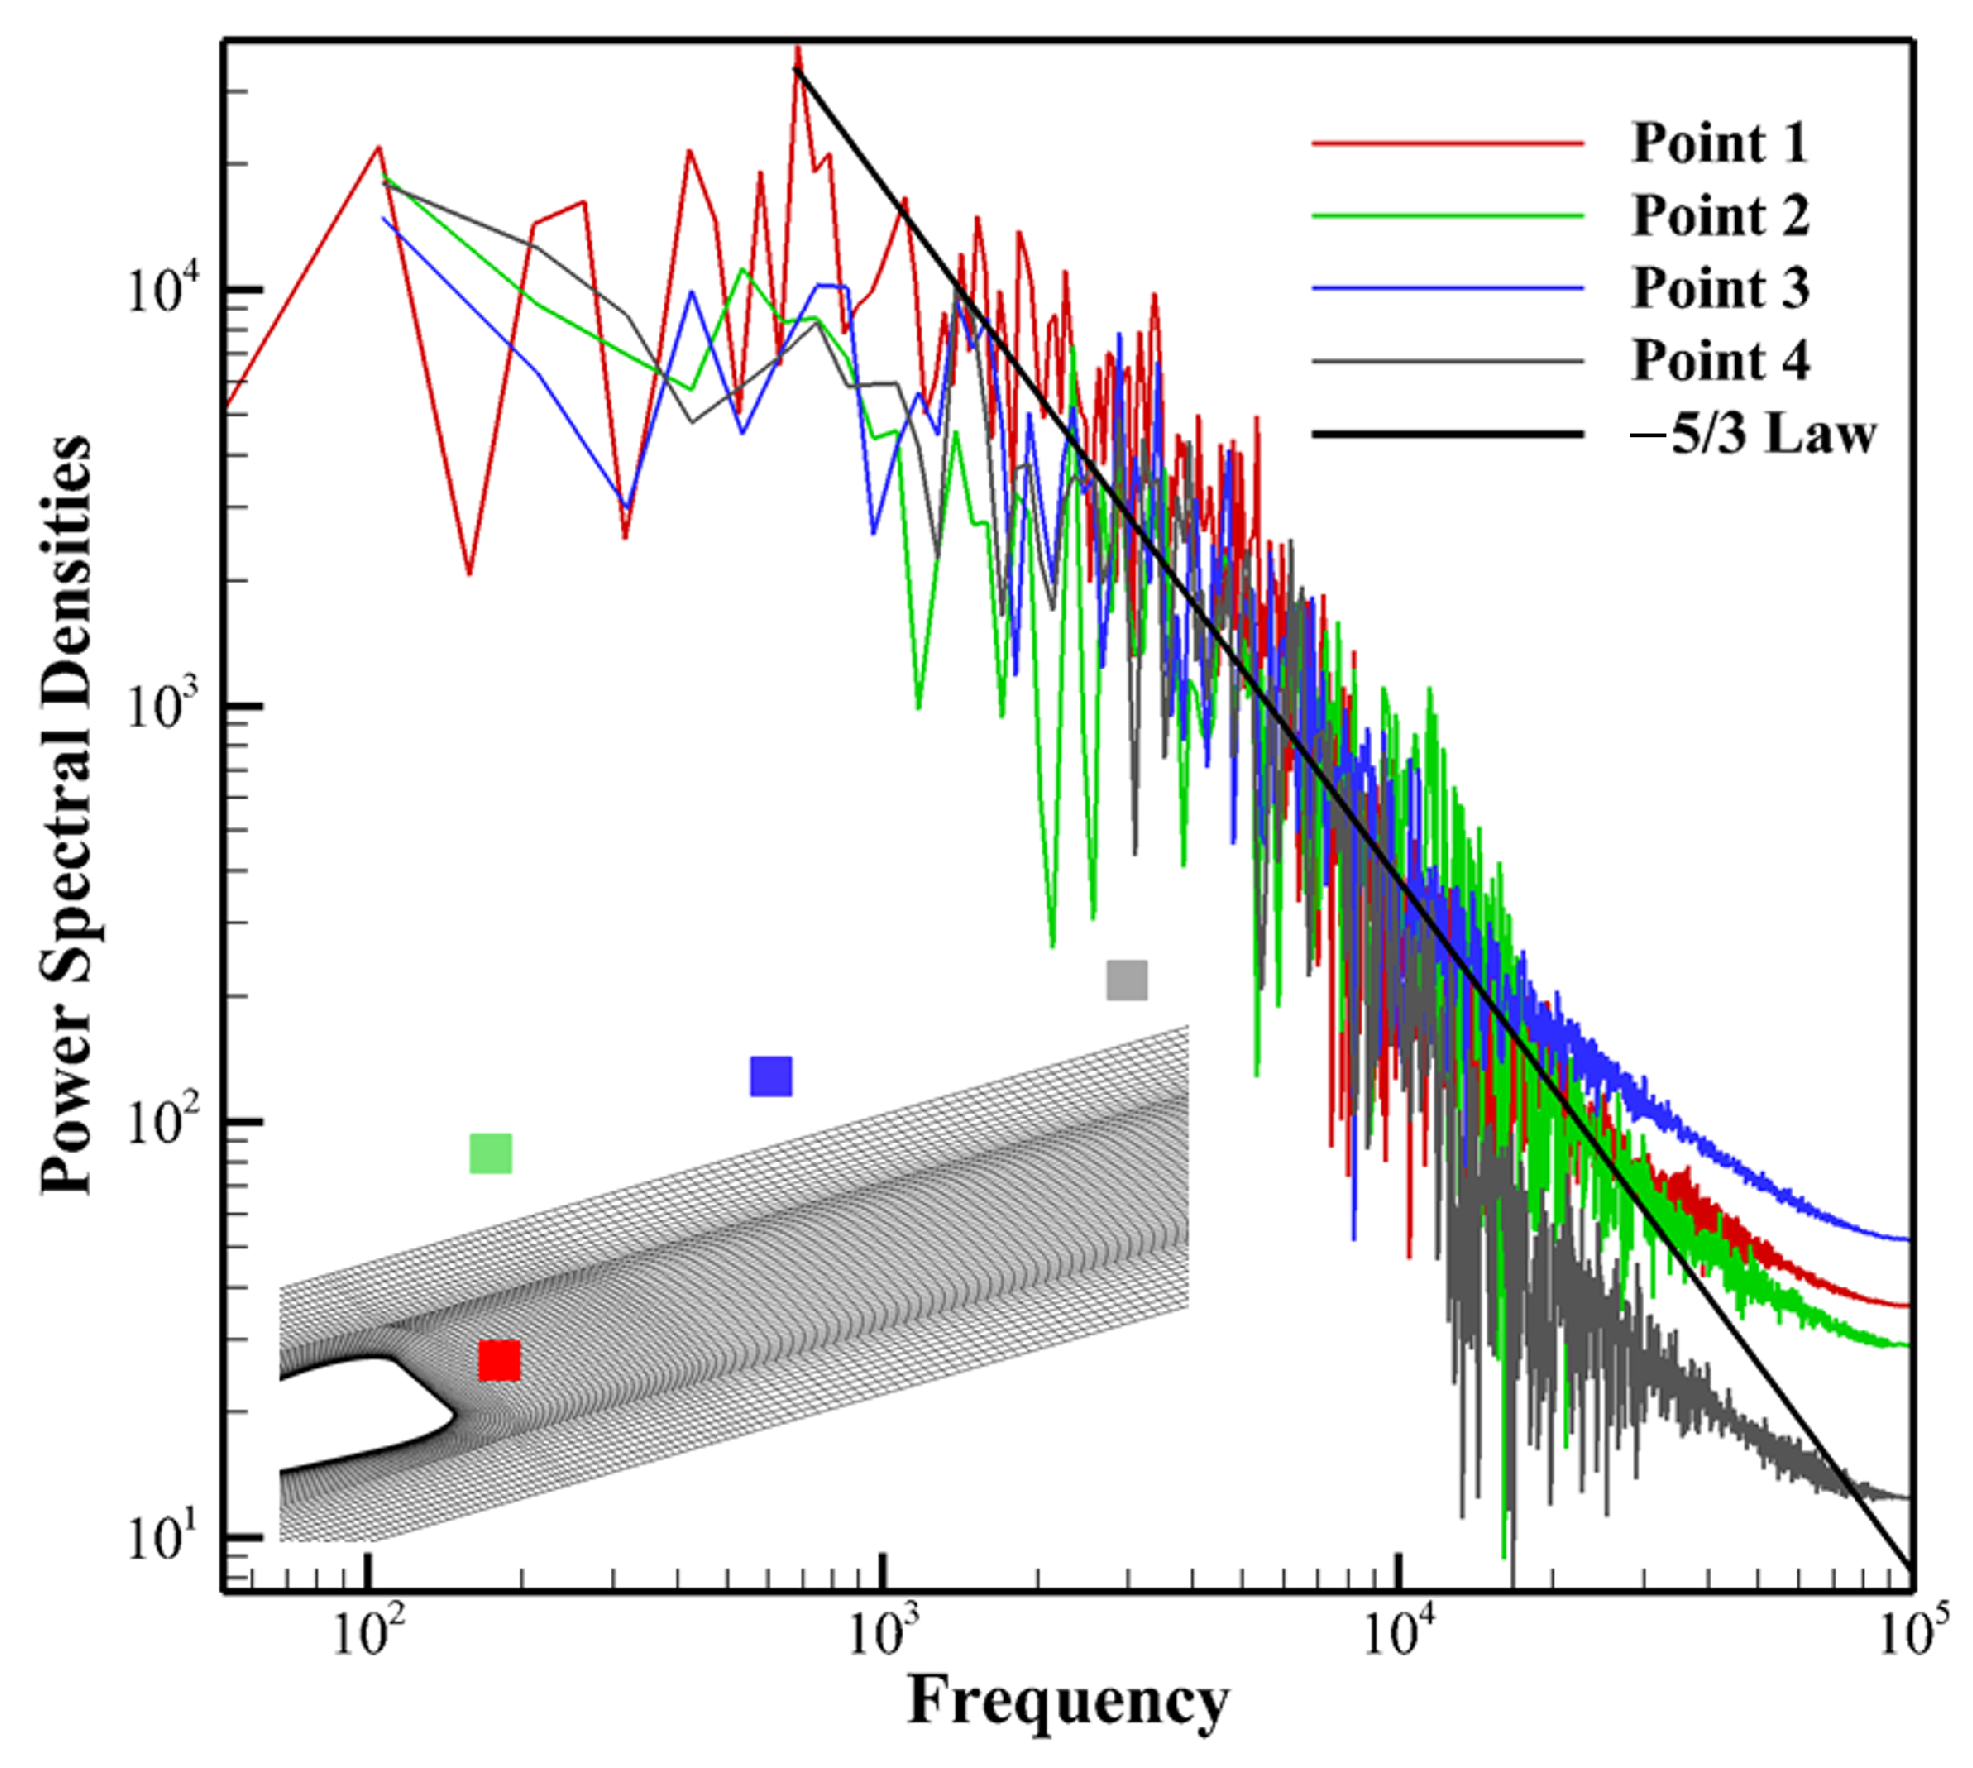
s to ensure a CFL number below 1. Following statistical convergence, 170 flow-through times were averaged to extract steady-state statistics. As illustrated in
Figure 3, the power spectra follow the
law, providing evidence that the unsteady structures have been properly resolved.
3. Experimental Validation
An experimental campaign was carried out at
for the same configurations to obtain the cooling effectiveness. The same geometric model of FPG simulation was used. In the experiment, the blowing ratio and density ratio were also the same as experimental parameters to ensure consistency. To measure the distribution of cooling effectiveness on the flat plate, Pressure Sensitive Paint (PSP) [
20] was utilized. The calibration curves of PSP system are shown in
Figure 4. Based on a 95% confidence interval, the measurement uncertainty of film cooling effectiveness was estimated to be 3% at a typical value of 0.5. Additional details on the uncertainty analysis can be found in the work of Li et al. [
20].
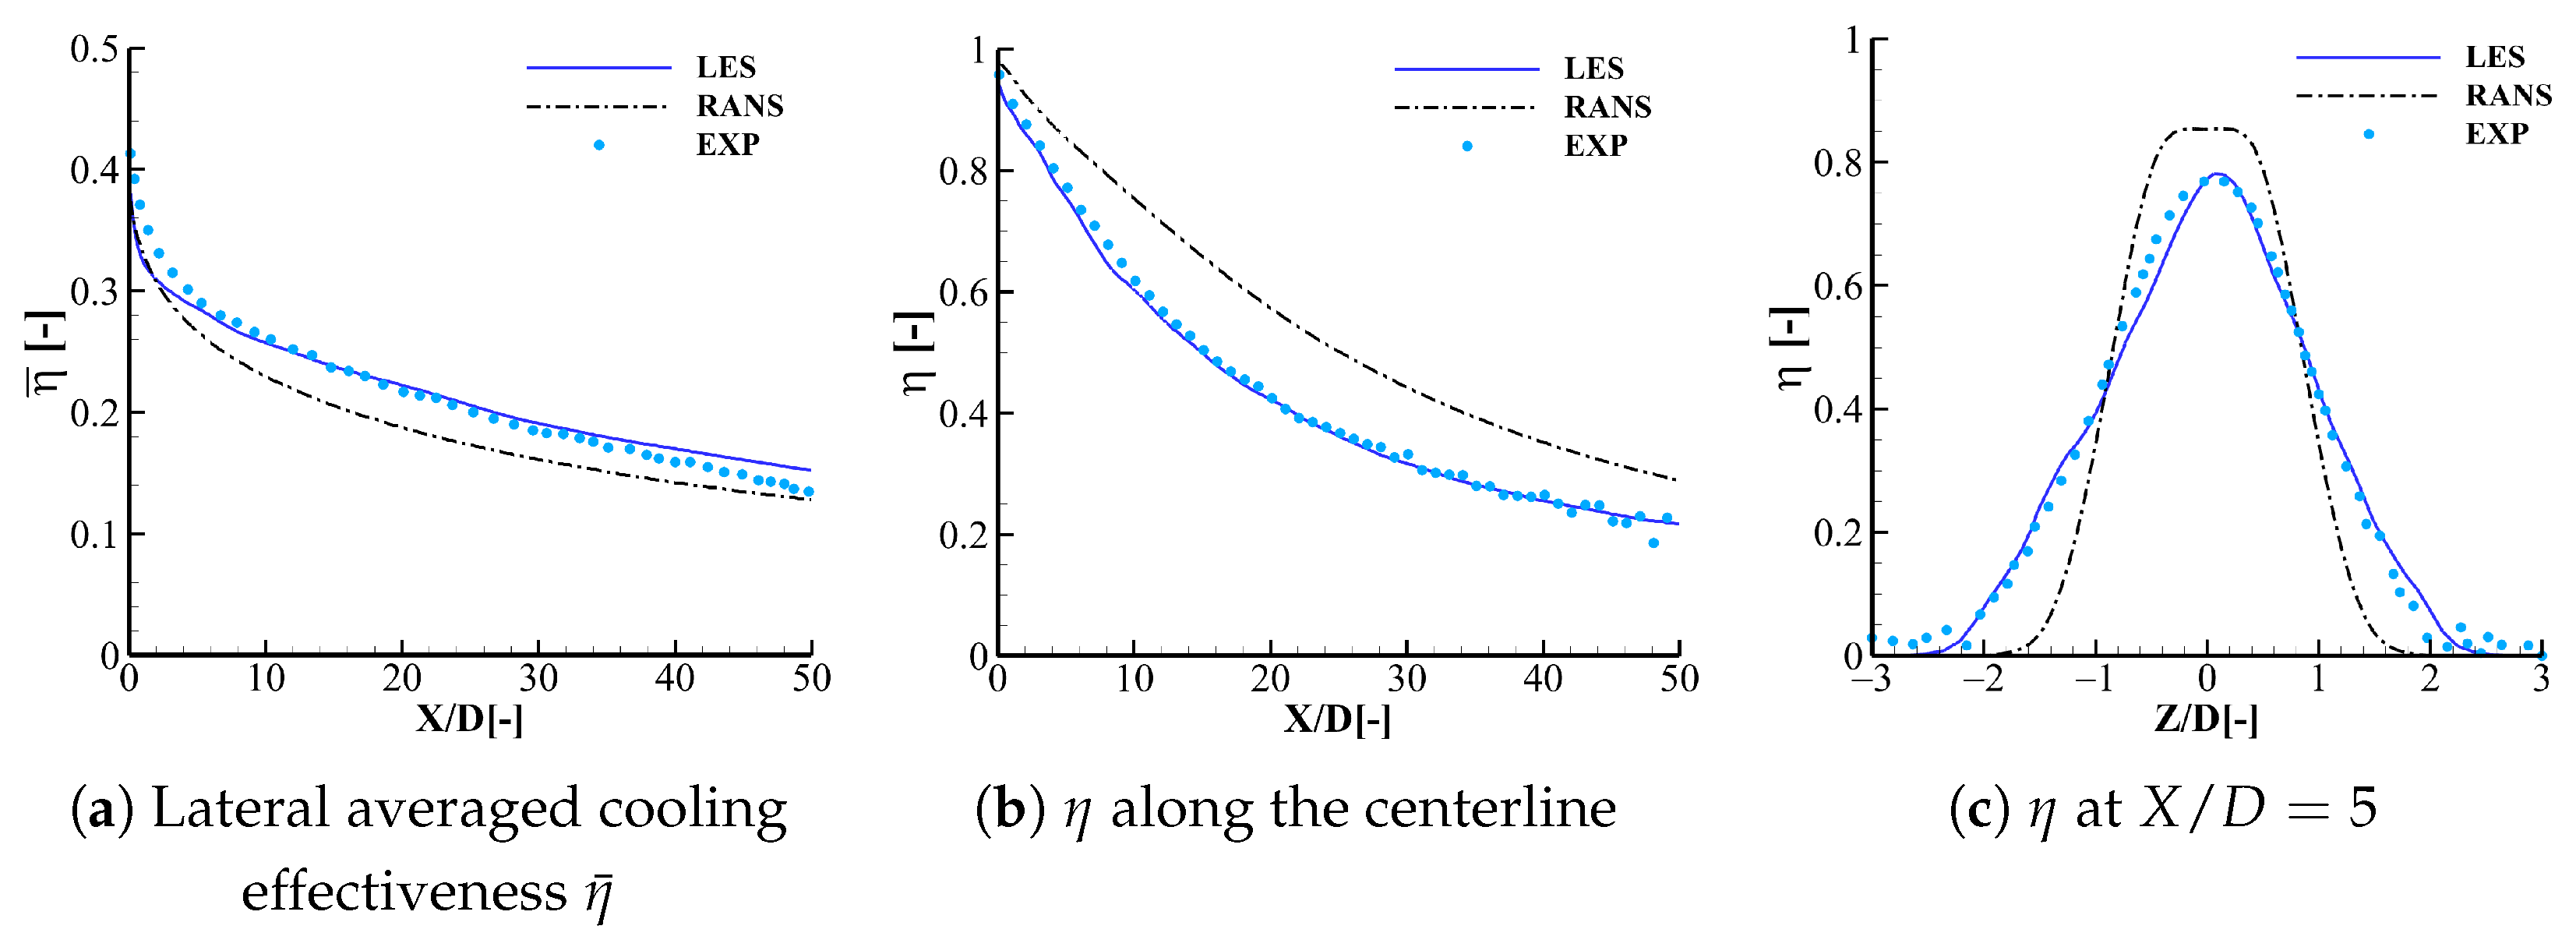
A comparison of the time-averaged LES results with experimental data is presented in
Figure 5. The effectiveness of film cooling is defined as
, where
is the main flow inlet temperature,
represents the coolant inlet temperature, and
denotes the adiabatic wall temperature. The simulation has also been conducted with the Realizable
RANS model and compared with both LES and experiment. The distribution of laterally averaged cooling effectiveness is presented in
Figure 5a. It is evident that LES provides a better match with experimental data compared to RANS at most streamwise stations. The centerline distributions of
are compared in
Figure 5b. LES agrees well with the experiment, while RANS over predicts the value on the centerline. The lateral distributions of
on the
slice are compared in
Figure 5c. The LES shows almost consistent results with experimental results, where the spread distribution of effectiveness at
is closer to the experimental data. In comparison, the effectiveness spread predicted by RANS is much narrower.
This result suggests that LES offers superior predictive capability for the cross-flow jet behavior, whereas the RANS method underestimates the lateral spread of the coolant, causing notable discrepancies in the predicted effectiveness distribution along both the centerline and laterally. The comparison with experimental data indicates that LES is superior to RANS in terms of accuracy when predicting the flow field. The LES results presented in this paper offer more dependable numerical forecasts for the study.
4. Comparison of the Time-Averaged Results
Figure 6a illustrates the distribution of film cooling effectiveness
along the streamwise direction for both blowing ratios under FPG and ZPG conditions. The laterally averaged cooling effectiveness is also provided in
Figure 6b. For the lower blowing ratio case (
), the cooling effectiveness in the ZPG configuration consistently exceeded that of the FPG case up to approximately
. The effectiveness curves for FPG and ZPG edged down when
, implying that the coolant has largely mixed into the mainstream and the influence of the pressure gradient becomes negligible in the far field.
In contrast, for the higher blowing ratio at , the film cooling performance near the trailing edge of the injection hole within was nearly identical between the FPG and ZPG configurations. Further downstream beyond , the FPG case demonstrated a marginally higher cooling effectiveness than the ZPG counterpart. This improvement is attributed to enhanced wall adherence and reduced jet lift-off under favorable pressure gradients, which promote coolant spreading along the wall. The different cooling effect of FPG results from the competition between enhanced wall attachment and increased dissipation of the coolant, which will be further investigated in the following vortex and flow field analysis.
Figure 7 illustrates the distribution of turbulence kinetic energy (TKE) on the mid-span plane for both blowing ratios under FPG and ZPG conditions. At
, the FPG case exhibited noticeably higher TKE than the ZPG case in the downstream region. The larger velocity fluctuations suggest that stronger turbulent mixing takes place under FPG. For
, though a turbulent boundary layer developed at the upstream of hole exit on the FPG, while the ZPG maintained a laminar flow upstream of the hole exit. However, the turbulent kinetic energy (TKE) in the upstream boundary layer had minimal impact on the jet exit. High levels of TKE indicate regions of intense, unstable turbulence, and mixing between the coolant and the main flow. Under the two blowing ratios, the coolant jets under the FPG both remained closer to the wall compared to the ZPG. This compressed trajectory facilitates greater surface coverage and thermal protection in high-
M cases. However, at low
M, the increased turbulence acts to rapidly disperse the coolant, overcoming the benefits of wall attachment.
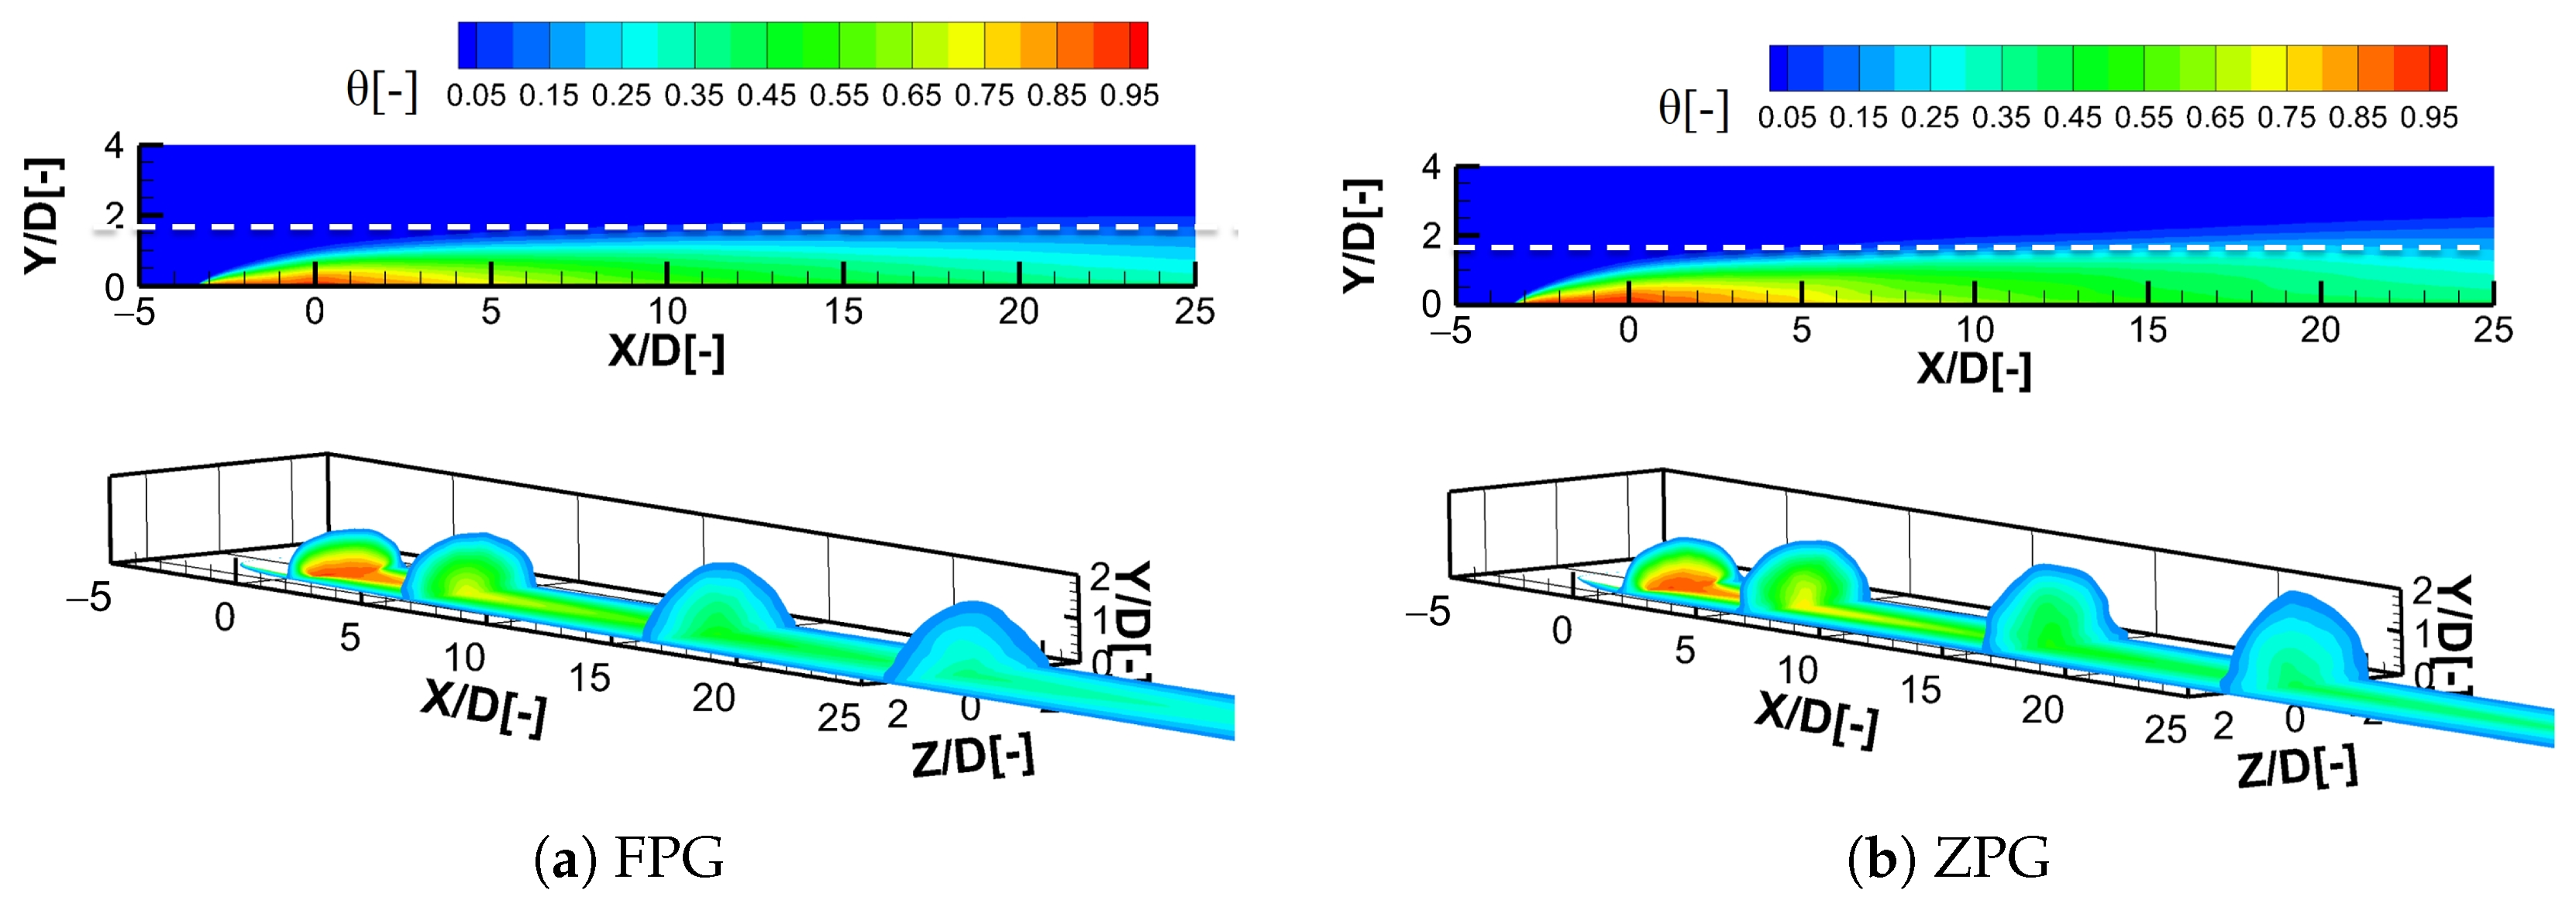
The contours of dimensionless temperature
on the mid-plane and downstream slices are shown in
Figure 8, including the
,
,
, and
planes.
As the variation in jet height was more pronounced under the higher blowing ratio, only the case is shown here. It is evident that the jet approached the wall due to the acceleration of the main flow. This is more distinctly illustrated in the figures plotted along the transverse cross-sections. This observation suggests that, in the case of the FPG, a substantial temperature decrease occurred at the upper section of the jet near the injection point, particularly in the area where the jet comes into direct interaction with the mainstream. This sharp temperature drop corresponds to the interface formed between the high-density, low-velocity coolant jet and the mainstream near the coolant exit. Under the FPG, the jet was compressed toward the wall, making this thermal boundary more distinct. Understanding this phenomenon required an analysis of the unsteady structures in the time-averaged flow field.
The dimensionless time-averaged streamwise velocity
U distributions on the mid-plane are shown in
Figure 9. It was found that the two separation zones in the shaped hole were not the same under different mainstream flow conditions. The first separation zone on the round hole had little difference, while the second separation zone on the FPG was much larger than that on the ZPG. This phenomenon indicates that the mainstream flow field can affect the flow state in the shaped hole. When the mainstream accelerates, it provides a stronger inhibitory effect on the coolant flow, causing an increase in the separation zone on the expansion part of shaped hole. Based on the time-averaged streamlines shown in
Figure 9, it can be observed that the coolant jet is directed toward the wall in the FPG scenario.
Furthermore, the acceleration of the main flow led to a reduced boundary layer thickness, as depicted in
Figure 10. The dimensionless streamwise velocity distribution lines in the vertical direction demonstrate the boundary layer’s thickness. At any given distance from the wall, a thinner boundary layer contains more momentum, thus enabling it to transfer greater amounts of mass and momentum from the jet. And this enhances cooling effectiveness, which helps explain the higher spanwise averaged effectiveness observed under FPG conditions.
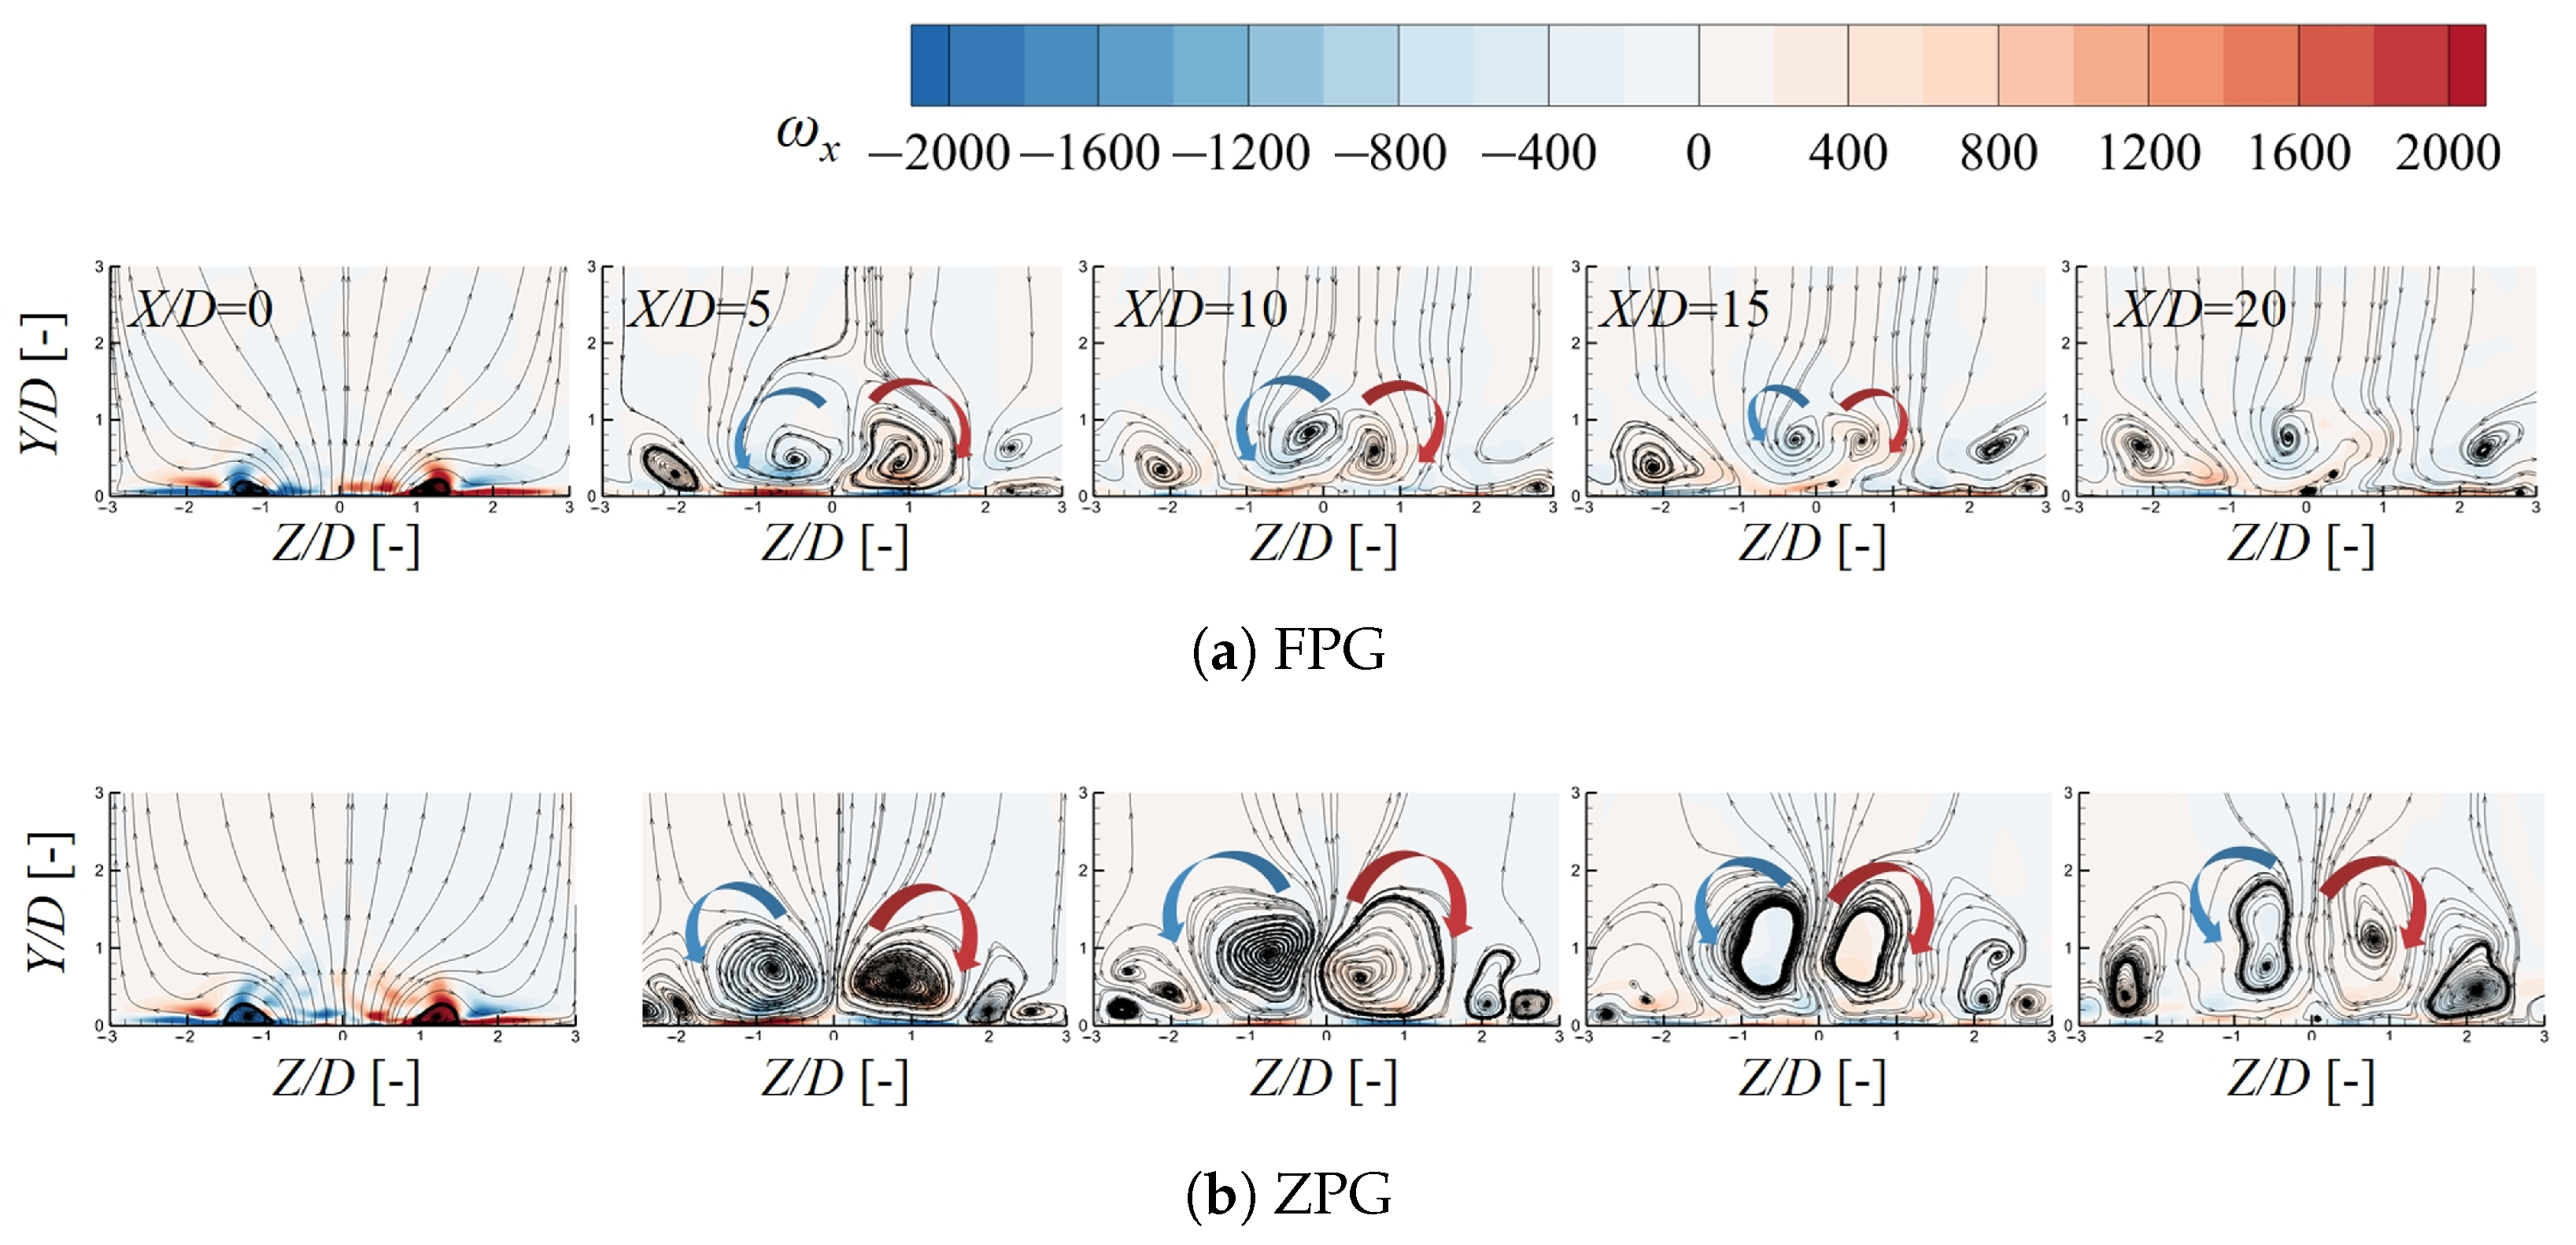
The counter-rotating vortex pair (CRVP) is a critical element in film cooling flows, significantly contributing to the mixing of the coolant with the main flow, thereby impairing cooling efficiency. These vortical structures rotate in such a way that the hot mainstream gas is drawn beneath the cool jet, leading to a decrease in cooling effectiveness. As the CRVP begins to grow in the second separation zone, the streamwise pressure gradient not only affects the generation of CRVP but also influences their development along the flow direction after they leave hole exit.
Figure 11 illustrates the time-averaged vortices along the flow direction (
) and the streamlines of these vortices at
. The red and blue arrows denote the two opposite rotating directions of the CRVP, illustrating the process in which the coolant is entrained upward and mixed with the hot mainstream flow. A comparison between the two cases demonstrates how the FPG compresses the vortices, pushing them closer to the wall. Due to their interaction with the wall, the jet is both compressed and stretched in the spanwise direction.
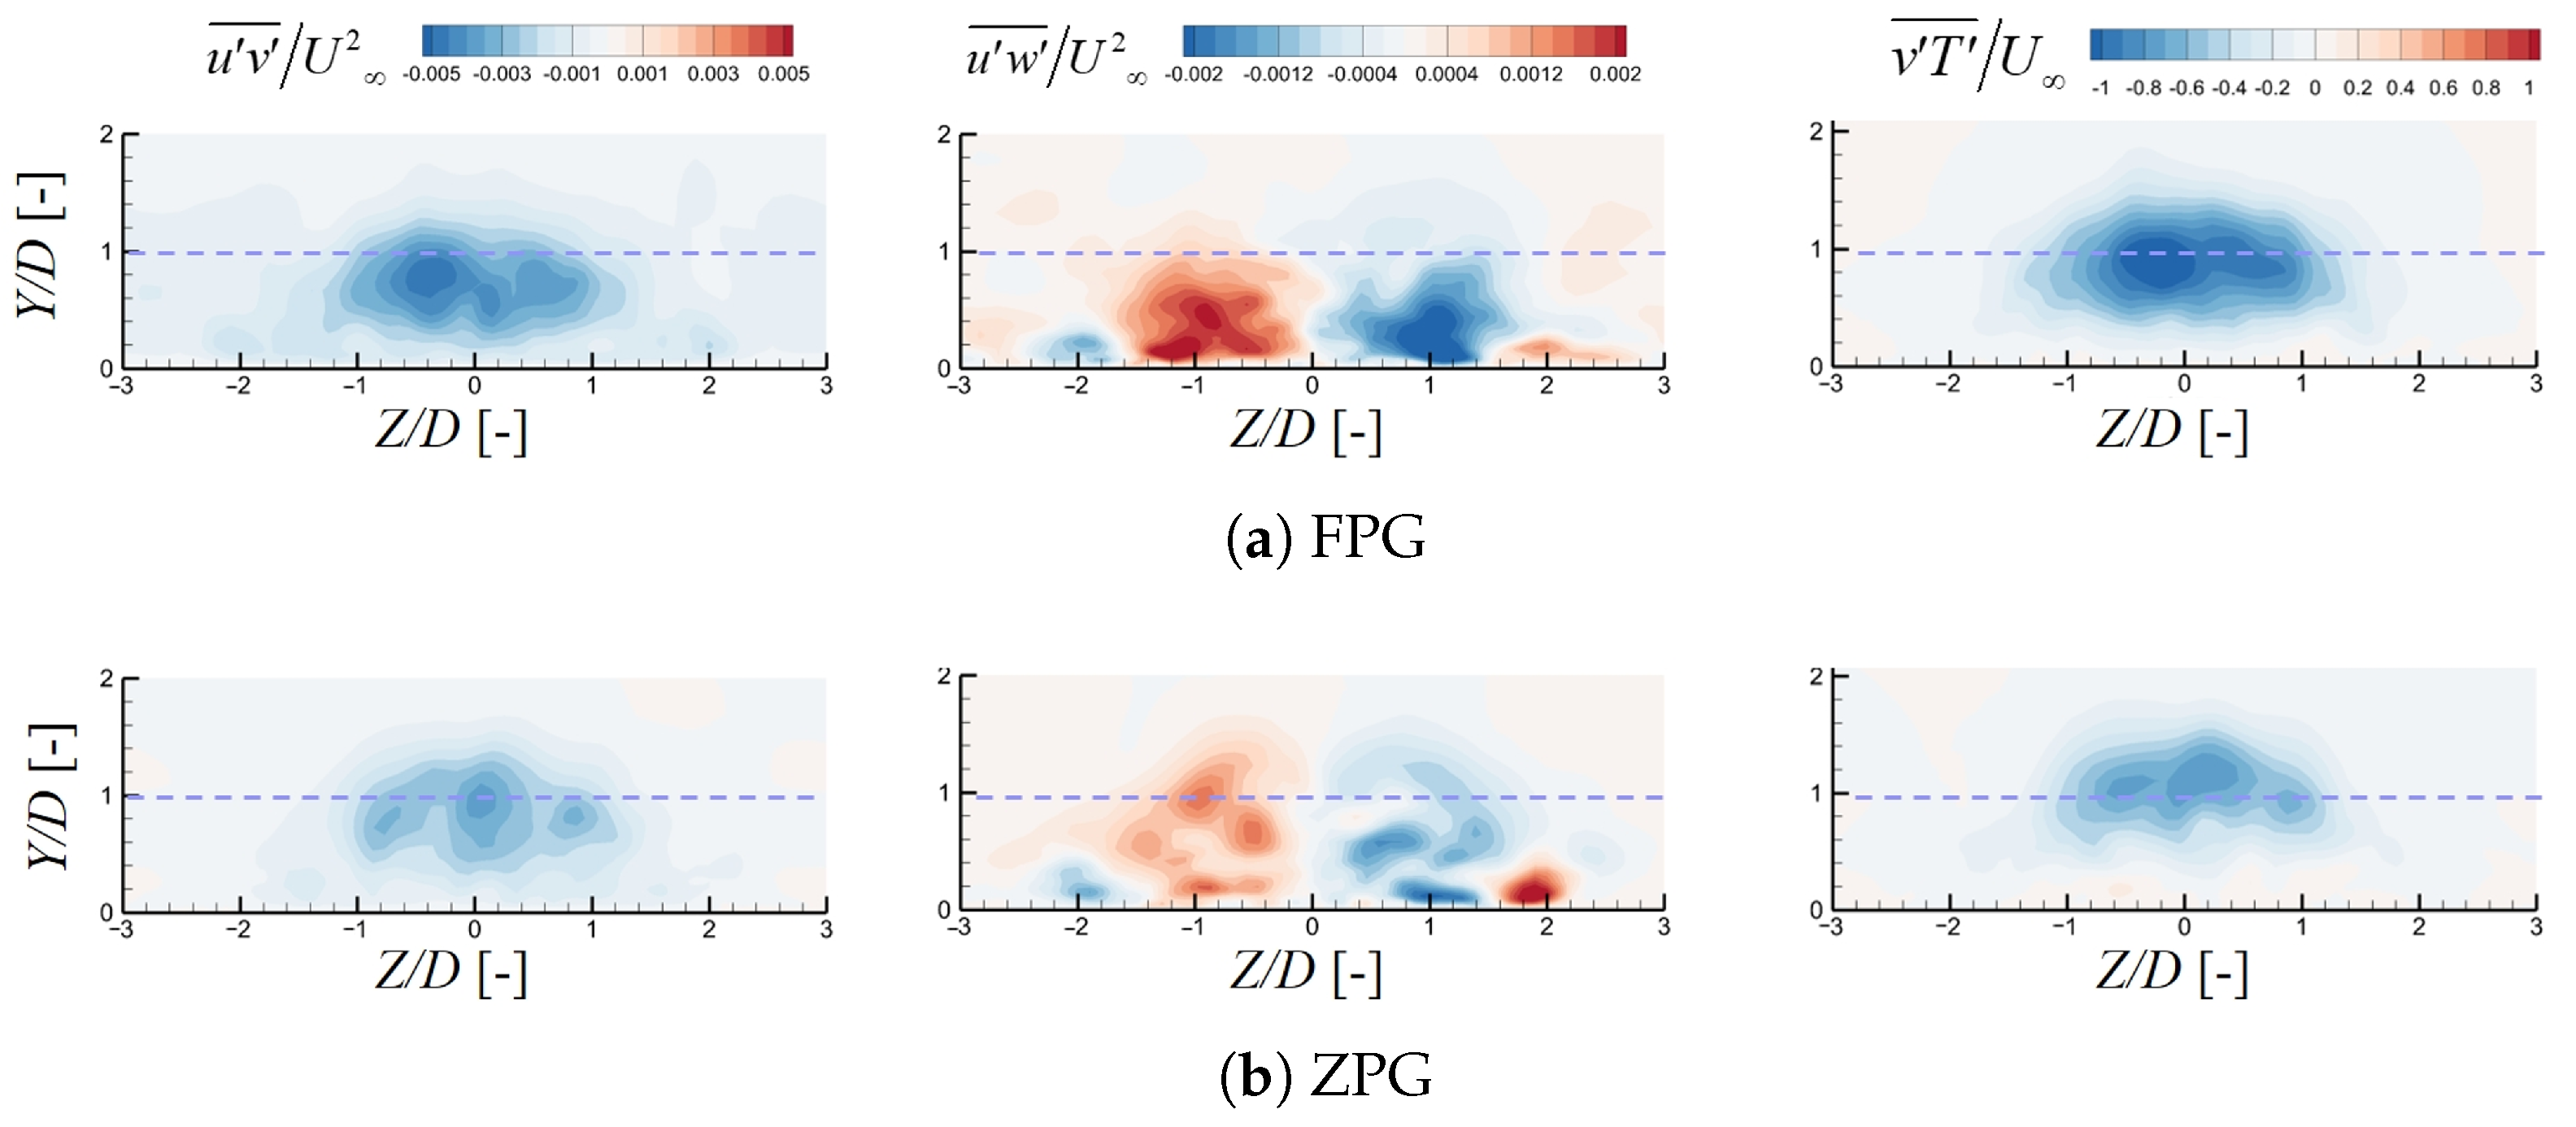
In addition to examining the influence of the time-averaged flow field and its structures on the interaction between the mainstream and the coolant jet, it is also important to consider Reynolds stresses and heat fluxes.
Figure 12 presents the Reynolds stress and turbulent scalar fluxes on the
plane at
. The variation in vortex structure can also be observed through the contours of Reynolds stresses and turbulent scalar fluxes. The FPG pushes the high Reynolds stresses region and high heat flux region closer to the wall, this reduced jet height strengthens wall attachment, contributing to near-wall cooling. In addition, the FPG also intensifies Reynolds stresses and heat fluxes, indicating stronger turbulence activity. This enhanced mixing in the shear region may accelerate coolant dissipation and reduce downstream cooling performance.
To provide a more intuitive analysis of the changes in heat flux,
Figure 13 presents the iso-surface of the heat flux in the normal-wall direction (Z direction) at
. It is evident that the heat flux iso-surface extends further along the flow direction in the FPG case, suggesting that the FPG enhances heat transfer in the jet region. However, the high heat transfer area is also displaced toward the wall in the Z direction. These phenomena are similar to the research conclusions of Coletti [
4] on counter-rotating vortex pairs, suggesting that the enhanced mixing and jet deflection caused by the FPG can affect the mixing process in multiple ways. Factors such as the blowing ratio and acceleration coefficient can vary the intensity of these two effects, which is why previous researchers have arrived at different conclusions regarding the influence of FPG on cooling.
5. Effect of FPG on the Vortical Structures
Due to the inability of time-averaged flow fields to capture small-scale vortex structures, analyzing the instantaneous flow field becomes necessary. The interaction between flow and temperature is further clarified by examining the instantaneous flow field.
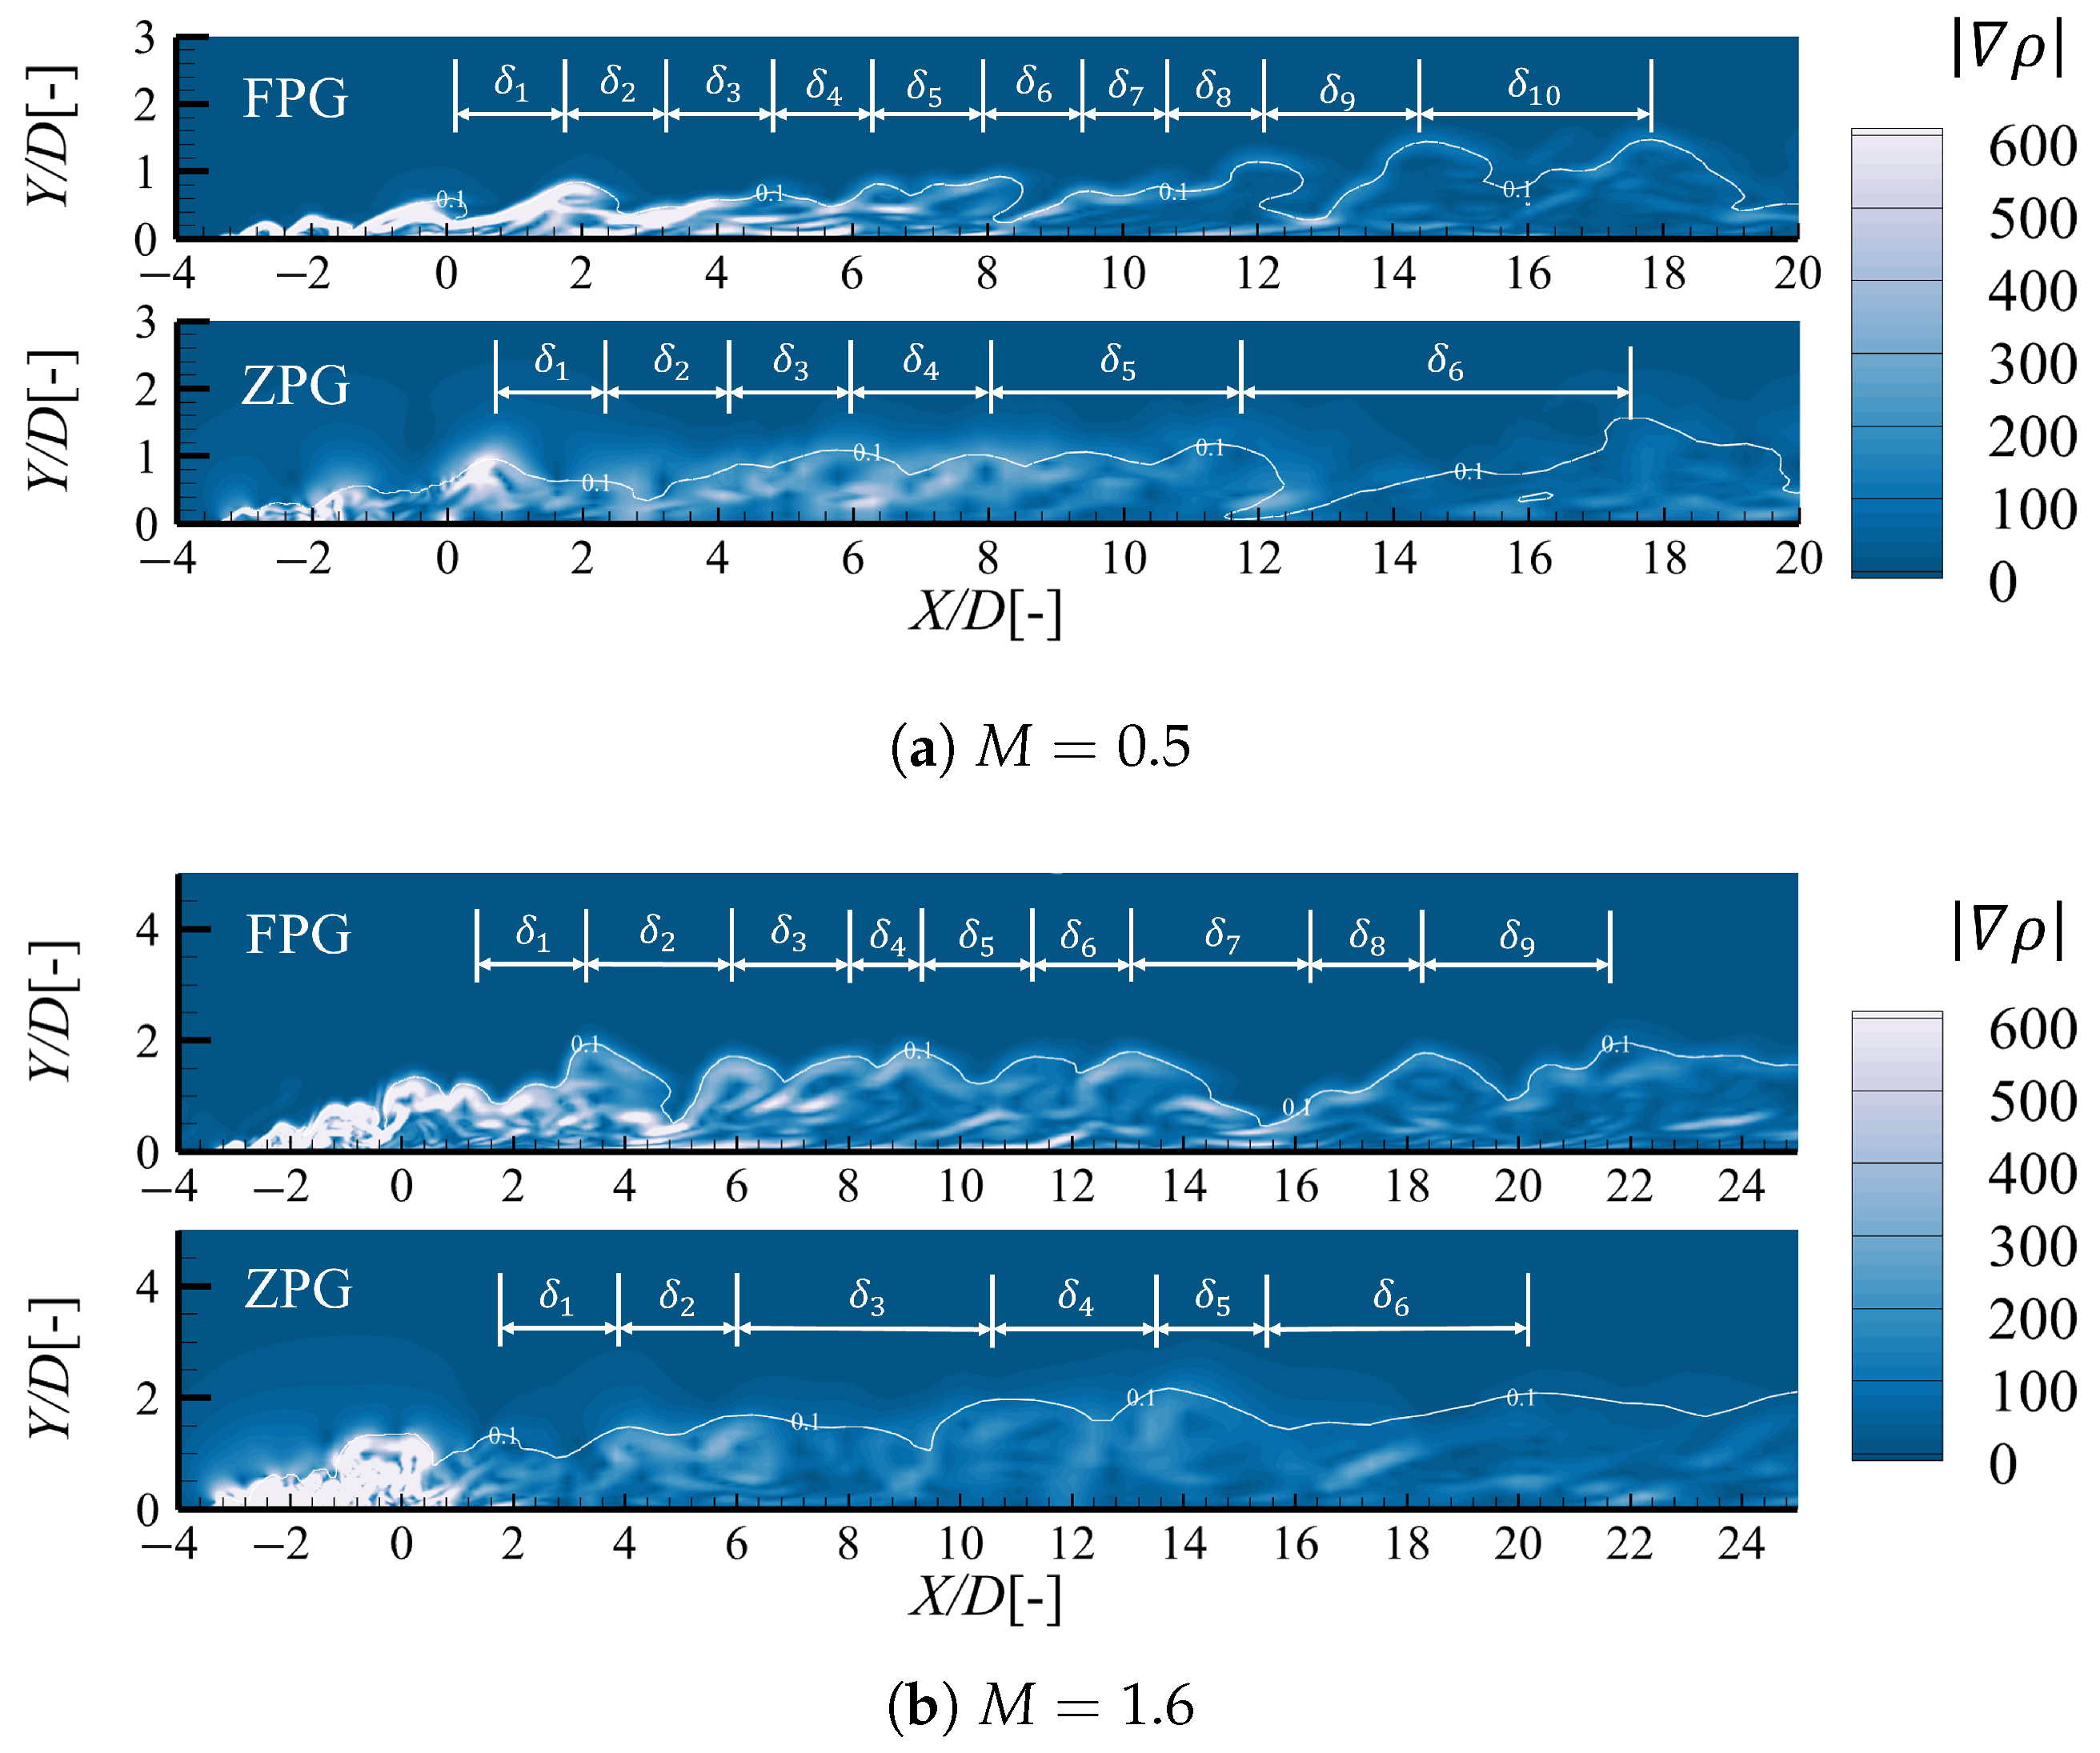
To visualize the expansion waves and unsteady vortices within the flow field, the density gradient is commonly employed [
21].
Figure 14 presents the contour of the density gradient on the mid-span plane from the instantaneous data at the two blowing ratios. The head of the hairpin vortex forms at the interface between the high-density coolant and the lower-density mainstream, coinciding with strong shear and momentum exchange, which are also regions of high-density gradient magnitude. The locations of the hairpin vortex heads are marked.
Since the coolant jet at has lower momentum and dissipates more rapidly, the analysis is limited to the region upstream of . It is evident that the hairpin vortices maintain well-defined sizes and shapes. These vortices expand in the vertical direction, and the distance between the heads of the two vortices grows. Furthermore, it is noticeable that the hairpin vortices in the FPG case exhibit more dynamic behavior than those in the ZPG case, and the number of hairpin vortices substantially increases downstream. However, the rate of increase appears more pronounced at a lower blowing ratio. Given the crucial role of hairpin vortices in the mixing of coolant and main flow, the heightened activity of these vortices seems to negatively affect cooling performance, which corresponds with the observed drop in cooling effectiveness under FPG at .
Figure 15 depicts the vortex structures identified using the Q criterion, with the color scheme representing dimensionless temperature. A horseshoe vortex is seen to form at the upstream edge of the hole exit, which will influence the near-wall flow development.The jet’s interaction with the main flow induces a local adverse pressure gradient at the hole’s upstream edge, resulting in the separation of the main flow boundary layer and the formation of the horseshoe vortex. In the case of the FPG at
, intensified vortex activity was also observed upstream of the hole, indicating the development of a turbulent boundary layer with strong streamwise structures.
Additionally, shear layer vortices appeared at the top of the hole exit, indicated within the red rectangles. Then, the forests of the hairpin vortices grew along the flow direction. It can be seen clearly that the FPG cases under and both have more vortex structure at these two moments, especially the hairpin vortex at the downstream position of the hole. For the lower blowing ratio (), the hairpin vortices not only extended downstream but also exhibited noticeable lateral spreading across the spanwise direction. This accelerated vortex breakdown and energy dissipation. In the far field, the spatial concentration of vortex structures, like the hairpin vortex and fragmented streamwise vortices, demonstrated a marked increase under compared to the ZPG baseline. Such complex and intensified vortex interactions contribute to enhanced mixing but may also weaken the coolant’s ability to stay attached to the wall surface.
The vortex in the shear layer, which dominates the flow near the jet’s exit, arises from the Kelvin–Helmholtz (K-H) instability induced by the detachment of the annular boundary layer at the orifice’s exit [
22]. As the main flow accelerates, the shear interaction between the jet and the surrounding flow becomes more pronounced, thereby enhancing the K-H instability. The acceleration of the main flow plays a crucial role in promoting the development of shear vortices. To quantitatively assess the susceptibility of the shear layer to Kelvin–Helmholtz (K-H) instability, the local gradient Richardson number
is employed as a classical criterion. It is defined as
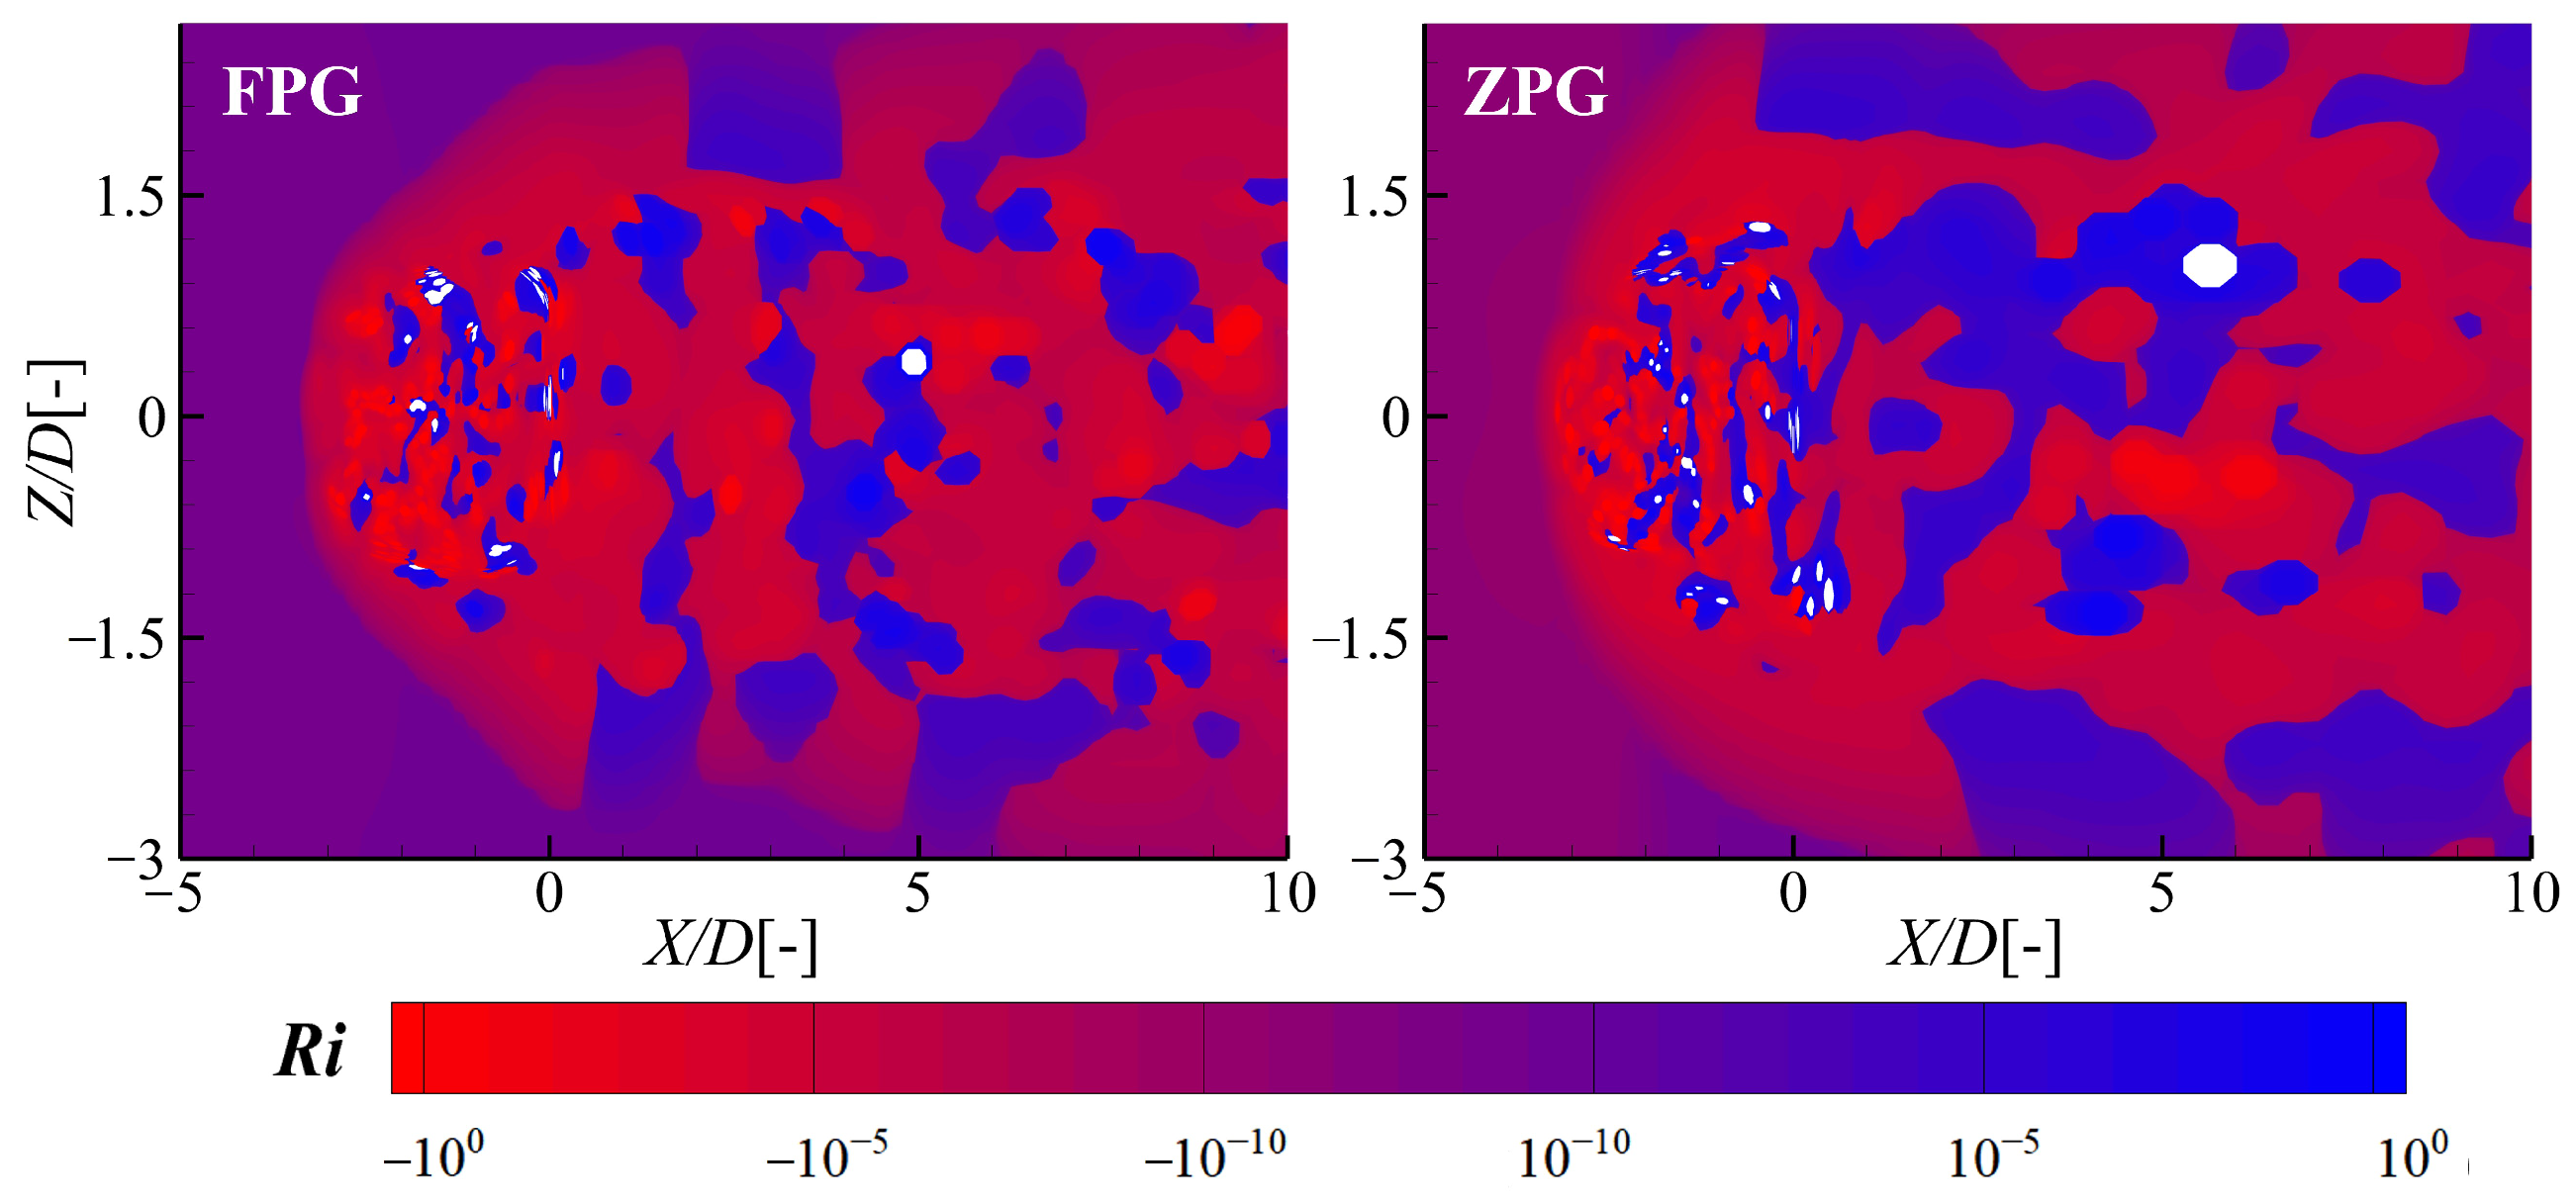
Figure 16 presents the contour distribution of
on a lateral plane at
for both the FPG and ZPG conditions at
. According to the criterion proposed by Želi et al. [
23], Kelvin–Helmholtz instability is likely to occur when the local gradient Richardson number satisfies
. In the present analysis,
are masked as blank(white) region, representing locally stable zones. As observed in
Figure 16, the white regions are sparse and localized, indicating that the shear layer downstream of the cooling hole is predominantly unstable and susceptible to K-H vortex formation.
Compared to the ZPG, the FPG case exhibits a more extensive distribution of low-Ri regions downstream of the hole, indicating stronger and more widespread shear-layer instability.
Figure 16 illustrates this with noticeably larger areas of red zones in the FPG case, representing enhanced regions of unstable shear flow. The strengthened shear and rapid mixing induced by the FPG entrain hot mainstream fluid more aggressively into the coolant layer, reducing film integrity and lateral coverage near the hole exit, especially with low jet momentum. In contrast, under the ZPG, a more coherent shear layer with moderate instability promotes lateral spread without excessive dilution, resulting in relatively higher local cooling effectiveness.
To further observe the evolution of these unsteady structures in the shear layer, 18 monitoring points were strategically arranged along the shear layer region, as illustrated in
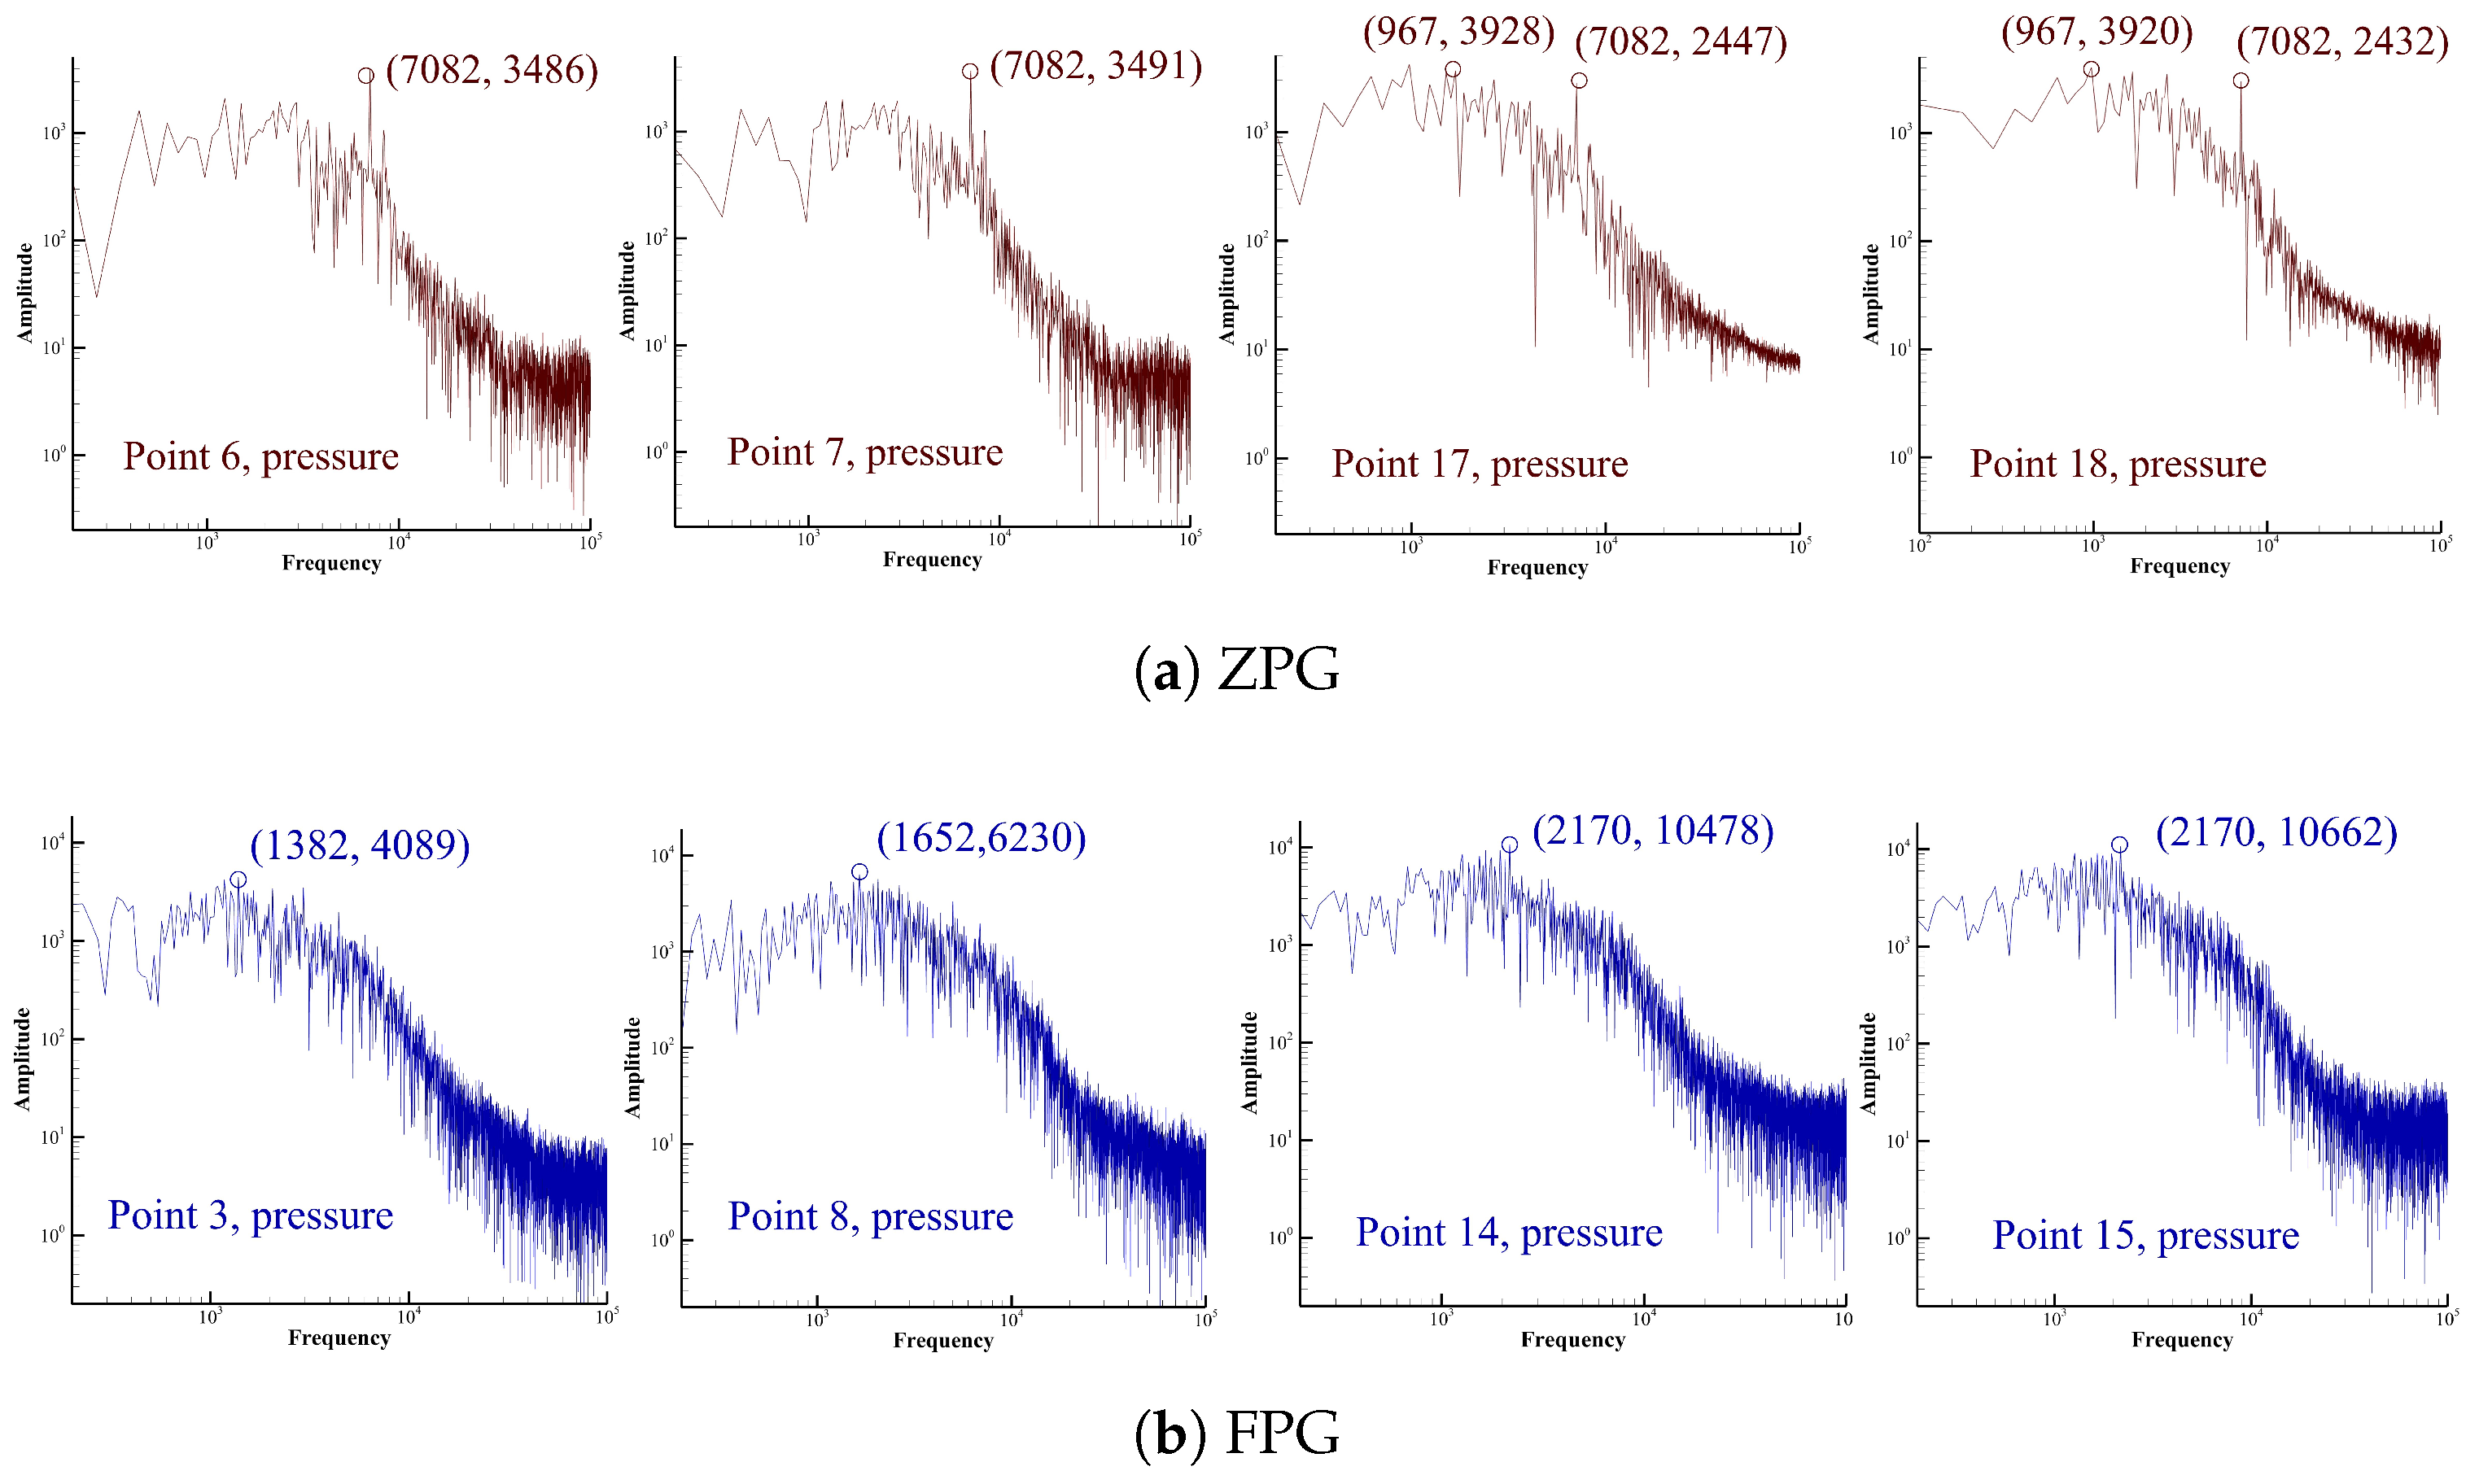
Figure 17. The frequency spectrum for 18 monitoring points in the shear layer region for
case was derived by applying the Fast Fourier Transform (FFT) to the pressure signals [
24], as illustrated in
Figure 18. The spectrum generally exhibits a dominant peak followed by a decay that approximately follows the −5/3 slope, indicating a classical turbulent energy cascade process in which energy is transferred from large eddies to smaller ones and eventually dissipated as internal energy. The dominant frequency represents the most energetic coherent structure with the largest integral length scale at the measurement location.
In the ZPG condition, monitoring points 4–10 exhibit a clear dominant frequency at approximately 7082 Hz and a spectral amplitude up to 3491 Pa2/Hz, which is associated with the characteristic shedding frequency of the shear layer vortices. However, from point 11 onward, multiple frequency components emerge, indicating that the coherent shear-layer structures may gradually transition into hanging vortices. As for the FPG case, the frequency at point 3 is 1382 Hz. Since the upstream points are positioned close to the boundary layer, it is likely influenced by both the shear layer and horseshoe vortices, resulting in a more intricate flow pattern. Only points 9 to 16 share a common dominant frequency of 2170 Hz, much lower than that of the ZPG. Furthermore, the pressure fluctuation amplitudes under the FPG increase more significantly along the shear layer, with peak power spectral densities exceeding 10,408 Pa2/Hz, substantially higher than those observed in the ZPG case. The significantly higher amplitude indicates stronger energy concentration at this lower frequency, corresponding to large-scale vortical structures with enhanced turbulent dissipation.


