Article

Cavitation–Velocity Correlation in Cavitating Flows Around a Clark-Y Hydrofoil Using a Data-Driven U-Net

1
State Key Laboratory of Hydroscience and Engineering, Department of Energy and Power Engineering, Tsinghua University, Beijing 100084, China
2
Institute of Industrial Science, The University of Tokyo, 4-6-1 Komaba, Meguro-ku, Tokyo 153-8505, Japan
*
Author to whom correspondence should be addressed.
Fluids 2025, 10(8), 213; https://doi.org/10.3390/fluids10080213
Submission received: 8 July 2025 / Revised: 27 July 2025 / Accepted: 8 August 2025 / Published: 13 August 2025
(This article belongs to the Special Issue Multiphase Flow and Fluid Machinery)

Abstract

Cavitating flows are of great interest in the fields of hydraulic machineries, which can significantly affect mechanical performance and safety. Despite various efforts being dedicated to figuring out the interaction between flow and cavitation fields, their correlation has not been clearly addressed. To this end, in this study, a convolutional neural network, U-Net, was adopted to build a model that can predict the vapor volume fraction from velocity fields. Large eddy simulations of cavitating flows around a Clark-Y hydrofoil were conducted, and the simulated snapshots with velocity and vapor volume fraction were adopted as a dataset for training the network. The predicted vapor volume fraction shows good agreement with the referred simulation results, with a L1 deviation lower than 2 × 10⁻⁴, considering all the snapshots. The comparable L1 deviation between the training and validation datasets suggests the existence of a strong correlation between velocity and cavitation fields. The cavitation–velocity interaction derived from using U-Net suggests that the location with zero velocity indicates the interior part of attached and cloud cavitations, and the local vortical velocity fields usually suggest the existence of cavitation shedding.

1. Introduction

Cavitation is a fundamental interphase mass transfer phenomenon in both natural environment and industrial applications which generally happens when local pressure is lower than saturated vapor pressure. Along with the occurrence of cavitation, there usually appears intense pressure changes and complex vortical structures [1,2]. In such scenarios of hydraulic machineries, the resultant pressure pulse can lead to remarkable mechanical vibration and acoustic noise [3,4]. This not only reduces energy conversion performance but also compromises the safety and lifespan of the system.
Considering the significant role of cavitation in hydraulic machineries, many scholars have investigated cavitating flows and resultant performance in different types of pumps and turbines through experimental and numerical approaches [5,6,7,8]. However, due to their complex structures, especially their high-curved blades, it is quite challenging to perform high-resolution experimental and numerical studies. Therefore, cavitating flow around a hydrofoil becomes a more feasible way to investigate cavitation characteristics, which has been investigated extensively in the past decades. From the experimental side, high-speed visualizations are conducted to figure out the temporal–spatial evolution of cavitation [9,10,11]. Depending on the extent of cavitation, two typical patterns are observed: (i) sheet cavitation, which remains attached to the suction surface of the hydrofoil [12], and (ii) cloud cavitation, which periodically sheds from the attached cavitation [13]. In addition, particle image velocimetry (PIV) is also adopted to measure velocity fields so as to illustrate flow structures [12,13,14]. It has been found that the re-entrant jet in the rear of attached cavities plays a dominant role in the shedding feature of cloud cavitation [13].
With the rapid growth of computation resources, computational fluid dynamics has emerged as a powerful tool to investigate cavitating flows. In general, numerical modeling of cavitating flows involves a turbulence model and a cavitation model. The Reynolds-averaged Navier–Stokes (RANS) method, as the most common approach in engineering applications, usually suffers from the underestimation of cavitation when applied to simulate cavitating flows directly. This can be significantly improved by artificially reducing the turbulent viscosity according to local density [13,14,15]. In recent years, more numerical studies have been performed using large eddy simulation (LES) so that more small-scale flow and vortical structures can be investigated [16,17,18,19]. This provides more flow information in analyzing the flow mechanism involving turbulence. As for the cavitation models, most of them are developed based on the Rayleigh–Plesset equation [20,21], including the Singhal model [22], the ZGB model [23], and the Schnerr–Sauer model [24,25]. These cavitation models show comparable prediction results among numerical studies.
Both experimental and numerical investigations suggest that the flow fields play significant roles in the development of cavitation; however, analysis of the underlying mechanism is still quite challenging. Early studies primarily examined how flow structures influence cavitation by visualizing both the flow field and the cavitating field, for example, the role of the re-entrant jet in cavitation shedding [13,14]. The vorticity transport equation has been introduced to analyze the interaction between vortex and cavitation [16,17]. The contributions of different vortex source terms to cavitation are summarized as follows: the vortex stretching term predominantly governs cavitation development, while the baroclinic torque term plays a significant role at the liquid–vapor interface [16]. More detailed analysis of turbulent stress has shown it is related to cavitation inception [19]. Although numerical simulations are conducted from a Eulerian perspective, the cavitating flow can also be analyzed from a Lagrangian perspective so as to reveal Lagrangian coherent structures [26,27,28]. Such analysis provides detailed temporal evolutions of flow and cavitation structures. In all of the above studies, scholars attempted to analyze the flow mechanism directly based on physical phenomena. However, due to the complexity of cavitating flows, clarifying the most dominant mechanism is not an easy task.
Recently, data-driven algorithms have emerged as another effective tool for flow analysis. Proper Orthogonal Decomposition (POD) [29,30] and Dynamic Mode Decomposition (DMD) [31,32] are the most common data-driven approaches. They analyze flow fields in the form of snapshots according to eigenvalues and eigenvectors of a system matrix. These two methods have been applied to cavitating flows around various hydrofoils [33,34,35], and they can successfully extract the dominant coherent structures so as to reveal major flow mechanisms. However, both POD and DMD analysis are performed under a linear assumption, and the resultant reconstruction residual cannot be negligible. The machine learning (ML) technique, on the other hand, has become a more compelling data-driven approach in recent years [36]. It has achieved great success in both forward and inverse analysis of flow fields [37,38], while its application to cavitating flows is still relatively limited.
To this end, in this study, a convolutional neural network was used to quantitatively evaluate the correlation between velocity and cavitation fields. High-fidelity large eddy simulation results of cavitating flows around a Clark-Y hydrofoil were adopted as a dataset. The present paper is organized as follows: The numerical methodology used to simulate cavitating flow is presented in Section 2. The architecture of the proposed neural network, along with the dataset, is described in Section 3. The results are analyzed and discussed in Section 4. Finally, the conclusions are summarized in Section 5.

2. Numerical Methodology

2.1. Problem Description

Numerical simulations were carried out to investigate the velocity field and cavitation characteristics of a Clark-Y hydrofoil. As illustrated in Figure 1, the hydrofoil is positioned within a channel at an angle of attack of α = 8°. The streamwise, wall-normal, and spanwise directions are denoted as the x-axis, y-axis, and z-axis, respectively. The chord length C of the hydrofoil is 70 mm, and the uniform inflow velocity u is set as 10 m/s, corresponding to a Reynolds number of 7.8 × 10⁵. The spanwise width of the hydrofoil is set as 0.3 C, which is a parameter commonly adopted in numerical studies to balance computational cost and three-dimensional effects. The computational domain is 10 C in the streamwise direction, with the distance from the inlet to the hydrofoil leading edge set as 4 C. The domain height is set as 2.7 C so as to minimize top and bottom boundary effects on the flow field.

2.2. Numerical Model

In our simulation, the liquid and vapor phases of water are considered as a homogenous mixture, with no slip velocity between the two phases. The governing equations, including the continuity, momentum, and mass transfer equations, are written as follows:
ρ m t + ρ m u j x j = 0
ρ m u i t + ρ m u i u j x j = p x i + x j μ m u i x j
ρ v α v t + ρ v α v u j x j = m ˙ + m ˙
where u is the velocity, p is the pressure, and ρm and μm are the density and dynamic viscosity of the mixture, respectively. These are defined as follows:
ρ m = α v ρ v + 1 α v ρ l
μ m = α v μ v + 1 α v μ l
where αv is the vapor volume fraction, and the subscripts v and l denote vapor and liquid, respectively. In Equation (3), the source terms m ˙ + and m ˙ represent the mass transfer rates due to evaporation and condensation.
Compared to Reynolds-averaged Navier–Stokes (RANS) models, large eddy simulation (LES) offers superior capability in resolving multi-scale turbulence and has been widely adopted in cavitation simulations. The key principle of LES is the separation of large and small scales through spatial filtering. By applying a Favre-filtering operation to Equations (1) and (2), the governing equations for LES are derived as follows:
ρ m t + ρ m u ¯ j x j = 0
ρ m u ¯ i t + ρ m u ¯ i u ¯ j x j = p ¯ x i + x j μ m u ¯ i x j ρ m τ i j x j
where the overbar denotes a spatially filtered quantity. The subgrid-scale (SGS) stress tensor τij is defined as
τ i j = u i u j ¯ u ¯ i u ¯ j
which is a symmetric tensor with six independent components. The eddy-viscosity assumption is used to model τij and close the equations:
τ i j = 2 μ t S ¯ i j + 1 3 σ i j τ k k
where
S ¯ i j = 1 2 u ¯ i x j + u ¯ j x i
μt is the subgrid-scale turbulent viscosity. In this study, the Wall-Adapting Local Eddy-viscosity (WALE) model [39] is employed to compute μt:
μ t = ρ m L s 2 S i j d S i j d 3 2 S ¯ i j S ¯ i j 5 2 + S i j d S i j d 5 4
S i j d = 1 2 u ¯ i x j 2 + u ¯ j x i 2 1 3 δ i j u ¯ k x k 2
L s = min k d , C s V 1 3
where Ls is the subgrid characteristic length scale, V is the volume of the computational cell, k is the Von Karman constant, d is the distance to the closest wall, and Cs is the WALE constant, set to 0.5 based on calibration against decaying isotropic homogeneous turbulence.
In addition, the Schnerr–Sauer cavitation model is employed in the present work to compute the mass transfer between water and water vapor. In this model, the vaporization and condensation rates are defined as
m ˙ + = ρ v ρ l ρ α v 1 α v 3 R b 2 3 max p v p , 0 ρ l
m ˙ = ρ v ρ l ρ α v 1 α v 3 R b 2 3 max p p v , 0 ρ l
where pv is the saturation pressure, and Rb is the bubble radius, which is determined from the vapor volume fraction αv and the bubble number density Nb according to
α v = N b 4 3 π R b 3 1 + N b 4 3 π R b 3
Which leads to
R b = α v 1 α v 3 4 π 1 N b 1 / 3
where Nb denotes the bubble number density, specified as 1013 m−3 according to the research of Schnerr and Sauer [24,25].

2.3. Numerical Setup

The computational domain is presented in Figure 1. Regarding the boundary conditions, a uniform inflow velocity u = 10 m/s is prescribed at the inlet. At the outlet, a static pressure pout of 42,000 pa is imposed, ensuring that the cavitation number satisfies σ = (ppv)/(0.5ρu2) = 0.8, consistent with the reference experimental conditions [14]. The top and bottom boundaries of the domain are treated as free-slip walls, while the hydrofoil surfaces are modeled as no-slip boundary conditions. Periodic boundary conditions are applied to the side boundaries to simulate the flow periodicity in the spanwise direction.
The entire computational domain is discretized using a structured mesh. An O-grid topology is employed around the hydrofoil to enhance mesh quality and resolution near the solid surface. The final mesh consists of approximately 2.97 million cells, with 42 nodes distributed along the spanwise direction. This mesh resolution has been validated to be sufficiently fine to capture the detailed cavitation structures according to our previous numerical studies [18,19]. Local mesh refinement is applied in the vicinity of the hydrofoil and within the wake region. The dimensionless wall distance y+ is maintained at approximately 1 along the hydrofoil surfaces, except in the vicinity of the leading edge, where local flow acceleration results in abrupt velocity changes. The mesh arrangement near the hydrofoil is shown in Figure 2.
A steady-state non-cavitating simulation is first performed to obtain a converged initial flow field prior to the unsteady cavitating simulations. For the unsteady simulations, a time step of 2 × 10⁻⁵ s is used, ensuring that the Courant number remains around 1 throughout the simulation. A higher-order discretization scheme is applied for the advection terms, while a second-order backward Euler scheme is employed for temporal integration. The number of inner iterations per time step ranges from 10 to 50 to achieve an RMS residual level of 1 × 10⁻⁴, ensuring adequate convergence at each time step. The commercial CFD code ANSYS CFX 2021 was adopted to perform numerical simulation using the above configurations.

2.4. Validation of Simulation

The numerical simulation results are compared against experimental data to validate the accuracy and reliability of the adopted numerical methods. The temporal evolution of cavitation over a typical period is illustrated in Figure 3, where Tc is the cavitation cycle period characterizing the full evolution. The simulated cavitation patterns at various phases of the cycle show good agreement with the experimental observations [14]. The numerical model successfully captures key dynamics, including the growth and development of sheet cavitation, as well as the downstream propagation of could cavitation during the early stages (from 1/8 Tc to 4/8 Tc). In the later stages (from 5/8 Tc to 8/8 Tc), the simulation accurately reproduces the breakdown of the sheet cavity and the subsequent shedding of the cloud cavity. The detailed flow physics and underlying mechanisms will be discussed further in subsequent sections.
Furthermore, a fast Fourier transform (FFT) analysis of the time series of the vapor volume fraction reveals that the cloud cavitation shedding period is approximately 44 ms, which is in close agreement with the reference experimental value of 40 ms [14], as well as with values reported in previous numerical studies [40,41]. This further demonstrates the capability of the present simulation approach in predicting unsteady cavitation dynamics.
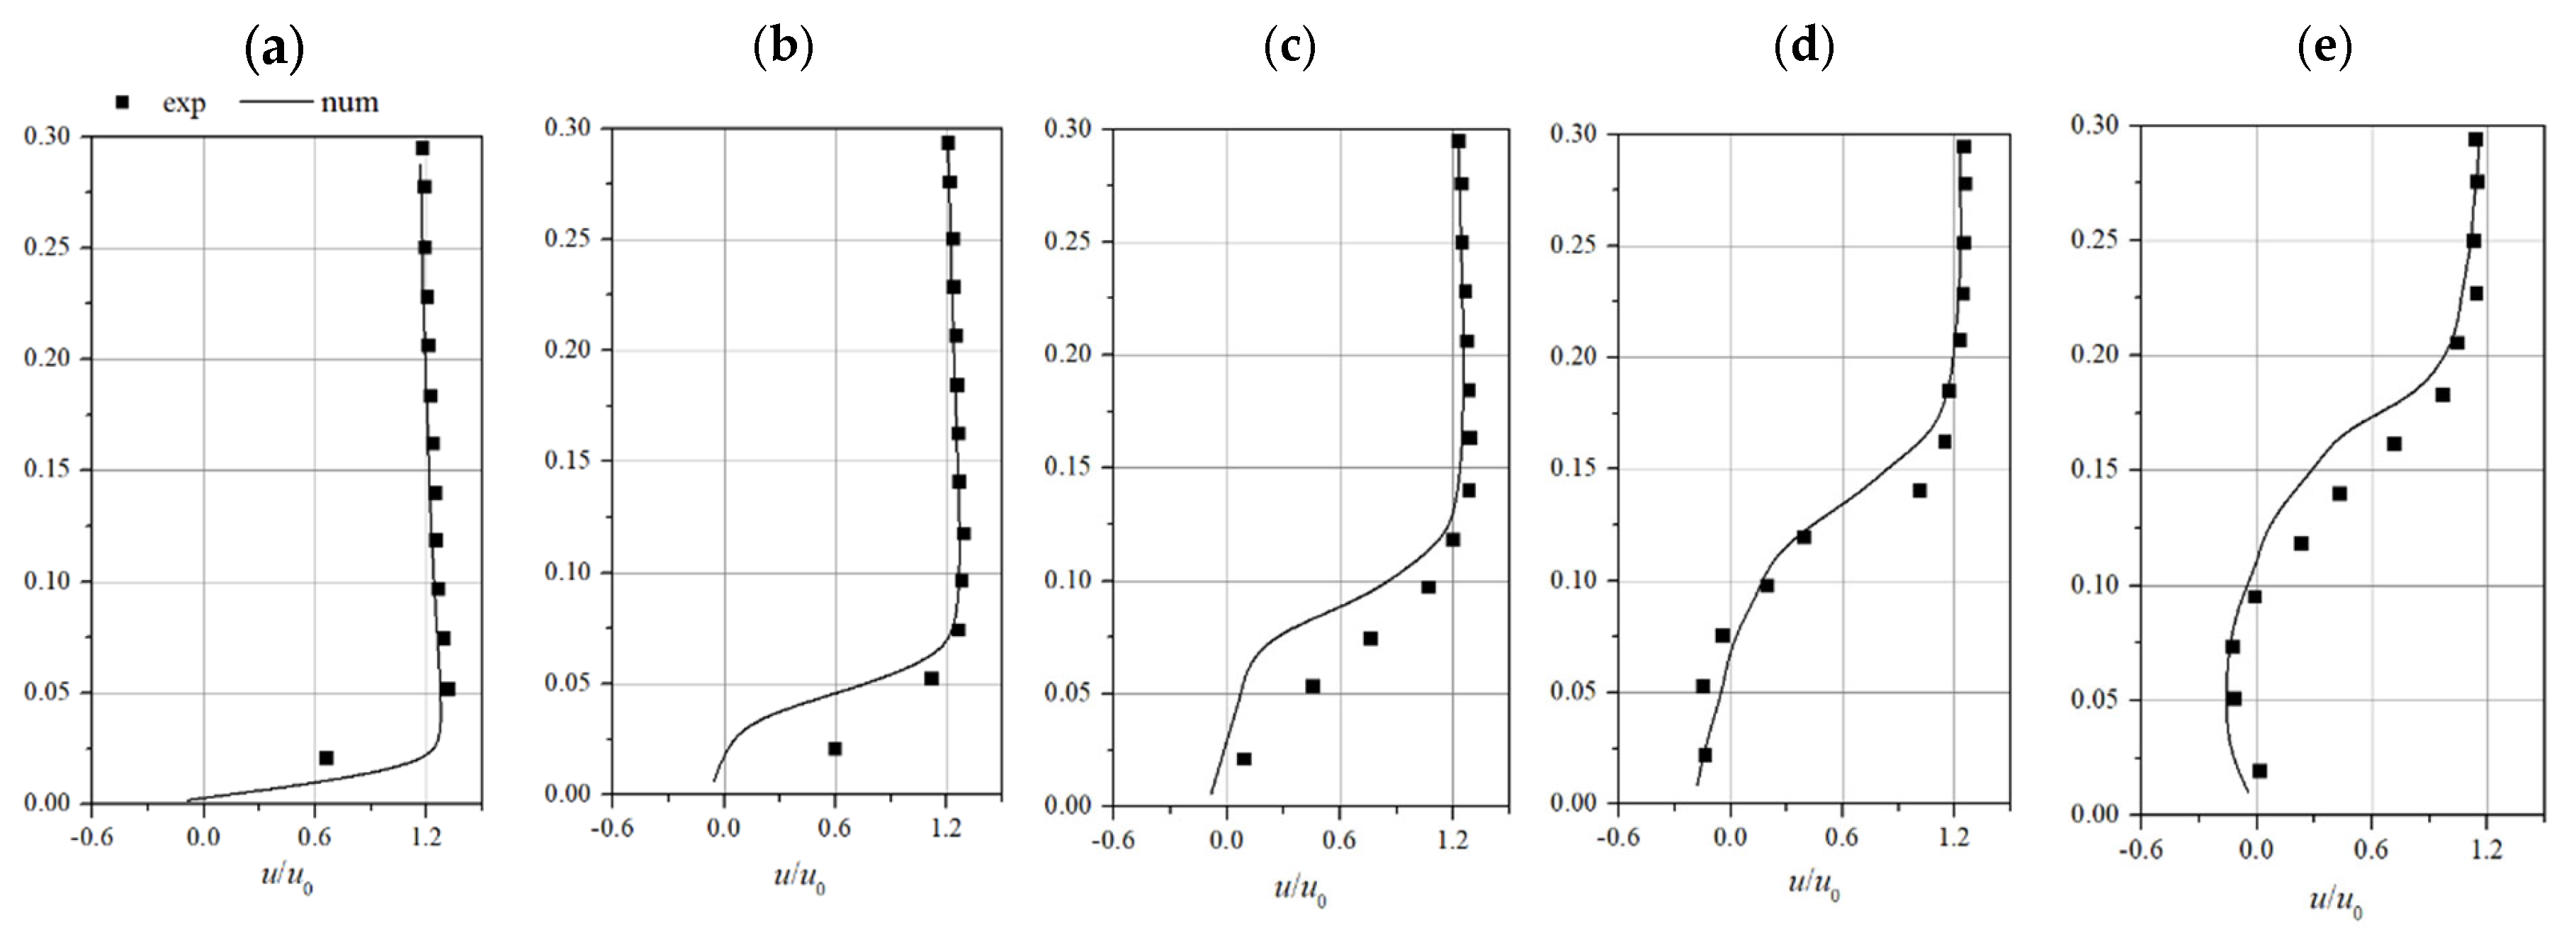
To further validate the numerical results, a quantitative comparison of the time-averaged streamwise velocity distribution is performed. Figure 4 presents the normalized streamwise velocity profiles along the vertical direction at five representative streamwise positions along the hydrofoil. Here, the streamwise velocity is normalized by the inflow velocity u, and x denotes the distance from the hydrofoil leading edge. The predicted velocity distributions are in good agreement with the experimental measurements made by PIV [14] at all positions, particularly near the leading edge where the flow acceleration and cavity inception occur. A noticeable discrepancy is observed near the wall region, attributed to the complexity of the local flow, including boundary layer development, re-entrant jet interactions, etc. In addition, negative velocity components are captured at x/C = 0.8 and x/C = 1.0, clearly indicating the presence of the re-entrant jet adjacent to the boundary layer. Overall, the present numerical model accurately predicts both the cavitation dynamics and the velocity field around the hydrofoil, confirming the validity of the employed numerical methods.

3. U-Net Neural Network

3.1. Dataset Preparation

In this section, we detail how the snapshots simulated using the numerical configuration described in Section 2 were adopted as a dataset to train a neural network. Although three-dimensional simulations of cavitating flows were performed in the present study, we extracted the two-dimensional plane at the middle along the spanwise direction, specifically z = 0.0105. In total, 350 snapshots were employed after the cavitating flow reached a fully developed state with stable periodical feature. The time interval of these snapshots is 2 × 10⁻⁴ s.
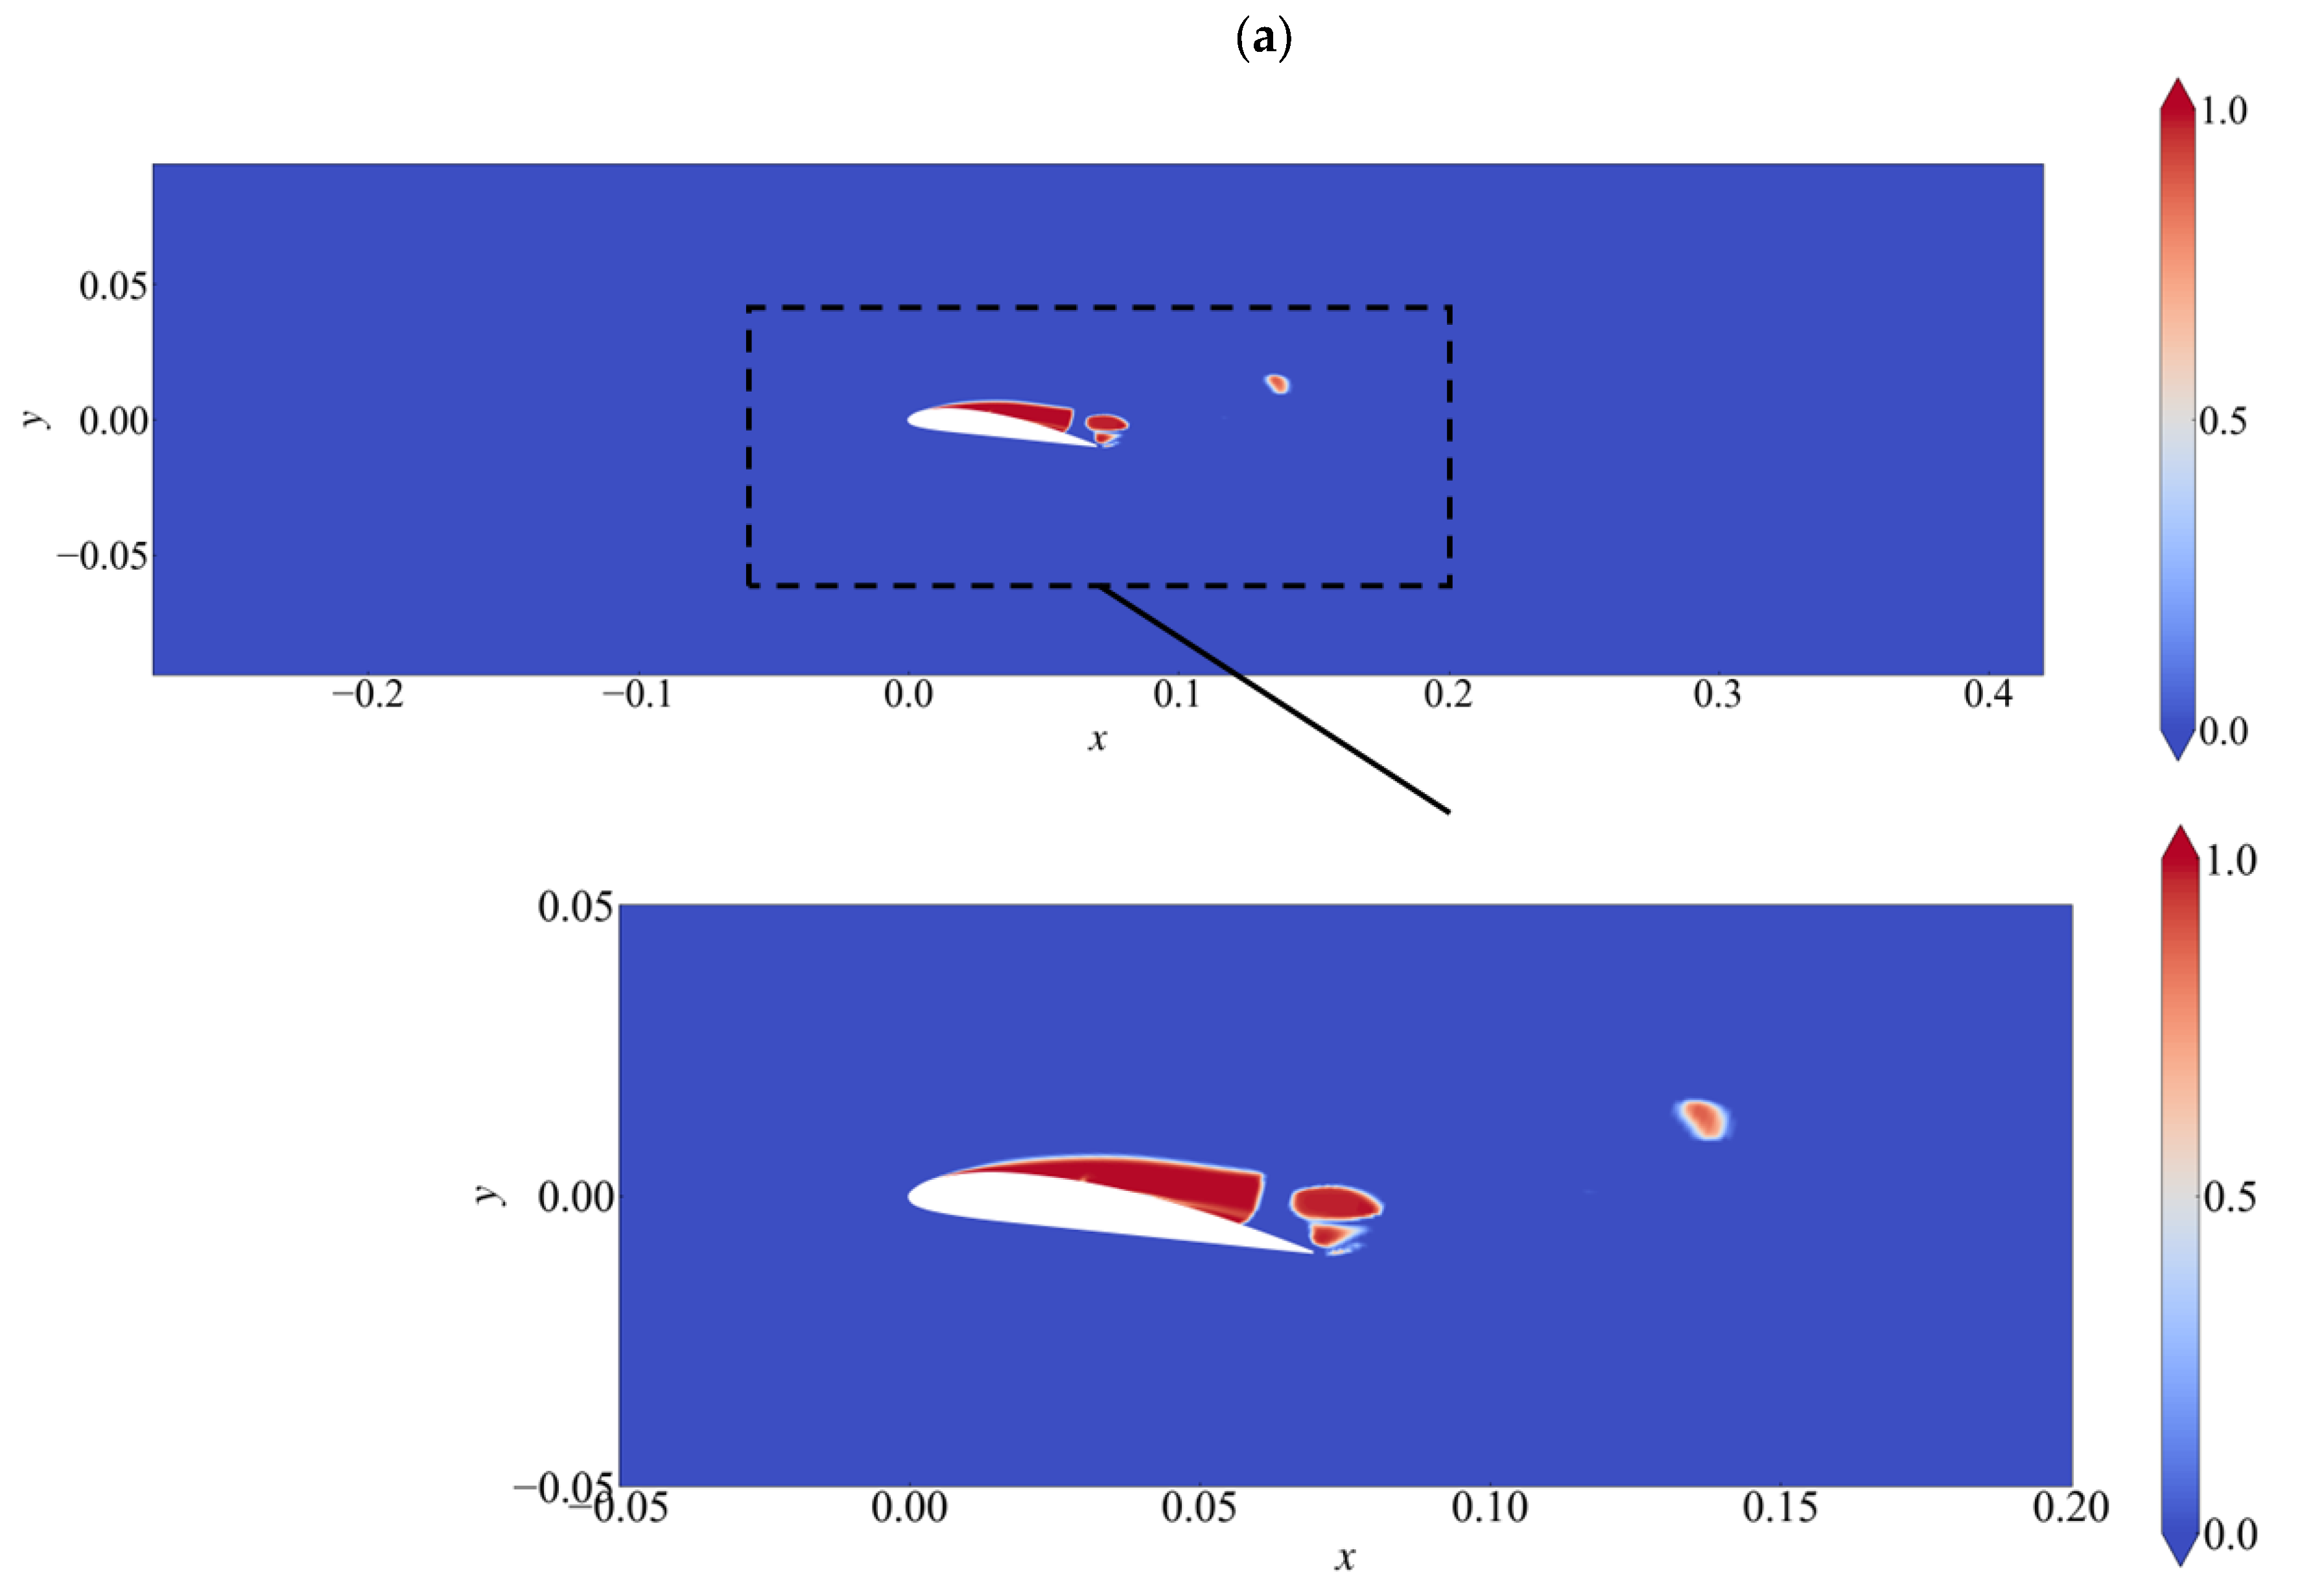
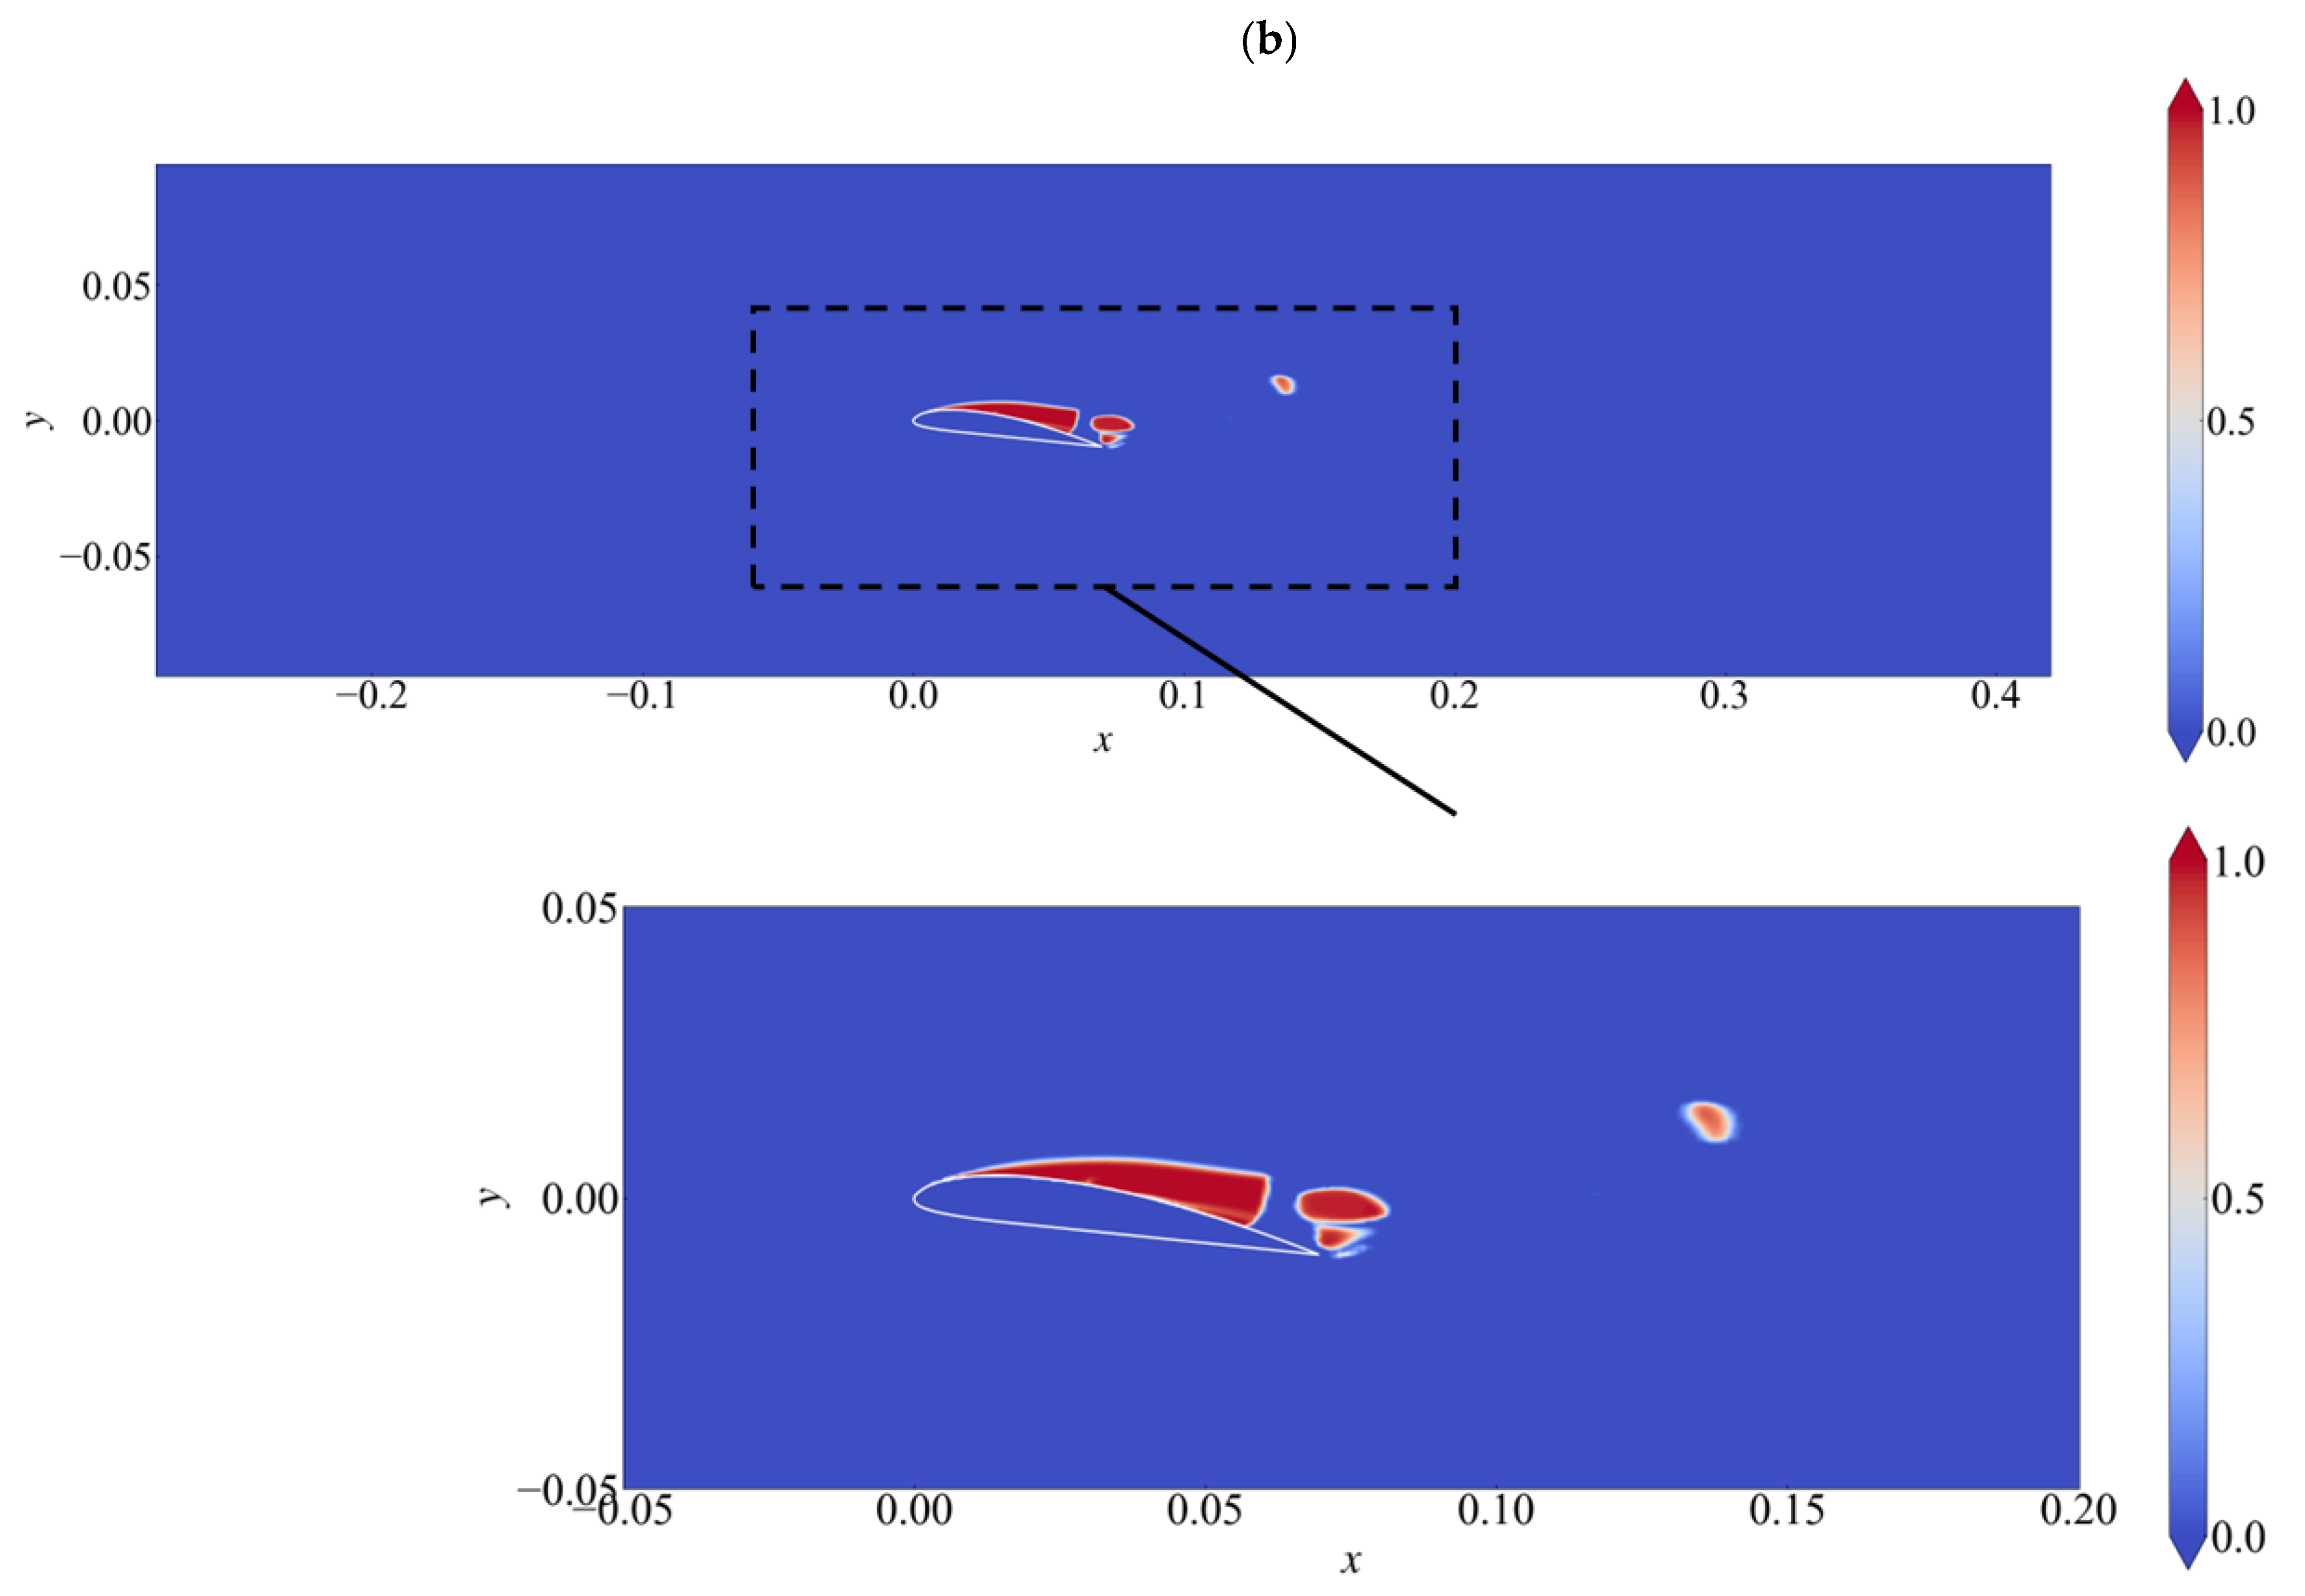
Since we aimed to reveal the correlation between the velocity fields and the cavitation, the flow quantities, i.e., streamwise velocity u, wall normal velocity v, and the volume fraction of the vapor phase αv, were extracted from the simulated flow fields. In the simulations, these data were represented in a structured grid system. However, to ensure feasibility for training a deep neural network, the flow quantities on the extracted plane were mapped onto a two-dimensional Cartesian grid system with uniform grid size along the x and y directions with linear interpolation. More specifically, the number of grids along x and y directions was 1024 and 256, respectively. Also, we note here that, on the original structured grids, the flow quantities inside the Clark-Y hydrofoil region were null. After mapping them onto the Cartesian grids, the values of all the involved flow quantities, i.e., u, v, and αv, were set as zero to avoid non-physical distributions inside the solid region. Figure 5 plots the contour of vapor volume fraction on the plane z = 0.0105 from LES and after mapping onto Cartesian grids. Good consistency can be observed from the comparison of Figure 5a,b, which validates that it is effective in performing linear interpolation for adjusting the grid system for the dataset.

3.2. Neural Network Architecture

In the present neural network, we adopted the streamwise and wall-normal velocities in the size of 1024 × 256 as the input, and the vapor volume fraction, with the same size, was taken as the output. By defining the input and output in this way, the neural network predicts the vapor volume fraction from a given velocity field so that the correlation between velocity and cavitation can be reflected. The L1 loss between the predicted vapor volume fraction and the ground truth from LES was employed to train this neural network:
L 1 = 1 N i = 1 N Ψ θ , u i , v i α v , i
where N represents the total number of grid points, while Ψ is a neural network with parameters θ.
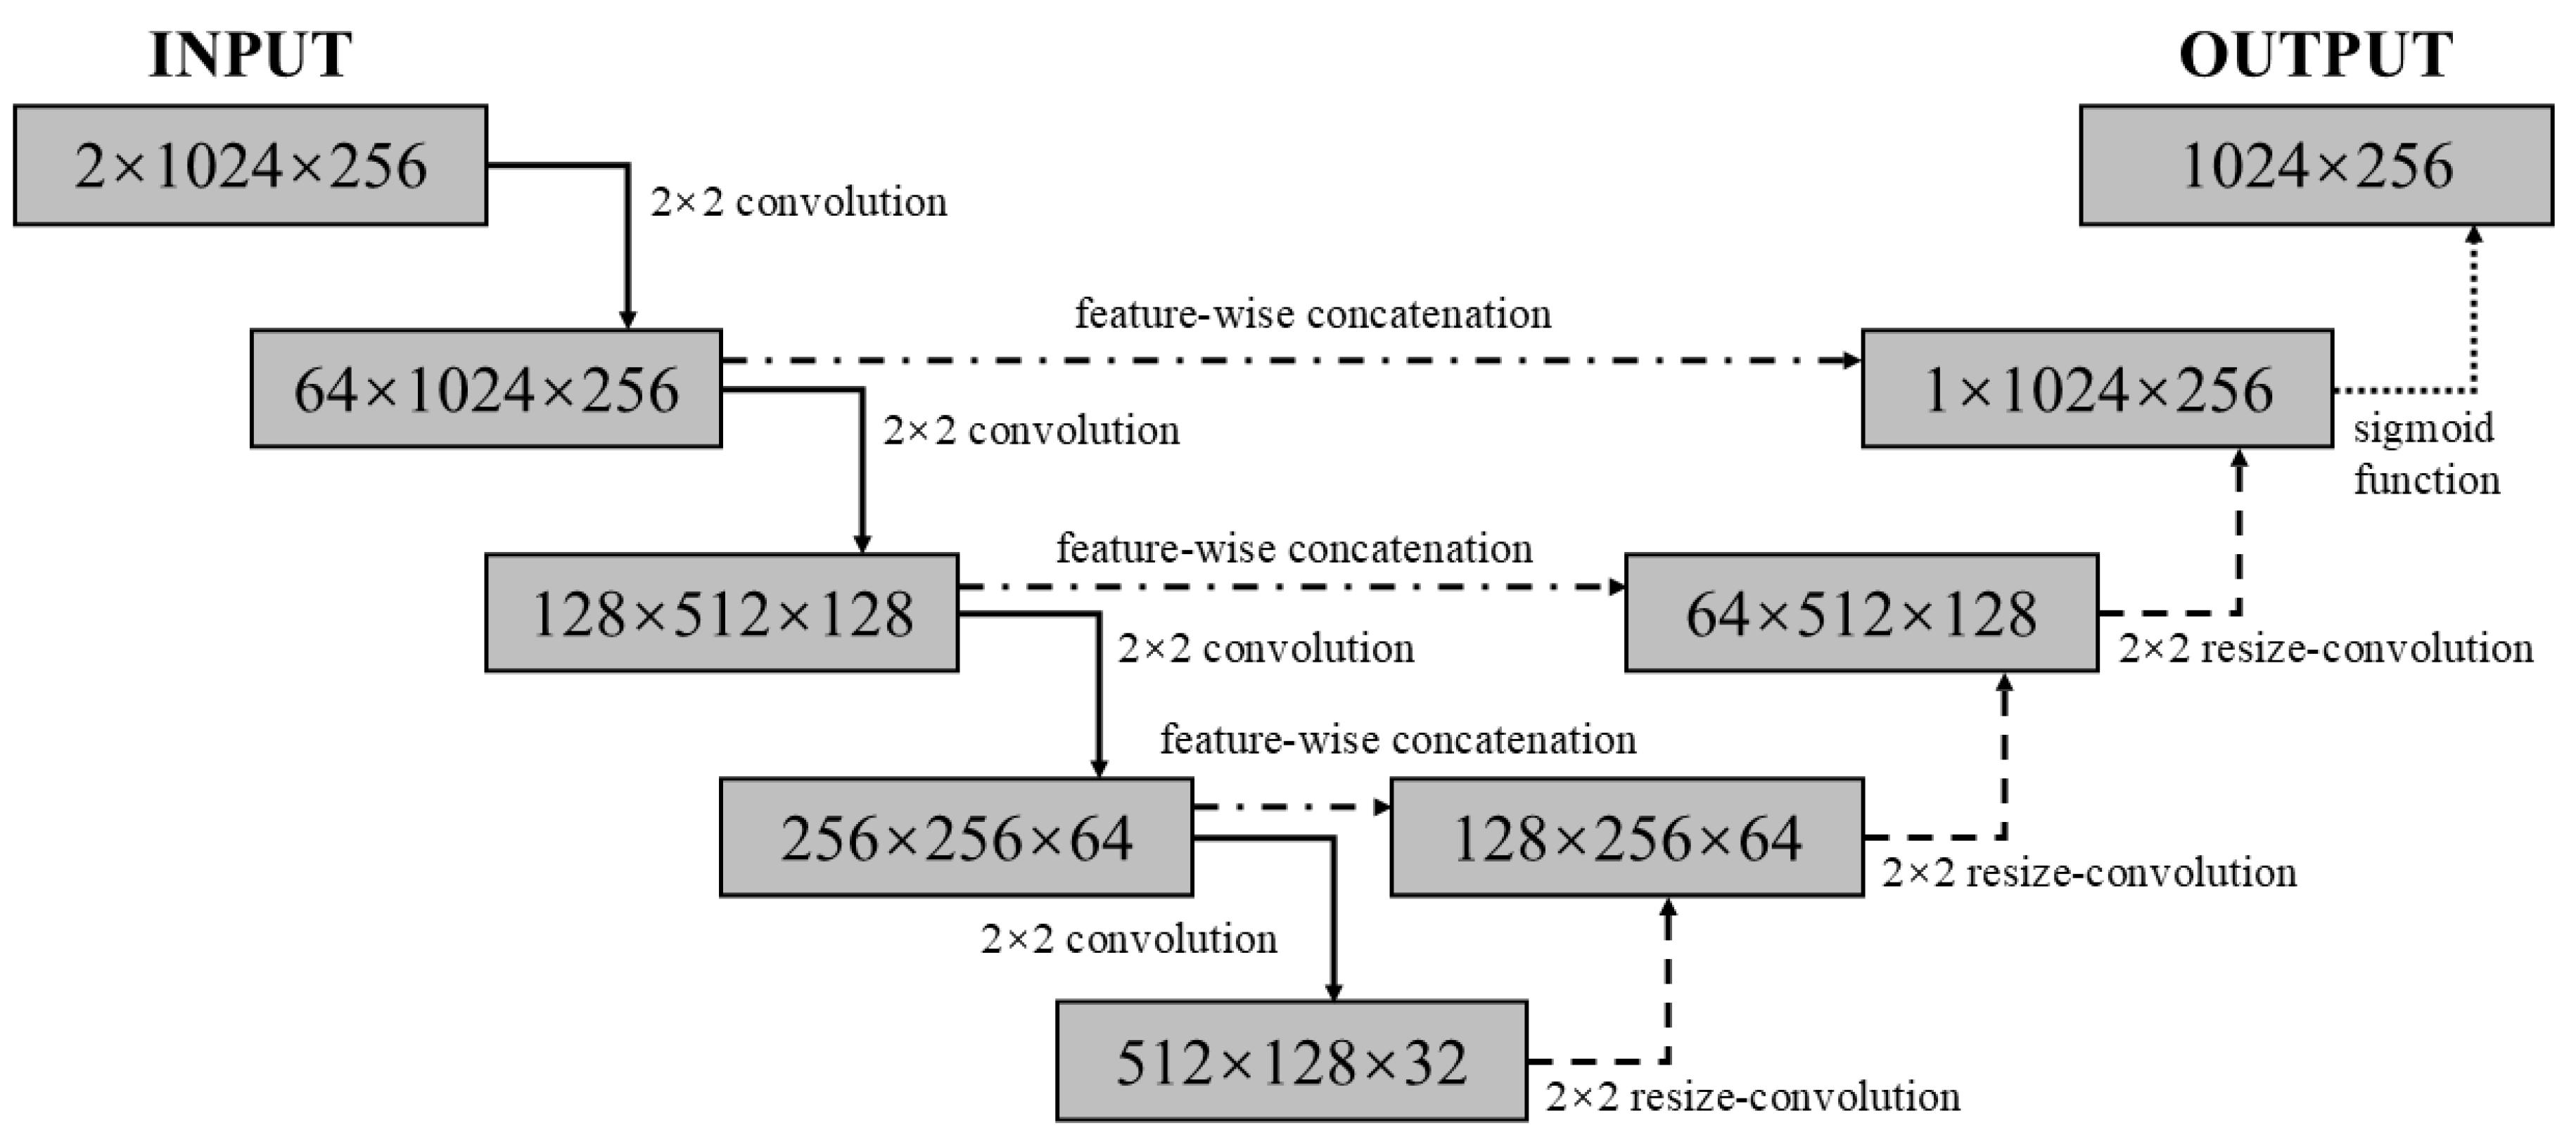
The neural network described in the present study was developed based on the U-Net architecture [42]. The U-Net architecture was originally proposed as a computer vision technique, and it has been introduced in the prediction of flow fields due to its ability to extract spatial features [43]. The main advantage of U-Net lies in its capability to retain both global and local information when applied in the prediction of flow fields. This is beneficial for predicting small-scale flow structures. Generally, a U-Net is designed in the form of an encoder-decoder architecture that consists of convolution neural networks. The encoding part constitutes three down-sampling blocks, and each block contains two convolutional layers with batch normalization and ReLU activation, followed by 2 × 2 max pooling to reduce spatial resolution. Then, the decoding part mirrors this process for up-sampling. In each block of the decoder, up-sampling is performed using transposed convolution, followed by feature-wise concatenation with the corresponding encoder feature map. Finally, a sigmoid activation function is imposed to bound the output in the range of [0, 1], which accounts for the physical constrains. Figure 6 illustrates the entire neural network architecture of the present U-Net.

3.3. Training Process

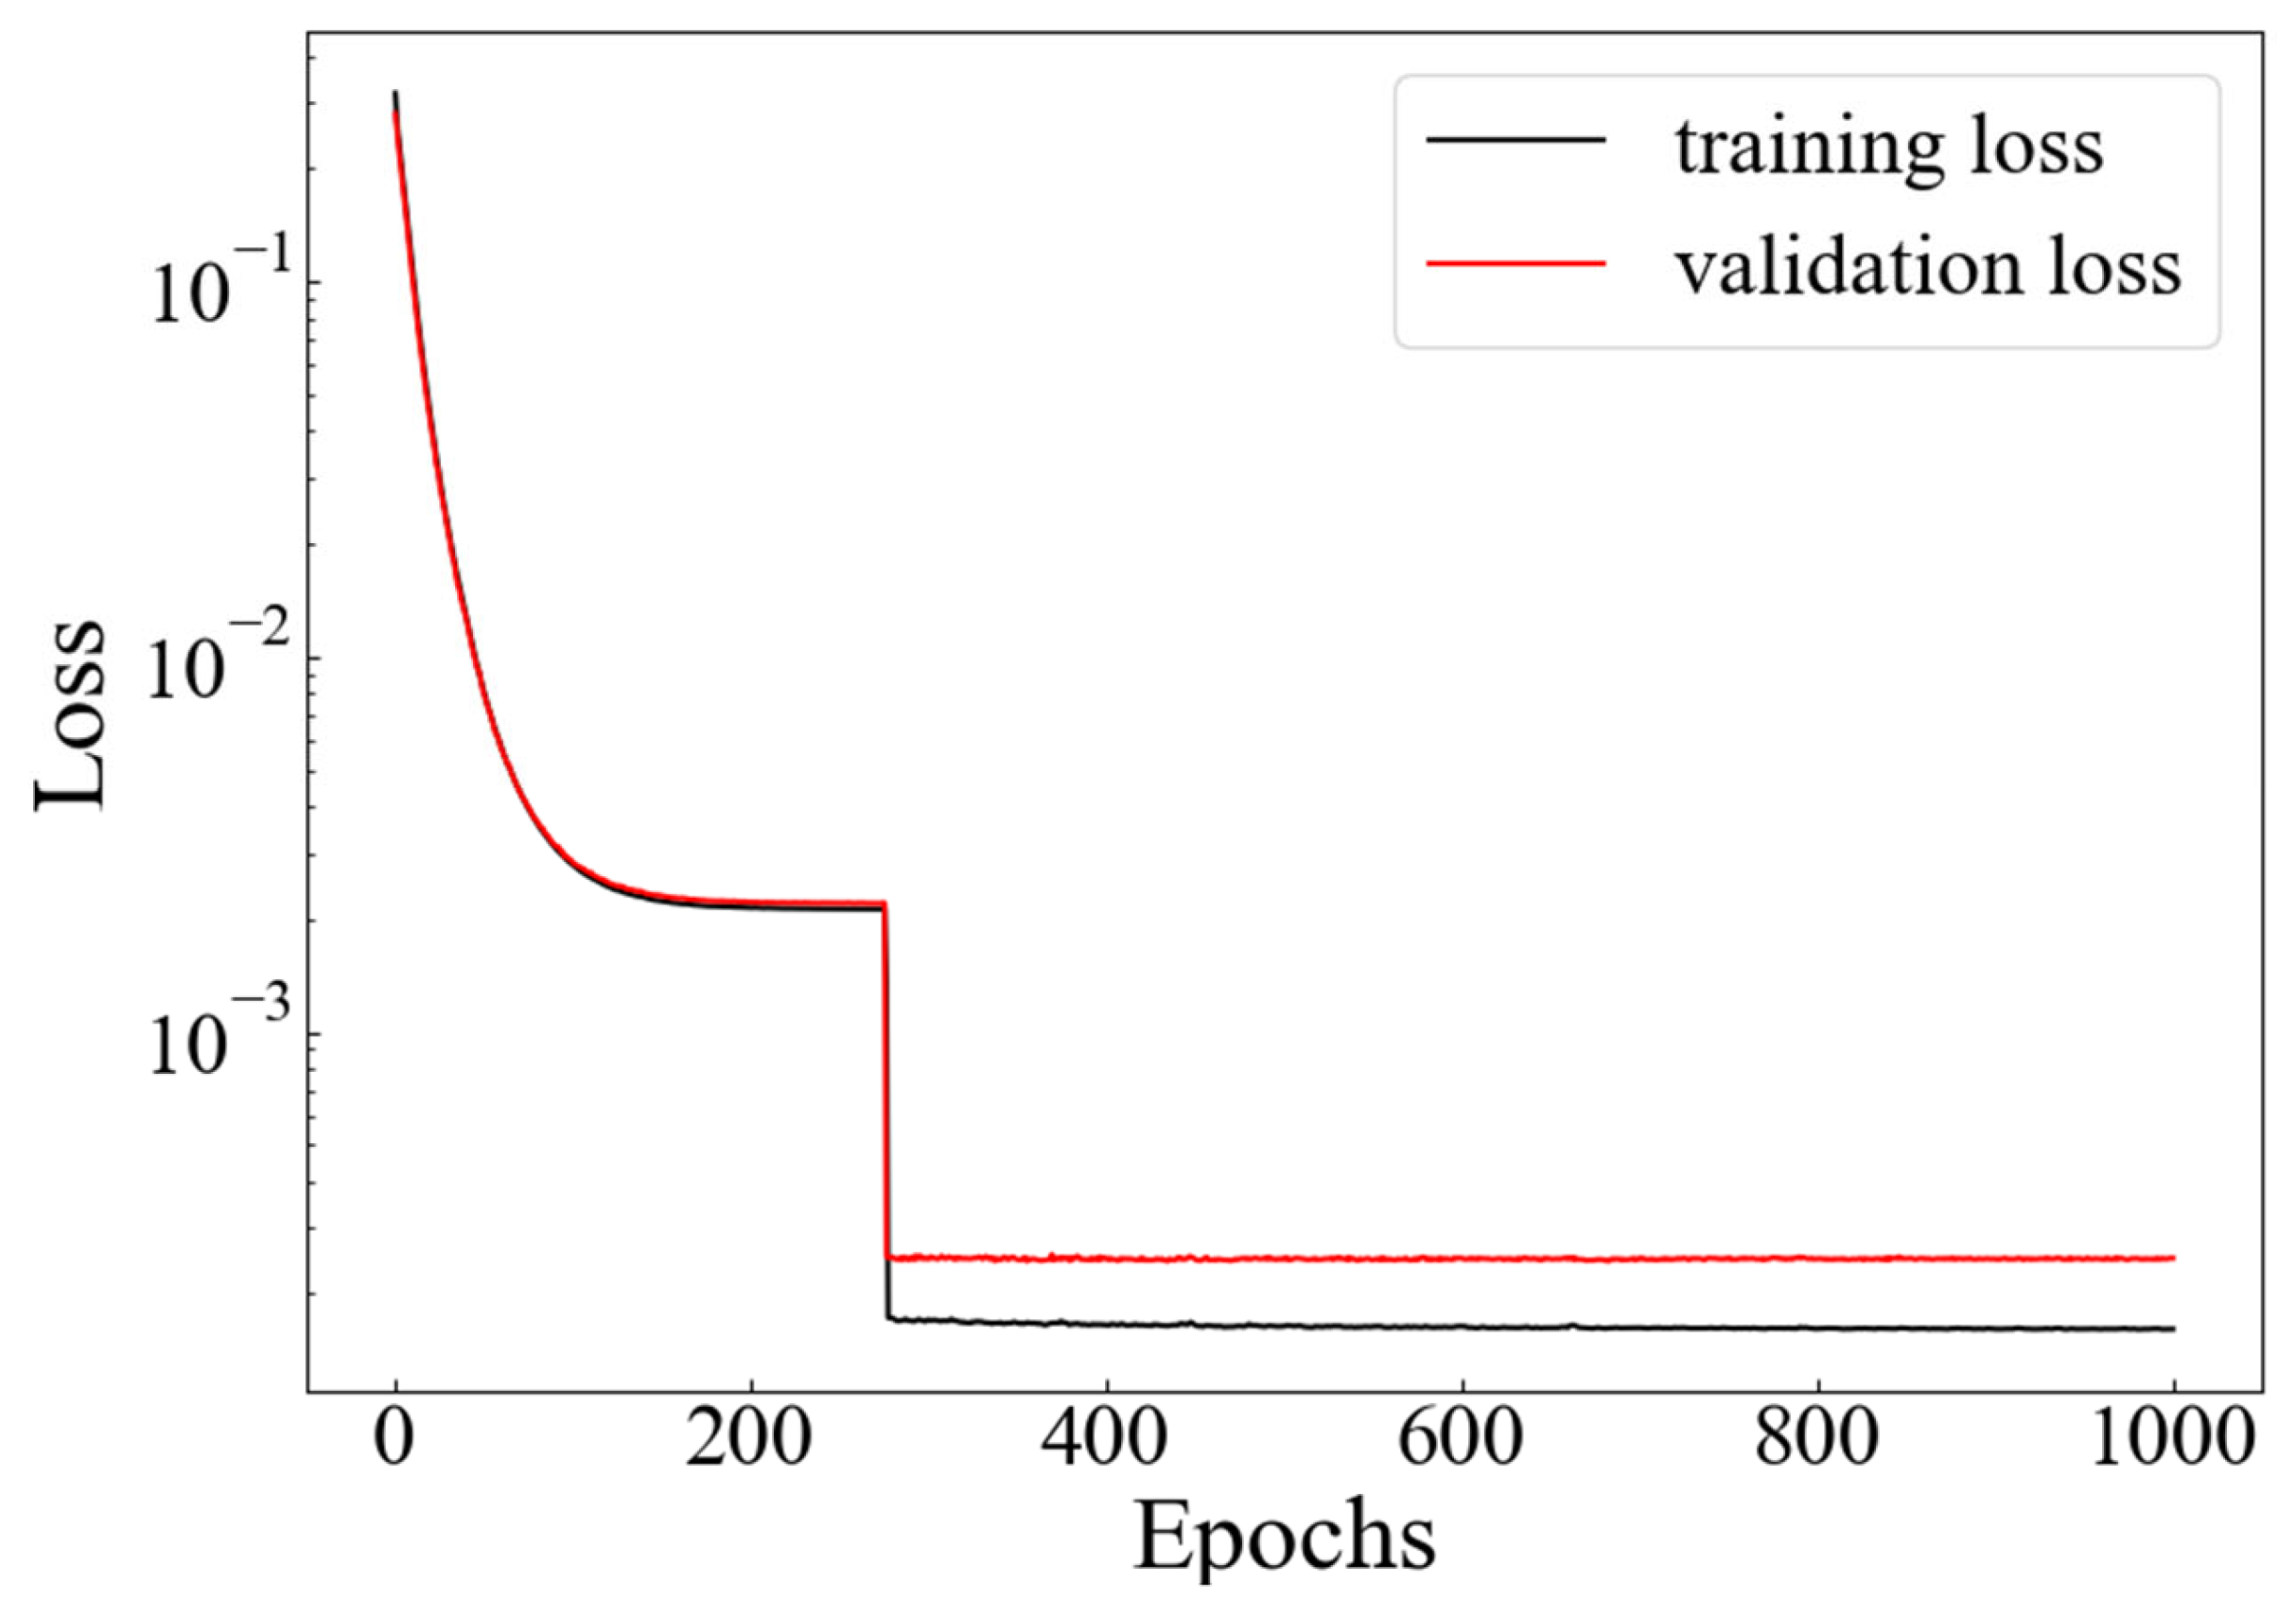
The U-Net architecture described in Section 3.2 was implemented into PyTorch (Version 1.8.2), a machine learning library [44]. The Adam optimizer was adopted for training with a constant learning rate of 10−4. Regarding the 350 snapshots used to form a dataset, they were randomly divided into two sub-datasets: the training dataset, which constituted 80% of the total snapshots, and the validation dataset, which comprised the remaining 20%. In the present study, we randomly distributed all the snapshots into the 80% training dataset and 20% test dataset so as to eliminate the influence of other factors on training and test datasets. The history of training and validation losses is shown in Figure 7. As the epoch progresses towards 300, both the training and validation losses undergo a reduction, reaching a value of approximately 10−4. This validates the well-trained performance of the present neural network. The L1 deviation between the vapor volume fraction predicted by the trained U-Net and the reference value is only 0.000179, considering all the snapshots. The comparable L1 deviation between the training and validation datasets demonstrates the good generalizability of the present model, suggesting the existence of a strong correlation between velocity and cavitation fields.

4. Results and Discussions

4.1. Evolution of Cavitating Flow

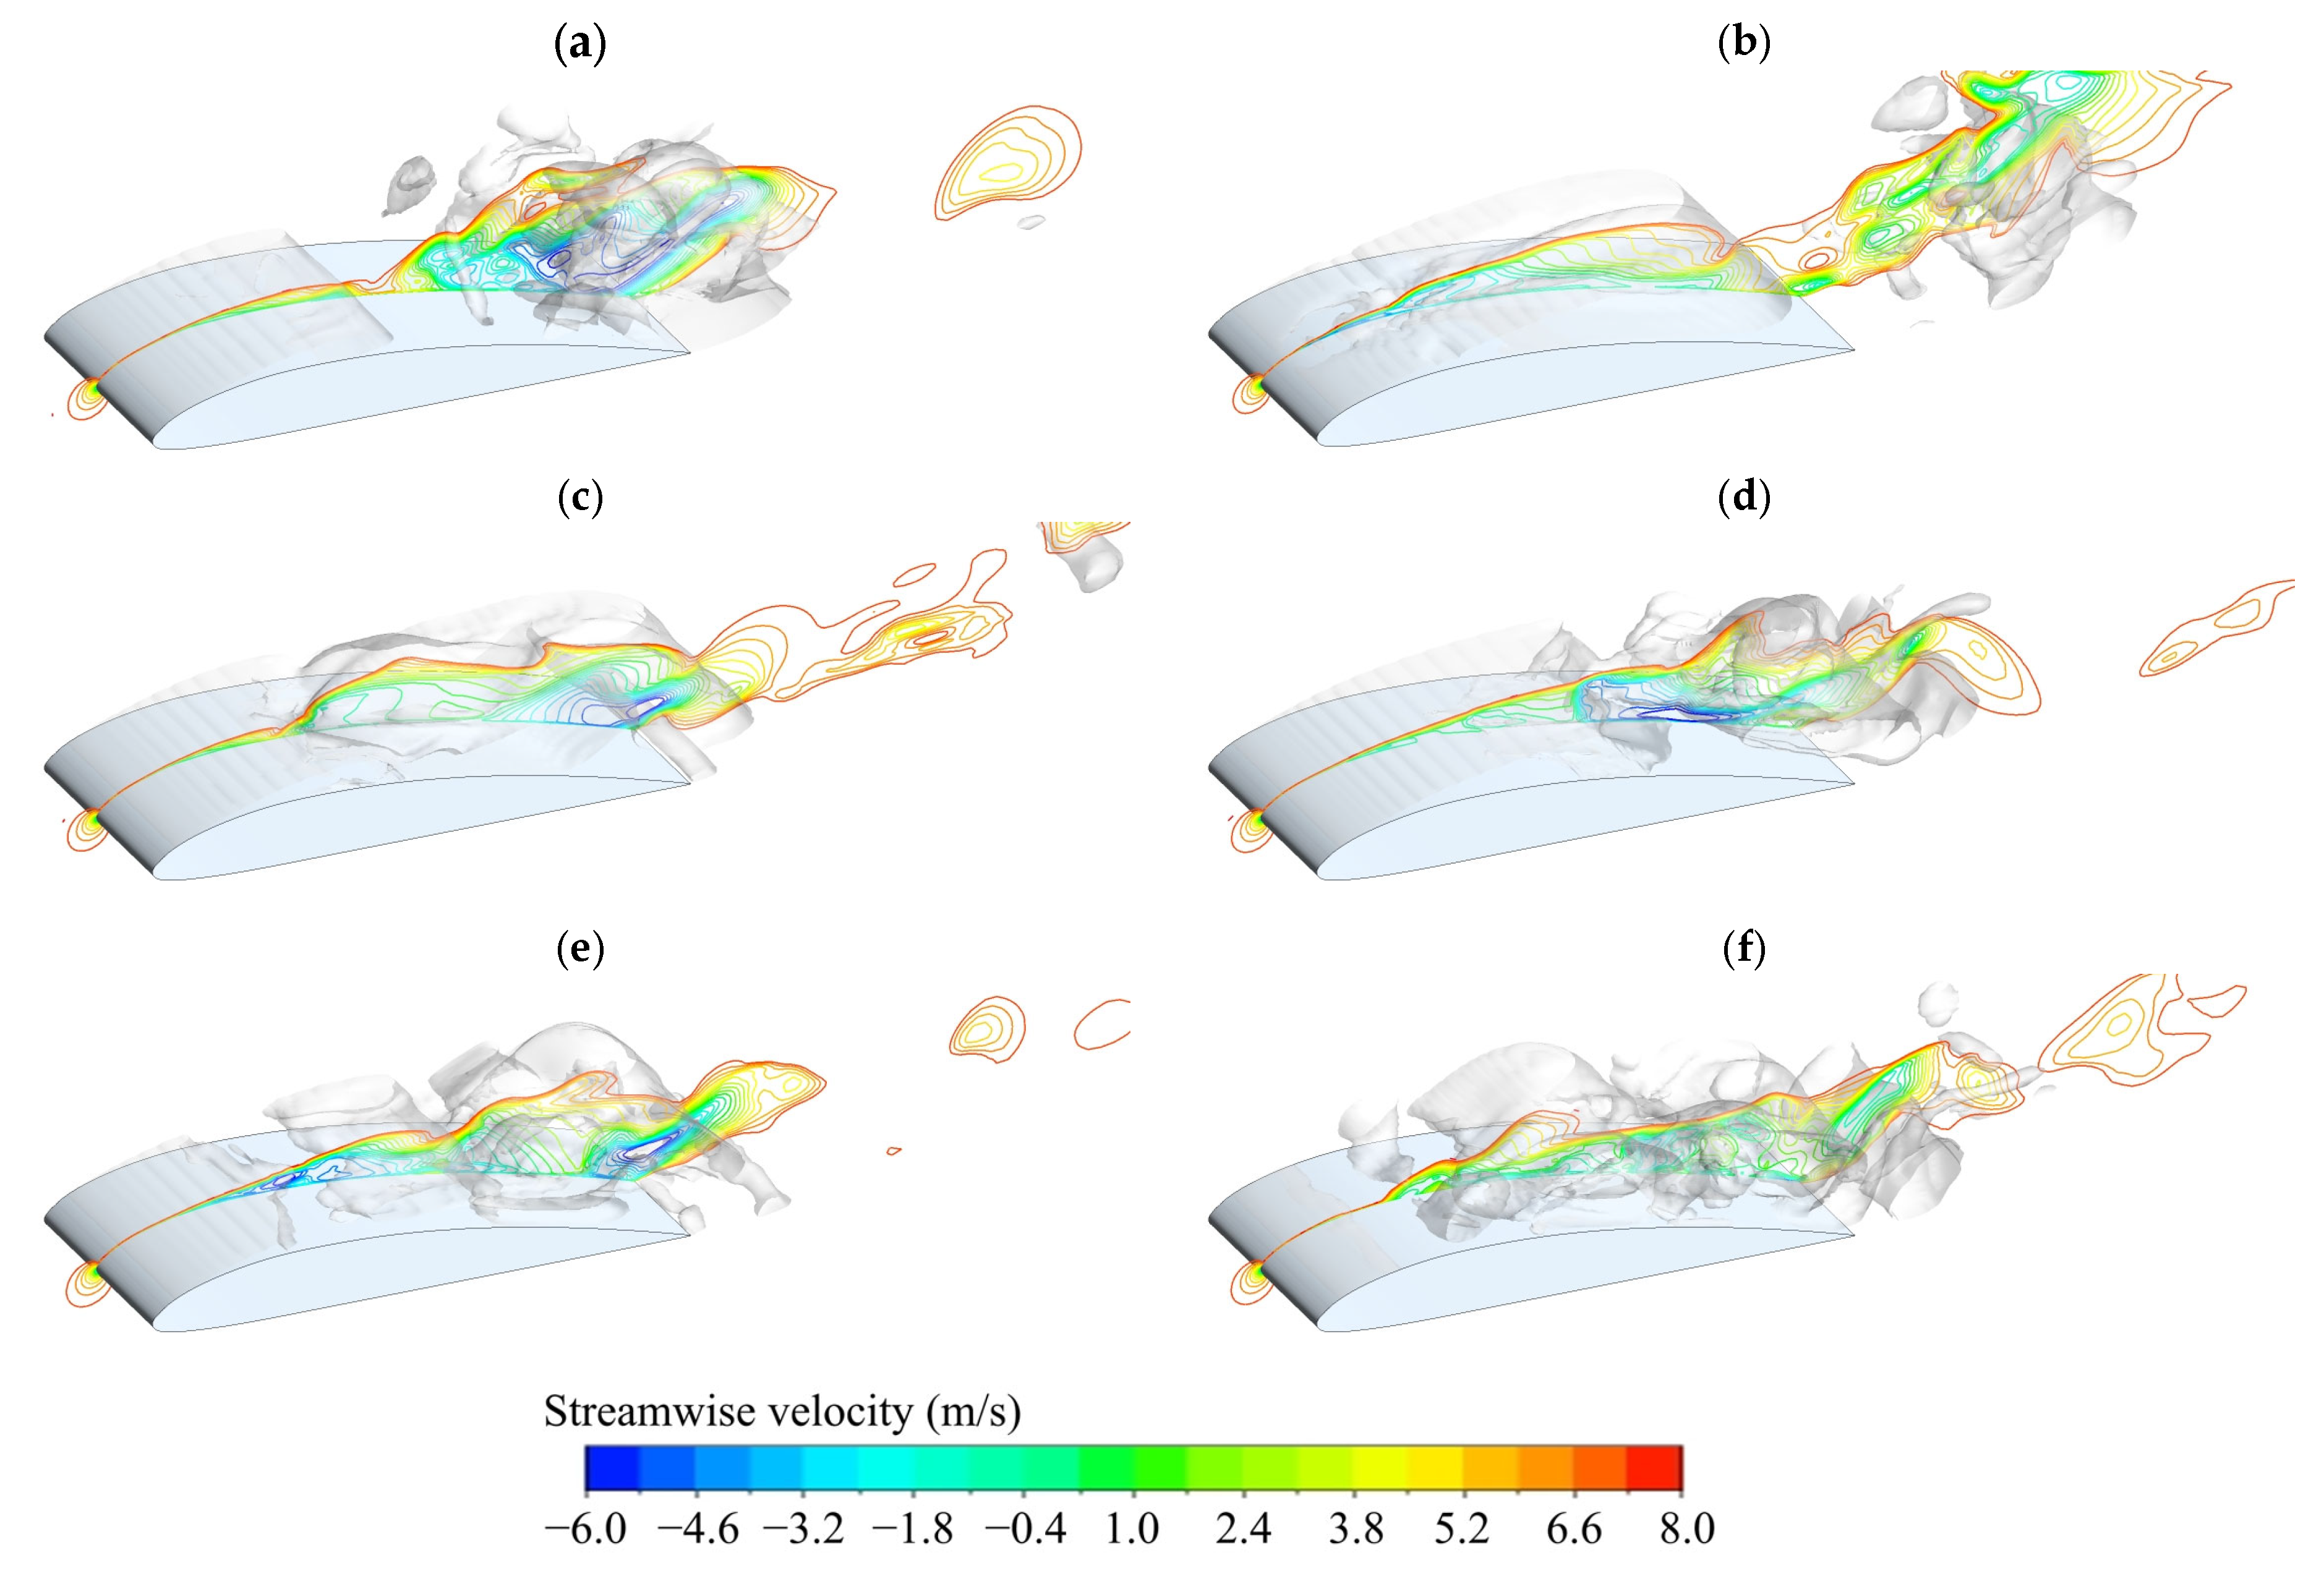
The spatial–temporal evolution of the cavitating flow around the Clark-Y hydrofoil is illustrated in Figure 8. The gray-shaded region denotes the cavity, represented by the iso-surface of vapor volume fraction αv = 0.1, while the contours at the mid-span section show the streamwise velocity distribution around the cavitation. Strong coupling between cavitation dynamics and local velocity fields is clearly demonstrated in these figures. The evolution process can be divided into three distinct stages: the development stage, the shedding stage, and the propagation stage.
In the development stage (t0 to t0 + 2/6 Tc), a sheet cavity forms along the suction side of the hydrofoil and gradually extends downstream from the leading edge. Both the length and thickness of the sheet cavity increase continuously, reaching their maximum extent at t0 + 2/6 Tc. During this period, the velocity distribution within the cavity evolves noticeably. At t0, the flow inside the sheet cavity remains relatively stable, but by t0 + 2/6 Tc, a re-entrant jet emerges near the cavity closure region, characterized by locally negative velocity components. This re-entrant jet interacts with the coming flow, inducing vortical structures that disturb the integrity of the sheet cavity.
In the shedding stage (from t0 + 2/6 Tc to t0 + 4/6 Tc), the sheet cavity begins to break up due to the upstream progression of the re-entrant jet. This ultimately leads to the detachment of the cavity and its transition into a cloud cavity by t0 + 4/6 Tc. The cavitation structures near the trailing edge exhibit complex patterns resulting from strong vortex interactions and turbulence. The re-entrant jet plays a pivotal role in this process by detaching the sheet cavity from the hydrofoil surface and triggering the shedding event.
In the propagation stage (from t0 + 4/6 Tc to t0 + 5/6 Tc), the detached cloud cavity is convected downstream and eventually collapses under the influence of elevated pressure in the wake region. Simultaneously, a new sheet cavity begins to form at the leading edge, repeating the cavitation cycle. The velocity field shows a recovery of positive streamwise velocity as the re-entrant jet weakens following the shedding event. Large-scale vortices within the shedding cavity further interact with the remaining vapor structures, contributing to the complexity of the flow. Overall, the re-entrant jet governs the spatio-temporal evolution of the cavitating flow by modulating both boundary layer separation and vortex dynamics. The correlation between cavitation structures and velocity distribution is evident throughout the entire cycle, highlighting the intricate interaction between re-entrant jet dynamics, vortex formation, and cavity evolution.

4.2. Prediction of Cavitation by U-Net

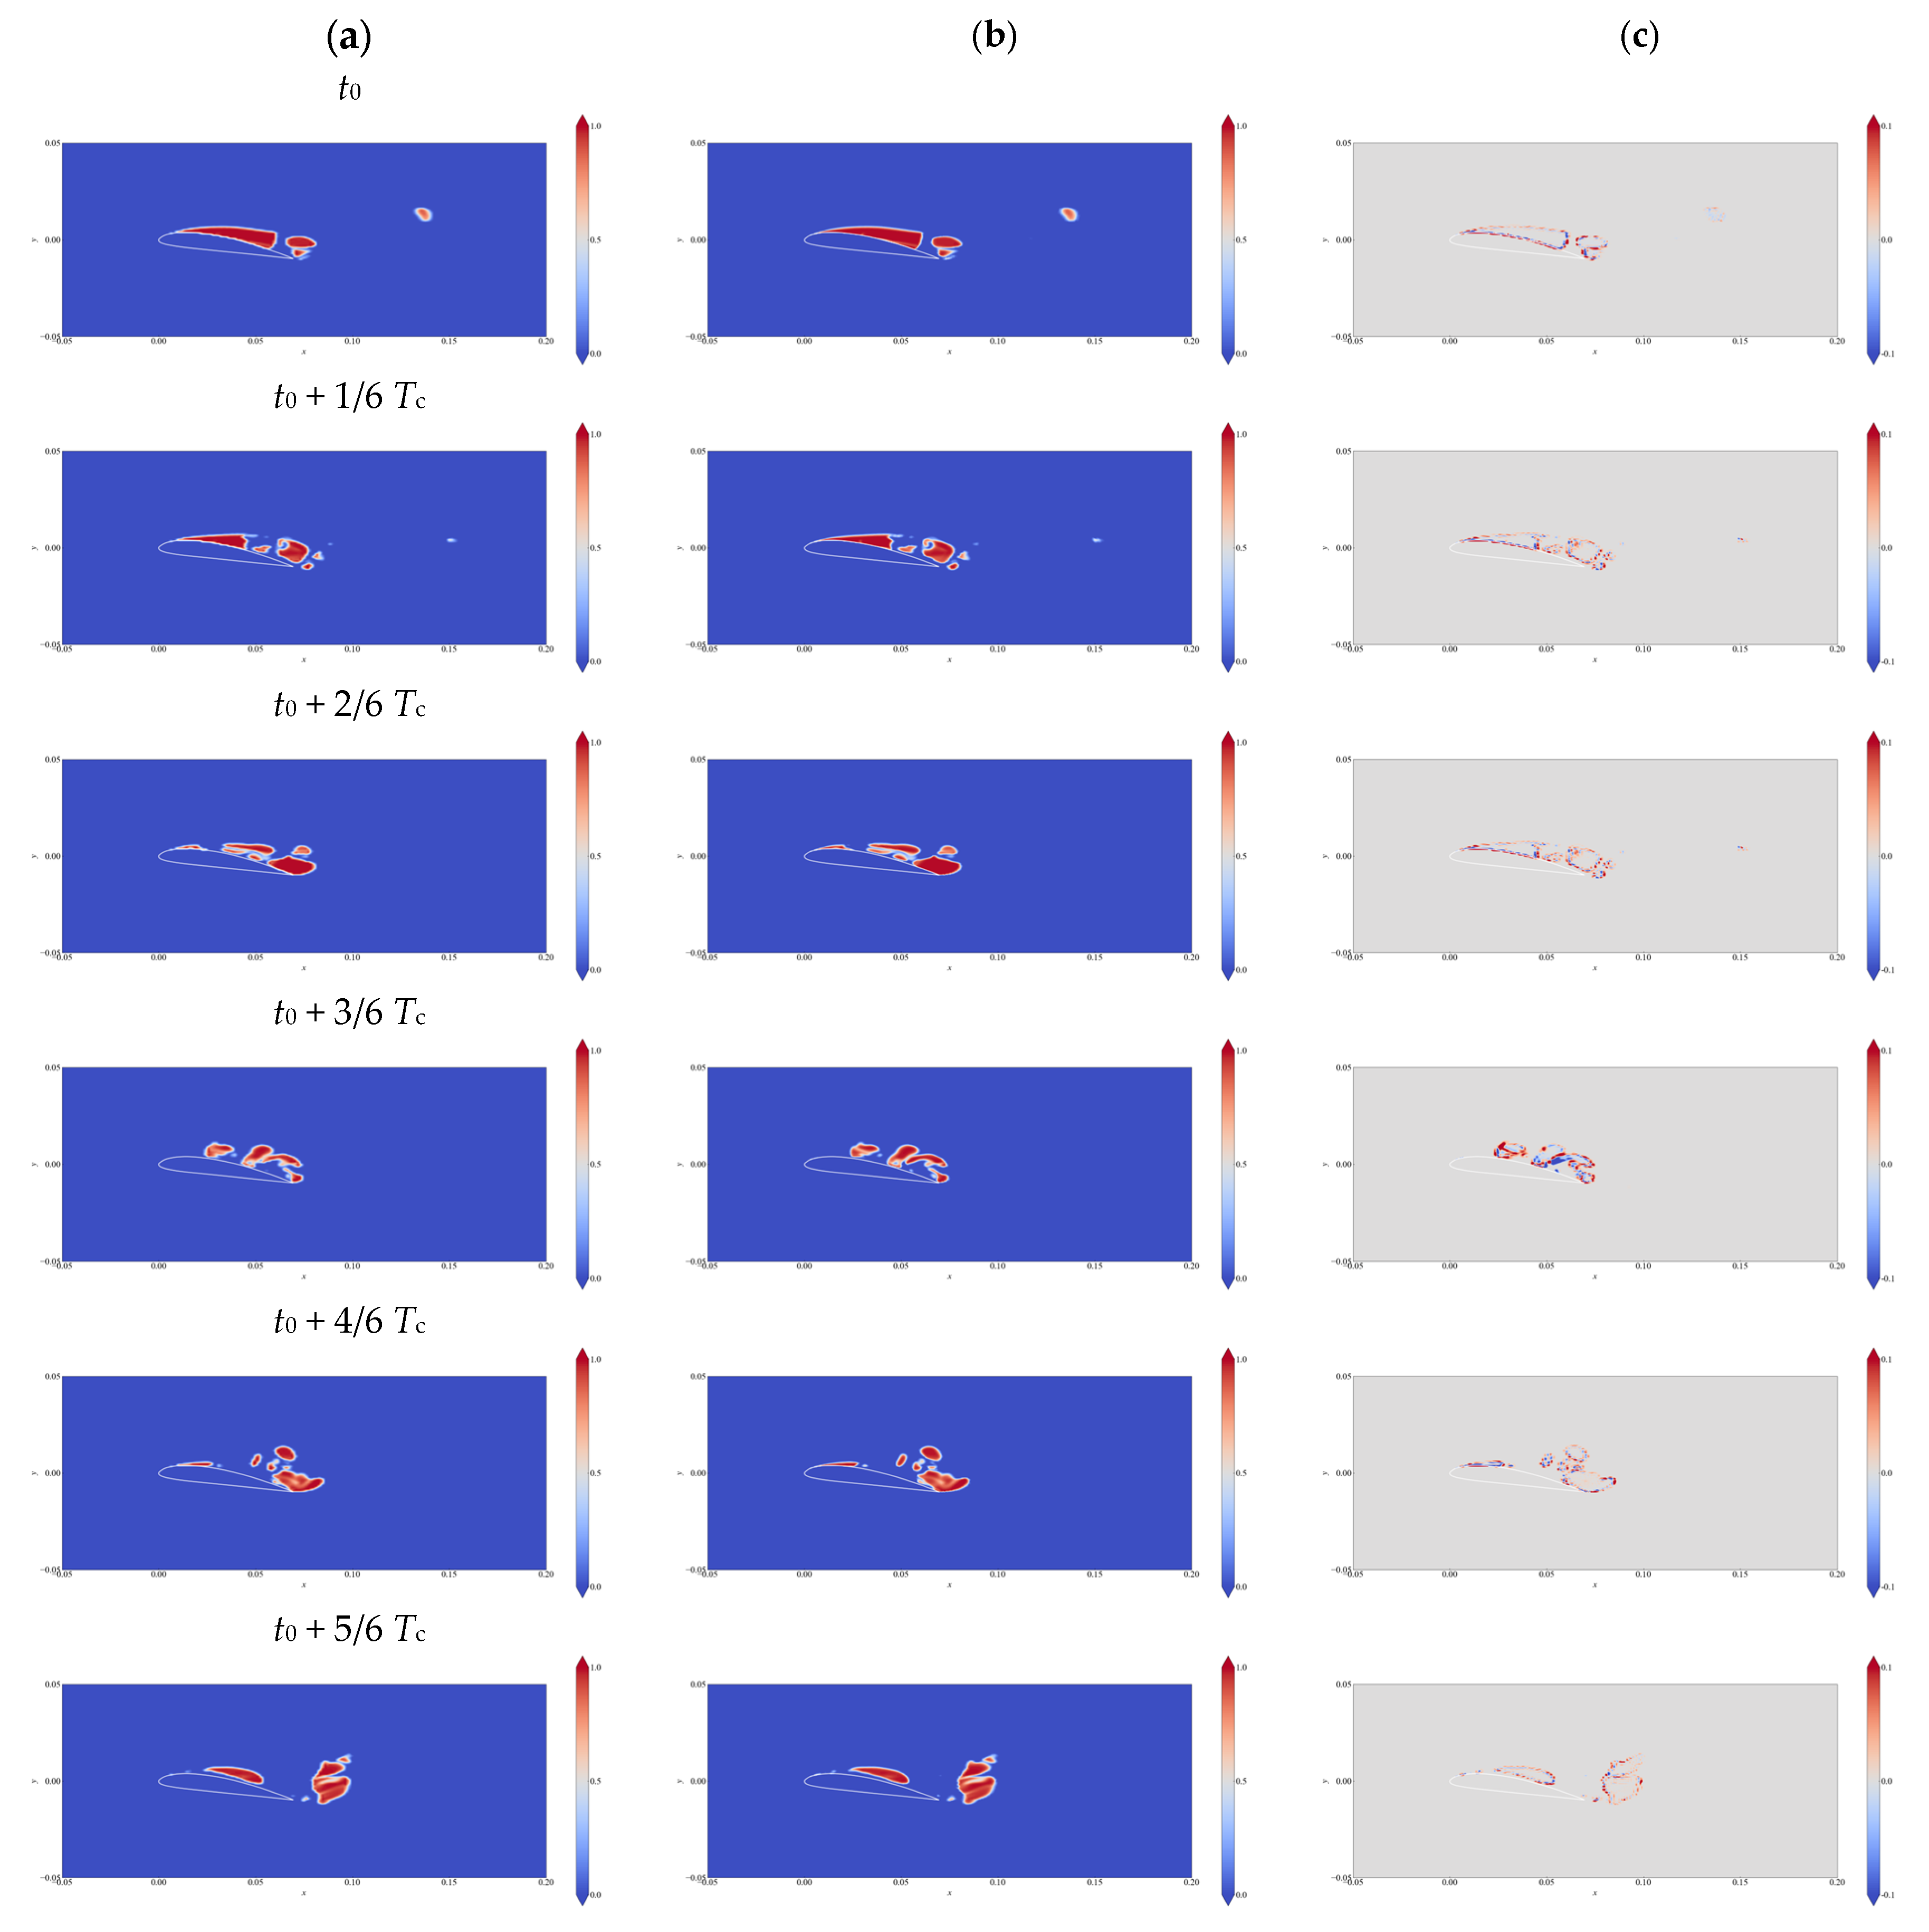
The vapor volume fraction αv,p predicted by the well-trained U-Net, along with the referred cavitation αv of LES and their difference αv,pαv, are plotted in Figure 9. The predicted cavitation shows good agreement with the reference fields. The maximum difference is only around 10%, suggesting that the present U-Net has highly accurate predictive performance. As shown in Figure 9, the U-Net can predict the cavitation fields at all the stages, i.e., inception, developing, shedding, and collapse, showing the good generalizability of the present model. Also, the maximum difference usually appears around the liquid–vapor interface. This is attributed to the dramatic change in the vapor volume fraction around the interfacial region. Although the specific values around the liquid–vapor interface are not accurately predicted, the core region where cavitation exists can always be captured. Therefore, the present U-Net model can predict the characteristics of the cavitation pattern distribution directly according to the velocity field.

4.3. Cavitation–Velocity Correlation

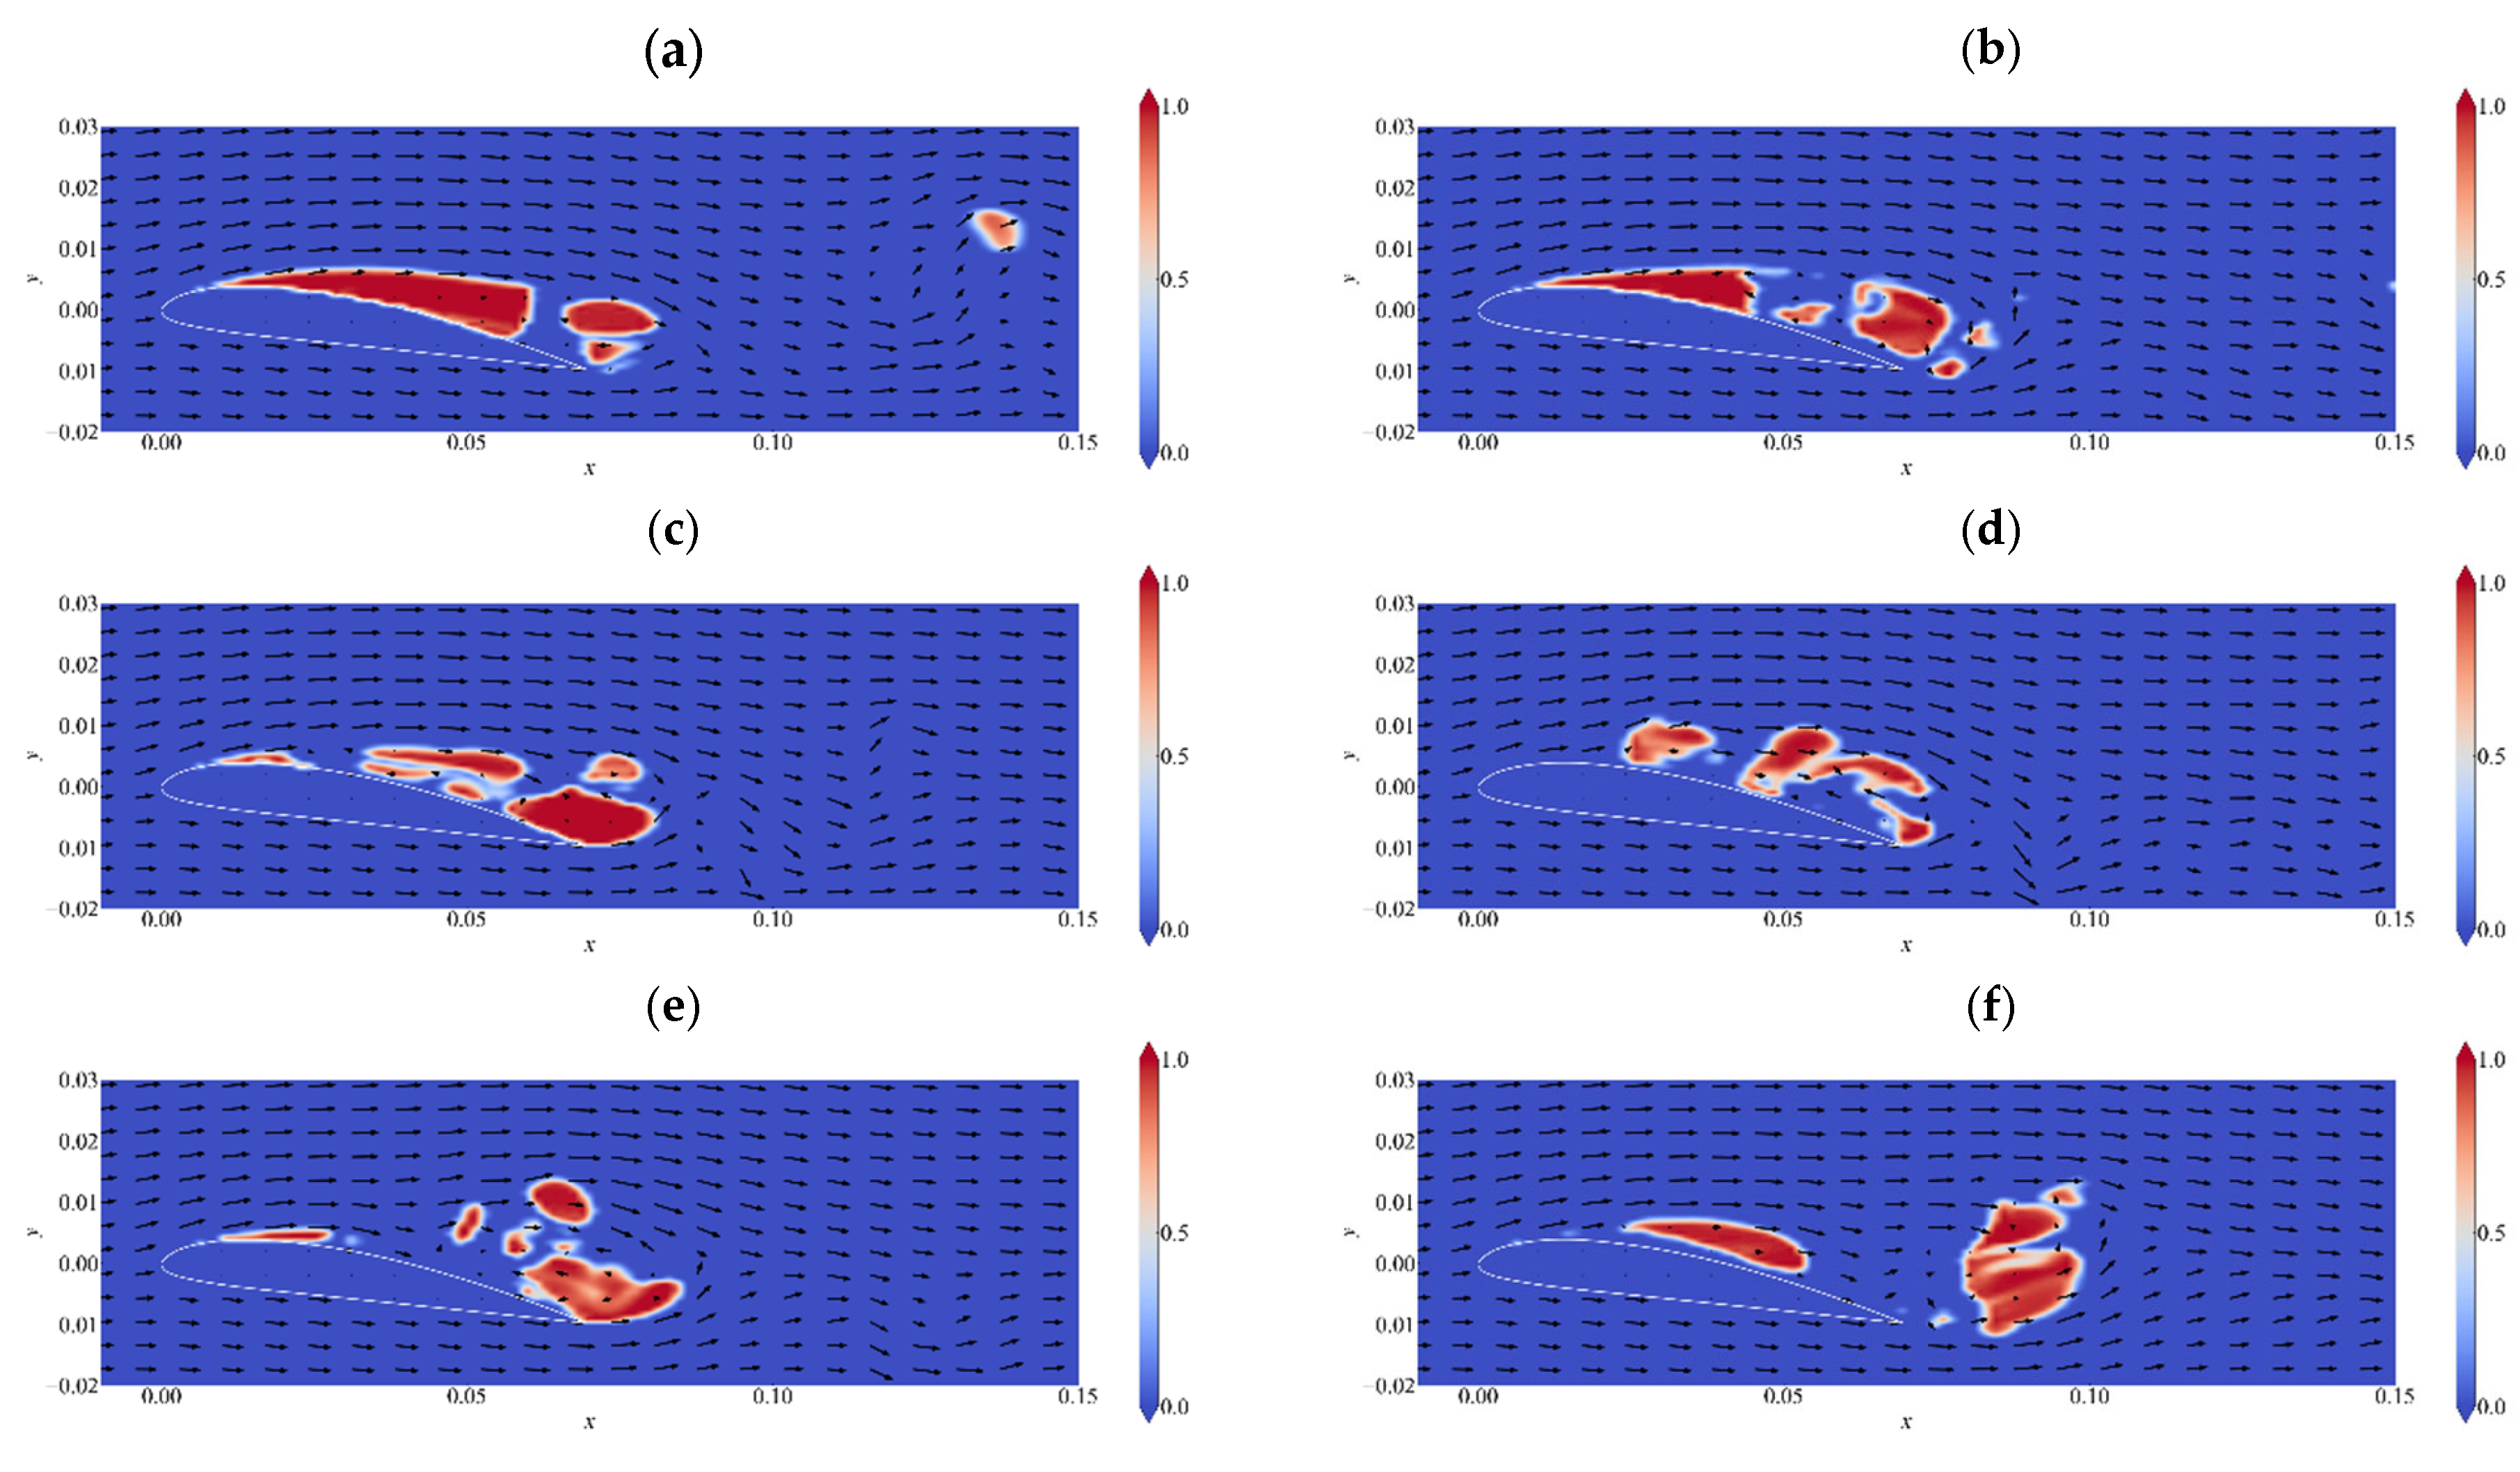
Figure 10 plots the contour of predicted cavitation fields with velocity vectors in a typical cycle from t0 to t0 + 5 ΔT. Common features can be found and summarized from these figures. First, cavitation will not appear in the region with uniform flows. Second, except for the solid region inside the hydrofoil, the location where local velocity is zero tends to indicate that this is the interior part of attached cavitations or cloud cavitations (see Figure 10a–c). In contrast, the presence of shear velocity around this core region of zero velocity reflects the location of the gas–liquid interface. Such cavitation, including attached and cloud cavitation, generally exhibits larger-scale structures due to the inclusion of significant internal zero velocity regions. This phenomenon also suggests that the zero velocity inside the attached cavitation fixes it in a relatively stable stationary state on the hydrofoil suction surface, while the shear velocity at its gas–liquid interface changes its morphology to some extent. In addition, the velocity characteristics of large-scale cloud cavitation suggest that its motion downstream relies mainly on the overall rotation triggered by shear velocity at the gas–liquid interface, rather than on the streamwise velocity inside.
Third, by comparison, the local vortical velocity fields usually suggest the existence of cavitation shedding here (see Figure 10d–f). These cavitations are still relatively small in scale since they just shed from the attached cavitations, and there is no significant zero-velocity region inside the cavitation region. During the process of cavitation shedding, there tends to be a consistent flow velocity in the small-scale cavitation structure, driving it downstream.

5. Conclusions

Large eddy simulations combined with the Schnerr–Sauer cavitation model were performed to simulate the cavitating flows around a Clark-Y hydrofoil. The numerical simulations agree well with experimental measurements of velocity fields by PIV [14]. The temporal-spatial evolution of cavitation with periodical shedding is predicted well.
Simulated snapshots with velocity and cavitation fields were adopted to train a convolutional neural network, U-Net. The velocity and vapor volume fraction fields served as the input and output of the neural network. By defining the L1 loss between the predicted and referred values, the U-Net was considered well trained, showing training and validation losses of around 10−4. The L1 deviation between the vapor volume fraction predicted by the trained U-Net and the reference value is only 0.000179, considering all the snapshots. The cavitation–velocity correlation was analyzed based on the well-trained U-Net. The analysis suggests that the zero-velocity location indicates the interior part of attached and cloud cavitations, and the local vortical velocity fields usually suggest the existence of cavitation shedding.
Although a neural network with two-dimensional input and output was trained in the present study, it would be straightforward to extend it towards three-dimensional fields, while the computational cost and resource requirement for training the network will also increase. We note that the present study confirms the feasibility of predicting cavitation fields using velocity fields. It also suggests the possibility of developing data-driven cavitation models using machine learning techniques. This remains to be addressed in future work.

Author Contributions

Conceptualization, Y.H., M.L. and L.T.; methodology, Y.H. and M.L.; validation, Y.H. and B.H.; investigation, Y.H., B.H. and M.L.; data curation, Y.H. and M.L.; writing—original draft preparation, Y.H. and M.L.; writing—review and editing, B.H. and M.L.; visualization, Y.H. and M.L.; supervision, M.L. and L.T.; project administration, L.T.; funding acquisition, L.T. All authors have read and agreed to the published version of the manuscript.

Funding

This work was supported by the Creative Seed Fund of Shanxi Research Institute for Clean Energy, Tsinghua University.

Data Availability Statement

The data presented in this study are available on request from the corresponding author.

Acknowledgments

Ming LIU would like to express their thanks for the support provided by the International Research Fellow of Japan Society for the Promotion of Science (Postdoctoral Fellowships for Research in Japan (Standard)), Japan Society for the Promotion of Science, Japan.

Conflicts of Interest

The authors declare no conflict of interest.

References

  1. Lu, Y.P.; Tan, L.; Han, Y.D.; Liu, M. Cavitation-vibration correlation of a mixed flow pump under steady state and fast start-up conditions by experiment. Ocean Eng. 2022, 251, 11158. [Google Scholar] [CrossRef]
  2. Sun, W.H.; Tan, L. Cavitation-Vortex-Pressure Fluctuation Interaction in a Centrifugal Pump Using Bubble Rotation Modified Cavitation Model Under Partial Load. ASME J. Fluids Eng. 2020, 142, 051206. [Google Scholar] [CrossRef]
  3. Luo, X.W.; Ji, B.; Tsujimoto, Y. A review of cavitation in hydraulic machinery. J. Hydrodyn. 2016, 28, 335–358. [Google Scholar] [CrossRef]
  4. Kan, K.; Binama, M.; Chen, H.X.; Zheng, Y.; Zhou, D.Q.; Su, W.T.; Muhirwa, A. Pump as turbine cavitation performance for both conventional and reverse operating modes: A review. Renew. Sustain. Energy Rev. 2022, 168, 112786. [Google Scholar] [CrossRef]
  5. Donmez, A.H.; Yumurtaci, Z.; Kavurmacioglu, L. The Effect of Inlet Blade Angle Variation on Cavitation Performance of a Centrifugal Pump: A Parametric Study. ASME J. Fluids Eng. 2019, 141, 021101. [Google Scholar] [CrossRef]
  6. Shen, X.; Zhang, D.; Xu, B.; Shi, W.; van Esch, B.P.M. Experimental and numerical investigation on the effect of tip leakage vortex induced cavitating flow on pressure fluctuation in an axial flow pump. Renew. Energy 2021, 163, 1195–1209. [Google Scholar] [CrossRef]
  7. Han, Y.D.; Tan, L. Experimental investigation on spatial-temporal evolution of tip leakage cavitation in a mixed flow pump with tip clearance. Int. J. Multiph. Flow 2023, 164, 104445. [Google Scholar] [CrossRef]
  8. Han, Y.D.; Tan, L. Spatial-temporal evolution of tip leakage cavitation with double-hump in a mixed flow pump with tip clearance. Phys. Fluids 2023, 35, 045152. [Google Scholar]
  9. Wang, G.; Senocak, I.; Shyy, W.; Ikohagi, T.; Cao, S. Dynamics of attached turbulent cavitating flows. Prog. Aerosp. Sci. 2001, 37, 551–581. [Google Scholar] [CrossRef]
  10. Leroux, J.B.; Astolfi, J.A.; Billard, J.Y. An Experimental Study of Unsteady Partial Cavitation. ASME J. Fluids Eng. 2004, 126, 94–101. [Google Scholar] [CrossRef]
  11. Cervone, A.; Bramanti, C.; Rapposelli, E.; d’Agostino, L. Thermal Cavitation Experiments on a NACA 0015 Hydrofoil. ASME J. Fluids Eng. 2006, 128, 326–331. [Google Scholar] [CrossRef]
  12. Foeth, E.J.; van Doorne, C.W.H.; van Terwisga, T.; Wieneke, B. Time resolved PIV and flow visualization of 3D sheet cavitation. Exp. Fluids 2006, 40, 503–513. [Google Scholar] [CrossRef]
  13. Dular, M.; Bachert, R.; Stoffel, B.; Sirok, B. Experimental evaluation of numerical simulation of cavitating flow around hydrofoil. Eur. J. Mech. B/Fluids 2005, 24, 522–538. [Google Scholar] [CrossRef]
  14. Huang, B.; Young, Y.L.; Wang, G.; Shyy, W. Combined Experimental and Computational Investigation of Unsteady Structure of Sheet/Cloud Cavitation. ASME J. Fluids Eng. 2013, 135, 071301. [Google Scholar] [CrossRef]
  15. Coutier-Delgosha, O.; Fortes-Patella, R.; Rebound, J.L. Evaluation of the Turbulence Model Influence on the Numerical Simulations of Unsteady Cavitation. ASME J. Fluids Eng. 2003, 125, 38–45. [Google Scholar] [CrossRef]
  16. Huang, B.; Zhao, Y.; Wang, G. Large Eddy Simulation of turbulent vortex-cavitation interactions in transient sheet/cloud cavitating flows. Comput. Fluids 2014, 92, 113–124. [Google Scholar] [CrossRef]
  17. Ji, B.; Luo, X.W.; Arndt, R.E.A.; Peng, X.; Wu, Y. Large Eddy Simulation and theoretical investigations of the transient cavitating vortical flow structure around a NACA66 hydrofoil. Int. J. Multiph. Flow 2015, 68, 121–134. [Google Scholar] [CrossRef]
  18. Liu, M.; Tan, L.; Liu, Y.B.; Xu, Y.; Cao, S.L. Large eddy simulation of cavitation vortex interaction and pressure fluctuation around hydrofoil ALE 15. Ocean. Eng. 2018, 163, 264–274. [Google Scholar] [CrossRef]
  19. Liu, M.; Tan, L.; Caso, S.L. Cavitation-Vortex-Turbulence Interaction and One-Dimensional Model Prediction of Pressure for Hydrofoil ALE15 by Large Eddy Simulation. ASME J. Fluids Eng. 2019, 141, 021103. [Google Scholar] [CrossRef]
  20. Lord Rayleigh, O.M.F.R.S. On the pressure developed in a liquid during the collapse of a spherical cavity. Lond. Edinb. Dublin Philos. Mag. J. Sci. 1917, 34, 94–98. [Google Scholar] [CrossRef]
  21. Plesset, M.S. The dynamics of cavitation bubbles. ASME J. Appl. Mech. 1949, 16, 228–231. [Google Scholar] [CrossRef]
  22. Singhal, A.; Athavale, M.; Li, H.; Jiang, Y. Mathematical basis and validation of the full cavitation model. ASME J. Fluids Eng. 2002, 124, 617–624. [Google Scholar] [CrossRef]
  23. Zwart, P.; Gerber, A.; Belarmri, T. A two-phase flow model for predicting cavitation dynamics. In Proceedings of the 5th International Conference on Multiphase Flow, Yokohama, Japan, 30 May–3 June 2004. [Google Scholar]
  24. Sauer, J.; Schnerr, G. Unsteady cavitating flow-a new cavitation model based on a modified front capturing method and bubble dynamics. In Proceedings of the ASME Fluids Engineering Summer Conference, Boston, MA, USA, 11–15 June 2000. [Google Scholar]
  25. Schnerr, G.; Sauer, J. Physical and numerical modeling of unsteady cavitation dynamics. In Proceedings of the 4th International Conference on Multiphase Flow, New Orleans, LA, USA, 27 May–1 June 2001. [Google Scholar]
  26. Zhao, Y.; Wang, G.; Huang, B.; Wu, Q. Lagrangian investigations of vortex dynamics in time-dependent cloud cavitating flows. Int. J. Heat Mass Transf. 2016, 93, 167–174. [Google Scholar] [CrossRef]
  27. Tseng, C.C.; Liu, P.B. Dynamic behaviors of the turbulent cavitating flows based on the Eulerian and Lagrangian viewpoints. Int. J. Heat Mass Transf. 2016, 102, 479–500. [Google Scholar] [CrossRef]
  28. Long, X.; Cheng, H.; Ji, B.; Arndt, R.E.A.; Peng, X. Large eddy simulation and Euler–Lagrangian coupling investigation of the transient cavitating turbulent flow around a twisted hydrofoil. Int. J. Multiph. Flow 2018, 100, 41–56. [Google Scholar] [CrossRef]
  29. Berkooz, G.; Holmes, P.; Lumley, J.L. The proper orthogonal decomposition in the analysis of turbulent flows. Annu. Rev. Fluid Mech. 1993, 25, 539–575. [Google Scholar] [CrossRef]
  30. Meyer, K.E.; Pedersen, J.M.; Ozcan, O. A turbulent jet in cross flow analysed with proper orthogonal decomposition. J. Fluid Mech. 2007, 583, 199–227. [Google Scholar] [CrossRef]
  31. Schmid, P.J. Dynamic mode decomposition of numerical and experimental data. J. Fluid Mech. 2010, 656, 5–28. [Google Scholar] [CrossRef]
  32. Schmid, P.J. Application of the dynamic mode decomposition to experimental data. Exp. Fluids 2011, 50, 1123–1130. [Google Scholar] [CrossRef]
  33. Liu, M.; Tan, L.; Cao, S. Dynamic mode decomposition of cavitating flow around ALE 15 hydrofoil. Renew. Energy 2019, 139, 214–227. [Google Scholar] [CrossRef]
  34. Yin, T.; Pavesi, G.; Yuan, S. Numerical investigation of unsteady cavitation around a twisted hydrofoil. Int. J. Multiph. Flow 2021, 135, 103506. [Google Scholar] [CrossRef]
  35. De Giorgi, M.G.; Fontanarosa, D.; Ficarella, A. Characterization of unsteady cavitating flow regimes around a hydrofoil, based on an extended Schnerr–Sauer model coupled with a nucleation model. Int. J. Multiph. Flow 2015, 115, 158–180. [Google Scholar] [CrossRef]
  36. Brunton, S.L.; Noack, B.R.; Koumoutsakos, P. Machine Learning for Fluid Mechanics. Annu. Rev. Fluid Mechanics 2020, 52, 477–508. [Google Scholar] [CrossRef]
  37. Kim, H.; Kim, J.; Won, S.; Lee, C. Unsupervised deep learning for super-resolution reconstruction of turbulence. J. Fluid Mech. 2021, 910, A29. [Google Scholar] [CrossRef]
  38. List, B.; Chen, L.W.; Thuerey, N. Learned turbulence modelling with differentiable fluid solvers: Physics-based loss functions and optimisation horizons. J. Fluid Mech. 2022, 949, A25. [Google Scholar] [CrossRef]
  39. Nicoud, F.; Ducros, F. Subgrid-scale stress modelling based on the square of the velocity gradient tensor. Flow Turbul. Combust. 1999, 62, 183–200. [Google Scholar] [CrossRef]
  40. Long, X.P.; Cheng, H.Y.; Ji, B.; Arndt, R.E. Numerical investigation of attached cavitation shedding dynamics around the Clark-Y hydrofoil with the FBDCM and an integral method. Ocean Eng. 2017, 137, 247–261. [Google Scholar] [CrossRef]
  41. Long, Y.; Long, X.P.; Ji, B.; Xing, T. Verification and validation of Large Eddy Simulation of attached cavitating flow around a Clark-Y hydrofoil. Int. J. Multiph. Flow 2019, 115, 93–107. [Google Scholar] [CrossRef]
  42. Ronneberger, O.; Fischer, P.; Brox, T. U-Net: Convolutional Networks for Biomedical Image Segmentation. Int. Conf. Med. Image Comput. Comput.-Assist. Interv. 2015, 9351, 234–241. [Google Scholar]
  43. Thuerey, N.; Weibenow, K.; Prandtl, L.; Hu, X. Deep Learning Methods for Reynolds-Averaged Navier–Stokes Simulations of Airfoil Flows. AIAA J. 2020, 58, 25–36. [Google Scholar] [CrossRef]
  44. Paszke, A.; Gross, S.; Massa, F.; Lerer, A.; Bradbury, J.; Chanan, G.; Killeen, T.; Gimelshein, N.; Antiga, L.; Desmaison, A.; et al. PyTorch: An imperative style, high-performance deep learning library. In Proceedings of the 33rd International Conference on Neural Information Processing Systems, Red Hook, NY, USA, 8 December 2019; Volume 721, pp. 8026–8037. [Google Scholar]
Figure 1. Schematic of computational domain.
Fluids 10 00213 g001
Figure 2. Mesh arrangement of the hydrofoil.
Fluids 10 00213 g002
Figure 3. Comparison of transient cavitation patterns between experiment [14] (left) and numerical simulation (right) at (a) 1/8Tc, (b) 2/8Tc, (c) 3/8Tc, (d) 4/8Tc, (e) 5/8Tc, (f) 6/8Tc, (g) 7/8Tc, and (h) 8/8Tc. Here, the cavitation by numerical simulation is plotted by the iso-surface of vapor volume fraction, with a value of 0.1.
Fluids 10 00213 g003
Figure 4. Comparison of streamwise velocity between numerical and experimental results at locations of x/C = (a) 0.2, (b) 0.4, (c) 0.6, (d) 0.8, and (e) 1.0.
Fluids 10 00213 g004
Figure 5. Contour of vapor volume fraction on the plane z = 0.0105 (a) from LES and (b) after mapping onto Cartesian grids.
Fluids 10 00213 g005aFluids 10 00213 g005b
Figure 6. The entire neural network architecture of the present U-Net.
Fluids 10 00213 g006
Figure 7. History of training and validation losses versus epochs.
Fluids 10 00213 g007
Figure 8. From (a) t0 to (b) t0 + 1/6 Tc, (c) t0 + 2/6 Tc, (d) t0 + 3/6 Tc, (e) t0 + 4/6 Tc, and (f) t0 + 5/6 Tc.
Fluids 10 00213 g008
Figure 9. Contour of cavitation fields by (a) U-Net, (b) LES, and (c) their difference.
Fluids 10 00213 g009
Figure 10. Contour of predicted cavitation fields with velocity vectors from (a) t0 to (b) t0 + 1/6 Tc, (c) t0 + 2/6 Tc, (d) t0 + 3/6 Tc, (e) t0 + 4/6 Tc, and (f) t0 + 5/6 Tc.
Fluids 10 00213 g010
Disclaimer/Publisher’s Note: The statements, opinions and data contained in all publications are solely those of the individual author(s) and contributor(s) and not of MDPI and/or the editor(s). MDPI and/or the editor(s) disclaim responsibility for any injury to people or property resulting from any ideas, methods, instructions or products referred to in the content.