1. Introduction
Two-phase flows are prevalent in a wide range of industrial applications, including the thermal management of advanced electronic components such as microprocessors and data centers [
1], oil and gas production and processing [
2,
3,
4], solar and nuclear energy systems [
5,
6,
7,
8], metallurgical industry [
9,
10], and power electronics in hybrid vehicles [
11]. The complexity of two-phase flow arises from the interplay of multiple physical phenomena—such as heat transfer, phase change (evaporation and condensation), capillarity, and bubble dynamics—within a single system. As a result, the accurate modeling of two-phase flows remains a significant challenge for both experimental and numerical approaches.
Bubble dynamics have been numerically investigated through a multiscale modeling framework to better understand nucleate boiling heat transfer on nanofabricated porous surfaces. The results demonstrated that negative pressure generated by nanoscale evaporation significantly enhances liquid transport through the porous coating, promoting more efficient bubble departure and heat transfer [
12]. An experimental study investigated the bubble behavior in proton-exchange-membrane water electrolyzers to enhance cell efficiency [
13]. In another application, bubble dynamics play a role in the washing of Bio-Heavy oils—fuels used in power generation that contain elevated levels of sodium and potassium, which can cause nozzle clogging and combustion-related operational issues. The introduction of
bubbles has been shown to effectively reduce the concentration of these contaminants [
14].
The presence of two-phase flow in a broad range of engineering systems has driven extensive research efforts—both computational and experimental—aimed at elucidating the dynamics of bubbles and droplets. Particular attention has been devoted to bubble coalescence and breakup, as these phenomena can substantially alter the interfacial area between the gas and liquid phases, thereby influencing mass transfer rates and the kinetics of chemical reactions.
Over several decades, numerous experimental studies have investigated the rising behavior of bubbles, leading to the development of empirical correlations for terminal velocity and bubble shape that remain benchmarks today [
15,
16,
17]. However, capturing detailed velocity and pressure fields in the surrounding fluid is more effectively achieved through numerical simulations.
In numerical modeling, various interface-capturing and interface-tracking methods have been employed to study bubble dynamics under diverse conditions. The Lattice Boltzmann method (LBM) has been extensively utilized to simulate three-dimensional bubble dynamics, particularly in scenarios involving significant density ratios. In [
18], it was demonstrated that in quiescent fluids, smaller bubbles’ trajectories are notably influenced by the presence of larger ones. In [
19], a diffuse-domain phase-field Lattice Boltzmann method (DD-CCPFLB) was introduced for simulating two-phase flows in complex geometries. By coupling the diffuse-domain approach with a consistent and conservative phase-field model, the method integrates boundary conditions as source terms, facilitating implementation on regular grids without specialized boundary treatments. Validation against benchmark problems demonstrated the method’s accuracy in capturing droplet dynamics, including deformation and breakup in Y-shaped channels and interactions with cylindrical obstacles. One disadvantage of the Lattice Boltzmann method is that the method struggles with high specific mass ratios, needing additional strategies to bypass this issue [
20].
Front-capturing methods, notably the Volume of Fluid (VOF) and Level Set (LS) techniques, have been extensively employed to simulate three-dimensional gas–liquid flows involving multiple bubble configurations, capturing effects such as bubble spacing, size, arrangement, and shear forces [
21]. The VOF method has demonstrated success in modeling slug flows within circular microchannels, providing insights into wall-to-bubble heat transfer, surface tension, and evaporation mechanisms. Recent advancements include the development of adaptive mesh refinement strategies to enhance the accuracy of VOF simulations in complex geometries [
22]. Similarly, the LS method has been utilized to simulate bubble interactions under tilted and gravity-driven flows in vertical channels, revealing tendencies for bubbles to coalesce and migrate toward the channel center [
23]. Innovations such as the convected level-set method have improved interface tracking by combining reinitialization and convection processes [
24,
25]. Hybrid approaches that couple LS and VOF methods have been developed to better capture the transition from isolated to confined bubbly flows in microchannels, particularly under boiling conditions [
26]. Despite these advancements, challenges remain in accurately recovering interfaces, especially in three-dimensional simulations, prompting ongoing research to refine these methods [
27].
Conversely, front-tracking methods, which explicitly represent interfaces, offer a robust alternative for simulating dispersed multiphase flows, particularly in complex geometries. The Arbitrary Lagrangian–Eulerian (ALE) technique has been employed to study bubble dynamics in various configurations, including axisymmetric and three-dimensional domains, as well as environments confined by smooth or sinusoidally corrugated boundaries [
28]. Key metrics such as rising velocity, film thickness, and temporal perimeter variations have been analyzed to understand bubble behavior. Comparative studies between ALE and decoupled interface methods have demonstrated both approaches’ accuracy, noting that the decoupled method requires refined meshing near interfaces to maintain precision [
29].
In this paper, we utilize an established numerical tool based on the front-tracking method to simulate the behavior of a single gas bubble subjected to forced flow within a channel with complex geometrical configurations. The term “complex” refers to the fact that the geometries simulated are different than the standard geometries used in, for instance, the Finite-Difference Method, which are restricted to simple geometric structures (rectangles, circles, cylinders). Since the geometries have convergent/divergent sections, as well as curves, we believe that standard methods cannot deal with such numerical domains.
The current formulation is a three-dimensional extension of the decoupled formulation presented in [
29] which builds on the front-tracking method introduced by [
30]. The method used combines an explicit treatment of the material derivative—the semi-Lagrangian approach—with an uncoupled mesh strategy capable of operating on unstructured meshes without the need to remesh the fluid domain. It employs the finite-element method and models surface tension using the Laplace–Beltrami operator. Previous front-tracking efforts were presented on regular structured meshes, with the original work employing a two-dimensional grid. The main contribution of this article lies in the successful validation of representative test cases and the accurate dynamic simulations achieved with the proposed methodology, capturing complex interface evolutions. Our focus is on analyzing the bubble’s trajectory, shape evolution, and interaction with the surrounding fluid, aiming to enhance the understanding of bubble dynamics across different geometric variations.
The choice of geometries was motivated by both practical relevance and methodological goals. Converging, diverging, and curved circular channel configurations are common in a wide range of engineering applications, including microfluidic devices, liquid–gas reactors, and heat exchangers. These test cases were designed to showcase the solver’s performance under realistic, challenging conditions. The accuracy and stability of the proposed method have been thoroughly validated in the first author’s PhD thesis [
31] and in our recent article [
32], which include convergence tests and comparisons with analytical benchmarks. The current results build on this foundation, demonstrating the solver’s capacity to handle complex interface dynamics, large density ratios, and realistic geometrical constraints.
2. Methods
To simulate the flow in complex geometries addressed in this study, the “one-fluid” formulation is employed. This approach utilizes a single set of the incompressible Navier–Stokes equations to represent the entire computational domain, encompassing all fluid regions regardless of phase. The distinct fluid regions are characterized by spatially varying properties, such as density and viscosity, which are locally determined using a Heaviside function defined with respect to the fluid interface. Although the current finite-element discretization can capture turbulence effects, the mesh resolution required to do so accurately is computationally prohibitive. Therefore, the problems are treated as laminar. Accordingly, the non-dimensional Navier–Stokes equations governing the incompressible flow in these geometries are presented below:
where
and
are the specific mass and viscosity, respectively, as functions of the spatial coordinate
;
is the velocity with components u, v, w;
t is the time;
p is the pressure;
is the gravity force;
is the surface tension coefficient;
is the Dirac-delta function related to the interface location;
is the interface curvature; and
is the outward unit vector normal to the interface.
T stands for transposed—in this case applied to the velocity gradient.
The equations above are also function of non dimensional groups, which appear during the non-dimensionalization procedure. These non-dimensional groups are the Reynolds number, the Froude number, and the Weber number. The Reynolds number can be understood as the ratio of inertial forces against viscous forces. A high Reynolds number indicates that flow is dominated by convection, whereas a low Reynolds number suggests that diffusion is the dominant effect. The Weber number indicates the influence of the surface tension created by fluid interfaces. A low Weber number indicates the flow will be more strongly shaped by the surface tension forces. Finally, the Froude number measures the influence of gravitational forces on the fluid, where lower numbers indicate a stronger gravitational influence. These numbers are given by
where
and
are the specific mass and viscosity of the continuous phase,
is the reference velocity (the bubble’s terminal velocity),
L is the reference length (bubble diameter),
is the reference surface tension of the continuous phase, and
the reference gravity acceleration, usually
.
The Navier–Stokes equations described above are solved through the finite-element and the Galerkin methods. For this formulation, a validity domain given by
is considered, along with the boundary conditions given by Equations (
4) and (
5). The first condition characterizes a prescribed velocity on the boundary
, while the second addresses a condition of zero tangential velocity and normal stress on the boundary
.
Let
be the space of quadratically integrable functions over the domain
, given by Equation (
6).
Let us also take the Sobolev space
, given by Equation (
7), and its analog
for n-dimensional vectors, given by the Cartesian product between
spaces, according to Equation (
8).
Let the subspaces
and
be defined by Equations (
9) and (
10), where
and
are the velocity and pressure contours, respectively.
The variational formulation of the Navier–Stokes equations is obtained by multiplying Equations (
1) and (
2) by the weight functions
and
q. The final equations are shown in Equations (
11) and (
12).
The problem consists of finding the solutions
and
that satisfy Equations (
11) and (
12) for all
and for all
.
The non-linear convective term is handled explicitly using a first-order semi-Lagrangian scheme [
33,
34], which ensures unconditional stability and maintains the symmetry of the linear system of equations. Body forces due to surface tension and gravity are also incorporated explicitly into the resulting linear system. Although Equation (
12) accounts for spatially varying fluid properties, these variations are not resolved within the interior of each finite element; instead, properties such as density and viscosity are approximated using an arithmetic average of their nodal values within each element.
The finite-element space adopted in this work is the Taylor–Hood “mini” element, commonly referred to as P1P1+ [
35]. This element is geometrically represented by a tetrahedron with degrees of freedom located at the four vertices and an additional degree of freedom at the centroid, making it one of the simplest Ladyzhenskaya–Babuska–Brezzi (LBB)-stable elements suitable for implementation [
36]. It is employed to discretize the three-dimensional volume domain, which includes the complex interior of the microchannel. In contrast, the interface between fluid phases is discretized using linear triangular elements, forming a three-dimensional surface mesh that evolves over time.
The methodology used in this paper uses an explicit treatment of the material derivative—the semi-Lagrangian—which is unconditionally stable, with no restriction on Reynolds number or time step. The explicit treatment of surface tension adds strong time-step constraint, therefore simulations with very high surface tension (low We numbers) can make the numerical simulation unfeasible computationally, depending on mesh size and resolution. Moreover, due to the explicit treatment of the interface, strong surface mesh deformation is not handled well by the current numerical implementation. Additionally, the current state of the developed code does not handle topology change, such as break-up and coalescence.
Nodes on the interface (surface) mesh are not shared with those of the fluid (volume) mesh, ensuring that both discretizations remain uncoupled. The interaction between them is established through a purely Lagrangian advection of the interface mesh, driven by the local fluid velocity. In return, the surface tension forces computed at the interface nodes are projected onto nearby nodes of the fluid mesh, enabling the incorporation of surface tension into the momentum equations. The curvature at the interface is approximated using a discrete form of the Laplace–Beltrami operator, applied to the closed surface mesh.
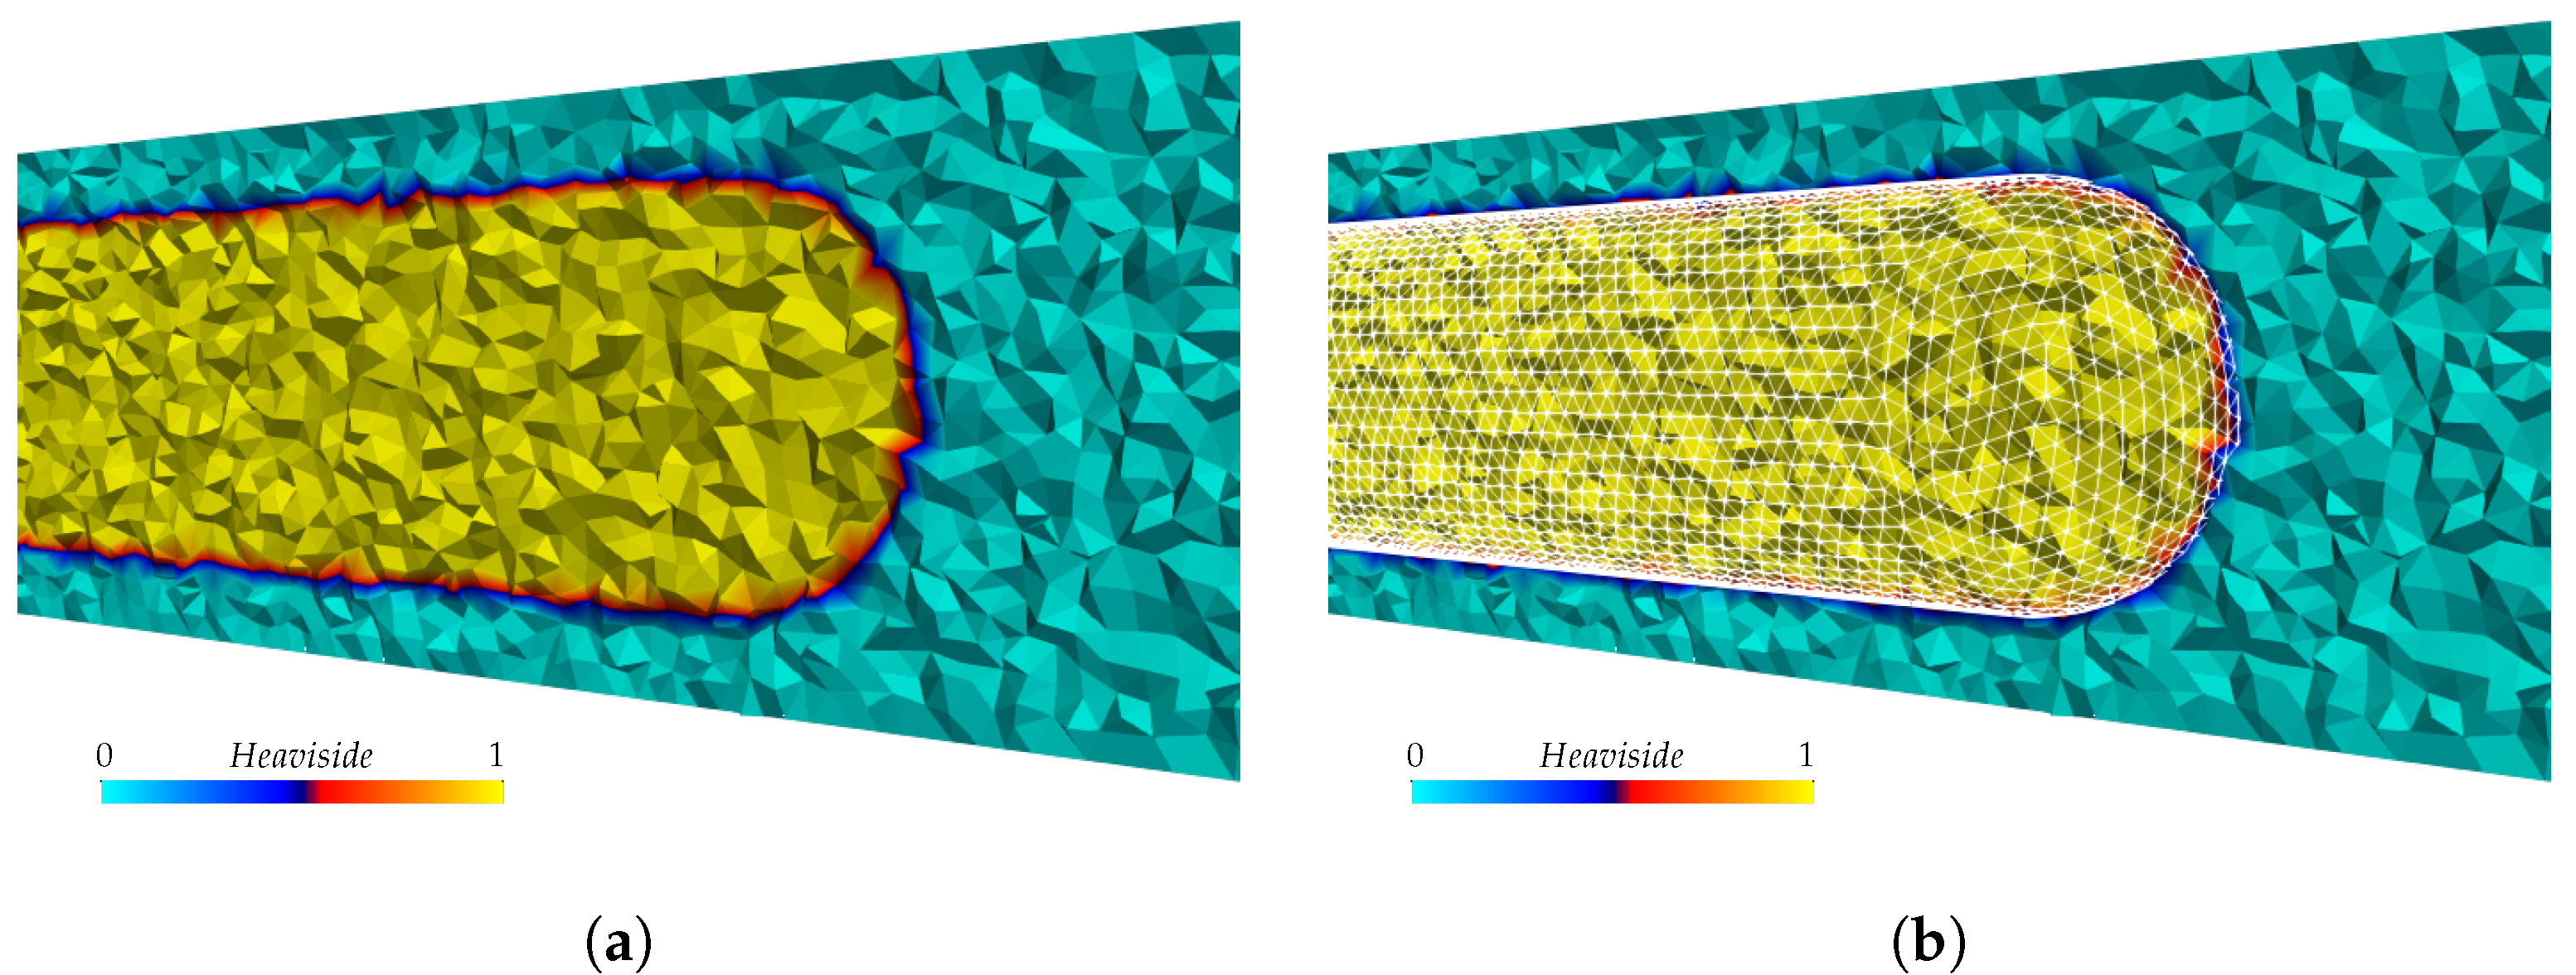
The fluid interface is represented by a three-dimensional surface mesh composed of triangular elements, which is advected at each time step by the local fluid velocity field. This evolving surface acts as a support for a smoothed Heaviside function that distinguishes the two fluid phases: assigning a value of 1 to the dispersed phase and 0 to the continuous phase, with a smooth transition across the finite interface thickness, as can be seen in
Figure 1. The Heaviside function formulation adopted in this work follows the approach proposed by [
37], allowing for the continuous interpolation of fluid properties across the interface, namely
where
is the distance between a given fluid mesh node to its closest interface mesh node and
is the interface thickness value.
An interpolation procedure is applied at each interface node, using the velocity of the fluid mesh nodes. The transfer between the two meshes is performed via incomplete cubic polynomial interpolation, which uses all element nodes. Smoothing is applied to the Heaviside function as described in Equation (
13), and consequently to
and
, as shown in Equation (
14). In cases of strong surface mesh deformation, no local refinement is performed; however, the current implementation supports large deformations, as seen in the tail of the bubbles presented in the Results section.
Curvature values computed on the interface mesh are transferred to the fluid mesh via a distance function. To advect the surface mesh, each surface node is located within a fluid mesh element, and its velocity is obtained by interpolating the velocities of that element’s nodes. The node is then advected accordingly. This process is repeated for all surface nodes. After advection, a remeshing routine ensures that the surface mesh remains well-shaped. If entanglement or bubble breakup occurs, the simulation is terminated, as these events are not yet supported.
In nature, the interface between fluids has no thickness. When representing such flows using the current methodology, the interface intersects discrete fluid mesh elements, splitting fluids across these elements. While this introduces inaccuracy in the numerical simulation, it is inherent to the chosen approach, and the deviation decreases as the mesh is refined.
In simulations involving large fluid property ratios or strong surface tension forces, numerical instabilities may occur at the interface. One way to mitigate this is by increasing the number of mixed elements, thereby spreading fluid properties or surface tension forces over more elements and reducing the steepness of property gradients. This is achieved by assigning a finite interface thickness. The choice of interface thickness is problem-dependent and is typically defined as a multiple of the characteristic element size h. A value of h results in the minimum number of mixed elements. Conversely, larger values, such as h, improve numerical stability but reduce physical accuracy, as they deviate further from the sharp interface assumption. The appropriate value of is usually determined through trial and error, aiming for stable simulations with acceptable accuracy when , typically in the range of h to 3 h.
Since the interface thickness can be changed, property gradients are smoothed over a different set of elements. Although the per-element intensity changes, the total integrated surface tension remains approximately conserved.
The smoothing effect introduced by the interface thickness enables the stable simulation of flows involving large density ratios. This feature allows for the accurate modeling of highly unbalanced two-phase systems, such as air bubbles rising in ethylene glycol, with a density ratio of
. Additional cases involving air in ethanol (
) and air in sugar–water solutions (
) have also been successfully simulated, demonstrating the robustness of the present approach in handling extreme density contrasts [
38].
The fluid properties are assigned to the nodes using the Heaviside function using the following formula
The fluid properties associated with the finite element are obtained by an average of the nodal values.
Ultimately, the surface tension force is incorporated into the momentum equation through the following discrete formulation:
Here,
refers to the quantity
calculated on the interface mesh and transferred to the fluid mesh using a distance function
, which computes the distance between each fluid mesh node and the closest node on the interface mesh, based on the distances to all interface nodes. The term
represents the gradient of the regularized Heaviside function, effectively acting as a discretized Dirac delta function that localizes the force in the vicinity of the interface. The surface tension coefficient is constant and non-dimensionalized, such that
, and is therefore omitted from Equation (
15). The curvature
is computed at the interface mesh nodes by means of a finite-element approximation of the Laplace–Beltrami operator and subsequently assigned to the fluid mesh nodes using a distance-based criterion [
31].
3. Results
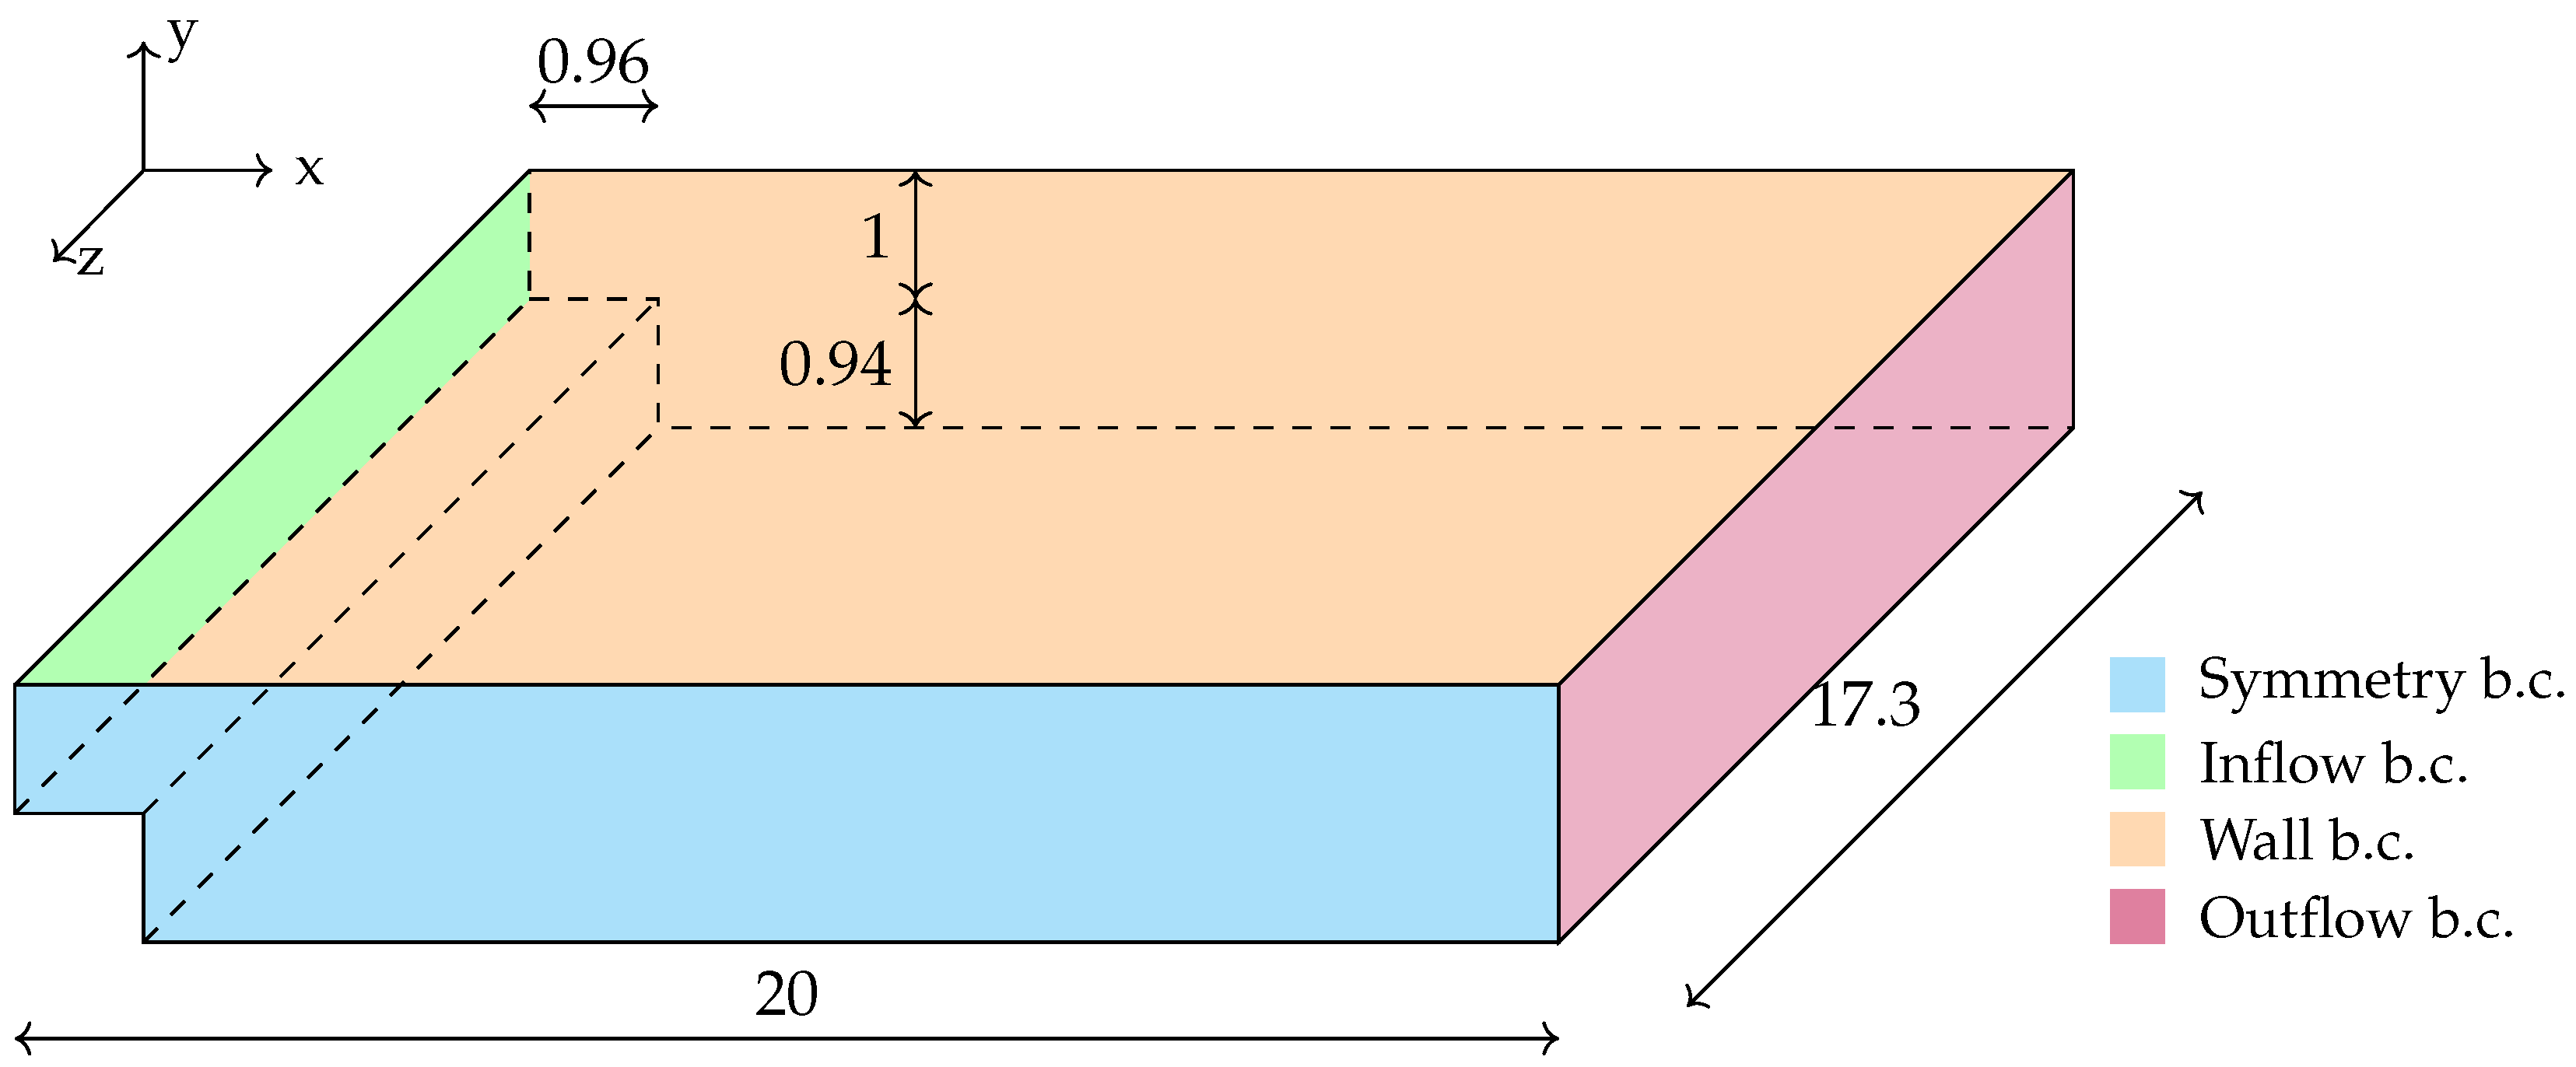
At the start of this section, a three-dimensional, single-phase numerical verification is presented for the well-known backward-facing step, to assess the methodology’s ability to accurately capture flow behavior. The test setup, shown in
Figure 2, was designed to replicate the experimental results reported in [
39], but was made nondimensional by taking the inlet height as the reference length. A parabolic horizontal velocity profile was imposed at the inlet, uniform in the
z direction and varying along the
y coordinate, from zero at the walls to a maximum of
at the inlet center.
The simulation was run with 1,282,312 nodes and 1,098,021 elements. Despite the high number of nodes, the domain was not overly refined due to its large extent in the x and z directions compared to the y direction. The Reynolds number was set to , with a time step of . Steady state was reached after 8400 iterations.
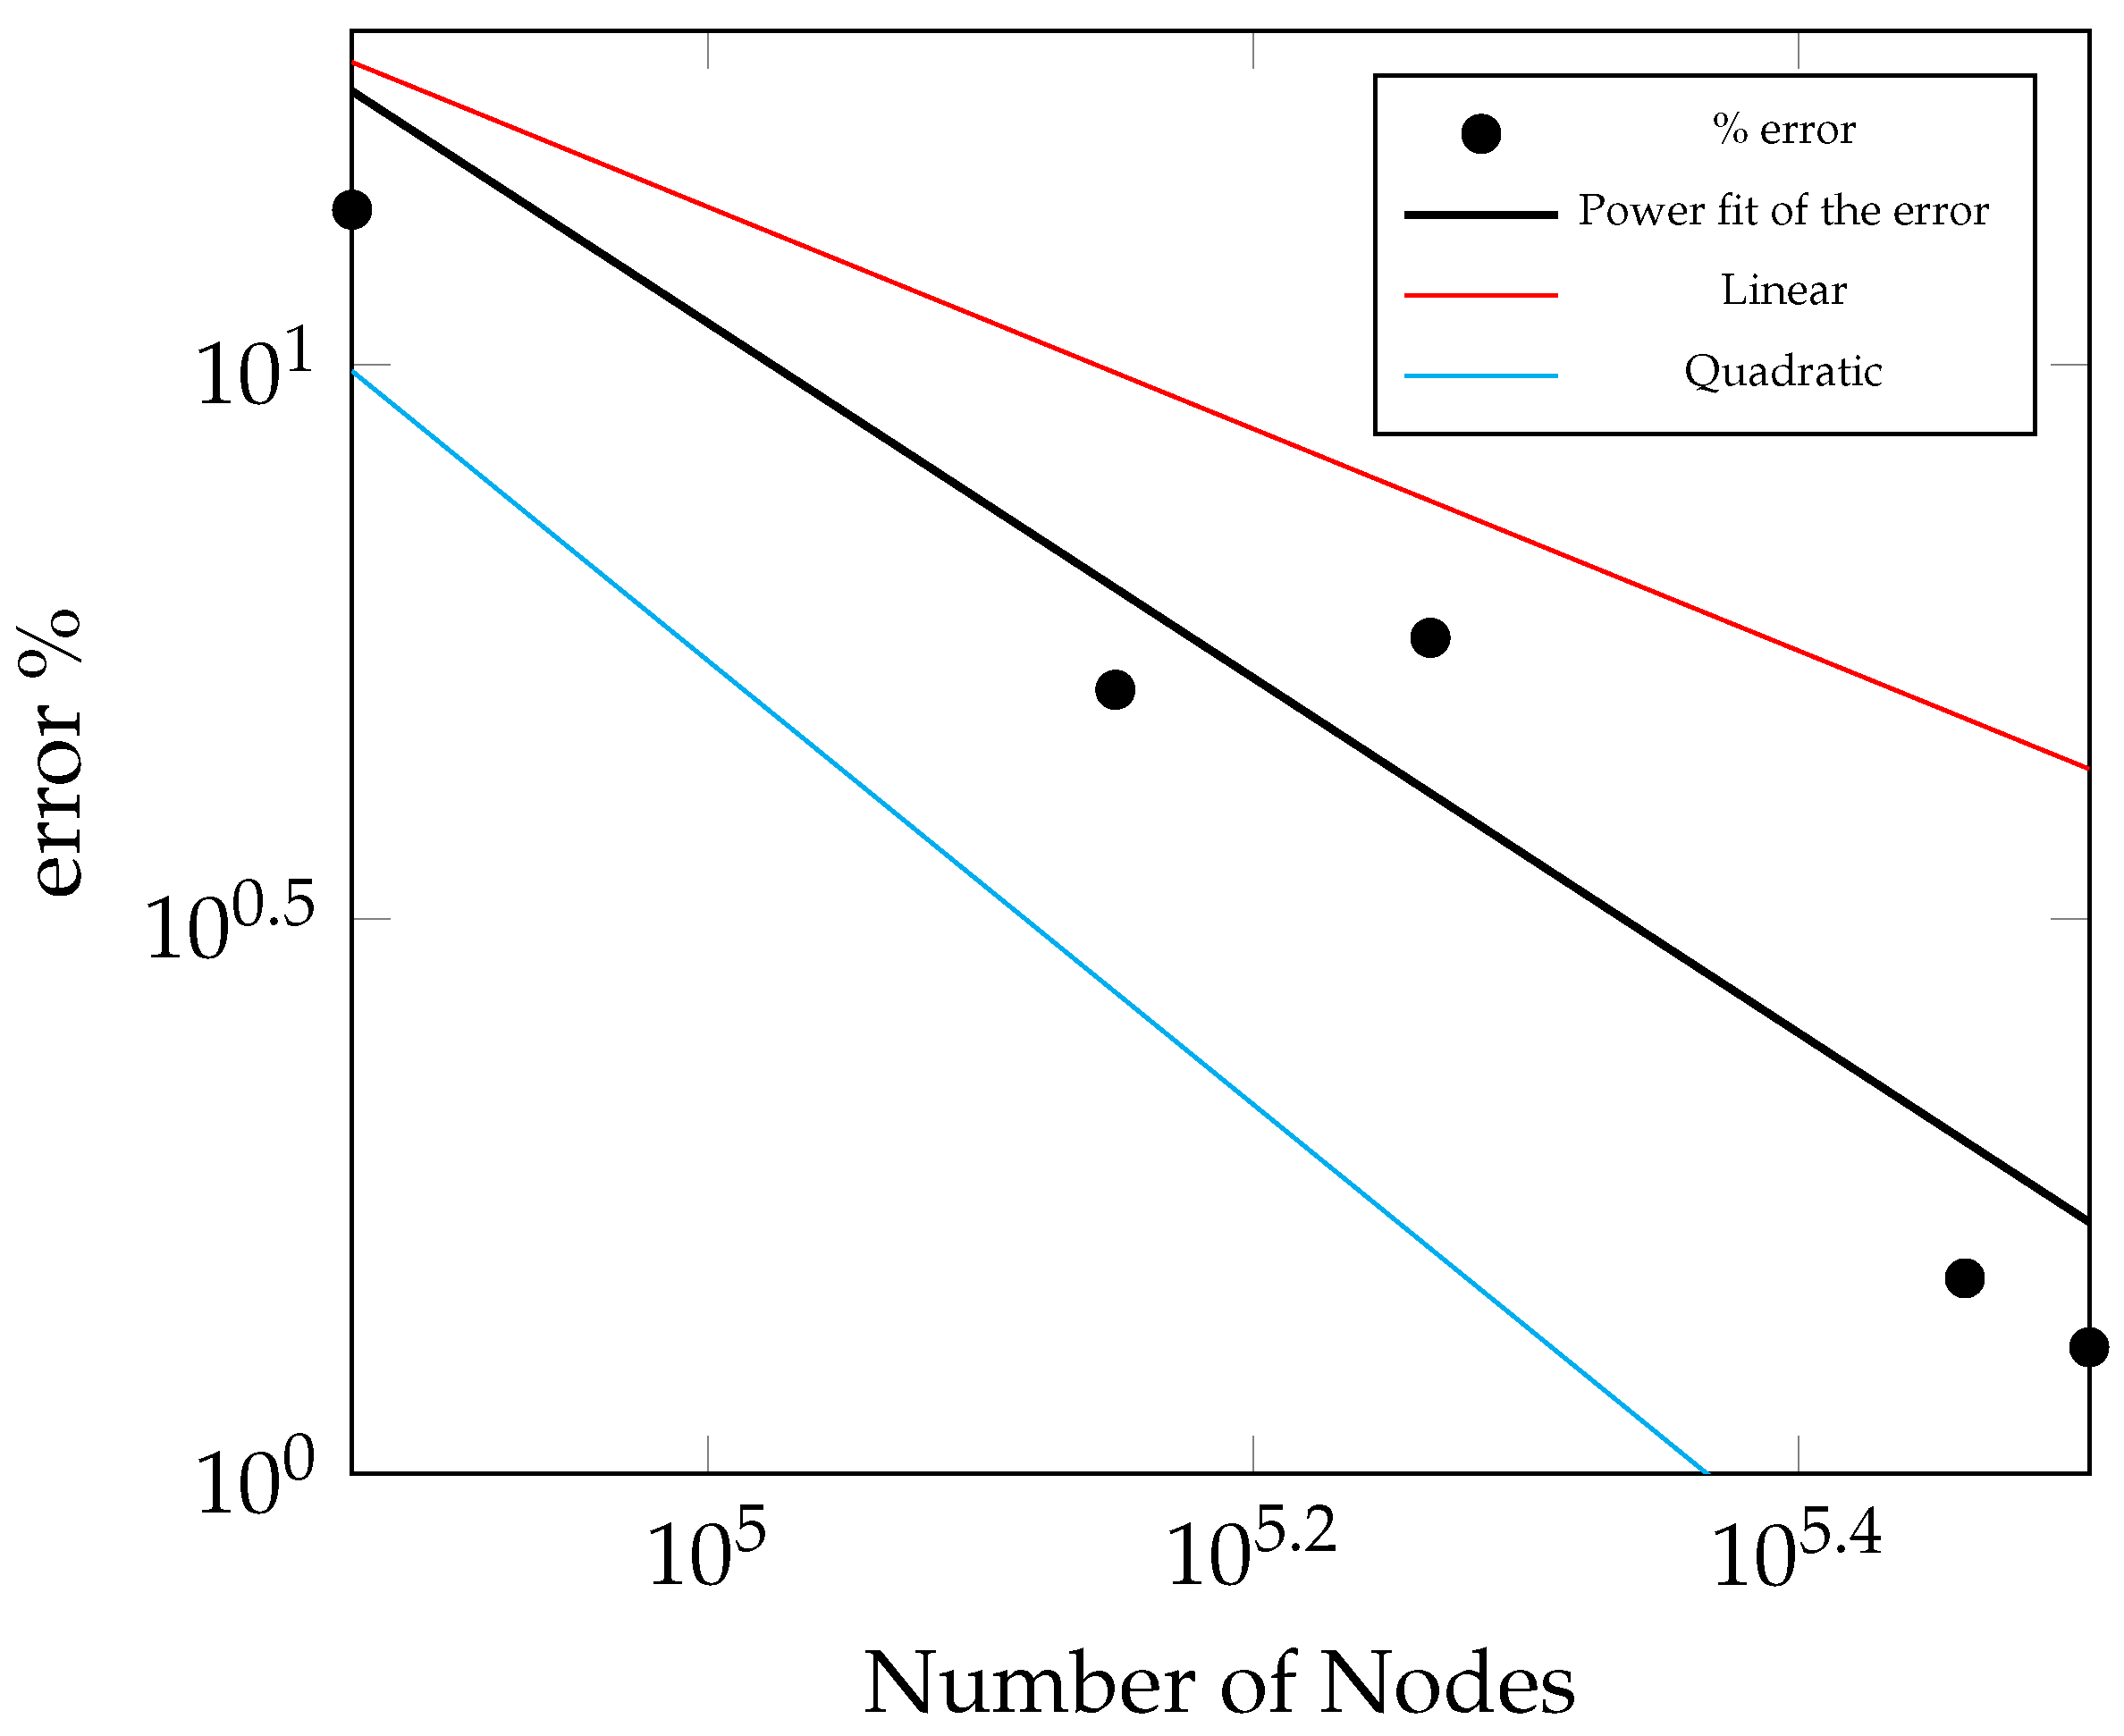
Figure 3 presents a mesh convergence study for the backward-facing step configuration. A power fit of the error using the velocity results from the meshes with 74,000, 141,000, 184,000, 289,000, 321,000 nodes (83,368, 761,304, 1,001,223, 1,606,217, and 1,793,095 elements, respectively) was created in order to compare the order of convergence. It can be seen that the error decreases with an increase in the number of nodes, agreeing with at least linear convergence.
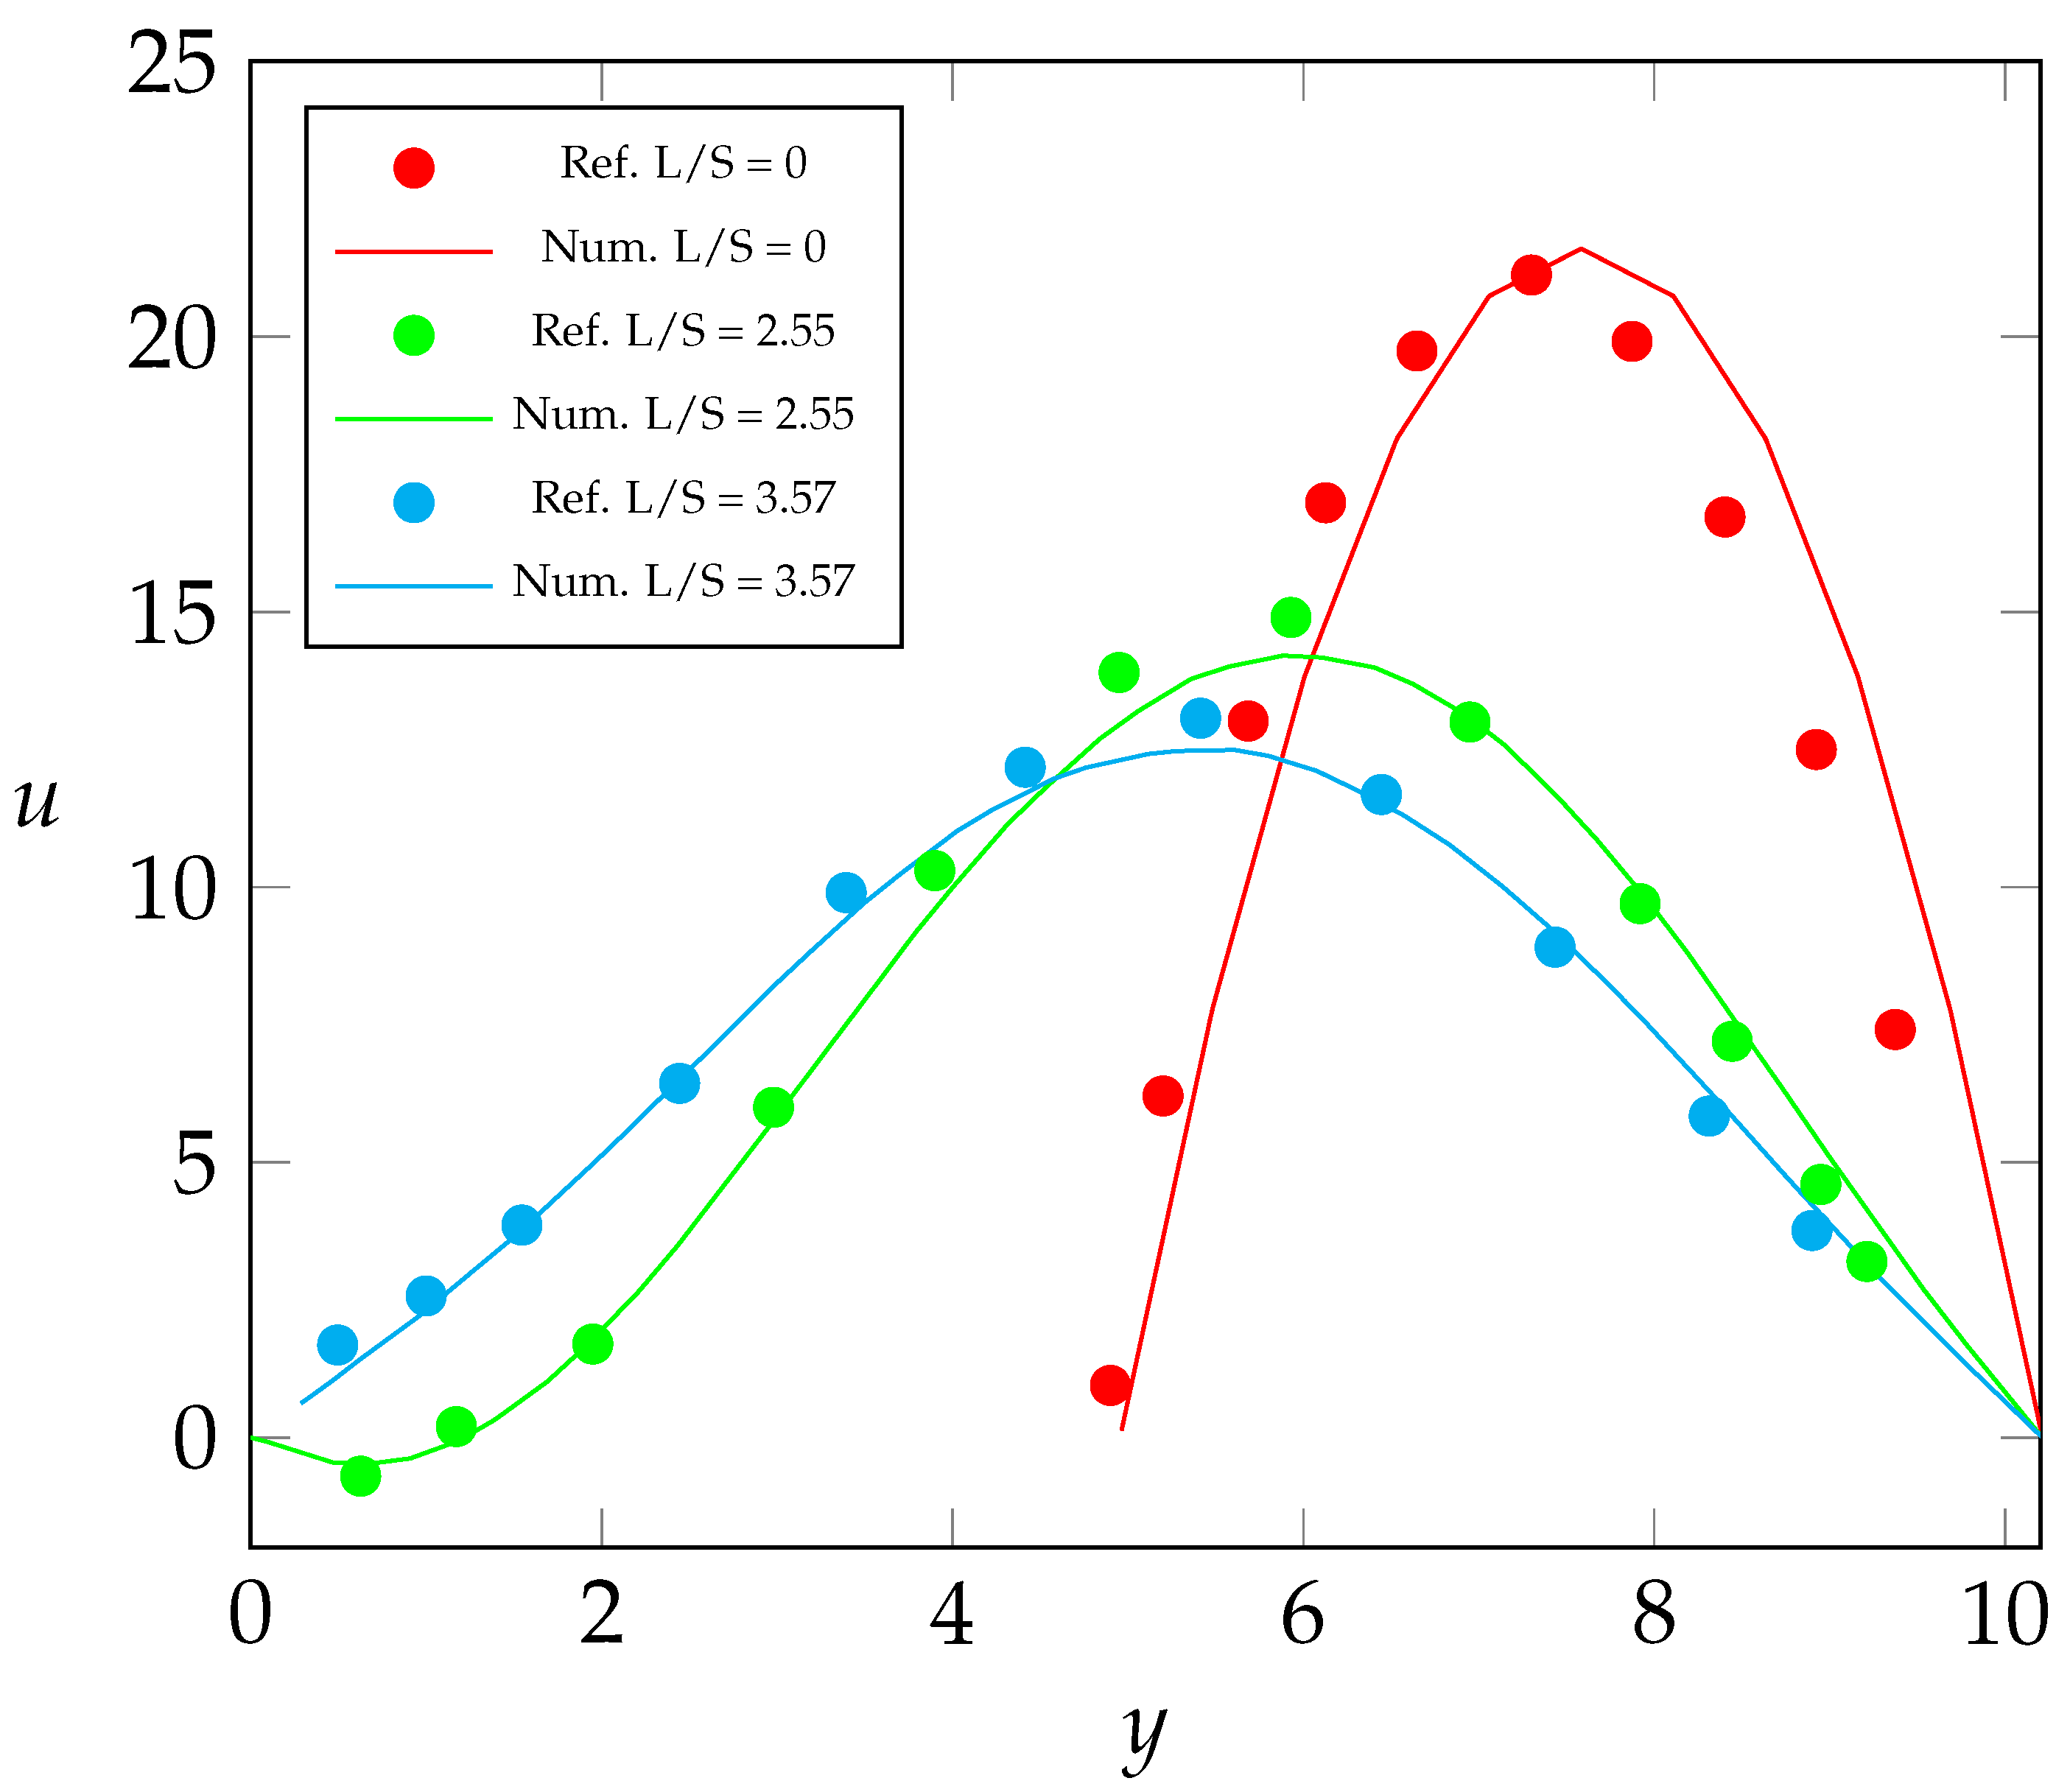
Figure 4 presents the horizontal velocity profile for three points in the created domain, at the edge of the step, and at the points where the length of the domain divided by the height of the step is equal to
and
. As can be seen in the figure, there is very good agreement between the experimental data and velocity profiles. The slight offset seen when
is due to the way air is injected into the experiment, versus the parabolic velocity profile set as a boundary condition in the numerical simulation.
Moreover, results for the flow in three complex geometries are presented. All numerical results here presented are obtained using a two-phase finite-element simulation tool, with an uncoupled surface mesh separated from the fluid mesh being used to represent the interface. The single-phase benchmark is achieved by ignoring the interface mesh and the surface tension force in the fluid motion equations. This numerical tool has been verified against several single and two-phase flow in various test cases and the results have been reported in [
31,
32,
40].
The single-phase backward-facing step is an important benchmark in the context of fluid dynamics refers to a sudden change in a channel’s cross-sectional area, resulting a flow separation and recirculating regions behind the step and further along the channel length, when the flow reattaches to the wall downstream of the step. The geometrical parameters of such recirculating regions delivers an accurate assessment of the numerical code’s capabilities. Additionally, a classical two-phase flow benchmark is presented at
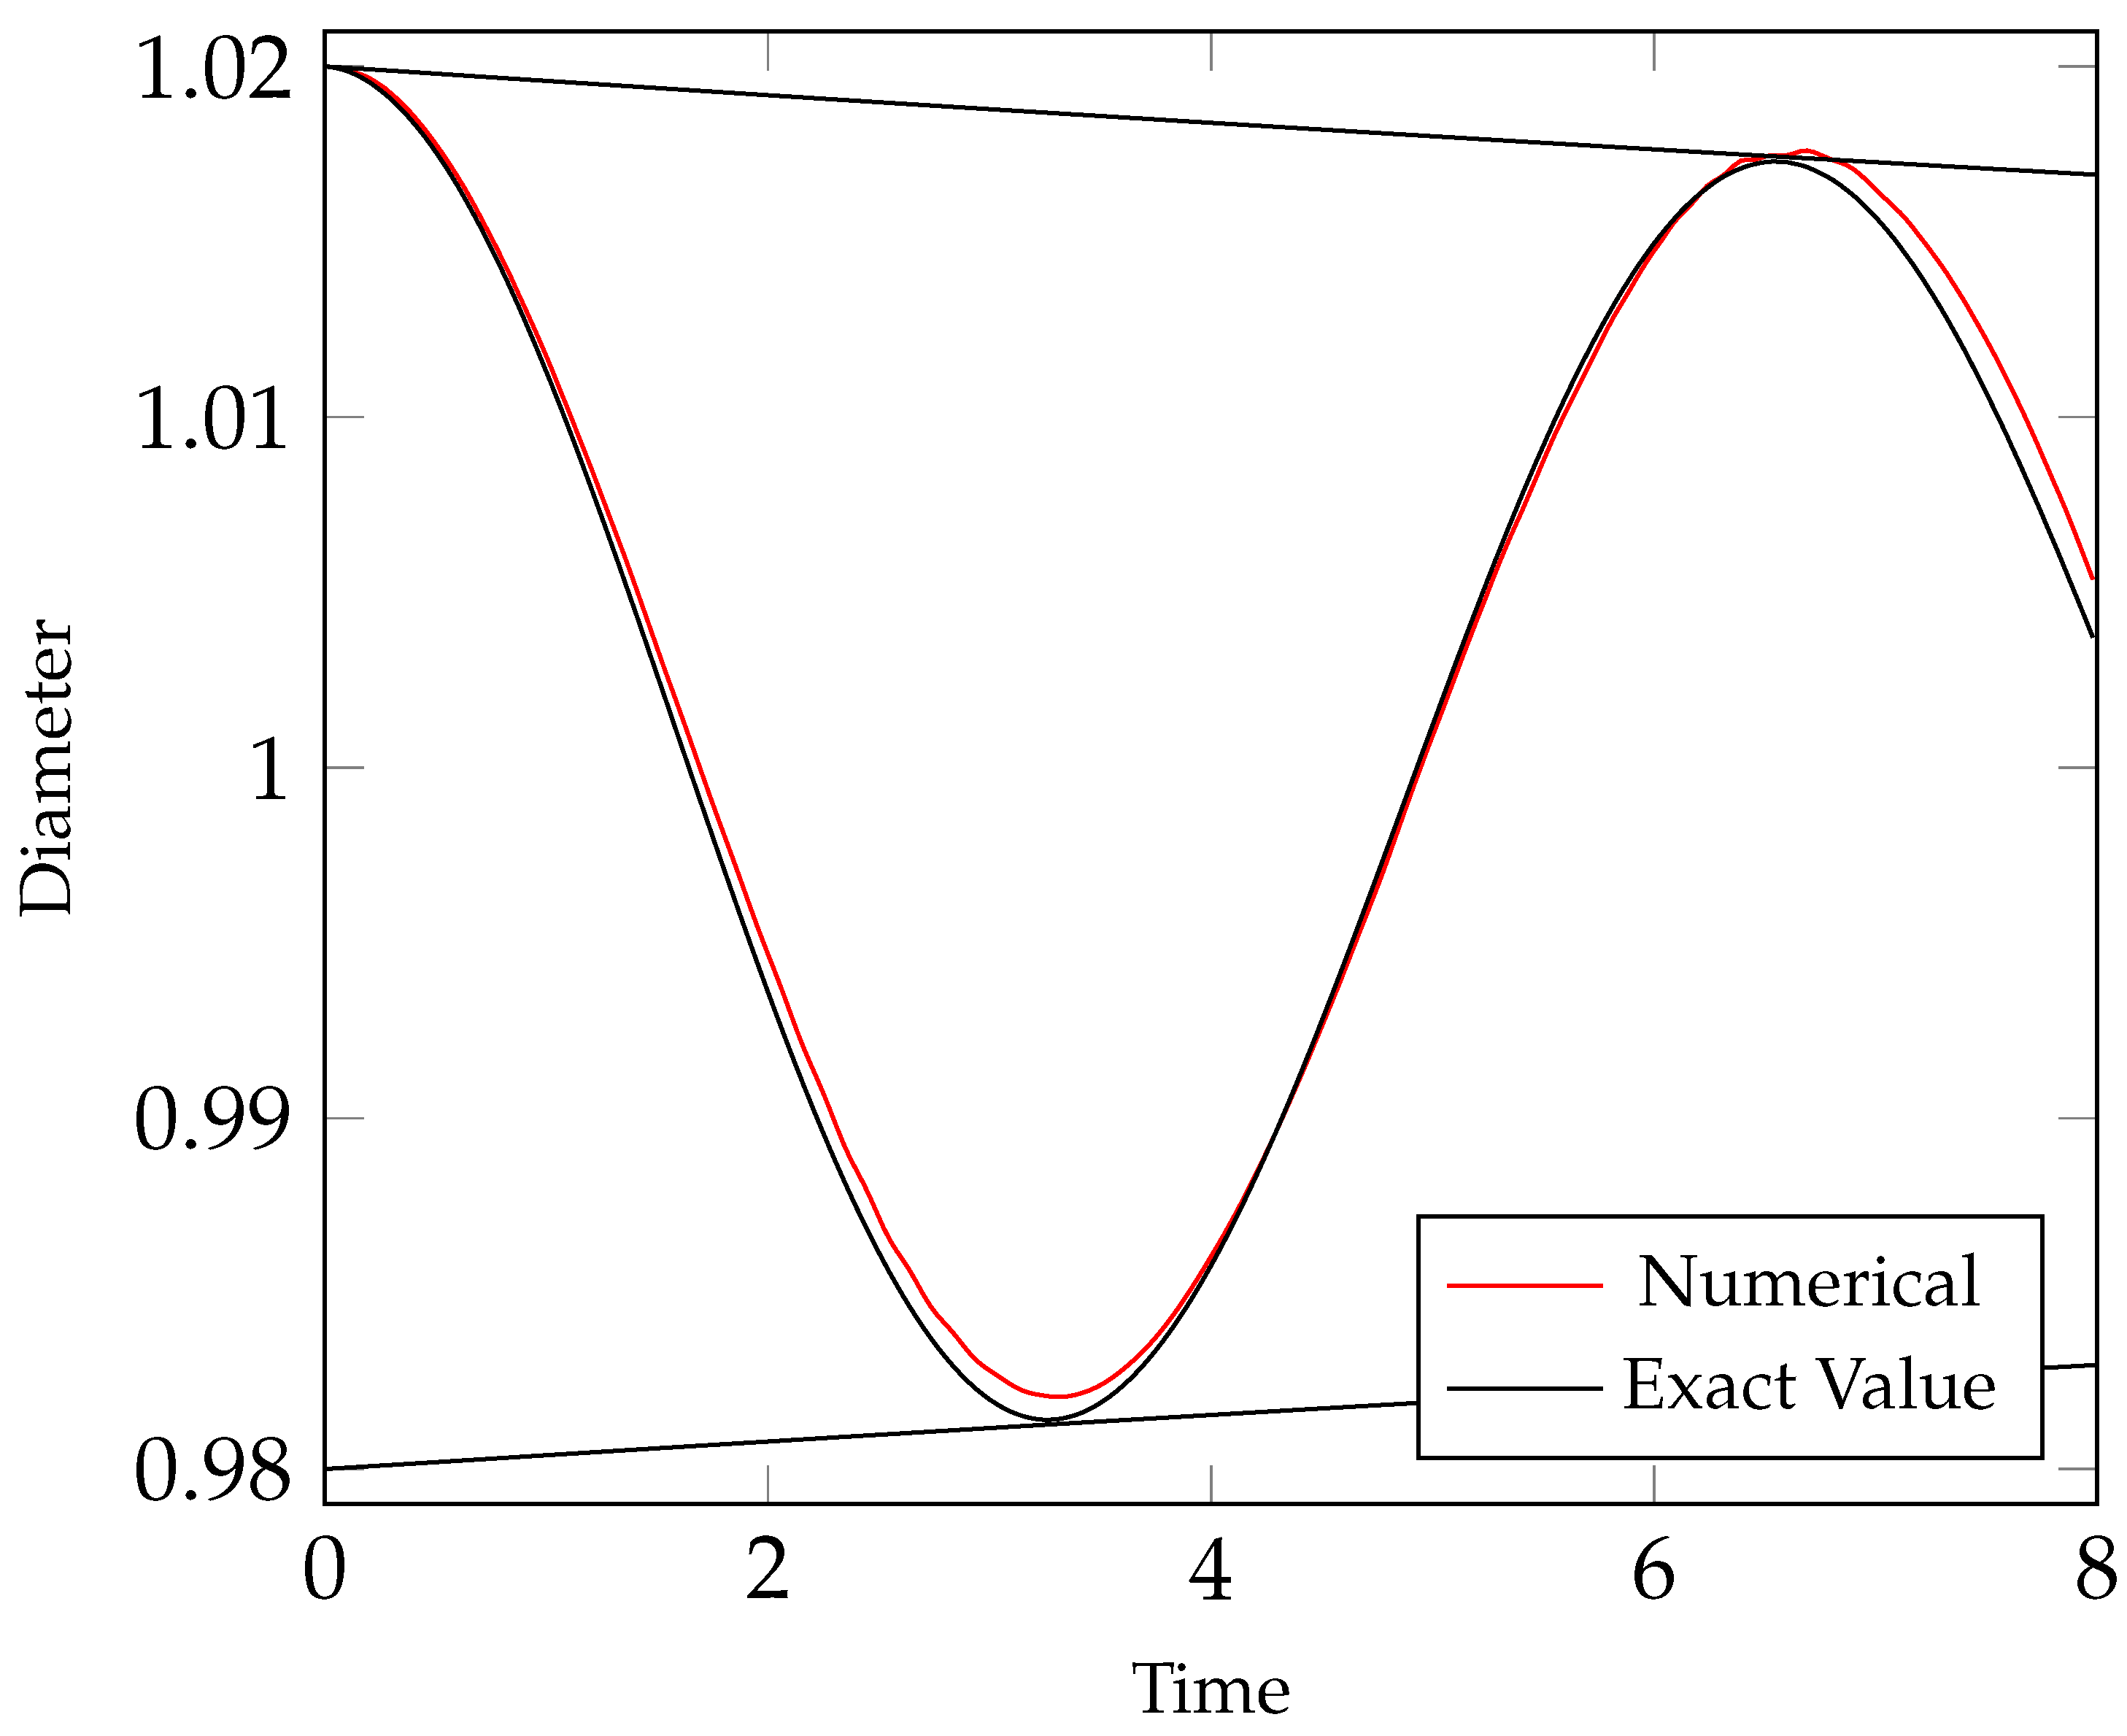
Figure 5. A simulation for a 2 × 2 × 2 domain was executed, with a bubble placed at the center. This bubble has an equilibrium diameter
(same volume as a bubble of diameter
), with a slight perturbation
in the
z direction, to showcase the accuracy of the two-phase flow simulation tool. Reynolds number was set to
and Weber number set to
, and the simulation was executed over 266 time steps
totaling 8 non-dimensional time units. The results obtained present good agreement with the analytical values.
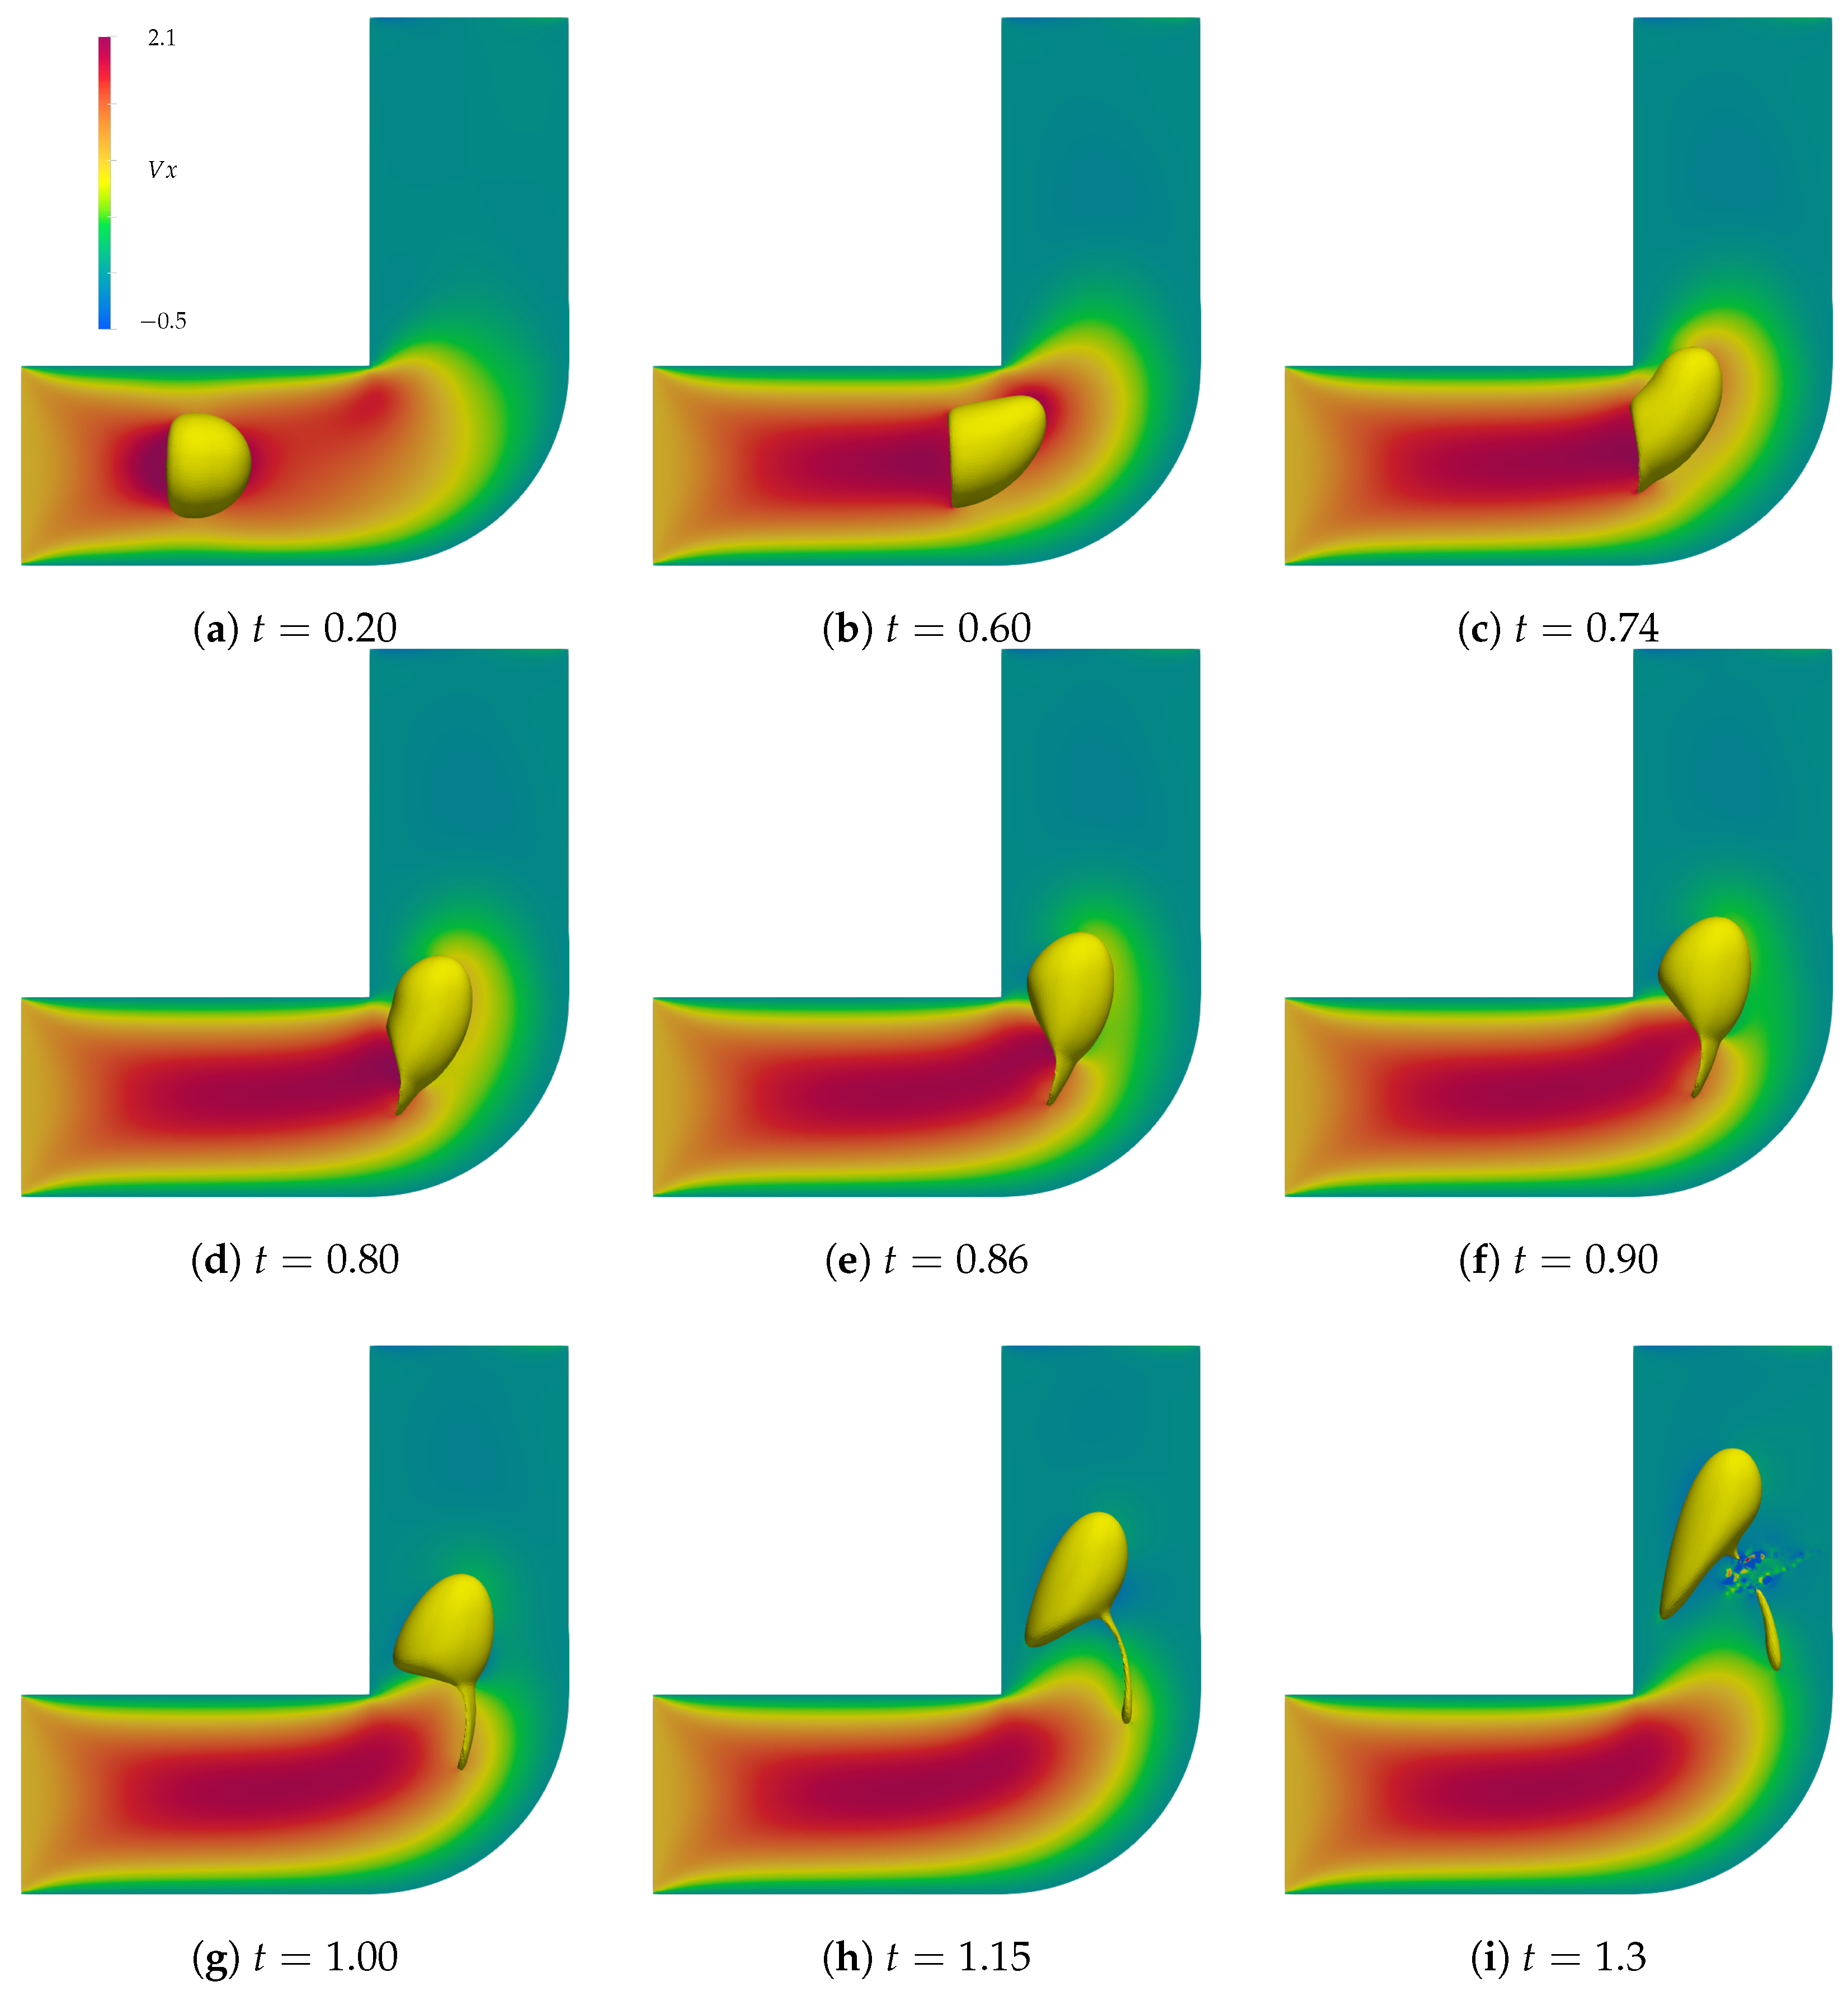
The two-phase flow simulations were computed with the same fluid properties, , while the bubble fluid properties are and , with gravity disabled. The same time step was selected for all simulations, with a time step of , over a maximum of 400 time steps; however, only the expanding channel simulation completed all time steps. The converging channel simulation was interrupted by the bubble reaching the fluid domain’s end, and the curved channel simulation was interrupted near the end by a bubble breakup. The same interface thickness was used for all three simulations.
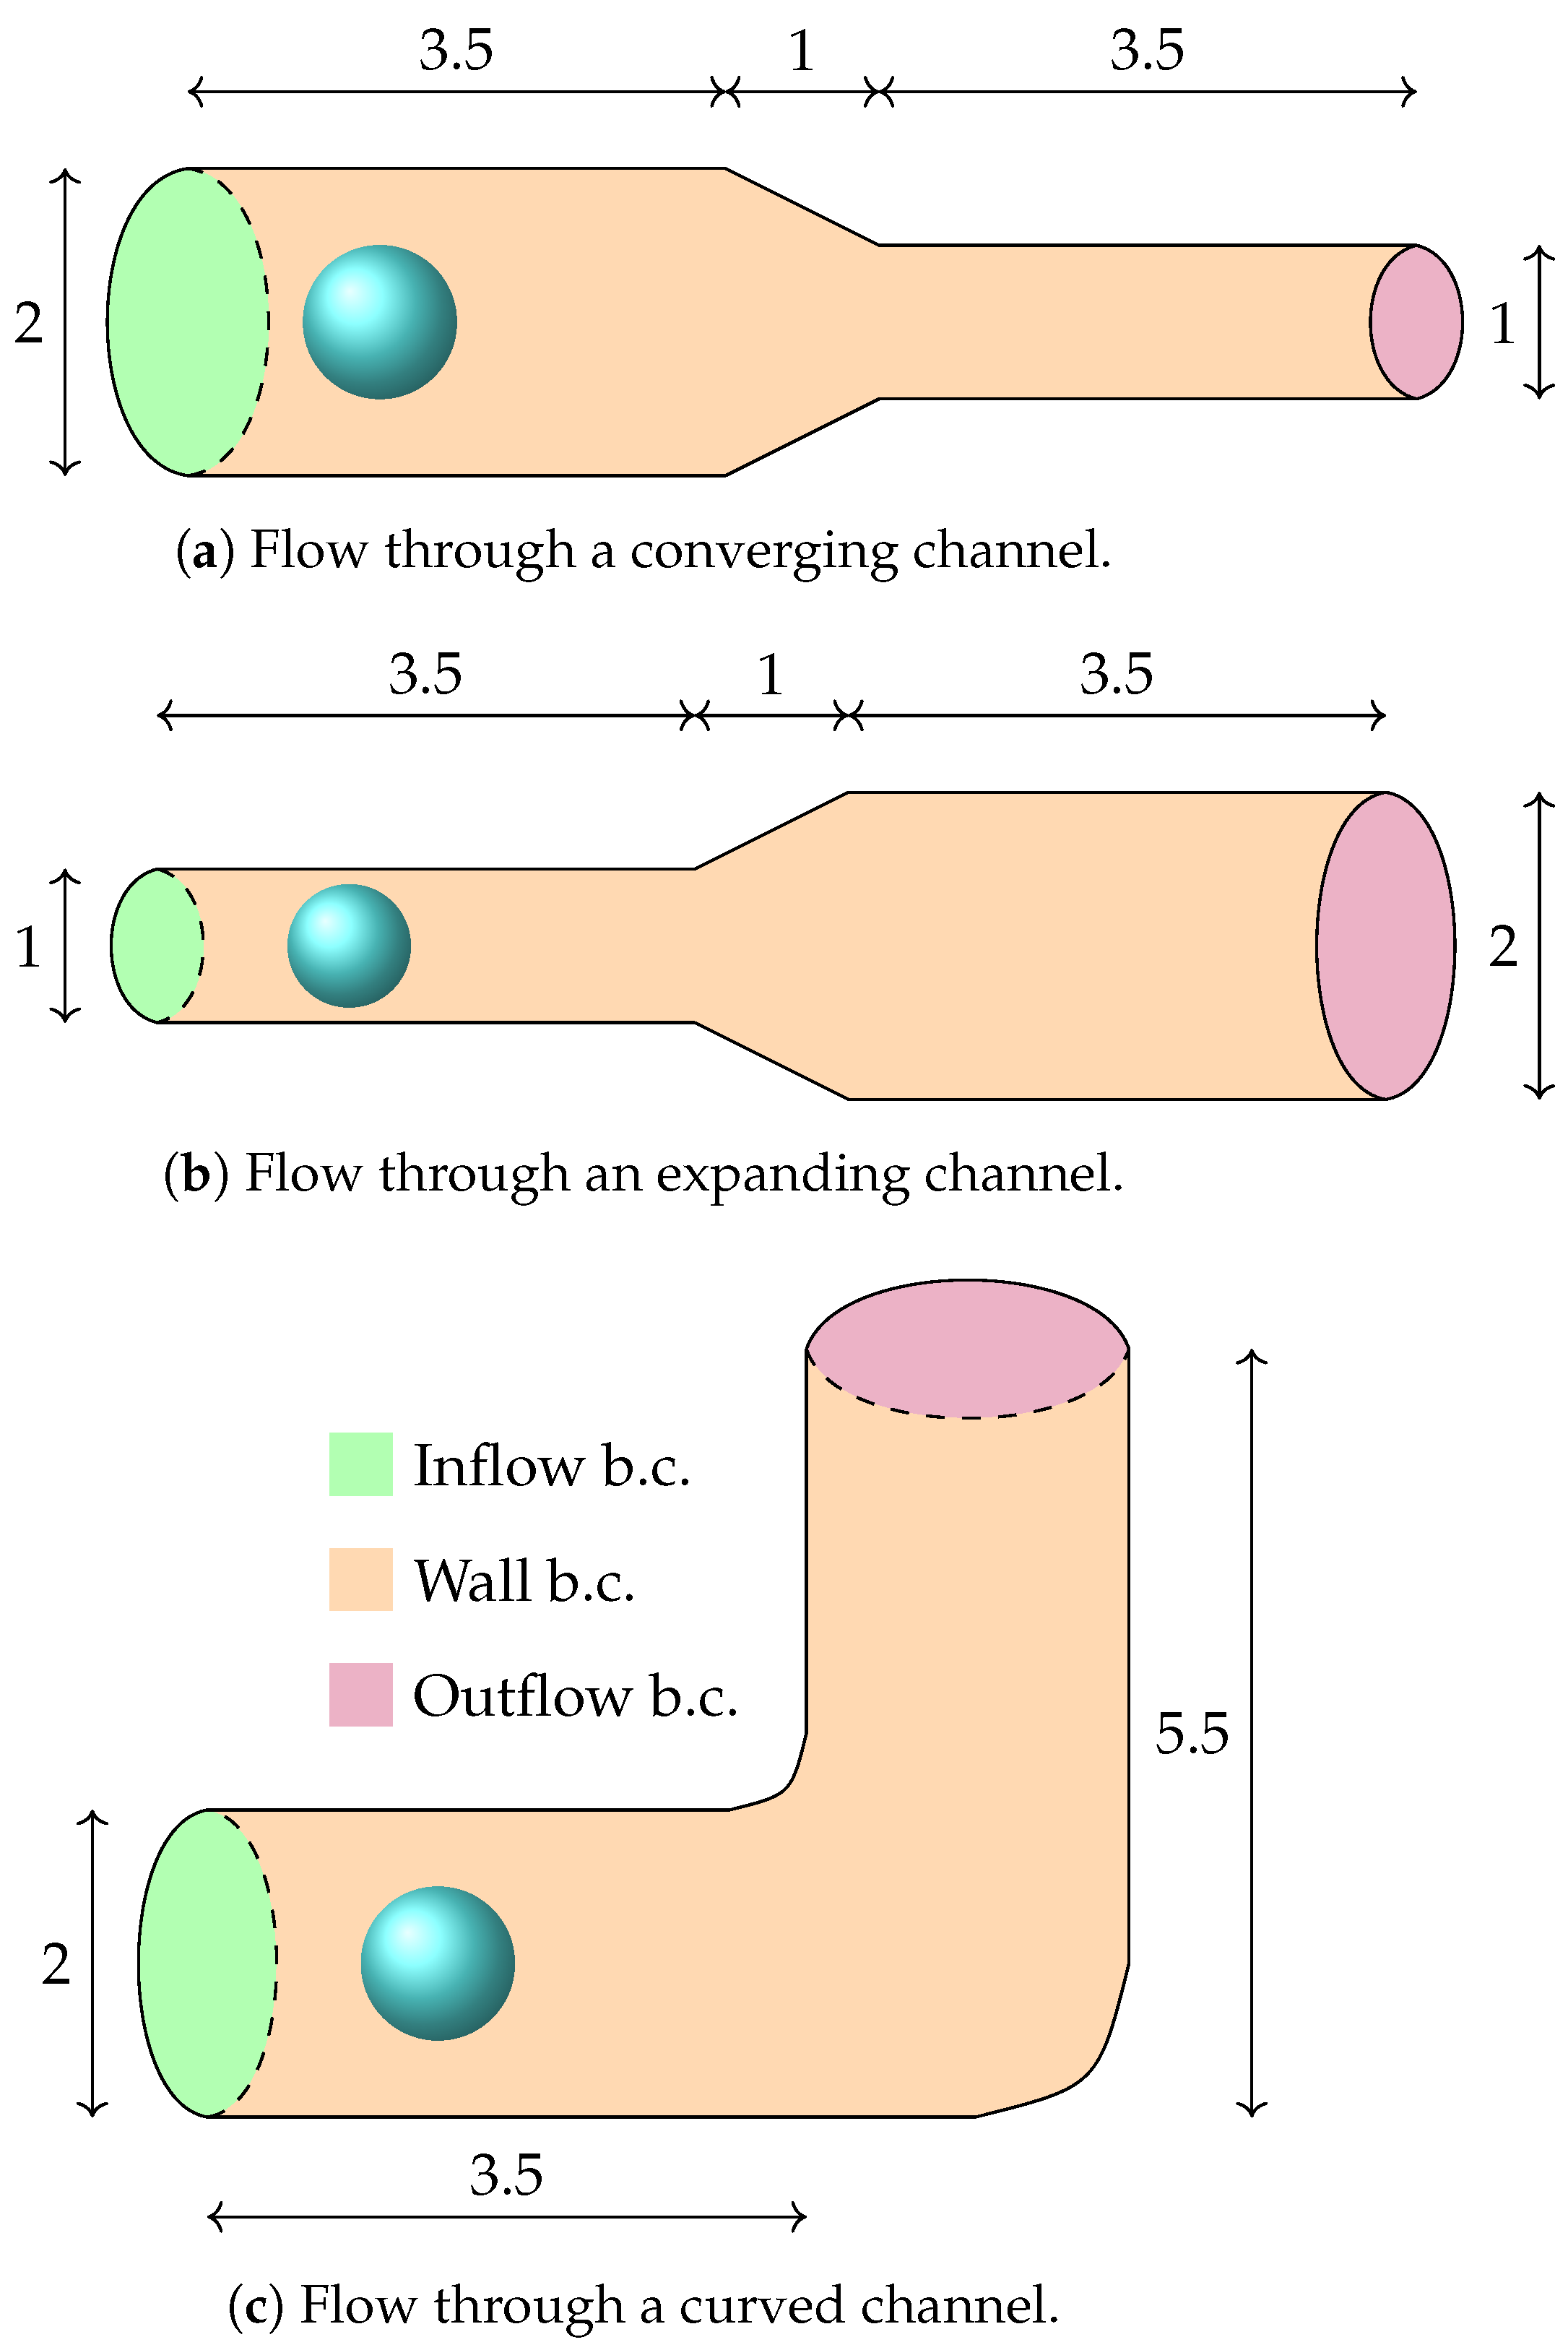
The two-phase simulations setup can be observed in
Figure 6. Three different channels with changing geometry are represented to investigate the the motion and behavior of the bubbles. The spatial dimensions of the channels are non-dimensional and contain a single initially spherical bubble of diameter
for the converged and curved channels, and
for the expanding channel, with the objective of analyzing the deformation and trajectory of the bubble as it moves through different geometrical constraints. In all cases, a non-dimensional uniform velocity profile
is imposed at the inflow boundary, while a zero-pressure condition
is imposed at the outflow. The channel walls are subject to a no-slip condition; therefore, the velocities are null. These configurations allow for the study of the effects of channel constriction, expansion, and curvature on bubble deformation and migration, particularly under varying shear and pressure gradients induced by the geometry.
The converging channel simulation has 1,744,069 nodes, and was simulated with Reynolds number and Weber number . The expanding channel simulation domain has 1,720,930 nodes and was simulated with and , and the curved channel simulation has 2,963,087 nodes, and was simulated with and .
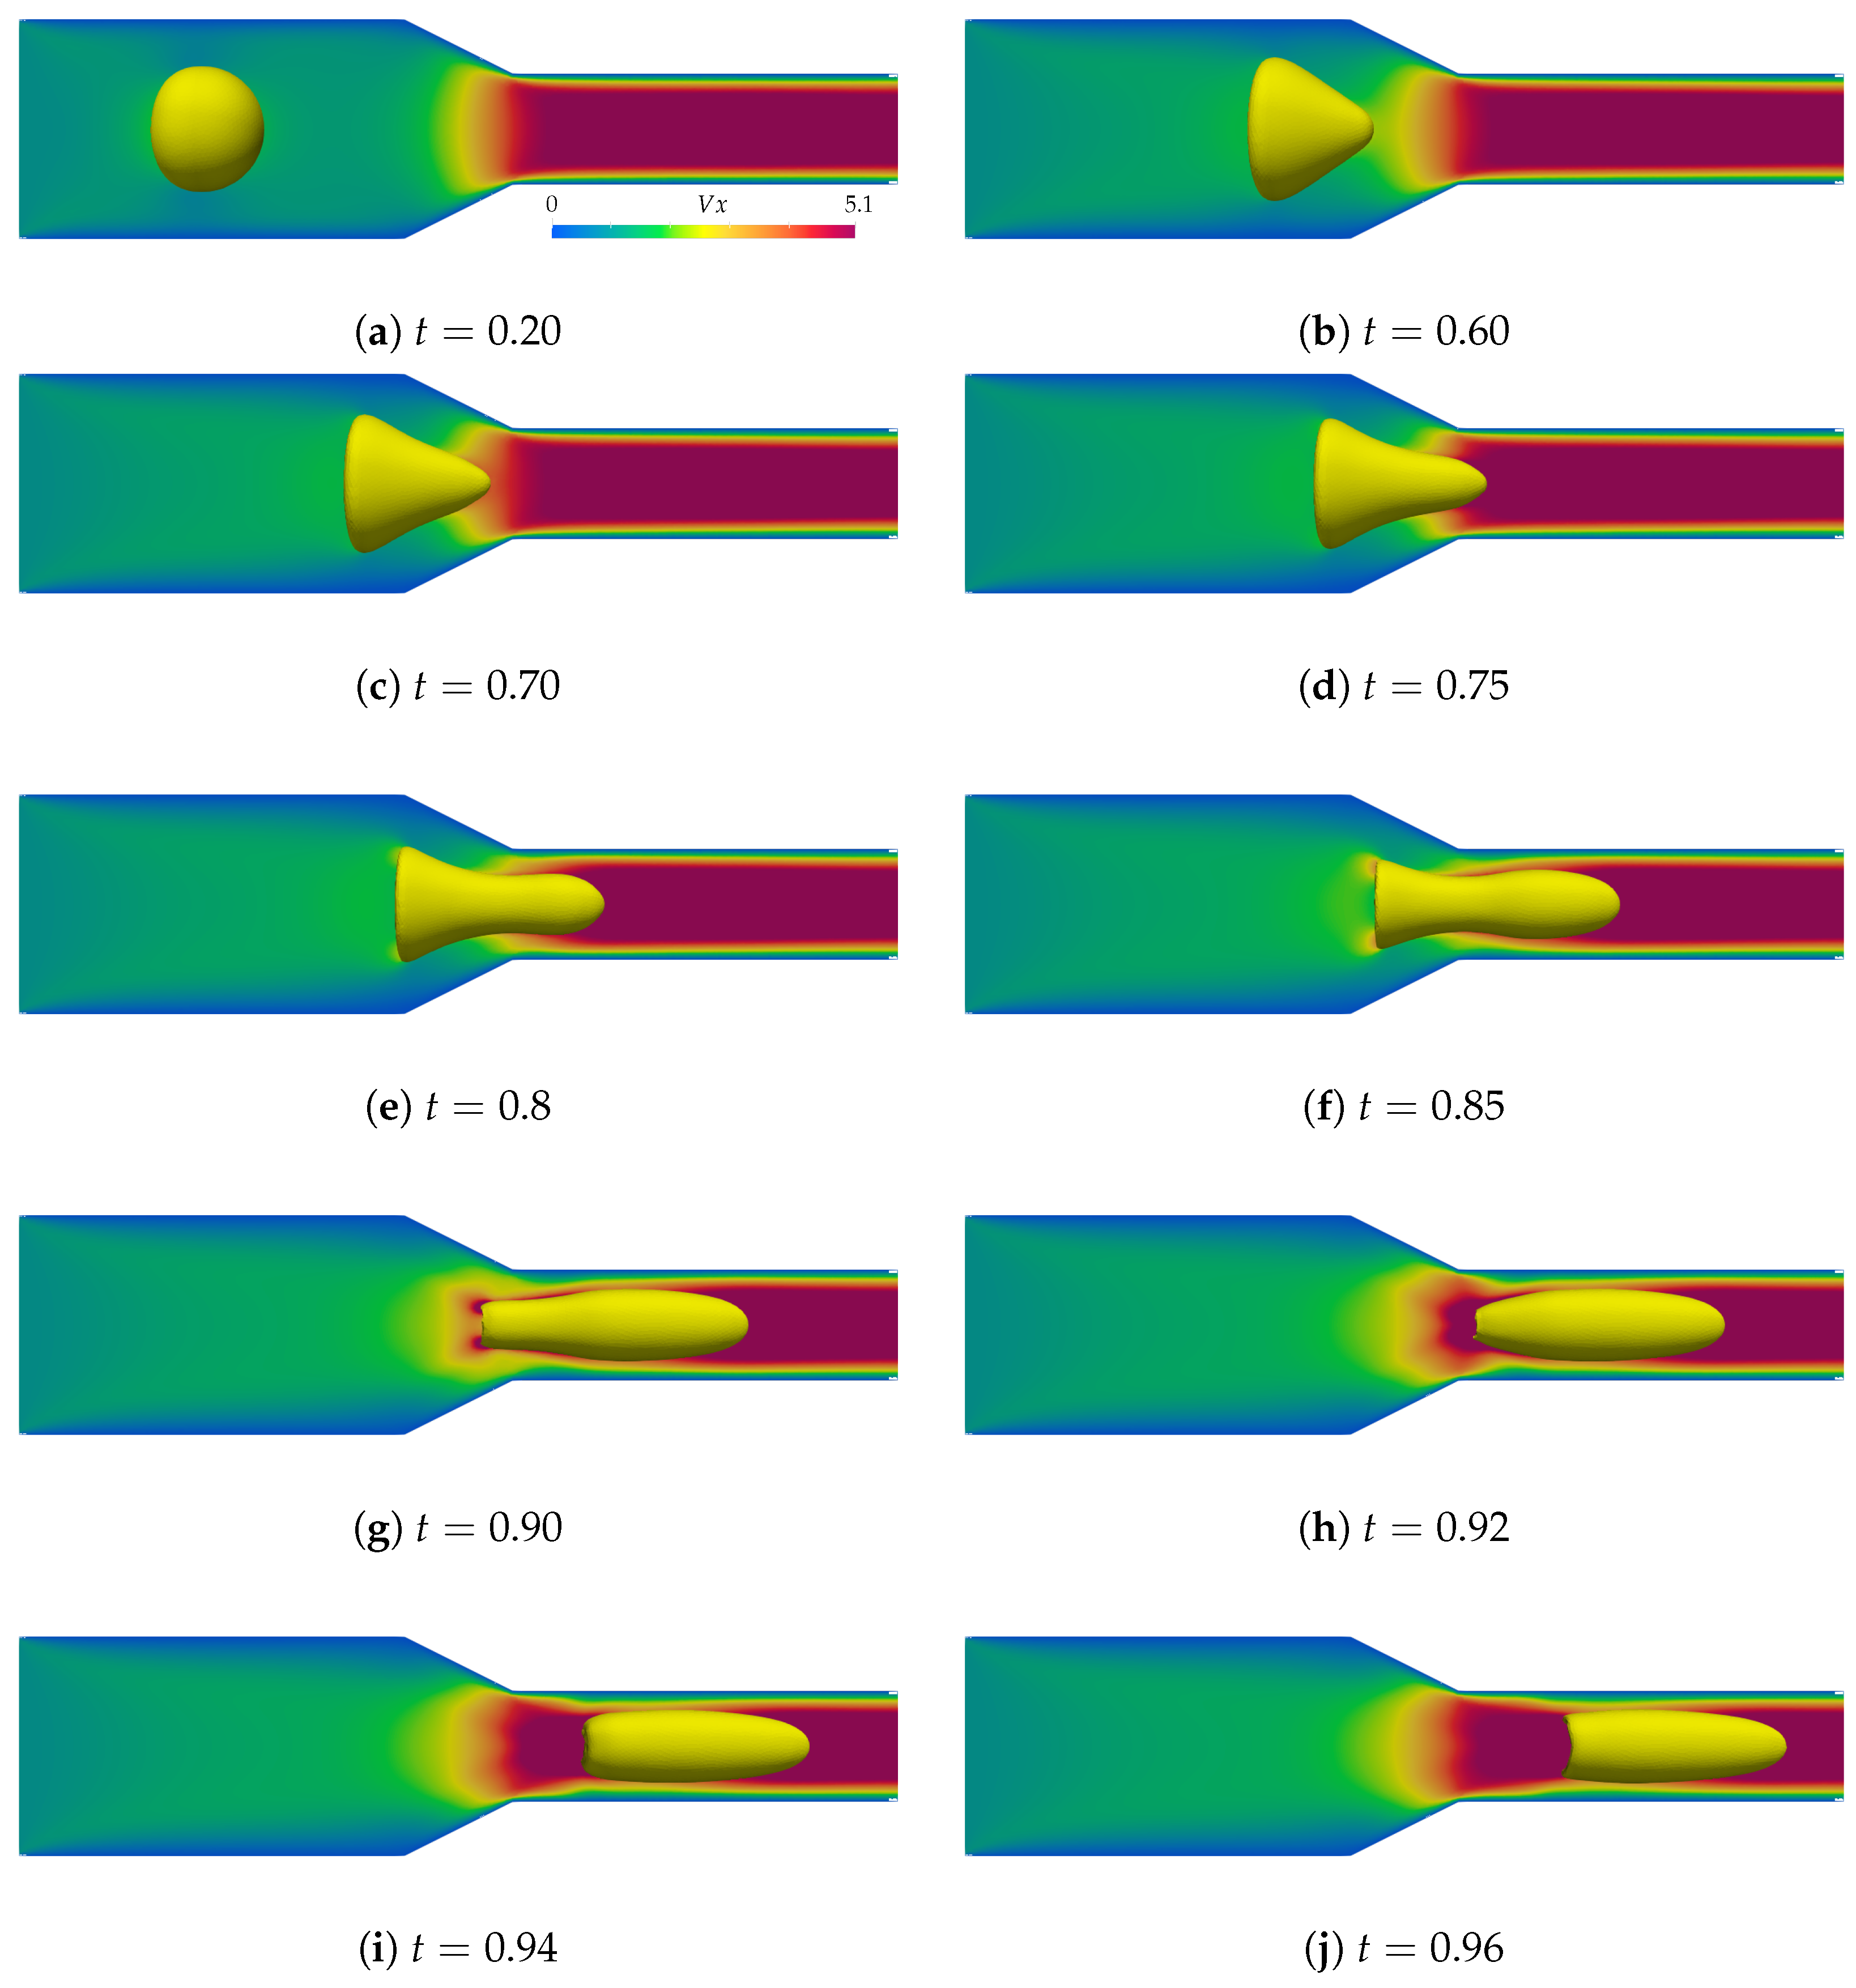
The results of the converging channel simulation can be observed in
Figure 7. It initiates with the bubble, gradually adopting a mushroom shape as it advances toward the channel constriction. Upon reaching the constriction, the bubble undergoes a rapid change in shape, which occurs very rapidly compared to other observed phenomena. In just a few time steps, the triangular shape of the bubble transforms; its top takes on a Taylor bubble shape, while the middle undergoes constriction until it passes through the constriction section, assuming the Taylor shape completely.
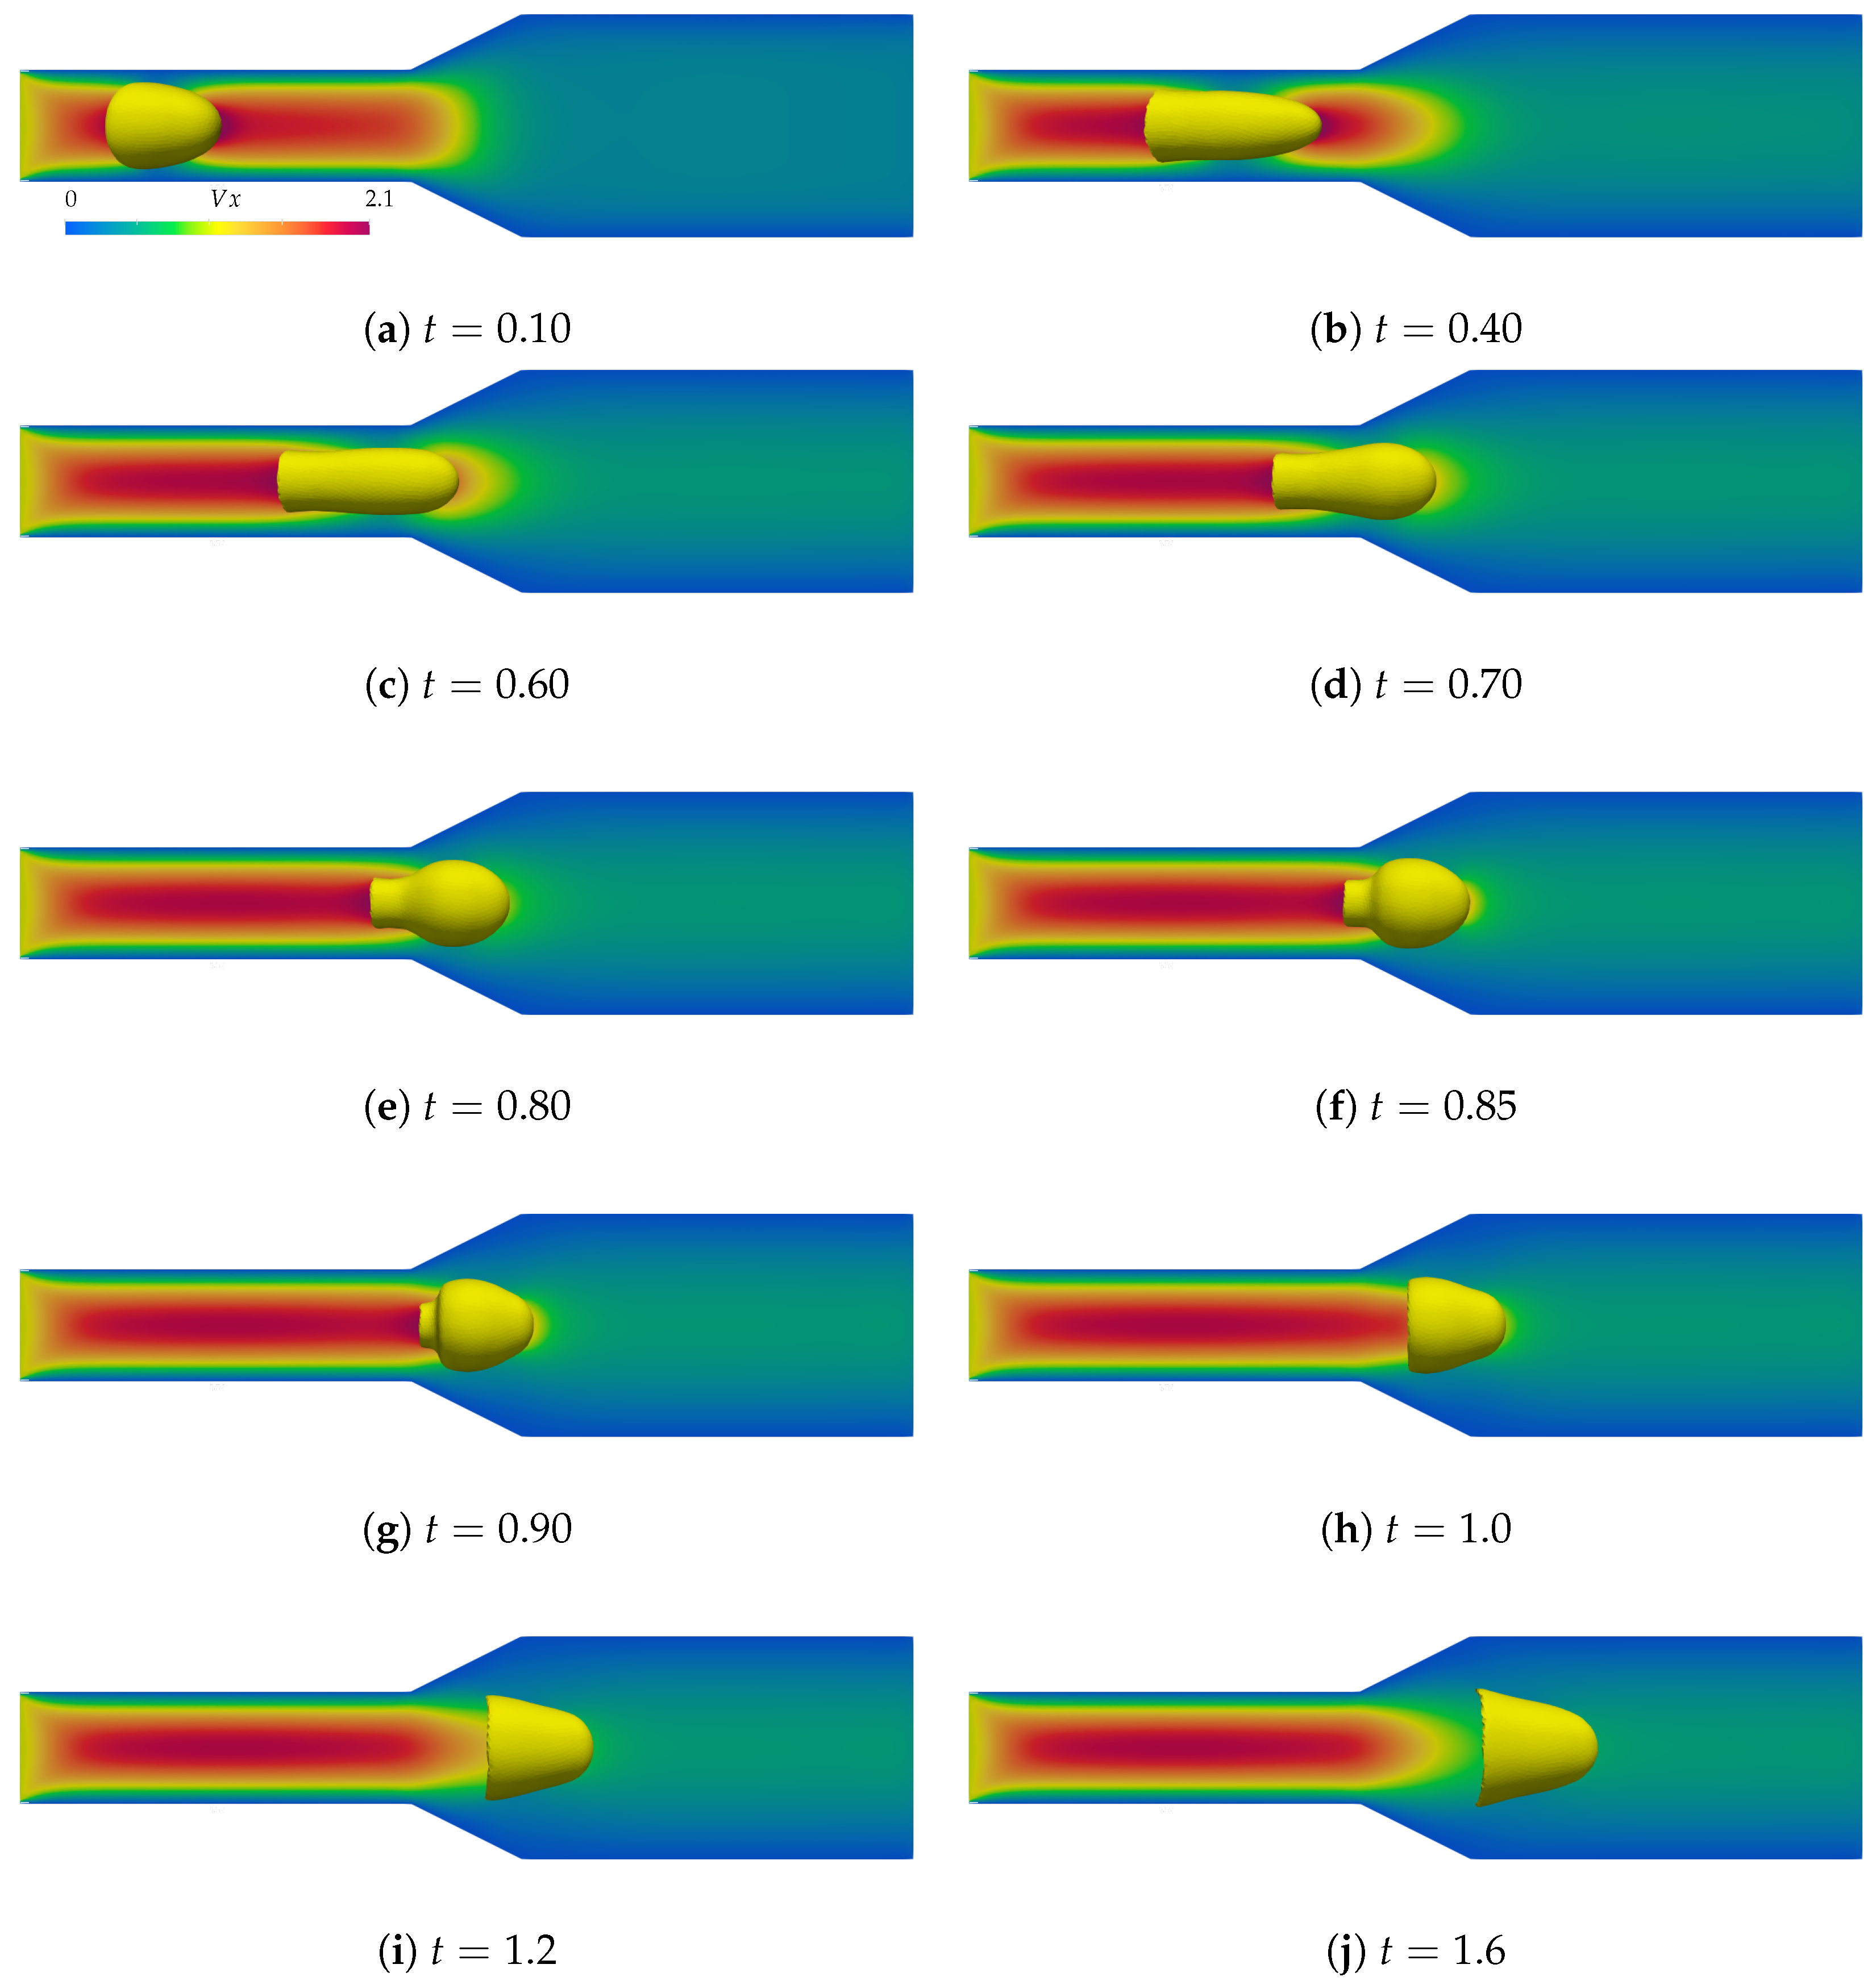
In the expanding channel simulation presented in
Figure 8, initially, the bubble swiftly assumes the form of a Taylor bubble and advances towards the expansion section. As the bubble traverses the expansion, it swells, becomes curved, and then the lower portion of the bubble recedes, resulting in a bell-shaped configuration as it exits the channel expansion.
Finally, in the curved channel simulation displayed in
Figure 9, the bubble begins to take on a mushroom shape, but the velocity fields promptly deform it, pulling its top towards the curve. The bubble starts to hollow out, undergoing a drastic change in shape. As it ascends towards the top of the channel, it leaves a trailing portion behind, gradually distancing itself from it until separation occurs, concluding the simulation due to the unsupported breakup.
We can note that the bubbles suffer significant and different geometric deformations as they travel through the different sections of the channel, the converging, diverging and curved regions. The bubbles are carried by the velocity fields, but their passage also influences them, creating a liquid film on the constricting passages, and promoting some mixing of the fluid contained. One thing of note, is that the bubble on the expanding channel maintained its bell shape after the passage, and the bubble on the curved channel suffered breakup, which suggests channel geometry might be useful to shape the bubbles in applications where bubble size and shape are important, such as two-phase heat transfer. Surface tension intensity is also a strong factor in bubble shape, and whether it breaks up or not.
