Article

Concentration Monitoring of Highly-Diluted Crude Oil-In-Water Emulsions by Ultrasonic Backscattering Sensors

by
Carlos A. B. Reyna
1,*,
Ediguer E. Franco
2,
Santiago Laín
2,3,*,
Timoteo F. de Oliveira
1,
Marcos S. G. Tsuzuki
1 and
Flávio Buiochi
1
1
Department of Mechatronics and Mechanical Systems Engineering, Escola Politécnica da Universidade de São Paulo, São Paulo 05508-030, Brazil
2
Engineering Faculty, Universidad Autónoma de Occidente, Cali 760030, Colombia
3
Hydrogen & Power-to-X Department, Centro Ibérico de Investigación en Almacenamiento Energético CIIAE, 10004 Cáceres, Spain
*
Authors to whom correspondence should be addressed.
Fluids 2025, 10(5), 108; https://doi.org/10.3390/fluids10050108
Submission received: 27 March 2025 / Revised: 19 April 2025 / Accepted: 23 April 2025 / Published: 25 April 2025

Abstract

:
This work deals with the feasibility of ultrasonic monitoring of the crude oil content in highly diluted crude oil-in-water emulsions, common mixtures obtained in the coalescence process of the petroleum industry. The measurement principle is the determination of the time of flight using the reflected pulses from a set of scatterers located in the near field of commercial transducers of 5 and 10 MHz. Dispersers consist of two rows of metal wires tensioned in front of the transducer using a specially designed mechanical part. The resulting assembly is a probe that can be introduced into a tank or pipe to perform the measurement. Experiments with crude oil-in-water emulsions with concentrations from 10 to 2000 ppm (parts per million) at a temperature of 20 °C were carried out. The results show that the small changes in the propagation velocity resulting from changes in concentration and temperature can be detected by the developed ultrasonic sensor. This opens up the possibility of determining the oil content in the emulsion by means of a calibration approach. The main motivation is the development of techniques for real-time monitoring of crude oil content in the wastewater produced in the petroleum industry.

1. Introduction

Petrochemical processes use large amounts of water to maintain well pressure, reduce oil viscosity during the extraction process, and extract mineral compounds or other inorganic solutes from crude oil. The water is emulsified mainly during the suction operation by the rotor tips of the pumps. Then, emulsified water is removed from separation reactors, avoiding its presence in the distillation towers. Excess water in crude oil can reduce the quality of sub-products and increase the production of greenhouse gases and other pollutants. On the other hand, the removed water still contains crude oil micro-particles. Above a certain level of contamination, measured in parts per million of oil, the excess water cannot be released into natural bodies of water, such as rivers or the ocean [1].
These highly diluted emulsions are called crude oil-in-water microemulsions, and their concentrations are less than 5000 parts per million. This means the crude oil content is approximately less than 0.5% in weight. The large number of chemical compounds in the crude oil makes the extracted water a toxic solution capable of damaging the environment. The final crude oil content in these crude oil-in-water microemulsions is a critical parameter in the production process.
The characterization techniques of crude oil-in-water microemulsions are an active research topic. The techniques available for turbidity measurement have little use with crude oil, and the ones commonly used in the characterization of water-in-crude oil emulsions have important disadvantages as well. Common methods for determining the water content in crude oil, such as centrifugation [2], Karl Fisher’s distillation, and grinding methods [3], are mostly useful for high concentrations, as they require the extraction of a sample from the tank or pipeline for further processing in a laboratory. These laboratory tests are time-consuming, and some techniques require the addition of chemicals that, in the case of microemulsions, can change the measured concentration.
The real-time monitoring of water concentration before and after the coalescence process is of particular interest to the petrochemical industry [4]. Ultrasound has the potential to meet this need because it allows the characterization of opaque substances. Ultrasound measurement can be completed even through the wall of the tank or pipeline, and it is not an ionizing radiation harmful to human beings. Additionally, the required equipment is robust, relatively inexpensive, and easy to operate. The flexibility of ultrasonic techniques has allowed the characterization of edible substances, polymer resins, and motor oils [5,6,7], as well as the process monitoring of polymer and concrete curing [8,9] and physical property monitoring of emulsions, suspensions, slurries [10,11,12], and bubble flows [13]. In the case of the oil industry, the literature reports the use of ultrasonic techniques in the characterization of concentrated crude oil emulsions [14,15] and the monitoring of its stability evolution [16]. Other interesting works deal with the monitoring of a multiphase oil–water–gas flow directly in a pipe [17] and the detection of oily contaminants in water courses [18]. However, in the case of crude oil-in-water microemulsions, there are no reported works yet. Regarding wave generation and reception methods, the literature reports the use of compact thick-film piezoelectric transducers [19], laser techniques for both the generation and reception of ultrasonic pulses [20] and conventional ultrasonic transducers [17].
The measurement of the propagation velocity of ultrasonic waves has been used to infer the physical properties of water-in-crude oil emulsions. In 2021, a novel multi-backscattering sensor with a simple signal processing methodology, which allows the measurement of the propagation velocity, was proposed to monitor water-in-crude-oil emulsions [15]. The ultrasonic multiple-backscattering sensor consists of a 3.5 MHz transducer and a set of thin cylindrical scatterers located in the near field. The results from this experimental arrangement showed an almost linear behavior of the propagation velocity over a volumetric water concentration from 0 % to 50 % .
This article proposes an ultrasonic technique to estimate water concentrations in water-in-crude oil microemulsions. The working principle is the determination of the time of flight of ultrasonic waves between two rows of scatterers located in front of the radiating surface of conventional transducers. The sensing device developed was initially tested with static samples to establish the measurement methodology. Other measurements were carried out with the sample being stirred by a laboratory mixer. The main motivation is the development of compact, inexpensive, and chemically and mechanically resistant devices, which could be attached to pipes or tanks in the oil process lines for on-line and real-time monitoring.

2. Theoretical Background

2.1. Propagation Velocity

When emulsions based on two non-miscible components, such as water and crude oil, have dispersed droplets whose mean diameter is smaller than the wavelength, the local acoustic propagation converges to a wavefront traveling through the mixture with constant velocity. Literature works such as [21,22] report typical droplet sizes in the range of 5–30 μ m in water-in-crude oil emulsions, which constrain the frequency operation to less than 25 MHz to avoid punctual reflection from the droplets. Then, considering a sensor with a working frequency equal to or less than 10 MHz, the total propagation time of flight of the ultrasonic wave through the heterogeneous mixture is the sum of the time of flight in each phase (layer of pure material) [23,24,25,26].
t e = t w + t p = X w c w + X p c p = X e c e ,
where t is the propagation time, X is the wave path length, c is the propagation velocity, and subscripts e, w, and p refer to emulsion, water, and petroleum oil, respectively. The relationship between propagation velocity c in the emulsion and the volume fraction depending on the selection of the dispersed phase ϕ w or ϕ p is:
c e = 1 ϕ w c w + 1 ϕ w c p = 1 ϕ p c p + 1 ϕ p c w .
Equation (2) provides the emulsion propagation velocity from the propagation velocities of the two phases, pure water and oil. The propagation velocity in the emulsion is directly related to its concentration when the droplet size is much smaller than the wavelength. Determination of the time delays in the emulsion and the phases ( t e = X e / c e , t w = X w / c w , and t p = X p / c p ) require the distances traveled by the waves X e , X w , and X p , which are known and have the same value. The results section explains in detail the procedure used to obtain the time delays ( t e , t w , and t p ) from the acquired ultrasonic signal.

2.2. Dilution Process Model

In order to analyze the dilution process during the experiments, a simple mixing model in a stirred tank was used. This model is useful for describing the mixture homogenization time and establishing the appropriate waiting time for measurement. The model consists of the following first-order differential equation:
q ( ϕ i n ϕ ) = V d ϕ d t
where ϕ i n is the concentration of the input fluid (zero in the case of pure water), ϕ is the concentration in the control volume and, consequently, in the output flow from the stirred tank, q is the input and output volumetric flow, and V is the constant control volume. The solution of Equation (3) is
ϕ = ϕ 0 1 exp q V t .
This equation shows that the concentration decays exponentially to zero with a time constant τ = V / q for a constant input flow of pure water ( ϕ 0 is the initial concentration).
The concentrations ϕ 0 and ϕ in Equation (3) are in terms of mass, that is
ϕ = ϕ m = m p m p + m w ,
where m p and m w are the petroleum and water masses, respectively. If the concentration values are small but measurable, they can be labeled in parts per million (ppm). On the other hand, the concentration in Equation (2) is volumetric ( ϕ p = V p V p + V w and ϕ w = V w V p + V w ). Then, to correlate both properties, the masses in Equation (5) are divided by the density of the corresponding fluid:
ϕ p = ϕ V = m p ρ p m p ρ p + m w ρ w = m p m p + ρ p ρ w m w .
Combining Equations (5) and (6) gives an expression for the volumetric concentration in terms of the mass concentration.
ϕ p ( t ) = 1 1 + ρ p ρ w ( 1 ϕ ) ϕ .
Assuming that the water and petroleum densities do not change through the processes, the expression (7) can be introduced in Equation (2). This provides the propagation velocity of the emulsion as a function of time:
c e ( t ) = 1 ϕ p ( t ) c p + 1 ϕ p ( t ) c w .
This theoretical propagation velocity will be compared with the results obtained by ultrasound in the dilution experiments. To compare the theoretical concentration in ppm (Equation (4)) with the experimental concentration obtained from the experimental propagation velocity c e x p ( t ) of the emulsion, Equation (2) can be modified in the following way:
ϕ p e x p ( t ) = c w c e x p ( t ) 1 c w c p 1 ,
which leads to the concentration in ppm, a dimensionless expression, multiplied by 1 × 10 6 , instead of multiplying by 100 (percentage), such as ϕ p in Equations (2) or (9), among others:
ϕ p p m = 1 1 + ρ p ρ w 1 ϕ p e x p ( t ) ϕ p e x p ( t ) .

3. Materials and Methods

3.1. Ultrasonic Backscattering Probes

In this work, backpropagation transducers refer to an ultrasonic transducer with an accessory part that supports a set of scatterers in the near field. The scatterers are metallic rods whose function is to reflect the wavefront coming from the radiating surface. Unlike the conventional walls of ultrasonic cells or transmission receiver probes [23,24] implemented in previous works, the scatterers in the backpropagation sensors reflect the transducer wavefront, achieving a greater interaction with the sample, which means more information about the propagation media when the echo returns to the transducer. Even though the backpropagation sensor uses de-phased rows of scatterers, this work validates the measurement of propagation velocity using successive echoes between them. It will be presented in the results section that the measured propagation velocity agrees with the mixture model of Equation (2).
Figure 1a shows the measurement probes manufactured using two ultrasonic transducers, a commercial 10 MHz 19 mm diameter piezoelectric transducer (Panametrics-Olympus, V321-SU) and a 5 MHz 10 mm diameter transducer of own manufacture. An accessory made by additive manufacturing, which contains a set of 10 metallic strings of 0.1 mm diameter, was installed in front of the transducers. The strings were distributed in two rows of five strings per row, separated by 1.5 mm. The separation between the rows was 1.7 mm. The configuration of the ultrasonic probes is shown in Figure 1b. The rows of scatterers provide two reflected pulses that allow the determination of the propagation velocity in the sample. In addition, the sensor can be inserted into pipes or tanks, providing flexibility and low pressure losses. Lower frequencies make it not possible to observe the small changes in propagation velocity induced by changes in concentration. On the other hand, at 20 MHz, a low signal-to-noise ratio and signal instability were observed as a consequence of high attenuation and scattering.

3.2. Experimental Setup

Figure 2 shows a schematic representation of the measurement setup. The sample was stored in a 3000 mL glass beaker. The two ultrasonic sensors of 10 and 5 MHz, marked as P1 and P2, were immersed in the sample, and each one connected to an ultrasonic pulser/receiver working in pulse-echo mode. The RF signal output from the pulser/receivers is connected to the input channels of a high-speed data acquisition board (GAGE, RazorMax PCIe 16-Bit Digitizer, Lockport, IL, USA). The acquisition process is synchronized by the trigger signal of the pulser/receiver connected to the 10 MHz probe. The test was performed with temperature control (20 °C) in a thermostatic bath (Huber, CC-106A, Offenburg, Germany) with a precision of 0.2 °C. In addition, the sample temperature was measured using a PT100-type sensor (DeltaOHM, model HD2107.2, Caselle di Selvazzano, PD, Italy) with a precision of 0.1 °C. The sample was constantly homogenized by an electric mixer (Fisatom, model 711, São Paulo—SP, Brazil). In the case of the tests with crude oil-in-water emulsions, two peristaltic pumps were used to modify the concentration. One pump introduces water from the thermostatic bath to dilute the emulsion and another pump extracts the excess sample from the beaker. The number of rotations of the pump allows the added volume to be precisely determined. In the case of the solution of NaCl in water, the pumps were not used, the concentration was increased by adding more salt to the solution. The data acquisition process was controlled by a desktop computer using specially developed Matlab scripts. The ultrasonic signals and temperature were stored in the computer for further analysis.
An initial emulsification process is required to obtain the initial sample with a concentration of 4000 ppm. A dispersing machine (IKA Labortechnick, model T25, Staufen, Germany) working at 15,000 rpm was used to mix 500 g of pure water and 2 g of crude oil with an API gravity of 30.5° obtained from the well LL83 of Petrobras located in Mangaratiba, Brazil. To improve the emulsion stability, 2 g of emulsifier (SF-770, Loctite, Rocky Hill, CT, USA) was used. Subsequently, during the experiment, the emulsion was diluted by adding water with pump 2, and after a mixing time of 5 min, the same volume of sample was withdrawn with pump 1. Peristaltic pumps allow the volume to be controlled with good precision. This emulsification process provides a droplet distribution with a mean diameter of around 5 μ m when sunflower oil was emulsified with water under the same conditions [27]. In this case, the emulsification time was increased from 3 to 5 min to guarantee a similar distribution of droplet size in the emulsion, and the dilution process was performed in less that 40 min.

3.3. Experimental Procedure

To evaluate the feasibility of measuring the propagation velocity using the backscatter probe, measurements were performed with a solution of sodium chloride (NaCl) in water. In this experiment, successive concentrations were obtained by adding 1 g of NaCl to the solution. It started with 3000 g of pure water and finished with a salt concentration of 2666 ppm or 0.26% (8 g NaCl). The solutions for each concentration were stirred for 150 s to completely dissolve the salt and restore the test temperature. The ultrasonic signals were digitalized and processed to determine the propagation velocity of each concentration. This procedure was repeated three times, and the average and standard deviation of the propagation velocities were obtained. This test was performed at 20 °C.
In the case of the emulsion, the experimental procedure begins with an initial emulsion. In a glass beaker, 500 g of water, 2 g of the chemical emulsifier, and 2 g of crude oil are emulsified by the dispersing machine for five minutes at 15,000 rpm. The resultant emulsion was added to the 3000 mL beaker and partially immersed in the thermal bath. The beaker already had 1500 g of water stabilized to the test temperature (20 °C). The subsequent homogenization was made with the mixer at 200 rpm. The ultrasonic sensors were placed on the bottom of the beaker. A couple of pumps were used to feed pure water and extract the same volume of the diluted sample in order to keep the sample volume inside the beaker. The flow in both pumps was 4.4 mL/s. The procedure was repeated twice [15].
In another experiment, the propagation velocity of water in a temperature range between 19 and 21 °C was measured. These results were used in the signal processing. Since emulsions are very dilute, variations in propagation velocity due to temperature changes correspond mainly to water (the continuous phase), this test was repeated twice.

3.4. Signal Processing

The calculation of the delays between the ultrasonic pulses is performed in the frequency domain, using an algorithm based on the cross-correlation:
( δ t ) = s 1 ( t ) s 2 ( t + δ t ) d t
where s 1 ( t ) and s 2 ( t ) are the ultrasonic pulses. Cross-correlation measures the similarity of the two pulses as a function of a time shift. The similarity of the pulses is high because they are reflections of the same initial pulse. The cross-correlation peaks at a position that depends on the time delay between the two pulses. However, previous research has shown that better accuracy is achieved by observing the zero crossing of the cross-correlation function, rather than its maximum value. This also allows interpolation between points surrounding the zero crossing to estimate the crossing point with sub-sample accuracy [28].
In order to apply the delay calculation algorithm, the raw signals from the acquisition system must undergo initial processing. Appropriate time windows confine the ultrasonic pulses, which are then centered and filtered. These time windows are generally static and depend on the configuration of the measurement device. A low-pass filter is sometimes applied to eliminate high-frequency components that hinder signal comparison.

4. Results and Discussion

Figure 3a shows the signals obtained from both backscattering probes ( s 1 and s 2 on Equation (11)). Notice that the 5 MHz prototype exhibits a constructive interference in the middle of the reflections from the first and second rows of scatterers, which is not present in the response of the 10 MHz probe. This additional pulse is evidence of a complicated interference pattern at 5 MHz [29]. However, in the cross-correlation algorithm, the main pulses have more relevance to calculate the time of flight ( t e ), avoiding the interference pulse. The known separation between the two rows of scatterers of a = 1.5 mm and b = 0.75 mm for transducers of 10 MHz and 5 MHz, respectively (see Figure 1a), allows the determination of the propagation velocity ( c e ).
Figure 3b shows the propagation velocity, as a function of concentration, measured with both backscattering probes in the solution of NaCl in water. In the case of the 10 MHz transducer, a linear behavior with low standard deviation is observed. The variation in the propagation velocity is 3.3 m/s for a variation in concentration of 0.25 % . It is important to note the small variation of 3.4 m/s ( 0.22 % with respect to the pure water value) in the propagation velocity and a maximum relative standard deviation of 0.5%. These results show the good sensitivity and stability obtained with the 10 MHz probe. In the case of the 5 MHz probe, the propagation velocity is in agreement with the 10 MHz probe for concentration values less than 0.1 % . For higher concentrations, the discrepancy is up to 1 m/s, and the behavior deviates from the linear trend. In addition, the standard deviation is up to ten times higher.
These results show that the developed methodology allows measuring small changes in the propagation velocity in liquids, with changes of 3.4 m/s in the NaCl–Water solution. However, the expected change in the microemulsion propagation velocity for oil concentrations between 0 and 2000 ppm is only 0.18 m/s. Such small changes cannot be detected by the 5 MHz transducer. Therefore, the microemulsion tests were performed using the 10 MHz probe. On the other hand, small temperature changes affect the measurement, and a compensation mechanism should have been implemented.
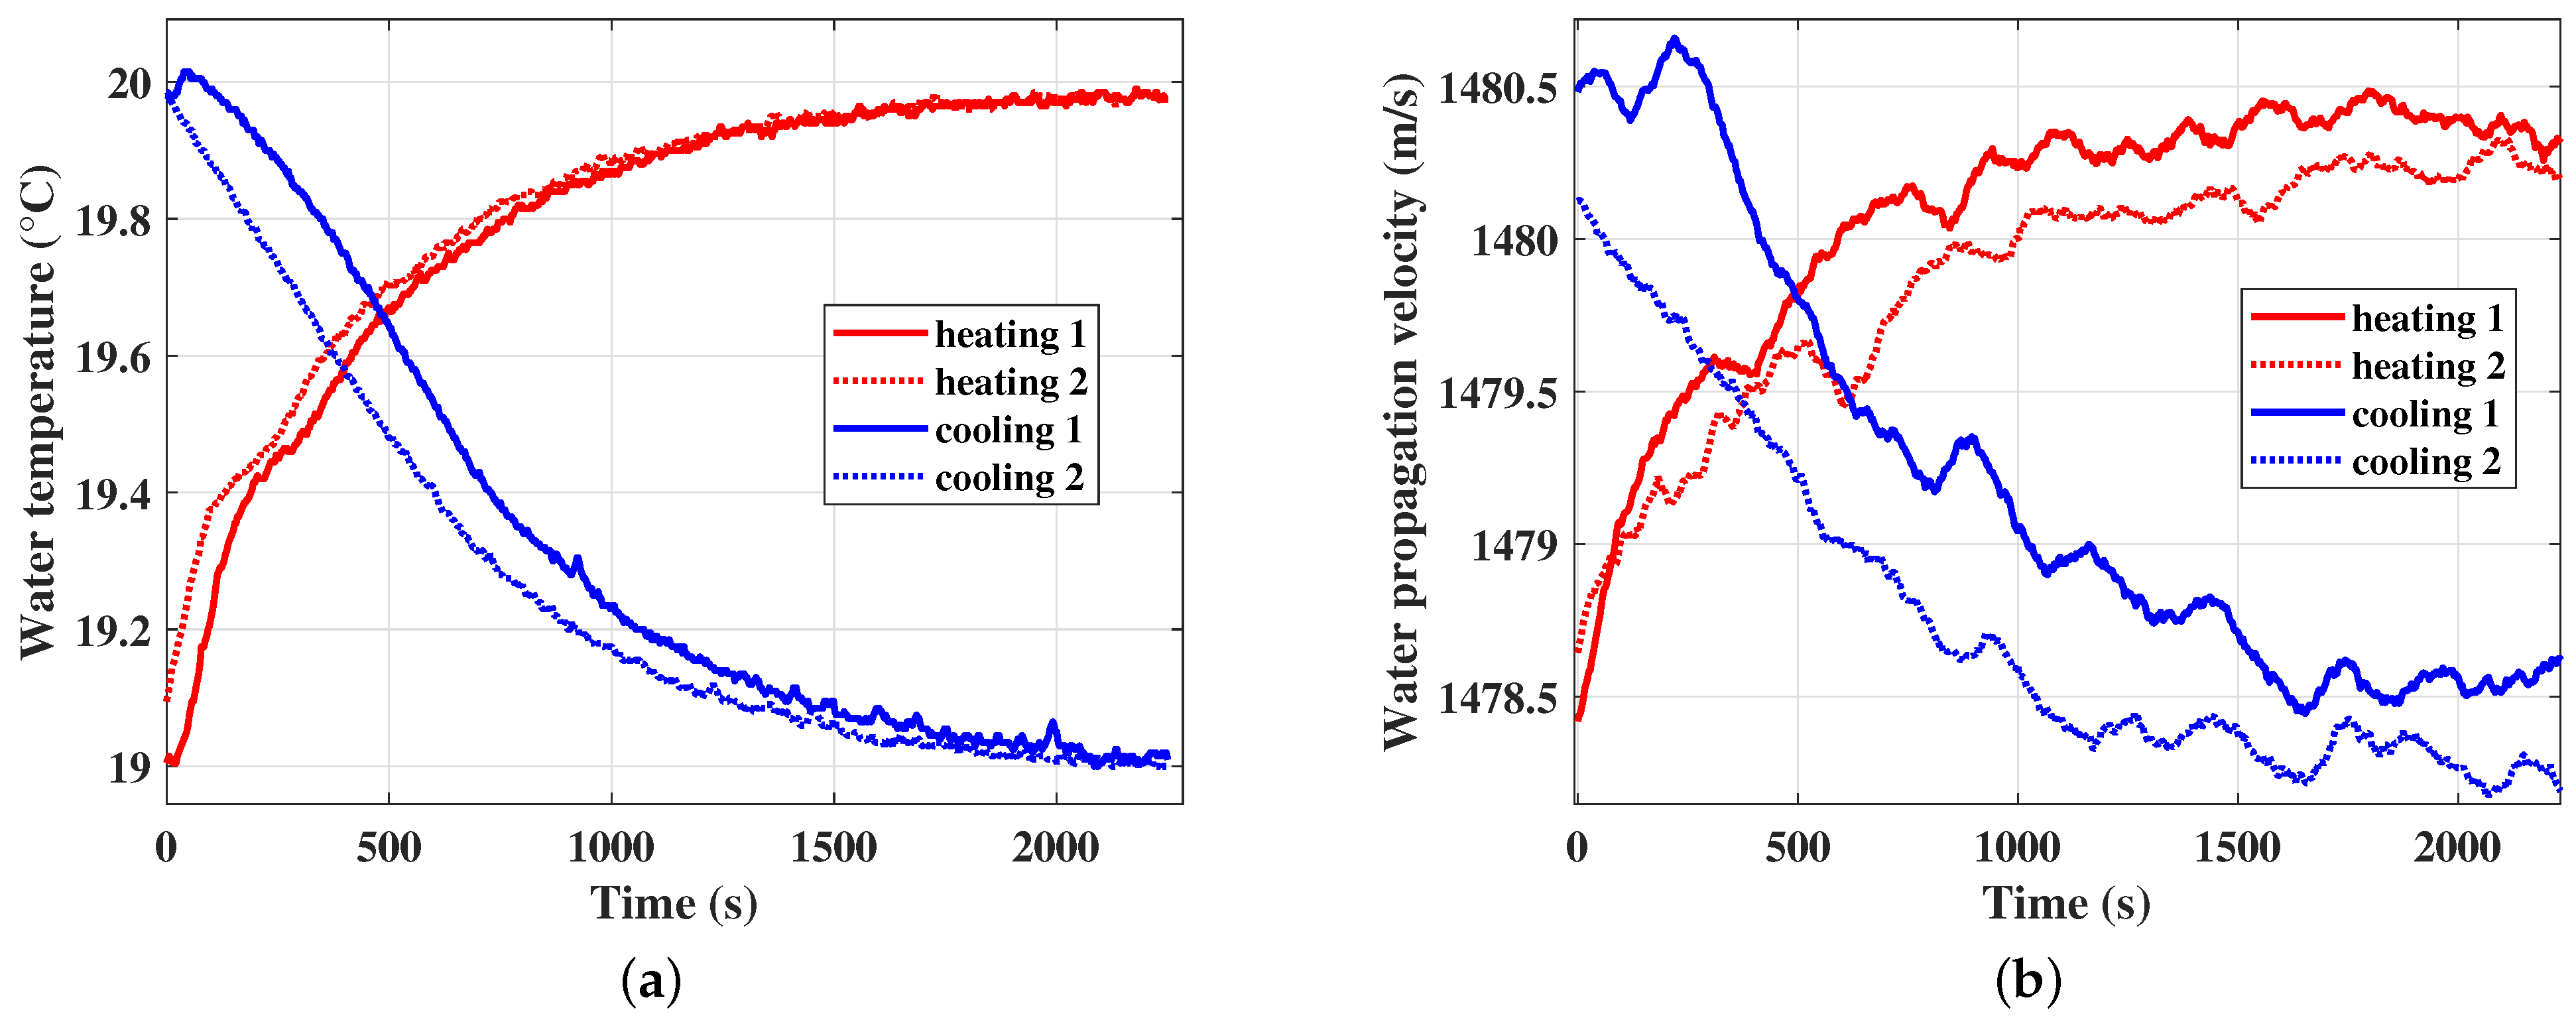
Figure 4a,b show the temperature and the propagation velocity, respectively, of pure water as a function of the acquisition time, in the temperature range from 19 °C to 20 °C at 10 MHz. This range of temperature propagation velocity is related to the range of variations in the dilution during our experiments. Even though the dilution process proposed in our experiments was intended to occur at a constant temperature (20 °C), the input and output fluxes led to slight temperature changes in the main volume of the sample during the dilution. That is the main reason to focus the attention on light temperature propagation velocity variations. These are the results used to obtain the curve in Figure 3b. The measurement was performed in a heating process from 19 °C to 20 °C, and in a cooling process from 20 to 19 °C, repeated twice in each case. The curves exhibit similar behavior, showing that the variation in propagation velocity is primarily a result of temperature variations. However, the propagation velocity curve exhibits greater fluctuations. This is because the value obtained is the average over the entire wave propagation path, and is affected by local temperature gradients.
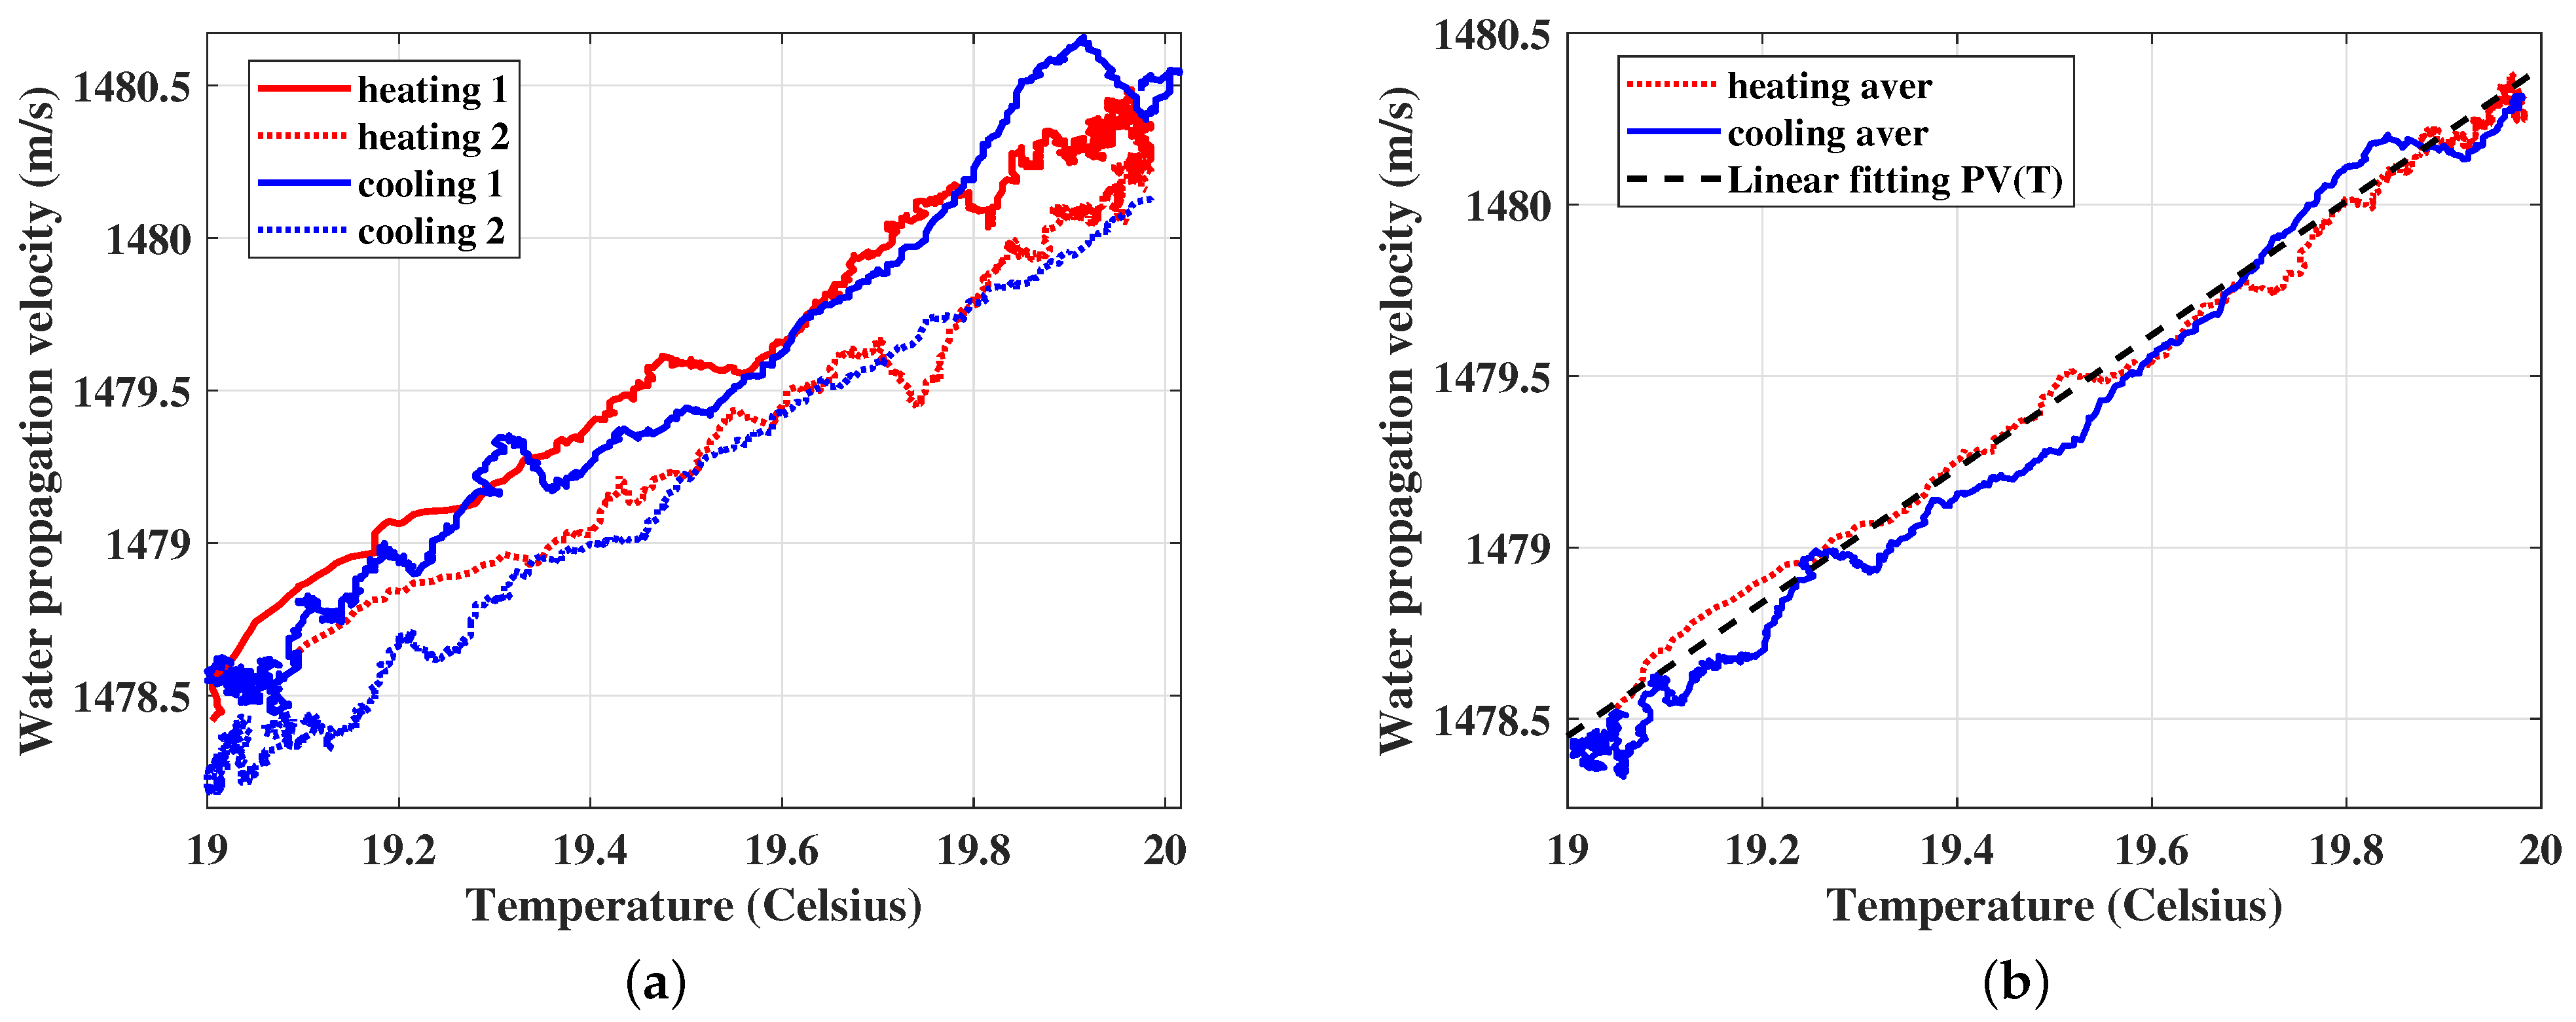
Information in Figure 4a,b allows a relation between the propagation velocity and temperature to be established. Figure 5a shows the propagation velocity as a function of temperature obtained in both cases, with heating and cooling between 19° and 20°. The results suggest linear behavior, with fluctuations due to thermal hysteresis and small delays in the measurement of both physical properties, temperature and propagation velocity. Figure 4b shows the average of the two measurements. The curves overlap and the dispersion is reduced, suggesting that most of the error is of a random origin. These averaged data were fitted using linear regression. The fitted line is
c W ( T ) = 1.95 T + 1441.4 ,
where c W is the propagation velocity in pure water, and T is the temperature in Celsius degrees. This equation will be useful to compensate for the effects of the temperature on the measurement with the crude oil-in-water microemulsions.
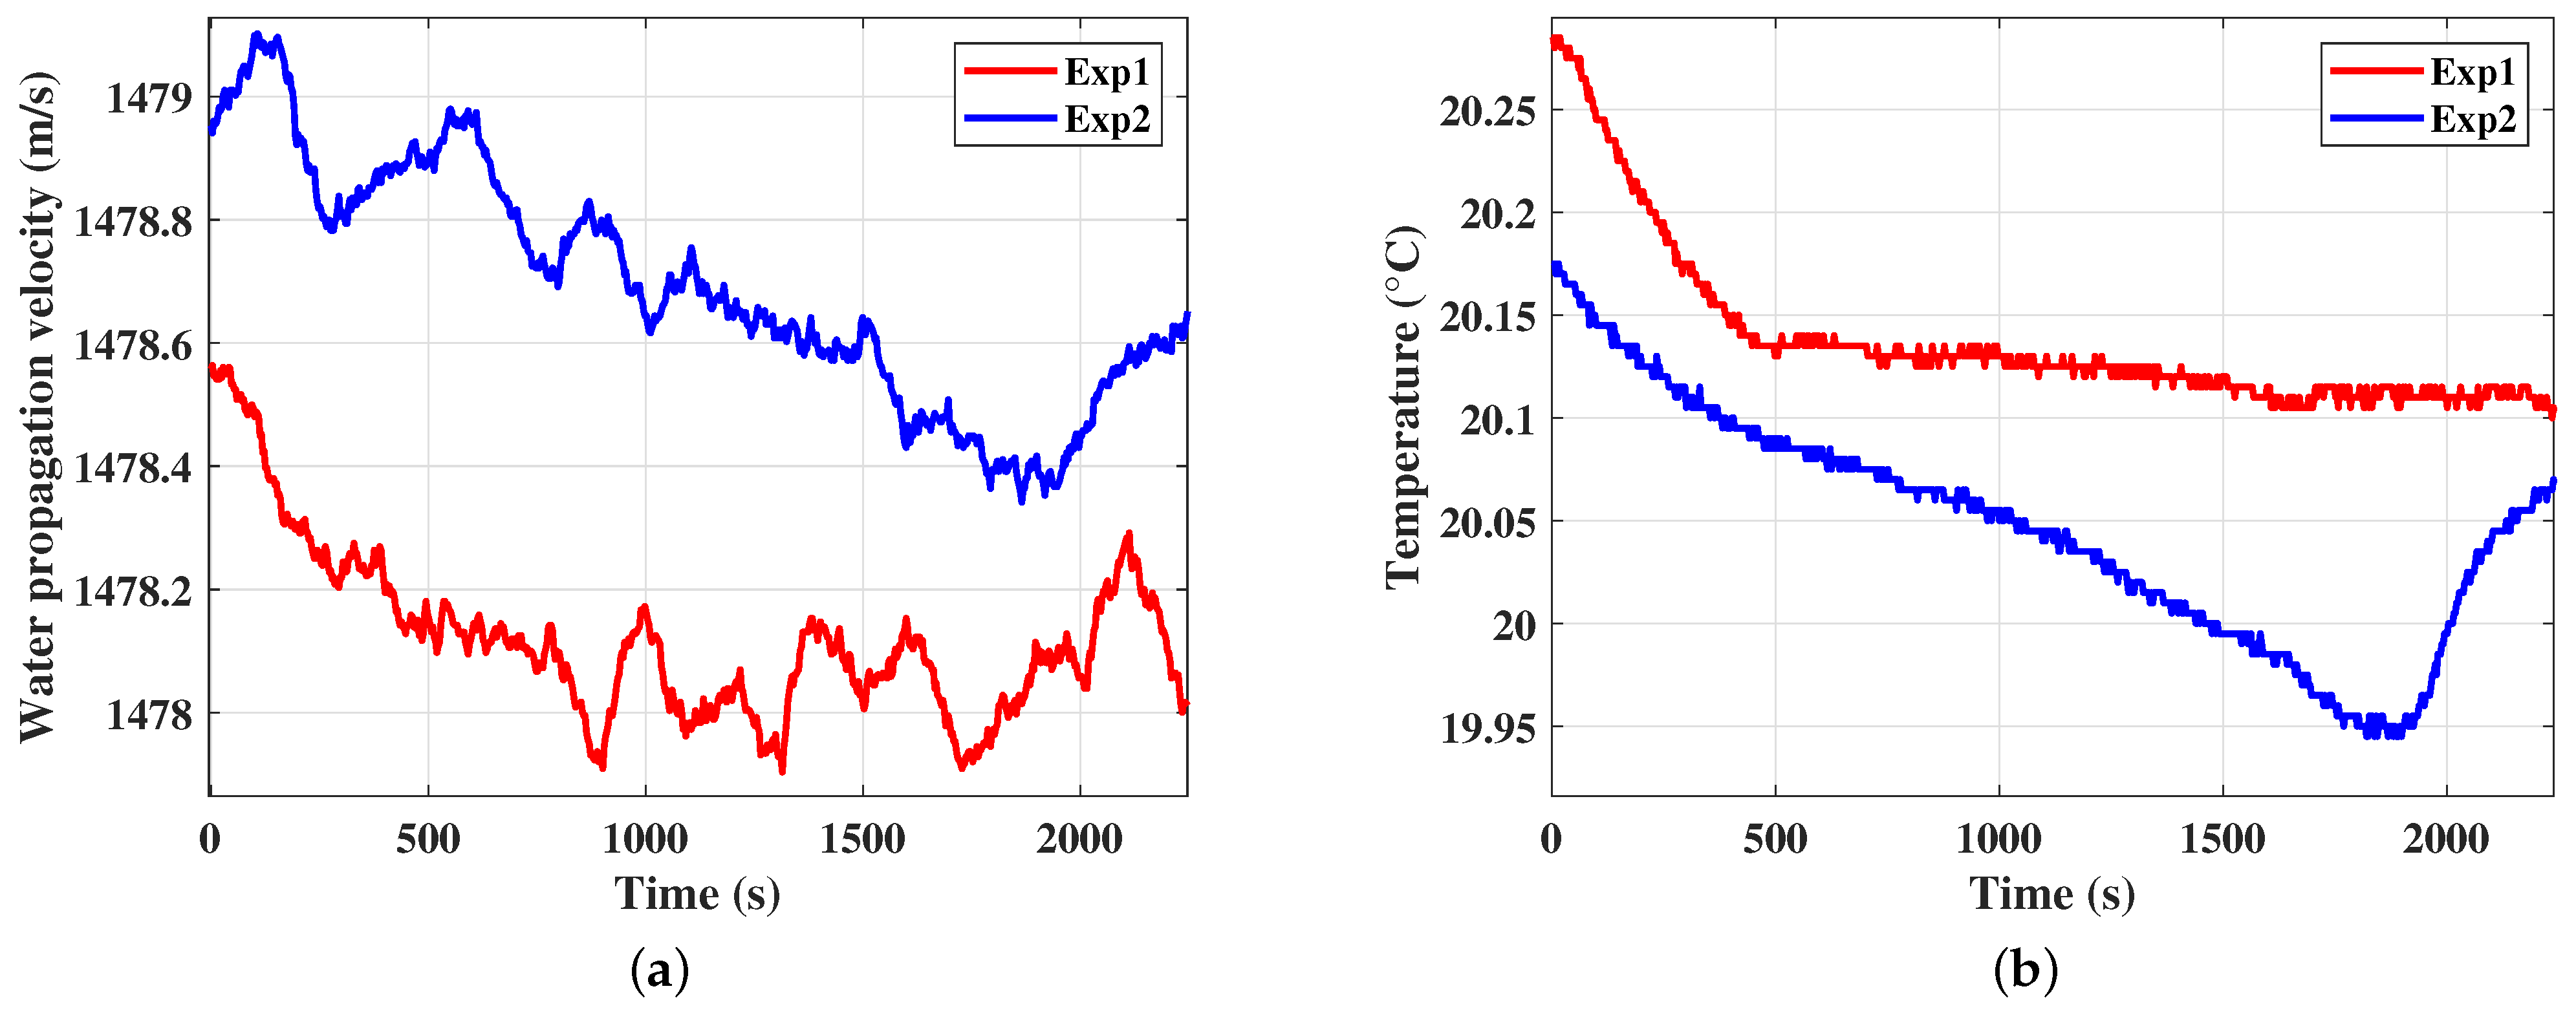
The results of propagation velocity and temperature of the crude oil-in-water emulsion during the dilution process at 20 °C, using the experimental setup from Figure 2b are shown in Figure 6a,b, respectively. When water is added to the initial emulsion, the propagation velocity decreases. Theoretically, a higher amount of water in the emulsion should lead to an increase in the propagation velocity. Even though the experiment was set at 20 °C, a variation of around 0.3 °C was observed. This happens because the temperature of the added water is slightly different from the temperature of the emulsion. These variations (1%) carry significant effects on propagation velocity, as shown in Figure 5b. However, a correlation can be observed between the propagation velocity and temperature curves, suggesting the possibility of compensation.
The compensation process consists of adjusting the propagation velocity measured in the microemulsion, using the measured temperature. The velocity variation corresponding to a temperature change is obtained by Equation (12), then it is subtracted from the measured velocity as follows:
c E ( ϕ , T ) = c M ( ϕ ) δ ( T ) + O
where c E ( ϕ ) is the compensated propagation velocity function, c M ( ϕ ) is the propagation velocity measured in the emulsion, δ ( T ) is the temperature correction of the propagation velocity, and O denotes an offset value. This offset is a knowing propagation velocity value in some specific condition, such as pure water at 20 °C. This methodology assumes that the variation in the propagation velocity in the emulsion is the same as in pure water due to the very low concentration of oil.
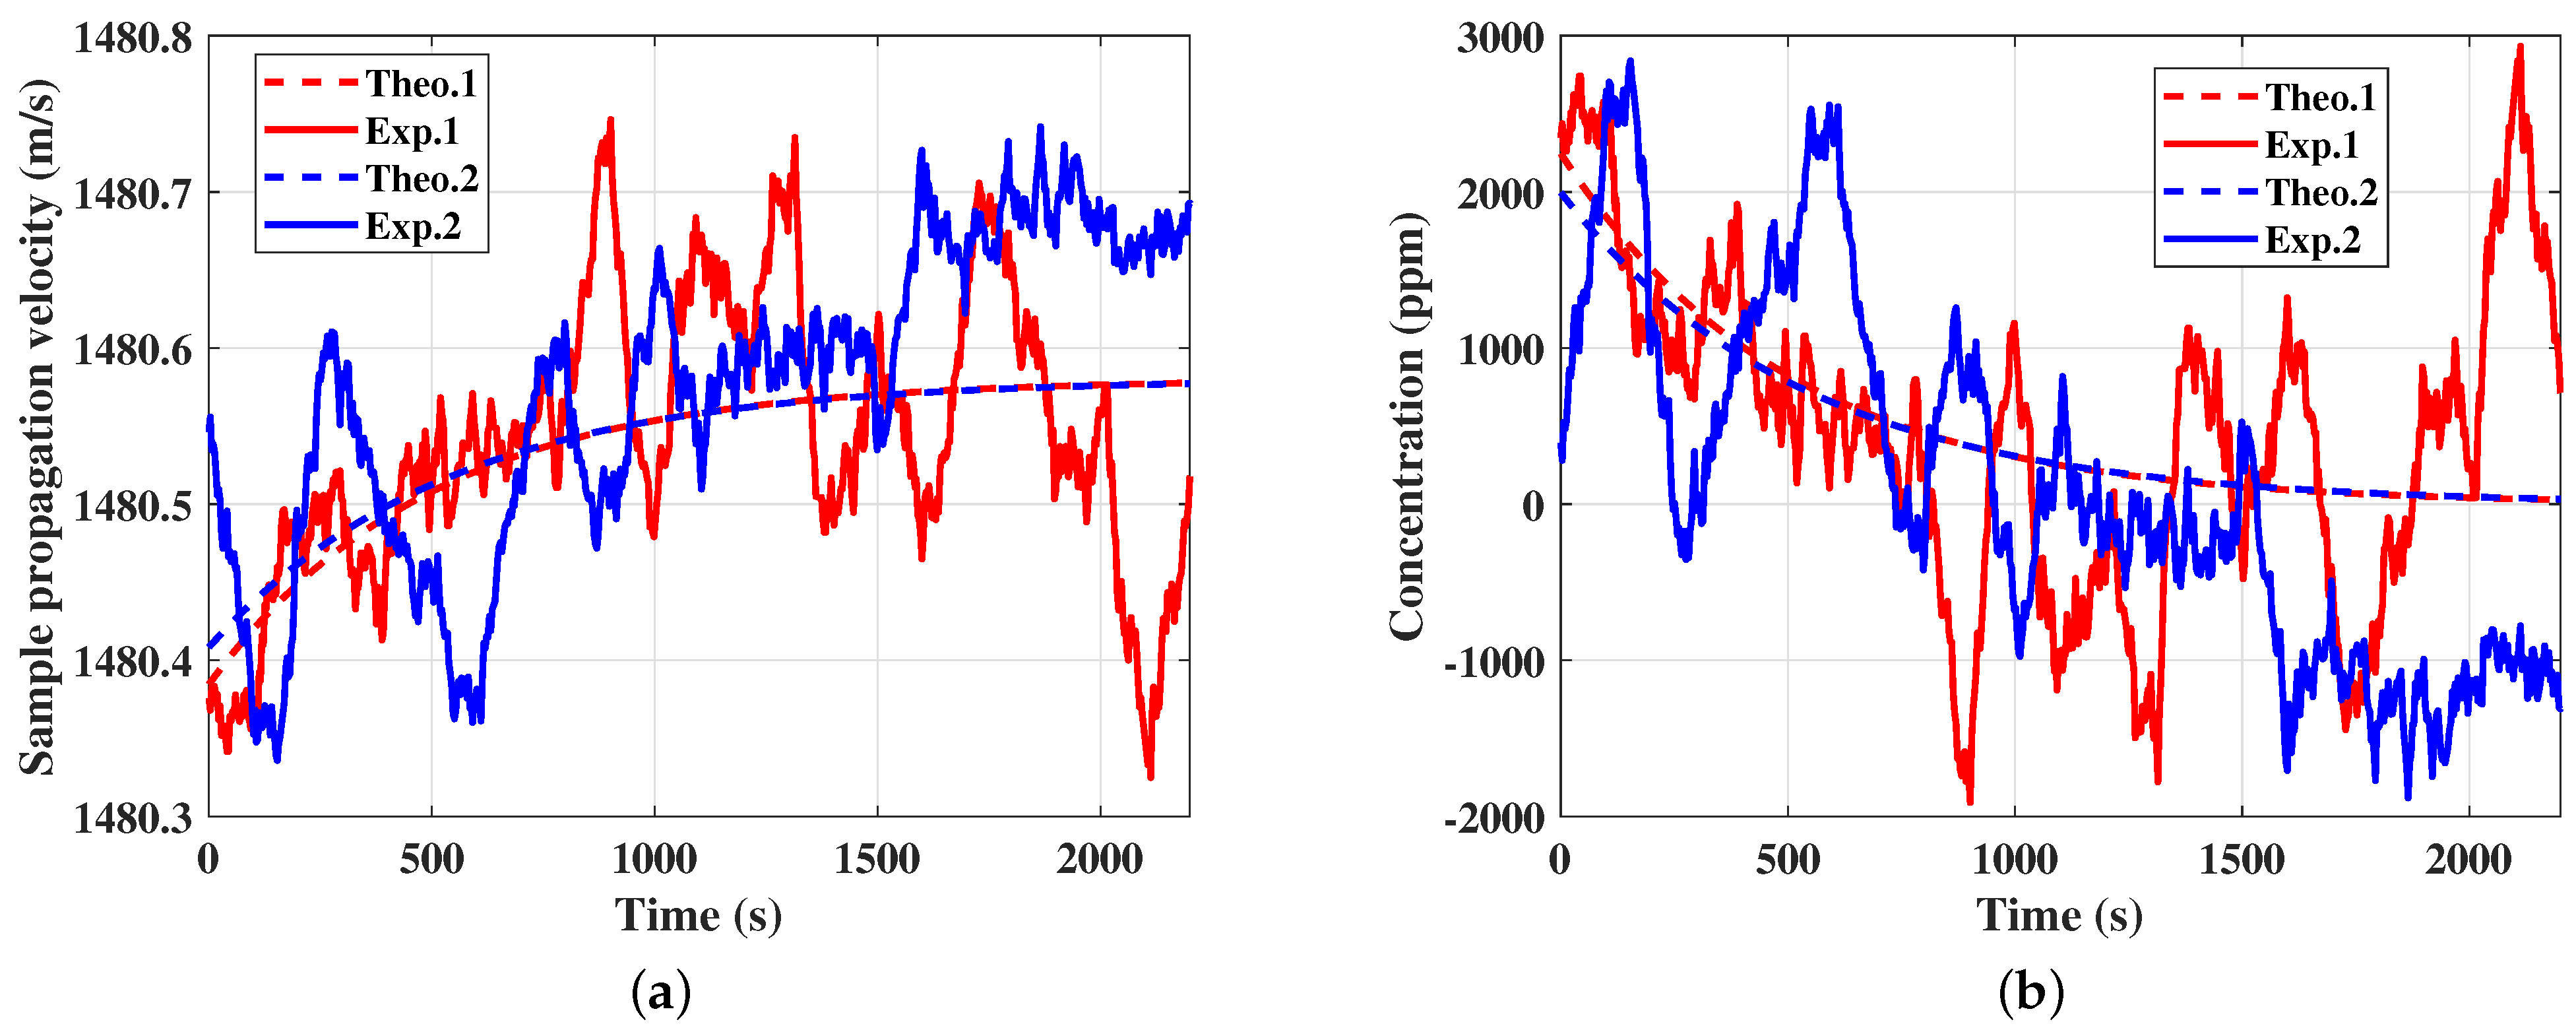
Figure 7a shows the propagation velocity obtained in the dilution test. The test lasted 2300 s, and the concentration varied from an initial value of 2000 ppm to a value close to zero at the end of the test. Two tests performed on different days are shown. It can be clearly seen that the measured values follow the same trend as the theoretical values, although oscillations occur that coincide with the periodicity of water addition to the system (beaker). This shows that, despite the implemented compensation scheme, temperature changes still significantly interfere with the measurement. However, it should be noted that this variation is only 0.03% with respect to the propagation velocity of pure water. The results also show that the measured values oscillate around the theoretical values, but it is not possible to implement an averaging scheme to reduce the error, for example, a moving average, because the concentration varies over time in these experiments.
Figure 7b shows the emulsion concentration calculated from the propagation velocities reported in Figure 7a. The measured concentration follows the same trend, fluctuating around the theoretical values. However, the fluctuations are large, even showing negative concentrations. These results are evidence of low sensitivity and the need for more precise temperature control. A 1 °C temperature change induces a greater variation in propagation velocity than expected due to the presence of oil in the microemulsion. Temperature variations also affect the measurement through thermal expansion, modifying the wave propagation distances, although the effect is small compared to the change in propagation velocity. Furthermore, the presence of droplets of comparable size or larger than the wavelength can generate reflections, scattering, or excessive attenuation that make measurement difficult. These droplets can also be in the solid or gas phase due to the complexity of the emulsions involved. These non-ideal effects and sample characteristics are experimental limitations of the ultrasonic measurement technique based on backscatter sensors.

5. Conclusions

This article evaluates a proposed methodology for the ultrasonic measurement of oil concentrations in highly diluted crude oil-in-water emulsions. These emulsions are a byproduct of the oil extraction process and their characterization is important for both the oil industry and environmental control agencies. Due to the changing concentration of these emulsions during the production process, experiments were implemented by continuously diluting the sample. The results show that it is feasible to use the propagation velocity of ultrasonic waves generated with the implemented backscatter transducers to monitor oil concentrations.
Transducers (probes) with operating frequencies of 5 and 10 MHz were implemented, demonstrating that the 10 MHz one provides better resolution and stability. Preliminary tests carried out at working frequencies lower than 5 MHz and higher than 10 MHz showed low sensibility and high attenuation, respectively, providing a low signal-to-noise ratio and considerable distortion of the reflected ultrasonic pulses. Key features of the proposed transducers include their robustness, compact size, ease of installation in pipes and tanks, and low cost. Furthermore, the signal processing is relatively simple, and the calibration only requires prior measurements of water propagation velocity with the same transducer.
A compensating method for changes in propagation velocity due to temperature variations was implemented. This method allowed for measurements of propagation velocity with variations less than 0.03% of the propagation velocity of pure water at 20 °C. However, the small temperature changes observed during the experiments, due to the limitations of the temperature control system, still significantly affected the measurement. Then, a more rigorous temperature control is required. This requirement can be met in the laboratory environment, but it is a limitation for practical applications in industry.
The results showed that the proposed methodology has potential for monitoring the concentration of highly diluted samples in real time. However, further research, including more sophisticated experimental techniques, primarily in temperature control, is required.

Author Contributions

The authors’ contributions to the development of this research article are reported below. Conceptualization, C.A.B.R. and F.B.; methodology, C.A.B.R. and T.F.d.O.; software, C.A.B.R.; validation, C.A.B.R., E.E.F. and F.B.; formal analysis, C.A.B.R., E.E.F., S.L. and F.B; investigation, C.A.B.R., E.E.F. and F.B.; resources, T.F.d.O., S.L., F.B. and M.S.G.T.; data curation, C.A.B.R.; writing—original draft preparation, C.A.B.R.; writing—review and editing, E.E.F., F.B. and S.L.; visualization, C.A.B.R. and E.E.F.; supervision, F.B. and M.S.G.T.; project administration, F.B. and M.S.G.T.; funding acquisition, F.B., M.S.G.T. and S.L. All authors have read and agreed to the published version of the manuscript.

Funding

The authors acknowledge the Brazilian institutions Petrobras/ANP (grant #0050.0127476.24.9), CNPq (grants #306.123/2022–3 and #312126/2021-2) and Capes for their financial support to this research. E. Franco and S. Lain were also founded by the Colombian institution Universidad Autónoma de Occidente (UAO) through grant 24INTER-444.

Data Availability Statement

The raw data supporting the conclusions of this article will be made available by the authors on request.

Conflicts of Interest

The authors declare no conflicts of interest.

References

  1. Stewart, M.; Arnold, K. Emulsions and Oil Treating Equipment; Elsevier: Amsterdam, The Netherlands, 2009. [Google Scholar] [CrossRef]
  2. Jadoon, S.; Malik, A.; Amin, A.A. Separation of Sediment Contents and Water from Crude Oil of Khurmala and Guwayer Oil Fields in Kurdistan Region by using Centrifuge Method. Int. J. Adv. Eng. Res. Sci. 2017, 4, 2919–2922. [Google Scholar] [CrossRef]
  3. Ivanova, P.G.; Aneva, Z.V. Assessment and assurance of quality in water measurement by coulometric Karl Fischer titration of petroleum products. Accredit. Qual. Assur. 2006, 10, 543–549. [Google Scholar] [CrossRef]
  4. Shah, A.; Fishwick, R.; Wood, J.; Leeke, G.; Rigby, S.; Greaves, M. A review of novel techniques for heavy oil and bitumen extraction and upgrading. Energy Environ. Sci. 2010, 3, 700–714. [Google Scholar] [CrossRef]
  5. Runrun, H.; Runyang, M.; Chenghui, W.; Jing, H. Ultrasonic shear-wave reflectometry applied to monitor the dynamic viscosity of reheated edible oil. J. Food Process Eng. 2020, 43, e13402. [Google Scholar] [CrossRef]
  6. Franco, E.E.; Adamowski, J.C.; Higuti, R.T.; Buiochi, F. Viscosity measurement of Newtonian liquids using the complex reflection coefficient. IEEE Trans. Ultrason. Ferroelectr. Freq. Control 2008, 55, 2247–2253. [Google Scholar] [CrossRef]
  7. Kazys, R.; Voleisis, A.; Sliteris, R. Investigation of the Acoustic Properties of Viscosity Standards. Arch. Acoust. 2016, 41, 55–58. [Google Scholar] [CrossRef]
  8. Alig, I.; Lellinger, D.; Sulimma, J.; Tadjbakhsch, S. Ultrasonic shear wave reflection method for measurements of the viscoelastic properties of polymer films. Rev. Sci. Instrum. 1997, 68, 1536–1542. [Google Scholar] [CrossRef]
  9. Wang, X.; Subramaniam, K.V.; Lin, F. Ultrasonic measurement of viscoelastic shear modulus development in hydrating cement paste. Ultrasonics 2010, 50, 726–738. [Google Scholar] [CrossRef] [PubMed]
  10. Higuti, R.; Bacaneli, E.; Furukawa, C.; Adamowski, J. Ultrasonic characterization of emulsions: Milk and water in oil. In Proceedings of the 1999 IEEE Ultrasonics Symposium. Proceedings. International Symposium (Cat. No.99CH37027), Tahoe, NV, USA, 17–20 October 1999; Volume 1, pp. 779–782. [Google Scholar] [CrossRef]
  11. McClements, D.J. Ultrasonic characterizations of emulsions and suspensions. Adv. Colloid Interface Sci. 1997, 37, 33–72. [Google Scholar] [CrossRef]
  12. Stolojanu, V.; Prakash, A. Cgaracterization of slurry systems by ultrasonic techniques. Chem. Eng. J. 2001, 84, 215–222. [Google Scholar] [CrossRef]
  13. Franco, E.E.; Henao Santa, S.; Cabrera, J.J.; Laín, S. Air Flow Monitoring in a Bubble Column Using Ultrasonic Spectrometry. Fluids 2024, 9, 163. [Google Scholar] [CrossRef]
  14. Alshaafi, E.; Prakash, A.; Mercer, S. Ultrasonic based methods to characterize stability of water-in-crude oil emulsions. Colloids Surfaces A Physicochem. Eng. Asp. 2021, 614, 125900. [Google Scholar] [CrossRef]
  15. Durán, A.L.; Franco, E.E.; Reyna, C.A.B.; Pérez, N.; Tsuzuki, M.S.G.; Buiochi, F. Water Content Monitoring in Water-in-Crude-Oil Emulsions Using an Ultrasonic Multiple-Backscattering Sensor. Sensors 2021, 21, 5088. [Google Scholar] [CrossRef] [PubMed]
  16. Perez, N.; Blasina, F.; Buiochi, F.; Duran, A.; Adamowski, J. Evaluation of a multiple scattering sensor for water-in-oil emulsion monitoring. Proc. Meet. Acoust. 2020, 38, 055007. [Google Scholar] [CrossRef]
  17. Chillara, V.K.; Sturtevant, B.T.; Pantea, C.; Sinha, D.N. Ultrasonic sensing for noninvasive characterization of oil-water-gas flow in a pipe. AIP Conf. Proc. 2017, 1806, 090014. [Google Scholar] [CrossRef]
  18. Franco, E.E.; Adamowski, J.C.; Buiochi, F. Ultrasonic sensor for the presence of oily contaminants in water. Dyna 2012, 79, 4–9. [Google Scholar]
  19. Meng, G.; Jaworski, A.J.; White, N.M. Composition measurements of crude oil and process water emulsions using thick-film ultrasonic transducers. Chem. Eng. Process. Process Intensif. 2006, 45, 383–391. [Google Scholar] [CrossRef]
  20. Lu, Z.Q.; Yang, X.; Zhao, K.; Wei†, J.X.; Jin, W.J.; Jiang, C.; Zhao, L.J. Non-contact Measurement of the Water Content in Crude Oil with All-Optical Detection. Energy Fuels 2015, 29, 2919–2922. [Google Scholar] [CrossRef]
  21. Moradi, M.; Alvarado, V.; Huzurbazar, S. Effect of salinity on water-in-crude oil emulsion: Evaluation through drop-size distribution proxy. Energy Fuels 2011, 25, 260–268. [Google Scholar] [CrossRef]
  22. Maia Filho, D.C.; Ramalho, J.B.; Spinelli, L.S.; Lucas, E.F. Aging of water-in-crude oil emulsions: Effect on water content, droplet size distribution, dynamic viscosity and stability. Colloids Surfaces A Physicochem. Eng. Asp. 2012, 396, 208–212. [Google Scholar] [CrossRef]
  23. Reyna, C.A.; Franco, E.E.; Tsuzuki, M.S.; Buiochi, F. Water content monitoring in water-in-oil emulsions using a delay line cell. Ultrasonics 2023, 134, 107081. [Google Scholar] [CrossRef] [PubMed]
  24. Reyna, C.A.B.; Franco, E.E.; Durán, A.L.; Pereira, L.O.V.; Tsuzuki, M.S.G.; Buiochi, F. Water Content Monitoring in Water-in-Oil Emulsions Using a Piezoceramic Sensor. Machines 2021, 9, 335. [Google Scholar] [CrossRef]
  25. Reis, J.C.R.; Santos, Â.F.; Lampreia, I.M. Chemical thermodynamics of ultrasound speed in solutions and liquid mixtures. ChemPhysChem 2010, 11, 508–516. [Google Scholar] [CrossRef] [PubMed]
  26. Ernst, S.; Glinski, J. Comment: Ultrasonic velocities for deuterium oxide–water mixtures at 298.15 K. Can. J. Chem. 1979, 57, 2333–2334. [Google Scholar] [CrossRef]
  27. Silva, C.A.; Saraiva, S.V.; Bonetti, D.; Higuti, R.T.; Cunha, R.L.; Pereira, L.O.; Silva, F.V.; Fileti, A.M. Application of acoustic models for polydisperse emulsion characterization using ultrasonic spectroscopy in the long wavelength regime. Colloids Surfaces A Physicochem. Eng. Asp. 2020, 602, 125062. [Google Scholar] [CrossRef]
  28. Adamowski, J.C.; Buiochi, F.; Sigelmann, R.A. Ultrasonic measurement of density of liquids flowing in tubes. IEEE Trans. Ultrason. Ferroelectr. Freq. Control 1998, 45, 48–56. [Google Scholar] [CrossRef] [PubMed]
  29. Reyna, C.A.B.; Lopes, J.H.; Franco, E.E.; Tsuzuki, M.S.G.; Buiochi, F. Validation of a three-dimensional model for improving the design of multiple-backscattering ultrasonic sensors. J. Acoust. Soc. Am. 2025, 157, 17–28. [Google Scholar] [CrossRef]
  30. Grosso, V.A.D.; Mader, C.W. Speed of Sound in Pure Water. J. Acoust. Soc. Am. 1972, 52, 1442–1446. [Google Scholar] [CrossRef]
Figure 1. Ultrasonic backscattering probes: (a) schematic showing the scatterer distribution and (b) image of the manufactured probes.
Fluids 10 00108 g001
Figure 2. Diagram of the experimental setup.
Fluids 10 00108 g002
Figure 3. (a) Acquired signal pattern for NaCl solution case and (b) NaCl solution characterization with 10 MHz and 5 MHz backscattering sensors at 20 °C and comparison with theoretical values from the literature [30].
Fluids 10 00108 g003
Figure 4. Temperature as a function of acquisition time for the heating (red lines) and cooling (blue lines) processes: (a) comparison of static and in-motion cases and (b) measurements at top (near free surface) and bottom of the sample for ϕ = 0.29 .
Fluids 10 00108 g004
Figure 5. Propagation velocity of pure water in the temperature range from 19°C to 20°C: (a) all measurements and (b) averaged values.
Fluids 10 00108 g005
Figure 6. Behavior during dilution process of (a) propagation velocity and (b) temperature.
Fluids 10 00108 g006
Figure 7. Theoretical and experimental behavior of (a) propagation velocity and (b) concentration of crude oil-in-water emulsions. Two tests performed on different days are shown.
Fluids 10 00108 g007
Disclaimer/Publisher’s Note: The statements, opinions and data contained in all publications are solely those of the individual author(s) and contributor(s) and not of MDPI and/or the editor(s). MDPI and/or the editor(s) disclaim responsibility for any injury to people or property resulting from any ideas, methods, instructions or products referred to in the content.