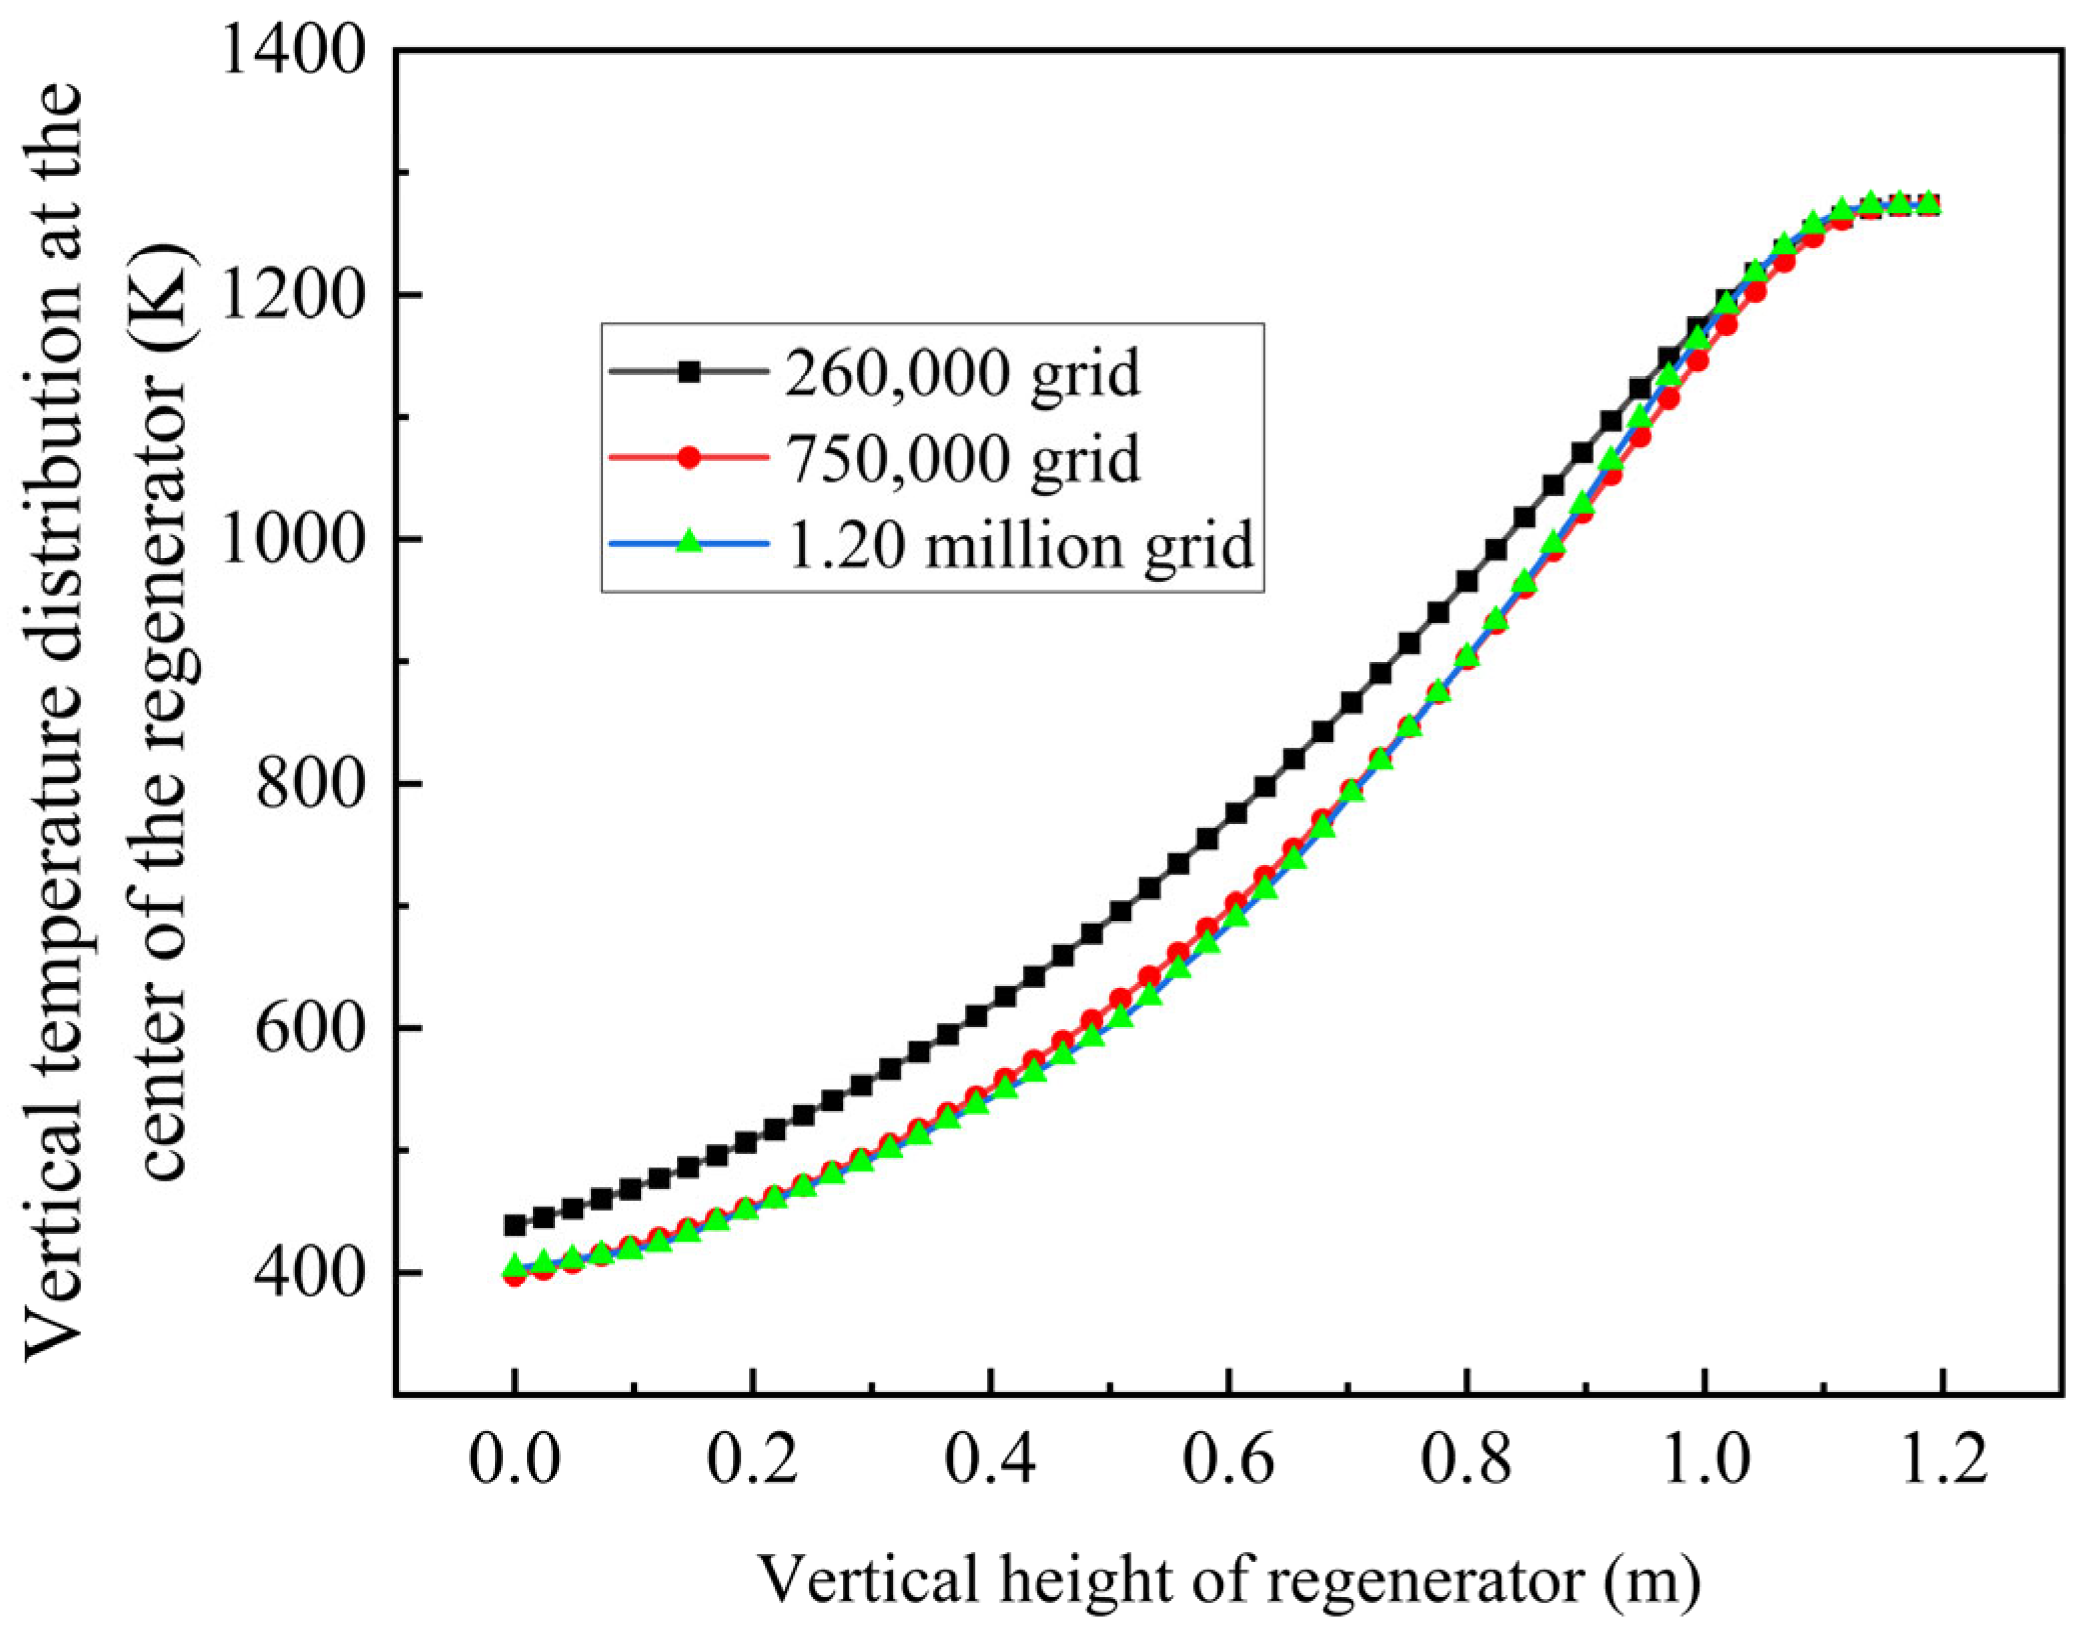
3.1. Simulation Results of the Single Channel
Prior to operation of the gas thermal reverse-flow oxidation device, the ceramic bed requires preheating with hot air to achieve the initial temperature necessary for methane oxidation. To investigate the temperature distribution within the regenerator more precisely, a single-channel model is employed. The preheating air parameters are configured as follows: hot air temperature at the top outlet is 1273 K with a velocity of 3 m/s; cold air temperature at the bottom inlet is 379 K with a velocity of 1.39 m/s; and the blowing duration for each cycle is 30 s. Following repeated purging and preheating cycles, the temperature variation within a single heat storage channel is monitored. Heating ceases when the temperature at the regenerator top reaches the operational range of 950–1050 °C specified for this device, after which gas introduction commences. The preheating simulation results are presented as follows.
Figure 8 shows the inlet and outlet at opposite ends, which are continuously interchanged when the flow direction reverses. The specific dimensions are shown in the figure. The hexagon region with 0.53 mm wall thickness in the middle section represents a single channel within the regenerator. The channel is 1200 mm long and the inner diameter is 3.4 mm. All physical property parameters, including temperature and species, are collected along the middle red line, which is convenient for subsequent data analysis.
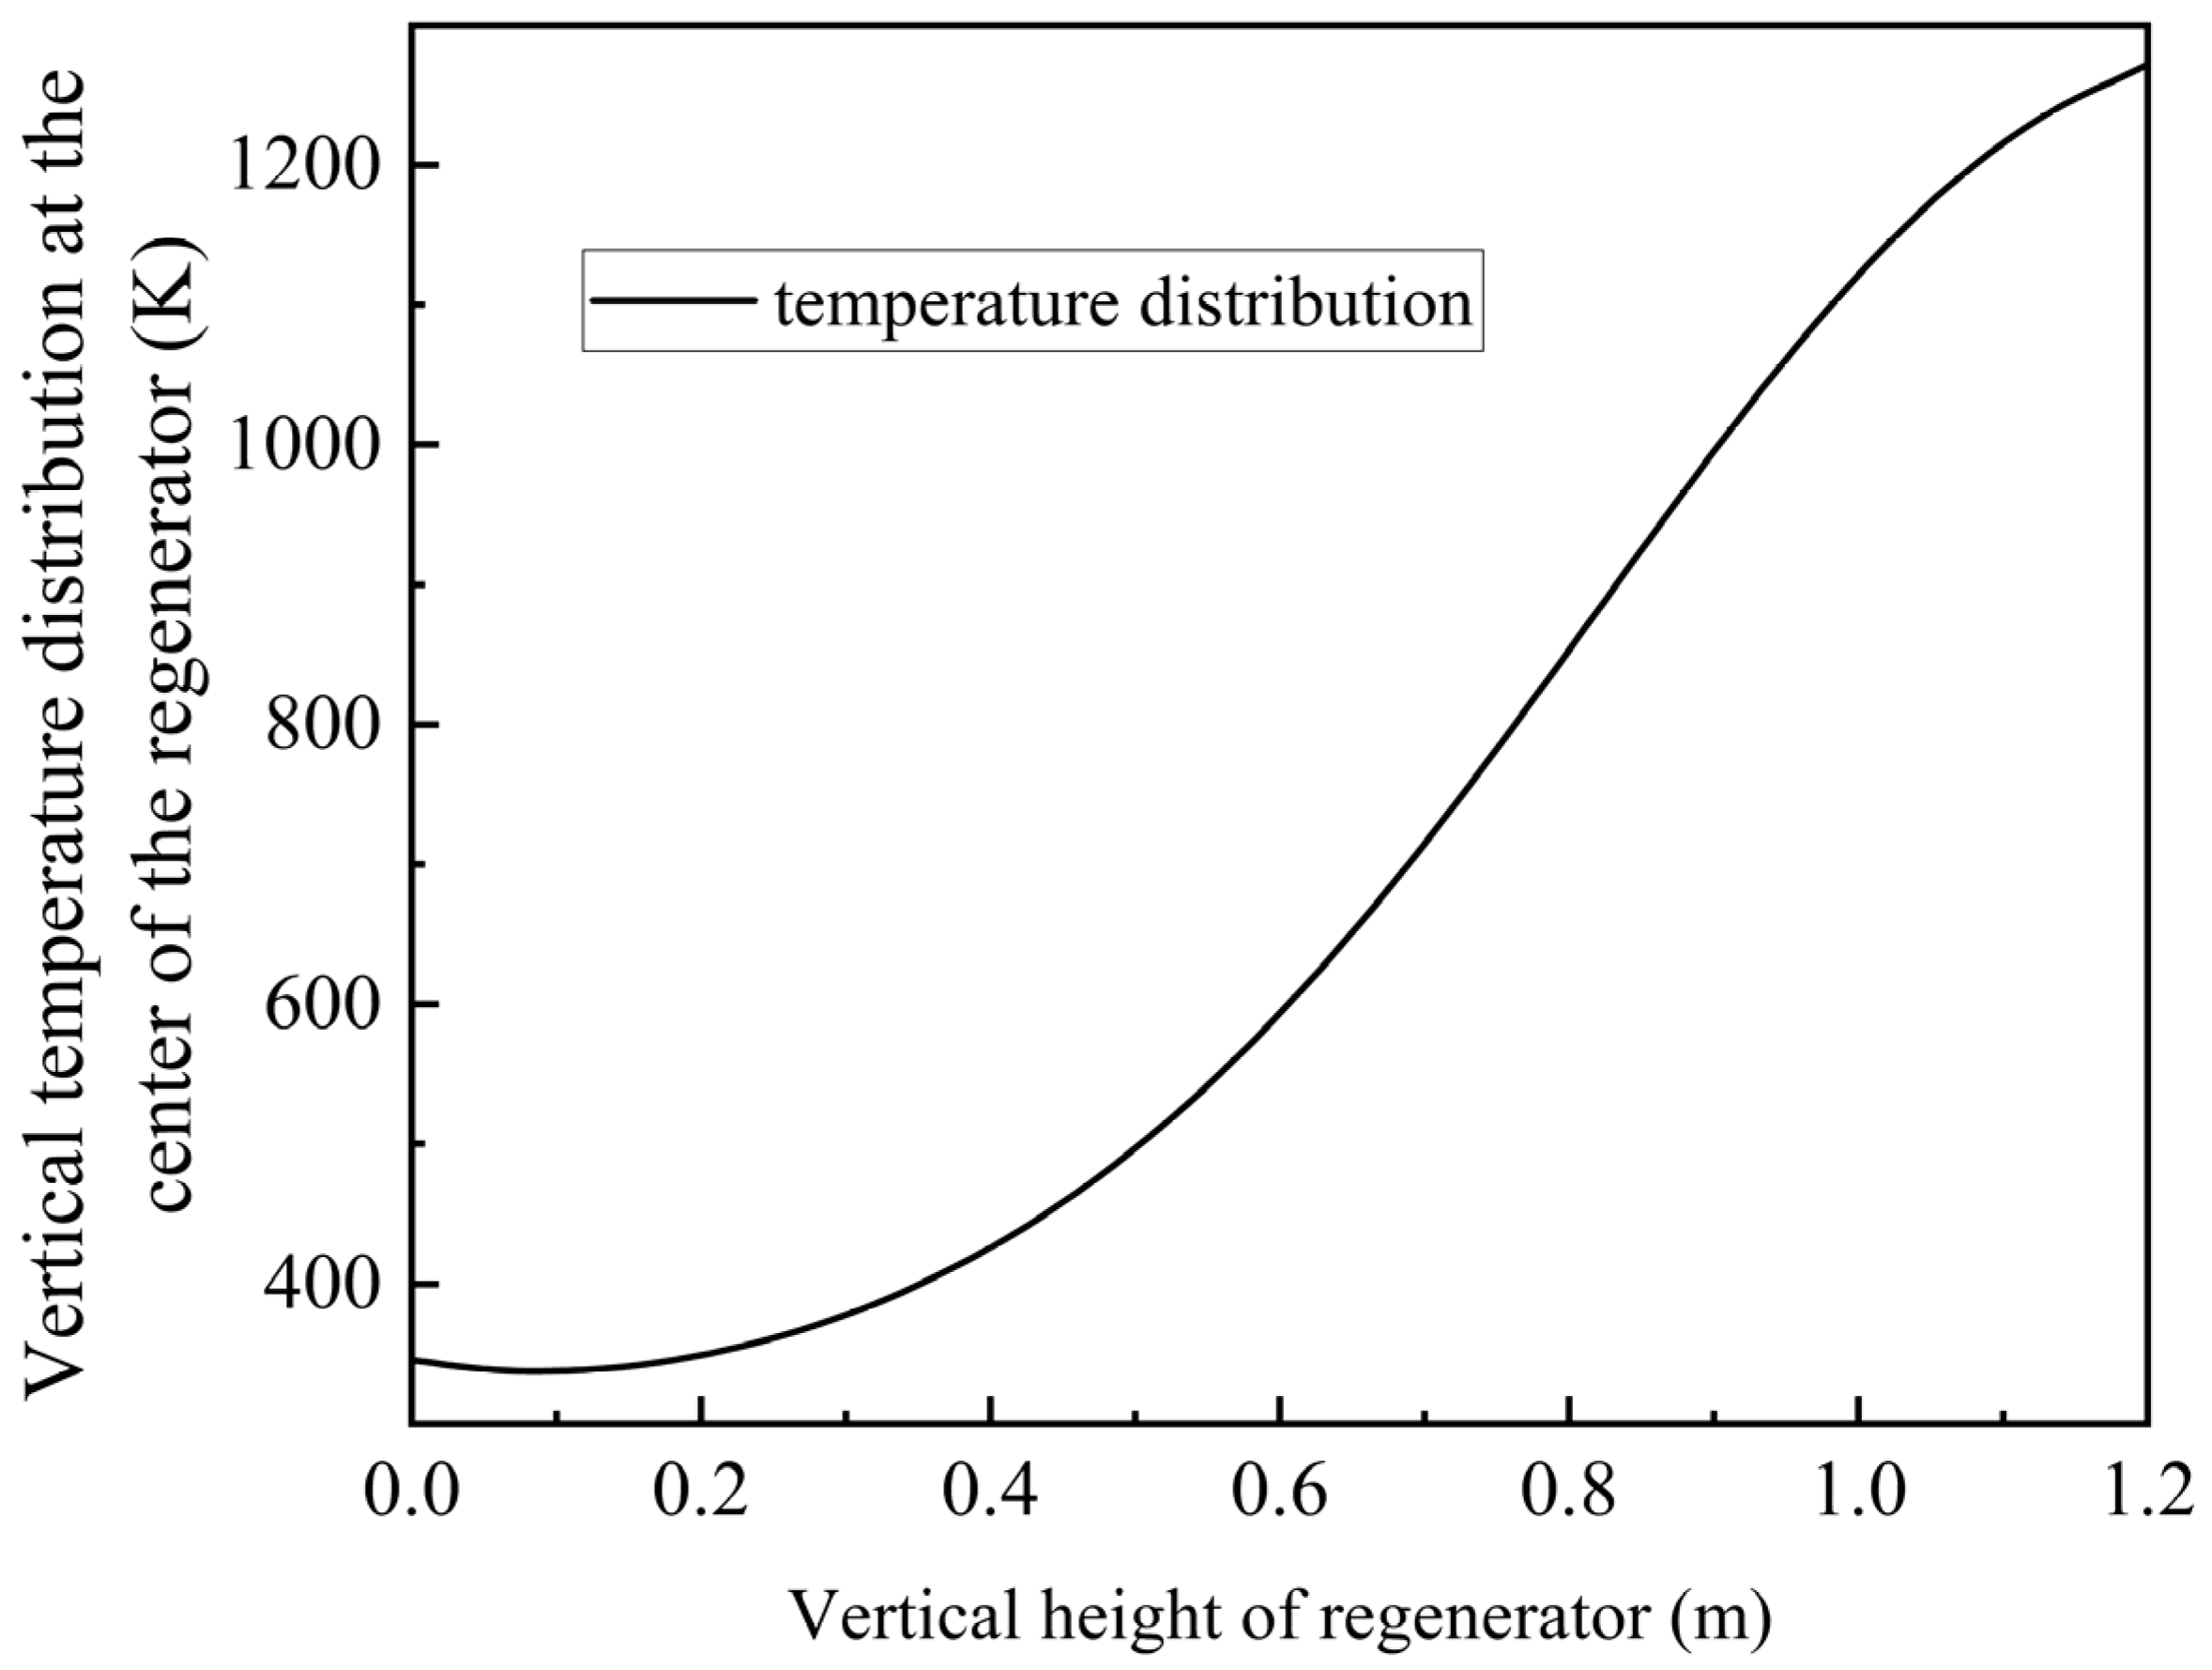
Through simulation analysis, the temperature within the channel exhibits a sigmoidal distribution following repeated purging cycles, as illustrated in
Figure 9. The temperature at the top reaches 1271 K (998 °C) and the temperature at the bottom is 345 K (72 °C), which satisfies the specified temperature requirements.
To investigate whether the gas residence time within the channel meets the operational requirements, the transit time of gas through the channel is analyzed. Based on the single-channel model, the gas combustion flow characteristics are examined through numerical calculation. The chemical reaction equations are shown in
Table 2, The flue gas composition is specified in
Table 3.
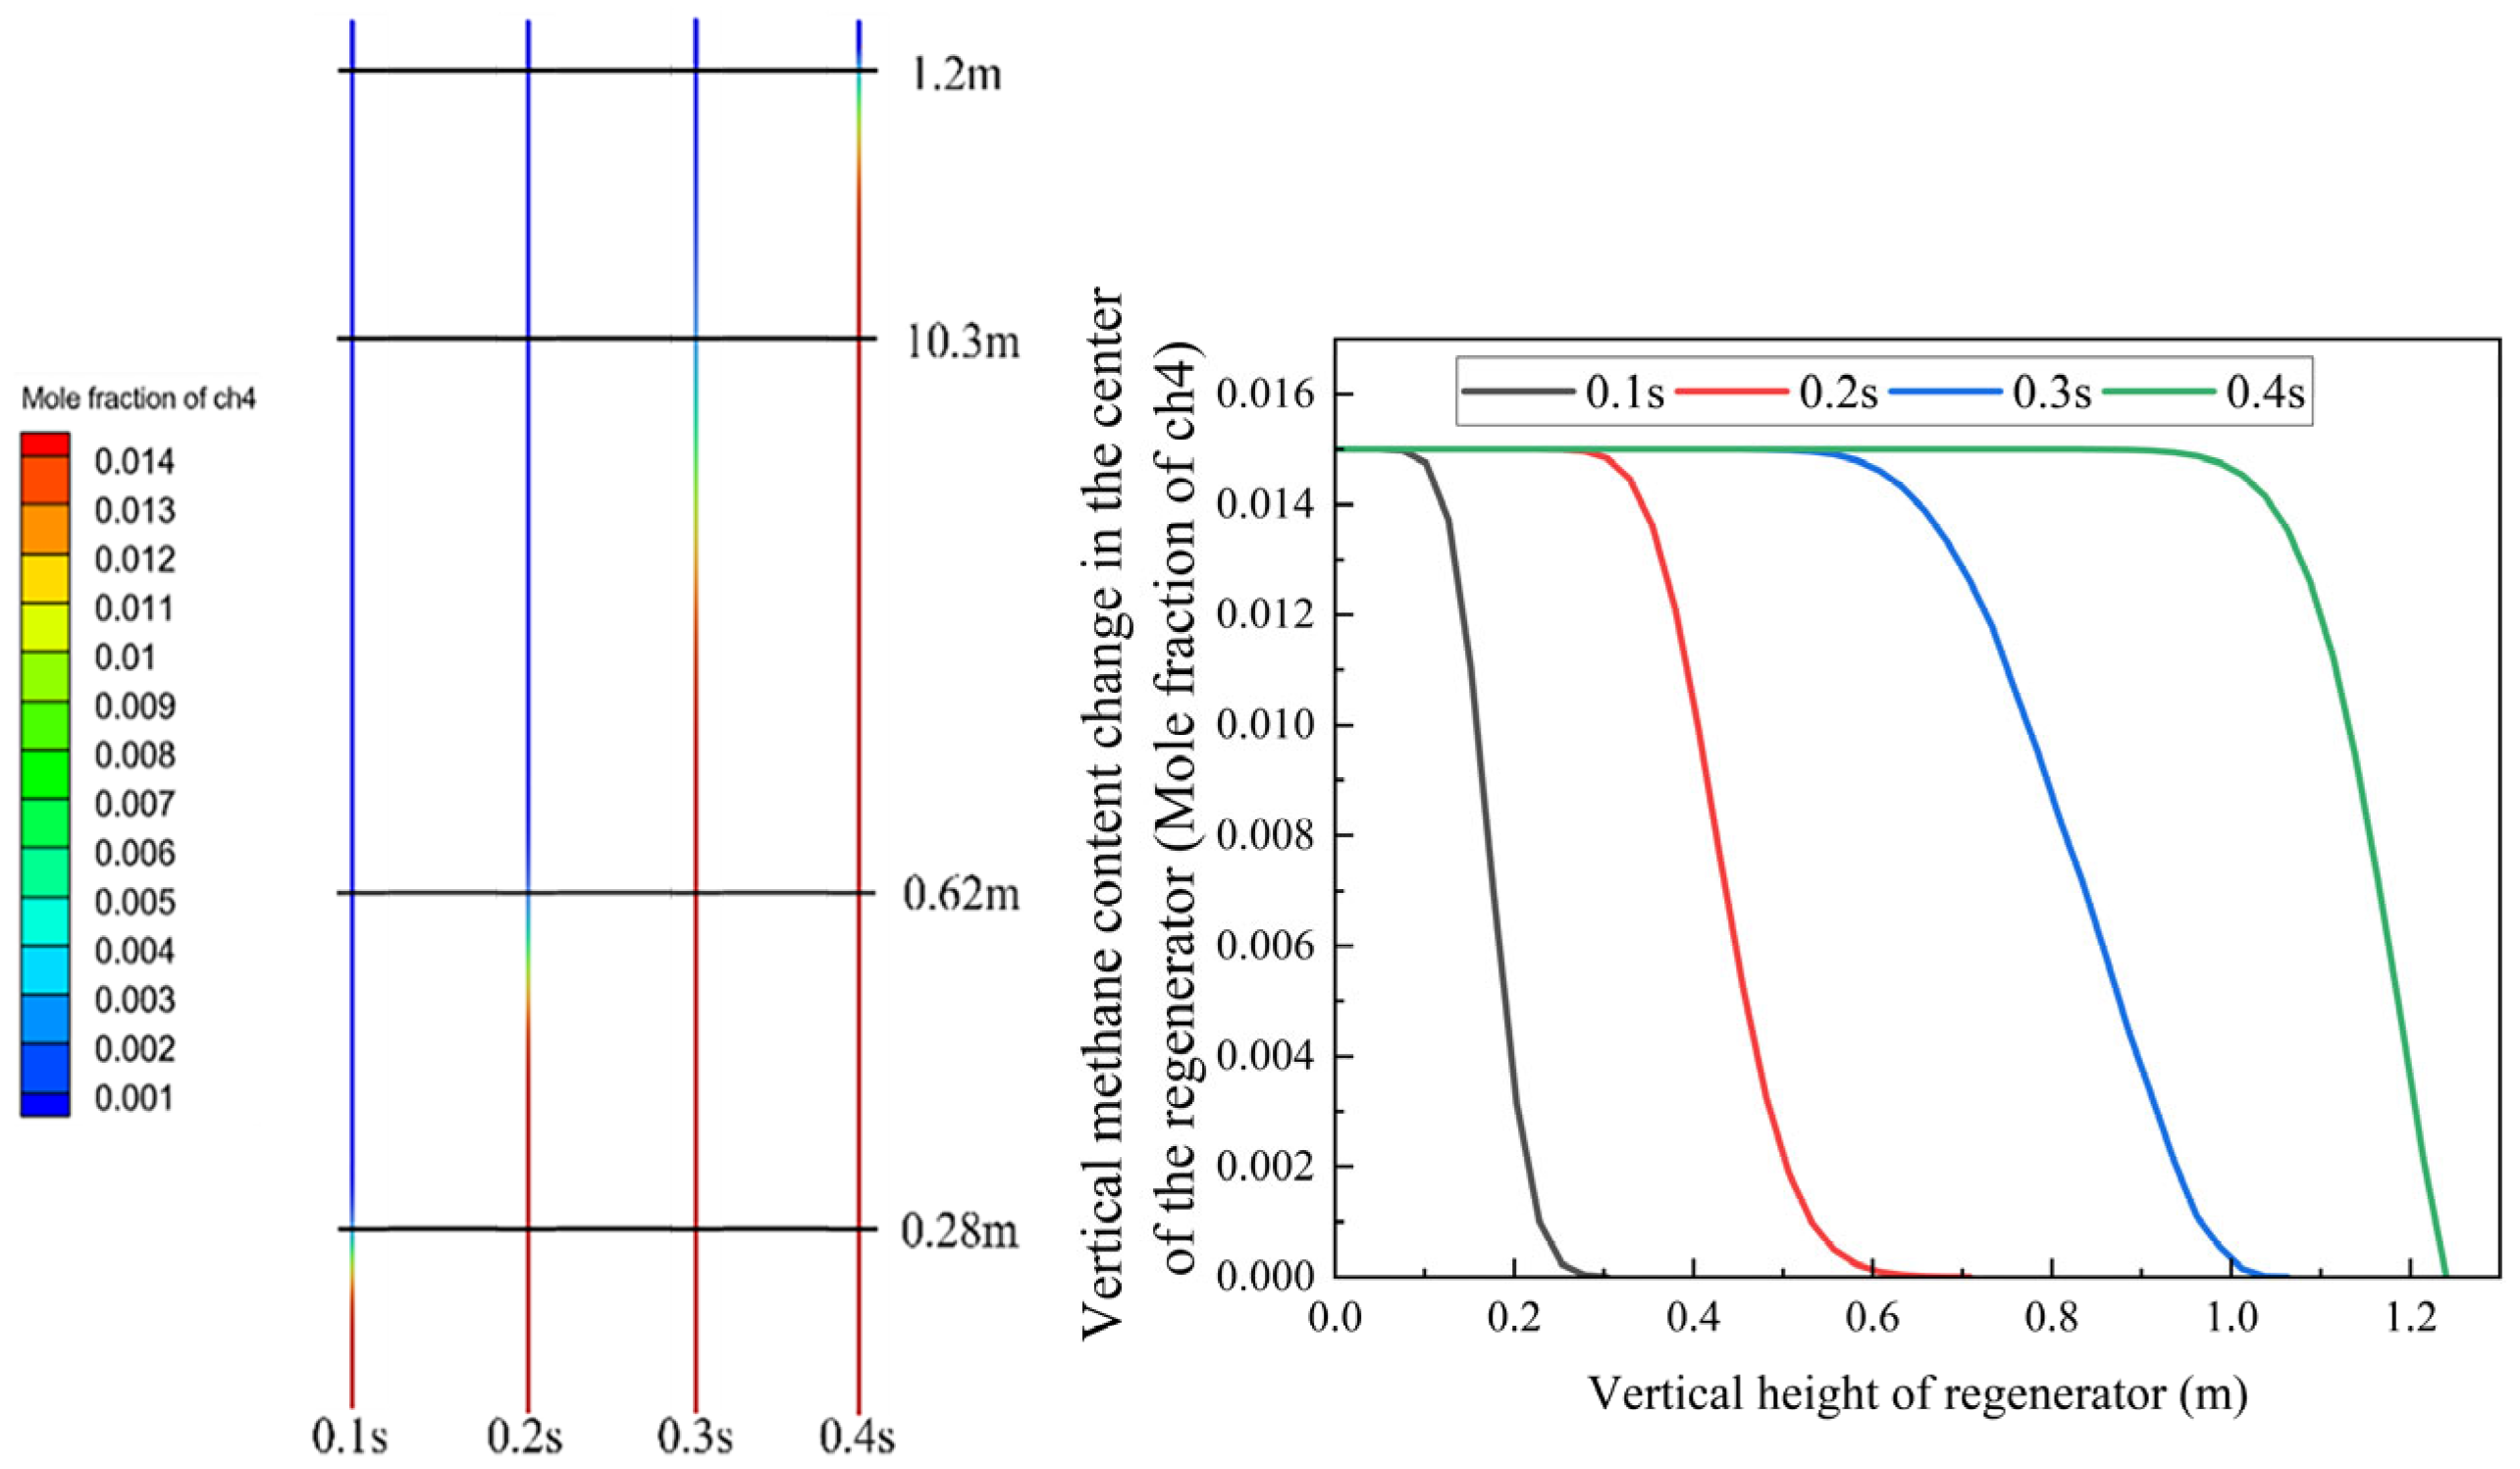
Figure 10 demonstrates that the gas completely traverses the 1.2-m-long regenerator channel within 0.4 s. Based on the color distribution and statistical data, the gas undergoes nearly complete oxidation at the outlet. The methane oxidation rate at the regenerator outlet reaches 90%, indicating that the regenerator significantly enhances methane combustion and oxidation. The small quantity of unoxidized methane continues to combust in the combustion chamber, with the generated heat accumulating in the combustion chamber and heating the regenerator, thereby ensuring continuous methane oxidation within the regenerator channel.
Based on the experimental configuration, the gas oxidation time during the entire intake process in the regenerator is predicted. At 1050 K, the theoretical time required for complete oxidation is 0.33 s, which corresponds well with the simulation results. Additionally, beyond the 0.26 s residence time in the regenerator, the flue gas remains in the combustion chamber for 0.41 s. The total residence time reaches 0.67 s, substantially exceeding the time required for complete methane oxidation.
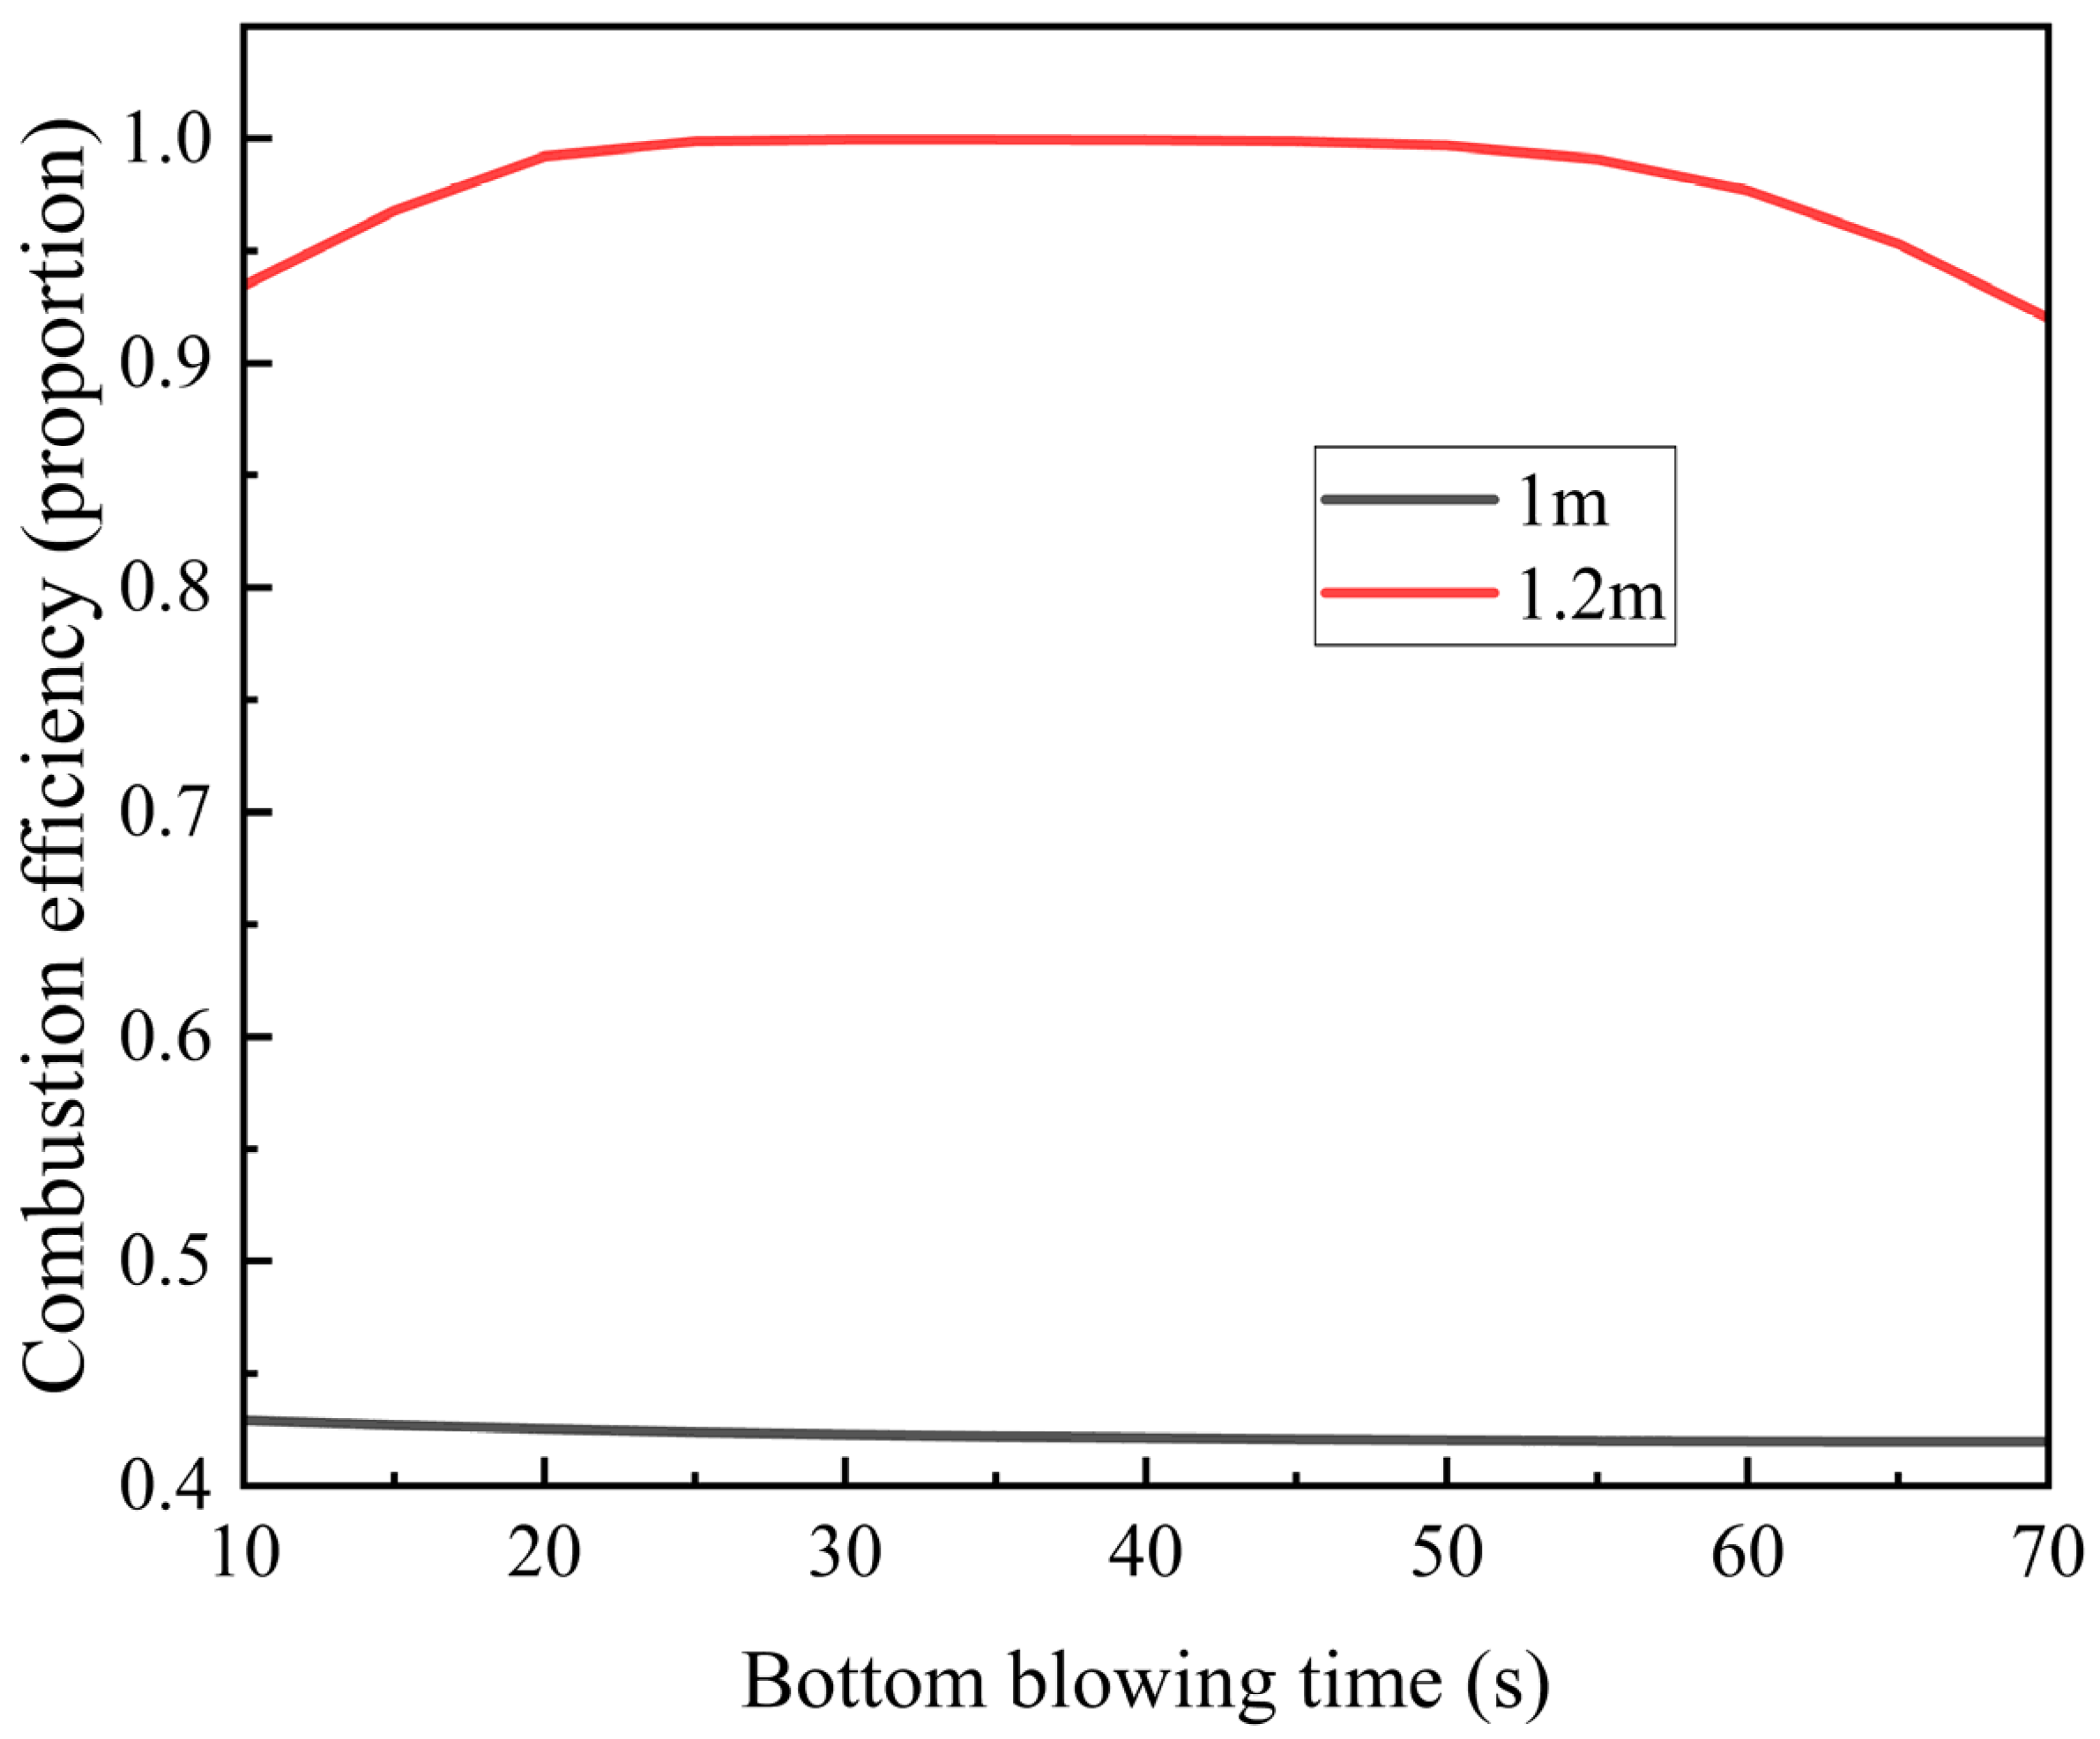
Since the inlet air temperature is typically low, prolonged introduction of low-temperature gas gradually cools the regenerator, potentially affecting gas oxidation behavior. To ensure complete combustion of methane within the regenerator, we investigated the influence of bottom blowing time on methane combustion efficiency, as illustrated in
Figure 11.
At the 1 m position, methane combustion efficiency remains below 45% and decreases further with extended bottom blowing time. This decline occurs because the low-temperature gas absorbs heat from the regenerator, lowering the ambient temperature and impairing methane combustion.
In contrast, at the 1.2 m position, methane combustion efficiency reaches 95%, initially increasing before decreasing with longer bottom blowing time. The peak efficiency (~100%) occurs at 30–50 s. Here, methane oxidation not only benefits from the regenerator’s heat but also contributes additional heat, enhancing overall combustion efficiency. However, as bottom-blowing continues, the regenerator’s temperature steadily drops. Eventually, the heat released by methane combustion becomes insufficient to compensate for this cooling, leading to a gradual decline in efficiency.
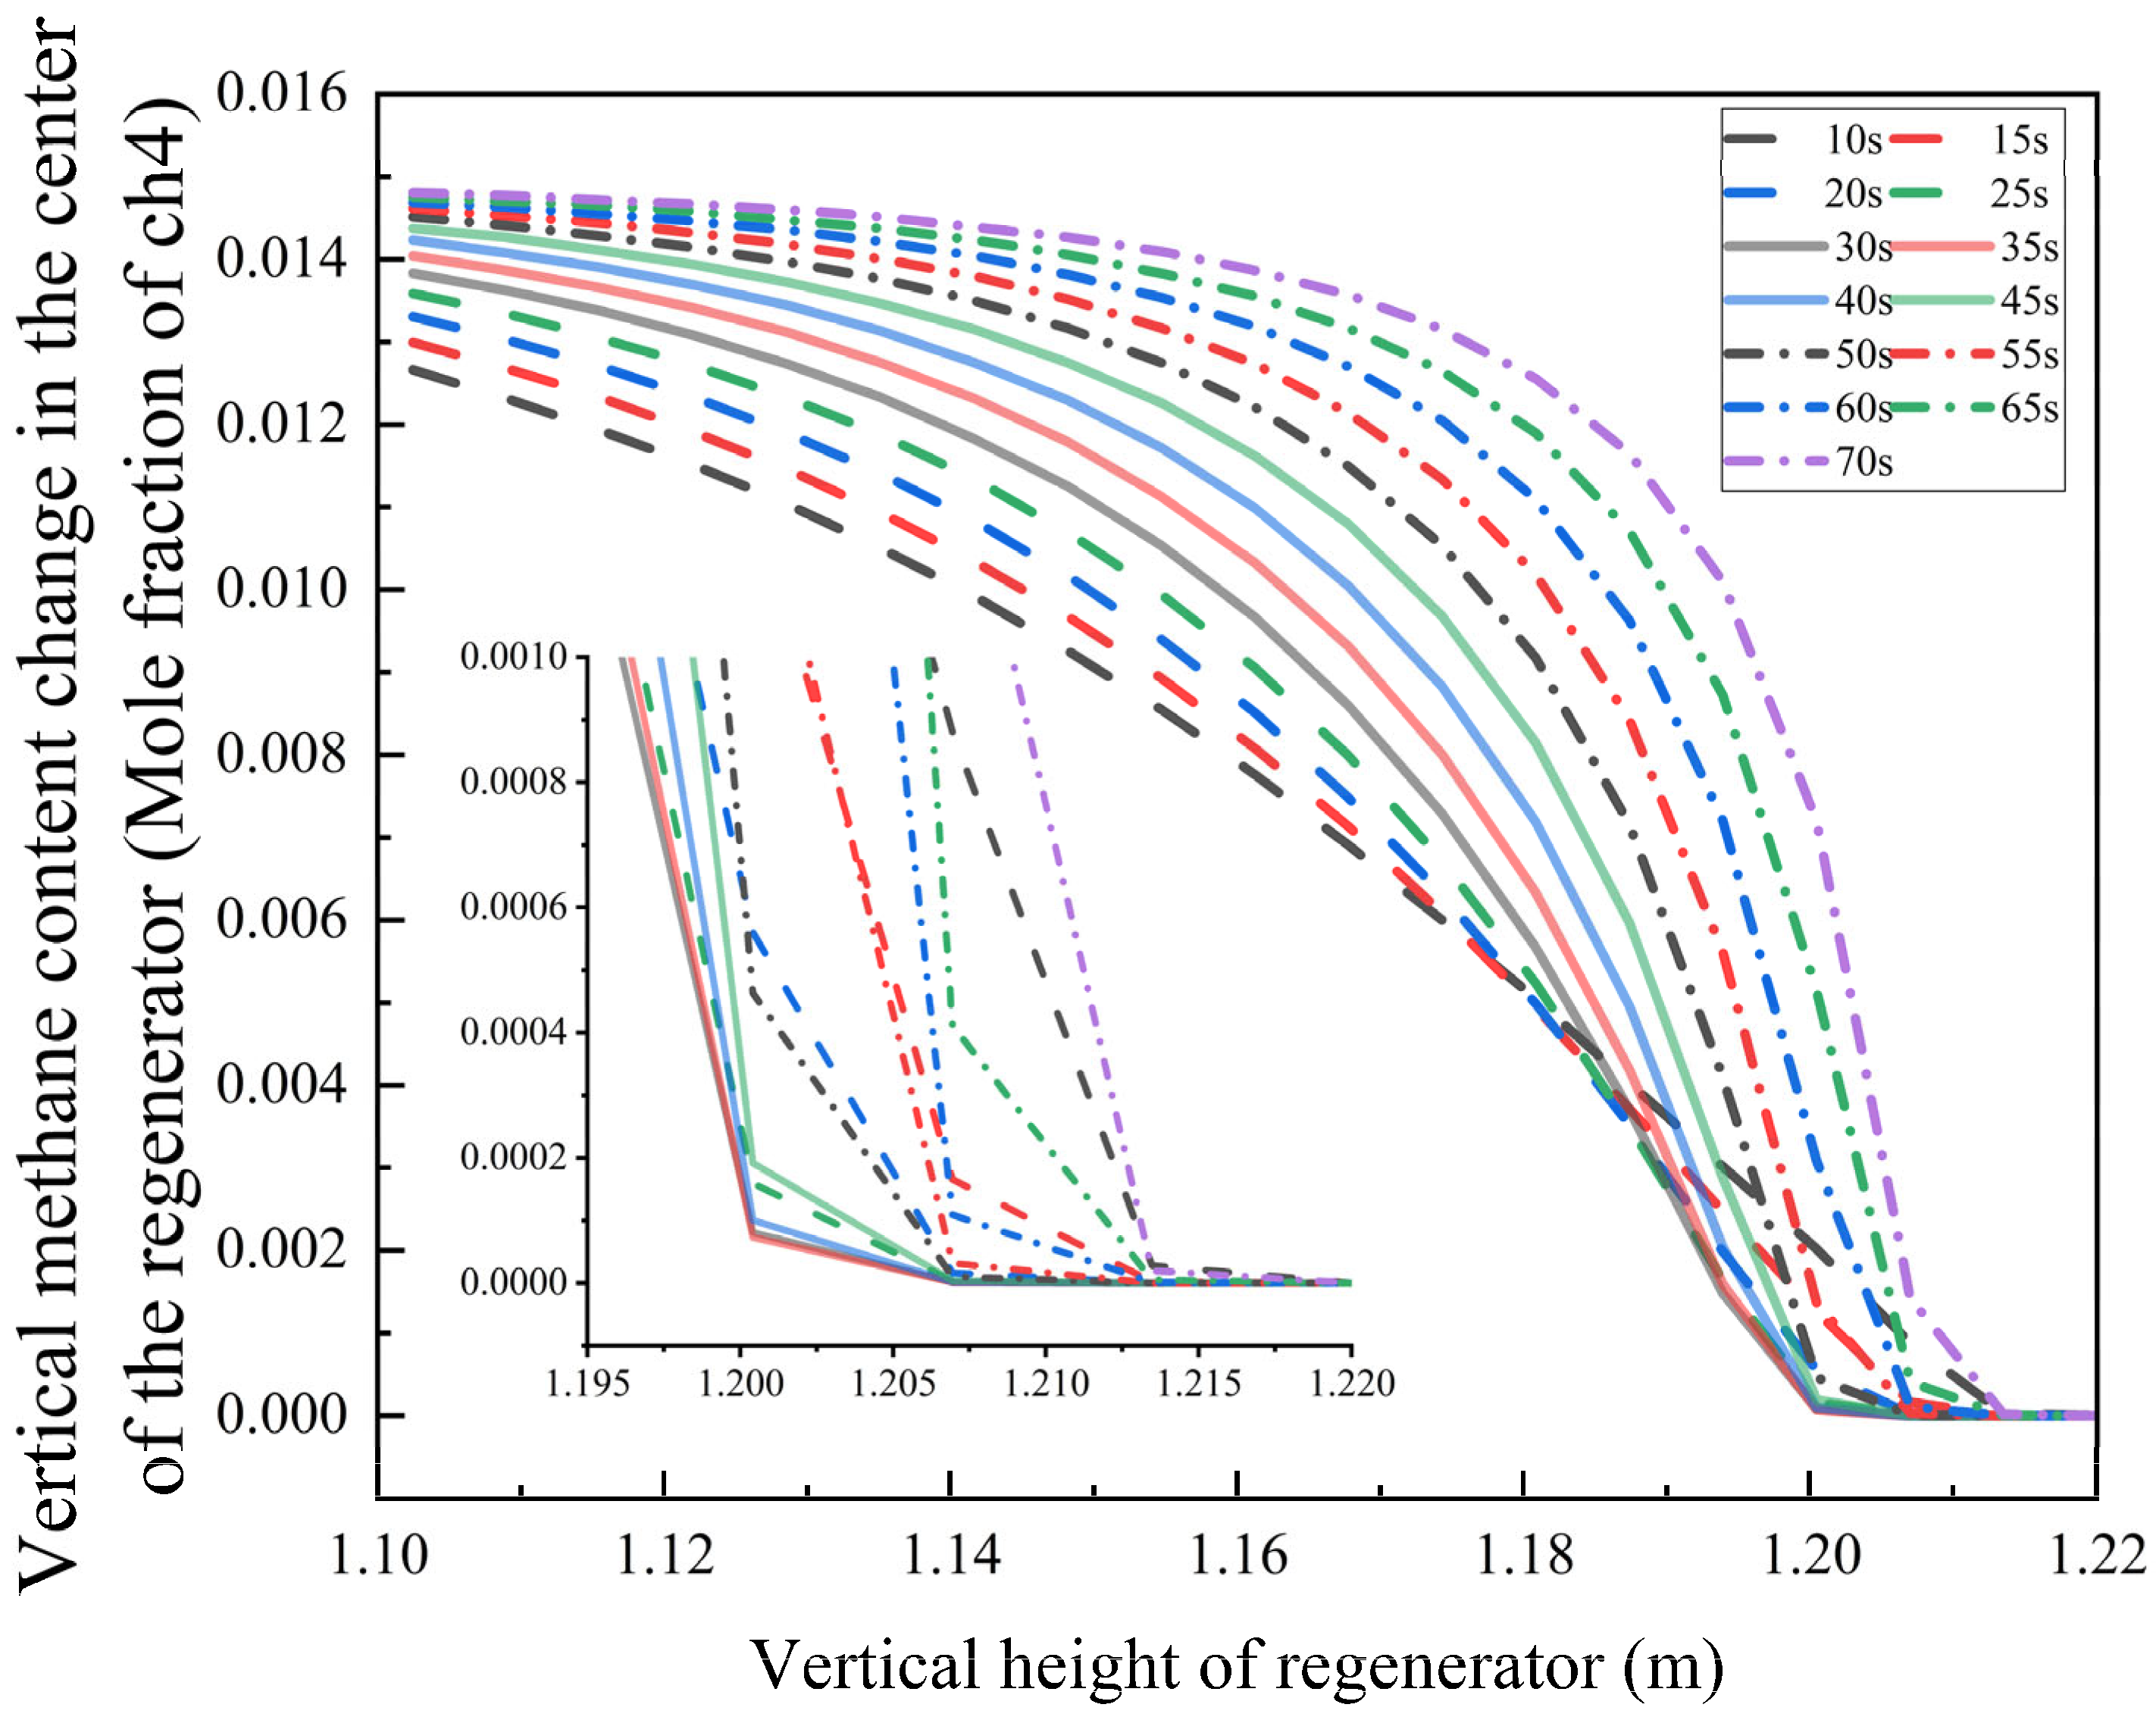
To deeply investigate the nonlinear relationship between the regenerator’s oxidation characteristics and bottom blowing time, numerical simulations were conducted for bottom blowing durations ranging from 10 to 70 s under the boundary conditions specified in
Table 3 (
Figure 12). The results reveal an S-shaped growth trend in the methane oxidation conversion rate as regenerator height increases.
Within the 10–25 s bottom blowing interval, the methane mole fraction falls below the detection limit at a height of 1.20 m. When the duration is extended to 30–35 s, the complete burnout position shifts downward to 1.20 m. However, for bottom blowing times exceeding 40 s, the burnout height begins to rise—under the 70 s condition, the methane oxidation completion point moves upward to 1.215 m.
This behavior stems from a two-stage coupling mechanism:
Optimal Range (30–35 s): The synergy between turbulence intensity and residence time enables an oxygen diffusion depth of 0.95 m, achieving an ideal gas mixture ratio for complete combustion. Oxygen is completely consumed at the position of 0.95 m.
Excessive Duration (>40 s): Elevated airflow velocity reduces oxygen penetration depth, leading to incomplete fuel combustion due to insufficient mixing.
These findings offer a theoretical foundation for optimizing operational parameters in industrial combustion systems.
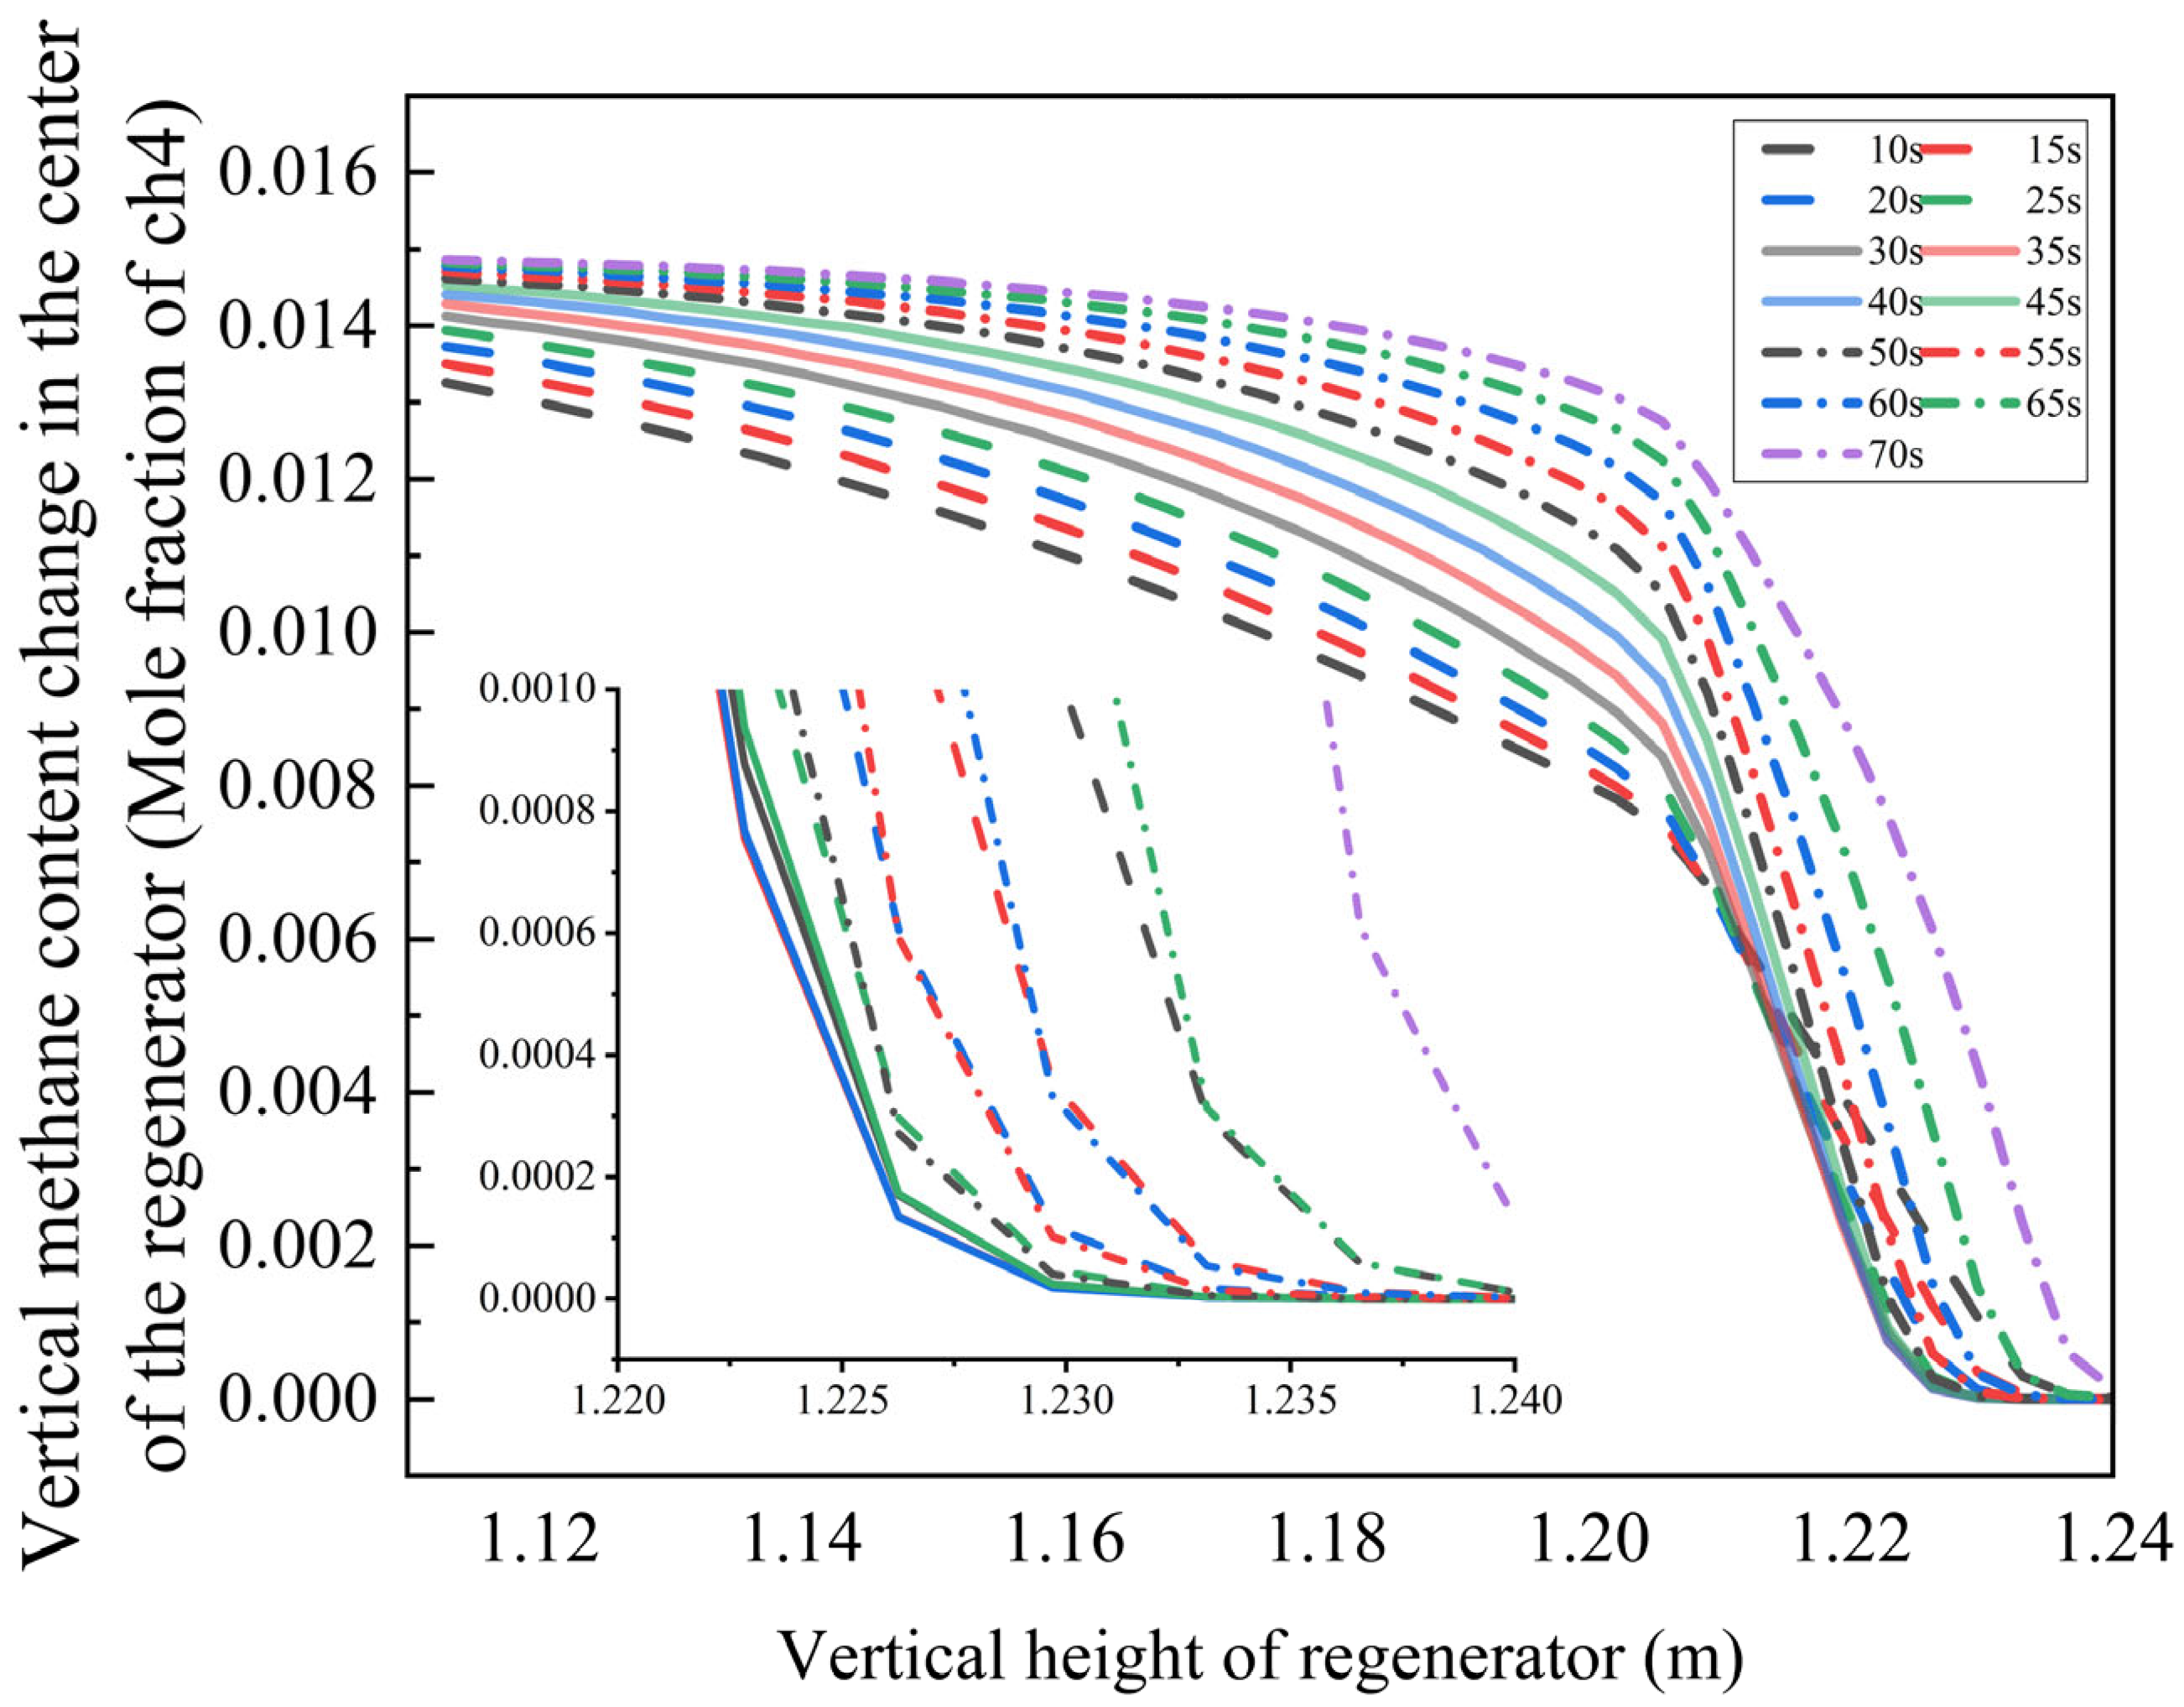
In industrial combustion systems, oxygen concentration is a critical thermodynamic parameter that significantly affects combustion reaction kinetics and pollutant formation characteristics. To elucidate this influence mechanism, we performed numerical simulations for a typical operating condition with an oxygen volume fraction of 5.186%, generating contour maps of flue gas composition distribution (
Figure 13) and boundary conditions specified (
Table 4) to systematically evaluate gas oxidation behavior under varying conditions.
The results demonstrate that in a low-oxygen environment, the methane mole fraction decays exponentially along the regenerator height. When the bottom blowing time is 10–25 s, the methane concentration falls below the detection limit at 1.235 m. Extending the bottom blowing time to 30–35 s shifts the complete burnout position downward to 1.230 m. However, with further extension to 70 s, the burnout height increases to 1.240 m.
This phenomenon arises from the coupling between oxygen diffusion rate and chemical reaction kinetics:
Moderate bottom blowing (30–35 s): Enhanced turbulent mixing efficiency reduces the reaction induction period, promoting complete combustion.
Excessive bottom blowing (70 s): High airflow velocity limits oxygen penetration depth, leading to incomplete fuel combustion.
Additionally, reduced oxygen concentration elevates the combustion reaction’s activation energy barrier, increasing the average methane burnout height by 0.005 m. These findings offer valuable insights for optimizing oxygen content regulation in industrial combustion systems.
The simulation results clearly demonstrate that gas composition significantly influences methane oxidation behavior. To systematically evaluate these effects, we examined methane burnout characteristics under different gas compositions using a fixed 30 s bottom blowing duration (operating parameters detailed in
Table 5).
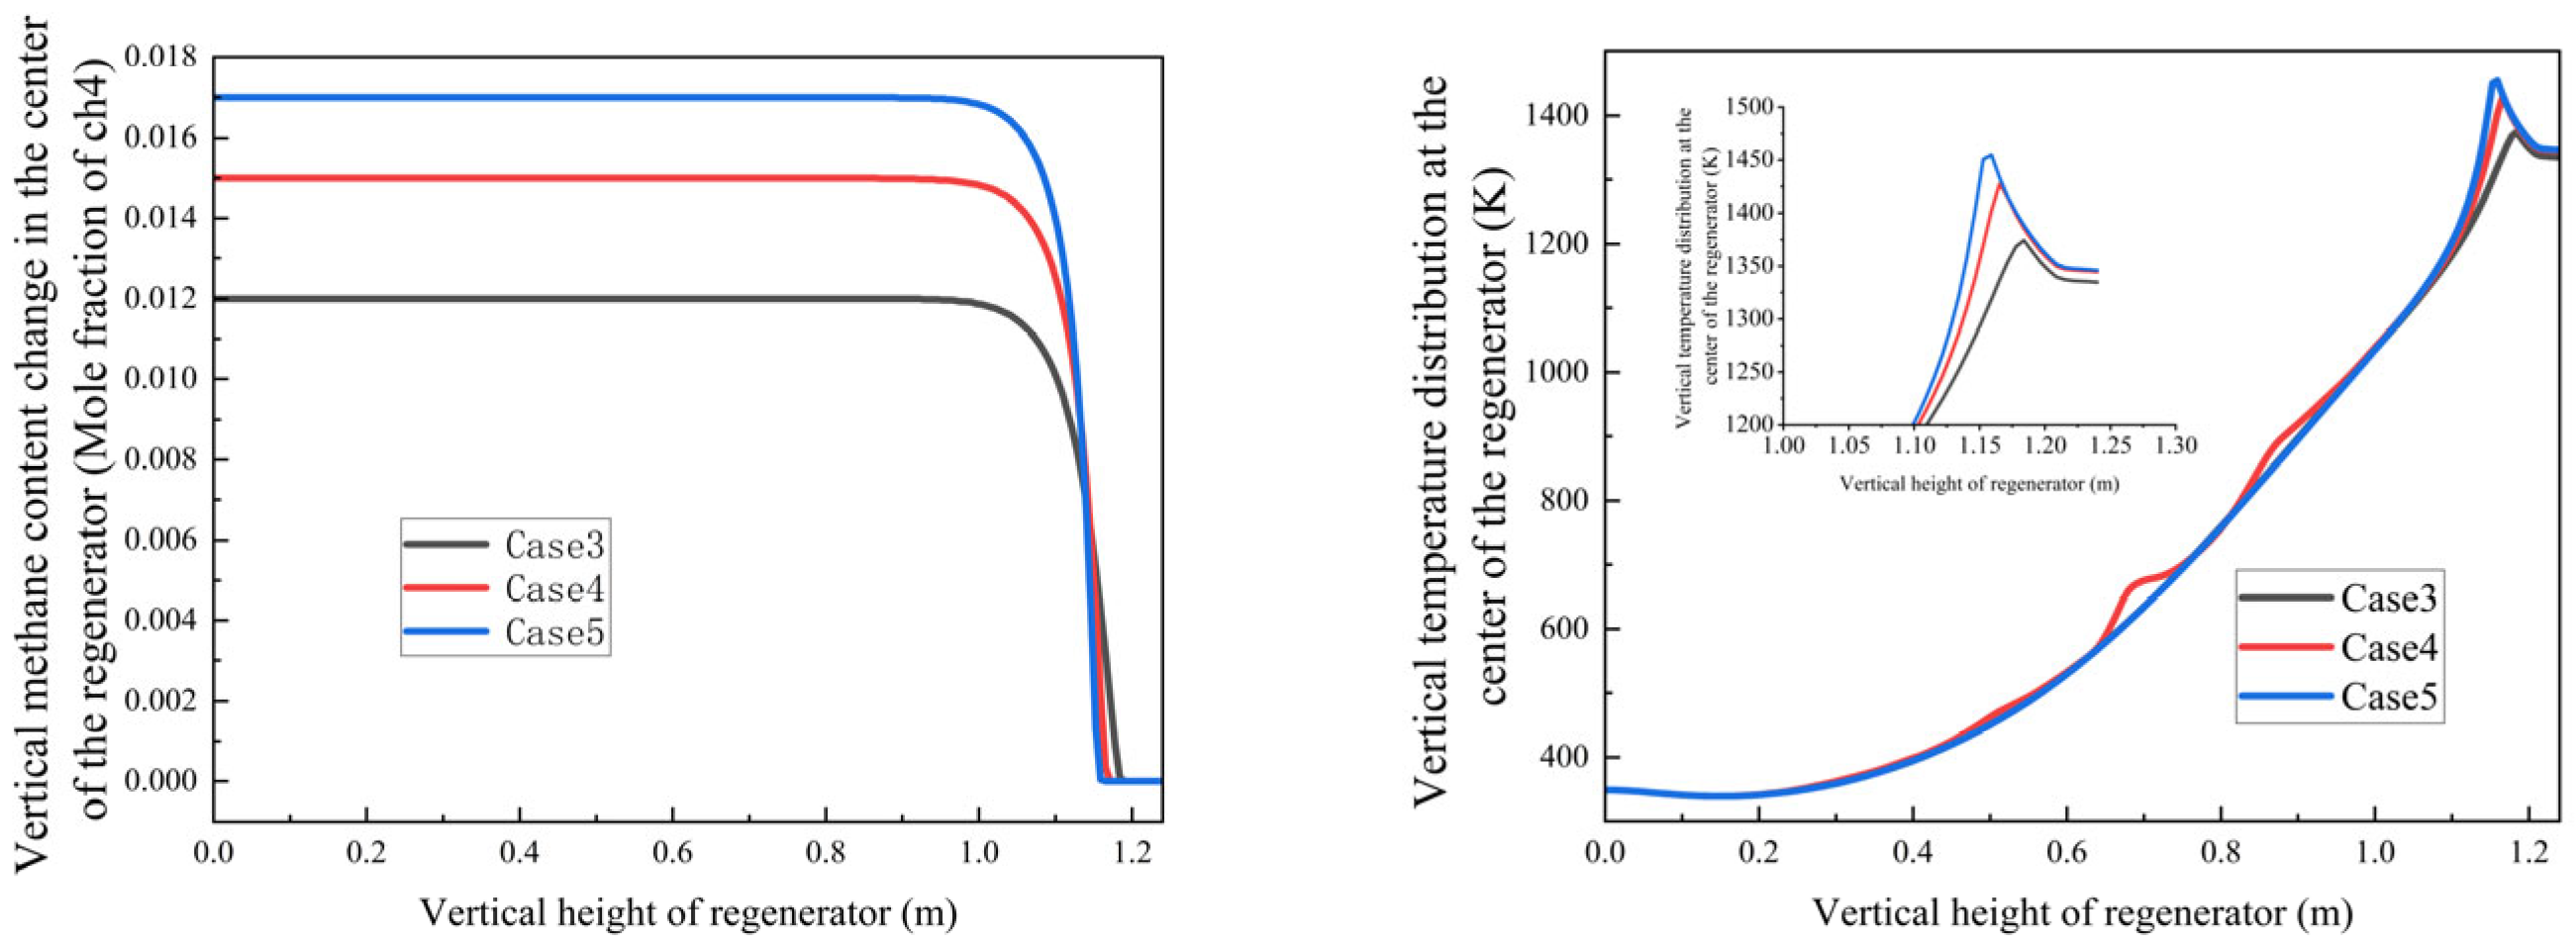
Figure 14 shows the methane mole fraction and temperature profiles along the regenerator height for various methane/oxygen concentrations.
Key findings from Cases 3–5 (air/fuel ratios φ = 2.67, 2.40, and 2.29, respectively):
Counter-intuitive Burnout Behavior: Despite having the highest air/fuel ratio (φ = 2.67), Case 3 showed a higher burnout height (1.21 m) than Case 5 (φ = 2.29, 1.18 m). This occurs for the following reasons:
Case 3’s lower methane concentration generates insufficient combustion heat (peak temperature: 1280 K);
Case 5’s richer methane mixture creates a self-sustaining high-temperature zone (1350 K) that enhances oxidation.
- 2.
Flow Velocity Optimization:
Cases 1,2: 1.39 m/s inlet velocity;
Cases 3–5: reduced to 0.89 m/s to balance residence time and turbulence intensity, maintaining mixing efficiency while minimizing pressure losses;
The thermal feedback mechanism plays a crucial regulatory role in these combustion characteristics. These findings provide essential design guidelines for industrial regenerative oxidation systems, particularly regarding the following:
The importance of maintaining adequate methane concentrations for thermal self-sustainment;
The need for velocity adjustments to optimize reaction conditions;
The value of redundant regenerator designs for handling variable gas compositions.
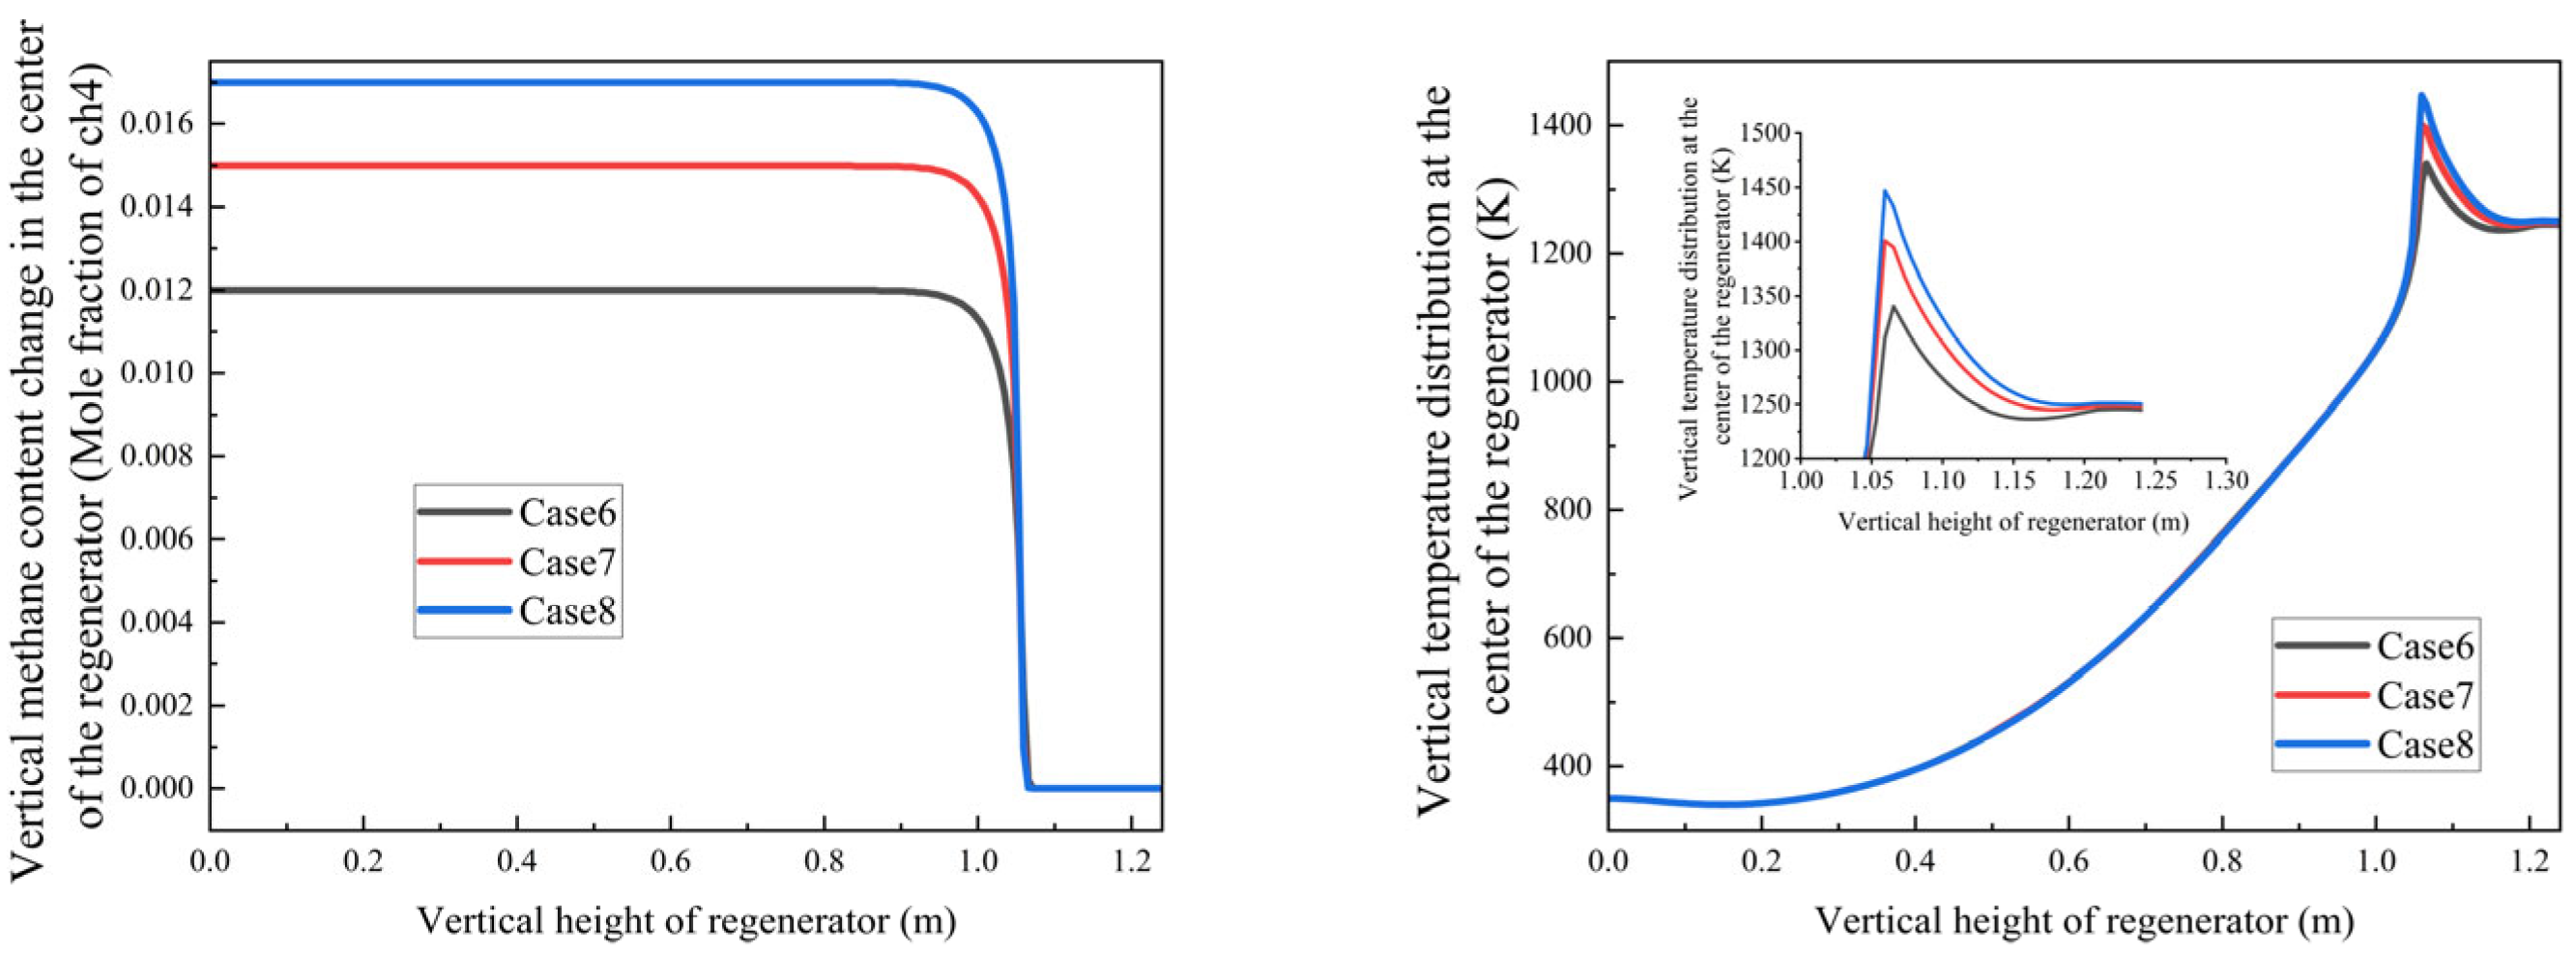
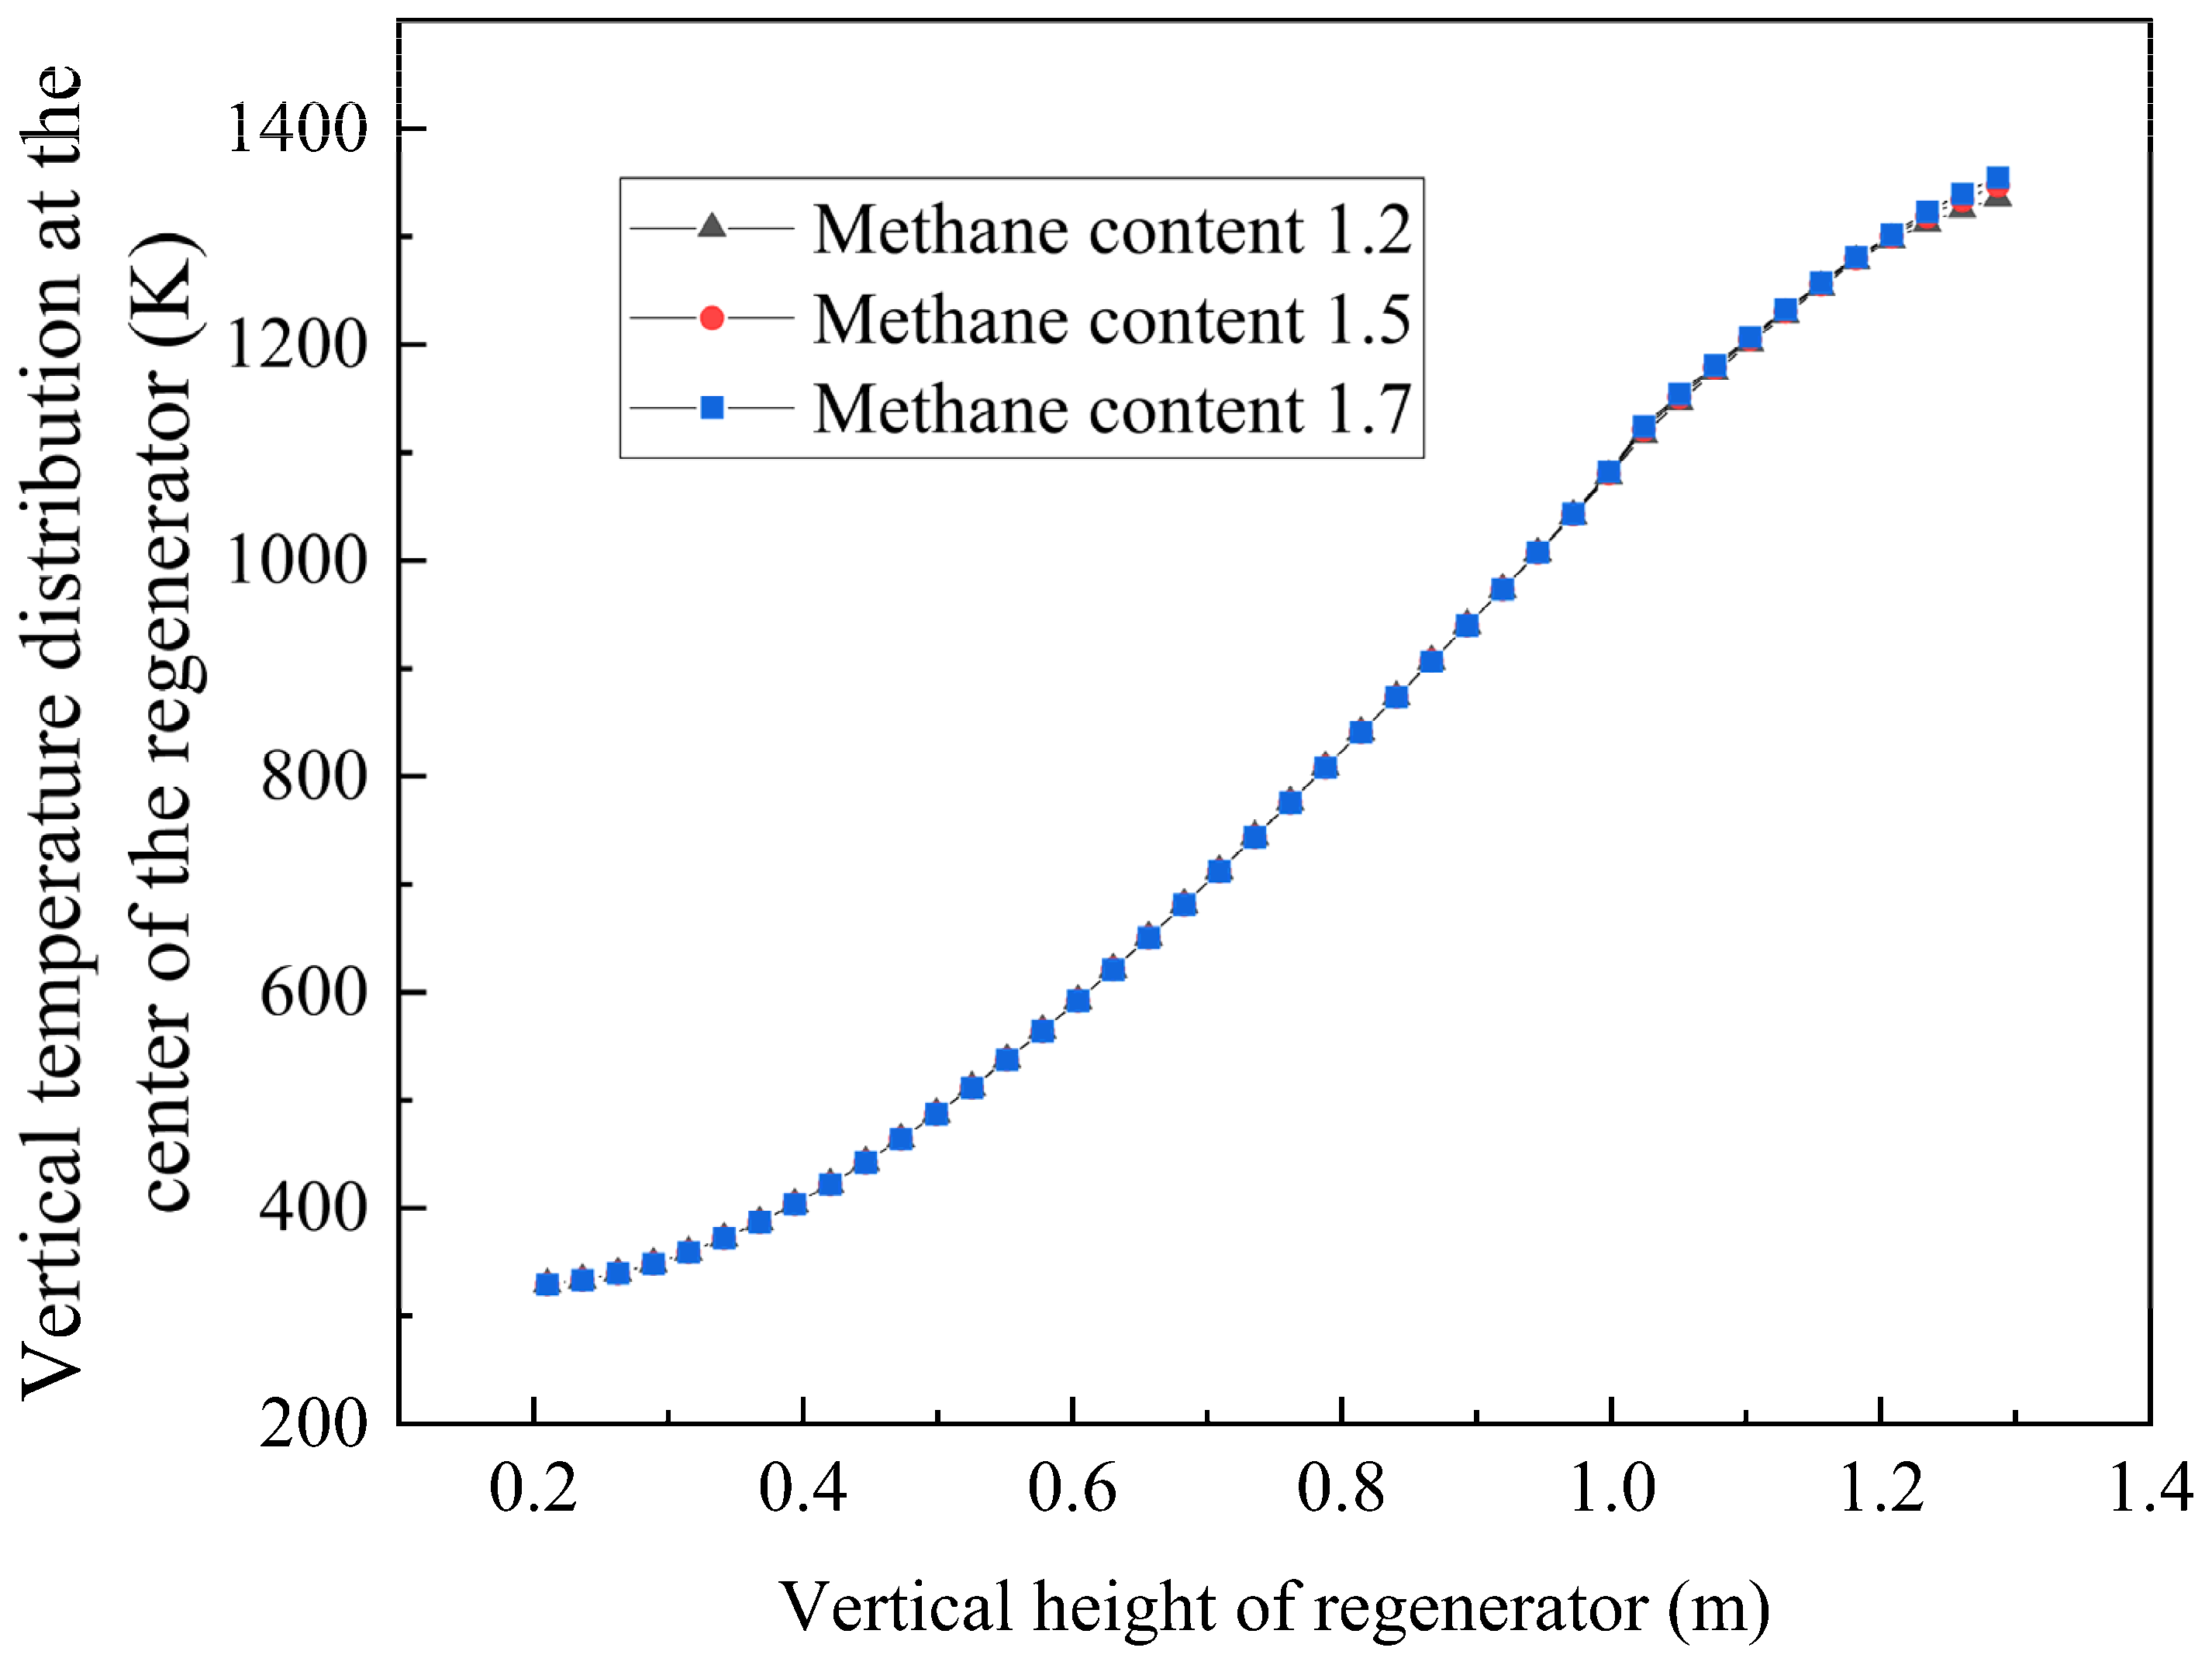
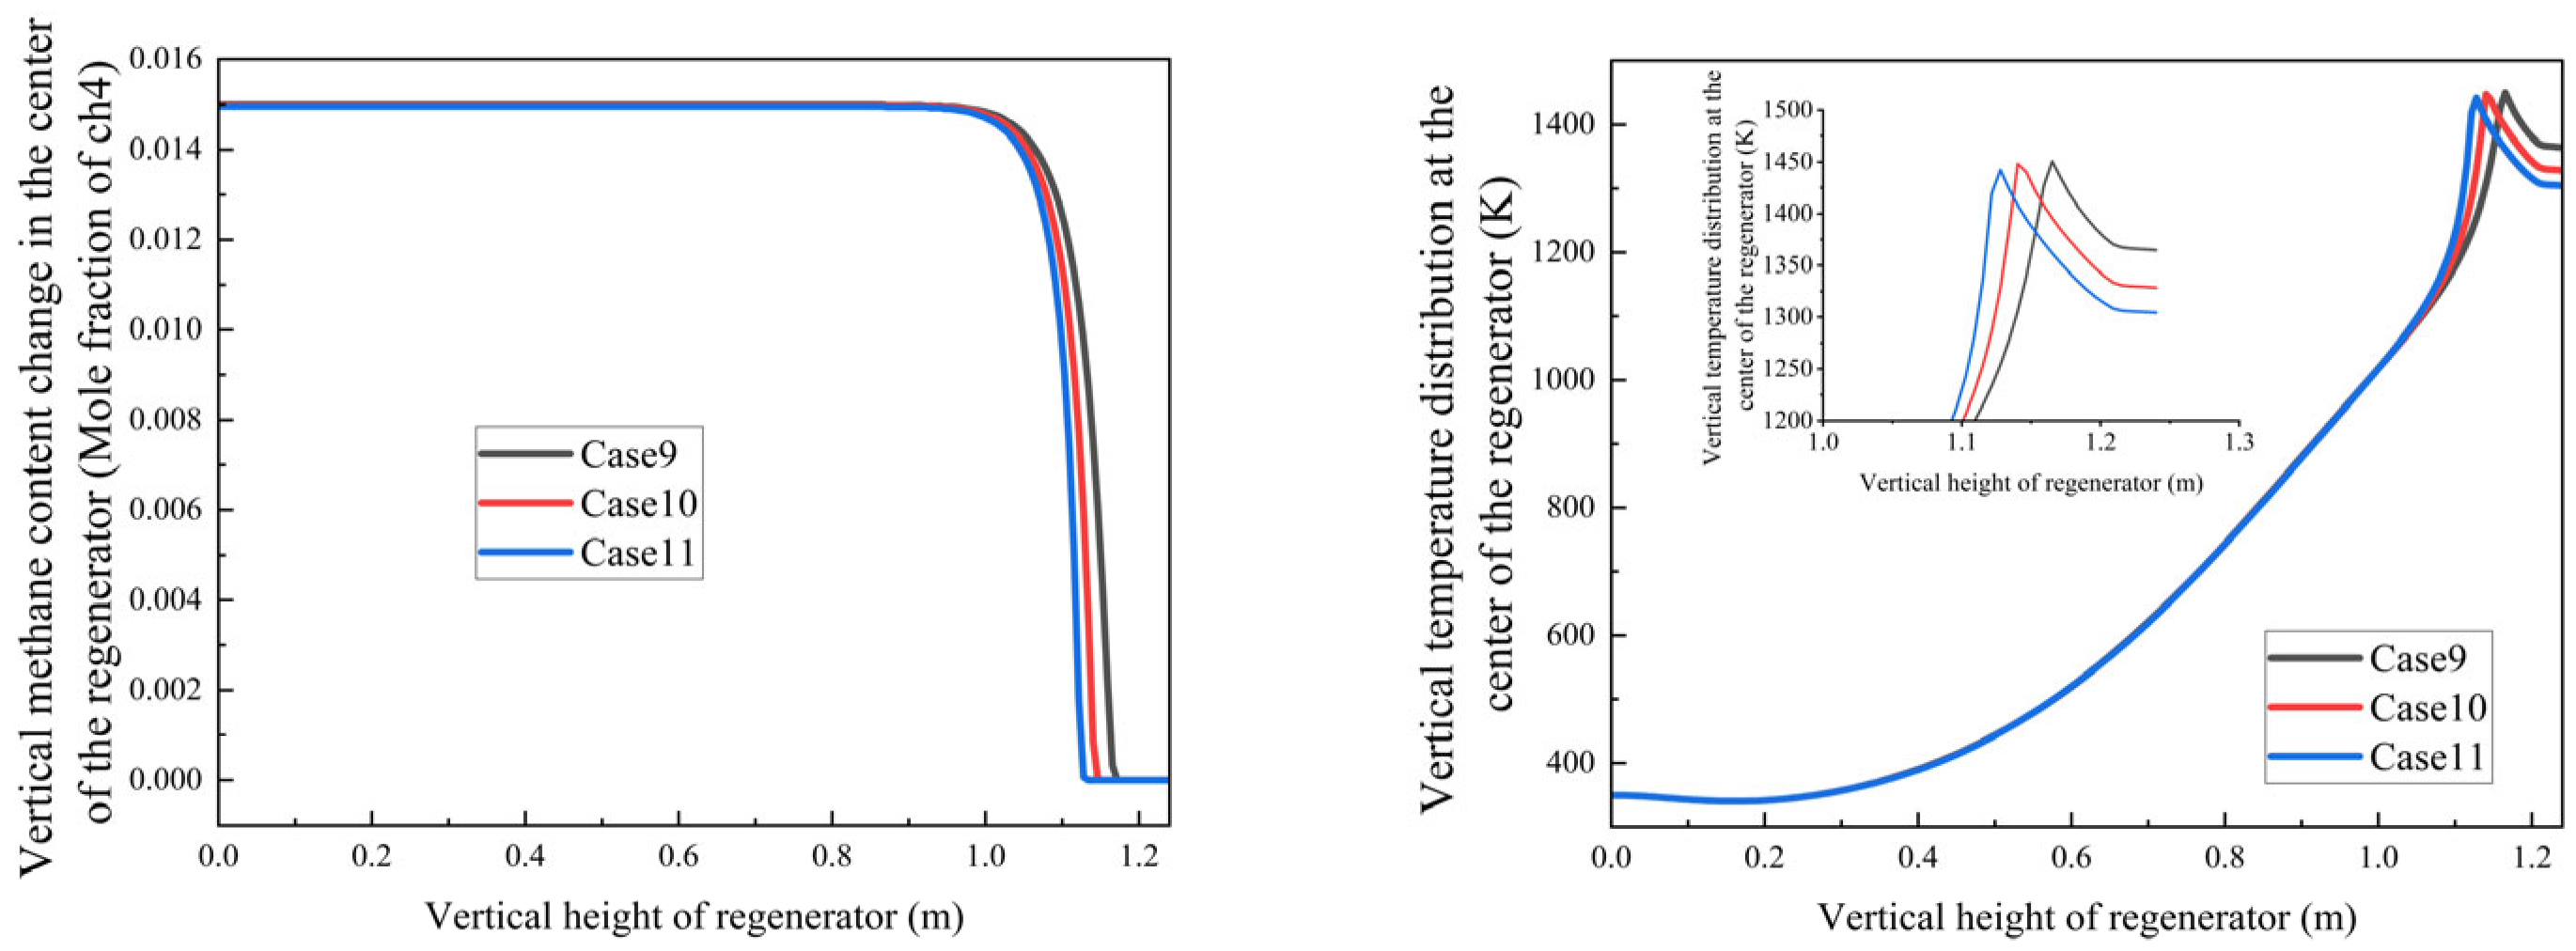
Increasing methane mole fraction leads to a steeper axial temperature gradient in the regenerator in
Figure 15;
Peak temperature region intensifies from 1330 K to 1450 K with higher methane concentrations, because with the methane flow rate increasing, the combustion heat increased, which led to a higher temperature.
- 2.
Oxidation stability:
Despite methane concentration gradients, complete oxidation consistently occurs at 1.06 ± 0.01 m;
This stability demonstrates the system’s robust adaptability to fuel concentration variations under current design parameters;
These findings corroborate the trends observed in
Figure 14 and highlight two key system characteristics:
The strong coupling between methane concentration and thermal field development;
The design’s inherent capability to maintain stable oxidation performance across a range of fuel concentrations.
Figure 15.
Variation trends of methane mole fraction and temperature with regenerator height under different methane concentrations in an open-circuit environment.
Figure 15.
Variation trends of methane mole fraction and temperature with regenerator height under different methane concentrations in an open-circuit environment.
Building on these results, we further investigated regenerative oxidation cases with fixed methane concentration but varying oxygen and carbon dioxide concentrations to simulate exhaust gas recirculation conditions (
Figure 16).
Figure 16 demonstrates that under constant methane concentration conditions, increasing the exhaust gas recirculation ratio (corresponding to decreasing oxygen concentration) leads to the following:
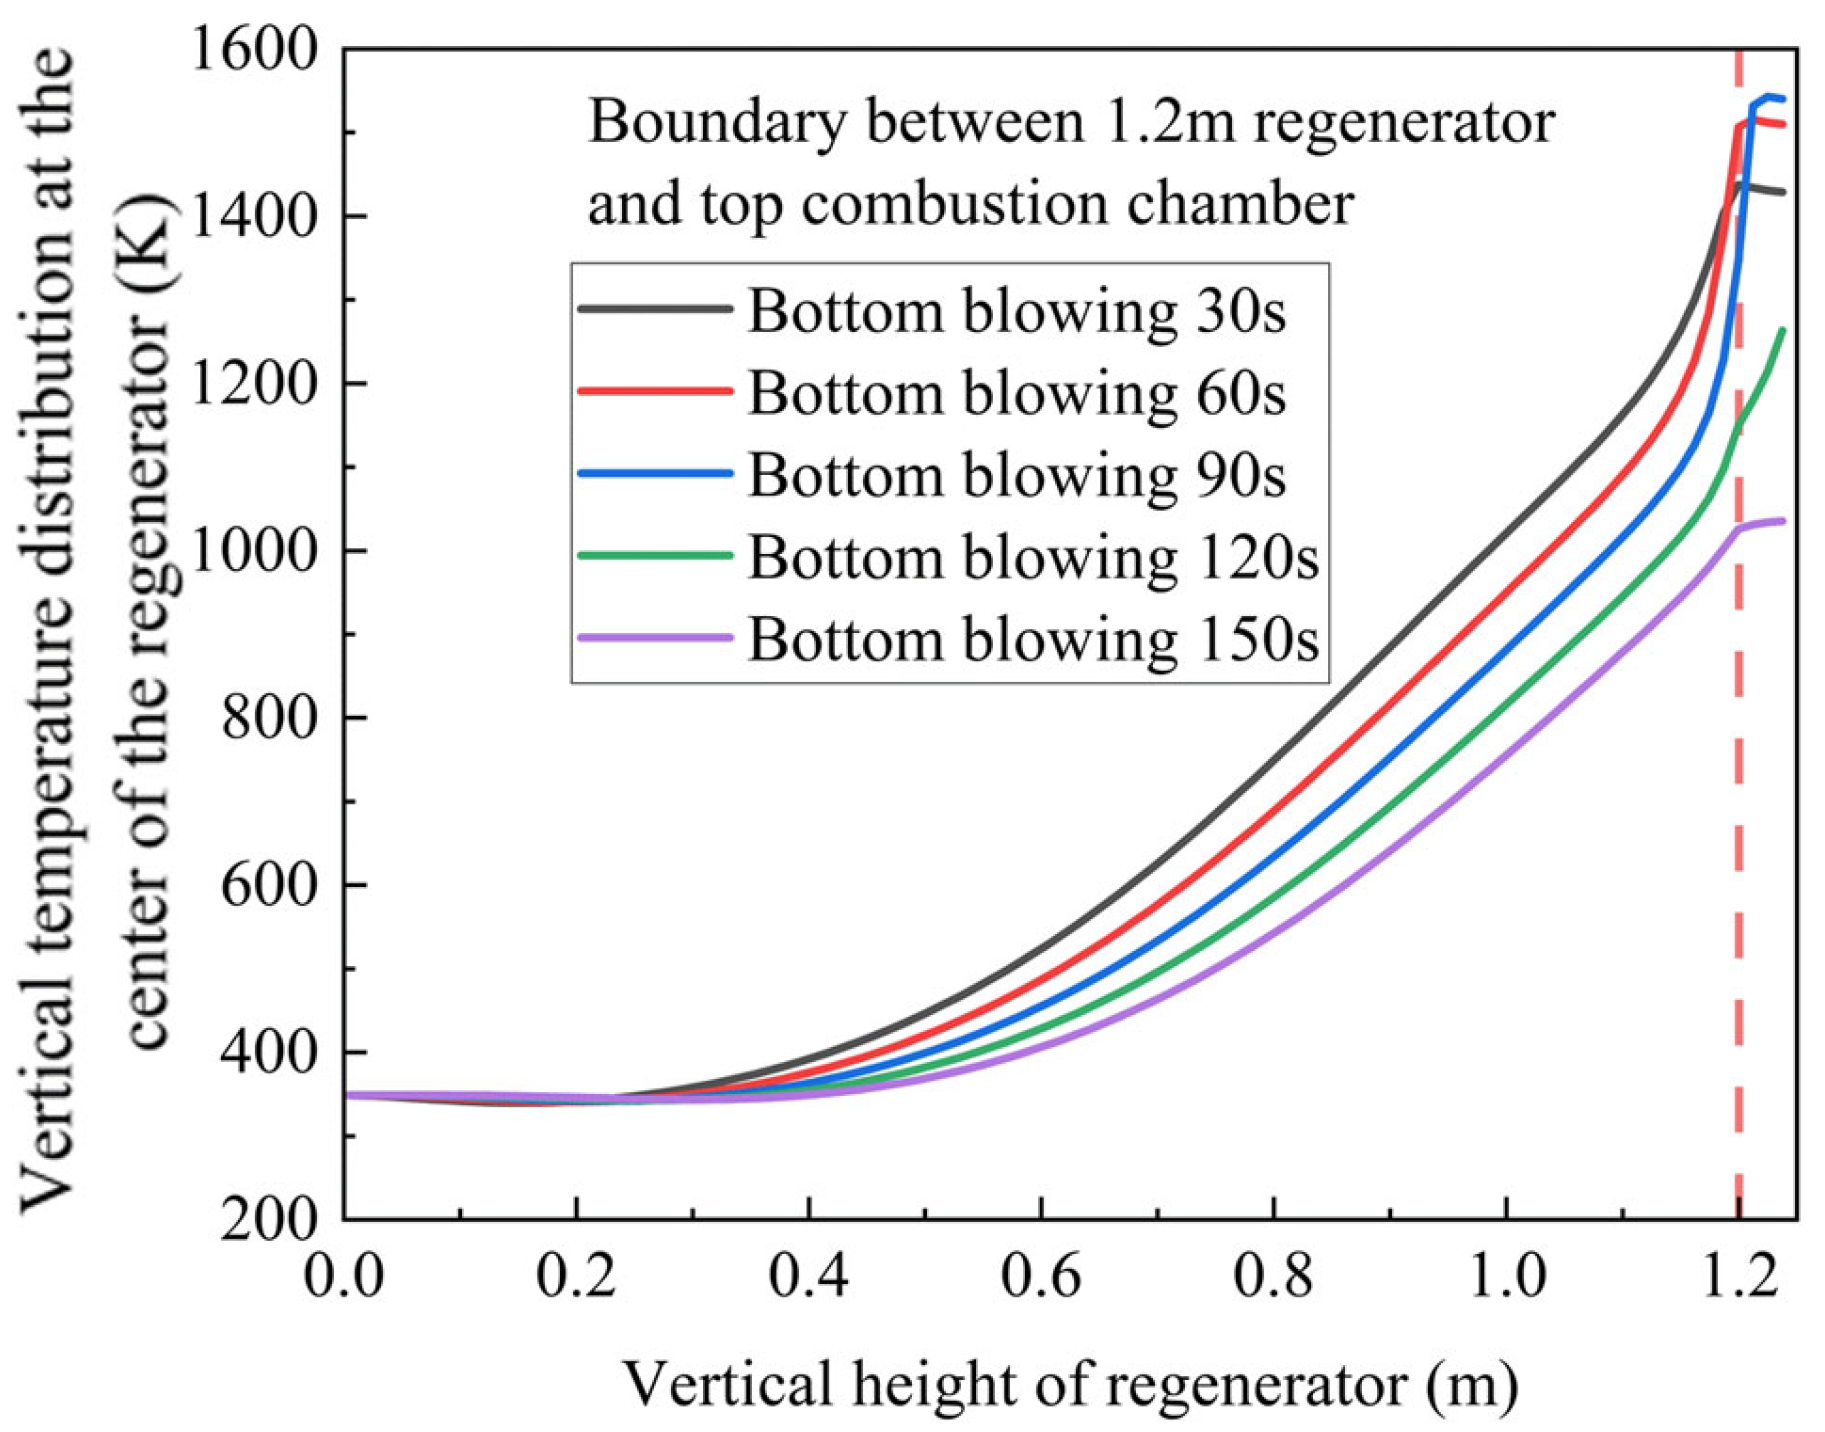
By integrating these simulation results with our experimental platform configuration, we predicted the optimal gas switching time for the regenerator’s air intake cycle. The red dotted line represents the top of the heat storage chamber. From this point on, the temperature distribution of the heat storage chamber at different times can be analyzed. As illustrated in
Figure 17, the analysis indicates an appropriate switching time range of 30–90 s.
3.2. Overall Model Simulation Results
The revised model incorporates the following key assumptions:
(A) Baseline Model (First Operating Cycle)
Inlet chambers: 1, 8, 12, 7, 11;
Cleaning chamber: 2;
Isolation chamber: 3;
Outlet chambers: 4, 5, 6, 9, 10.
(B) Modified Model (First Operating Cycle)
Inlet chambers: 1, 2, 3, 4, 5;
Cleaning chamber: 12;
Isolation chamber: 11;
Outlet chambers: 6, 7, 8, 9, 10.
- 4.
Cycle operation:
Chamber functions switch according to predefined protocols after each combustion cycle;
Special focus on the first post-preheating cycle due to the following:
Significant parameter fluctuations;
Critical importance for understanding dynamic response mechanisms.
Figure 18.
Arrangement of 12 chambers for two models.
Figure 18.
Arrangement of 12 chambers for two models.
This systematic analysis of the initial operational cycle provides fundamental insights into the device’s transient behavior and establishes a basis for subsequent performance evaluation. The content shown in the figure is only a state of a certain period of time.
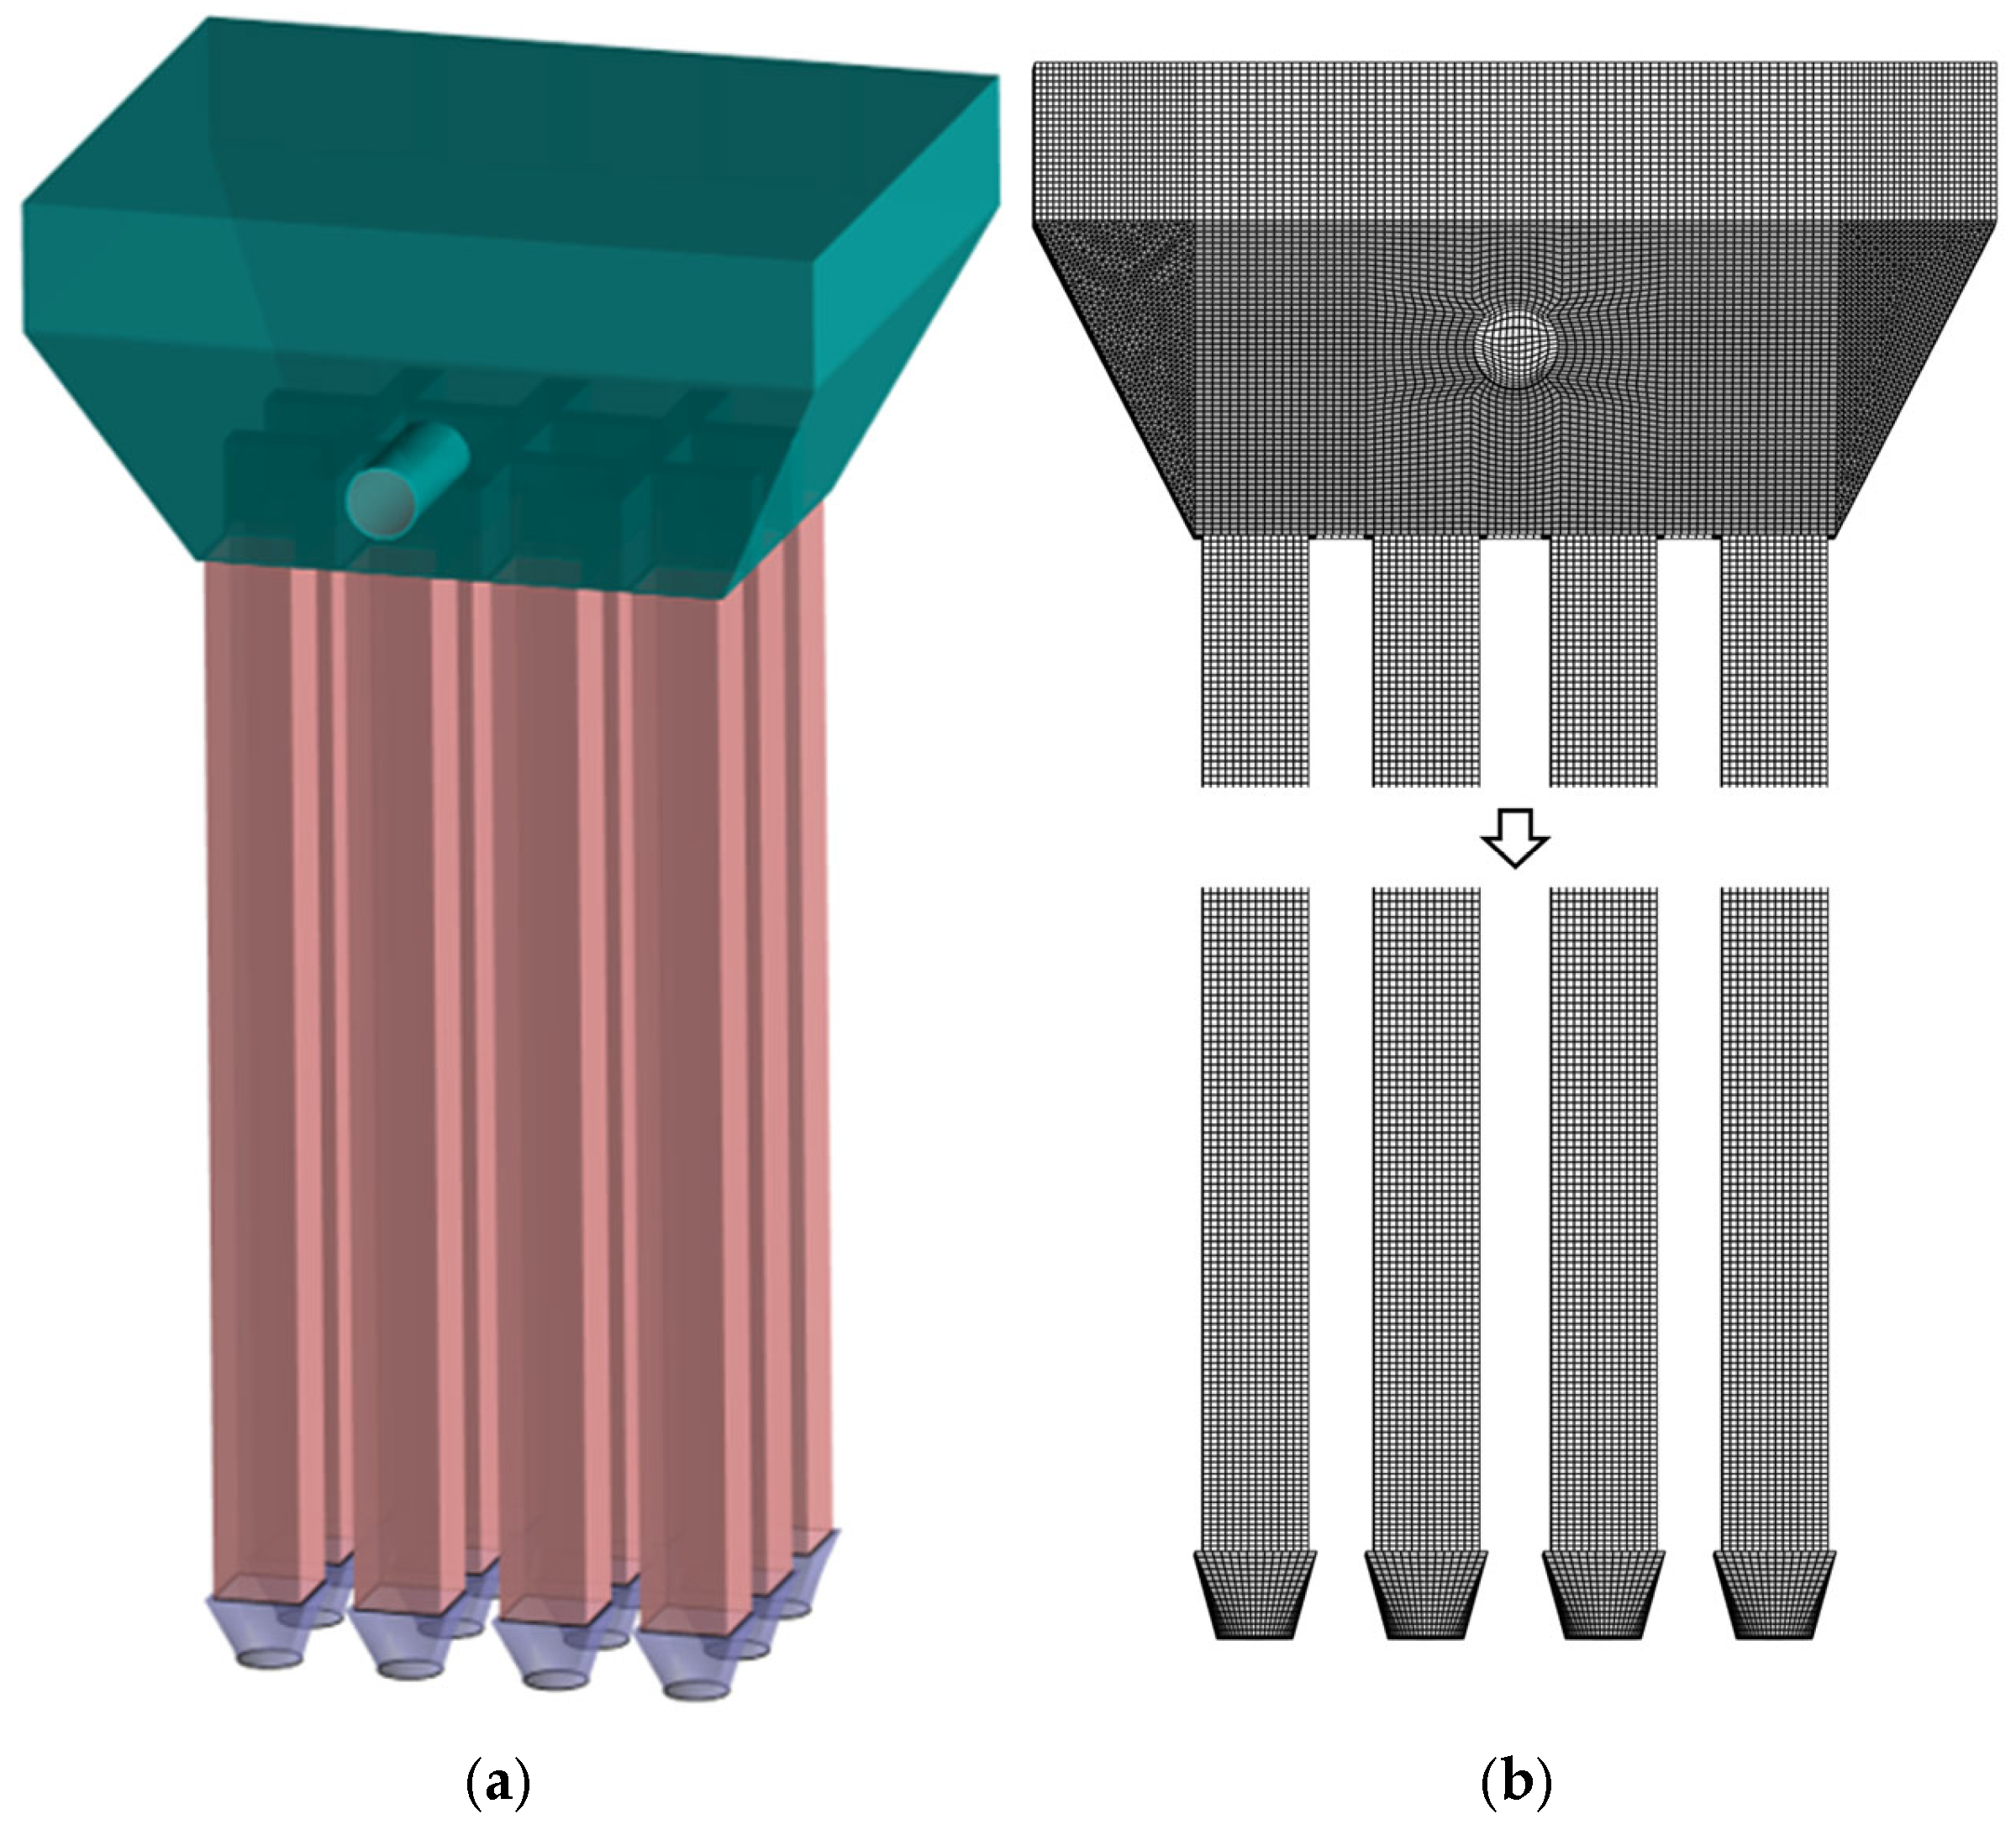
Following model simplification,
Figure 19a presents the schematic representation of the baseline model, while
Figure 19b displays the corresponding computational grid. This simplified configuration maintains the essential physical characteristics while improving computational efficiency for the numerical simulations.
Figure 20a presents the schematic representation of the modified model, while
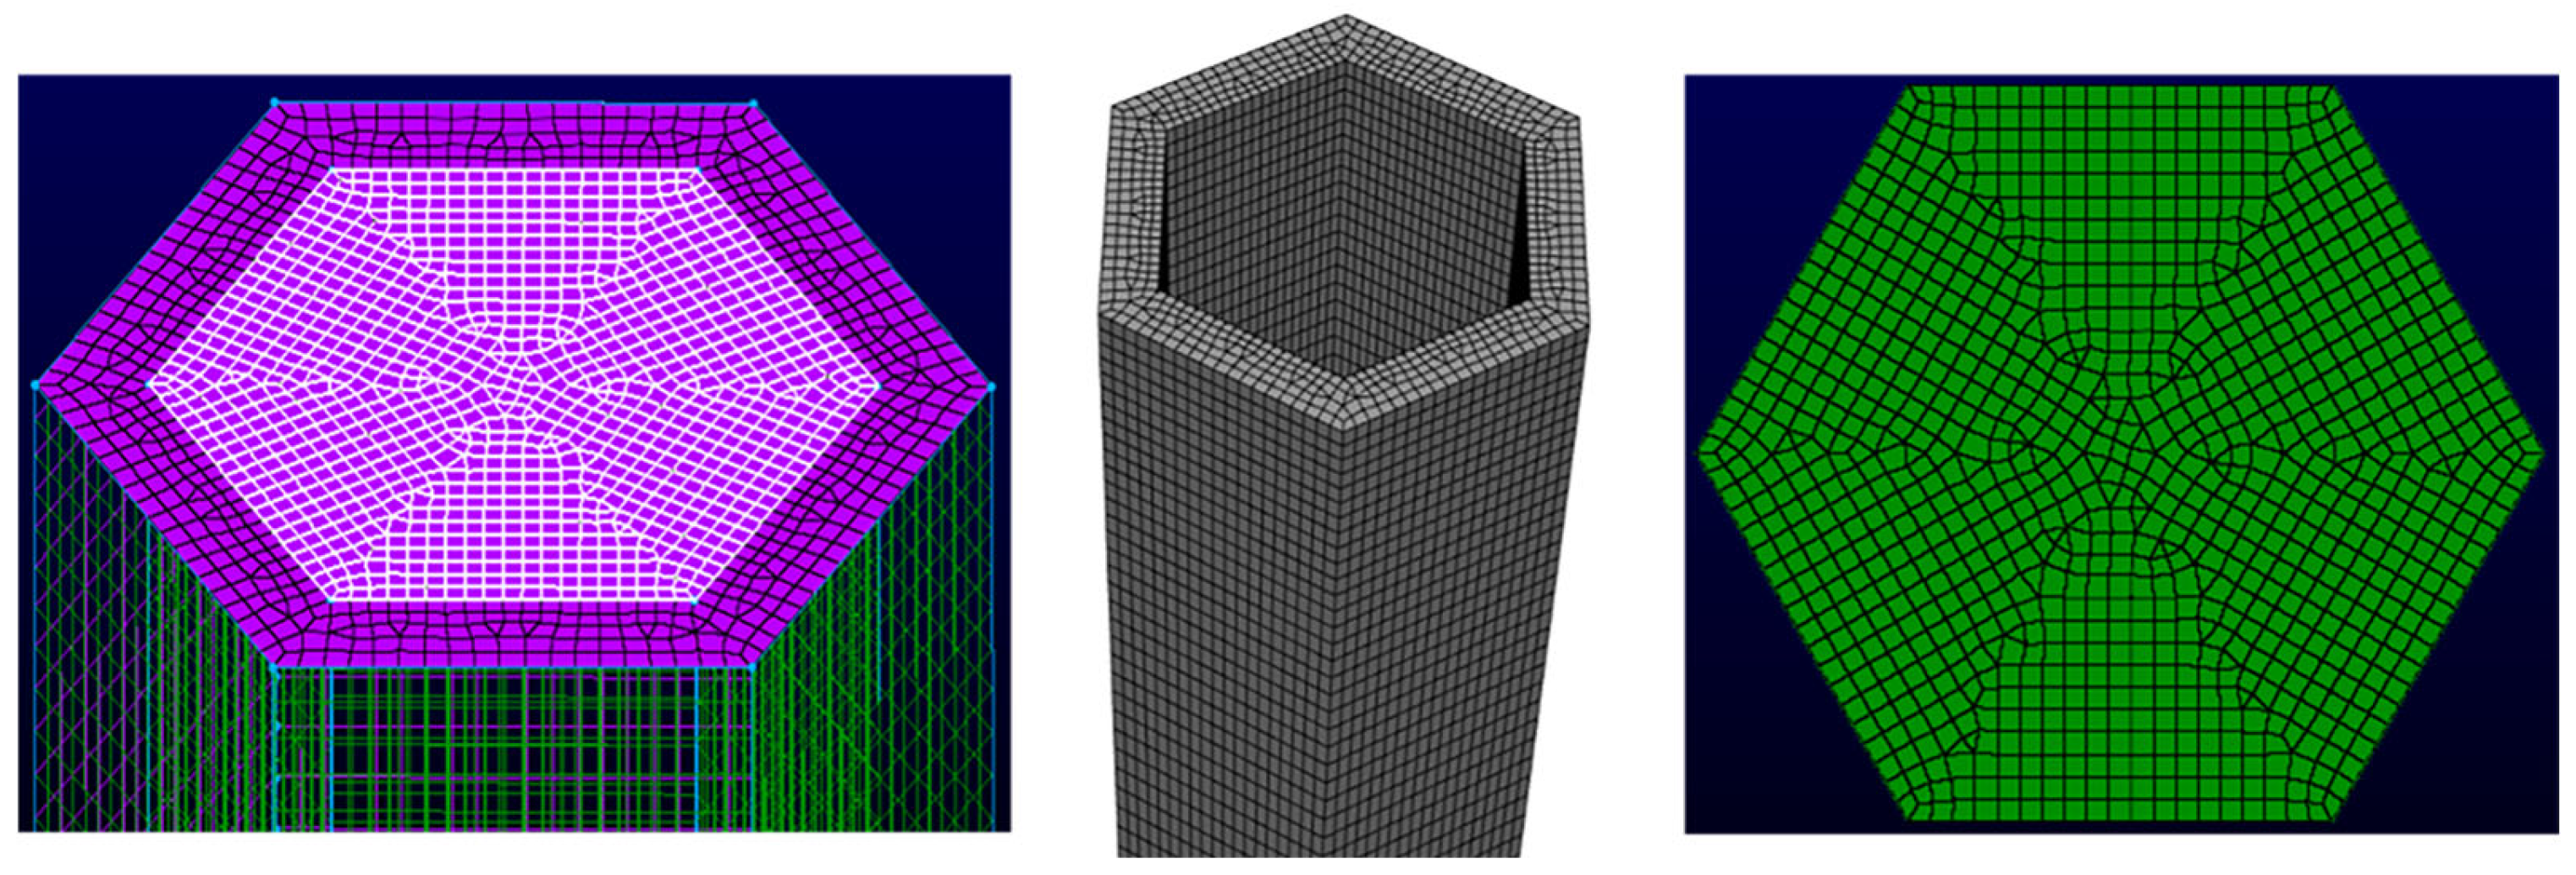
Figure 20b displays the corresponding computational grid. This simplified configuration maintains the essential physical characteristics while improving computational efficiency for the numerical simulations.The number of grids in
Figure 20b is 3,092,870, and the average grid size is 1.2283 × 10
−7 m. The value of yplus is approximately 30, and the height of the first layer of the grid is set to 0.001 m.
Combustion Chamber Performance and Model Validation
The combustion chamber serves two primary functions: (1) oxidation of organic substances and (2) decomposition of methane. Turbulent flow within the chamber significantly enhances combustion efficiency by promoting complete methane consumption, particularly for unburned gases entering from the regenerator chamber [
37,
38,
39].
Turbulent kinetic energy analysis reveals the following:
Comparison of flow characteristics in
Figure 21:
Baseline model (A):
Modified model (B):
Figure 21.
Streamline diagrams of the two models.
Figure 21.
Streamline diagrams of the two models.
Based on this analysis, Model B was selected for the RTO laboratory implementation.
- 2.
Experimental Validation
The simulation model was validated against experimental data using Case 4 parameters (
Table 6). Temperature distribution in Chamber 1 (along the red reference line in
Figure 22) was compared at t = 50 s using four measurement points. The key findings are set out below:
Excellent agreement between the experimental and simulation results;
Consistent trends in temperature distribution;
Comparable magnitude values.
Table 6.
Turbulence enhancement. Turbulent kinetic energy shows concentration-dependent growth.
Table 6.
Turbulence enhancement. Turbulent kinetic energy shows concentration-dependent growth.
| Case | Methane Concentration | Turbulent Kinetic Energy (m2/s2) |
|---|
| 3 | Low | 0.03032 |
| 4 | Medium | 0.03065 |
| 5 | High | 0.03086 |
Figure 22.
Comparison of temperature distributions in regenerator chamber between simulation and experimental results.
Figure 22.
Comparison of temperature distributions in regenerator chamber between simulation and experimental results.
This validation confirms the model’s reliability for engineering applications, demonstrating the following:
Accurate prediction of thermal behavior;
Representative simulation of flow dynamics;
Practical utility for system optimization.
