Article

Modeling the Link between Left Ventricular Flow and Thromboembolic Risk Using Lagrangian Coherent Structures

Bioengineering Program, Department of Mechanical Engineering, San Diego State University, San Diego, CA 92182-1323, USA
*
Author to whom correspondence should be addressed.
Fluids 2016, 1(4), 38; https://doi.org/10.3390/fluids1040038
Submission received: 19 May 2016 / Revised: 21 October 2016 / Accepted: 15 November 2016 / Published: 22 November 2016

Abstract

:
A thrombus is a blood clot that forms on a surface, and can grow and detach, presenting a high risk for stroke and pulmonary embolism. This risk increases with blood-contacting medical devices, due to the immunological response to foreign surfaces and altered flow patterns that activate the blood and promote thromboembolism (TE). Abnormal blood transport, including vortex behavior and regional stasis, can be assessed from Lagrangian Coherent Structures (LCS). LCS are flow structures that bound transport within a flow field and divide the flow into regions with maximally attracting/repelling surfaces that maximize local shear. LCS can be identified from finite time Lyapunov exponent (FTLE) fields, which are computed from velocity field data. In this study, the goal was to use FTLE analysis to evaluate LCS in the left ventricle (LV) using velocity data obtained from flow visualization of a mock circulatory loop. A model of dilated cardiomyopathy (DCM) was used to investigate the effect of left ventricular assist device (LVAD) support on diastolic filling and transport in the LV. A small thrombus in the left ventricular outflow tract was also considered using data from a corresponding LV model. The DCM LV exhibited a direct flow of 0.8 L/cardiac cycle, which was tripled during LVAD support Delayed ejection flow was doubled, further illustrating the impact of LVAD support on blood transport. An examination of the attracting LCS ridges during diastolic filling showed that the increase is due primarily to augmentation of A wave inflow, which is associated with increased vortex circulation, kinetic energy and Forward FTLE. The introduction of a small thrombus in the left ventricular outflow tract (LVOT) of the LV had a minimal effect on diastolic inflow, but obstructed systolic outflow leading to decreased transport compared with the unobstructed LVOT geometry. Localized FTLE in the LVOT increased dramatically with the small thrombus model, which reflects greater recirculation distal to the thrombus location. The combination of the thrombus and the LVAD increased stasis distal to the thrombus, increasing the likelihood of recurring coagulation during Series flow conditions. The extension of the results of the previous studies with this analysis provides a more sensitive indicator of TE risk than the Eulerian velocity values do, and may provide an important tool for evaluating medical device design, surgical implantation, and treatment options.

1. Introduction

Blood-contacting medical devices, such as those that interface with the cardiovascular system, have continued to manifest significant stroke and thromboembolic event rates despite advances in design and medical management. These statistics drive the search for better tools to predict thrombus formation during the development phase of these devices, in order to better position the designs for long-term clinical success. Thrombus formation is difficult to model mathematically, due to the complicated underlying mechanobiology. Virchow’s triad first identified flow as a major factor affecting thromboembolism (TE). Flow affects the local concentrations of coagulation cascade factors, which impacts the activation, aggregation and deposition of platelets that initiate a thrombus. Flow determines where a thrombus will form, its size and composition, and whether or not it will remain attached or embolize. Mechanical shear is the main signal for platelet activation, and has been studied under conditions that simulate the physiological and pathological range.
Many approaches to modeling TE have included mathematical descriptions of the biochemical coagulation cascade, relating the flow pattern to component concentrations and shear-induced platelet activation [1,2]. Mechanistic models have been successfully applied to the design optimization of medical devices such as heart valves, ventricular assist devices, and vascular grafts [3,4]. These models yield insight into the relationship of flow patterns with thrombus formation and growth, but are computationally expensive and often require data that are not available on a patient-by-patient basis. Alternatives to these models are sought that can be implemented with a lower computational cost for rapid feedback in a clinical or engineering setting, with the goal of informing physicians on relative TE risk for specific patients to aid in making treatment decisions.
One approach used successfully for evaluating complex flow fields in cardiovascular medicine is the analysis of Lagrangian Coherent Structures (LCS), which are flow structures that bound transport within a flow field, and are defined as the maximally attracting/repelling material surfaces [5,6,7] which locally maximize shear [7]. As material surfaces, there is no flux across an LCS, and hence LCS can divide a flow into regions with disparate properties. Attracting LCS enable assessment of blood clearance and regions of flow stasis in the flow, and repelling LCS are associated with fluid deformation of shear-sensitive blood elements corresponding to lines of platelet activation [8]. Our goal in this paper is to explore the application of LCS models for predicting transport and TE potential from velocity field data measured in an experimental model of the heart. Several clinical conditions are compared to understand the flow patterns in patients with dilated cardiomyopathy (DCM) before and after circulatory support with a left ventricular assist device (LVAD). In addition, a model of a patient left ventricle (LV) that experienced a recurring thrombus following LVAD implantation is evaluated.

2. Methods

Velocity field data measured in a mock circulatory loop were analyzed using the academic software FlowVC for FTLE and tracer particle behavior. Reverse FTLE were evaluated to identify important flow structures and how they are altered during LVAD support. Lagrangian transport of particles through the LV was used to assess the effect of LVAD support and a small LVOT thrombus on transport and blood stasis.

2.1. Experimental Studies

Experimental measurements of 2-D velocity in the midplane of a model left ventricle (LV) were made for several cardiac conditions using our mock circulatory loop, the SDSU cardiac simulator [9]. The simulator controls the pressure-volume cycle of a transparent left ventricle (LV) model with a programmable piston pump, which generates a flow pattern in the LV that closely resembles those measured from patients. The two-dimensional (2D) velocity field v (x,y) of the LV midplane was measured using Particle Image Velocimetry (PIV), a standard method of experimental flow visualization [10]. The circulating fluid used in the flow studies was a viscosity-matched blood analog of 40% glycerol and saline. Neutrally buoyant fluorescent particles (20 μm, PMMA-RHb) were added to the blood analog solution through the left atrial chamber. A LaVision PIV system captured images of the LV triggered from the hemodynamic signals which were used to produce a 40 Hz ensemble-averaged sequence of the 2-D velocity field for the cardiac cycle. The baseline condition corresponds to a mean aortic pressure of 65 mmHg and a cardiac output of 3.5 L/min, combined with an LV volume of 180 mL to produce an ejection fraction of ~25%, representative of a dilated cardiomyopathy (DCM) patient with a heart failure severity of NYHA IV [11,12].
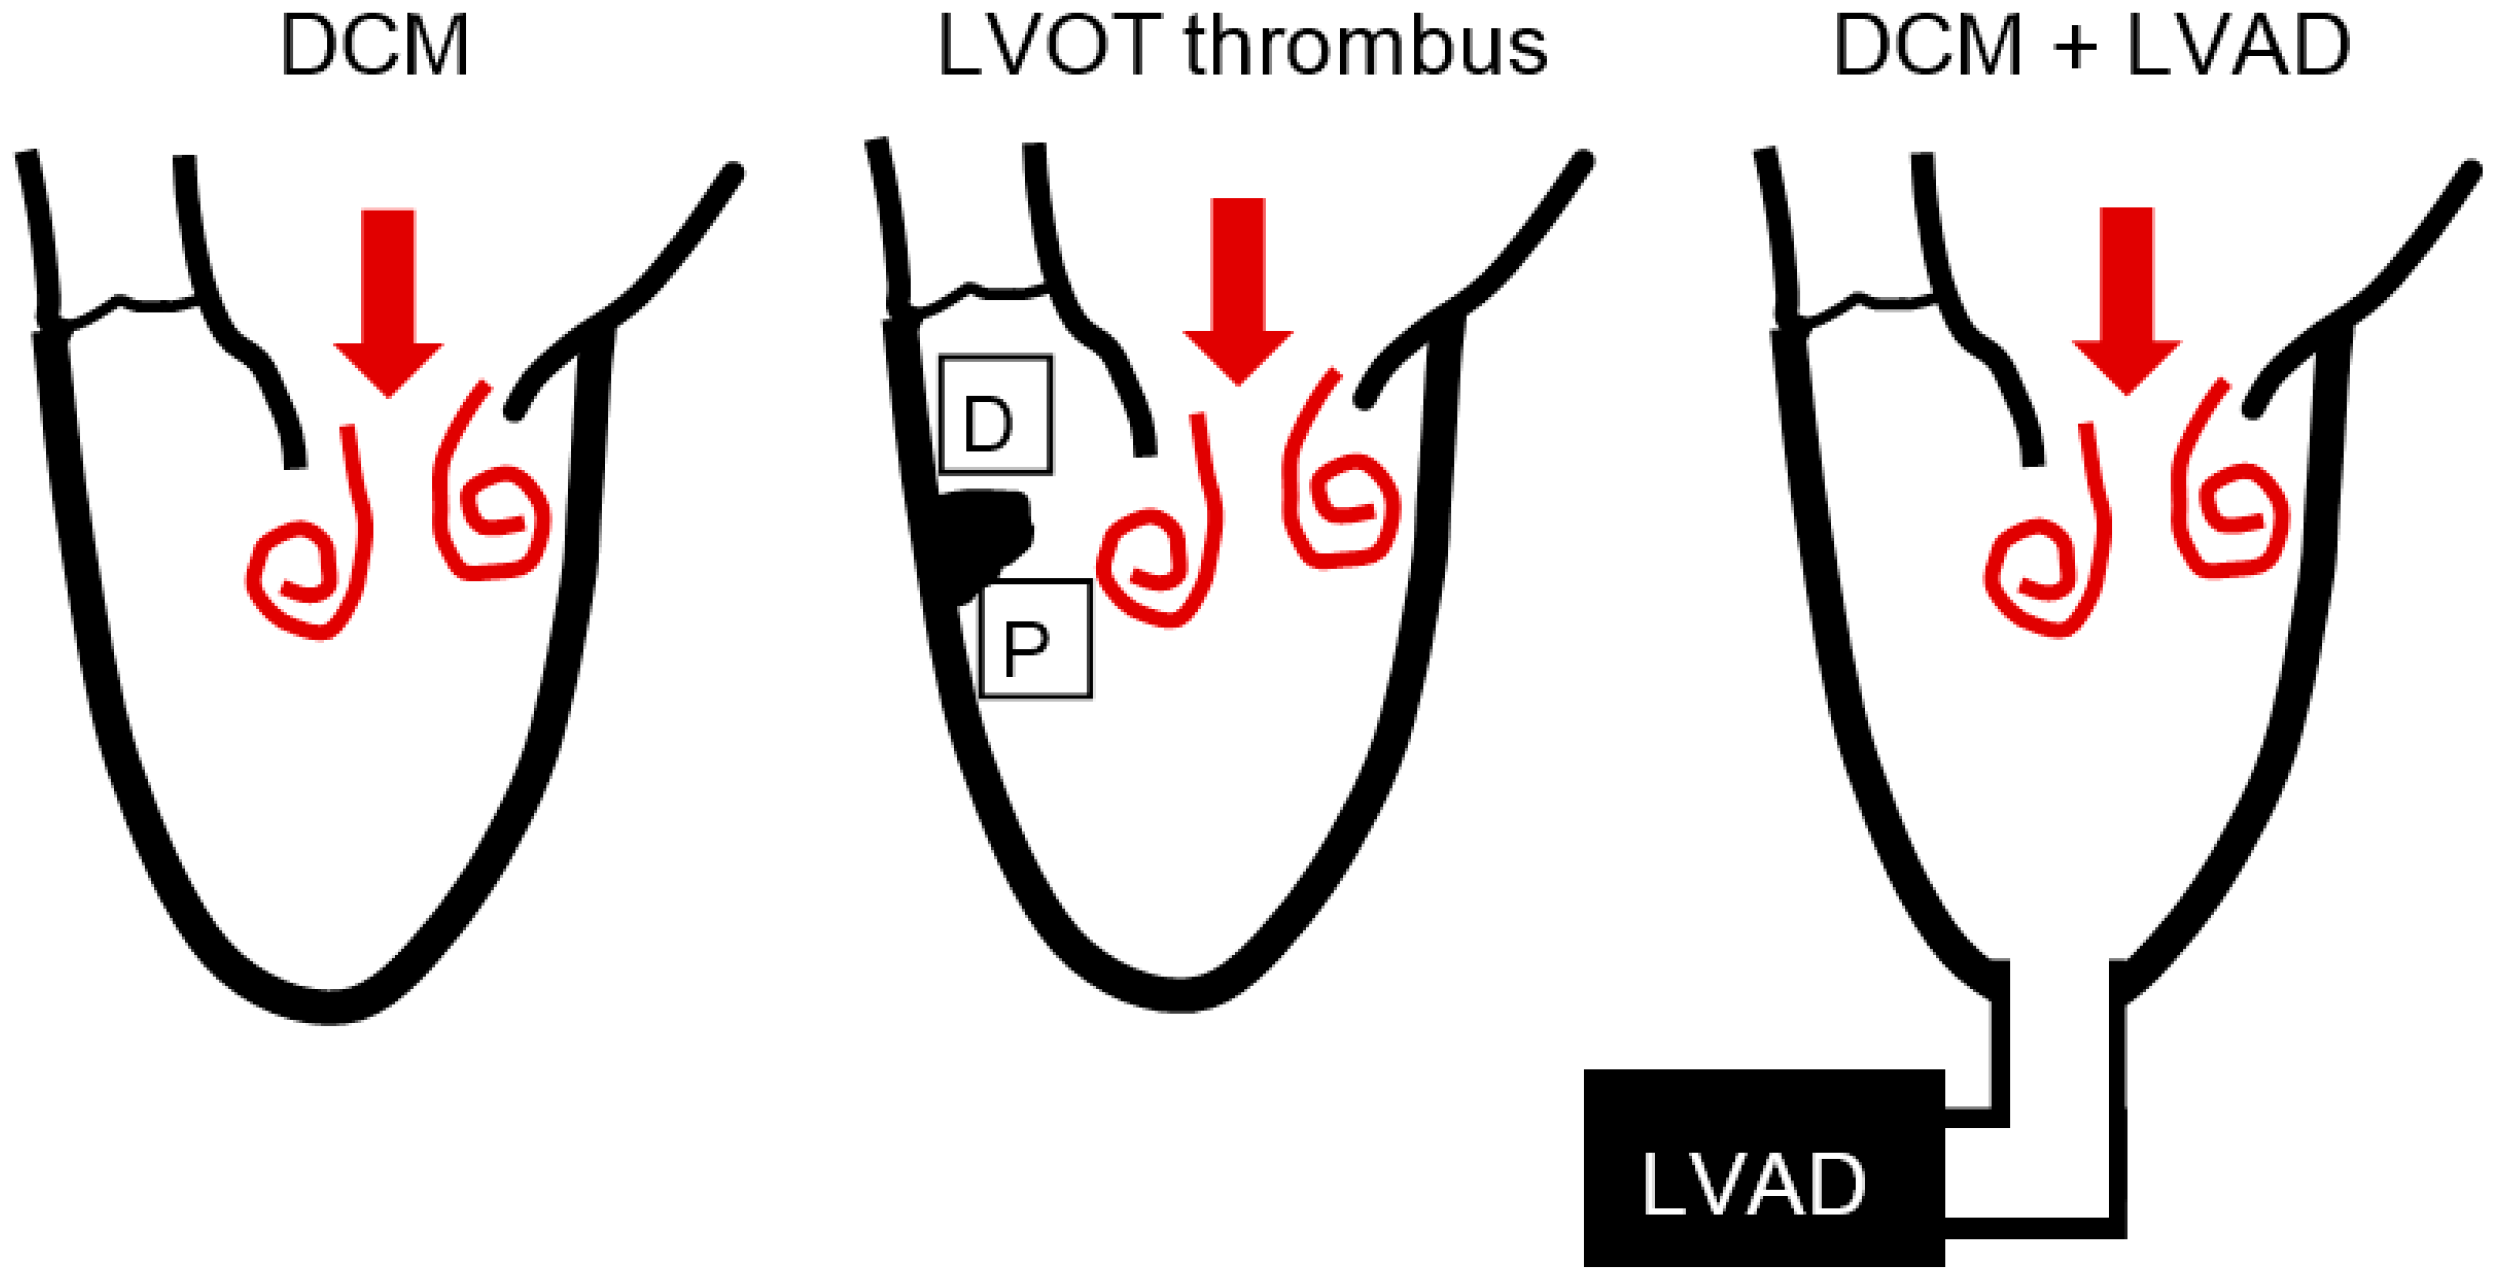
Several flow conditions were simulated that were motivated by clinical examples of patients who received a continuous flow left ventricular assist device (LVAD); for these studies a HeartMate II continuous flow LVAD was used (see Figure 1). The baseline DCM model described previously was studied without (Pre-LVAD) and at two levels of LVAD support, produced by controlling the LVAD motor at two different speeds. The lower speed, 8 krpm, boosts cardiac output to 4.6 L/min but allows the native contractile function to open the aortic valve, a flow condition known as Parallel Flow. Increasing the LVAD speed to 11 krpm further increases cardiac output (to 5.7 L/min) but results in Series Flow, in which the aortic valve does not open and all flow exits the LV through the LVAD [13]. The Pre-LVAD, Parallel and Series flow conditions were also studied with a second LV model geometry, based on a clinical case study of a patient who developed a recurring thrombus in the LVOT that was exacerbated by LVAD support [9,14]. The measured velocity field, together with the LV geometry, were used to generate the flow map from which the LCS could be determined.

2.2. Lagrangian Coherent Structures

LCS are flow structures that bound transport within a flow field, and are defined as the maximally attracting/repelling material surfaces [5,6,7] which locally maximize shear [7]. As material surfaces, there is no flux across an LCS, and thus LCS can divide a flow into regions with disparate properties. Attracting LCS are used to identify transport boundaries and major flow structures. Repelling LCS reveal regions exposed to high shear gradients which, in the context of cardiovascular flow, can provide insight into TE because the biological phenomenon of platelet activation, an important signal of increased TE risk, is associated with high shear gradients. Thus, repelling LCS can be assessed for indications of blood activation and TE. Both attracting and repelling LCS have a major influence on the trajectories of surrounding particles.
LCS are difficult to compute directly, and are typically identified by calculating a finite-time Lyapunov exponent (FTLE) field from the velocity field. FTLE is a measure of maximum averaged logarithmic deformation rate of a fluid element over time [7]. Given a flow map F t 0 t :   x 0   x ( x 0 , t 0 , t ) , the Cauchy-Green strain tensor is
C ( x 0 , t 0 , t ) = F t 0 t ( x 0 ) T   ·   F t 0 t ( x 0 )
The FTLE can be derived from the eigenvalues of the Cauchy-Green Strain tensor, denoted as λ i .
Λ i ( x 0 , t 0 , t ) = 1 | t t 0 | ln λ i ( x 0 , t 0 ; t )
The Forward FTLE field is computed by advecting a dense grid of virtual particles forward through time, from which the repelling LCS are derived. Because expansion in reverse time is also contraction in forward time, the only difference in computing attracting LCS is that particles are advected backward in time rather than forward [6].

2.3. Implementation

FTLE calculations were performed using FlowVC [15], an academic software available at http://shaddenlab.berkeley.edu/software.html. FlowVC requires binary velocity and mesh data thus the standard ASCII PIV files were converted into an unstructured velocity mesh with the same shape as the LV mask. The FTLE field is calculated for a mesh of 344 × 260, four times the resolution of the original 85 × 65 velocity field. The x and y limits of the FTLE mesh are determined from the maximum and minimum values of the velocity field. The virtual particles are advected for a selected integration time using the adaptive time-step Runge Kutta Fehlberg [16] algorithm. Particles outside the velocity mesh are ignored, and integration ends early on particles which exit the velocity mesh. The FTLE analysis was implemented in MATLAB (Mathworks) and Python (PSF).

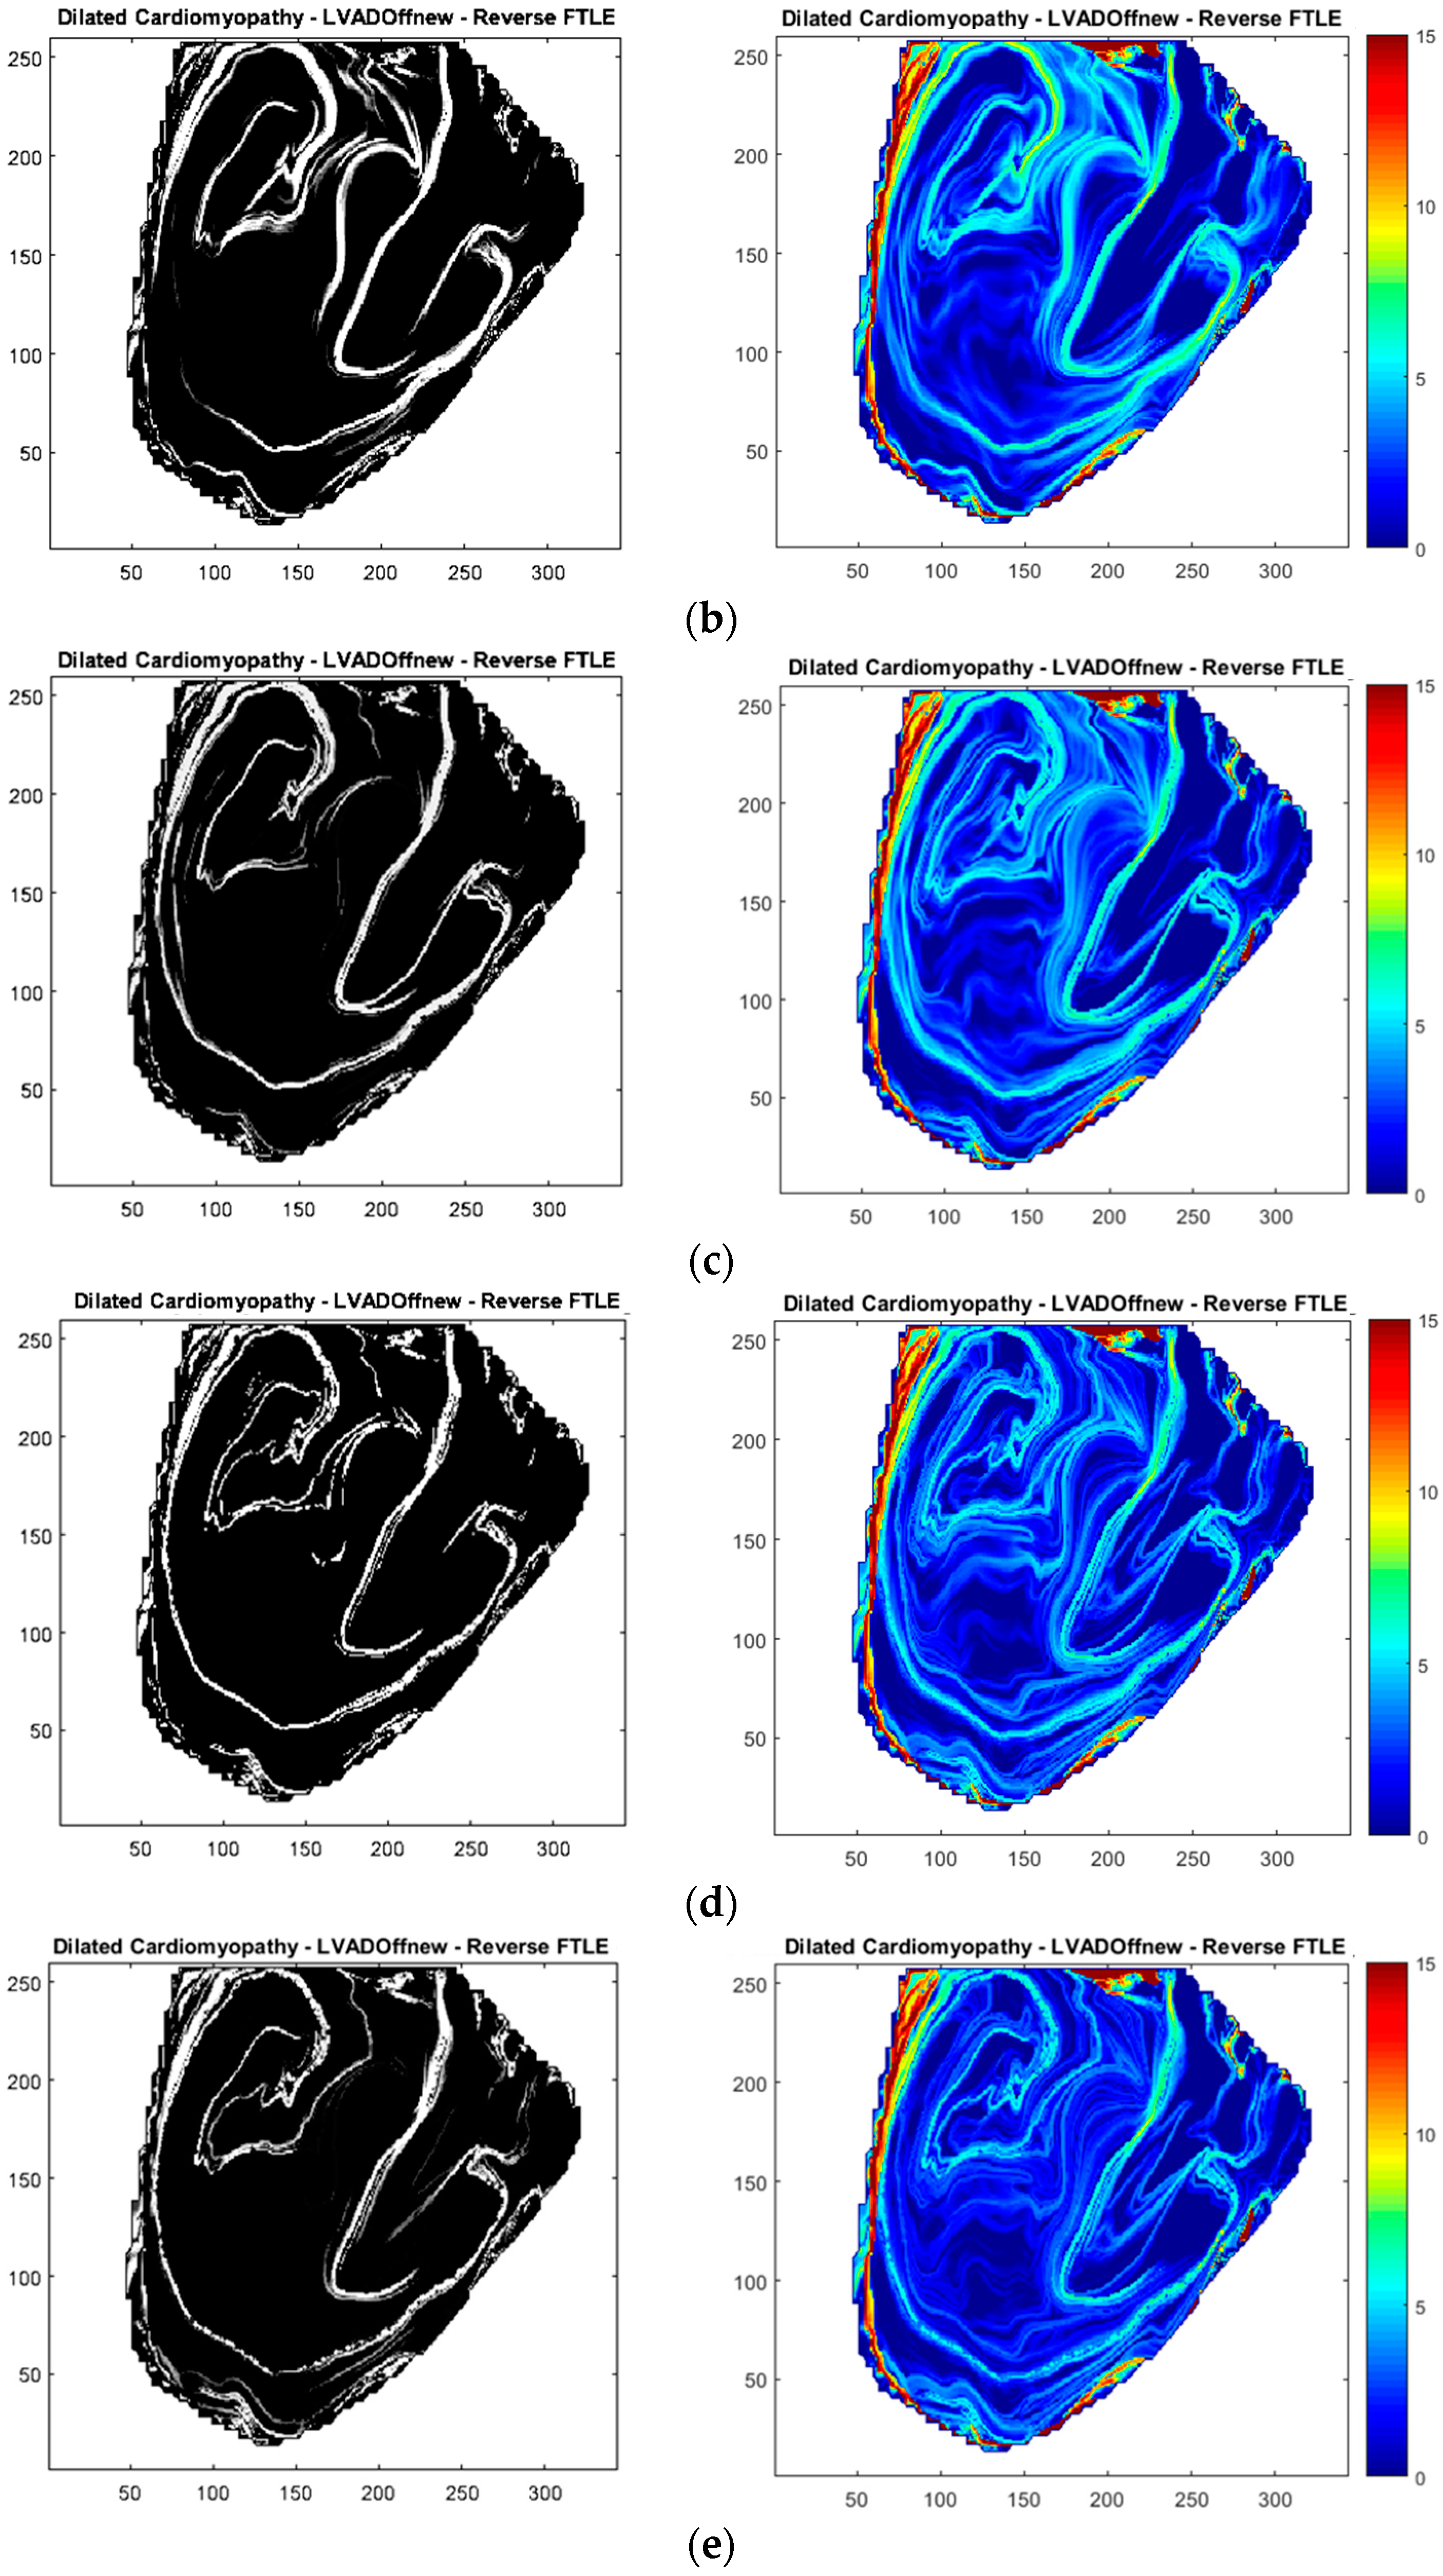
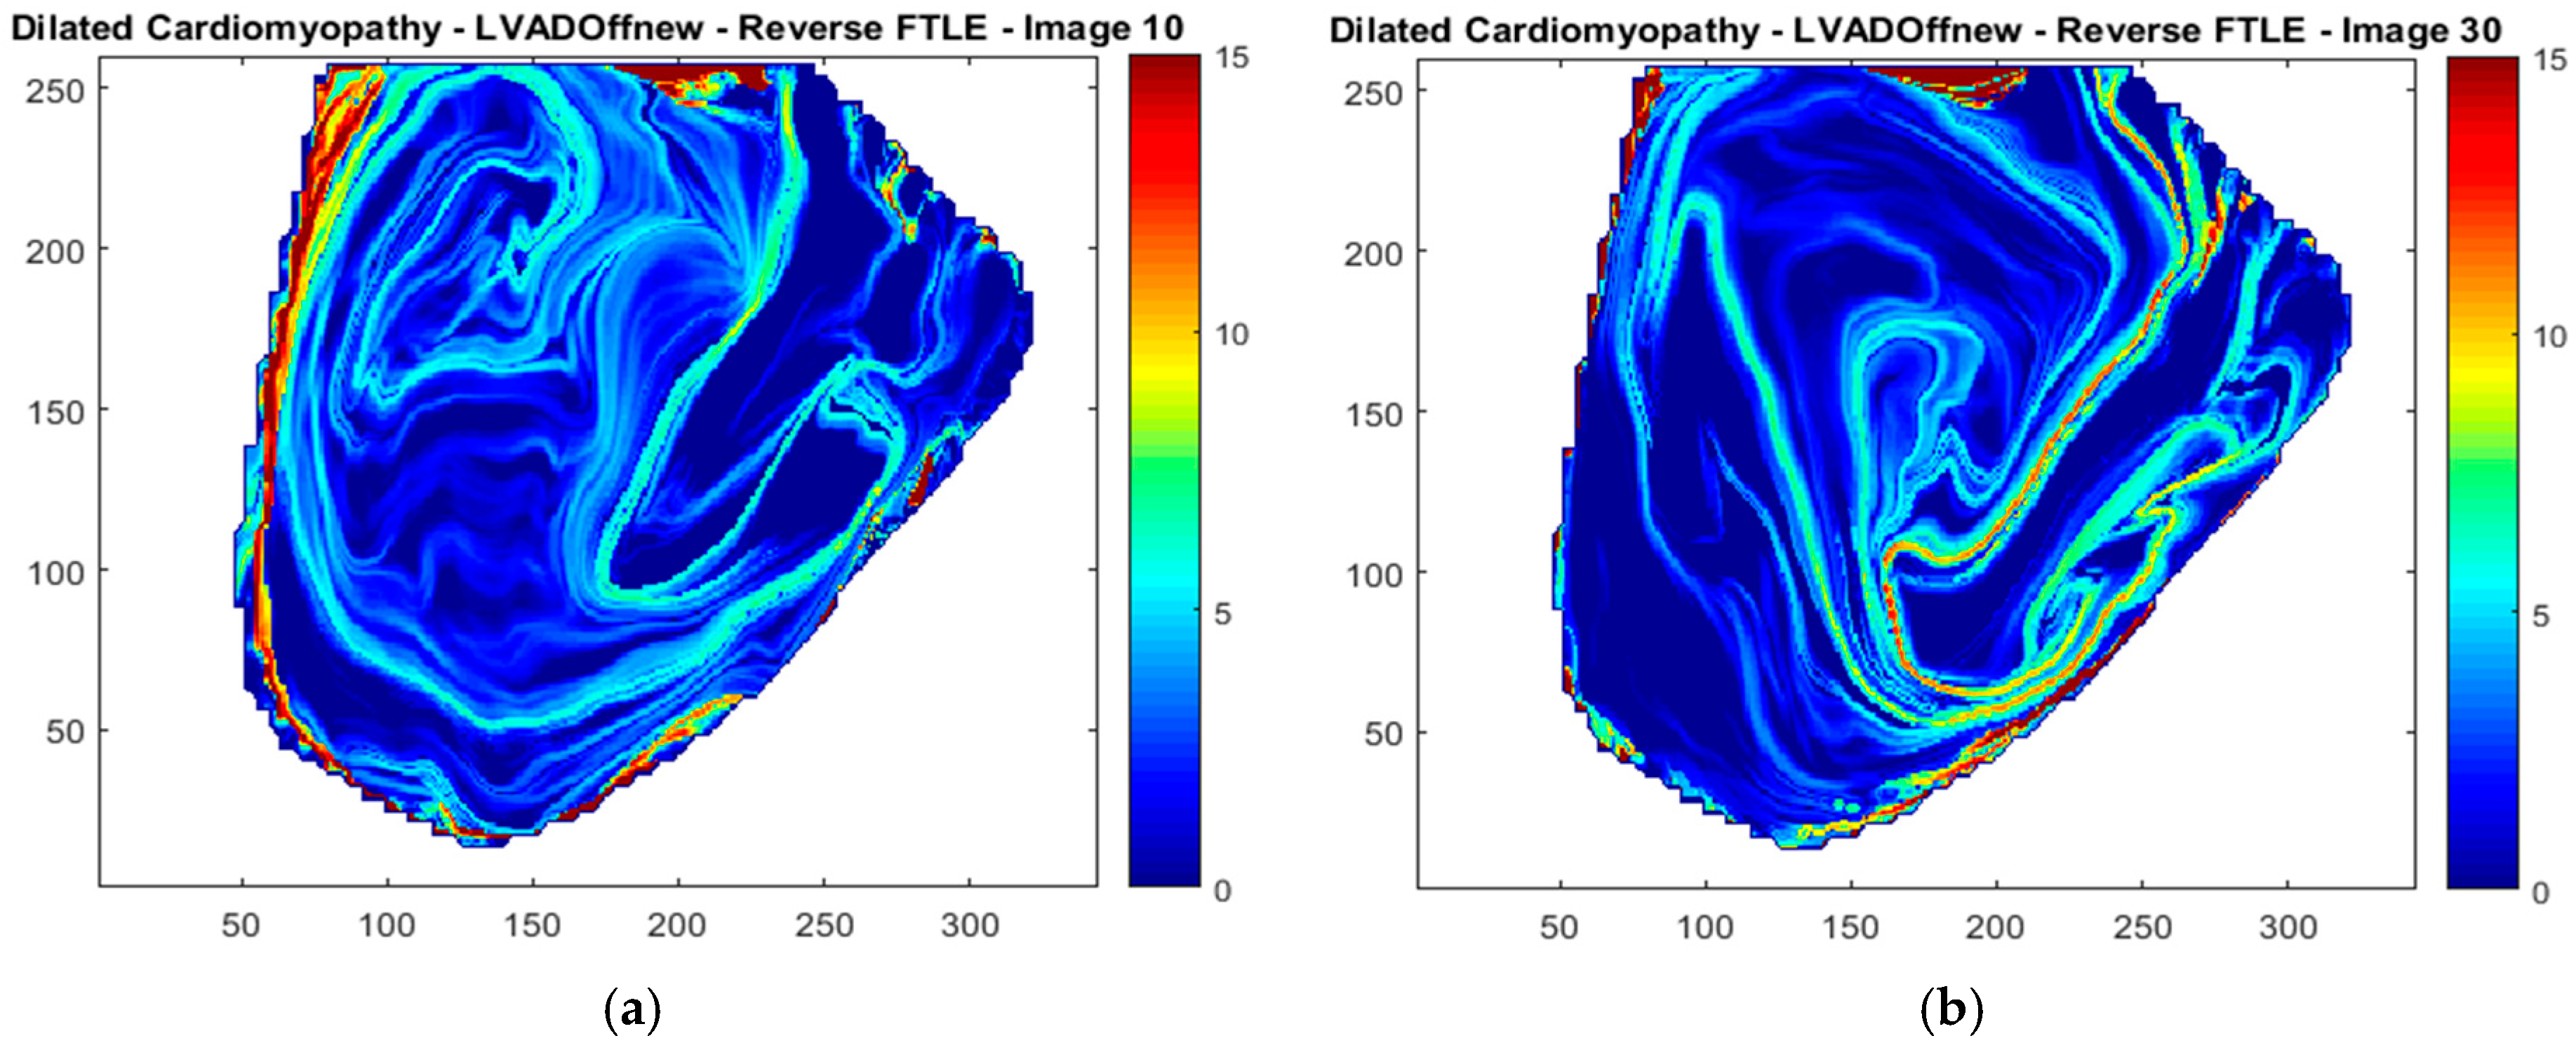
2.4. Selecting the Integration Time and Extracting LCS

The length of the integration time for the FTLE analysis is selected by generating results for a range of integration times, and selecting the value that strikes the right balance between sharpening LCS boundaries and blurring less influential flow structures. Some previous studies have applied algorithms to identify ridges in the FTLE field [17], but most use a combination of visual inspection and selective thresholding of the computed fields, which we followed in the application of this method to the cardiac simulator data [6].
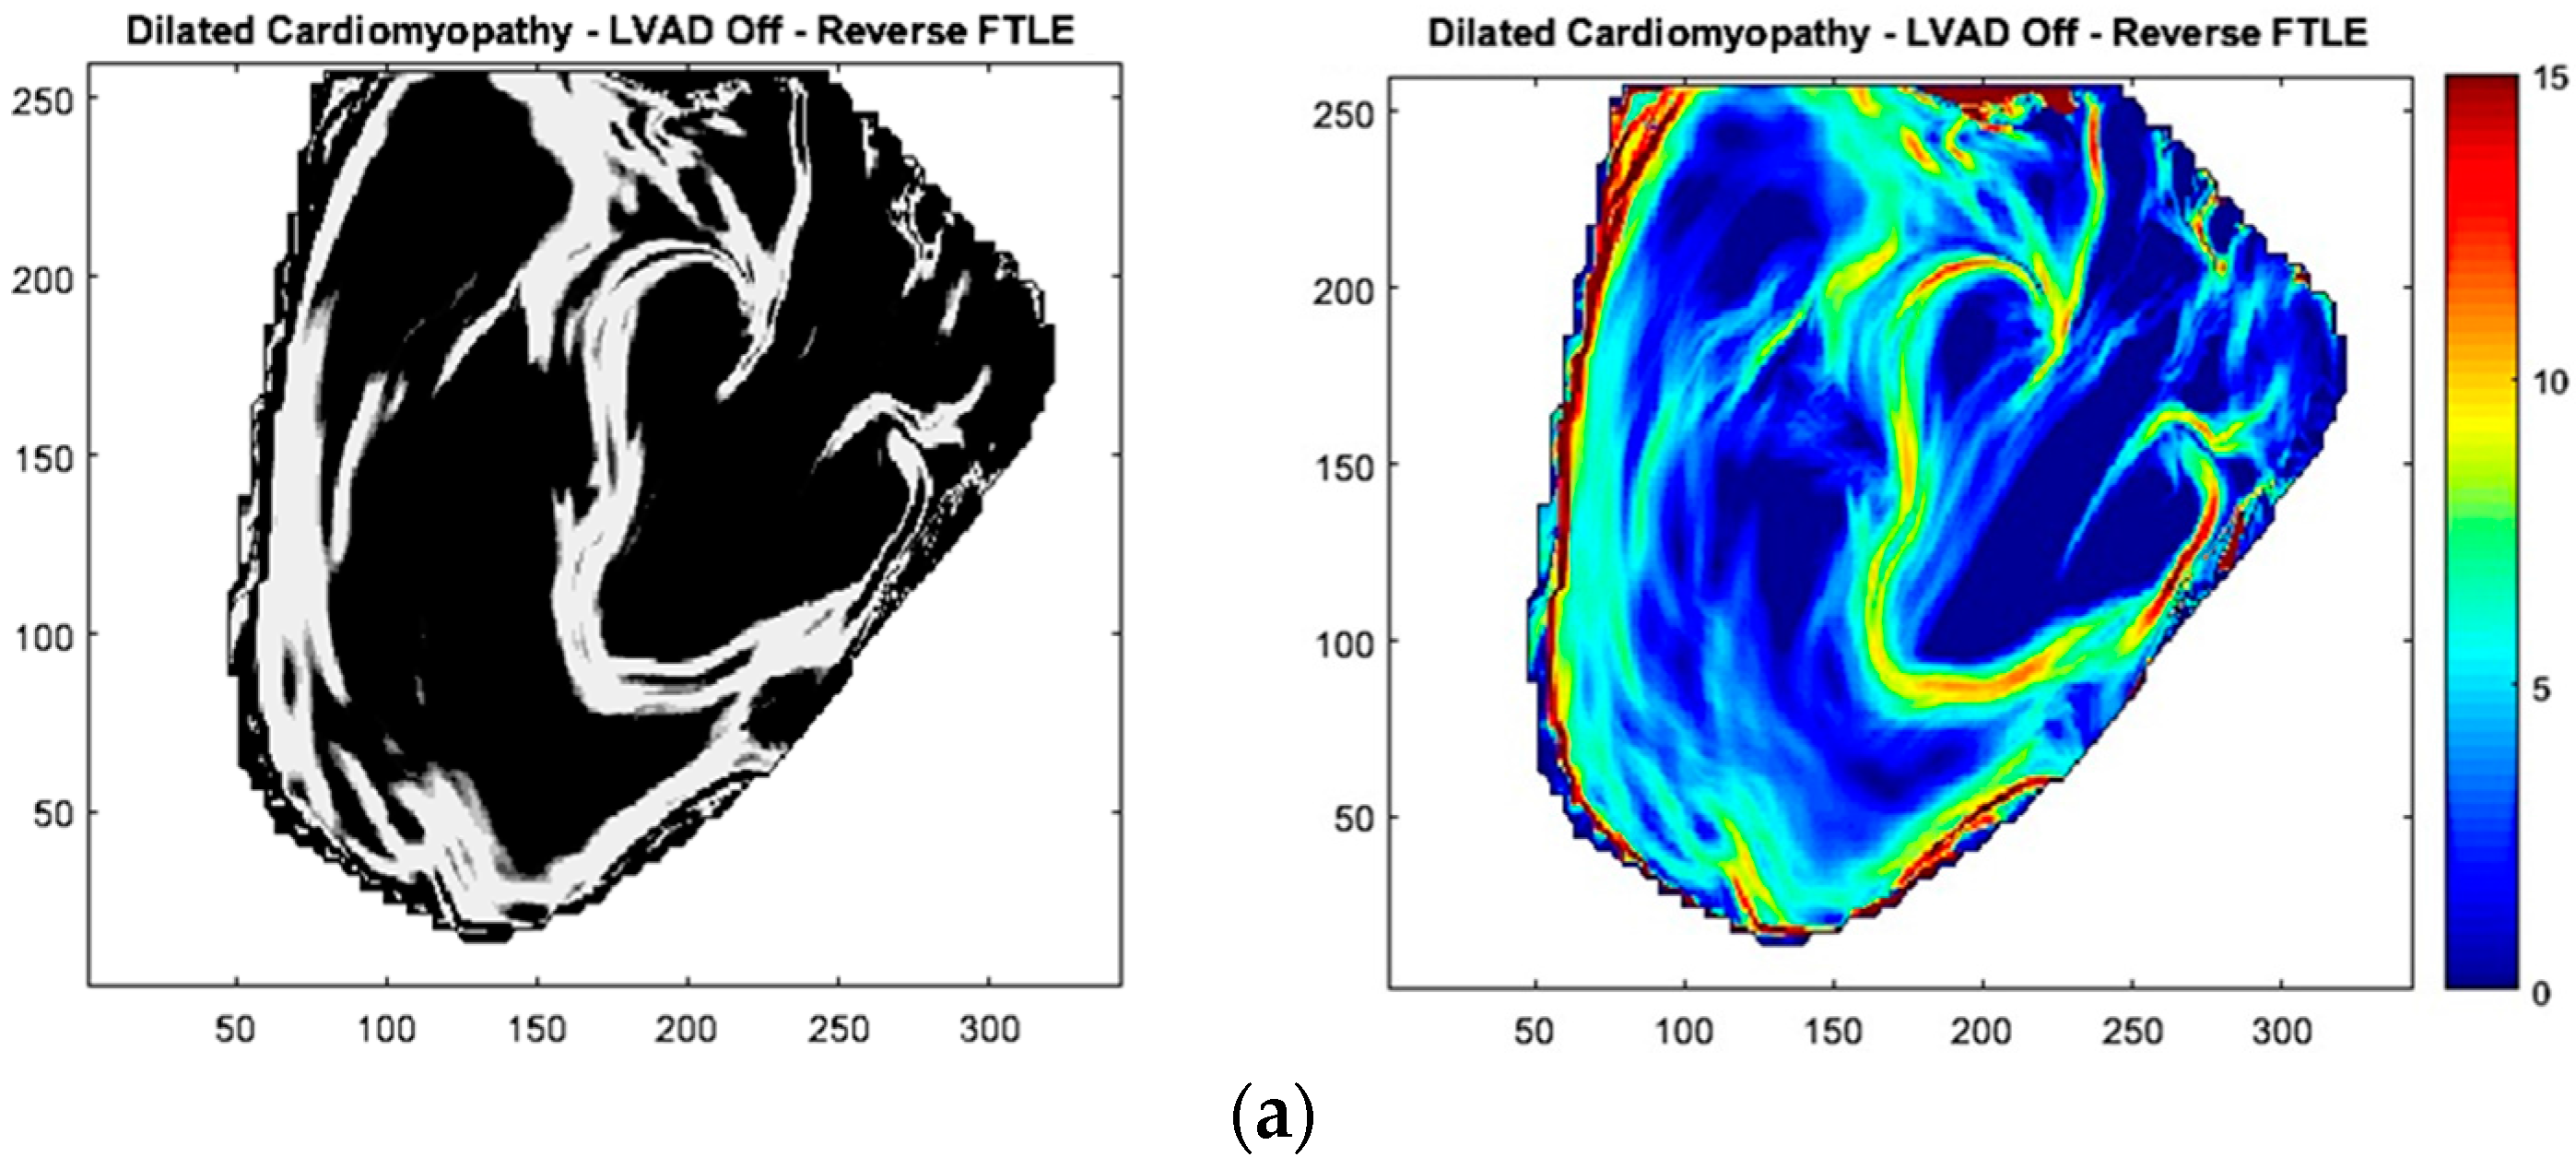
A range of integration times was studied for the baseline DCM LV model, as shown in 
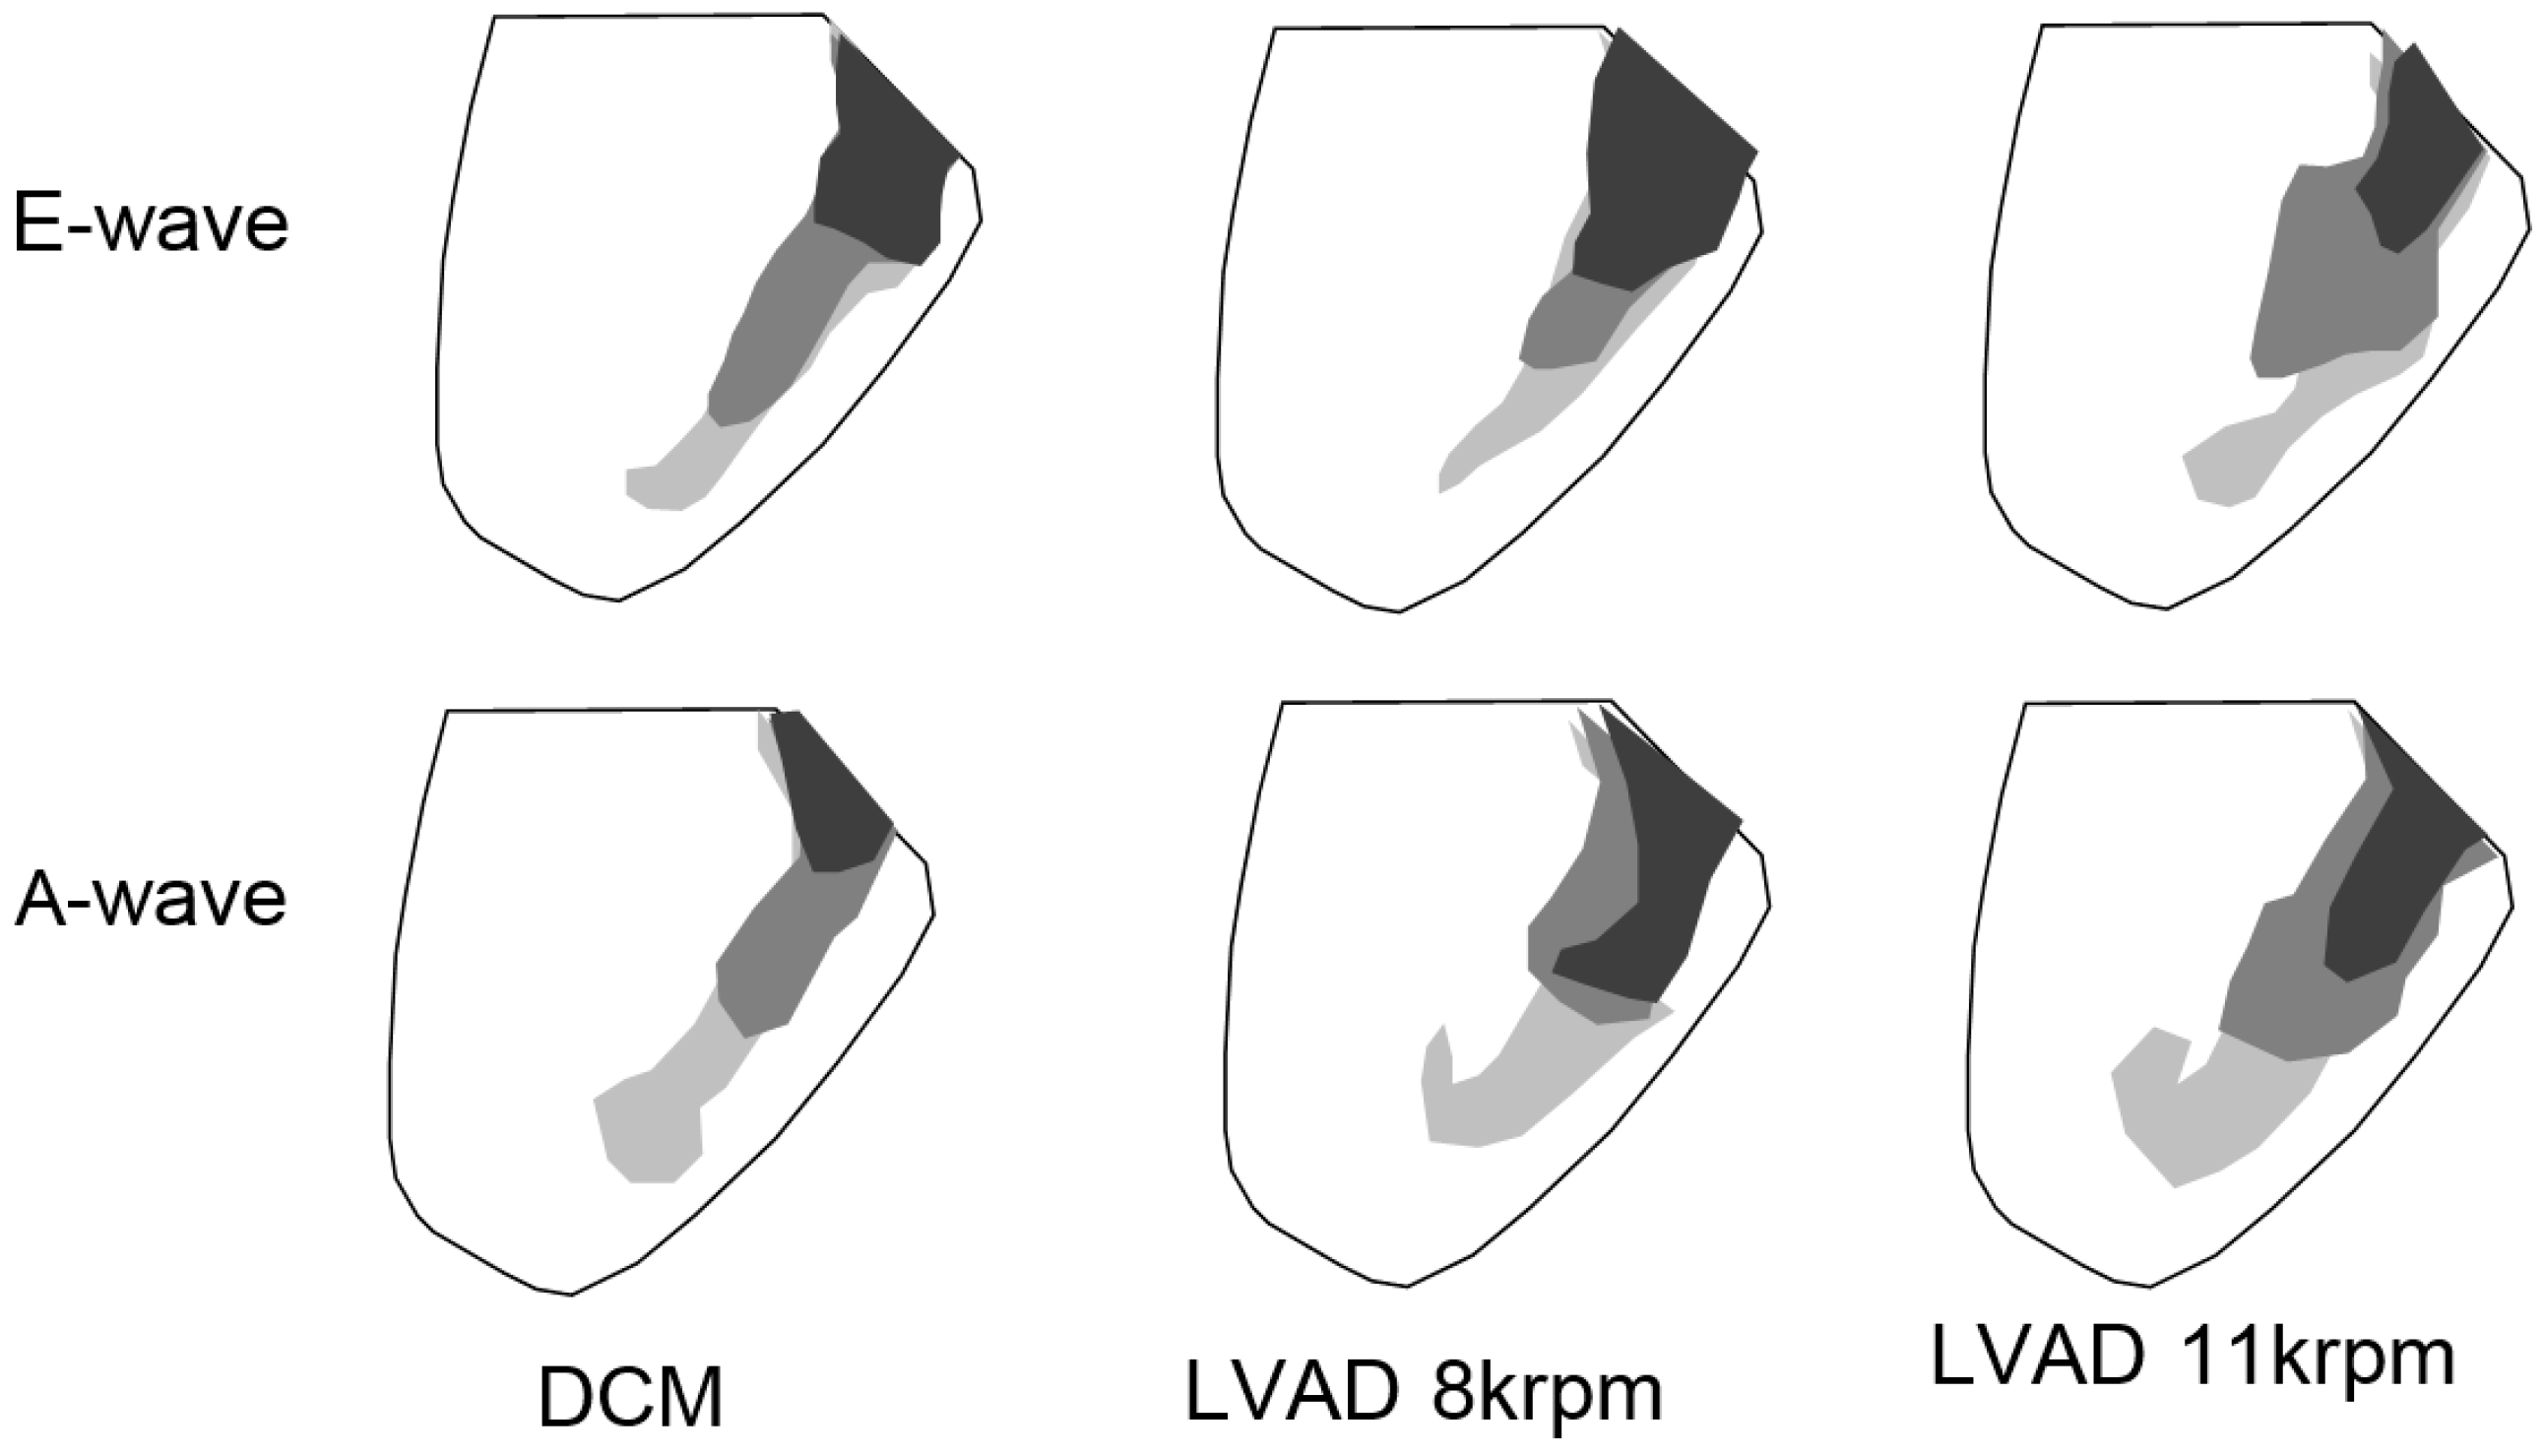
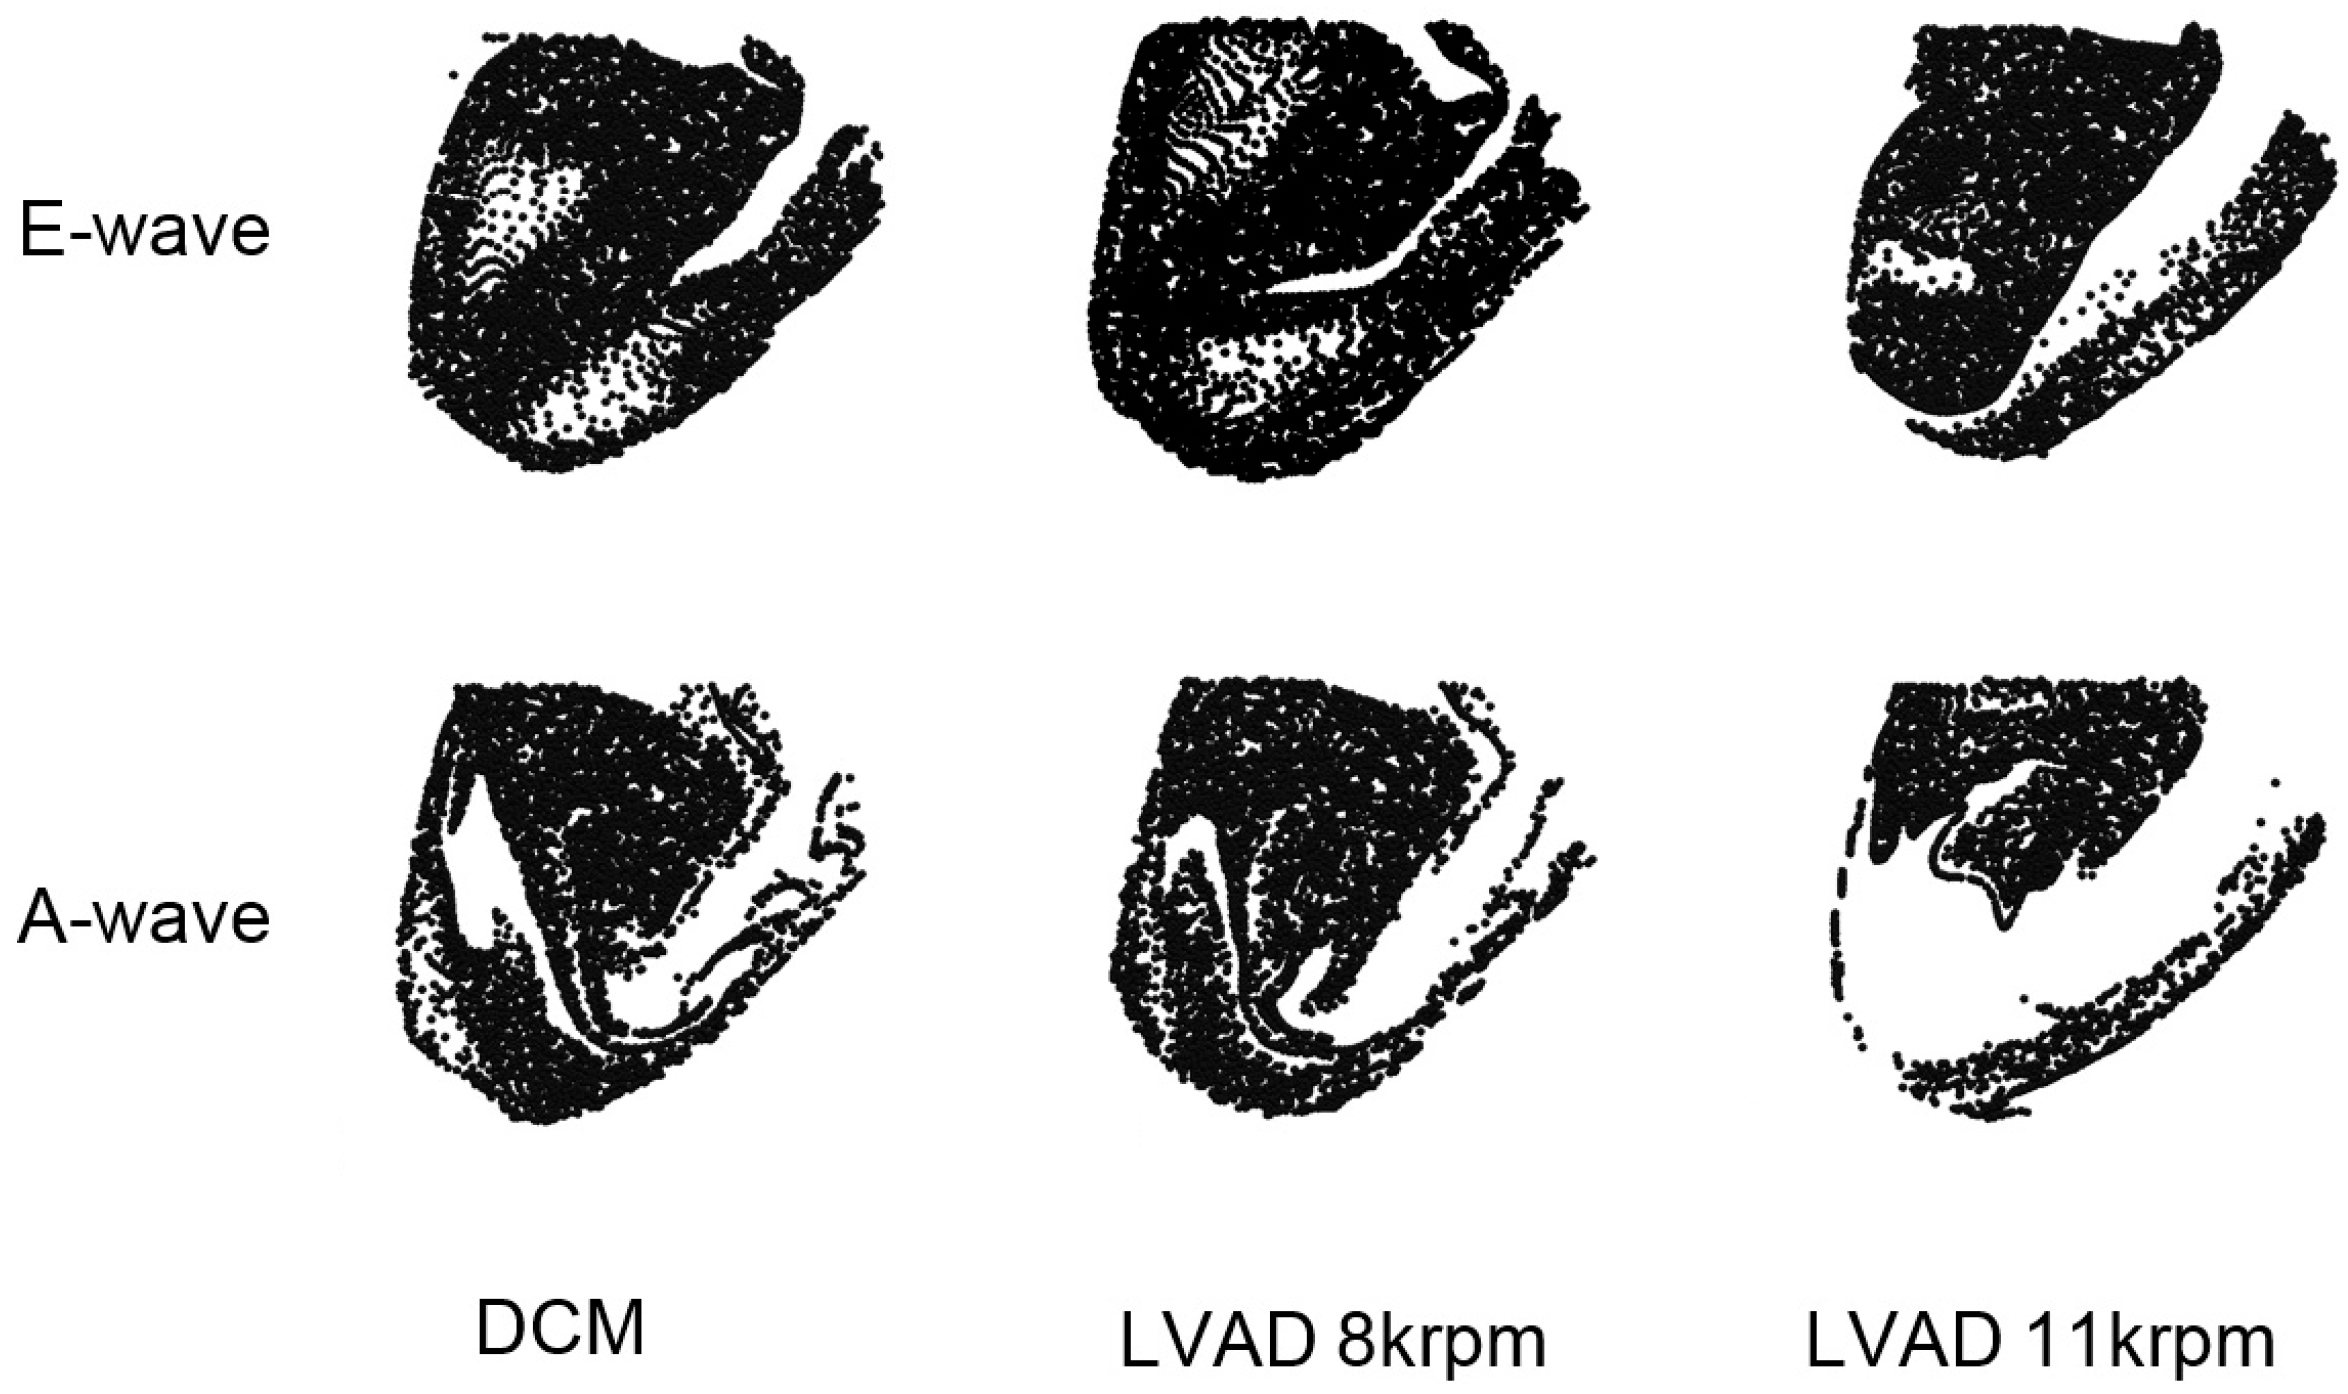
Figure 2 for the reverse FTLE integration. The heart rate is 70 bpm, thus the integration times span 25%–140% of the cardiac cycle. The dominant flow structure observed is the diastolic E wave, which is most easily identified in the middle of the range, at an integration time of 0.7 s. This integration time was selected for further analysis including extraction of the LCS ridges, which is illustrated in Figure 3. The ridges were identified for the E and A waves, to investigate diastolic filling and how the material surfaces for transport are affected by LVAD support.
A regional analysis of forward FTLE compared values for regions of interest (ROI) located distal and proximal to the LV model thrombus (see Figure 1, D and P). Forward FTLE was averaged for each ROI over the cardiac cycle.

2.5. Lagrangian Particle Analysis

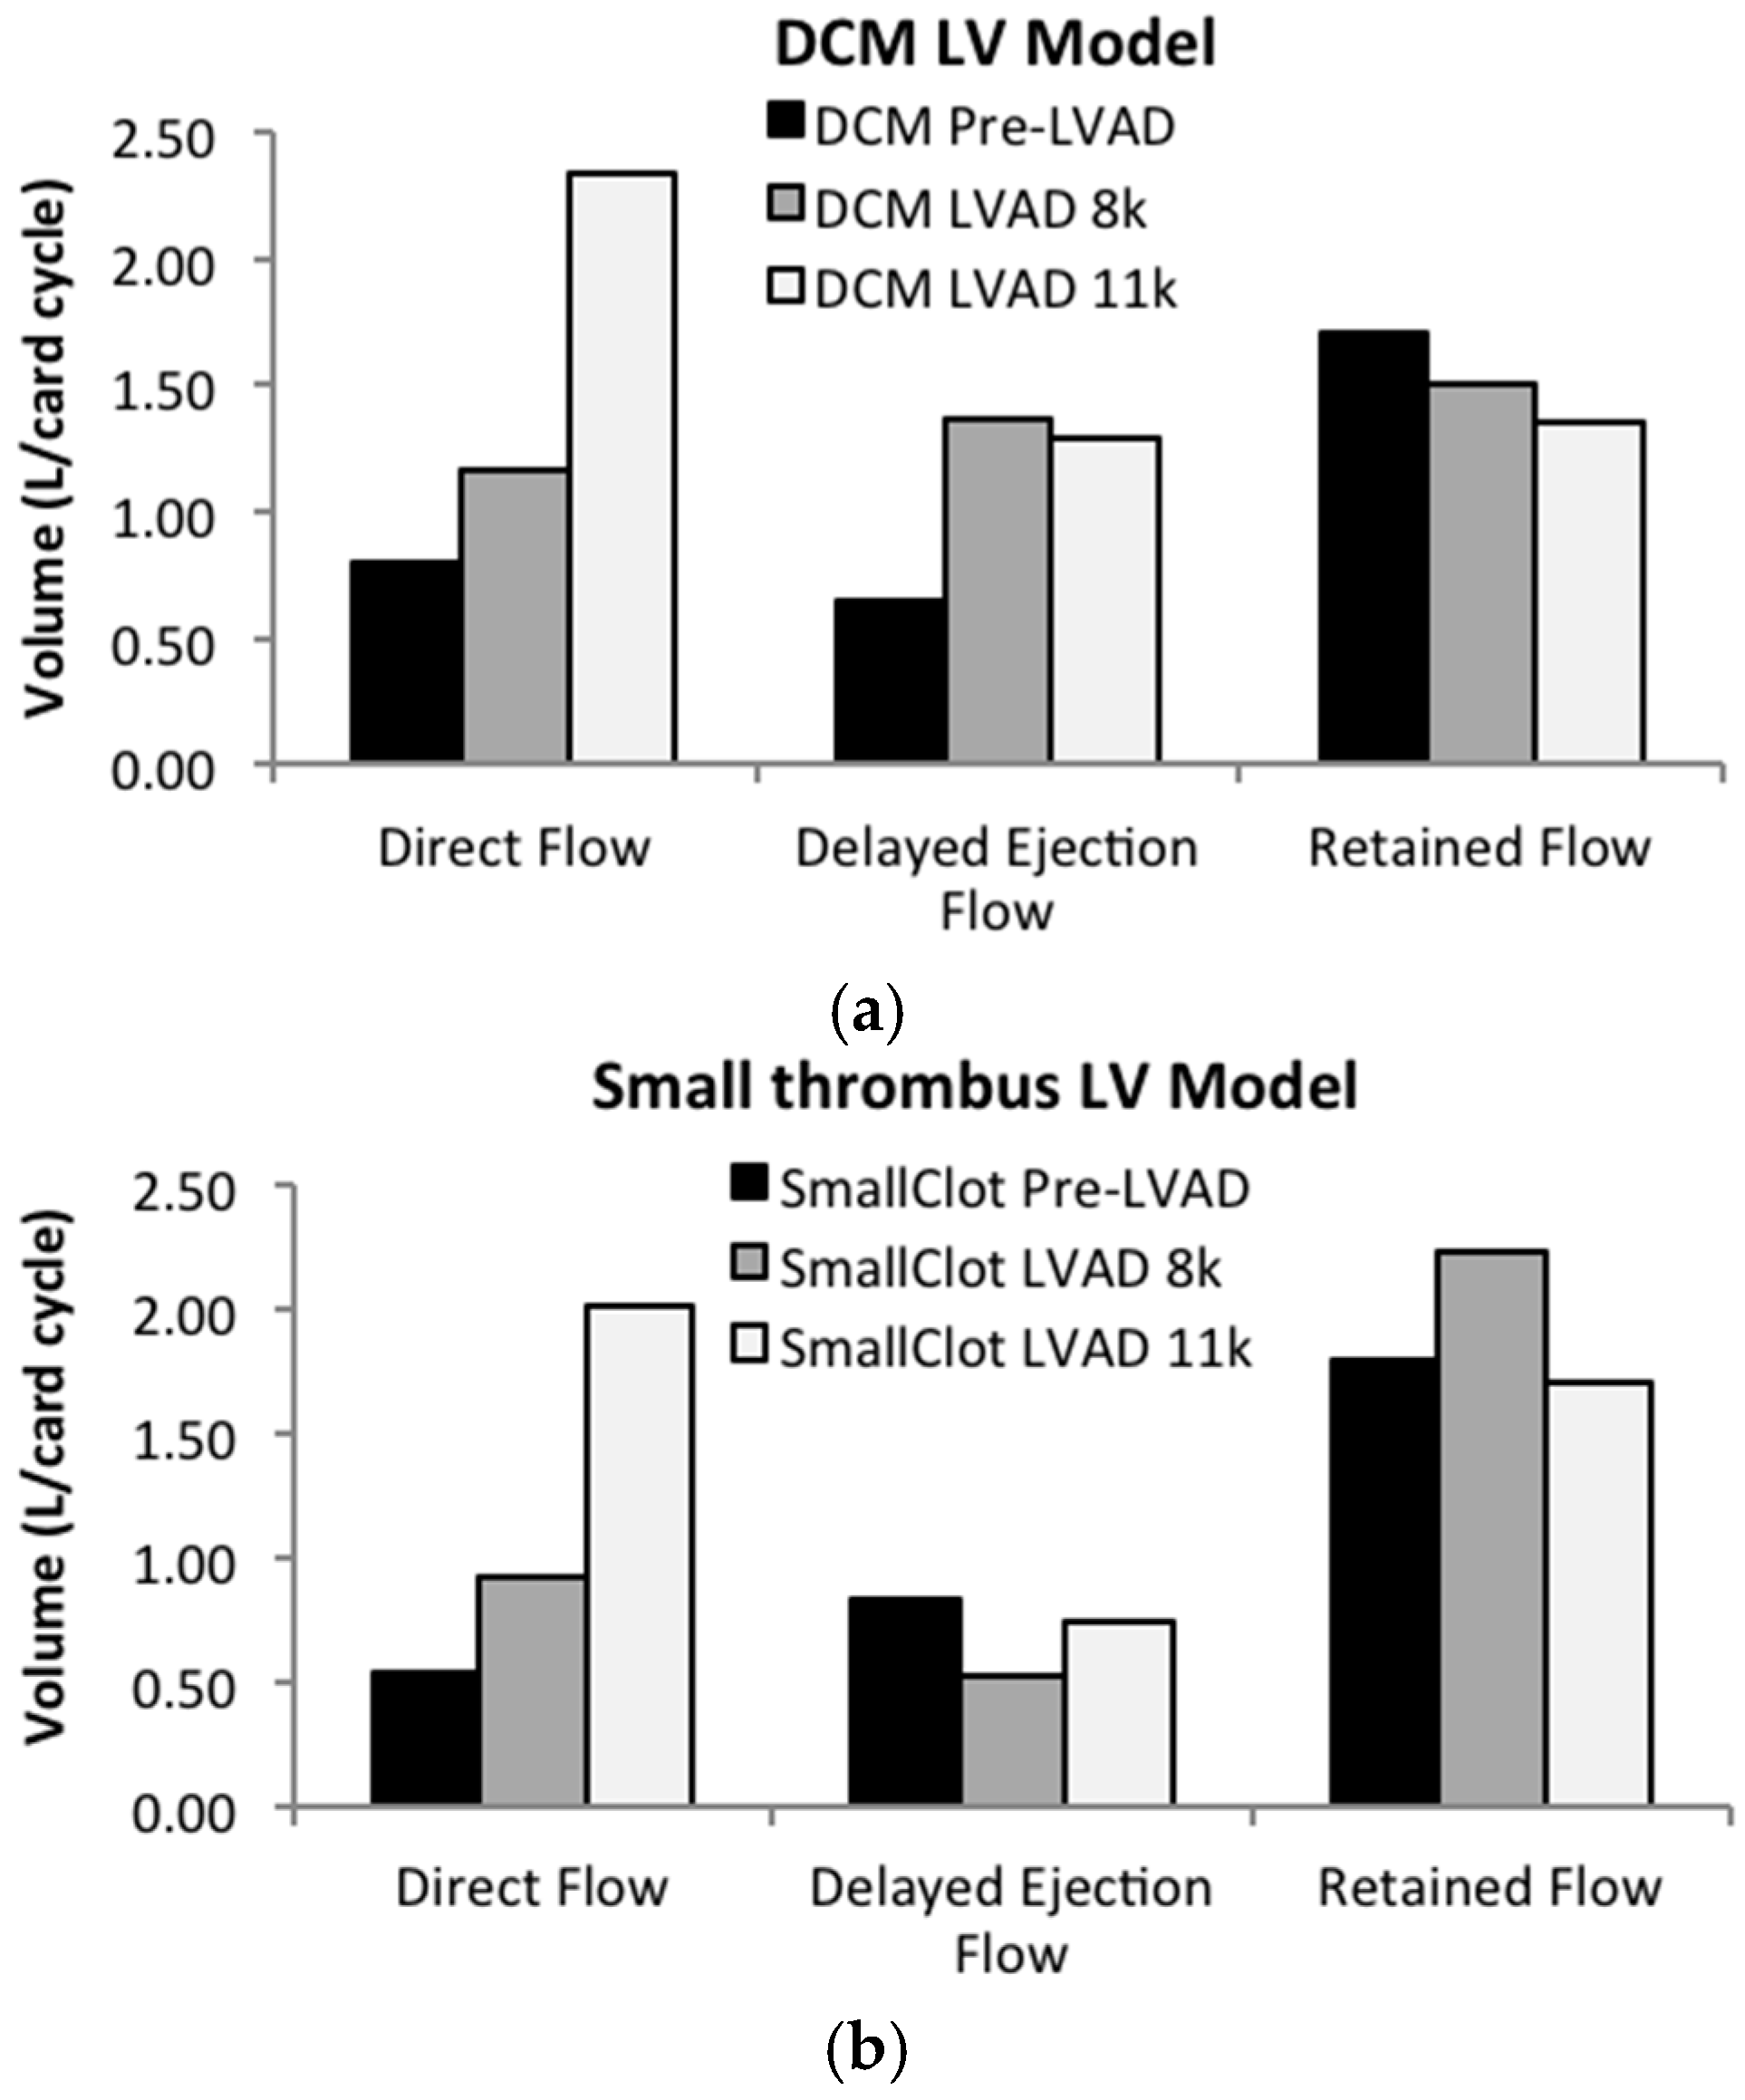
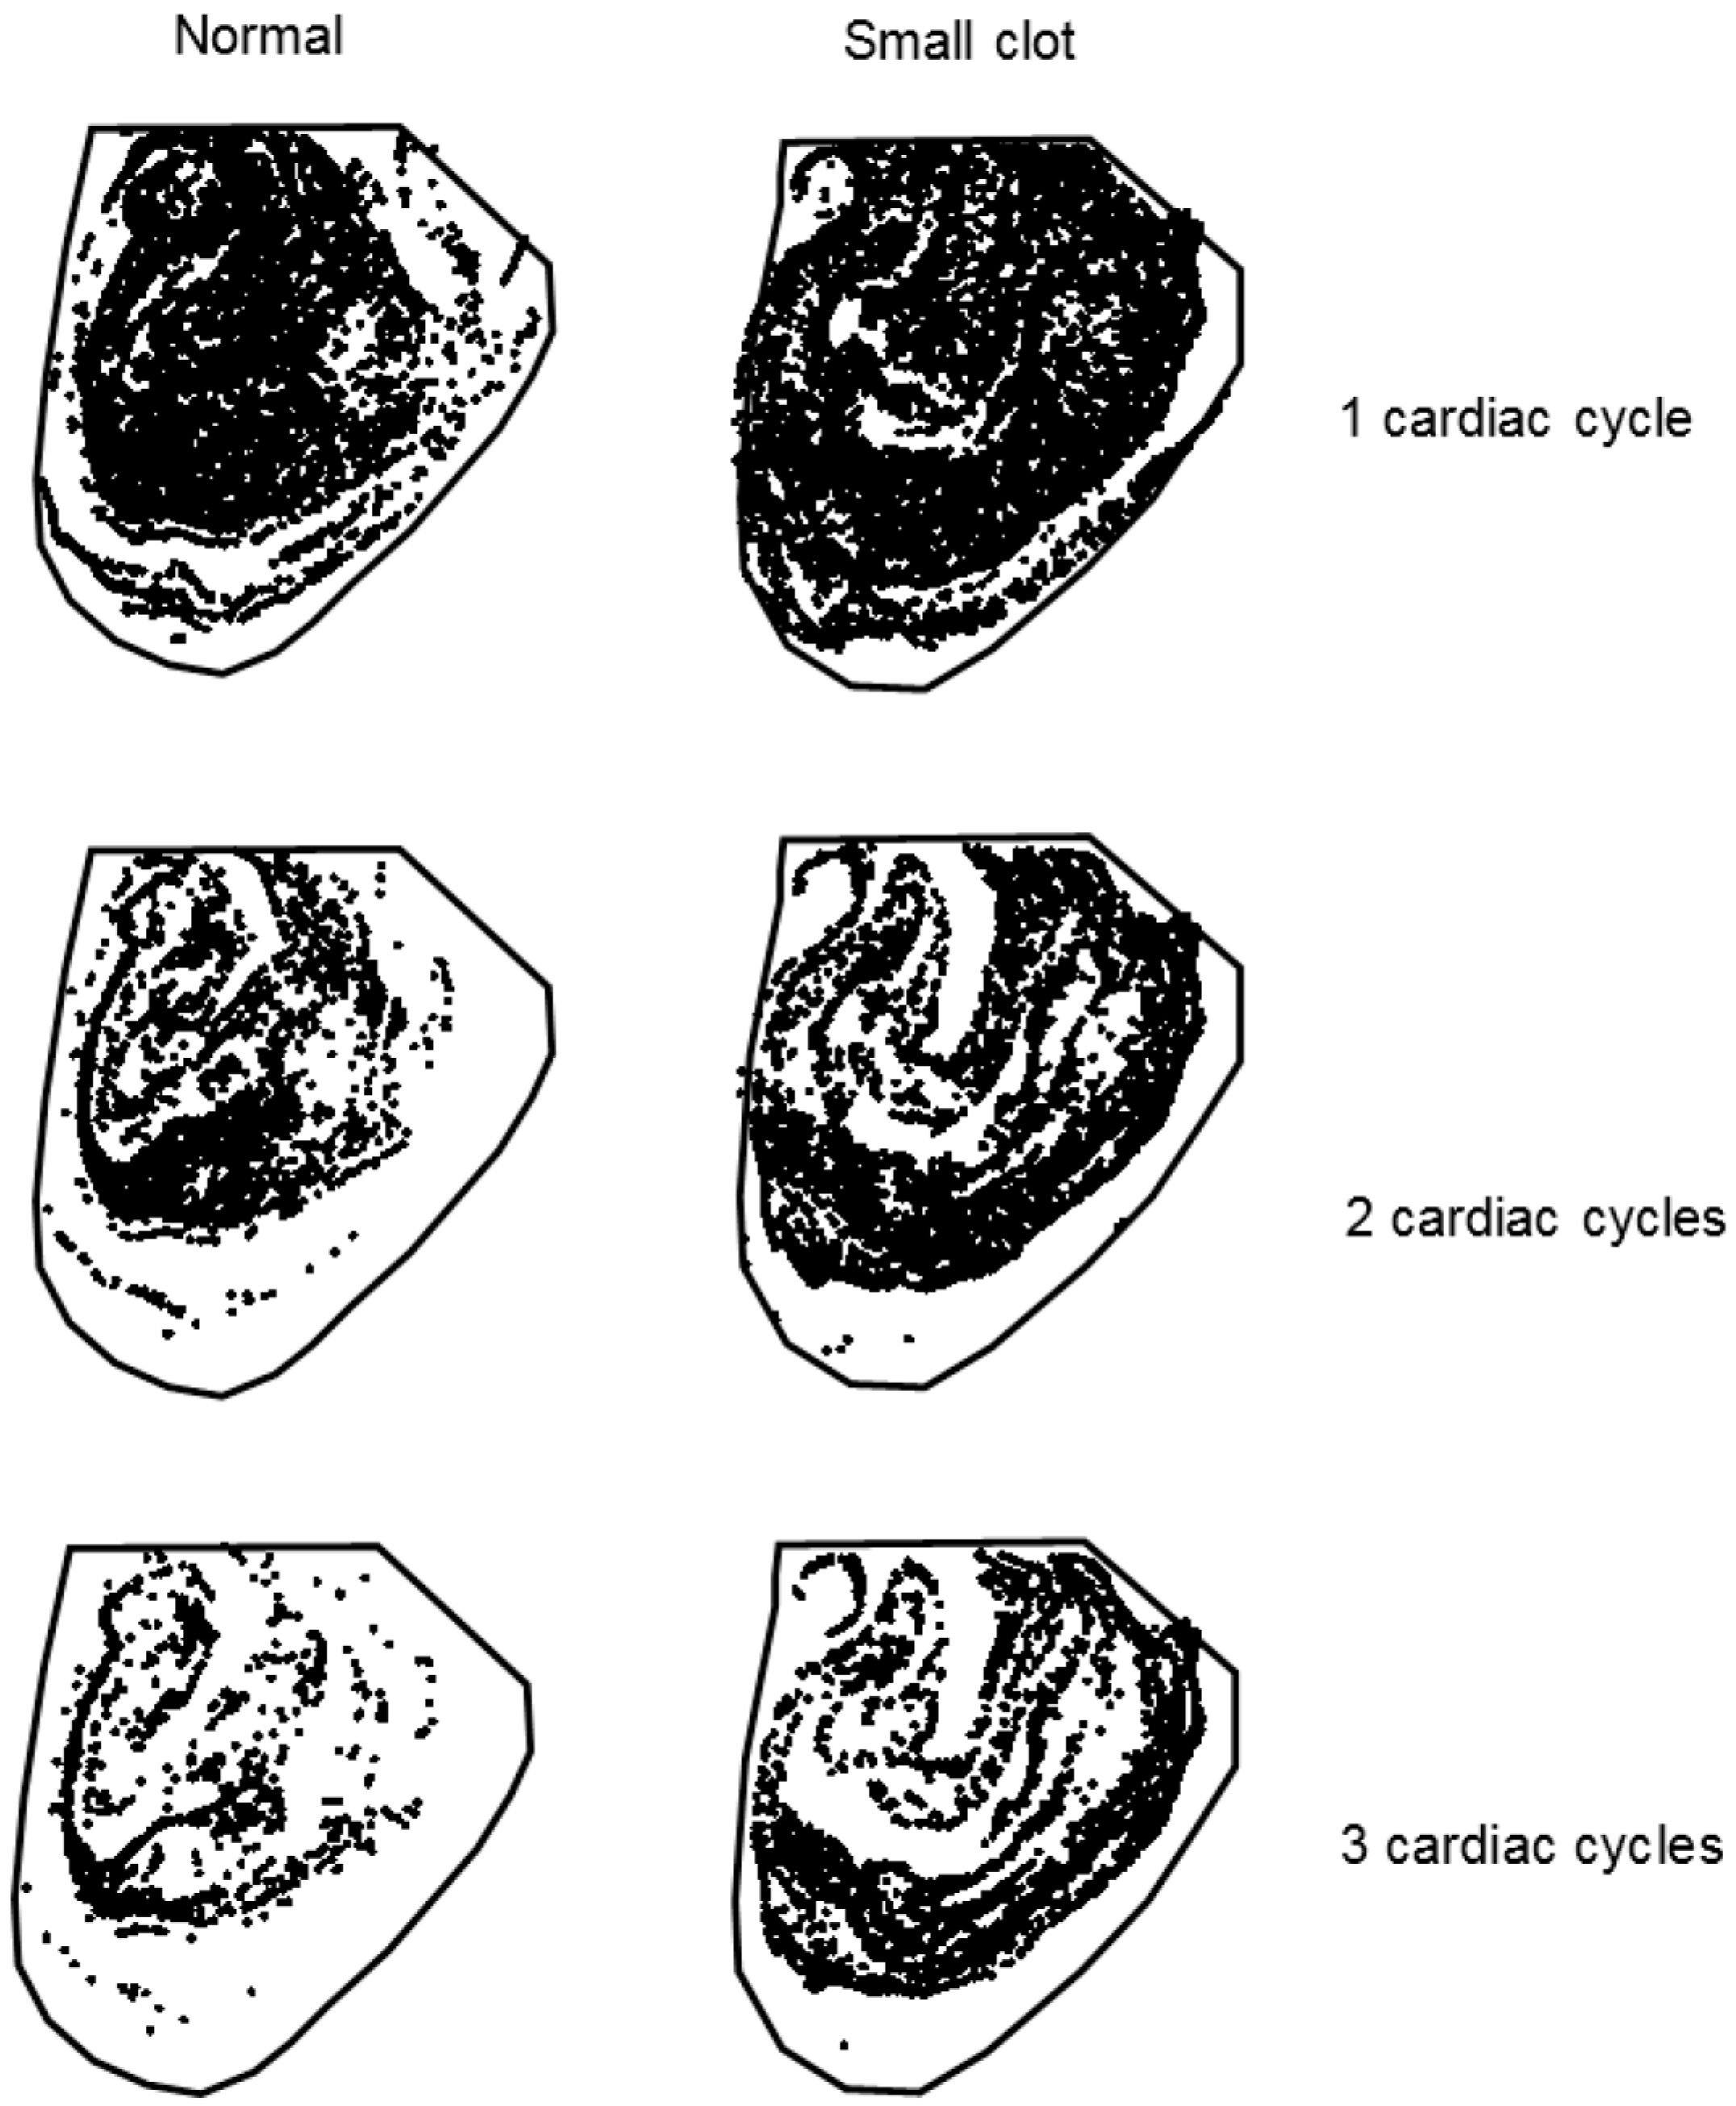
The algorithm for particle advection can also be used to trace the positions of particles as they move with the velocity field, enabling a Lagrangian analysis of blood transport and LV washout. 10,000 particles were uniformly distributed over the unstructured mesh at t = 0, which was set to correspond to the opening of the mitral valve at the onset of the diastole. Particle positions through several cardiac cycles were calculated, and the number of particles remaining at the end of the first, second and third cardiac cycle tabulated and normalized by the initial particle number to obtain the flow fraction. The reduction of flow fraction at the end of the first cardiac cycle constitutes the direct flow (DF), subsequent reduction during the second cardiac cycle is the delayed ejection fraction (DEF), and the remainder is the Retained Flow (RF). These fractions are then scaled by the total aortic flow in order to compare absolute flow volumes.

3. Results

The flow field data for the six different conditions described previously were used to compute the Forward and Reverse FTLE fields for an integration time of 0.7 s, as well as the Lagrangian virtual particle positions for three cardiac cycles. The attracting LCS structures were extracted from the Reverse FTLE fields for the E and A waves of diastole, and are compared to snapshots of particle positions that reflect the influence of these material surfaces. The particle positions over several heartbeats are used to determine the DF, DEF and RF for all flow conditions.

3.1. Dilated Cardiomyopathy (DCM) Model

Attracting LCS surfaces were identified for the first three frames (75 ms) of diastolic filling, corresponding to the E wave, and for six frames (150 ms) during the A wave, and are shown in Figure 4. The E wave starts when the mitral valve opens and a jet of blood enters the LV, which begins a sustained period of filling during which the LV volume increases progressively. This is followed by the A wave, associated with atrial contraction, and finally by isovolumic contraction and systolic ejection. The attracting LCS illustrated in Figure 4 shows the diastolic mitral jet, which flows along the anterior wall towards the apex during early diastole. The A wave LCS shown in the second row confirm the same path of flow entering the LV, traveling along the free wall towards the apex until the vortex pattern measured in our PIV studies is developed.

3.2. Effect of LVAD Support on LV Blood Transport

The attracting LCS in Figure 4 show that the main effect of LVAD support on diastolic flow structures is augmentation of the A wave. This observation is further supported by the data in Table 1, which show a 33% increase in peak A FTLE as LVAD support is increased to 11 krpm. This results in a reduced E/A ratio for diastolic filling, from the range of restrictive filling towards normal. Particle analysis images (Figure 5) show minimal effect of the LVAD at a speed of 8 krpm on the E wave but a noticeably larger boundary for the A wave, and an appreciable increase in both at a speed of 11 krpm.

3.3. Thrombus Development in the LVOT

For the condition simulating the presence of a small (7 mm) thrombus in the LVOT, the LCS in diastole are similar to the DCM condition, however the dynamics of transport are dramatically affected during systole as illustrated in Figure 6. The images of virtual particle transport over three cardiac cycles show the recurrence of a recirculating flow distal to the thrombus. This pattern reduces emptying of the LV during systole, which increases the residence time of particles globally as well as locally in the LVOT. The presence of the thrombus produce little alteration in the diastolic flow pattern, however, during systole, the LVOT flow path is partially obstructed by the thrombus, which narrows the flow path immediately adjacent to the thrombus. This accelerated flow then opens into a small expansion distal to the thrombus and proximal to the aortic valve, where the flow recirculates at the end of systole. The recirculation pattern is visible for the Pre-LVAD condition, shown in Figure 6. When LVAD support is introduced, recirculation is reduced but present at a speed of 8 krpm. However, at the higher LVAD speed, the lack of flow through the aortic valve results in a pocket of stagnant flow distal to the thrombus.
The blood retained in the LV as a function of completed cardiac cycles is compared for all six flow conditions in Figure 7. An increase in DF indicates better washout and decreased blood residence time. DF of the DCM LV is 25%, reflecting the ejection fraction of this model, which is increased with LVAD support. While the lower level of support, LVAD 8 k, shows minimal changes from the DCM baseline after the first cardiac cycle, this condition substantially improves LV flow by the second and third cycles. The higher LVAD speed, 11 krpm, shows a substantial increase in DF, an improvement in DEF and slight reduction in RF. The LVOT thrombus cases demonstrated a slow but steady effect of the thrombus on transport through the LV, reducing DEF and increasing RF with LVAD support.

3.4. Regional Analysis of FTLE in the LVOT

The regional analysis of Forward FTLE in the LVOT (Table 1) shows that FTLE doubled with the presence of the thrombus for the DCM case, reflecting the recirculation in the distal LVOT. The addition of LVAD support at 8krpm doubled LVOT FTLE for the DCM LV model, and increased slightly further with LVAD support at 11krpm. These changes decreased the distal/proximal ratio of Forward FTLE. The addition of LVAD support to the thrombus LV model did not alter the regional FTLE, which corresponds to a region of stasis in the distal LVOT that is exacerbated by a lack of aortic valve opening.

4. Discussion

The results of this computational analysis extend our previous experimental findings on TE in the LVAD-supported heart, which addressed a clinical case study on a patient with a recurring LVOT thrombus. The application of FTLE analysis to the velocity field data enables the extraction of attracting LCS and the regional comparison of repelling LCS, which can be used to estimate the amount of platelet activation, as the lines of maximal platelet activation correspond to stretching that occurs along LCS maxima [7]. Reverse FTLE used to identify attracting LCS have been applied to characterizing flow structures in the left ventricle to assess blood mixing, stasis and residence time. The FTLE integration time selected by previous investigators of LV flow ranges from 0.2 to 2.0 cardiac cycles, a range which brackets the value of 0.8 used in our study [17,18,19].
The evolution of the major LCS during diastolic filling provides insight into the flow dynamics of the DCM heart, and the improvement in cardiac output with LVAD support. When the mitral valve opens at the onset of diastole, a central jet carries flow into the LV. As the heart relaxes, LV volume is increased gradually until the A wave, which produces a smaller, slower jet that carries the last of the inflow during that cardiac cycle, and is followed by ejection. The DCM LV E and A wave LCS are quite similar to a previous clinical study, and illustrate the impact of LVAD support on A wave energy. This finding was also noted in the prior PIV study, in which the vortex analysis revealed augmentation of CW vortex A wave circulation and KE with LVAD support [9]. The E/A wave ratio for the DCM model corresponds to restrictive filling, and is reduced with LVAD support towards a normal E/A ratio, a result that has been observed in clinical studies [20,21]. The impact of the LVOT thrombus on the diastolic flow field was minimal, and did not result in significantly different findings from the DCM model.
A recent study used 2-D LV echocardiography measurements to estimate residence time and stasis in several patients with dilated cardiomyopathy, a healthy control, and a DCM patient before and after implantation with an LVAD [22]. The results identified a large diastolic vortex in the dilated DCM LV, but calculated high KE and low stasis for the vortex region, which reduces the risk of TE. The LVAD has a positive impact on the residence time, reducing the volume fraction of blood with residence time greater than 2s (VR) from 49% to 17%. The stasis index was decreased by 50% with the addition of the LVAD, and KE reduced by 85% overall. However, as noted in the previous study, increased residence time was observed in the LVOT due to the change in flow pattern. Our PIV studies compare favorably, finding that the VR decreases from 54% to 27% with LVAD support as the overall cardiac output is increased by 58%. The improvement in circulation overall is complicated by the reduction of aortic valve opening which leads to increased stasis and recirculation in the LVOT during LVAD support.
The clinical study of DCM patients described previously also calculated blood particle residence time, and grouped into direct flow, delayed ejection fraction and retained flow using the attracting LCS boundaries [18]. Healthy patients (n = 6) exhibited a direct flow of 43% ± 11% while DCM patients reached only 27% ± 13%. The DCM LV model showed a comparable level of direct flow (25%), which was increased to healthy levels (54%) with the introduction of the LVAD. In addition to showing an improvement in the relative flow volume distributed over the first (DF), second (DEF), and longer time periods (RF), our results are scaled to reflect the change in absolute flow volume, which includes the increase in blood flow produced by the LVAD. This finding provides clear insight into the LV flow pattern alterations accompanying LVAD support, how diastolic filling is enhanced, and systolic function improved. The Forward FTLE and particle analysis can be further evaluated for regional changes introduced by the LVOT thrombus, which does not affect the major diastolic or vortical flow structures, but rather inhibits ejection through the aortic valve and increases distal LVOT stasis. The 78% decrease in flow velocity distal to the model thrombus [9] is accompanied by a large localized increase in Forward FTLE (225%), which decreases with LVAD support. In the absence of the model thrombus, the flow pattern produced during Series flow was associated with a 12% reduction in velocity and a 210% increase in distal ROI Forward FTLE from the DCM baseline. The overall change in distal ROI velocity for the small thrombus and LVAD 11 k was 78%, and forward FTLE was 230%, illustrating that the two effects are not independent. The increase in Forward FTLE is largely related to recirculation in the distal clot region, which is reduced with LVAD support primarily due to stasis introduced by a partial or complete reduction of aortic valve opening. The combination of decreased flow velocity and increased platelet activation adjacent to the LVOT thrombus provides an explanation for the recurring thrombus observed in the original case study, and exposes a vulnerability that could be related to pump thrombus, which has occurred with increasing frequency despite focused LVAD design efforts, and contributes to the high stroke risk that continues to limit the widespread use of LVADs for heart failure patients.

Limitations

The application of FTLE to evaluating the velocity data from our experimental studies does not provide detailed mechanistic insight into the coagulation cascade and biochemistry that undoubtedly contribute to TE in the heart, especially in the presence of medical devices and concomitant anticoagulant medication. The simulated flow patterns produced by the SDSU cardiac simulator have been validated by comparison to flow data from patients, but is performed in an idealized geometry and controlled conditions, including a constant volume LV which does not reflect reverse remodeling. In addition, the study focuses on 2-D data in the LV midplane, which may not adequately describe the alterations in transport enhanced by the LVAD or affected by the LVOT thrombus.

5. Conclusions

This study reports an analysis of flow and transport in an experimental model of the failing heart used to evaluate the effect of LVAD support and the influence of a small thrombus in the LVOT, motivated by a patient case study. The results show that LVAD support augments diastolic filling primarily during the A wave, and increases blood transport. Direct flow tripled and delayed ejection flow doubled with the addition of Series LVAD support. The small LVOT thrombus did not have a major impact on diastolic filling, but created recirculation immediately distal to the model thrombus that was accompanied by high forward FTLE, an indicator for platelet activation [7]. This pattern of high platelet activation and increased flow stasis in the LVOT is predicted to increase the risk of thrombus formation and is further exacerbated by the presence of an LVAD.

Acknowledgments

This work was supported in part by a grant from the American Heart Association 14GRNT20530004 (PI: Karen May-Newman).

Author Contributions

Karen May-Newman designed and conducted the experimental PIV studies, Brian Herold adapted the published code for application to the experimental studies as part of his thesis work for a Masters of Science in Mechanical Engineering. Vi Vu helped to complete the matrix of simulations and additional analyses, and to write the manuscript. Karen May-Newman wrote the manuscript.

Conflicts of Interest

The authors declare no conflict of interest.

References

  1. Bluestein, D.; Chandran, K.B.; Manning, K.B.; Luestein, D.B.; Handran, K.B.C.; Anning, K.B.M. Towards non-thrombogenic performance of blood recirculating devices. Ann. Biomed. Eng. 2010, 38, 1236–1256. [Google Scholar] [CrossRef] [PubMed]
  2. Girdhar, G.; Xenos, M.; Alemu, Y.; Chiu, W.C.; Lynch, B.E.; Jesty, J.; Einav, S.; Slepian, M.J.; Bluestein, D. Device thrombogenicity emulation: A novel method for optimizing mechanical circulatory support device thromboresistance. PLoS ONE 2012, 7, e32463. [Google Scholar] [CrossRef] [PubMed]
  3. Yin, W.; Alemu, Y.; Affeld, K.; Jesty, J.; Bluestein, D. Flow-induced platelet activation in bileaflet and monoleaflet mechanical heart valves. Ann. Biomed. Eng. 2004, 32, 1058–1066. [Google Scholar] [CrossRef] [PubMed]
  4. Bluestein, D. Research approaches for studying flow-induced thromboembolic complications in blood recirculating devices. Expert Rev. Med. Devices 2004, 1, 65–80. [Google Scholar] [CrossRef] [PubMed]
  5. Haller, G.; Yuan, G. Lagrangian coherent structures and mixing in two-dimensional turbulence. Phys. D-Nonlinear Phenom. 2000, 147, 352–370. [Google Scholar] [CrossRef]
  6. Shadden, S.C. Lagrangian Coherent Structures. In Transport and Mixing in Laminar Flows: From Microfluidics to Oceanic Currents; Grigoriev, R., Ed.; Vol Wiley-VCH: Hoboken, NJ, USA, 2011. [Google Scholar]
  7. Shadden, S.C.; Hendabadi, S. Potential fluid mechanic pathways of platelet activation. Biomech. Model. Mech. 2013, 12, 467–474. [Google Scholar] [CrossRef] [PubMed]
  8. Xu, Z.; Chen, N.; Shadden, S.C.; Marsden, J.E.; Kamocka, M.M.; Rosend, E.D.; Alber, M. Study of blood flow impact on growth of thrombi using a multiscale model. Soft Matter 2009, 769–779. [Google Scholar] [CrossRef]
  9. Reider, C.; Moon, J.; Ramesh, V.; Montes, R.; Campos, J.; Herold, B.; Martinez-Legazpi, P.; Rossini, L.; del Alamo, J.C.; Dembitsky, W.; et al. Intraventricular thrombus formation in the LVAD-assisted heart studied in a mock circulatory loop. Meccanica 2016. [Google Scholar] [CrossRef]
  10. Willert, C.E.; Gharib, M. Digital particle image velocimetry. Exp. Fluids 1991, 193, 181–193. [Google Scholar] [CrossRef]
  11. Maurer, M.M.; Burkhoff, D.; Maybaum, S.; Franco, V.; Vittorio, T.J.; Williams, P.; White, L.; Kamalakkannan, G.; Myers, J.; Mancini, D.M. A Multicenter Study of Noninvasive Cardiac Output by Bioreactance During Symptom-limited Exercise. J. Card. Fail. 2009, 15, 689–699. [Google Scholar] [CrossRef] [PubMed]
  12. Travis, A.R.; Giridharan, G.A.; Pantalos, G.M.; Dowling, R.D.; Prabhu, S.D.; Slaughter, M.S.; Sobieski, M.; Undar, A.; Farrar, D.J.; Koenig, S.C. Vascular pulsatility in patients with a pulsatile- or continuous-flow ventricular assist device. J. Thorac. Cardiovasc. Surg. 2007, 133, 517–524. [Google Scholar] [CrossRef] [PubMed]
  13. Wong, K.; Samaroo, G.; Ling, I.; Dembitsky, W.; Adamson, R.; del Álamo, J.C.; May-Newman, K. Intraventricular flow patterns and stasis in the LVAD-assisted heart. J. Biomech. 2014, 47, 1485–1494. [Google Scholar] [CrossRef] [PubMed]
  14. May-Newman, K.; Wong, Y.K.; Adamson, R.; Hoagland, P.; Vu, V.; Dembitsky, W. Thromboembolism is linked to intraventricular flow stasis in a patient supported with a left ventricle assist device. ASAIO J. 2013, 59, 452–455. [Google Scholar] [CrossRef] [PubMed]
  15. Shadden Lab. FlowVC (Version 1) (Computer software). Available online: http://shaddenlab.berkeley.edu/software.html (accessed on 21 November 2016).
  16. Shadden, S.C.; Astorino, M.; Gerbeau, J.; Shadden, S.C.; Astorino, M.; Gerbeau, J. Computational analysis of an aortic valve jet with Lagrangian coherent structures Computational analysis of an aortic valve jet with Lagrangian coherent. Chaos 2010, 20, 7512. [Google Scholar] [CrossRef] [PubMed]
  17. Badas, M.G.; Espa, S.; Fortini, S.; Querzoli, G. On the use of FTLE to deduce 3D coherent structures in the left ventricular flow. In Proceedings of the 10th International Symposium on Particle Image Velocimetry, Delft, The Netherlands, 1–3 July 2013.
  18. Hendabadi, S.; Bermejo, J.; Benito, Y.; Yotti, R.; Fernández-Avilés, F.; del Álamo, J.C.; Shadden, S.C. Topology of blood transport in the human left ventricle by novel processing of Doppler echocardiography. Ann. Biomed. Eng. 2013, 41, 2603–2616. [Google Scholar] [CrossRef] [PubMed]
  19. Badas, M.G.; Domenichini, F.; Querzoli, G. Quantification of the blood mixing in the left ventricle using Finite Time Lyapunov Exponents. Meccanica 2016. [Google Scholar] [CrossRef]
  20. Chapman, C.B.; Allana, S.; Sweitzer, N.K.; Kohmoto, T.; Murray, M.; Murray, D.; Johnson, M.; Rahko, P.S. Effects of the HeartMate II left ventricular assist device as observed by serial echocardiography. Echocardiography 2013, 30, 513–520. [Google Scholar] [CrossRef] [PubMed]
  21. Tigen, K.; Karaahmet, T.; Tanalp, A.C.; Gurel, E.; Cevik, C.; Basaran, Y. Value of clinical, electrocardiographic, echocardiographic and neurohumoral parameters in non-ischaemic dilated cardiomyopathy. Acta Cardiol. 2008, 63, 207–212. [Google Scholar] [CrossRef] [PubMed]
  22. Rossini, L.; Martinez-Legazpi, P.; Vu, V.; Fernández-Friera, L.; Pérez Del Villar, C.; Rodríguez-López, S.; Benito, Y.; Borja, M.G.; Pastor-Escuredo, D.; Yotti, R.; et al. A Clinical Method for Mapping and Quantifying Blood Stasis in the Left Ventricle. J. Biomech. 2015, 49, 2152–2161. [Google Scholar] [CrossRef] [PubMed]
Figure 1. Experimental measurements of left ventricle (LV) flow for a model of dilated cardiomyopathy (DCM), a unique case of an LV with a thrombus in the left ventricular outflow tract (left ventricular outflow tract (LVOT) thrombus), and the addition of left ventricular assist device (LVAD) support were performed using a mock circulatory loop and particle image velocimetry. Regional analyses were calculated for two regions of interest (ROI) in the LVOT, identified as the distal (D) and proximal (P) ROI.
Fluids 01 00038 g001
Figure 2. Reverse time integration of finite time Lyapunov exponent (FTLE) is performed to identify Lagrangian Coherent Structure (LCS) ridges. (a) Integration time = 0.2 s; (b) Integration time = 0.5 s; (c) Integration time = 0.7 s; (d) Integration time = 0.9 s; (e) Integration time = 1.2 s.
Fluids 01 00038 g002aFluids 01 00038 g002b
Figure 3. Attracting LCS surfaces are extracted from the Reverse FTLE fields to illustrate the E and A waves through the mitral valve during diastolic filling. (a) E wave; (b) A wave.
Fluids 01 00038 g003
Figure 4. LCS ridges extracted from the reverse FTLE illustrate the effect of the LVAD on LV filling dynamics.
Fluids 01 00038 g004
Figure 5. Lagrangian particle analysis reflects the LCS structures identified from the FTLE analysis, illustrating how the altered filling dynamics affects transport through the LV.
Fluids 01 00038 g005
Figure 6. Particle transport for the DCM model (left) and the LVOT thrombus model (right) after 1, 2 and 3 cardiac cycles.
Fluids 01 00038 g006
Figure 7. Distribution of flow calculated for each condition. Direct flow is blood ejected during the first cardiac cycle, Delayed Ejection Flow is ejected during the second cycle, and the Retained Flow is blood with residence time longer than two cardiac cycles. The flow fractions are calculated from the particle analysis and scaled by the total aortic flow measured from the experimental studies. (a) DCM LV Model; (b) Small thrombus LV Model.
Fluids 01 00038 g007
Table 1. Characteristics of the forward FTLE analysis for the entire LV, as well as for the regional analysis of flow structures in the LVOT adjacent to the location of the model thrombus.
Flow ConditionFTLE for Entire LVRegional FTLE
AvePeak EPeak ADistal ROIProximal ROI
DCM
Pre-LVAD5.638.175.192.012.62
Parallel5.738.005.643.984.75
Series6.438.566.894.304.41
LVOT Thrombus
Pre-LVAD5.828.635.014.536.30
Parallel6.199.456.154.636.38
Series6.6510.106.644.636.57

