2.1. Optimization of Fermentation to Define the Gelation Baseline
A comparative study was conducted to evaluate the effects of fermentation conditions, namely time (t), temperature (T), and kefir grain concentration (g), on the physicochemical properties of kefir made from whole and skimmed milk. The two response variables were: pH and total acidity (expressed as lactic acid equivalents).
As anticipated, a decline in pH was evident in conjunction with escalating fermentation intensity, characterized by elevated grain percentages, augmented temperatures, and protracted fermentation durations (see
Table 1). The lowest pH values were found in experiment 8 (48 h, 26 °C, 10% (
w:
w)), indicating intense fermentation, while the highest pH values were observed in experiment 1 (12 h, 20 °C, 1% (
w:
w)), under milder fermentation conditions. The pH trajectories exhibited by both skimmed and whole milk kefir samples were comparable, indicating that the fat content does not exert a substantial influence on the acidification kinetics. It is noteworthy that kefir samples attained safe consumption pH values (≤4.5) within the initial 24 h under sufficiently intense fermentation conditions. It is evident from the data that there was a clear upward trend in total acidity, which was concomitant with an increase in fermentation intensity. Experiment 8 yielded the highest acidity values, while Experiment 1 yielded the lowest. Mid-range values were recorded in the two central-point replicates (experiments 9 and 10). A comparative analysis of the acidity profiles revealed that both milk types exhibited comparable outcomes, though a greater degree of variability was observed in whole milk. This variability may be attributed to the complex buffering and particulate nature of the medium. Notably, an inverse and non-linear relationship was observed between TA and pH, consistent with the logarithmic nature of pH but moderated by the buffering capacity of milk proteins and salts. This finding underscores the notion that acidity perception is more closely associated with total acid content than with pH alone. This finding serves to reinforce the feasibility of utilizing skimmed milk in the production of kefir, even in cases where grains have been originally adapted to whole milk. The fermentation kinetics are influenced by milk composition, where protein, fat, and carbohydrate fractions jointly contribute to the buffering environment and microbial activity.
A full factorial statistical analysis was conducted to quantitatively assess the influence of fermentation parameters on the physicochemical properties of kefir. The models were developed independently for kefir produced with skimmed and whole milk. For skimmed milk kefir, the regression equation for pH indicated that all three variables contributed to its reduction, with fermentation time being the most influential factor, as evidenced by its largest negative coefficient (−0.61). The model demonstrated a robust fit, with an R
2 value of 0.903 and an adjusted R
2 of 0.854, indicating that the variability in pH was effectively explained by the experimental factors. The response surface plots confirmed this trend: an increase in either fermentation time or temperature resulted in a progressive decrease in pH, reflecting the intensified acidification process. In a similar manner, an increase in kefir grain percentage contributed to further acidification, albeit to a lesser extent.
When evaluating whole milk kefir, a similar model was obtained, with fermentation time again emerging as the most significant variable (coefficient = −0.74). The statistical robustness of the model was confirmed by R
2 and adjusted R
2 values of 0.921 and 0.882, respectively. Response surface analyses revealed a consistent reduction in pH with increasing values of all three independent variables. These findings underscore the observation that, irrespective of the fat content of the milk, fermentation kinetics in terms of acidification exhibit analogous trends. The comparable behavior exhibited by both milk types indicates that milk fat does not significantly influence microbial acid production or metabolic activity during the fermentation process. This observation is consistent with previous reports that highlight the role of overall milk composition in modulating acidification rates during LAB fermentation.
With regard to total acidity (TA), the regression model for skimmed milk kefir demonstrated that all three variables (fermentation time, temperature, and grain percentage) exerted a positive effect on acidity, with fermentation time once again proving to be the most dominant. The model demonstrated an optimal fit (R
2 = 0.990; adjusted R
2 = 0.969), signifying elevated predictive reliability. The response surfaces demonstrated that an increase in fermentation time resulted in a significant rise in acid production, with temperature and grain concentration exerting secondary, but nevertheless notable, effects.
In the case of kefir produced using whole milk, the acidity model exhibited a comparable structure, with time demonstrating the most significant positive coefficient. In contrast to the findings of the pH models, interaction terms between variables were found to be statistically significant, suggesting a more complex interplay in the development of acidity. The model demonstrated robust performance, evidenced by R
2 = 0.992 and adjusted R
2 = 0.975. The response surfaces revealed that total acidity increased in proportion to the rise in fermentation time, temperature, and grain concentration. These patterns were consistent with the experimental data and mirrored those observed for skimmed milk kefir, thereby reinforcing the hypothesis that the milk’s fat content does not notably affect microbial acidification dynamics.
This trend further confirms the non-linear inverse dependence of pH on lactic acid equivalents, reflecting the buffering effects of the milk matrix. While pH is indicative of the concentration of free protons in the medium, total acidity quantifies both free and bound protons from organic acids. In this context, an observation was made of a gradual decline in pH, attributable to the buffering capacity of milk, which is primarily ascribed to proteins and mineral salts. These substances neutralize a proportion of the acid load in the initial phase. Conversely, total acidity exhibited a more marked and linear increase over time, providing a more sensitive indicator of microbial metabolic activity.
The statistical analysis confirmed that fermentation time is the most critical factor influencing both pH and total acidity of kefir, followed by temperature and kefir grain concentration. Such behavior reinforces that milk constituents (including fat) affect fermentation indirectly by altering the physicochemical environment, rather than fat acting as a direct substrate. This finding supports the use of skimmed milk in experimental designs targeting low-fat kefir formulations.
The fermentation condition that was optimized in this study (5.5% kefir grains, 26 °C, 24 h) consistently yielded a final pH of approximately 4.08 and a total acidity of about 10 g L−1 lactic acid equivalents. The selection of this standardized endpoint was driven by the necessity to ensure reproducibility and to establish a consistent physicochemical baseline for all subsequent gelation experiments. The effect of psyllium and CaCl2 on the gel structure was assessed in the absence of interference from uncontrolled acidification by controlling the fermentation state. Variations in casein charge, calcium activity and serum composition were also controlled.
2.2. Gel Formation and Rheological Characterization
All gelation assays were performed using kefir produced under the optimized fermentation conditions described in
Section 2.1, ensuring identical initial pH, total acidity, and microstructural state across samples. Standardizing these parameters has been shown to control key variables such as casein micelle charge, ionic strength, and calcium partitioning. These, in turn, have been demonstrated to directly influence the interactions between psyllium, calcium ions, and the protein–fat matrix.
The second experimental design sought to evaluate the impact of psyllium and calcium chloride (CaCl2) concentrations on the physicochemical characteristics of skimmed milk kefir. The experimental phase was developed using the fermentation conditions that had been optimized in the preliminary design, which were as follows: 5.5% kefir grains, 26 °C, and 24 h of fermentation. The selection of these conditions was driven by the objective of achieving a balance between sufficient microbial activity and sensory acceptability, thereby avoiding the elevated acidity levels that have been previously associated with extended fermentation times. In order to establish a baseline, the “blank sample” (kefir produced under the aforementioned conditions but without the addition of psyllium or calcium) was evaluated. The blank sample exhibited a pH of 4.08 ± 0.02 and a total acidity of 9.99 ± 0.09 g lactic acid·L−1, which is in accordance with the expected values for well-fermented kefir. This finding serves to confirm the suitability and reproducibility of the chosen fermentation conditions. Subsequently, the effect of psyllium and CaCl2 incorporation on the pH of kefir was investigated. pH measurements were conducted both immediately after the addition of the additives (t = 0) and after a two-hour hydration period. Across the three samples analyzed, only minor variations were observed. In two cases, a slight increase in pH was detected (e.g., from 4.10 to 4.20 and from 4.11 to 4.23), whereas the third sample remained essentially stable. The findings indicate that neither psyllium nor CaCl2 caused a substantial acidification or neutralization of the matrix within the two-hour period. This stability is of technological interest, as it implies that the incorporation of these additives does not adversely alter the acidity profile of the final product, thereby maintaining its characteristic sensory attributes.
The rheology of skimmed-milk kefir systems formulated with psyllium and calcium chloride (CaCl
2) was investigated to quantify the modulation of small-amplitude structure and flow behavior by these factors. Prior to the comparison of formulations within the experimental design, a robust hydration protocol for psyllium was established, given that its water uptake kinetics strongly influence the reproducibility of viscoelastic measurements. Mechanical spectra, defined as frequency sweeps at constant stress, are shown in
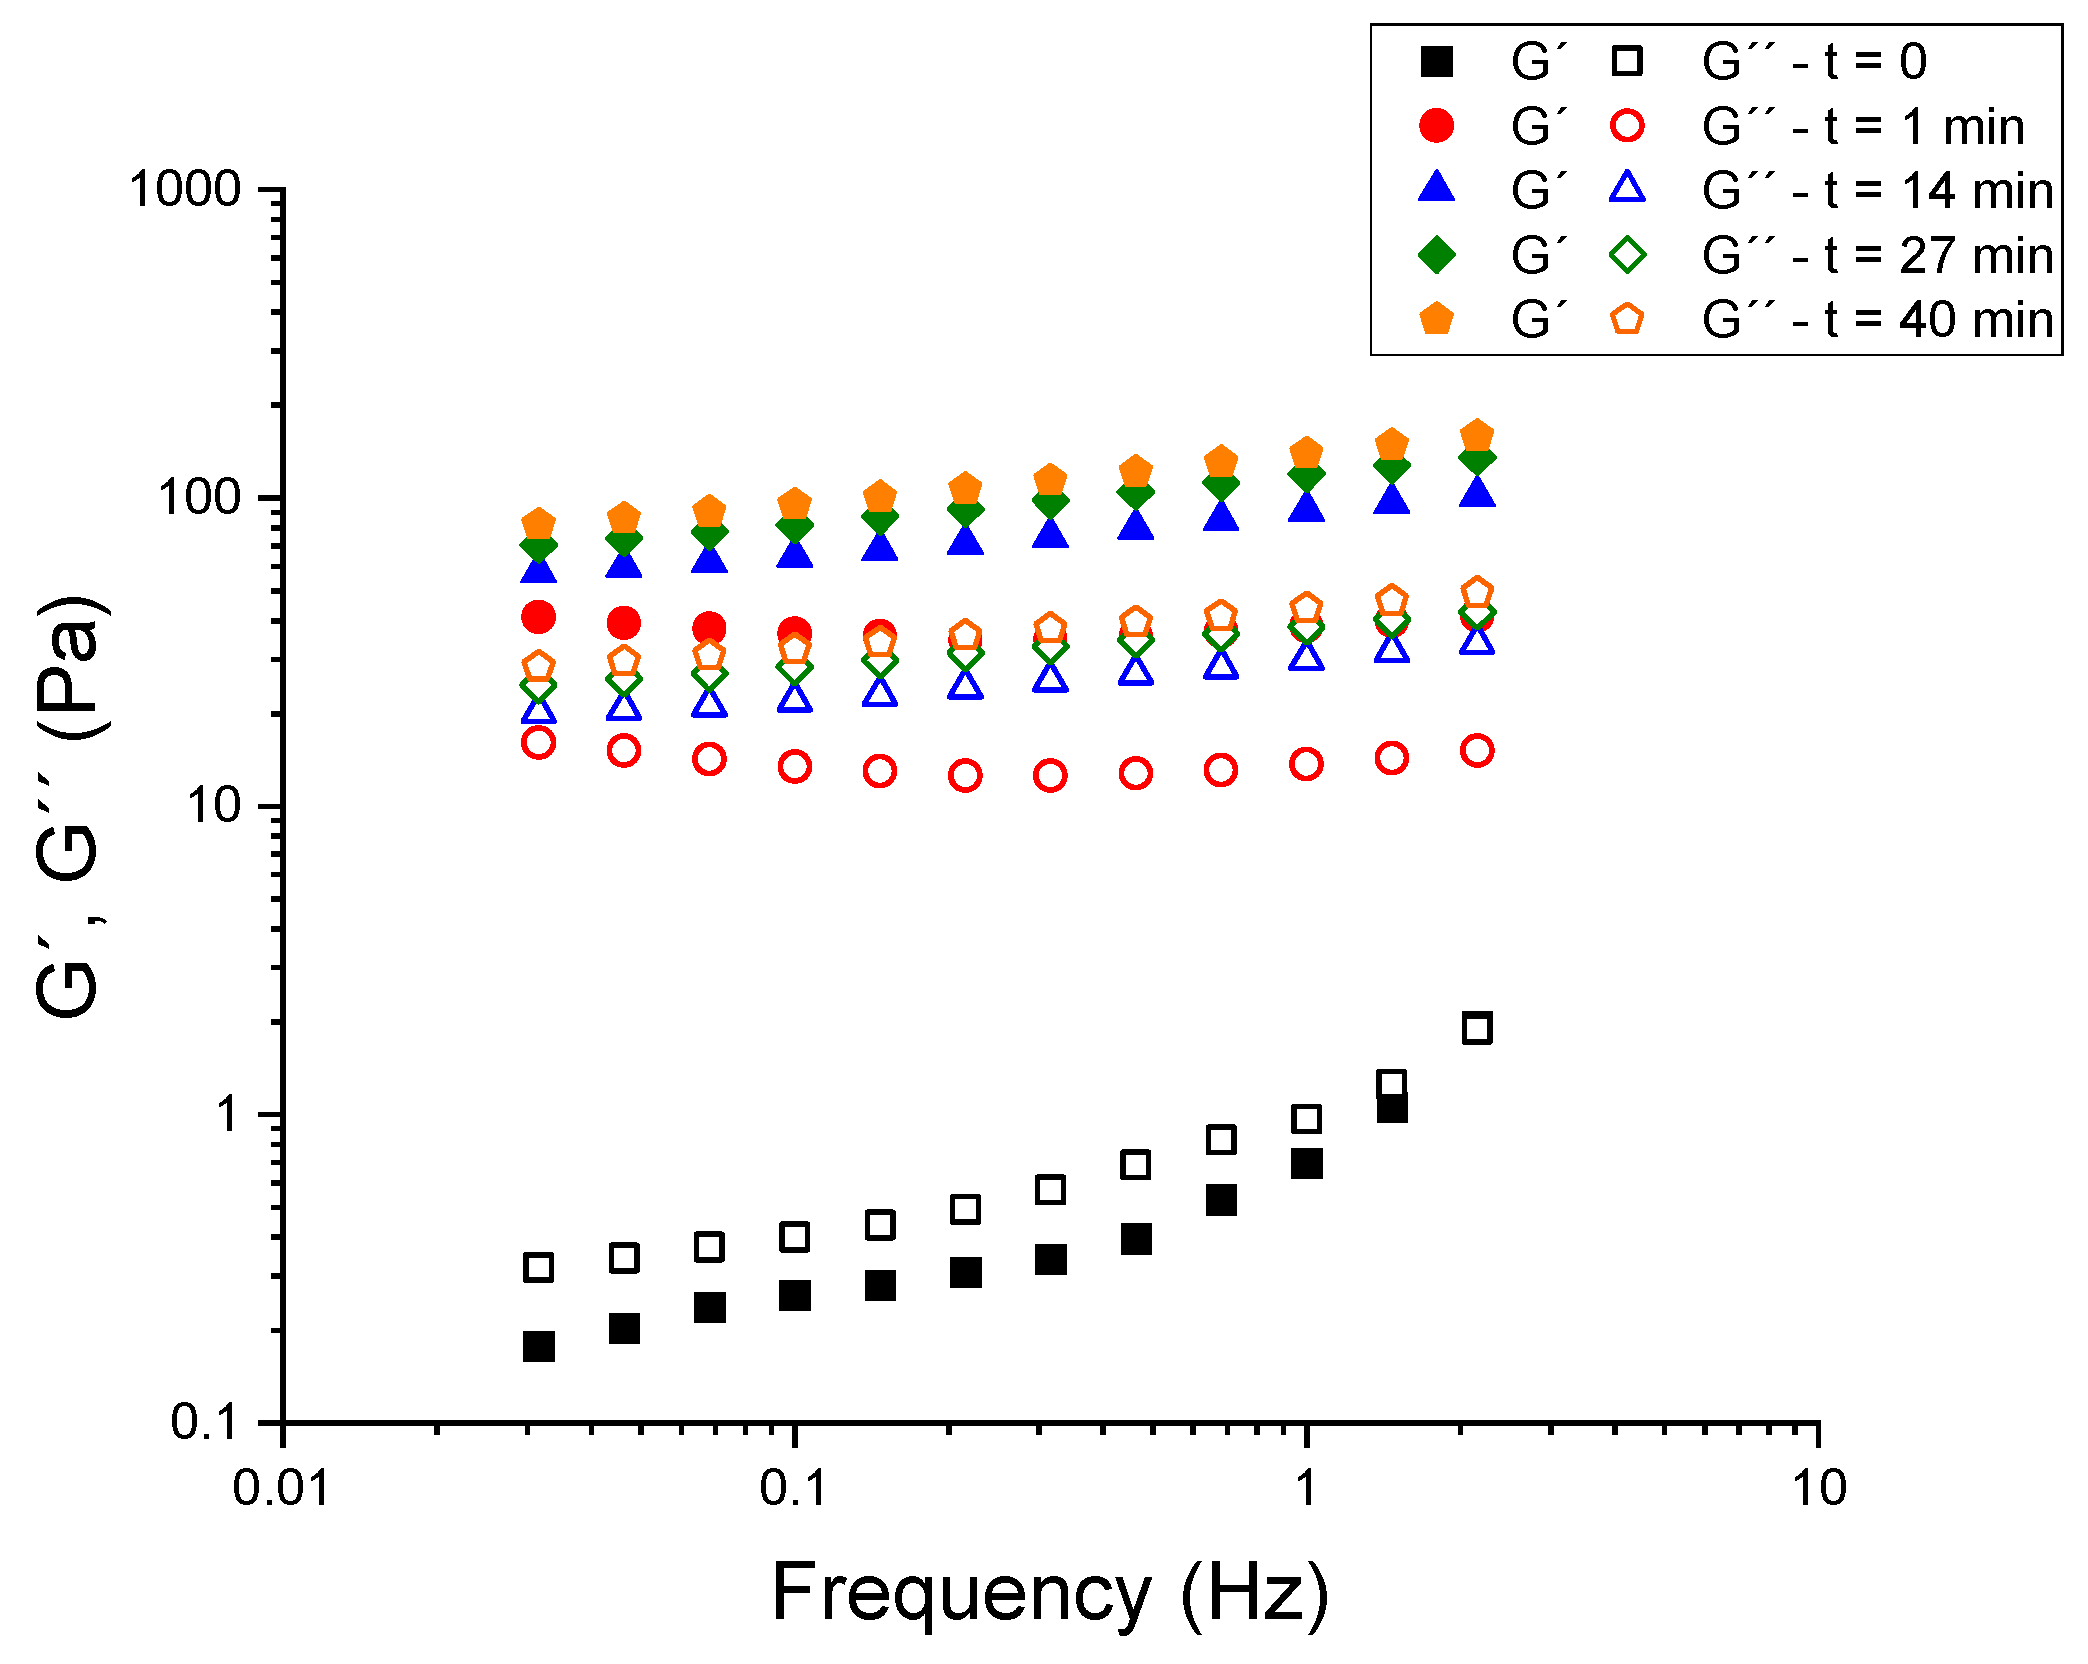
Figure 1 for a kefir blank sample (26 °C, 24 h, 5.5% grains) containing 0.0375% (
w:
w) CaCl
2 and 2% (
w:
w) psyllium. The experiment was conducted in two phases: initially, the kefir base was subjected to stress without the addition of psyllium (t = 0); subsequently, the kefir base was subjected to stress after the addition of 2% (
w:
w) psyllium. Tests were conducted at a constant shear stress of 0.2 Pa to ensure operation within the linear viscoelastic region (LVR). In the absence of psyllium, the kefir exhibited liquid-like behavior (G″ > G′ across most of the spectrum). It is noteworthy that, in a striking demonstration of rapidity, the ordering underwent an inversion a mere minute following the addition of psyllium (G′ > G″ at all frequencies that were examined), accompanied by a surge in both moduli that exceeded an order of magnitude. The progressive growth of G′ and G″ continued for several tens of minutes; beyond approximately 40 min, the spectra no longer evolved beyond the experimental error. Consequently, a 45-min rest period was implemented for all subsequent measurements to ensure complete and reproducible hydration of psyllium prior to rheological testing.
Subsequently, stress sweep tests were performed at 1 Hz to identify the LVR and determine the critical stress (τ
c) at which the microstructure begins to break down.
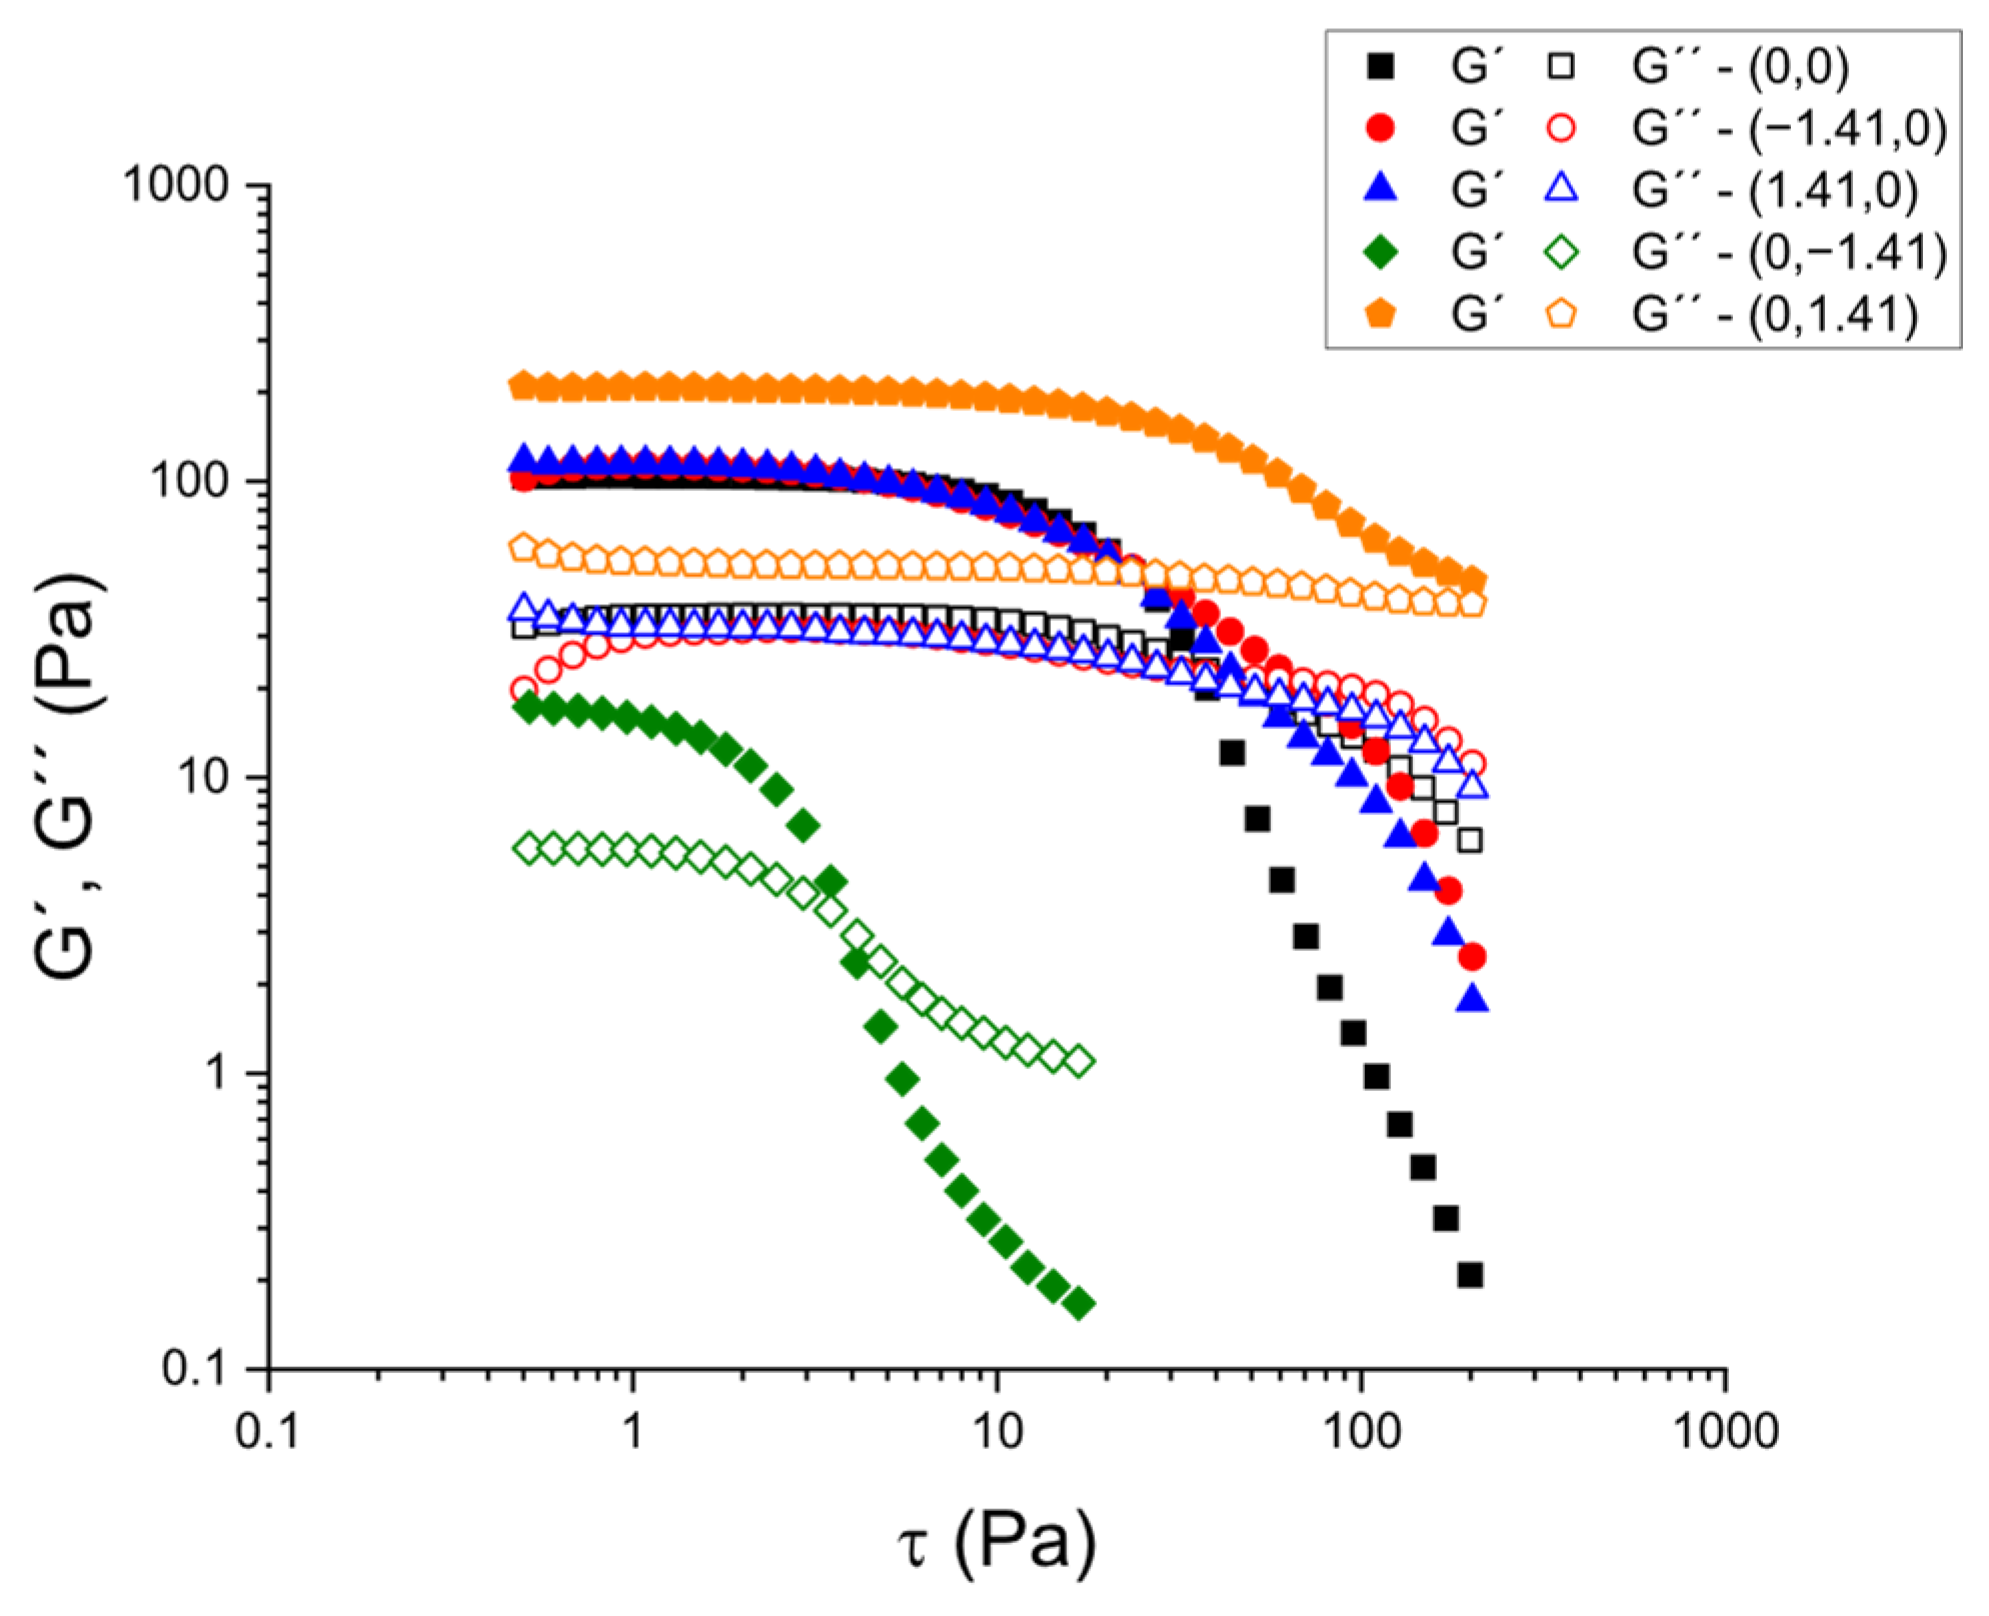
Figure 2 shows stress scans for selected samples based on calcium chloride and psyllium concentrations, in accordance with the experimental design. In the range of CaCl
2 and psyllium concentrations that were examined, all samples exhibited a measurable LVR, wherein G′ and G″ remained virtually constant with increasing stress. This was followed by a sharp decrease in G′, indicating the onset of irreversible structural breakdown. The amplitude of the LVR and the magnitude of τ
c provide complementary metrics of the robustness of the network under processing-like disturbances (filling, pumping, vibration), while G′ in the LVR (G′
LVR) measures the small-deformation stiffness of the gelatinous matrix.
A response surface analysis (RSM) was performed using psyllium and CaCl
2 concentrations as independent variables and τc, G′
LVR, and the loss tangent at 1 Hz as responses (see
Table 2).
The loss tangent (tan δ) is defined as the ratio of the loss to the storage modulus (=G″/G′). It has been demonstrated that this parameter quantifies the balance between viscous dissipation and elastic energy storage. Values below 1 indicate an elastic dominance, and, consequently, predominantly solid-like (gel) behavior. The analysis of the results yielded three empirical equations, based on a quadratic model, which relate these rheological parameters to the concentrations of calcium chloride (CaCl
2) and psyllium (Psy):
These models also demonstrated robust performance, evidenced by R
2 = 0.971 and adjusted R
2 = 0.939, R
2 = 0.959 and adjusted R
2 = 0.908, and R
2 = 0.919 and adjusted R
2 = 0.818, respectively. For a constant concentration of CaCl
2, an increase in psyllium resulted in elevated values of both G′
LVR and τ
c. In stress sweeps, this manifested as higher plateau G′ in the LVR and a rightward shift of the yielding point, indicating a denser and more cohesive network capable of withstanding larger imposed stresses before catastrophic softening. The two-dimensional surface for τ
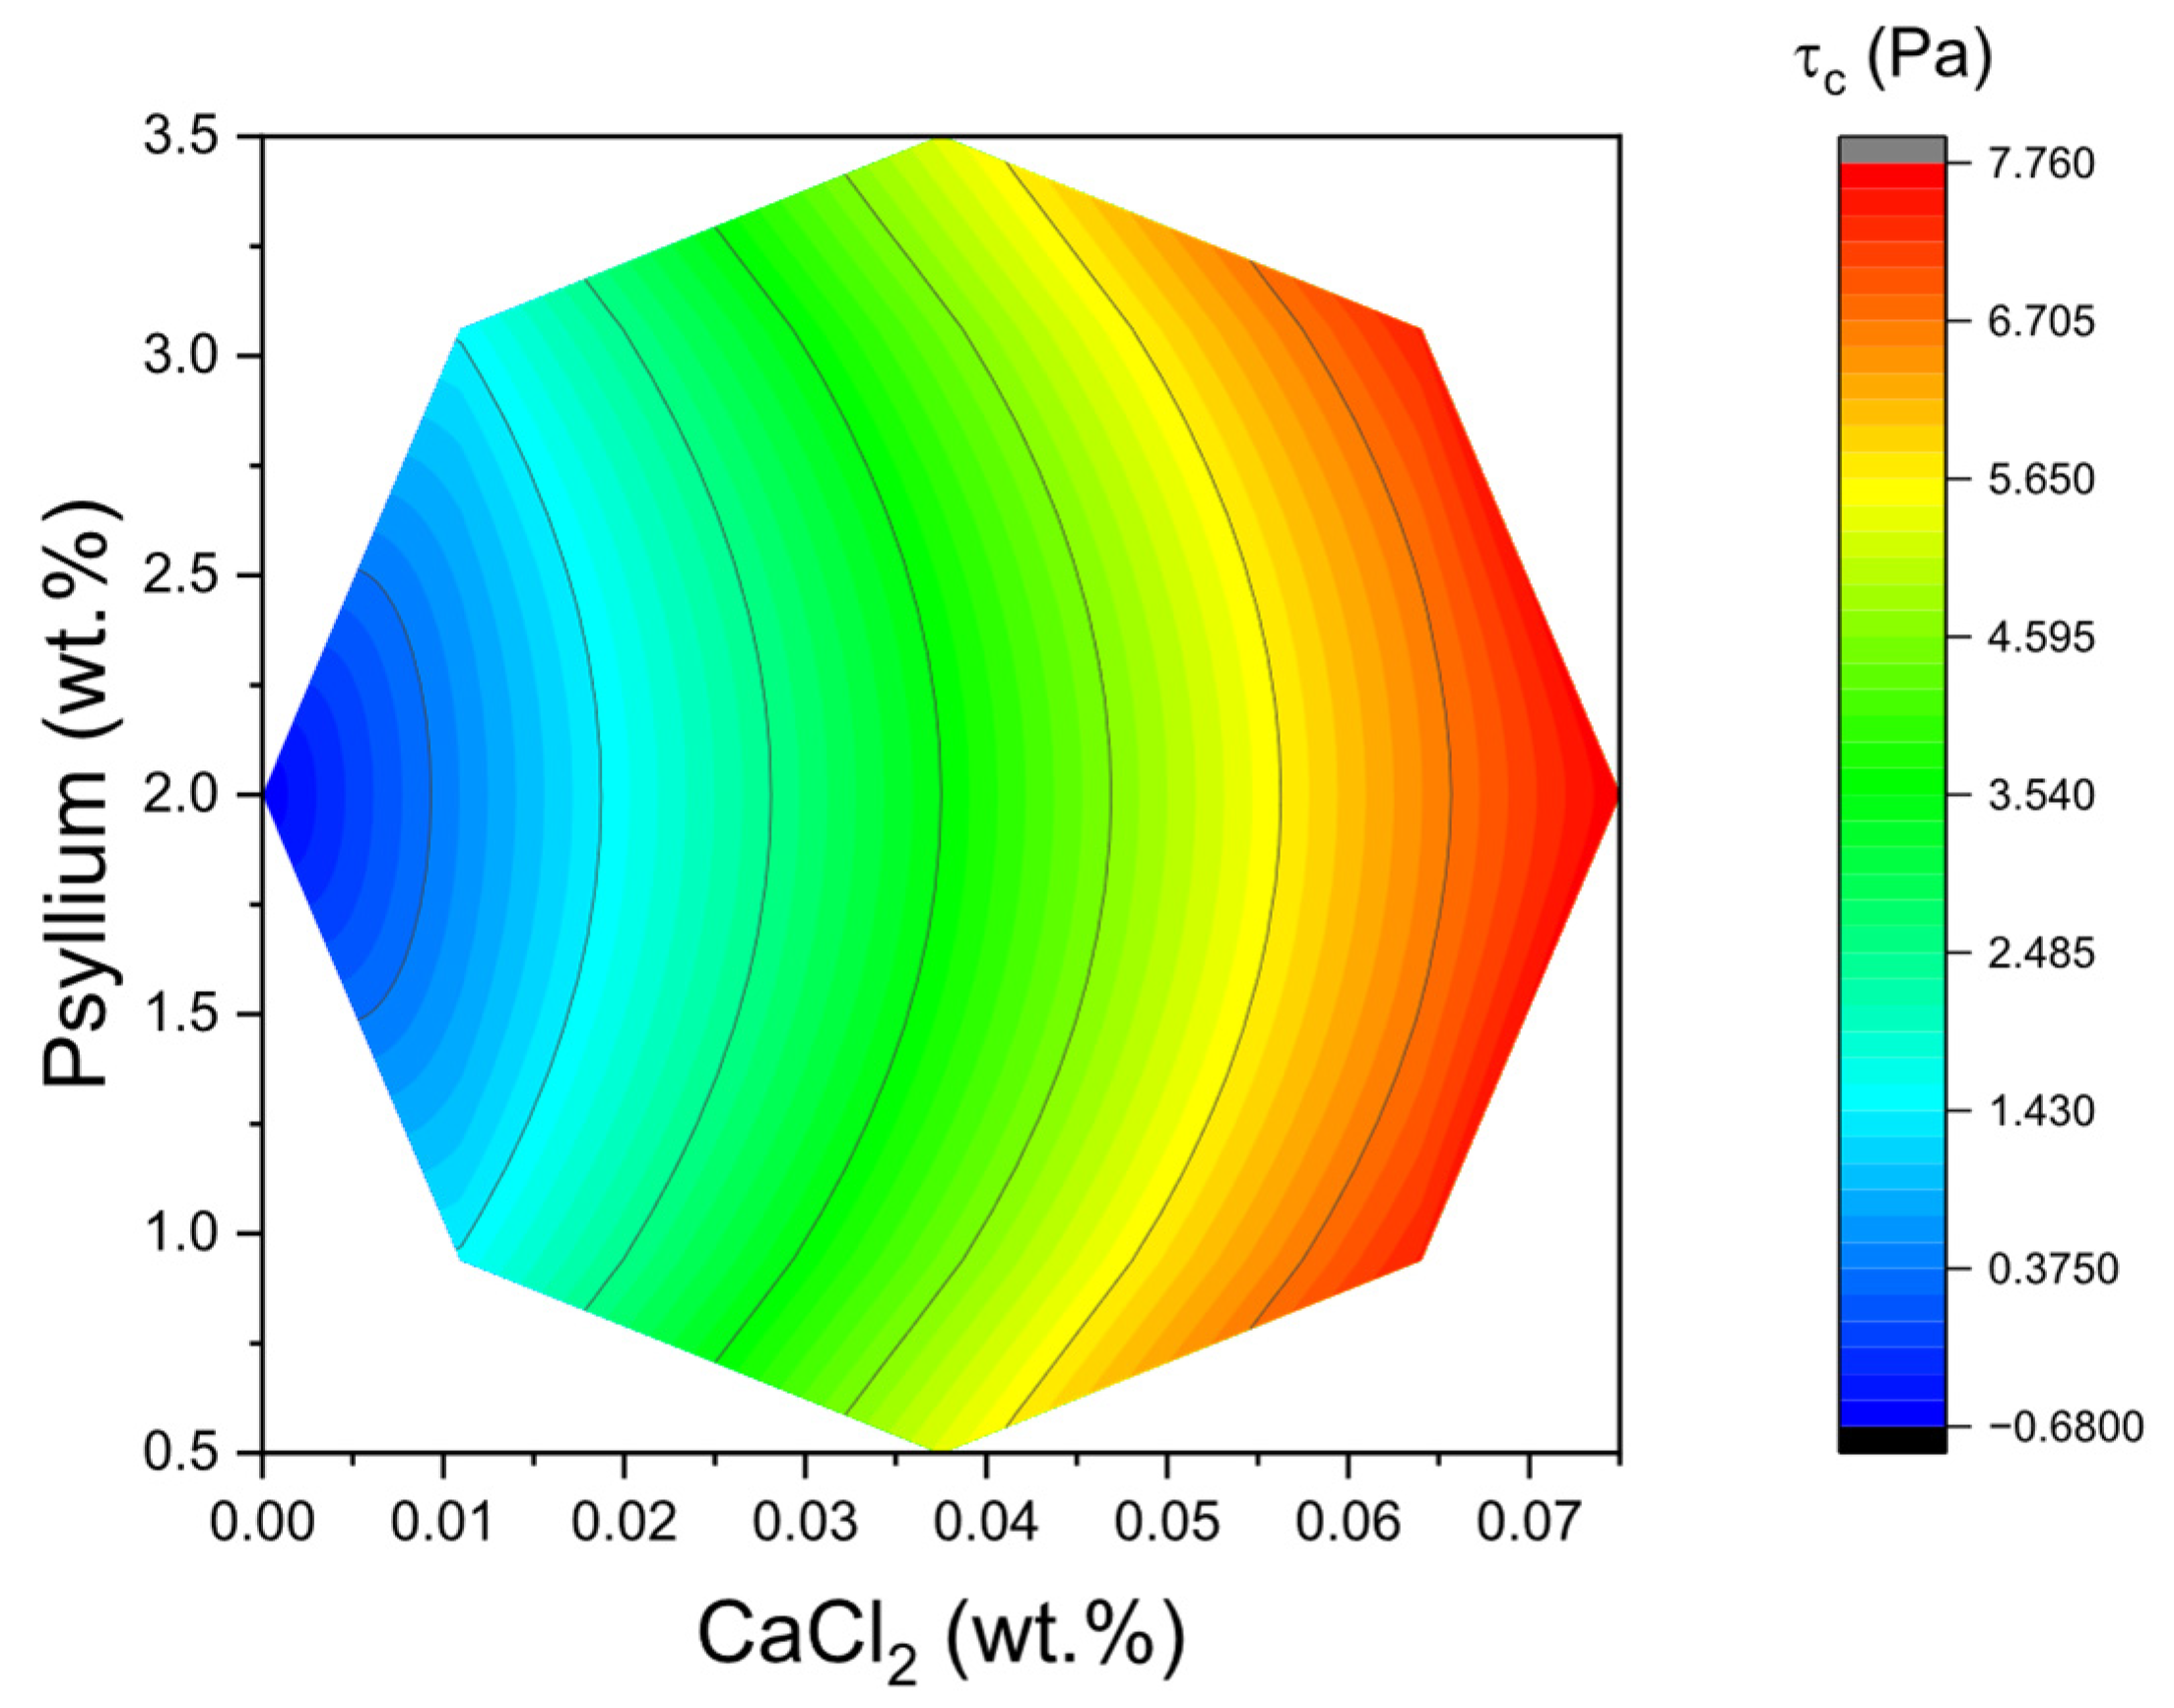
c shown in
Figure 3 corroborates the primacy of psyllium concentration as the main lever to extend the LVR and delay yielding. In practical terms, formulating towards the higher end of the psyllium range systematically enlarged τ
c, even when CaCl
2 was held constant. The physical interpretation is consistent with the high molecular weight and pronounced water-binding capacity of psyllium arabinoxylans, which promote chain entanglement and interparticle bridging in the protein–polysaccharide–fat droplet continuum of kefir.
Furthermore,
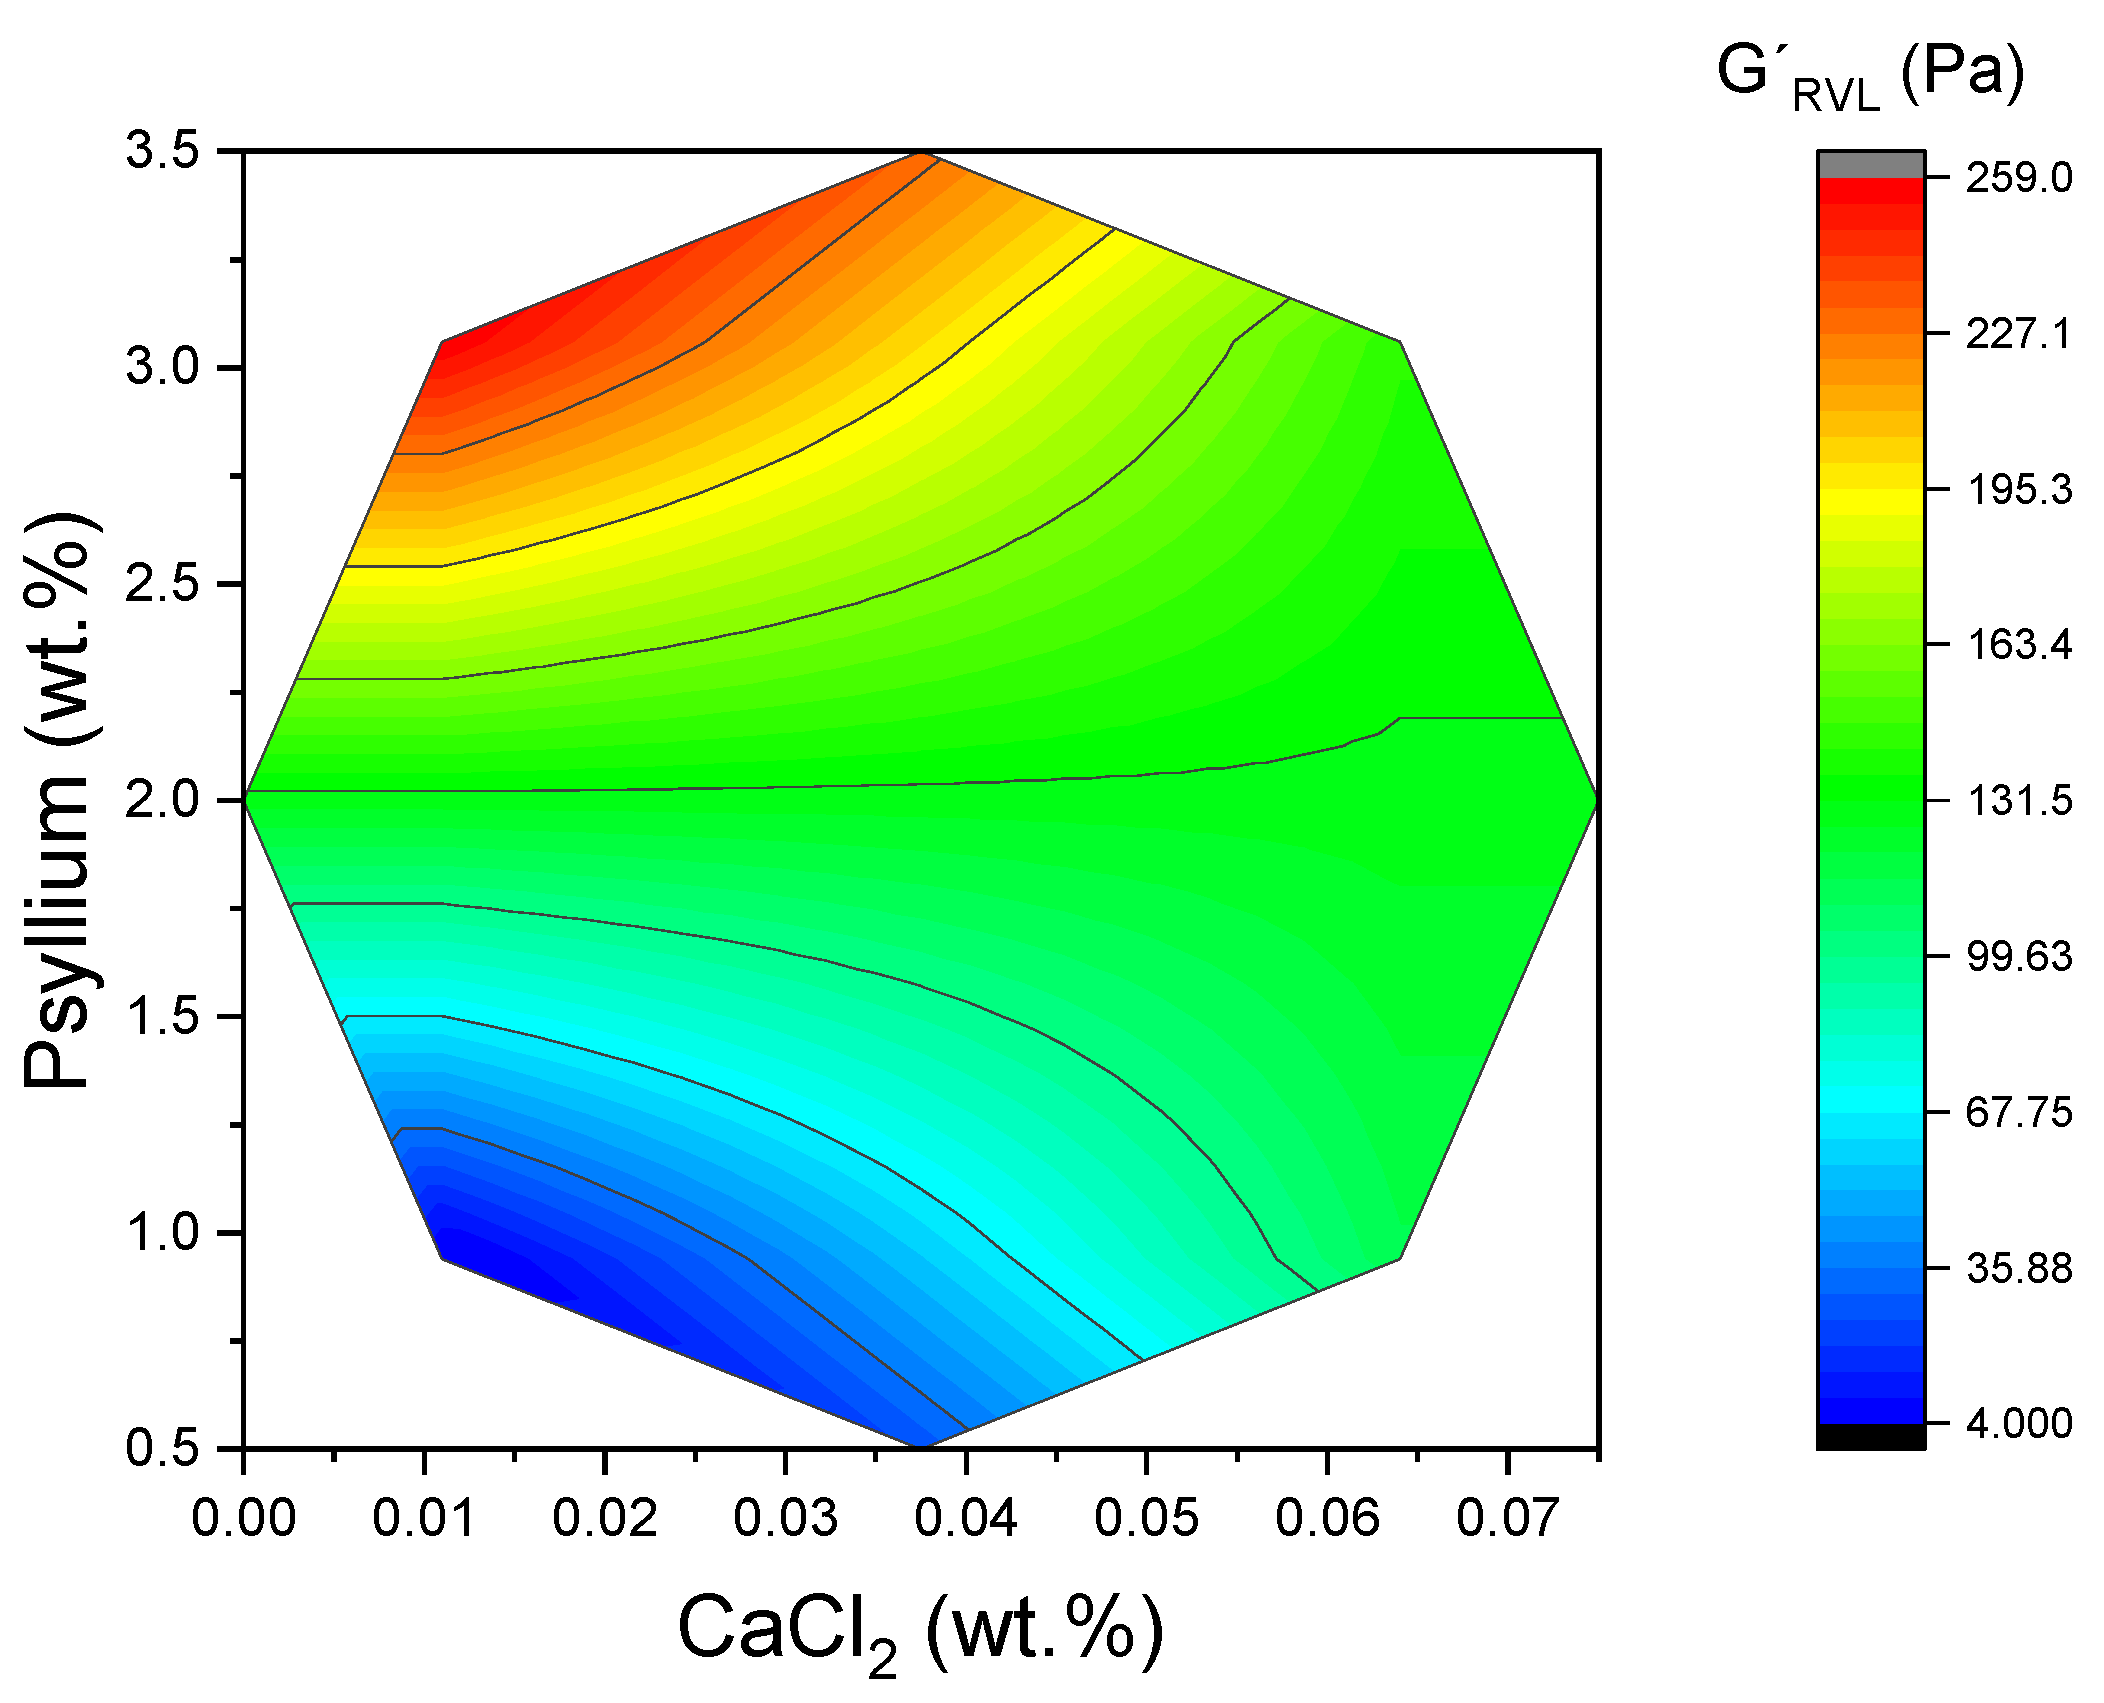
Figure 4 demonstrates the two-dimensional surface area for G′
LVR, illustrating the impact of both variables, particularly psyllium. The resulting increase in junction density and network connectivity has been shown to boost elastic energy storage under small deformations and to delay the strain-amplified rupture processes that define τ
c. From a product perspective, higher G′
LVR implies firmer spoonable texture, and higher τ
c suggests improved resilience during handling, transport, and oral processing. The influence of CaCl
2 was contingent upon the psyllium level. The response surfaces indicated that the maximum G′
LVR occurred at elevated psyllium contents and comparatively low CaCl
2 levels. Further increases in CaCl
2 tended to reduce G′
LVR, despite the presence of substantial polysaccharide. Consequently, the G′ parameter within the LVR experiences a decline, indicating a reduction in the system’s ability to resist deformation. As demonstrated in
Figure 1, there was also a decline in the τ
c from 10.42 Pa to 3.39 Pa at 3.06% (
w:
w) psyllium. Conversely, at low psyllium content (0.94% (
w:
w)), τ
c increased from 0.64 Pa to 3.68 Pa as the concentration of Ca
2+ increased, suggesting limited ionic bridging under dilute conditions. The effects observed in this study, which were found to be both coordinated and factor-dependent, align with prior reports of divalent-ion-induced polysaccharide coil contraction and network heterogeneity [
23,
24]. Whilst direct microstructural visualization was not a primary objective of the present study, the internal consistency of the rheological data provides a robust foundation for the interpretation proposed herein.
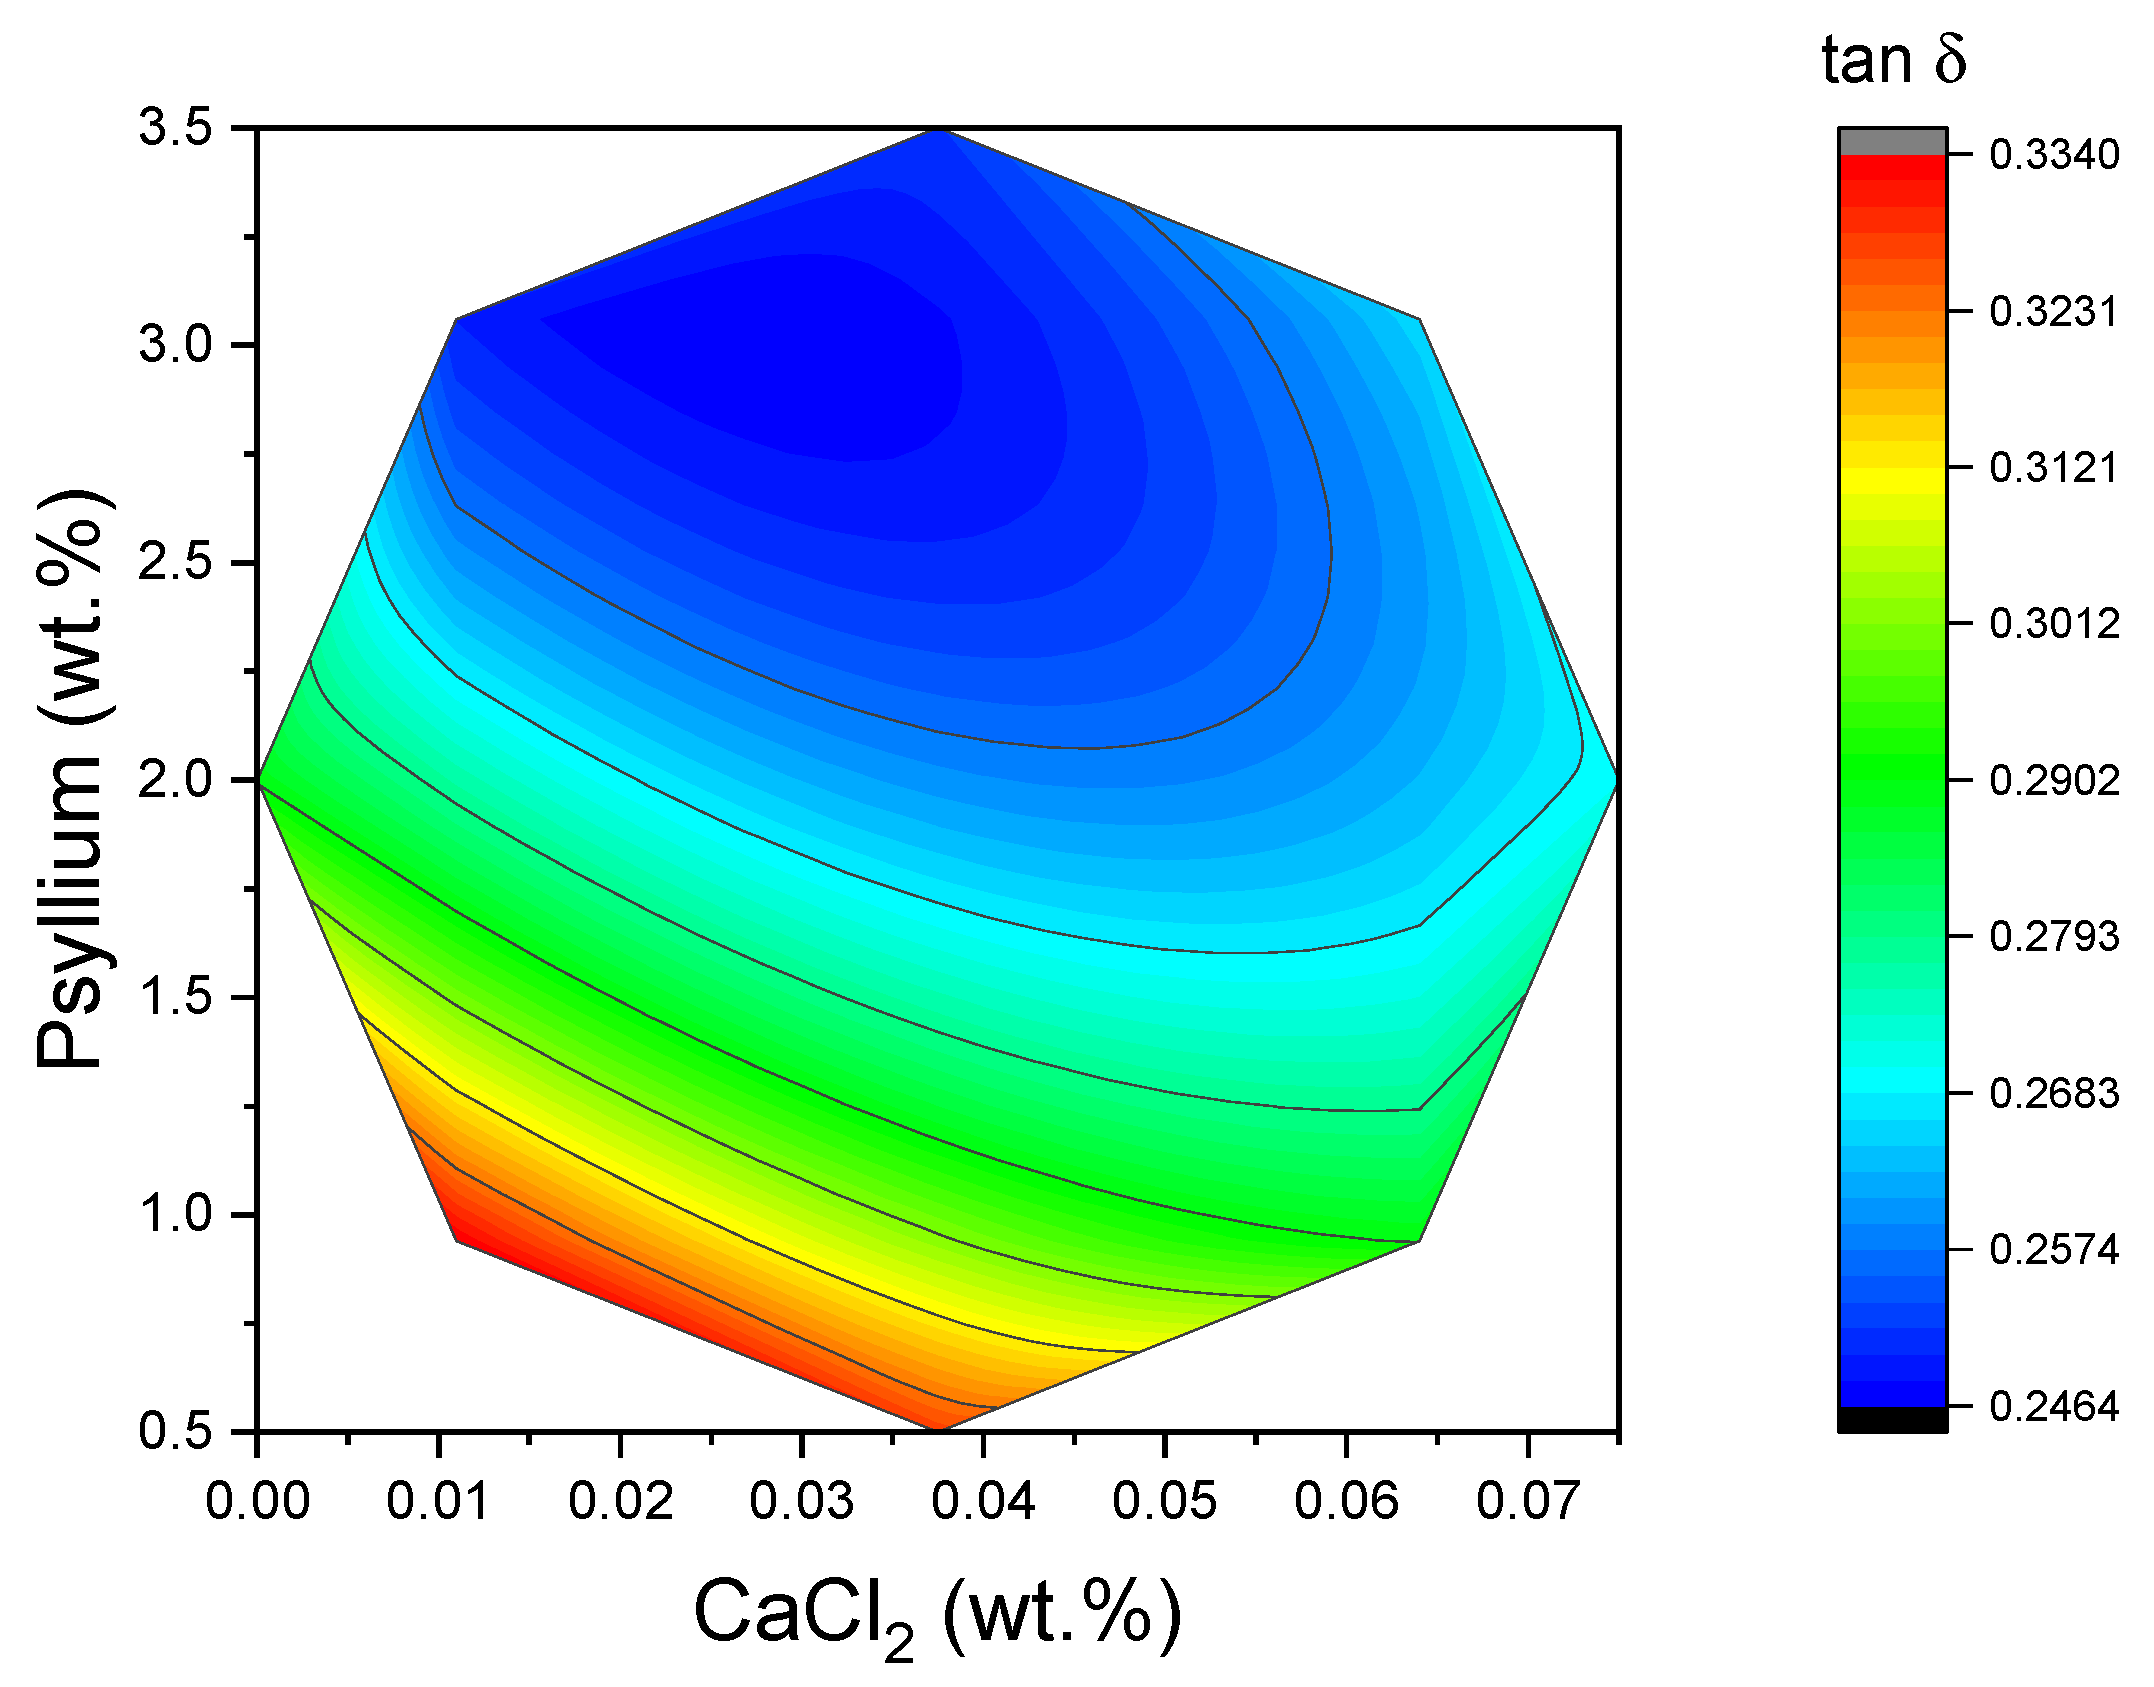
The loss tangent integrates the elastic and viscous contributions into a single, dimensionless descriptor of “gel character.” In the context of food science, low tan δ values (less than 0.1) are indicative of strong, highly elastic gels, while values approaching unity suggest weak gels or paste-like materials. In the present study, tan δ values were found to be comparatively low and concentrated within a narrow window (0.24–0.33), with the lowest values being observed at high psyllium/low CaCl
2 levels (see
Figure 5). This region coincided with the peak of G′
LVR. This alignment of low tan δ with high G′
LVR is consistent with the formation of a well-connected, elastic network. While the tan δ surface was mathematically more complex than those of G′
LVR and τc, its limited spread underscores that, within the design space explored, all formulations behaved as gels rather than viscous suspensions. These interpretations are in accordance with standard rheological practice, whereby tan δ is utilized as a rapid indicator of gel strength and water-holding ability in structured foods.
As illustrated in
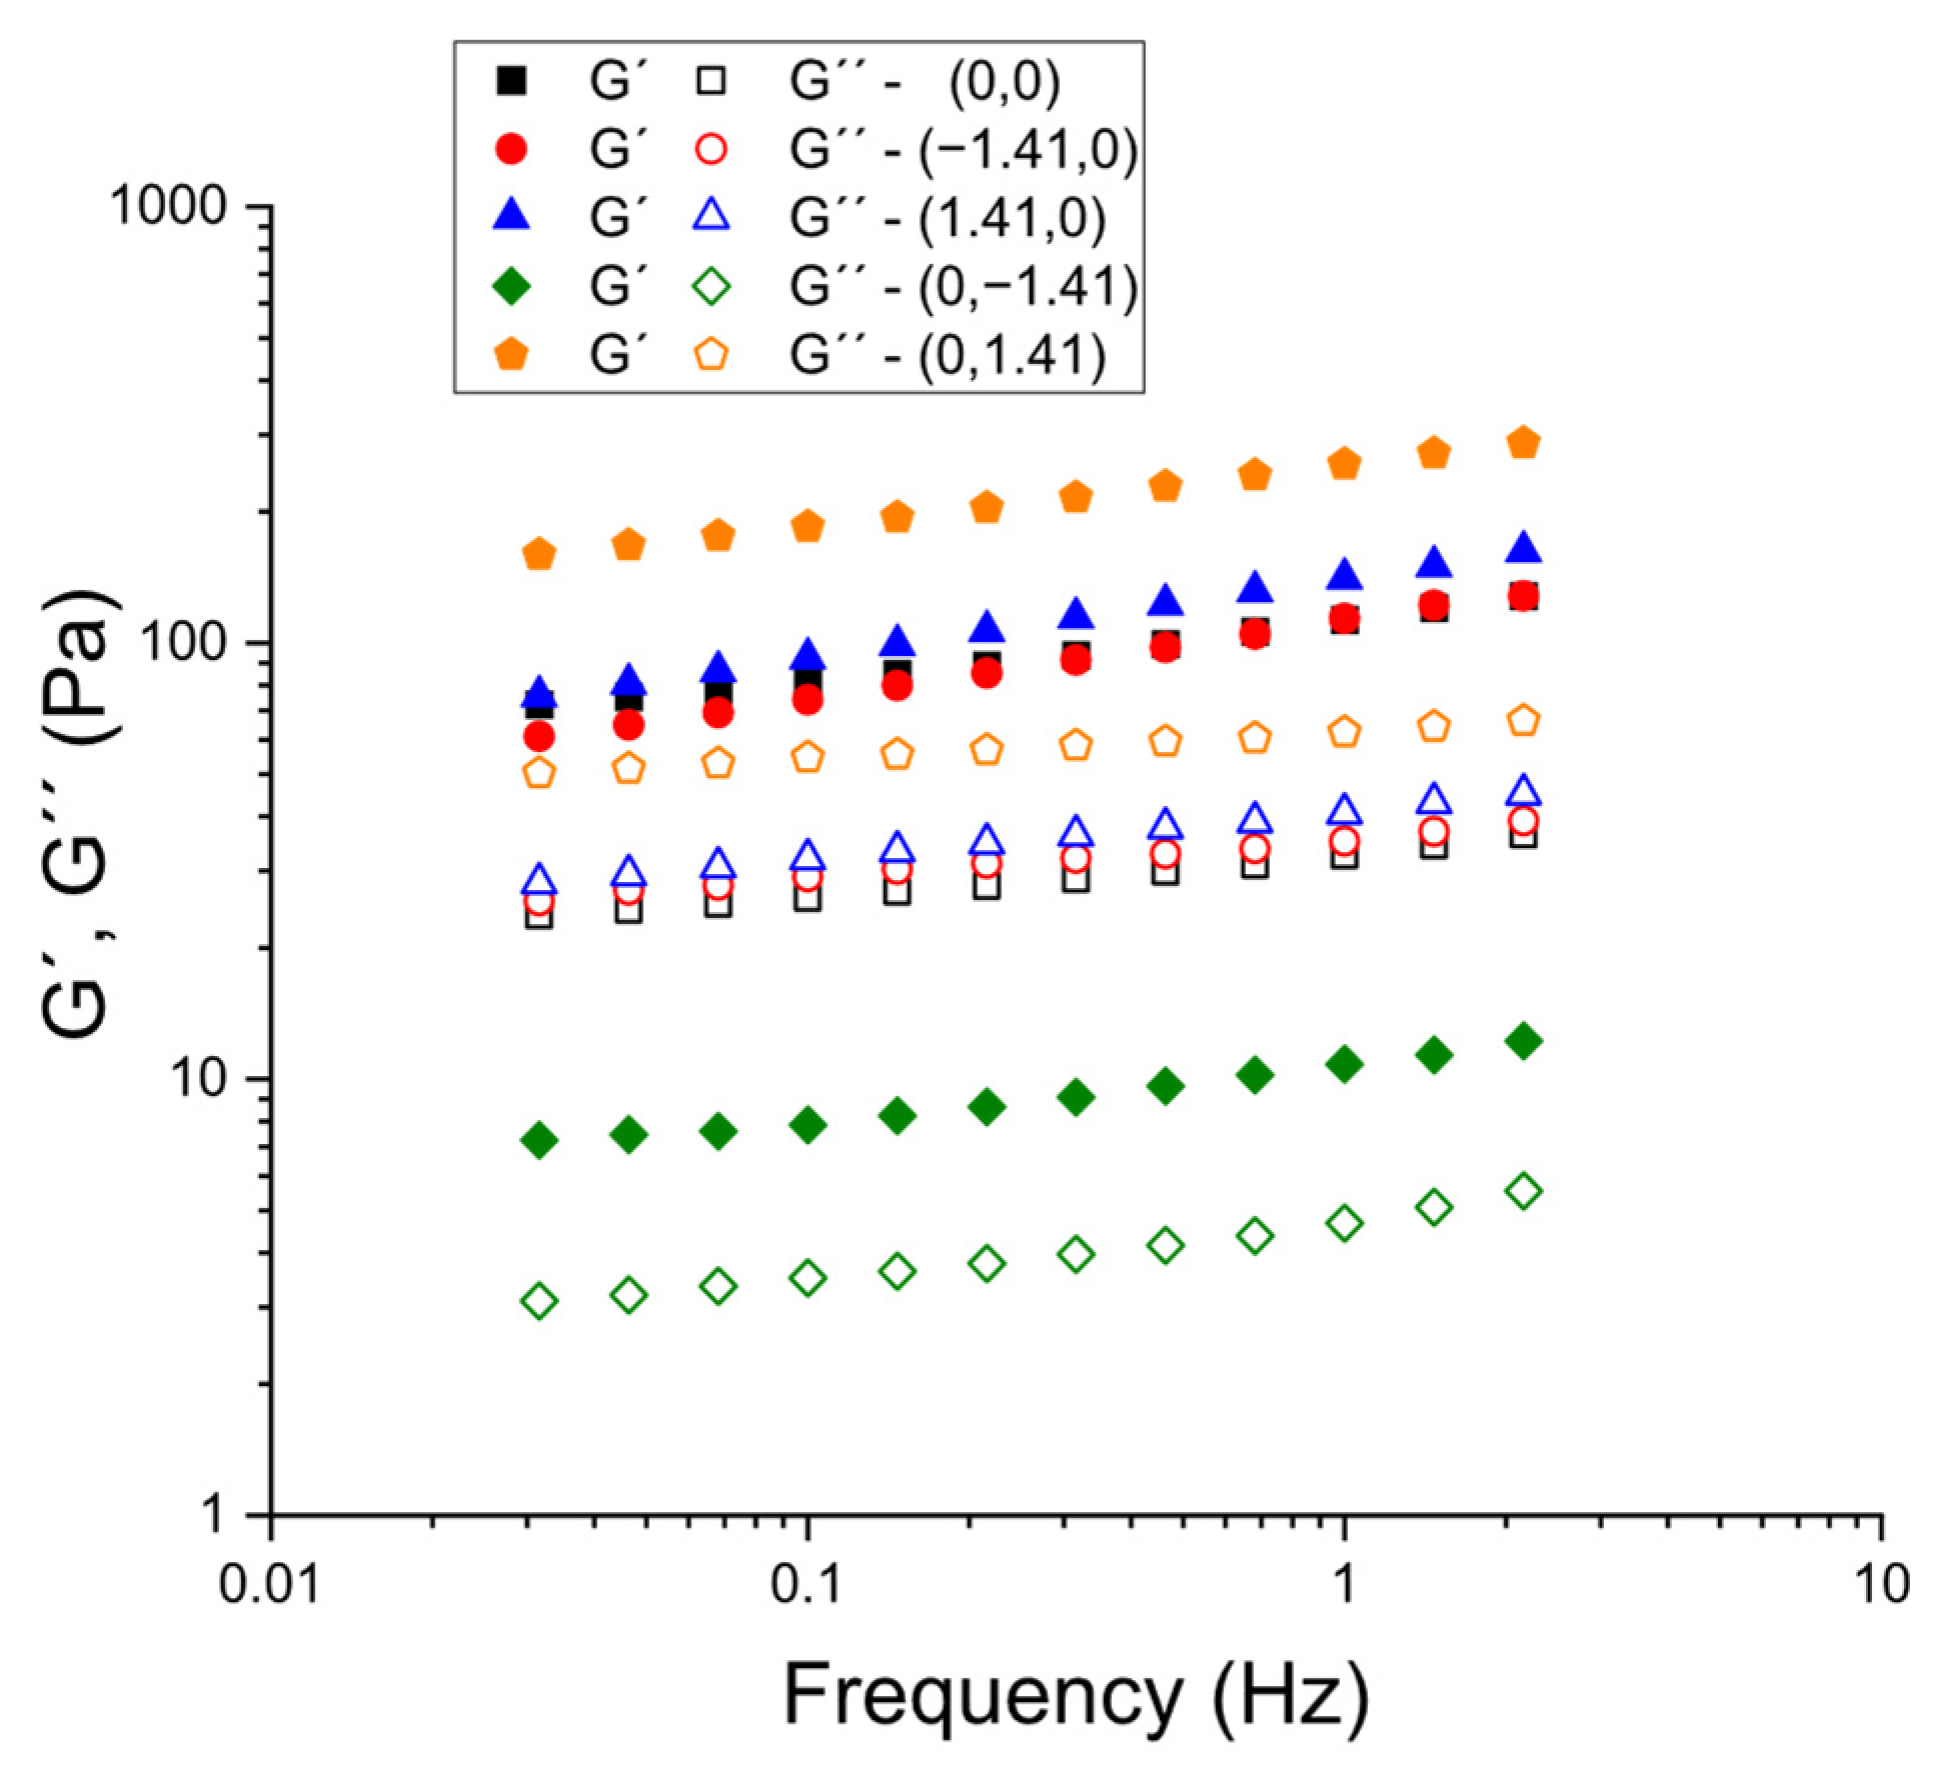
Figure 6, a series of frequency sweeps were conducted on specific formulations (selected to ascertain the impact of psyllium at constant CaCl
2 and vice versa). Methodologically, the stress amplitude in the frequency sweeps was kept constant within the LVR identified for each sample, following the protocol validated in the hydration-time study (constant-stress frequency sweeps after ensuring the LVR by a prior stress sweep). This ensured that the frequency dependence of G′ and G″ reflected material structure rather than progressive damage during testing. Across all compositions that were analyzed, the storage modulus exceeded the loss modulus throughout the explored frequency window (G′ > G″), and G′ demonstrated only a weak frequency dependence, which is characteristic of weak-gel behavior. In accordance with the earlier determination of tan δ at 1 Hz surface, the spectra position the formulations towards the ‘elastic-dominant’ side of viscoelasticity, with reduced tan δ (and consequently augmented gel character) systematically observed at elevated levels of psyllium and reduced levels of CaCl
2. These mechanical spectra thus corroborate the hypothesis that the formulations form percolated networks at small deformations, and that increasing psyllium primarily strengthens the network. Conversely, Ca
2+ additions in the studied range tend to attenuate the elastic response.
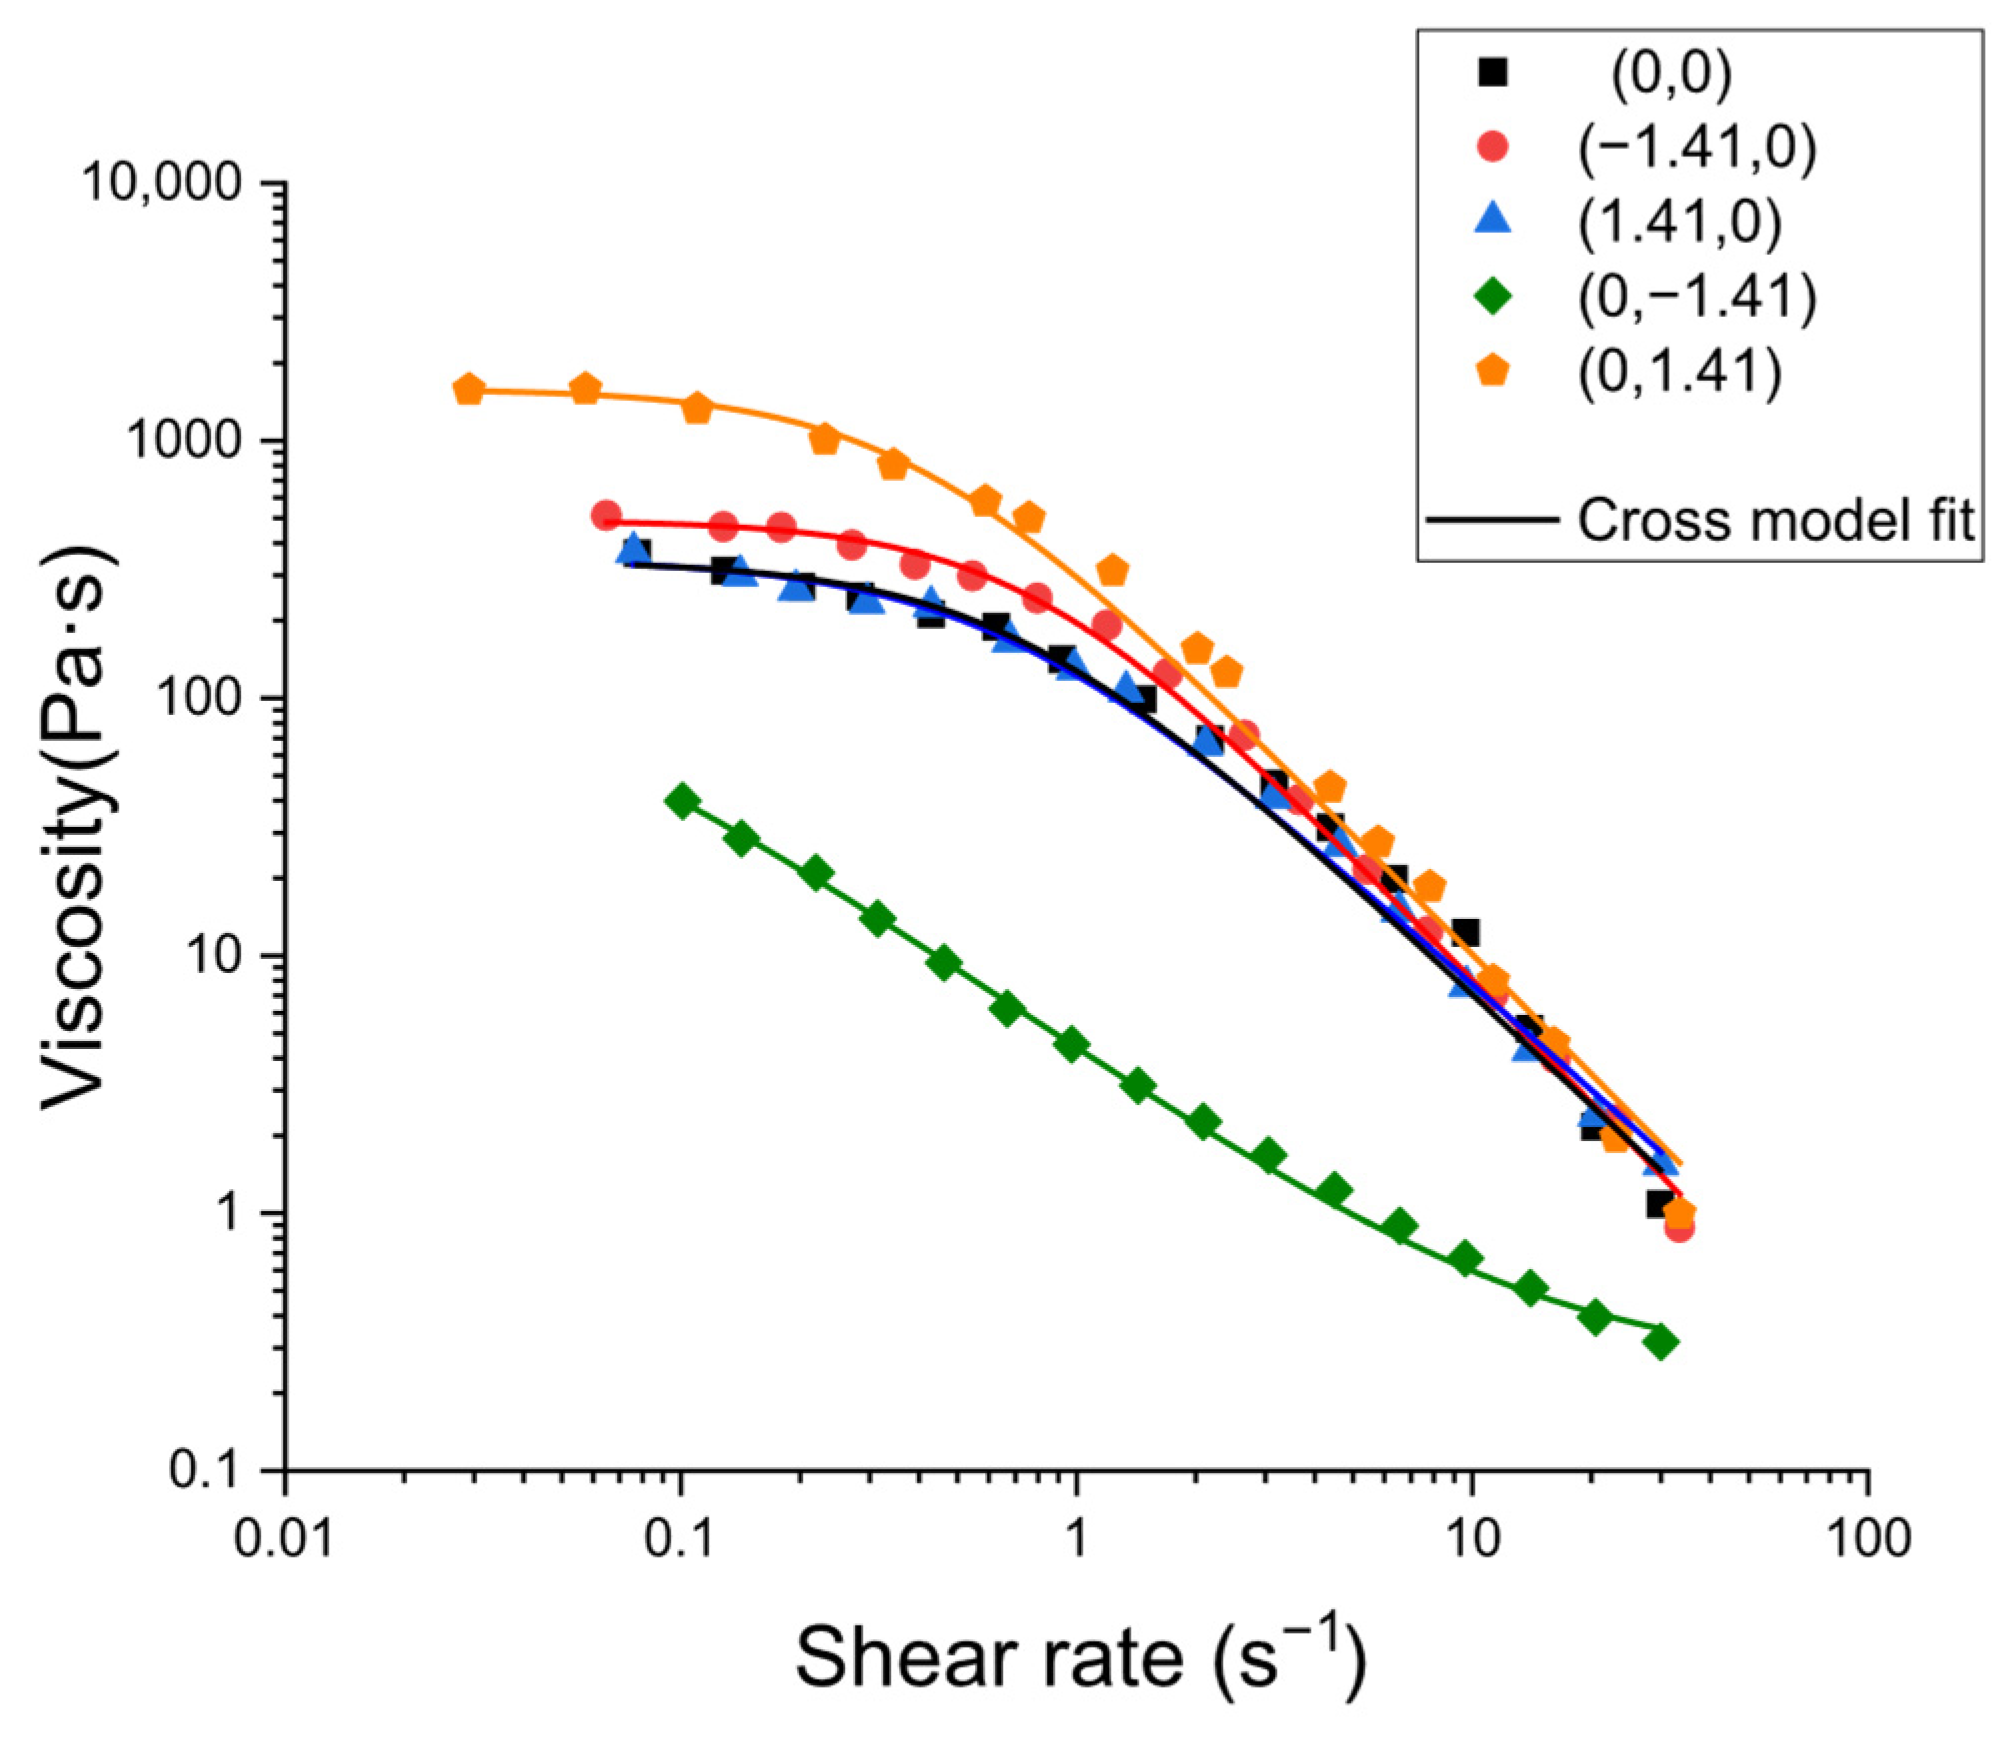
The analysis of flow curves illustrated in
Figure 7 (apparent viscosity versus shear rate) revealed pronounced shear-thinning behavior in all samples. This behavior is dominated by progressive chain disentanglement and structural alignment under flow. The Cross model provided a comprehensive description of all datasets, whereby the transition of viscosity between a zero-shear plateau (η
0) and a high-shear plateau (η
∞) occurred, accompanied by a characteristic time constant t (1/t marking the initiation of the power-law regime) and a shear-thinning index m determining the gradient of the intermediate region:
The favorable agreement with Cross suggests that the primary compositional effects are captured by the manner in which formulations set η0 and the extent and position of the shear-thinning regime.
In the context of the analysis, psyllium content emerged as the predominant factor influencing zero-shear viscosity as shown in the following equation:
The incorporation of psyllium resulted in an increase in apparent viscosity across the entire range of shear rates. This observation is indicative of a psyllium-induced densification and cohesion within the network, thereby enhancing its structural integrity. Conversely, the role of CaCl
2 was secondary. In the context of a constant psyllium level (the coded center for psyllium), it was demonstrated that 0% (
w:
w) CaCl
2 and 2% (
w:
w) psyllium exhibited higher viscosity than their counterparts with 0.0375% (
w:
w) or 0.075% (
w:
w) CaCl
2, which showed very similar flow curves to each other. Consequently, within the experimental domain, the addition of Ca
2+ appeared to decrease viscosity in comparison to the Ca-free formulation, irrespective of the psyllium level (see
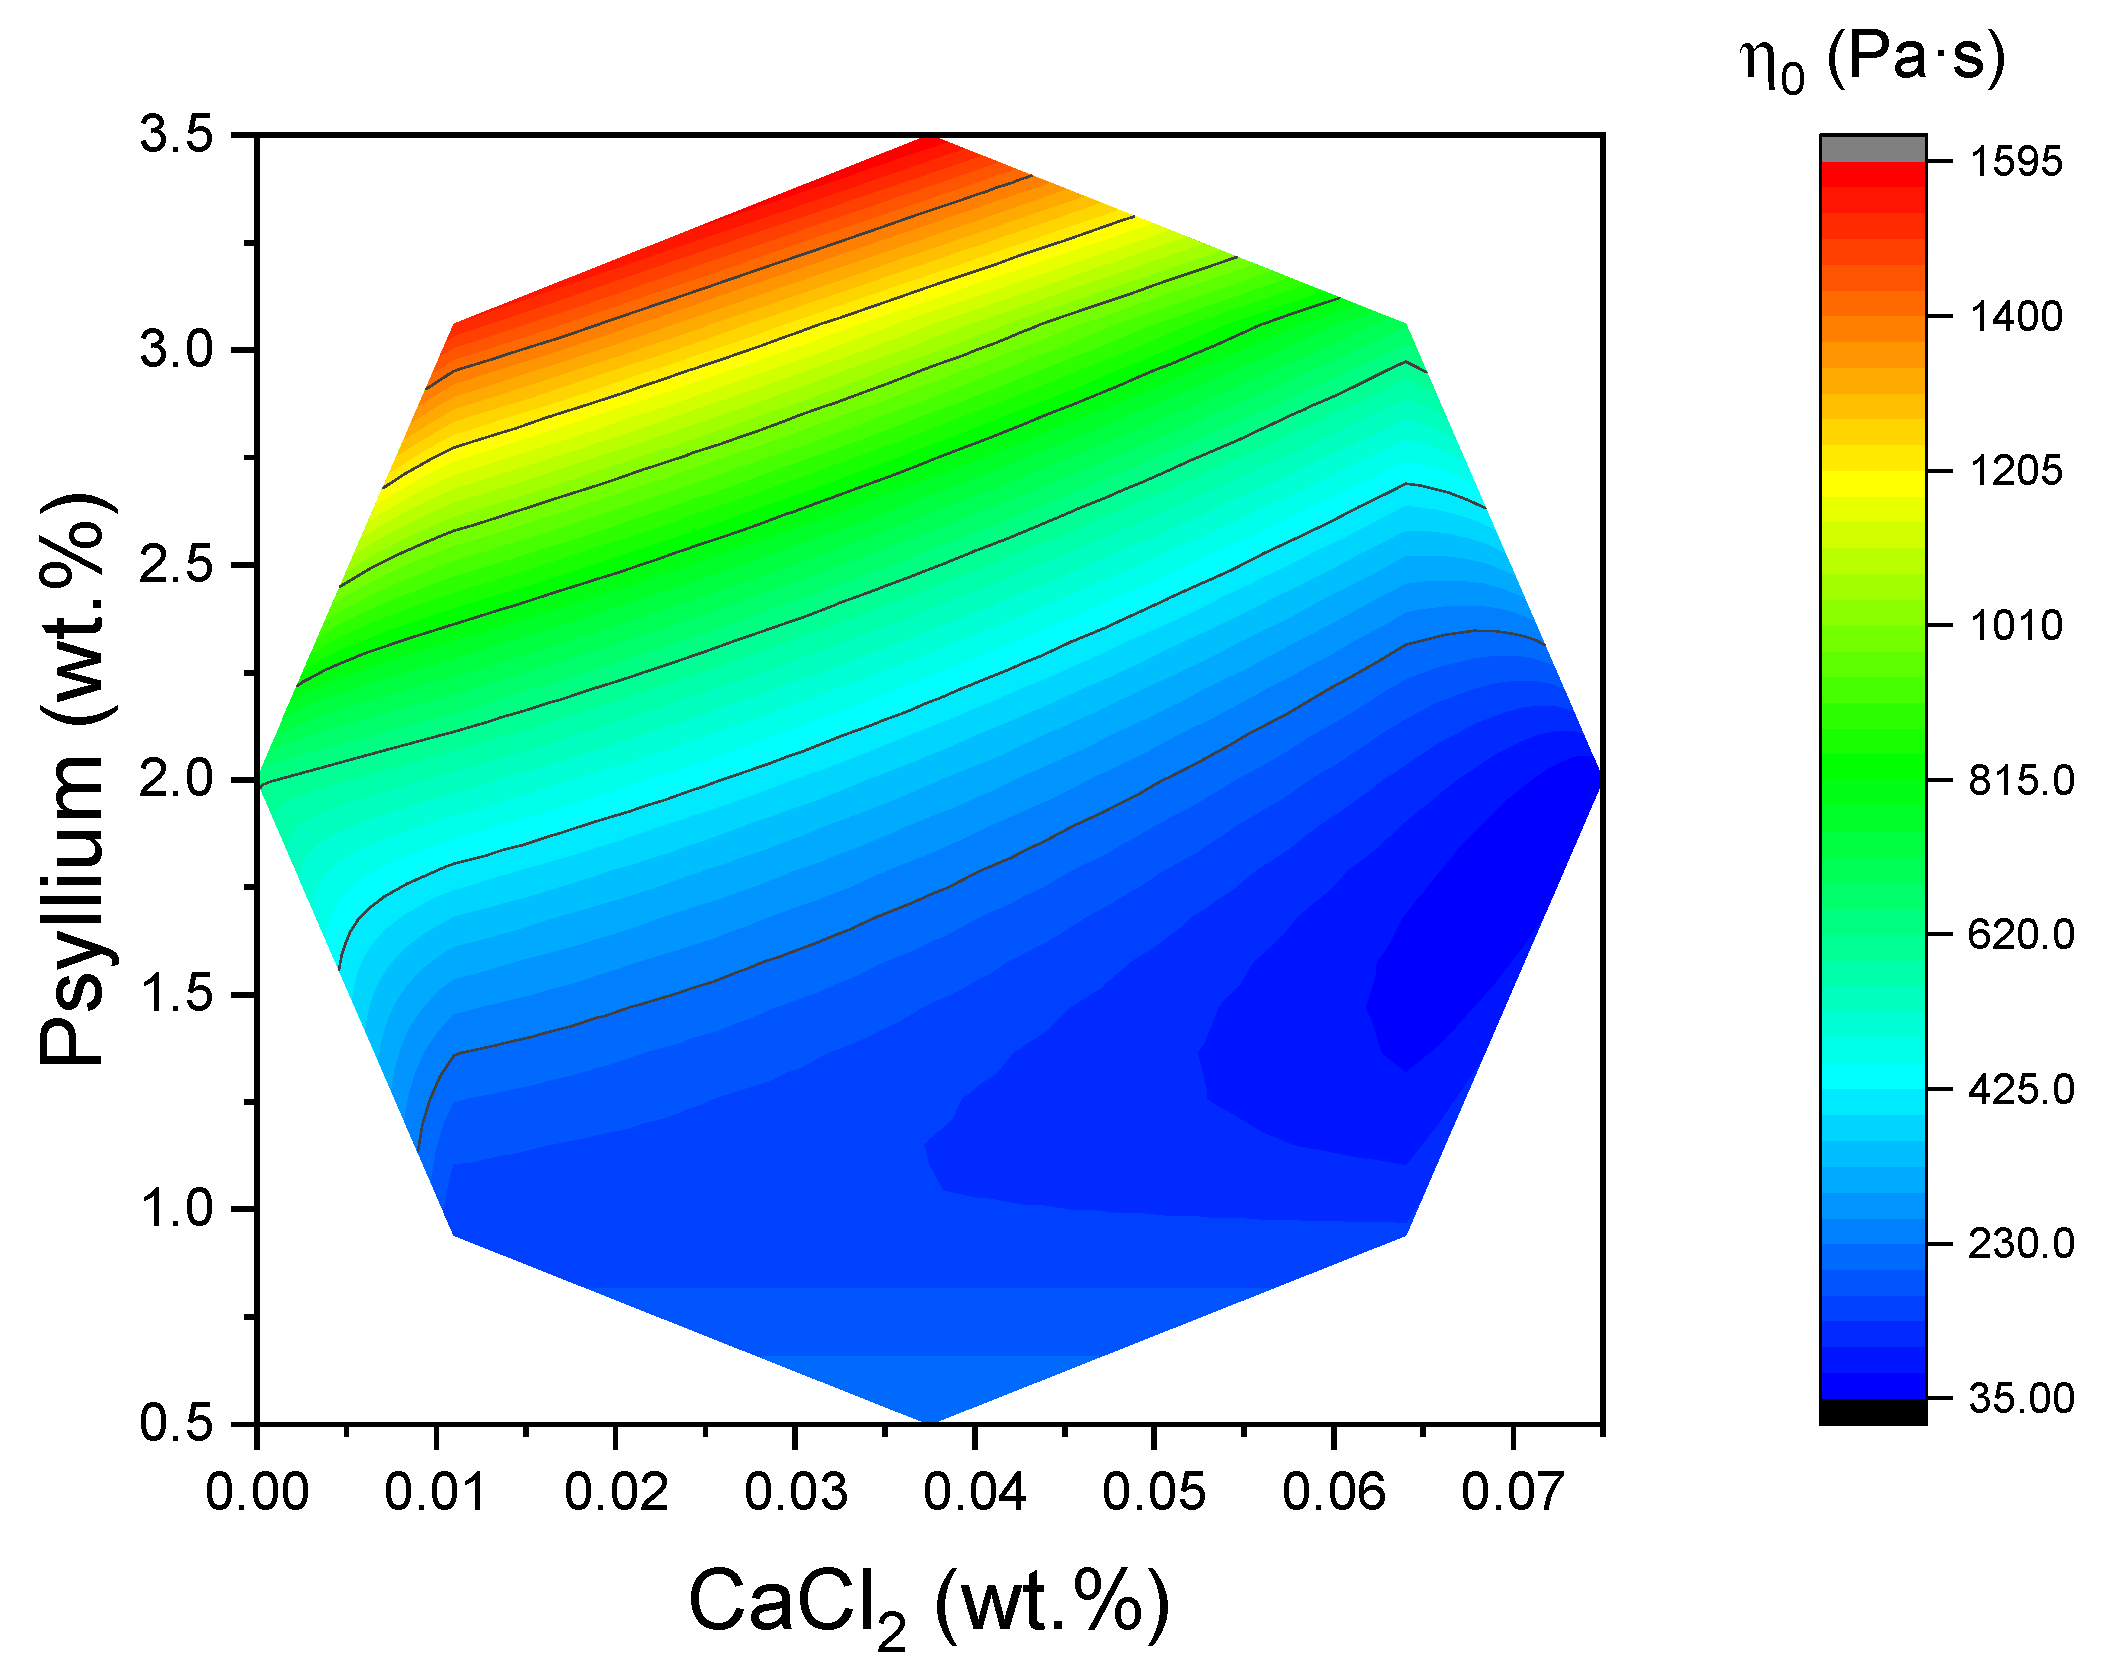
Figure 8). The response surface of the η
0 mapped over the Central Composite Design (CCD) exhibited a clear maximum in the region of high psyllium and low CaCl
2, thereby mirroring the qualitative trends seen in the flow curves. The fitted coefficients indicated a strong positive effect of psyllium and a negative effect of Ca
2+ on η
0 within the studied ranges, placing the ridge of highest zero-shear viscosity towards the upper-psyllium/lowest-calcium corner of the design space. This topography corresponds with the previously established viscoelastic maps, with the maximum viscosity, η
0, coinciding with the compositional region exhibiting higher G′ in the LVR and lower tan δ (indicating a stronger gel-like character). This suggests an internal consistency between the small-amplitude (structure-dominated) and steady-shear (flow-dominated) descriptions of the same microstructure.
From a physical-stability standpoint, the combination of a finite critical stress at rest (τ
c, established from stress sweeps) with a high η
0 is advantageous for suppressing sedimentation or phase separation during storage. Formulations with higher psyllium (and particularly the Ca-free variants at a given psyllium dose) therefore offer the most favorable baseline for shelf stability. Despite the fact that the four parameters of Cross’s model were mathematically adjusted to a quadratic model using the response surface methodology, only the adjustment of zero Newtonian viscosity (η
0) to calcium chloride and psyllium concentrations demonstrated an acceptable regression coefficient greater than 0.80 [
25], specifically R
2 = 0.94.
