
Study on the Adaptability of FBG Sensors Encapsulated in CNT-Modified Gel Material for Asphalt Pavement

 ,
, 

Abstract
1. Introduction
2. Results and Discussion
2.1. Analysis of Mechanical Properties
2.1.1. Tensile Properties Analysis
2.1.2. Bending Performance Analysis
2.2. Infrared Spectrum Analysis of Carboxylated Carbon Nanotubes
2.3. SEM Micro-Morphology Characterization Analysis
2.3.1. Morphology Characterization Analysis of Carbon Nanotubes Before and After Modification
2.3.2. Analysis of Tensile Fracture Surface Morphology of Composites
2.4. Calibration Test Analysis
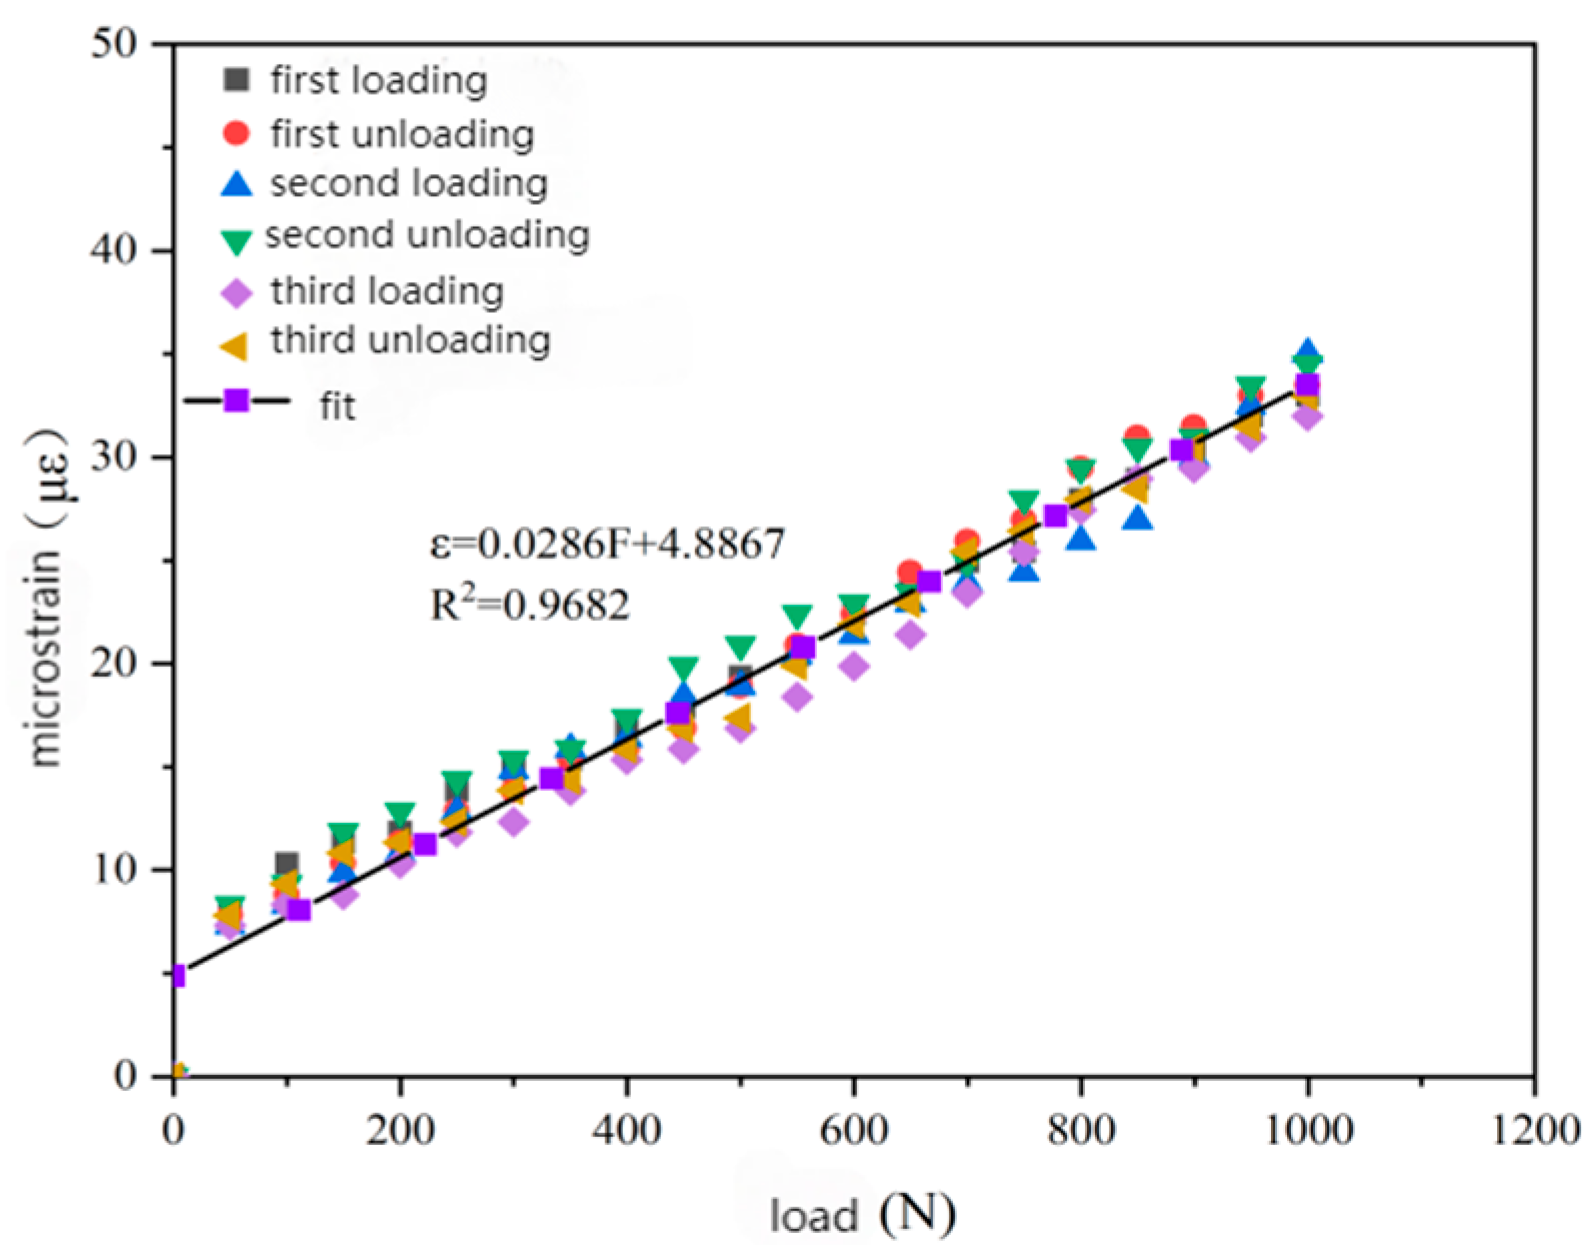
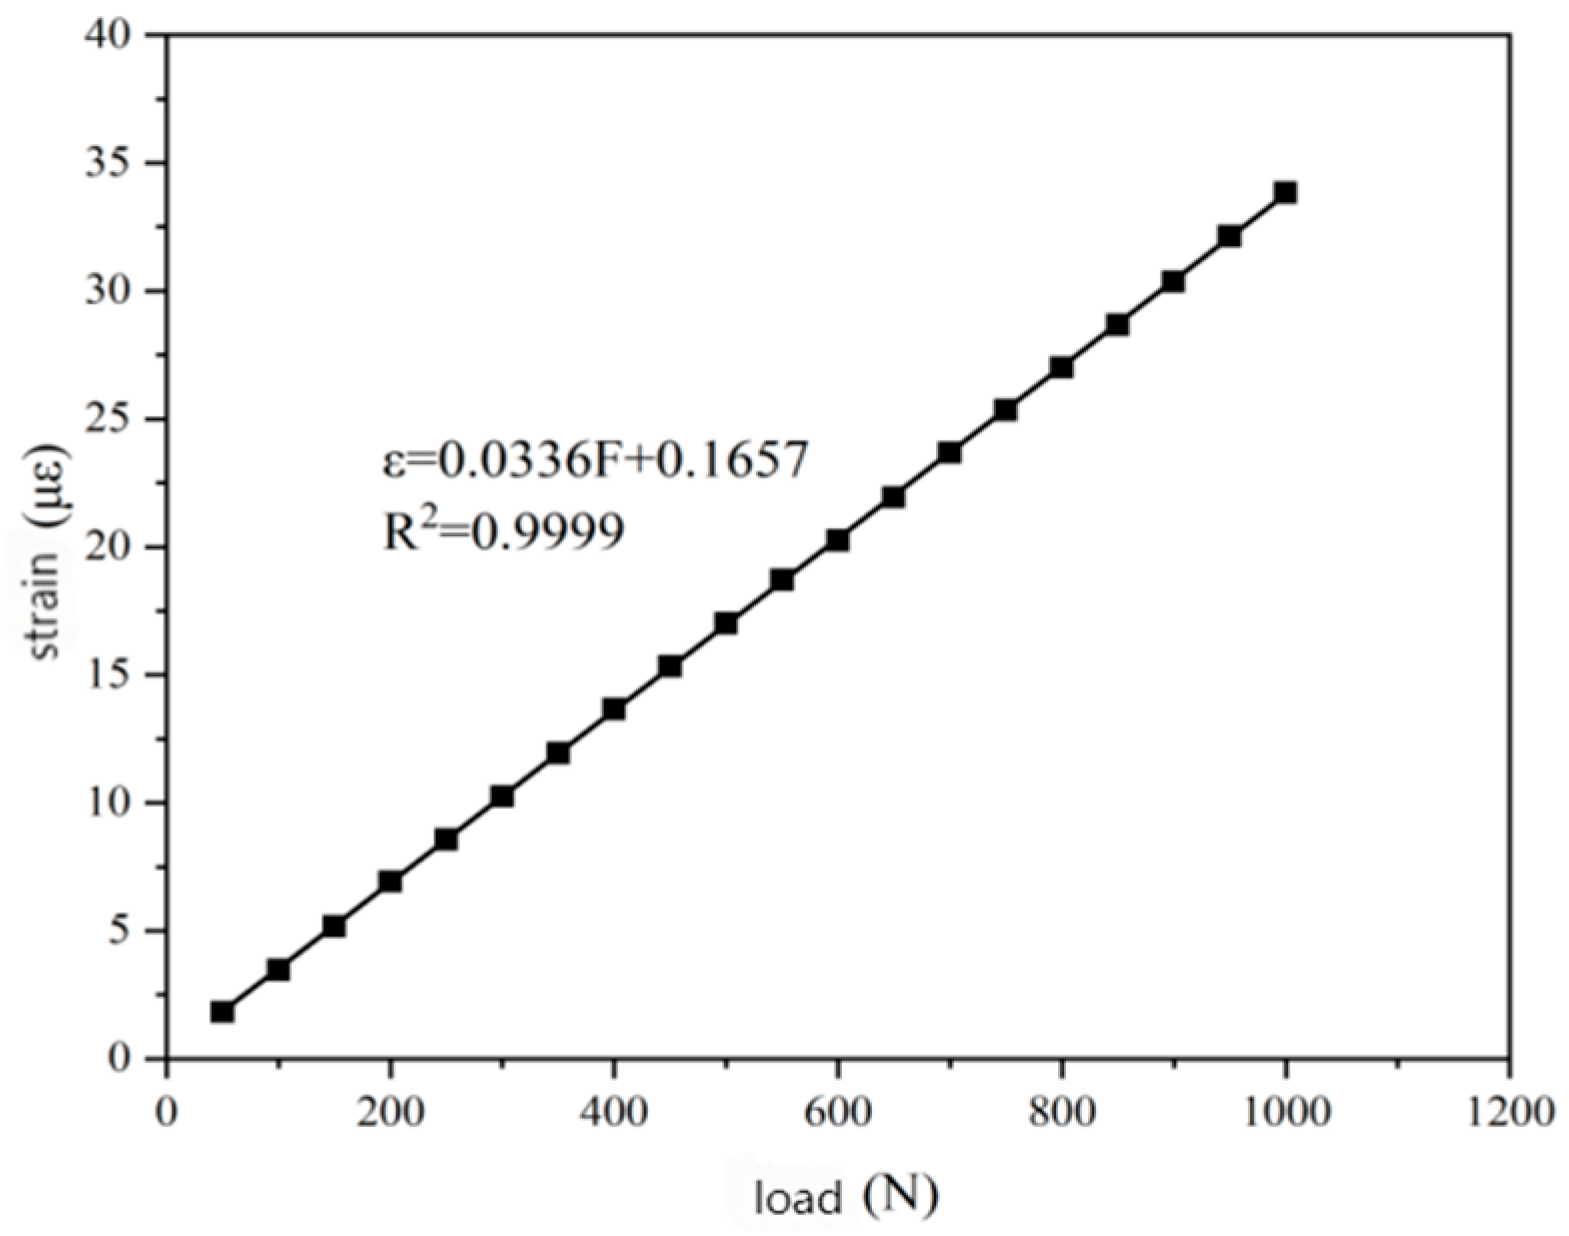
2.4.1. Analysis of Strain Calibration Test
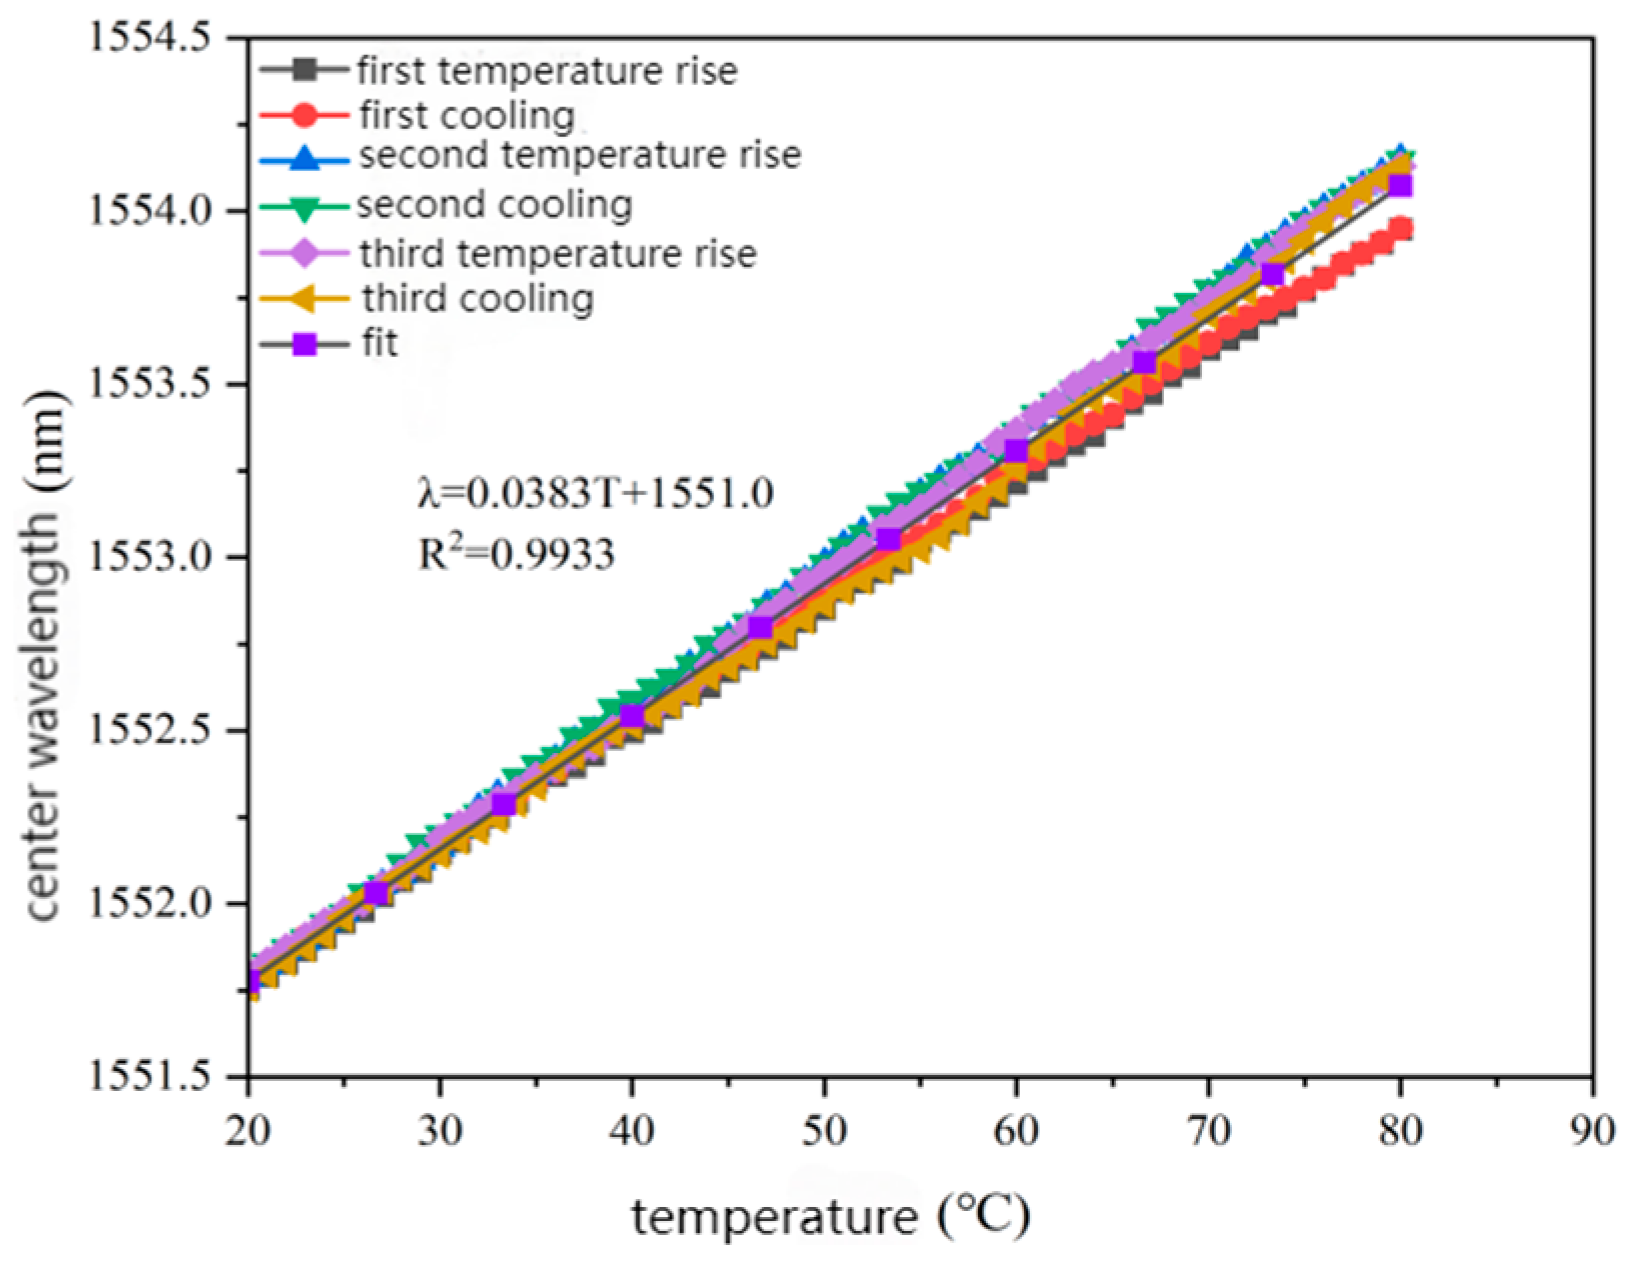
2.4.2. Temperature Calibration Test Analysis
2.5. Applicability Analysis of the Sensor
2.5.1. Static Load Test Analysis
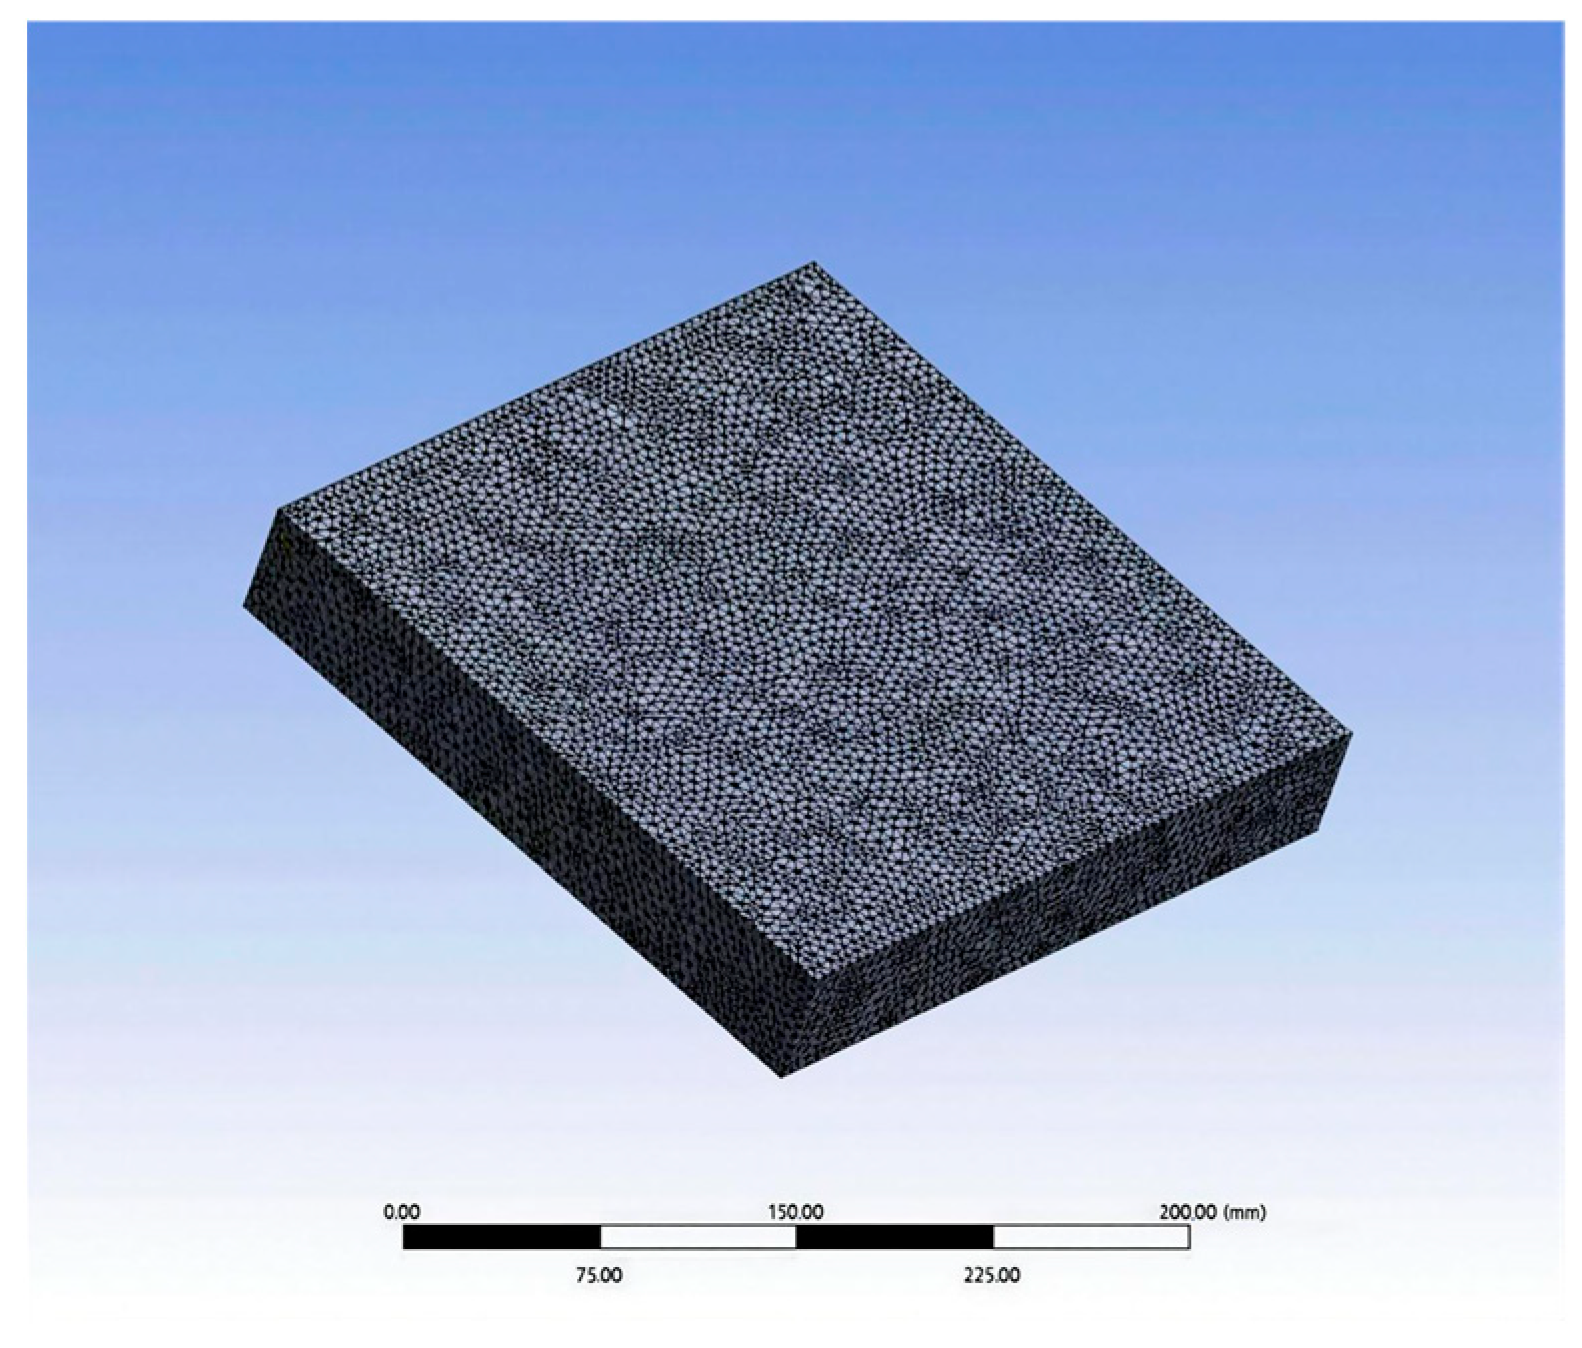
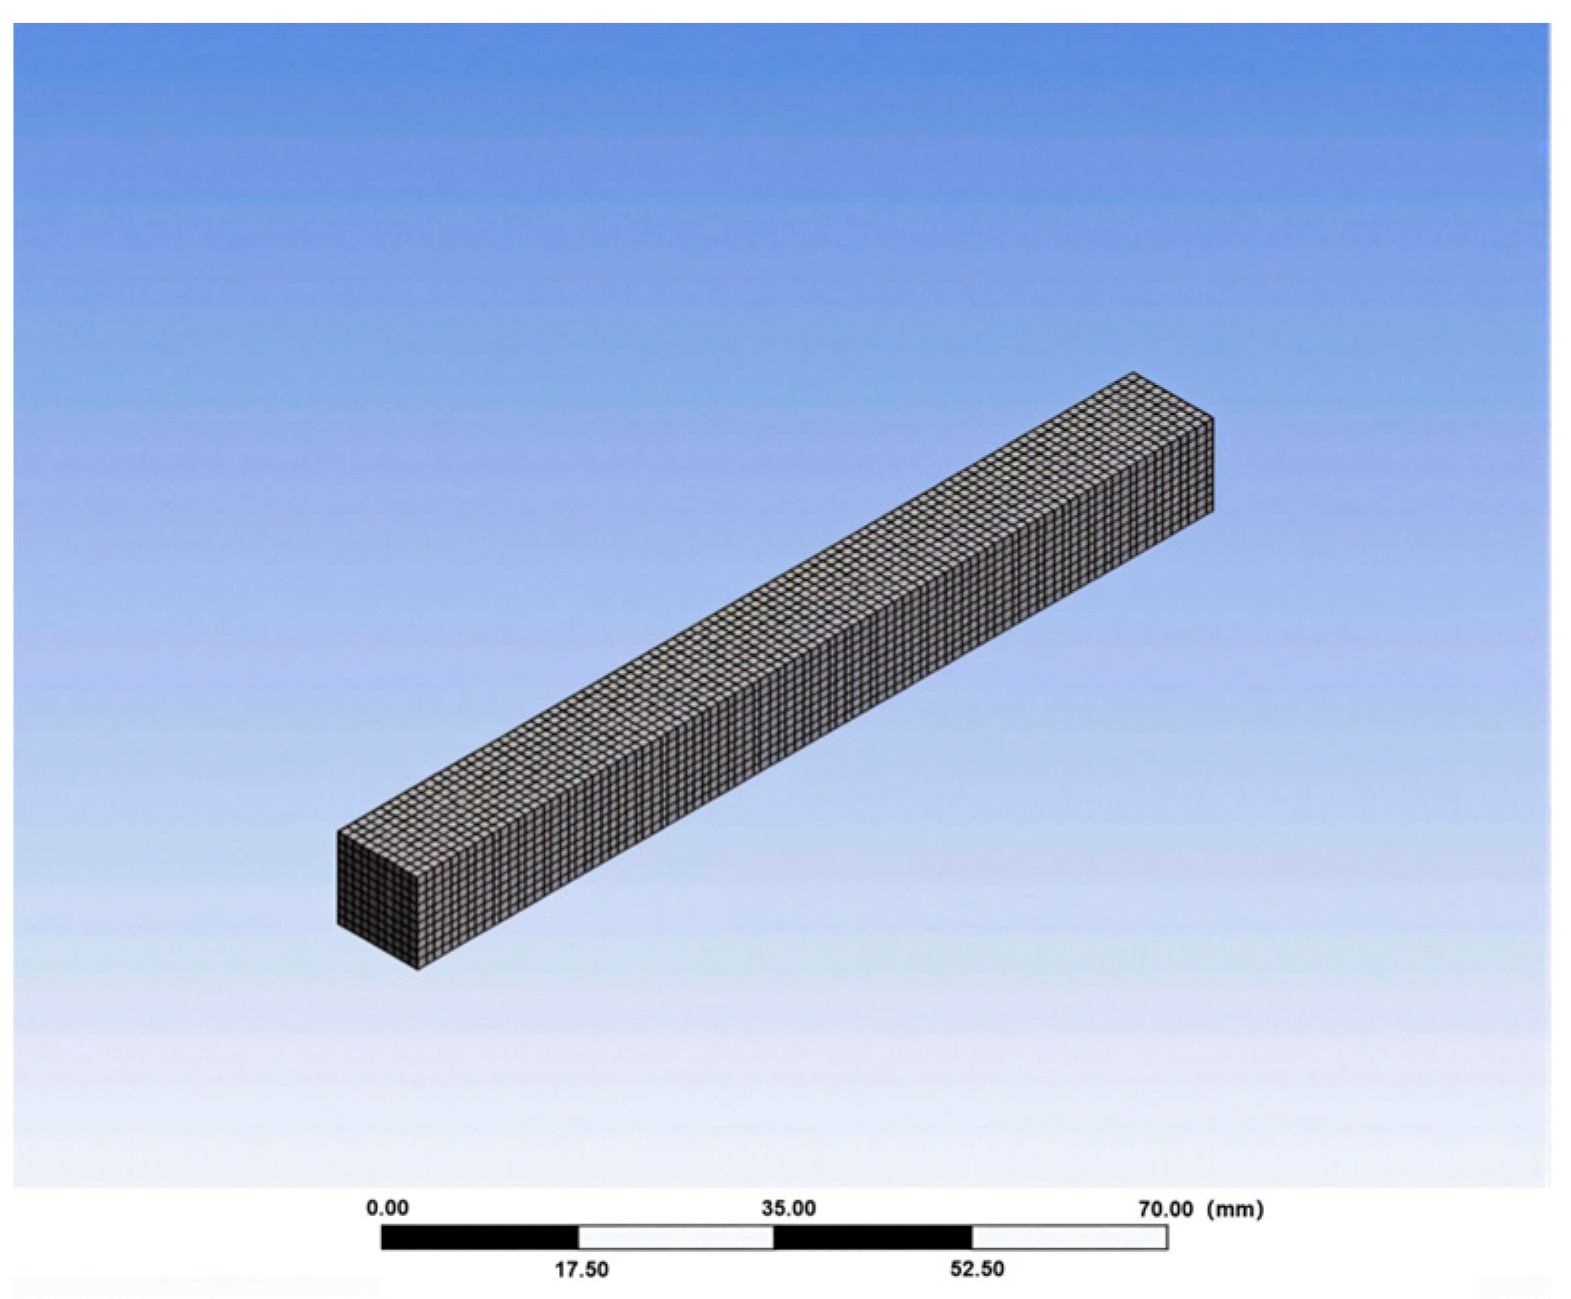
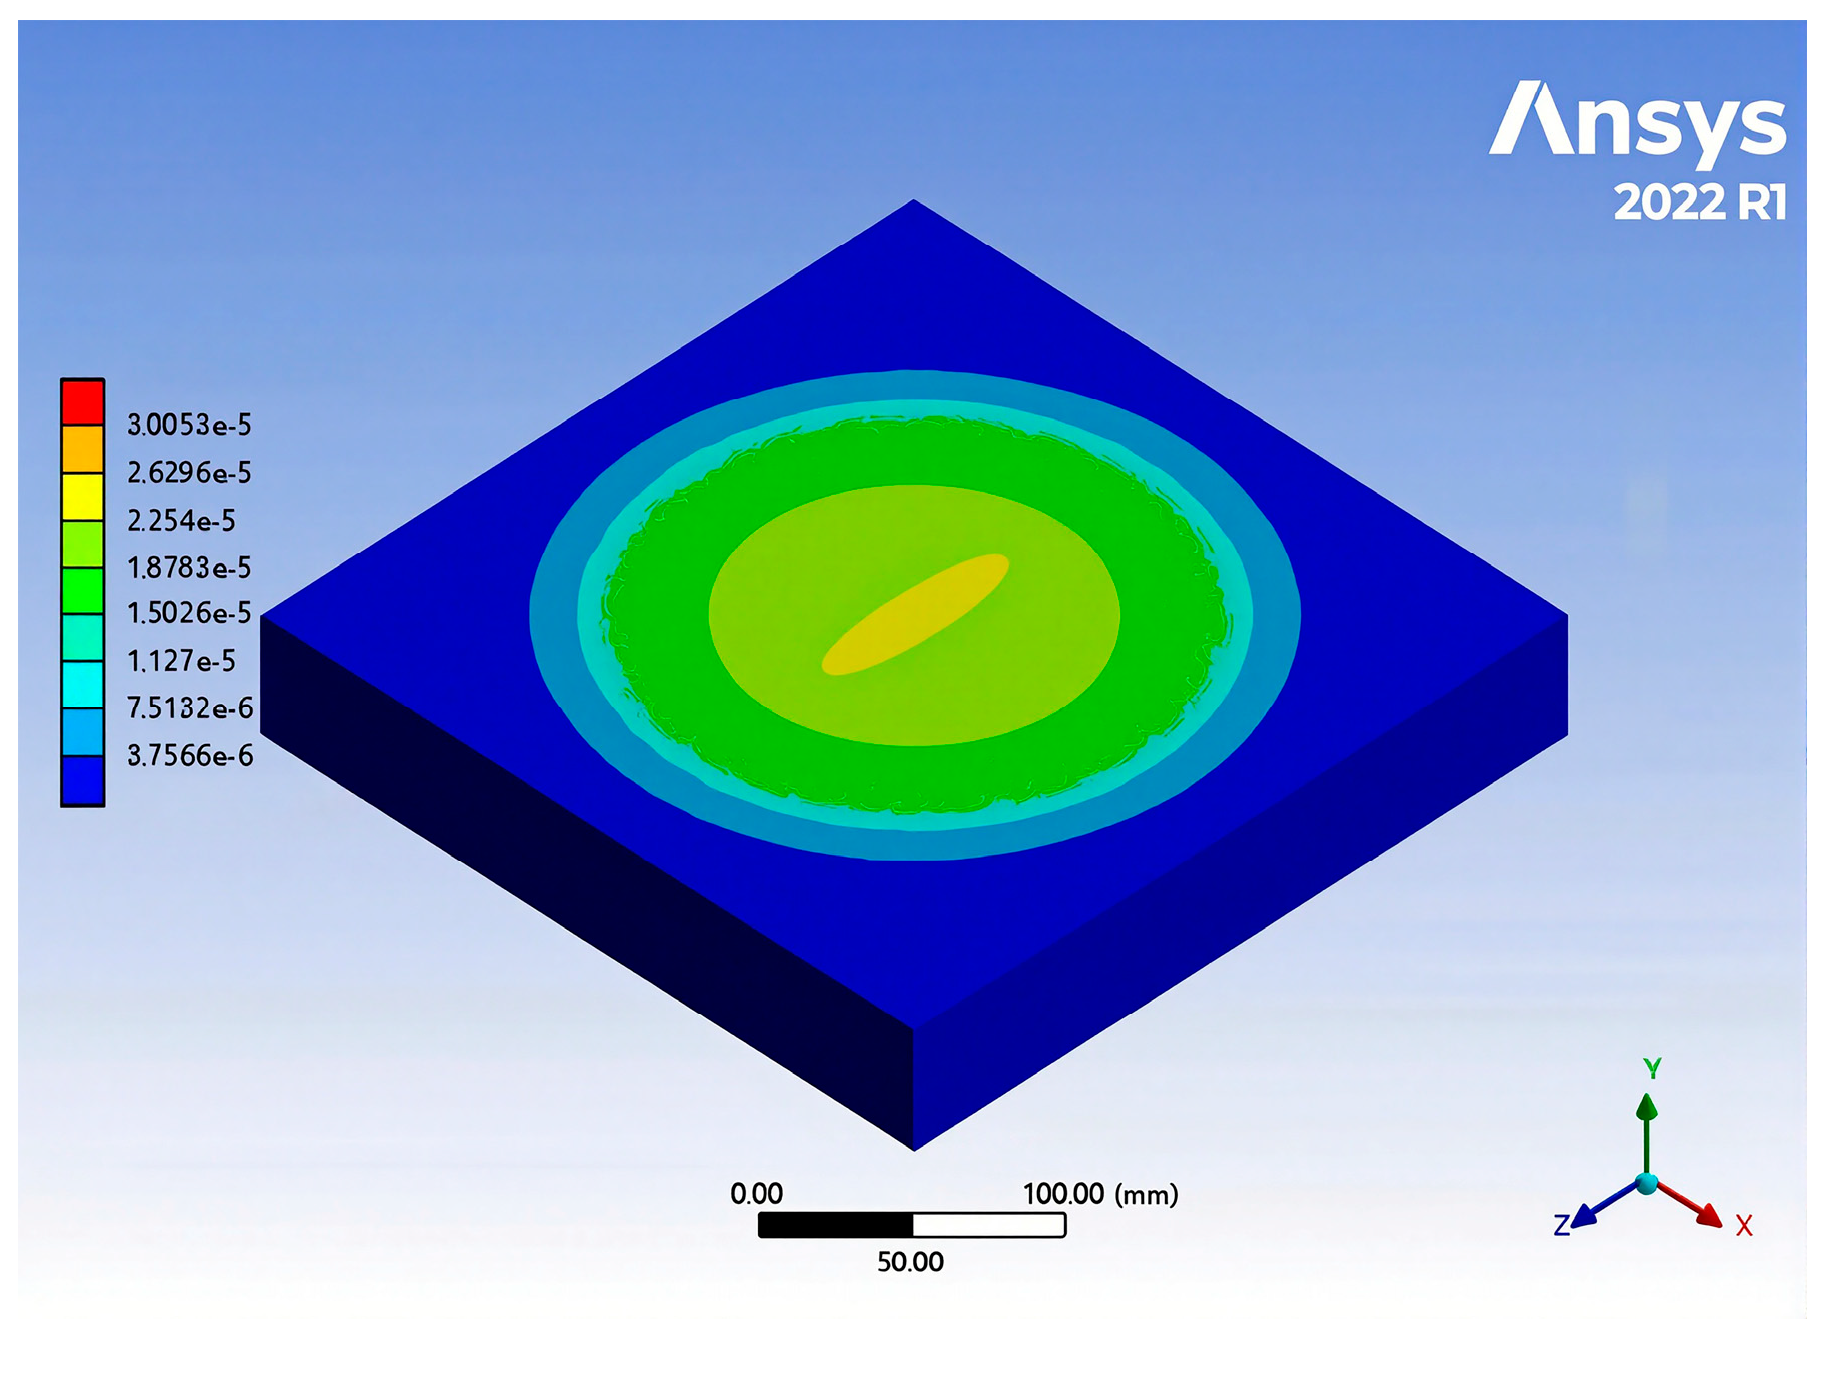
2.5.2. ANSYS Finite Element Analysis
- (1)
- Build models and set attributes
- (2)
- Meshing and adding load
- (3)
- Solution analysis
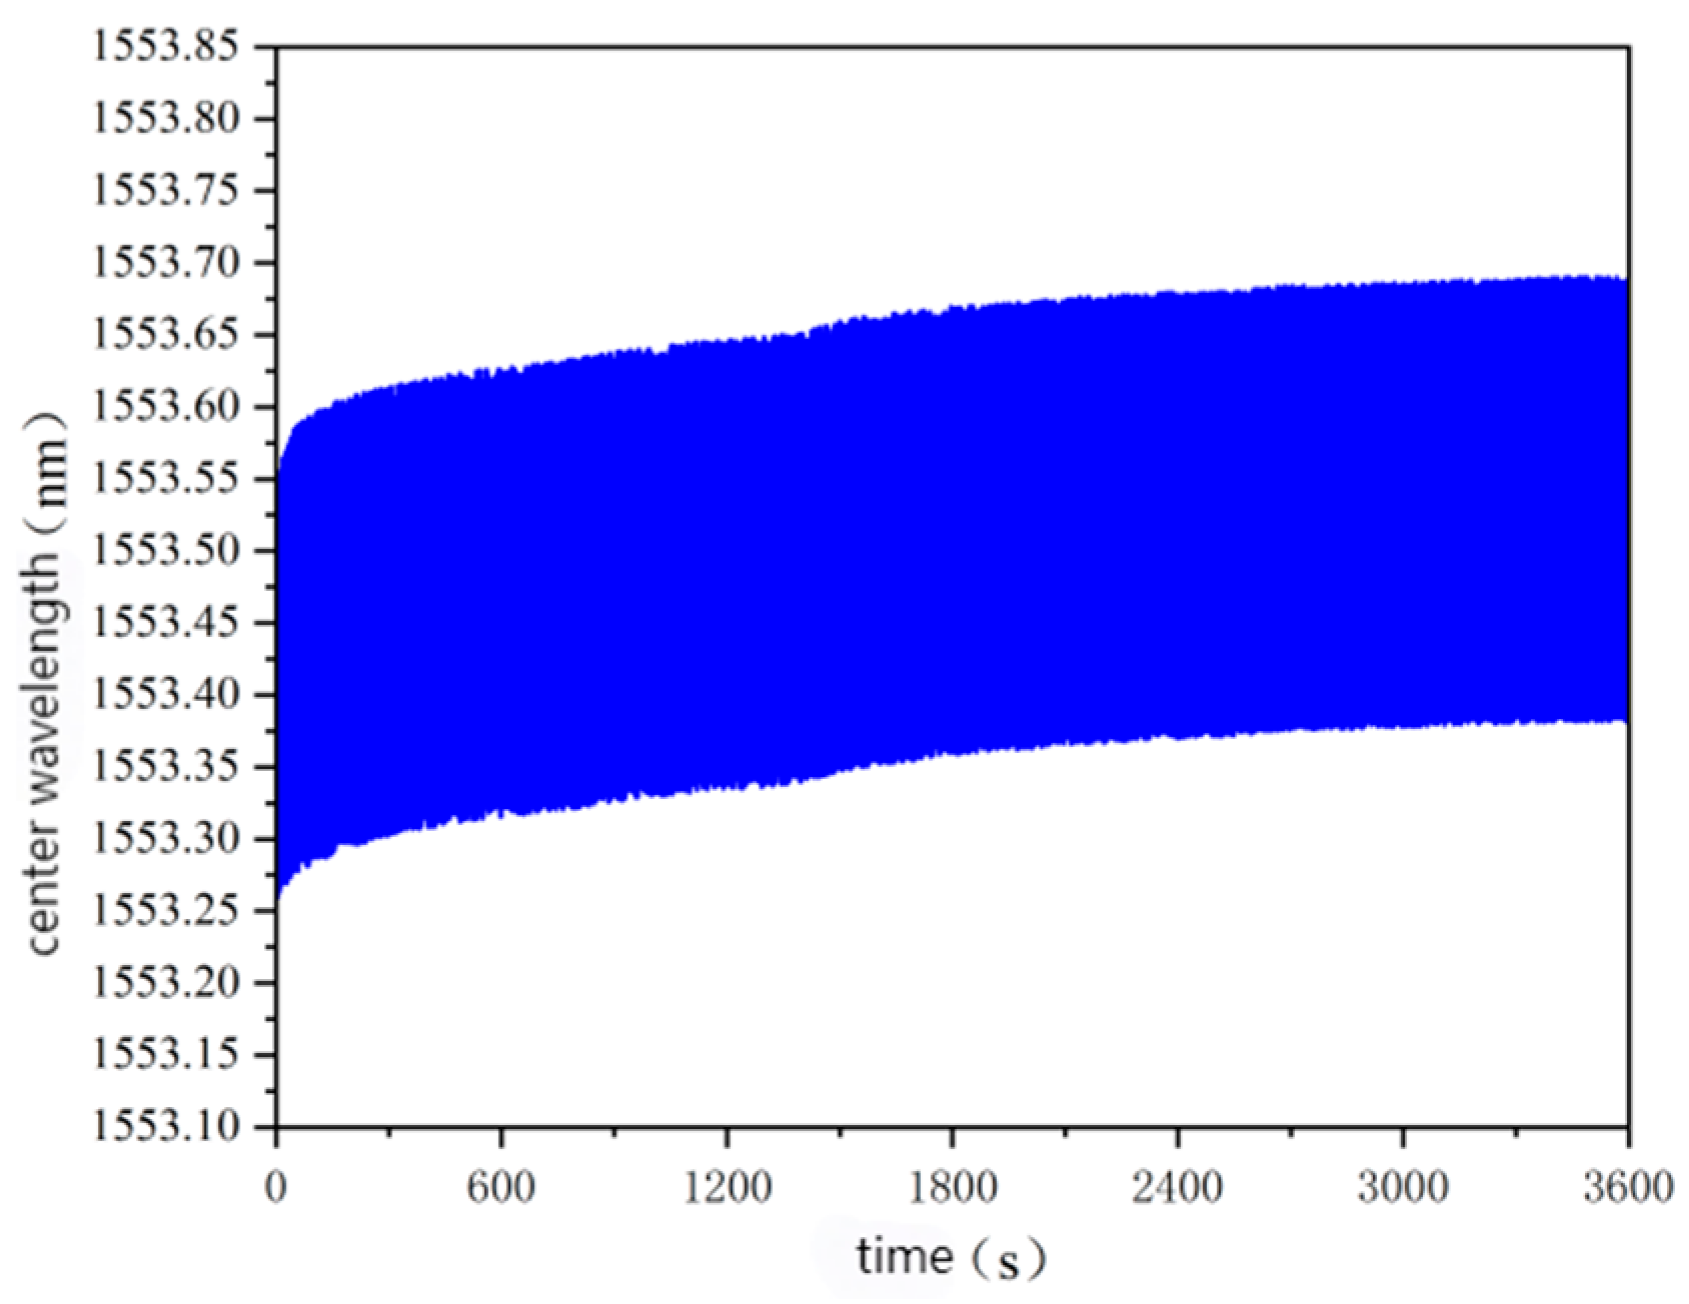
2.5.3. Dynamic Load Test Analysis
3. Conclusions
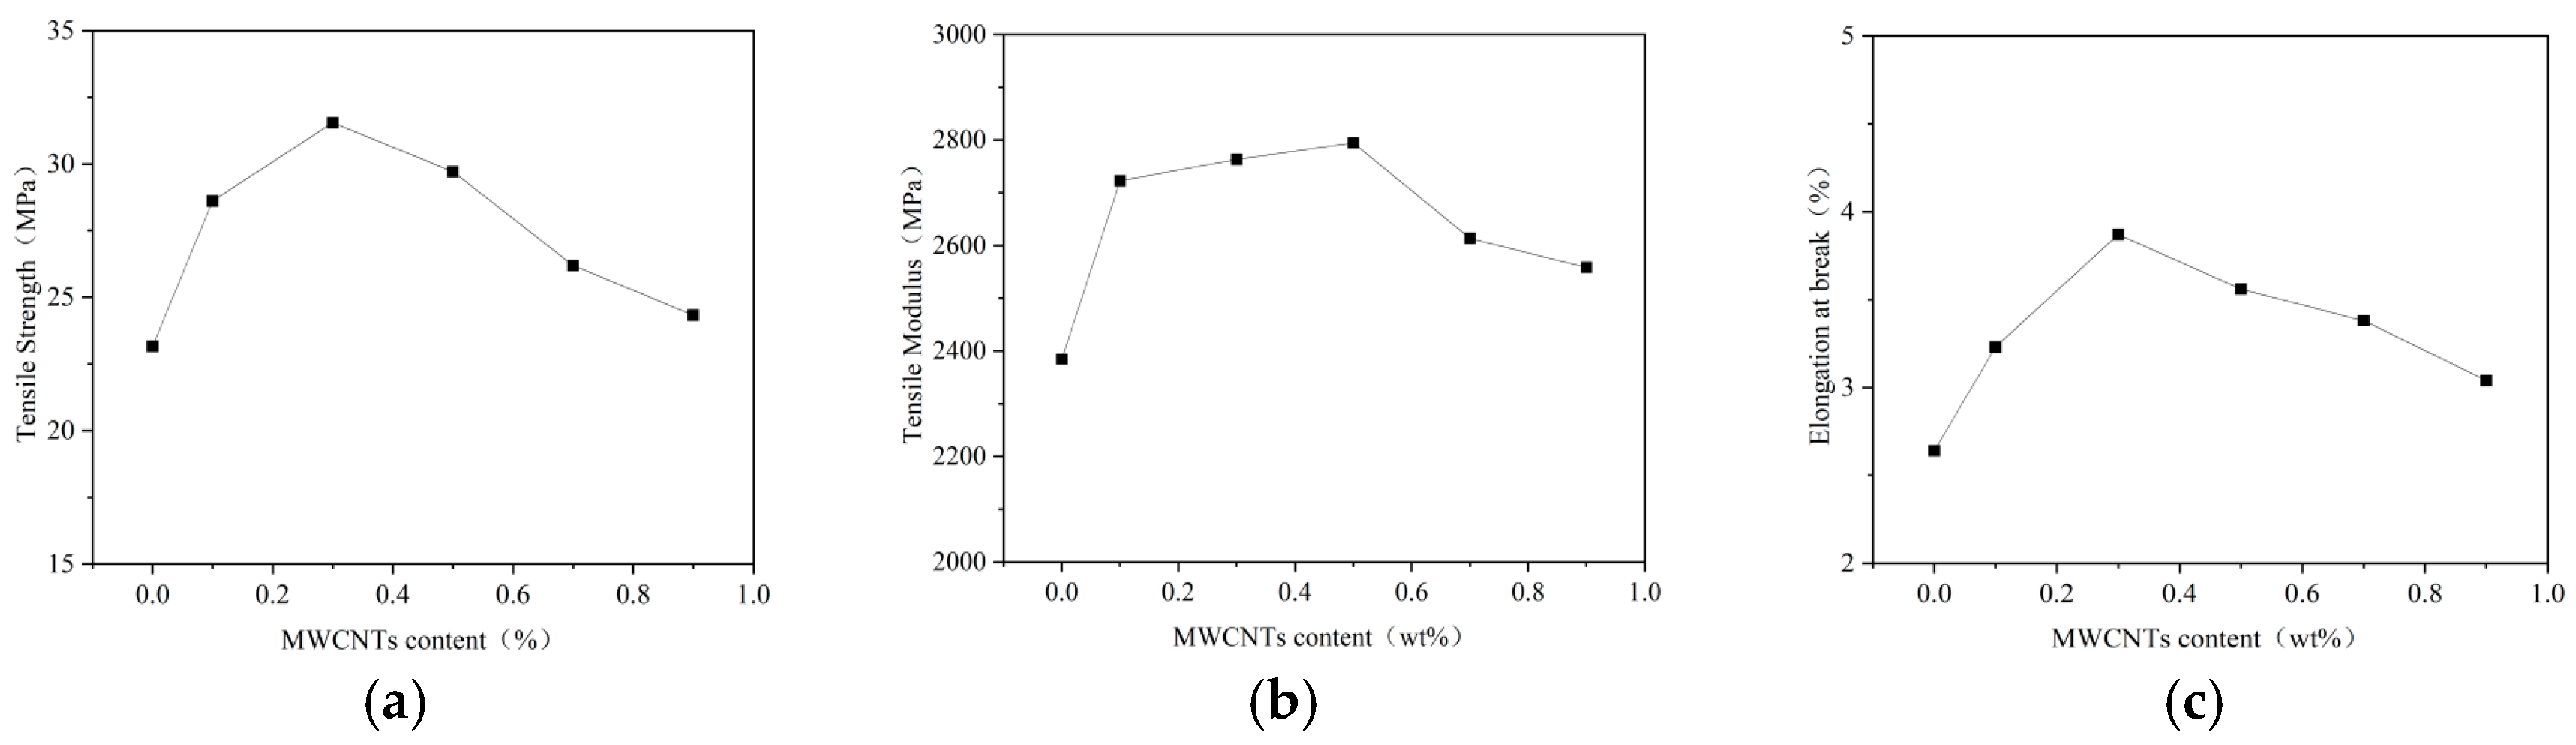
- (1)
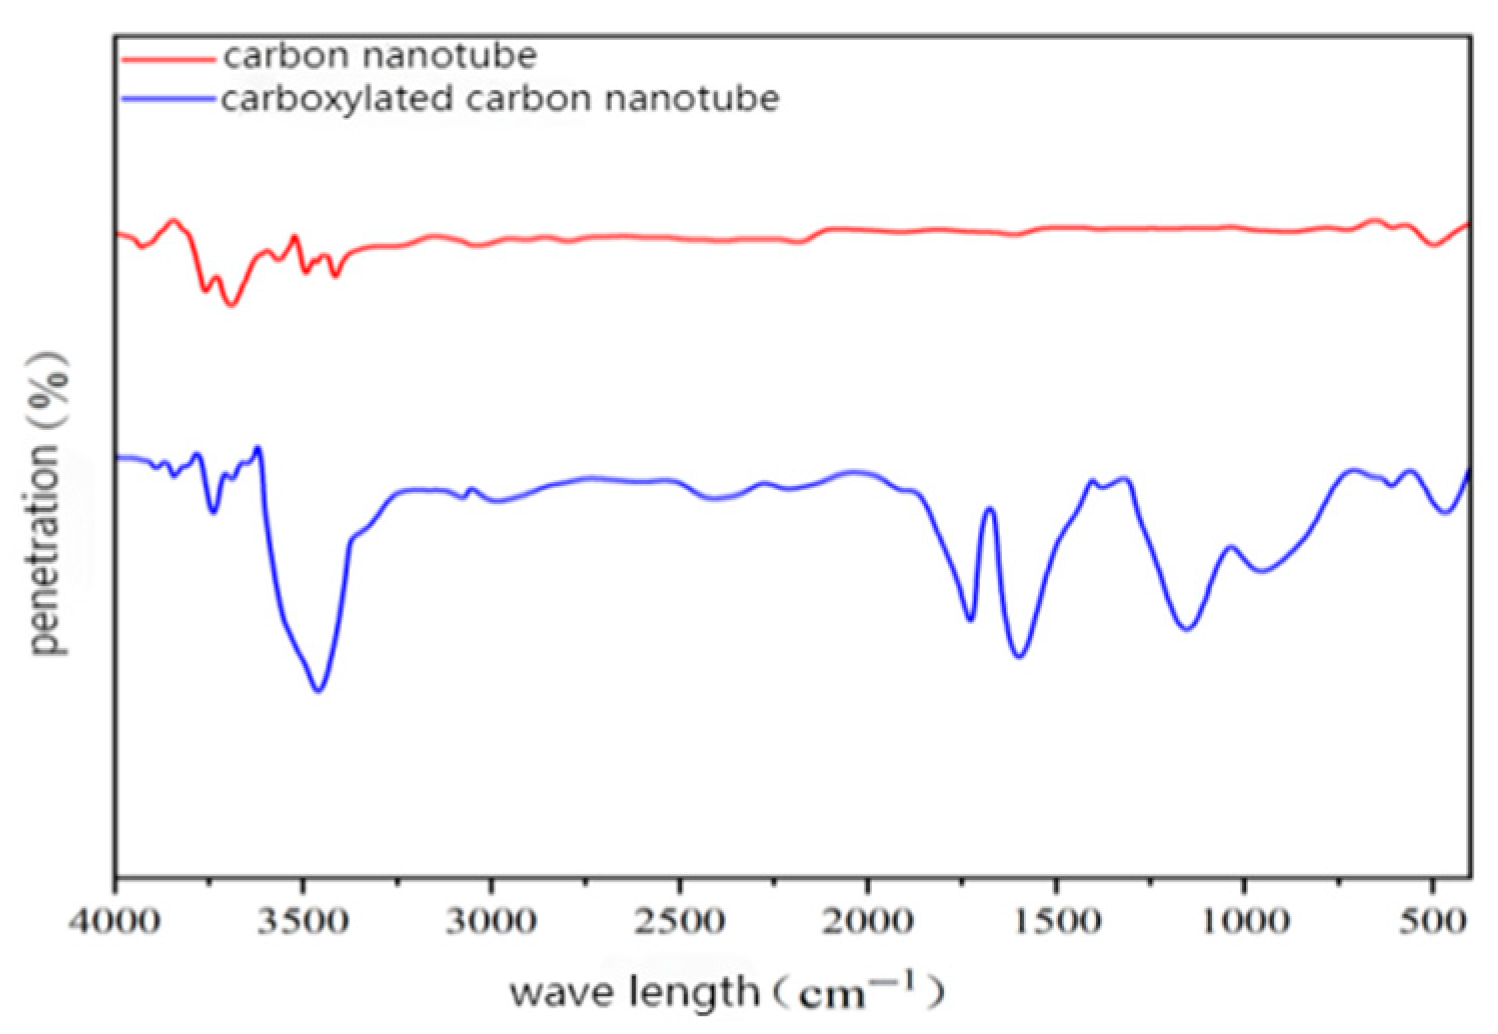
- When the content of carboxylated carbon nanotubes (CNTs) in epoxy resin (EP) was 0.3 wt%, the tensile and flexural properties of CNT/EP composites were optimal. When the content exceeded this amount, the performance showed a downward trend, indicating that 0.3 wt% is the best content. Infrared spectroscopy confirmed that carboxyl groups were successfully grafted on the surface of CNTs by the mixed acid reflux method, and the characteristic absorption peaks were located at 1200 cm−1, 1600 cm−1, 1700 cm−1, and 3450 cm−1, respectively. This modification significantly improved the dispersion and interfacial bonding strength of CNTs in EP.
- (2)
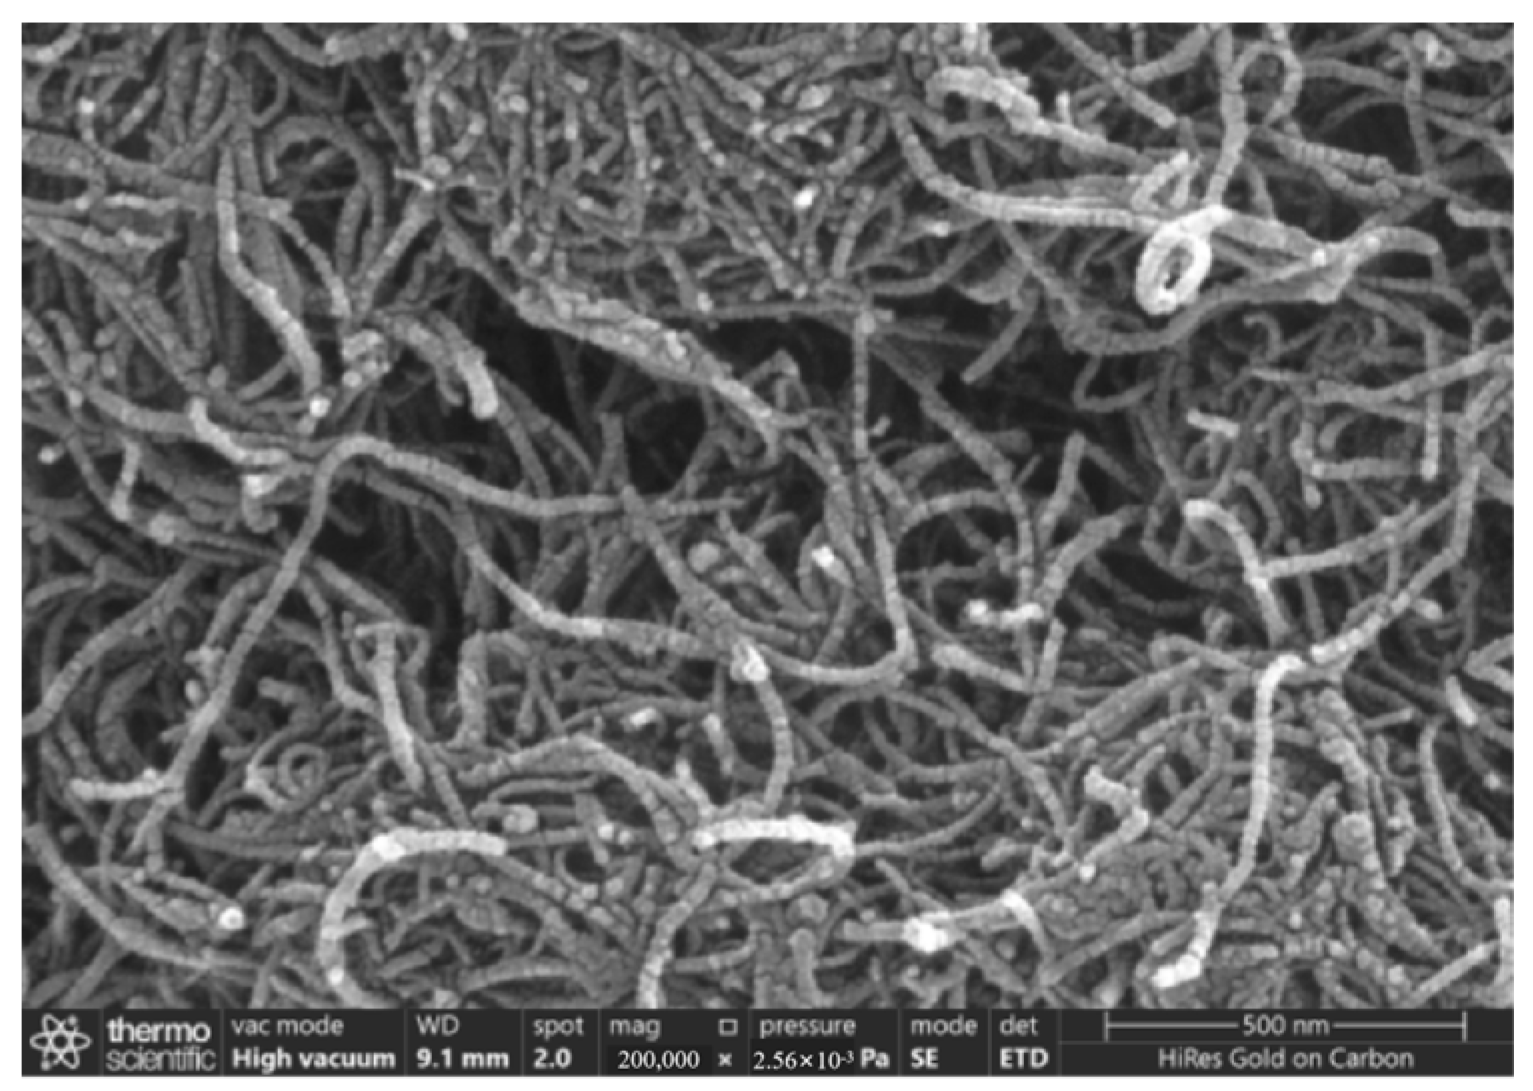
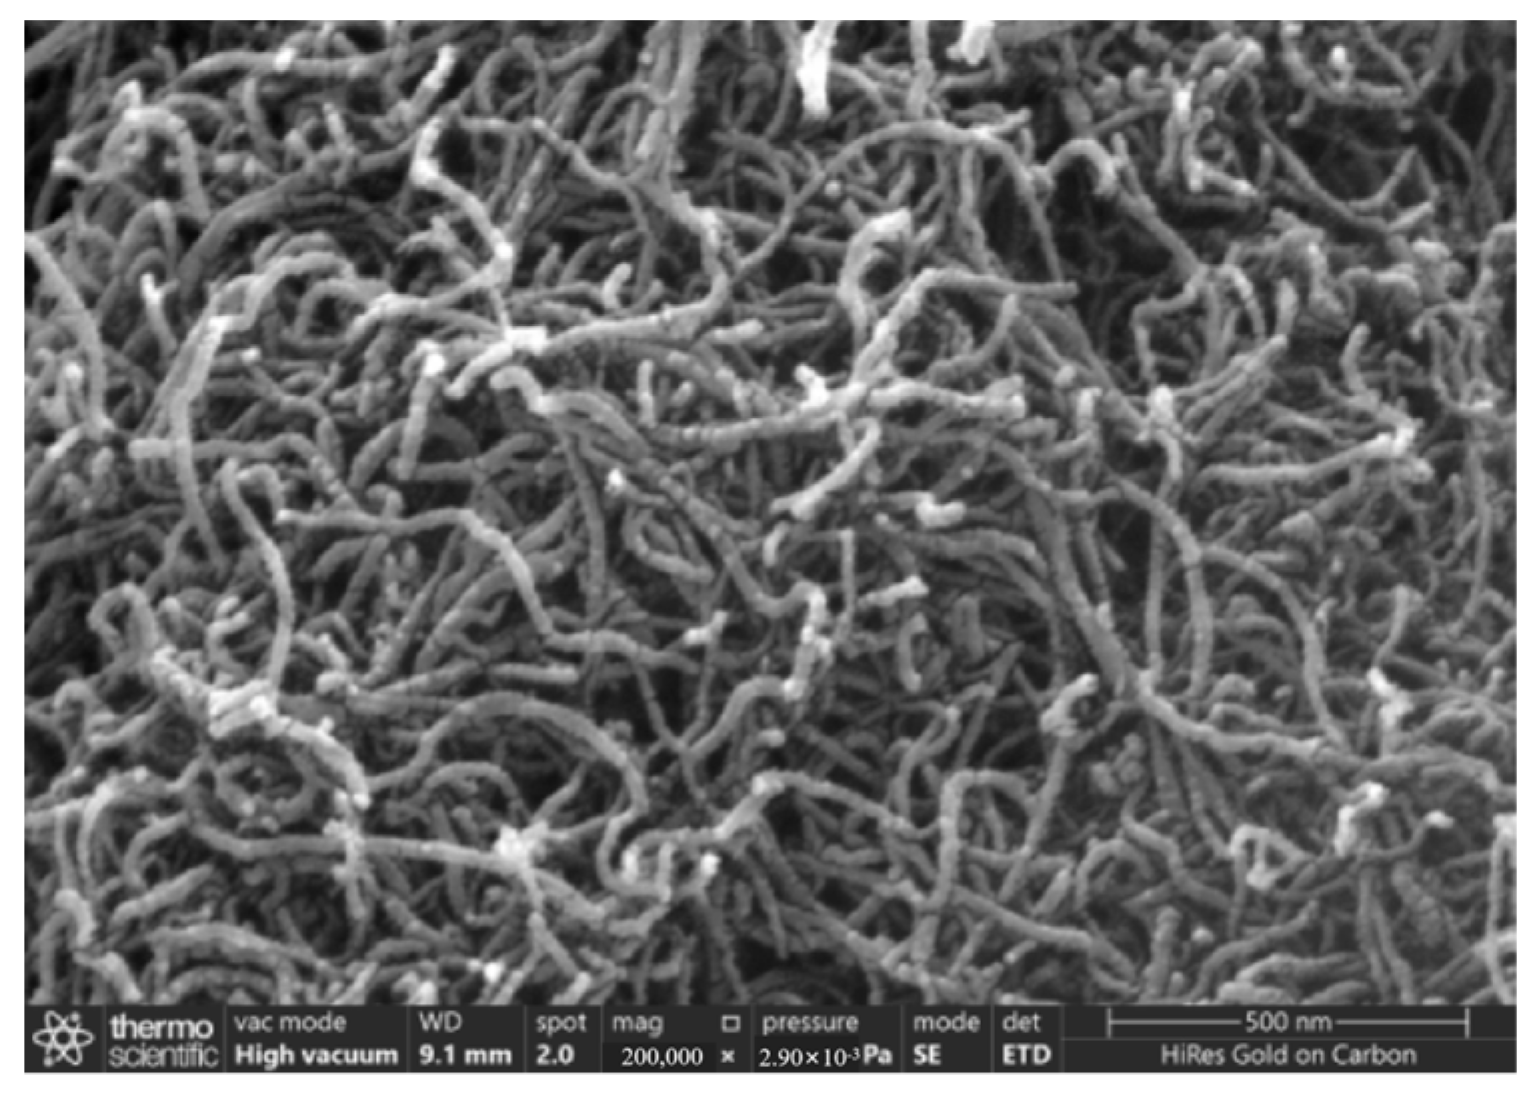
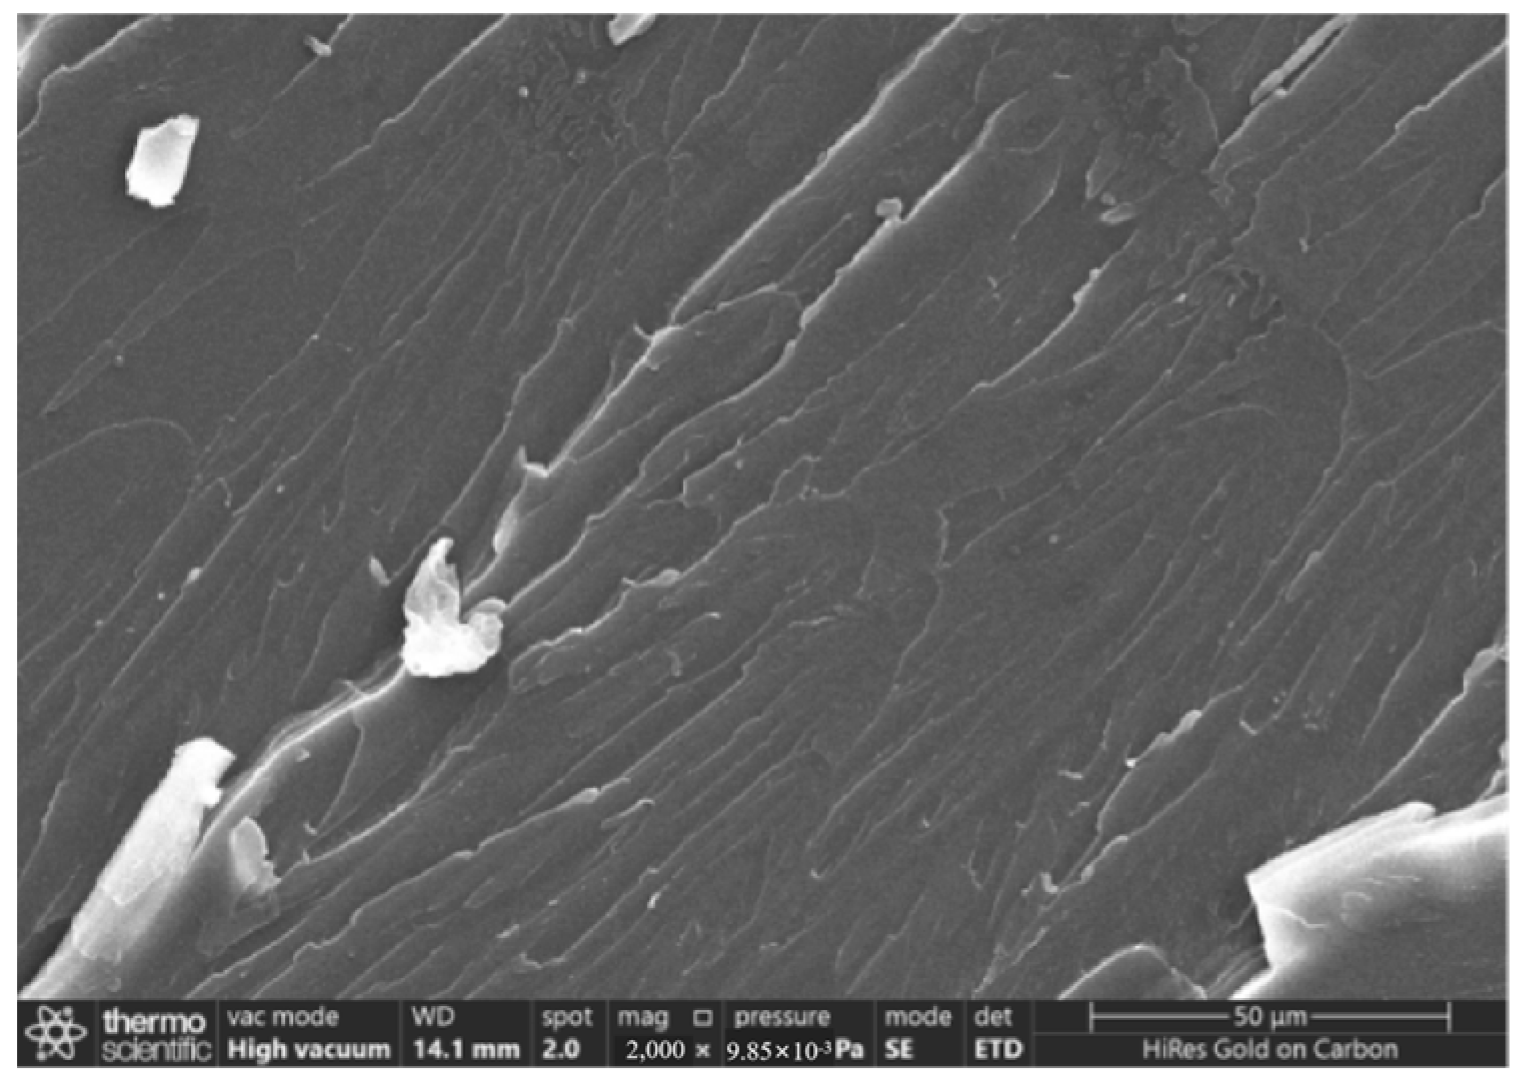
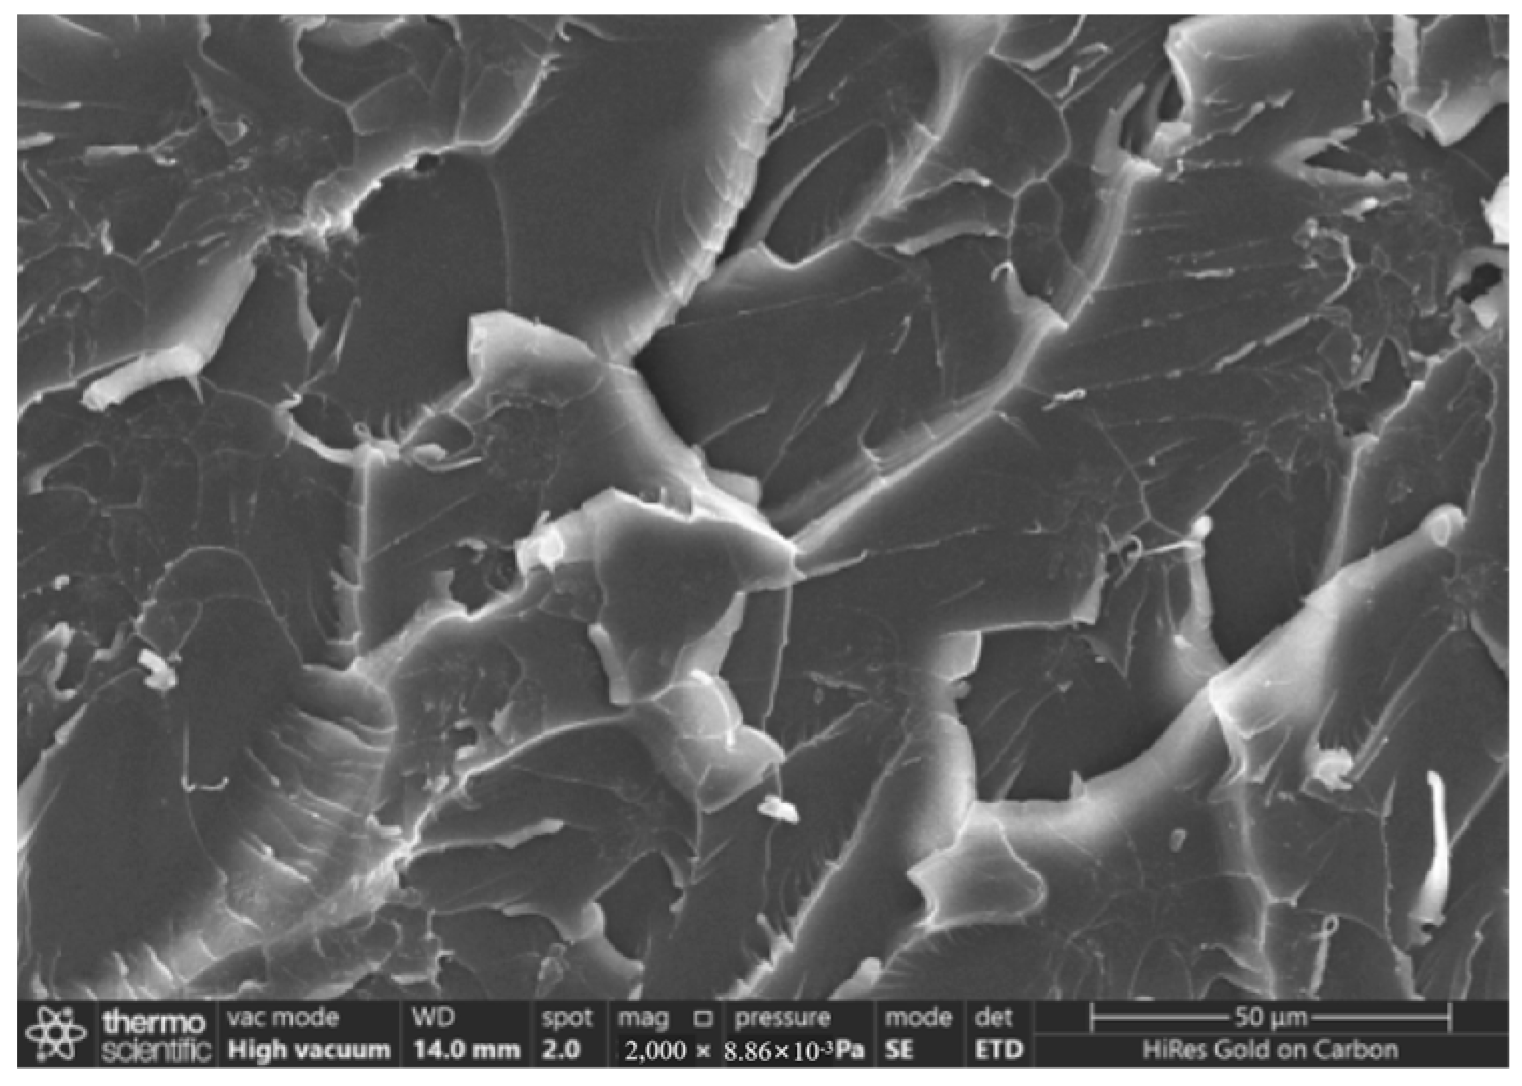
- According to scanning electron microscopy analysis, after carboxylation treatment, the agglomeration of carbon nanotubes was significantly reduced, the size of the aggregates was significantly reduced, the degree of entanglement was reduced, the arrangement between carbon nanotubes was relatively loose, and the dispersion was improved. Comparative analysis of the microstructure of the tensile fracture surface of the material was carried out. The tensile fracture surface of the composite material was rougher, and there was a large number of uneven tears and plastic deformation traces. The crack propagation path was tortuous and complex, and radial secondary cracks appeared. This indicates that the addition of carbon nanotubes can effectively bear the external applied force, absorb the energy in the fracture process, and enhance the toughness of the material.
- (3)
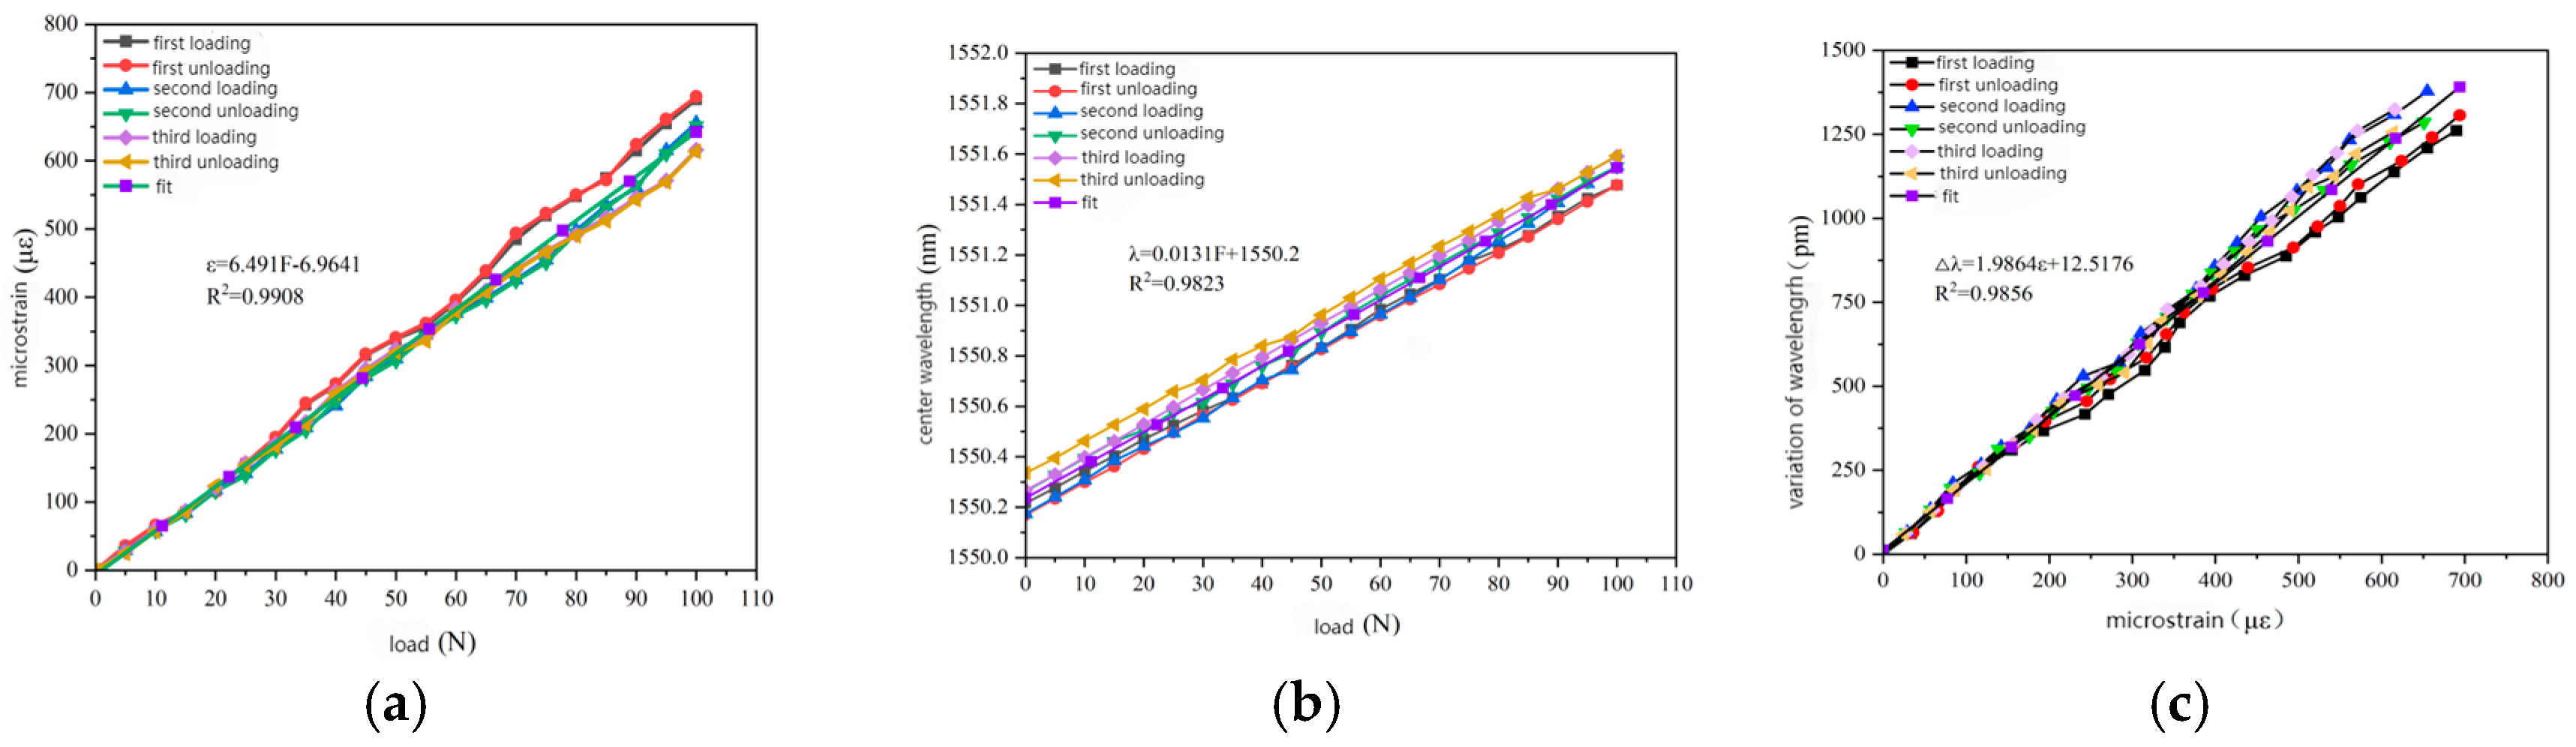
- Through the calibration test of the sensor, it can be concluded that the packaging material has good elastic behavior, good stability, and repeatability when subjected to external load and temperature changes. The strain sensitivity coefficient of the packaged FBG sensor reached 1.9864 pm/μm, which is about 1.63 times higher than that of the bare fiber. The temperature sensitivity of the sensor was 0.0383 nm/°C, which is an increase of 3.61-fold.
- (4)
- According to the analysis of the applicability of the sensor, under a certain amount of static load, the internal strain of the asphalt concrete specimen monitored by the sensor showed a corresponding linear change trend. The response trends of finite element simulation and the static load test were basically the same, verifying the effectiveness of the sensor and the accuracy of the monitoring process. Under the action of simulated wheel load, the relationship between the change in the center wavelength of the sensor and the time shows a cubic polynomial change rule, reflecting the internal strain change trend of asphalt concrete under the conditions of external wheel load.
4. Materials and Methods
4.1. Carbon Nanotubes
4.2. Epoxy Resin
4.3. Fiber Grating
4.4. Preparation of Carboxylated Carbon Nanotubes
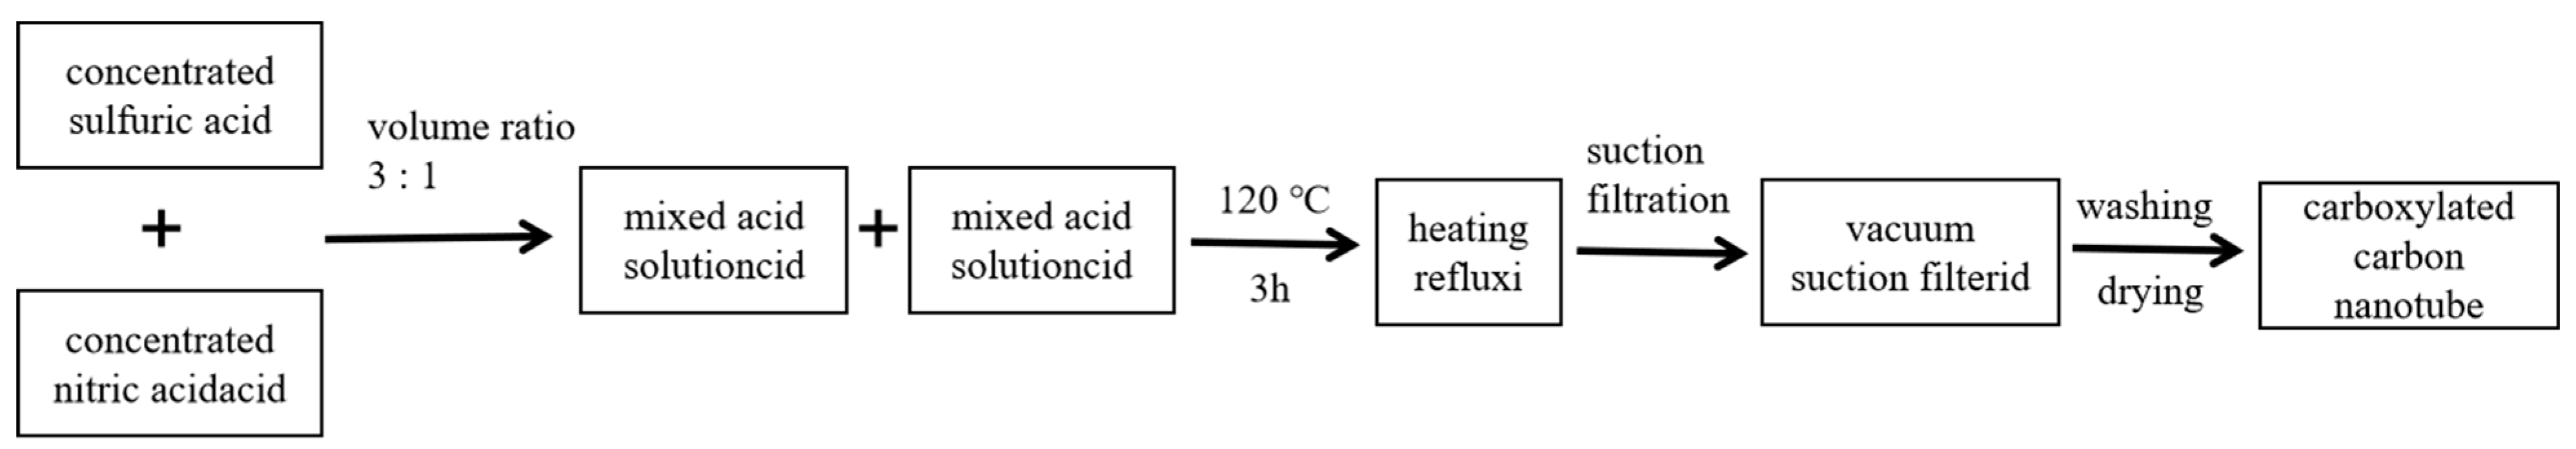
- (1)
- The mixed acid solution of concentrated sulfuric acid (H2SO4) and concentrated nitric acid (HNO3) was prepared according to a volume ratio of 3:1.
- (2)
- A certain amount of MWCNTs was placed in a clean beaker, and enough mixed acid solution was slowly added to ensure that all carbon nanotubes were completely immersed. A glass rod was used to gently stir the carbon nanotubes in the mixed acid along the wall of the beaker to initially break up the possible aggregates and ensure that the acid solution fully contacted the surface of the carbon nanotubes.
- (3)
- The whole mixture was carefully transferred into a round-bottomed flask, and the temperature was controlled by a constant-temperature heating sleeve. The mixture was continuously heated and refluxed at 120 °C for 3 h until the carbon nanotubes were fully oxidized.
- (4)
- After the reaction system was naturally cooled to room temperature, the reaction solution was diluted with deionized water to reduce the concentration of strong acid. The diluted solution was subjected to multiple suction filtration using a vacuum suction filtration device until a pure carboxylated carbon nanotube was obtained.
- (5)
- In order to ensure that the residual acid was completely removed, the modified carbon nanotubes needed to be washed repeatedly with deionized water again until the carbon nanotubes were neutral. Then, the cleaned carboxylated carbon nanotubes were transferred to the preheated oven for drying treatment.
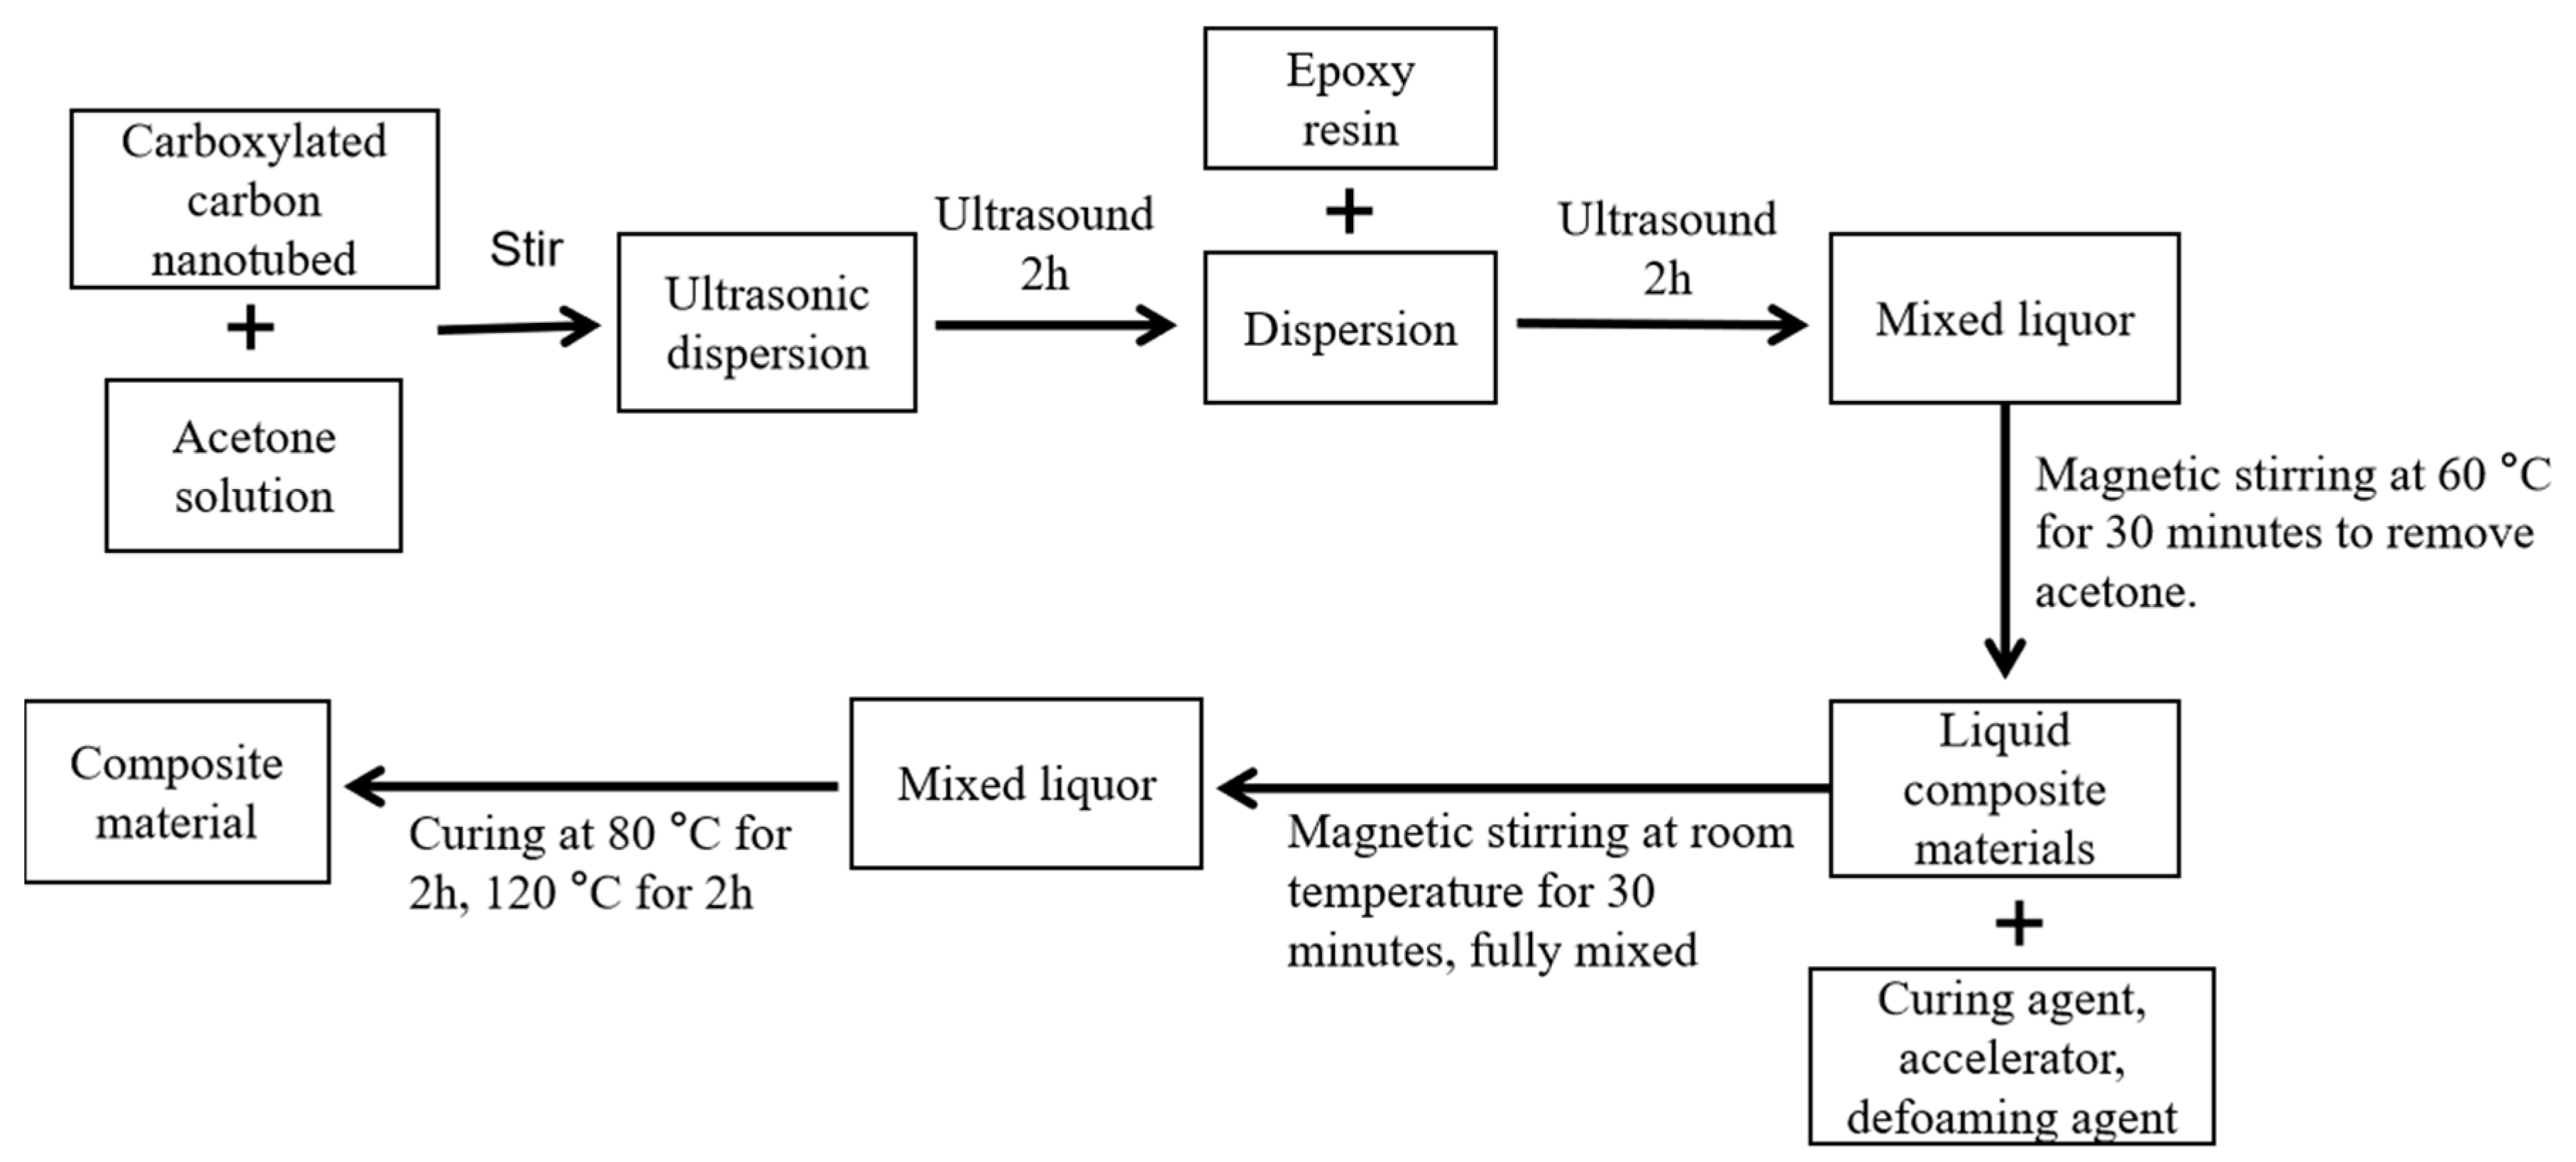
4.5. Preparation of CNT-Modified Gel Materials
- (1)
- Carbon nanotubes with different mass percentages were added to acetone solution and treated with an ultrasonic disperser for 2 h.
- (2)
- Epoxy resin was added to the dispersed solution according to the predetermined ratio, and ultrasonic dispersion was performed again for 2 h.
- (3)
- The acetone solvent in the system was removed by magnetic stirring for 30 min at 60 °C. After the mixture cooled to room temperature, the anhydride curing agent was added at a mass ratio of 100:80 (epoxy resin/curing agent), and 0.5% defoaming agent and DMP-30 accelerator were added at the same time.
- (4)
- Continuing magnetic stirring was performed for 30 min to ensure that all components were fully and evenly mixed. Then, the prepared mixed liquid was poured into the mold. According to the specific curing process, it was cured at 80 °C for 2 h, and then raised to 120 °C for 2 h to finally obtain the carboxylated carbon nanotube-reinforced epoxy resin composite sample.
4.6. Tensile and Bending Tests
4.7. Fourier Transform Infrared Spectroscopy Test
4.8. Scanning Electron Microscope Test
4.9. Packaging of Fiber Grating Sensor
- (1)
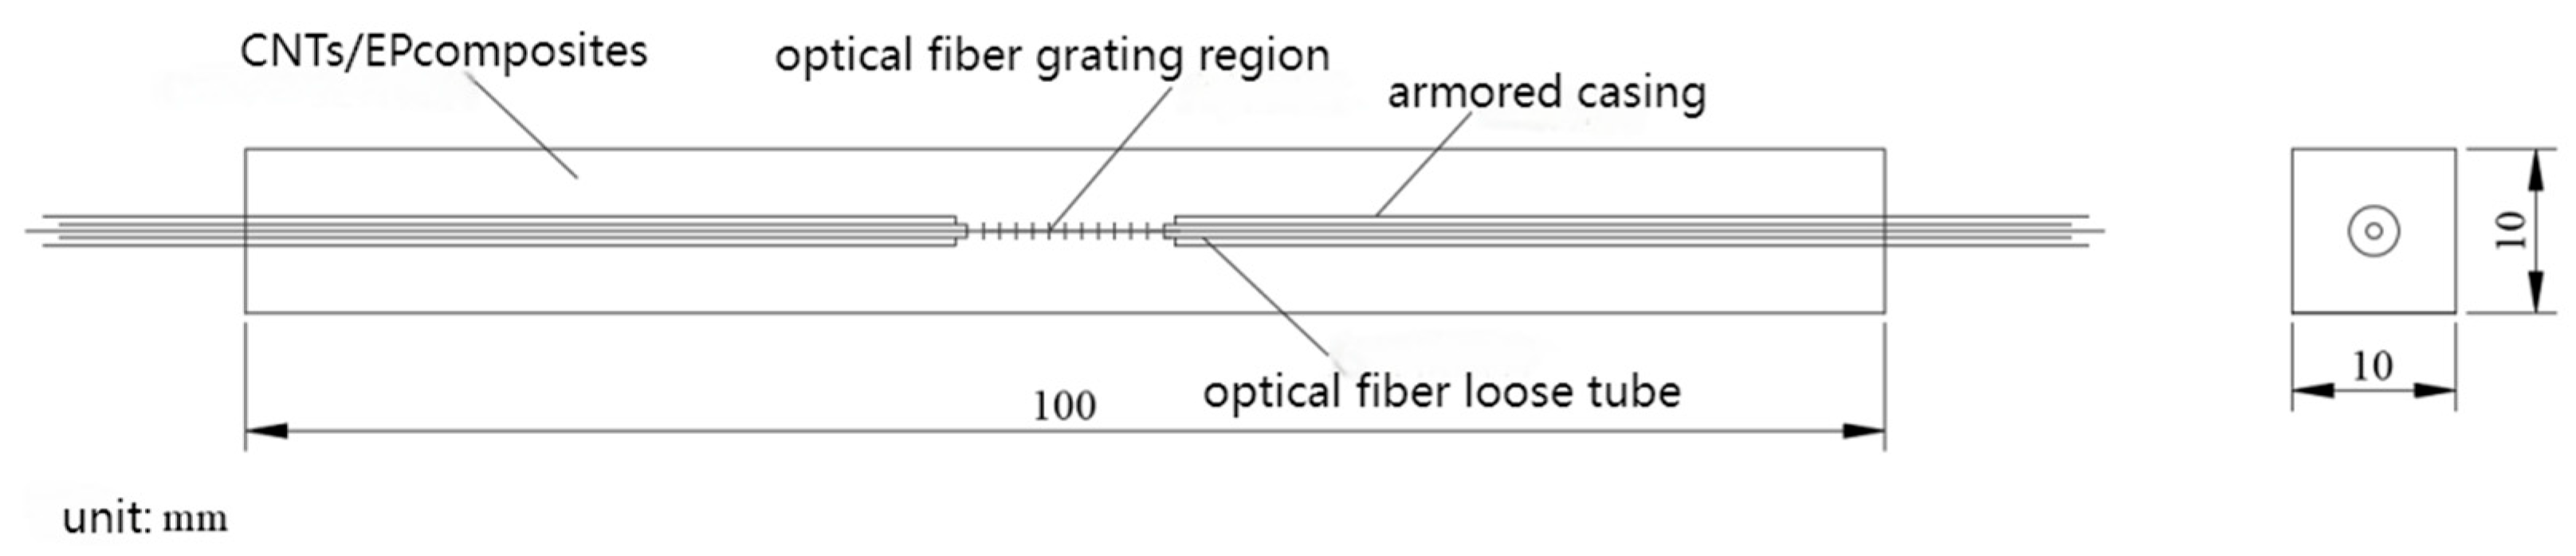
- Hytrel is a thermoplastic polyester elastomer with excellent wear resistance, chemical corrosion resistance and fatigue resistance. It can effectively protect optical fibers from the influence of the external environment and ensure that they are tightly and safely wrapped.
- (2)
- The Hytrel loose sleeves with optical fibers are further encapsulated into armored sleeves with an inner diameter of 1.1 mm. The armored sleeves are equipped with a stainless steel protective sleeve layer, which can effectively protect the optical fiber from damage in the asphalt pavement.
- (3)
- The FBG sensor is protected without affecting the accuracy of the sensor by encapsulating the fiber grating area with CNT/EP composites.
4.10. Sensor Calibration Test
4.11. Sensor Adaptability Analysis Test
Author Contributions
Funding
Institutional Review Board Statement
Informed Consent Statement
Data Availability Statement
Conflicts of Interest
References
- Lu, C.; Zhang, H.; Chen, M. Realization of high-quality development of transportation in the new era. China J. Highw. Transp. 2021, 34, 1–9. [Google Scholar]
- Ou, J.; Zhang, J.; Duan, B.; Jiang, C.; Wang, X. Progress in research on asphalt pavement maintenance decision-making technology. J. Beijing Univ. Technol. 2024, 50, 1–12. [Google Scholar]
- Zhou, Y.; Guo, X.; Hou, F.; Wu, J. Review of intelligent road defects detection technology. Sustainability 2022, 14, 6306. [Google Scholar] [CrossRef]
- Ding, B.; Zhao, Q.; Chen, D.; Du, D. Technology and application progress of fiber bragg grating pressure sensing. Study Opt. Commun. 2024, 50, 75–86. [Google Scholar]
- Feng, D.; Luo, X.; Fan, W.; Qiao, X. Strain sensing performance of material packaged fiber bragg grating in wide temperature range. Acta Opt. Sin. 2021, 41, 88–95. [Google Scholar]
- Meng, S.; Sun, Y.; Wang, M. Fiber Bragg grating sensors for subgrade deformation monitoring in seasonally frozen regions. Struct. Control Health Monit. 2020, 27, 2472. [Google Scholar] [CrossRef]
- Liu, H.; Ge, W.; Pan, Q.; Hu, R.; Lv, S.; Huang, T. Characteristics and analysis of dynamic strain response on typical asphalt pavement using Fiber Bragg Grating sensing technology. Constr. Build. Mater. 2021, 310, 125242. [Google Scholar] [CrossRef]
- Liao, M.; Sheng, L.; Luo, R.; Chen, Y. The moving load identification method on asphalt roads based on the BP neural network and FBG sensor monitoring. Constr. Build. Mater. 2023, 378, 131216. [Google Scholar] [CrossRef]
- Chen, Q.; Ge, T.; Li, X.; Li, X.; Wang, C. Road area pollution cleaning technology for asphalt pavement: Literature review and research propositions. J. Clean. Prod. 2025, 493, 144975. [Google Scholar] [CrossRef]
- Li, J.; Zhu, W.; Ren, J.; Li, Z.; Ding, G. Research on concrete cracks damage based on FBG sensing technology. Transducer Microsyst. Technol. 2025, 44, 17–20. [Google Scholar]
- Shi, Q.; Zhan, H.; Mo, R.; Wang, J. High-strength and toughness carbon nanotube fiber/resin composites by controllable wet-stretching and stepped pressing. Carbon 2022, 189, 1–9. [Google Scholar] [CrossRef]
- Chen, Q.; Lan, X.; Li, A.; Sun, X.; Wang, C. The novel rapid curing pavement maintenance seal with a low environmental impact: Preparation and performance evaluation. Wear 2025, 566, 205919. [Google Scholar] [CrossRef]
- Wang, C.; Lan, X.; Cong, Y.; Peng, S.; Huang, S.; Chen, Q. Evaluation of skid resistance of pavement maintenance energy-absorbing seal based on surface texture characteristics. Measurement 2025, 245, 116588. [Google Scholar] [CrossRef]
- Song, X.; Gao, J.; Zheng, N.; Zhou, H.; Mai, Y.-W. Interlaminar toughening in carbon fiber/epoxy composites interleaved with CNT-decorated polycaprolactone nanofibers. Compos. Commun. 2021, 24, 100622. [Google Scholar] [CrossRef]
- Chen, Z.; Luo, J.; Huang, Z.; Cai, C.; Tusiime, R.; Li, Z.; Wang, H.; Cheng, C.; Liu, Y.; Sun, Z.; et al. Synergistic toughen epoxy resin by incorporation of polyetherimide and amino groups grafted MWCNTs. Compos. Commun. 2020, 21, 100377. [Google Scholar] [CrossRef]
- Xin, X.; Liang, M.; Yao, Z.; Su, L.; Zhang, J.; Li, P.; Sun, C.; Jiang, H. Self-sensing behavior and mechanical properties of carbon nanotubes/epoxy resin composite for asphalt pavement strain monitoring. Constr. Build. Mater. 2020, 257, 119404. [Google Scholar] [CrossRef]
- Li, S.; Yao, Y. Synergistic improvement of epoxy composites with multi-walled carbon nanotubes and hyperbranched polymers. Compos. Part B Eng. 2019, 165, 293–300. [Google Scholar] [CrossRef]
- Fan, Z.; Wang, C.; Wang, Z.; Li, Y.; Feng, L.; Tan, S. Fog seal with polymer composite modified emulsified asphalt: Road performance and environmental adaptability. Wear 2025, 562, 205672. [Google Scholar] [CrossRef]
- Peng, L.; Fu, Q.; Li, Z.; Lin, M.; Qian, Y.; Kong, X. Research progress in environmentally friendly epoxy resin materials. Insul. Mater. 2024, 57, 1–16. [Google Scholar]
- Zeng, L.; Li, R.; Chen, Y. Tensile test and finite element simulation of carbon nanotube/epoxy resin composites. J. Compos. 2024, 41, 2909–2922. [Google Scholar]
- Lv, H.; Zhong, W.; Qin, L.; Zhang, K. Characteristics of polymer-encapsulated fiber grating pressure sensors. Laser 2020, 41, 63–67. [Google Scholar]
- Huang, L.Q.; Xiong, L.; Guo, Y.X.; Hu, Z.C. All-Silicon Packaging Technology for Fiber Bragg Gratings and Its Application in Tilt Sensor. IEEE Sens. J. 2023, 22, 22627–22636. [Google Scholar] [CrossRef]
- Luo, H.; Lei, C.; Li, R.; Zhang, S.; Zhang, J.; Xiao, C.; Wang, D. Study on the effect of packaging adhesive materials on the performance of high temperature pressure sensors. J. Test Meas. Technol. 2025, 39, 27–32+95. [Google Scholar]
- GB/T1040.1-2018; Plastics—Determination of Tensile Properties—Part 1: General Principle. Standards Press of China: Beijing, China, 2018.
- GB/T 9341-2008; Plastics—Determination of Flexural Properties. Standards Press of China: Beijing, China, 2018.
- JTG E20-2011; Standard Test Methods of Bitumen and Bituminous Mixtures for Highway Engineering. China Communications Press: Beijing, China, 2011.
- JTG 3432-2024; Test Methods of Aggregate for Highway Engineering. China Communications Press: Beijing, China, 2024.


Disclaimer/Publisher’s Note: The statements, opinions and data contained in all publications are solely those of the individual author(s) and contributor(s) and not of MDPI and/or the editor(s). MDPI and/or the editor(s) disclaim responsibility for any injury to people or property resulting from any ideas, methods, instructions or products referred to in the content. |
© 2025 by the authors. Licensee MDPI, Basel, Switzerland. This article is an open access article distributed under the terms and conditions of the Creative Commons Attribution (CC BY) license (https://creativecommons.org/licenses/by/4.0/).
Share and Cite
Guo, T.; Guo, X.; Chen, Y.; Fang, C.; Yang, J.; Li, Z.; Feng, J.; Kong, J.; Chen, H.; Wang, C.; et al. Study on the Adaptability of FBG Sensors Encapsulated in CNT-Modified Gel Material for Asphalt Pavement. Gels 2025, 11, 590. https://doi.org/10.3390/gels11080590
Guo T, Guo X, Chen Y, Fang C, Yang J, Li Z, Feng J, Kong J, Chen H, Wang C, et al. Study on the Adaptability of FBG Sensors Encapsulated in CNT-Modified Gel Material for Asphalt Pavement. Gels. 2025; 11(8):590. https://doi.org/10.3390/gels11080590
Chicago/Turabian StyleGuo, Tengteng, Xu Guo, Yuanzhao Chen, Chenze Fang, Jingyu Yang, Zhenxia Li, Jiajie Feng, Jiahua Kong, Haijun Chen, Chaohui Wang, and et al. 2025. "Study on the Adaptability of FBG Sensors Encapsulated in CNT-Modified Gel Material for Asphalt Pavement" Gels 11, no. 8: 590. https://doi.org/10.3390/gels11080590
APA StyleGuo, T., Guo, X., Chen, Y., Fang, C., Yang, J., Li, Z., Feng, J., Kong, J., Chen, H., Wang, C., Chen, Q., & Wang, J. (2025). Study on the Adaptability of FBG Sensors Encapsulated in CNT-Modified Gel Material for Asphalt Pavement. Gels, 11(8), 590. https://doi.org/10.3390/gels11080590