Article

Capacity Allocation of Game Tickets Using Dynamic Pricing

by
Aniruddha Dutta
1,2
1
Haas School of Business, University of California, Berkeley, CA 94704, USA
2
Smith School of Business, Queen’s University, Kingston, ON K7L 3N6, Canada
Data 2019, 4(4), 141; https://doi.org/10.3390/data4040141
Submission received: 26 August 2019 / Revised: 17 October 2019 / Accepted: 17 October 2019 / Published: 18 October 2019

Abstract

:
This study examines a pricing approach that is applicable in the field of online ticket sales for game tickets. The mathematical principle of dynamic programing is combined with empirical data analysis to determine demand functions for university football game tickets. Based on the calculated demand functions, the application of DP strategies is found to generate more revenues than a fixed price strategy. The other important result is the capacity distribution of tickets according to the football game intensity. Prior studies have shown that it is sometimes more profitable or football clubs to allocate a share of tickets to a retailer and earn a commission based on the sales, rather than selling the entire capacity of tickets by itself. This paper finds that in a high intensity game, where the demand is generally high, it is optimal for the club to sell all tickets by itself. Whereas, for less popular games, where there is considerable fluctuation in demand, the capacity allocation problem for maximized revenues from ticket sales, becomes a harder optimization challenge for the club. According to DP optimization, when the demand for tickets is relatively low, it is optimal for the club to retain 20–40% of the tickets and the rest of the capacity should be sold to online retailers. In the real world, this pricing technique has been used by football clubs and thus the secondary market online retailers like Ticketmaster and Vivid Seats have become popular in the last decade.

1. Introduction

With improving computing processing power, companies increasingly use data analytics for decision making [1] rather than relying on a leader’s or manager’s “gut instinct”. Organizations process extensive data to gain customer insights, propagate knowledge to their consumers and examine current trends to compete for customer’s share of wallet. The data revolution in the last decade [2,3] has given rise to numerous new fields of research in big data and machine learning, rendering companies more profitable. Companies prioritize means to leverage machine learning and optimization techniques for developing dynamic and effective pricing methodologies for decision making.
Data centric optimization of ticket pricing has improved revenue for football teams over the last decade [4]. Sports demand has been researched in detail in the field of sports economics [5,6,7] where previous research has shown that ticket price has a negative effect on stadium attendance. Thus, sports managers usually set ticket prices in the inelastic portion of the demand curve and try to optimize overall revenues from different sources including concessions, rental/lease and parking [8]. Krautmann and Berri (2007) [9] surveyed several empirical papers on estimated price elasticities of demand for sporting events; the estimates, collectively representing five different sports leagues, range in value from highly inelastic (−0.06) to marginally inelastic (−0.93). Chang et al. (2016) [10] recognized the intertemporal nature of demand for a sports match and concluded that a forward-looking, profit-maximizing team prices along the inelastic portion of its static demand curve and importantly, this same price falls along the elastic portion of the firm’s (empirically unobserved) dynamic demand curve.
Dynamic Pricing (DP) is an optimization algorithm which has been used extensively in the field of operations research [11,12,13,14] and inventory management to maximize profits with change in demand [15,16]. This real-time pricing technique has been used in the hotel and airlines industry in the last two decades under the label of revenue management. DP has led to increased revenues in the airlines [17] and hotel reservation [18,19] industry. DP is based on regular price changes which allows the organization to price inventory to better reflect consumer value. DP allows organizations to separate consumers willing to pay more for a product or service under certain conditions from those who are price sensitive. This strategy has been developed and researched in areas such as the airline industry [20,21], and hotels [22,23]. Even beyond the airline and hotel industry, there exists an extensive literature exploring application of dynamic pricing in a variety of pricing domains [12,24,25,26,27,28,29].
This study applies DP in the context of ticket pricing in the sports industries. There are certain specificities of the sports industry which are very different than the others. In sports, the fans tend to be very loyal and continue to support the clubs even in cases of bad athletic results. Peiss and Kirsten (2014) [30] observed that repeated match attendance increases spectators’ identification with the team and their willingness to pay for games. Therefore, rather than having a definitive negative relation between ticket prices and demand as in most other sales context, fans loyal to a specific team as a way of self-identification, may not be deterred by high ticket prices and would still opt to purchase tickets despite of high prices. Dimitropoulos and Alexopoulos (2014) [31] investigated that game attendance and the profitability of football clubs are positively associated to their short and long run success, but not on the seasonal uncertainty of the league. Ticket demand for sports events and the factors that affect market equilibrium have been studied in References [5,8,32,33,34,35]. On the other hand, studies by Burger and Walters (2003) [36] and Pinnuck and Potter (2006) [37] researched that market size and the team performance are strongly associated with team revenues. Leeds and Sakata (2012) [35] inferred that attendance is greater at games between better teams and games that the home team is more likely to win. Economic studies of North American sports have shown that a variety of factors affect attendance at sporting events, including the presence of superstars [38,39], home game vs away game attendance [40], the fallout from work stoppages [38], the construction of a new stadium [41,42], and changes in competitive balance. Thus, it is interesting to investigate empirically the dynamic pricing in the context football game ticket pricing in the United States through purchase transactions.
Based on the revenue management criteria set by Kimes (1989a) [43], Drayer and Shapiro (2009, 2012) [4,44] showed that dynamic pricing can be a good fit for pricing sports/events tickets. These criteria include a relatively fixed capacity, a perishable inventory sold in advance, the ability to segment a market, and fluctuating demand, all of which occur with the customer in the sports industry. Moe et al. (2011) [45] found ticket sales are influenced by factors such as team performance and the number of days before a game, which fluctuate constantly. Cui et al. (2012) [46] examined organizational pricing strategies in the presence of consumer resale. Phumchusri and Swann (2014) [47] concluded that the benefits from having flexibility of price changes and demand learning can complement each other to achieve as much as 8.15% revenue increase on average, as compared to static pricing. Kemper and Breur (2016) [48] through Monte-Carlo simulations showed that a dynamic ticket pricing policy for sports tickets is significantly more efficient than an optimal fixed price policy. Xu et al. (2019) [49] deduced that by leveraging the dynamic pricing model insights and allowing sufficient pricing flexibility, a sports franchise for major league baseball games, can achieve a potential revenue improvement of 17.2% for single-game tickets through daily price reoptimization.
In the past decade, several sports teams have tried to use DP to control ticket pricing according to consumer demand and team’s performance [4,50]. DP in sports events was first implemented by San Francisco Giants in 2009 which led to an increase in revenues from their ticket sales [45] and consequently all major sports leagues (MLB, NHL, NBA) started using DP [50]. The present study applies DP from a mathematical perspective to optimize ticket prices with a midwestern US university’s football ticket sales for the season 2016–18. The purpose of this study is to examine college football tickets to study how DP technique can be used to maximize the sales revenues under various capacity distribution scenarios. Taking into consideration the timing of the ticket sales and the performance of the team (ranking in the league), DP method has been used empirically to determine the prices which the sellers should implement to maximize their revenues based on capacity allocation and specific game strategies.
The organization of this paper is as follows. The model and assumptions are introduced in Section 2. In Section 3 the empirical results obtained from modeling the data along with our propositions are discussed. Section 4 discusses the conclusions and the limitations related to this topic.

2. Model

The present work is based on mathematical models of DP, which operate from the perspective of demand in the market [51]. A consumer is assumed to have a limited budget and he/she will try to maximize his utility based on his preferences. A buy transaction occurs only when the consumer’s willingness to pay exceeds the average ticket price (ATP) of the sports event. Research has shown that price is negatively correlated with demand of sports tickets [6,52,53]. This negative correlation can be explained by the fact that attendance in sports events is more when ATPs are low. However, price-demand correlation also depends on the quality of the contest or on specific games, e.g., soccer world cup final, NFL playoffs when the correlation can be a positive one. Our present research data has majority of ticket sales for games in the qualifying stages and thus I consider negative correlation between price and demand. I also zero cost of transportation to attend a game, so as to eliminate variable transportation costs from total utility for each game. Further, it is an assumption that all game venues are comparable to each other. I use ticket pricing data of football tickets for a mid-western US university, from the football season of 2016–18. The DP technique has been applied in the current study as a strategy of price setting by which the seller sets a price that is not negotiable and that varies dynamically over time.
A standard Bernoulli model of DP has been used for-profit maximization by the seller. Our model assumes that there exists a fixed initial inventory of C over a limited period of time T and a seller tries to optimize profits by selling tickets for a specific game in a monopolist market. The customers in the population are considered to be myopic and the model assumes that in every period t, only one customer wants to purchase a single item. I further assume that only one ticket is sold in each time segment which starts from t and ends in 1. At the beginning of each period, the seller sets a price p t . The customer purchases the ticket online when his expected price is more than the price offered by the seller. Therefore, at any given instant of time there are two possible outcomes: purchase or no purchase. A Bernoulli approach has been adapted and the customer’s purchase probability d t ( p t ) is modeled as a continuous random variable. The Bellman equation in our DP takes the following form:
V ( c , t ) = m a x p t { d t ( p t ) * ( p t + V ( c 1 , t 1 ) ) + ( 1 d t ( p t ) ) * V ( c , t 1 ) }
for all 0 c C and t = T , , 1 .
The boundary conditions applied to Equation (1) are:
V ( c , 0 ) = 0   for   all   c 0   and   V ( 0 , t ) = 0   for   all   t = T , , 1 .
V ( c , t ) represents the value function of revenue, which is maximized based on the purchase probability of the customer and the ATP. The first term of Equation (1) is the revenue generated p t , for the purchase that takes place with probability d t ( p t ) . With every purchase, the inventory is reduced from c to c 1 . For the remaining time periods over t 1 , the expected revenues account for V ( c 1 , t 1 ) . The second term in Equation (1) represents the situation where no purchase takes place. The probability of such a no-purchase situation is 1 d t ( p t ) , during which no revenues are generated, thus resulting in no change in inventory. The remaining expected revenues account for V ( c , t 1 ) . The objective of the present problem is to determine a price policy that maximizes the expected revenues V ( c , t ) over all periods. Investigation of capacity allocation for different price policies to determine the optimal pricing strategy is critical. I will evaluate revenues generated in every state ( c , t ) using our data, thus ensuring determination of a price policy that generates the maximum possible revenues.

3. Results

3.1. Data Cleaning

Our dataset consists of the ATP for each game that the university played from 2016 to 2018, as well as the venues and the initial and the final inventory of tickets. Each transaction contains the price at which the ticket is bought, date of purchase, number of tickets sold and the name of the playing teams along with the game venue. Overall there are three seat categories and prices vary accordingly. The data was grouped under three different seasons 2016, 2017 and 2018, and missing values were removed. Data cleaning was performed using the R programming language and a new variable, “Days to Game”, was created which is the difference between the event date and the purchase date. Before evaluating revenues for every time period, I must estimate the demand function from our data. Overall there are three types of seat categories, but for simplicity our current empirical model is designed for only one seat category type. Based on the approach in previous studies [54] I have calculated the cumulative distribution functions of the price points for two games in the 2016 season using an ordinary least squares approach. The logit model specification is given by:
y = e a + b x 1 + e a * b * x
Demand Equation (2) with the 2016 football season is given by:
d t ( p t ) = e x p 0.5855 0.0106 * A T P 1 + e x p 0.0062 * A T P
Figure 1 below shows the demand function for two midwestern university games in the 2016 season using the logit model. The estimated demand function equation (1) is used to formulate the dynamic pricing model starting with a capacity C = 10,000 and a selling period of T of 8600 periods. The demand function is modeled from the purchase probability ( d t ( p t ) ) and the revenues are calculated for all states ( c , t ) . All optimal price points are calculated starting from period T till the end of all game periods (the period just before the beginning of the match).
Proposition 1.
The ATP increases as the game day approaches. A decrease in purchase probability occurs but more tickets are sold, and the ATPs increase due to dynamic pricing strategy.
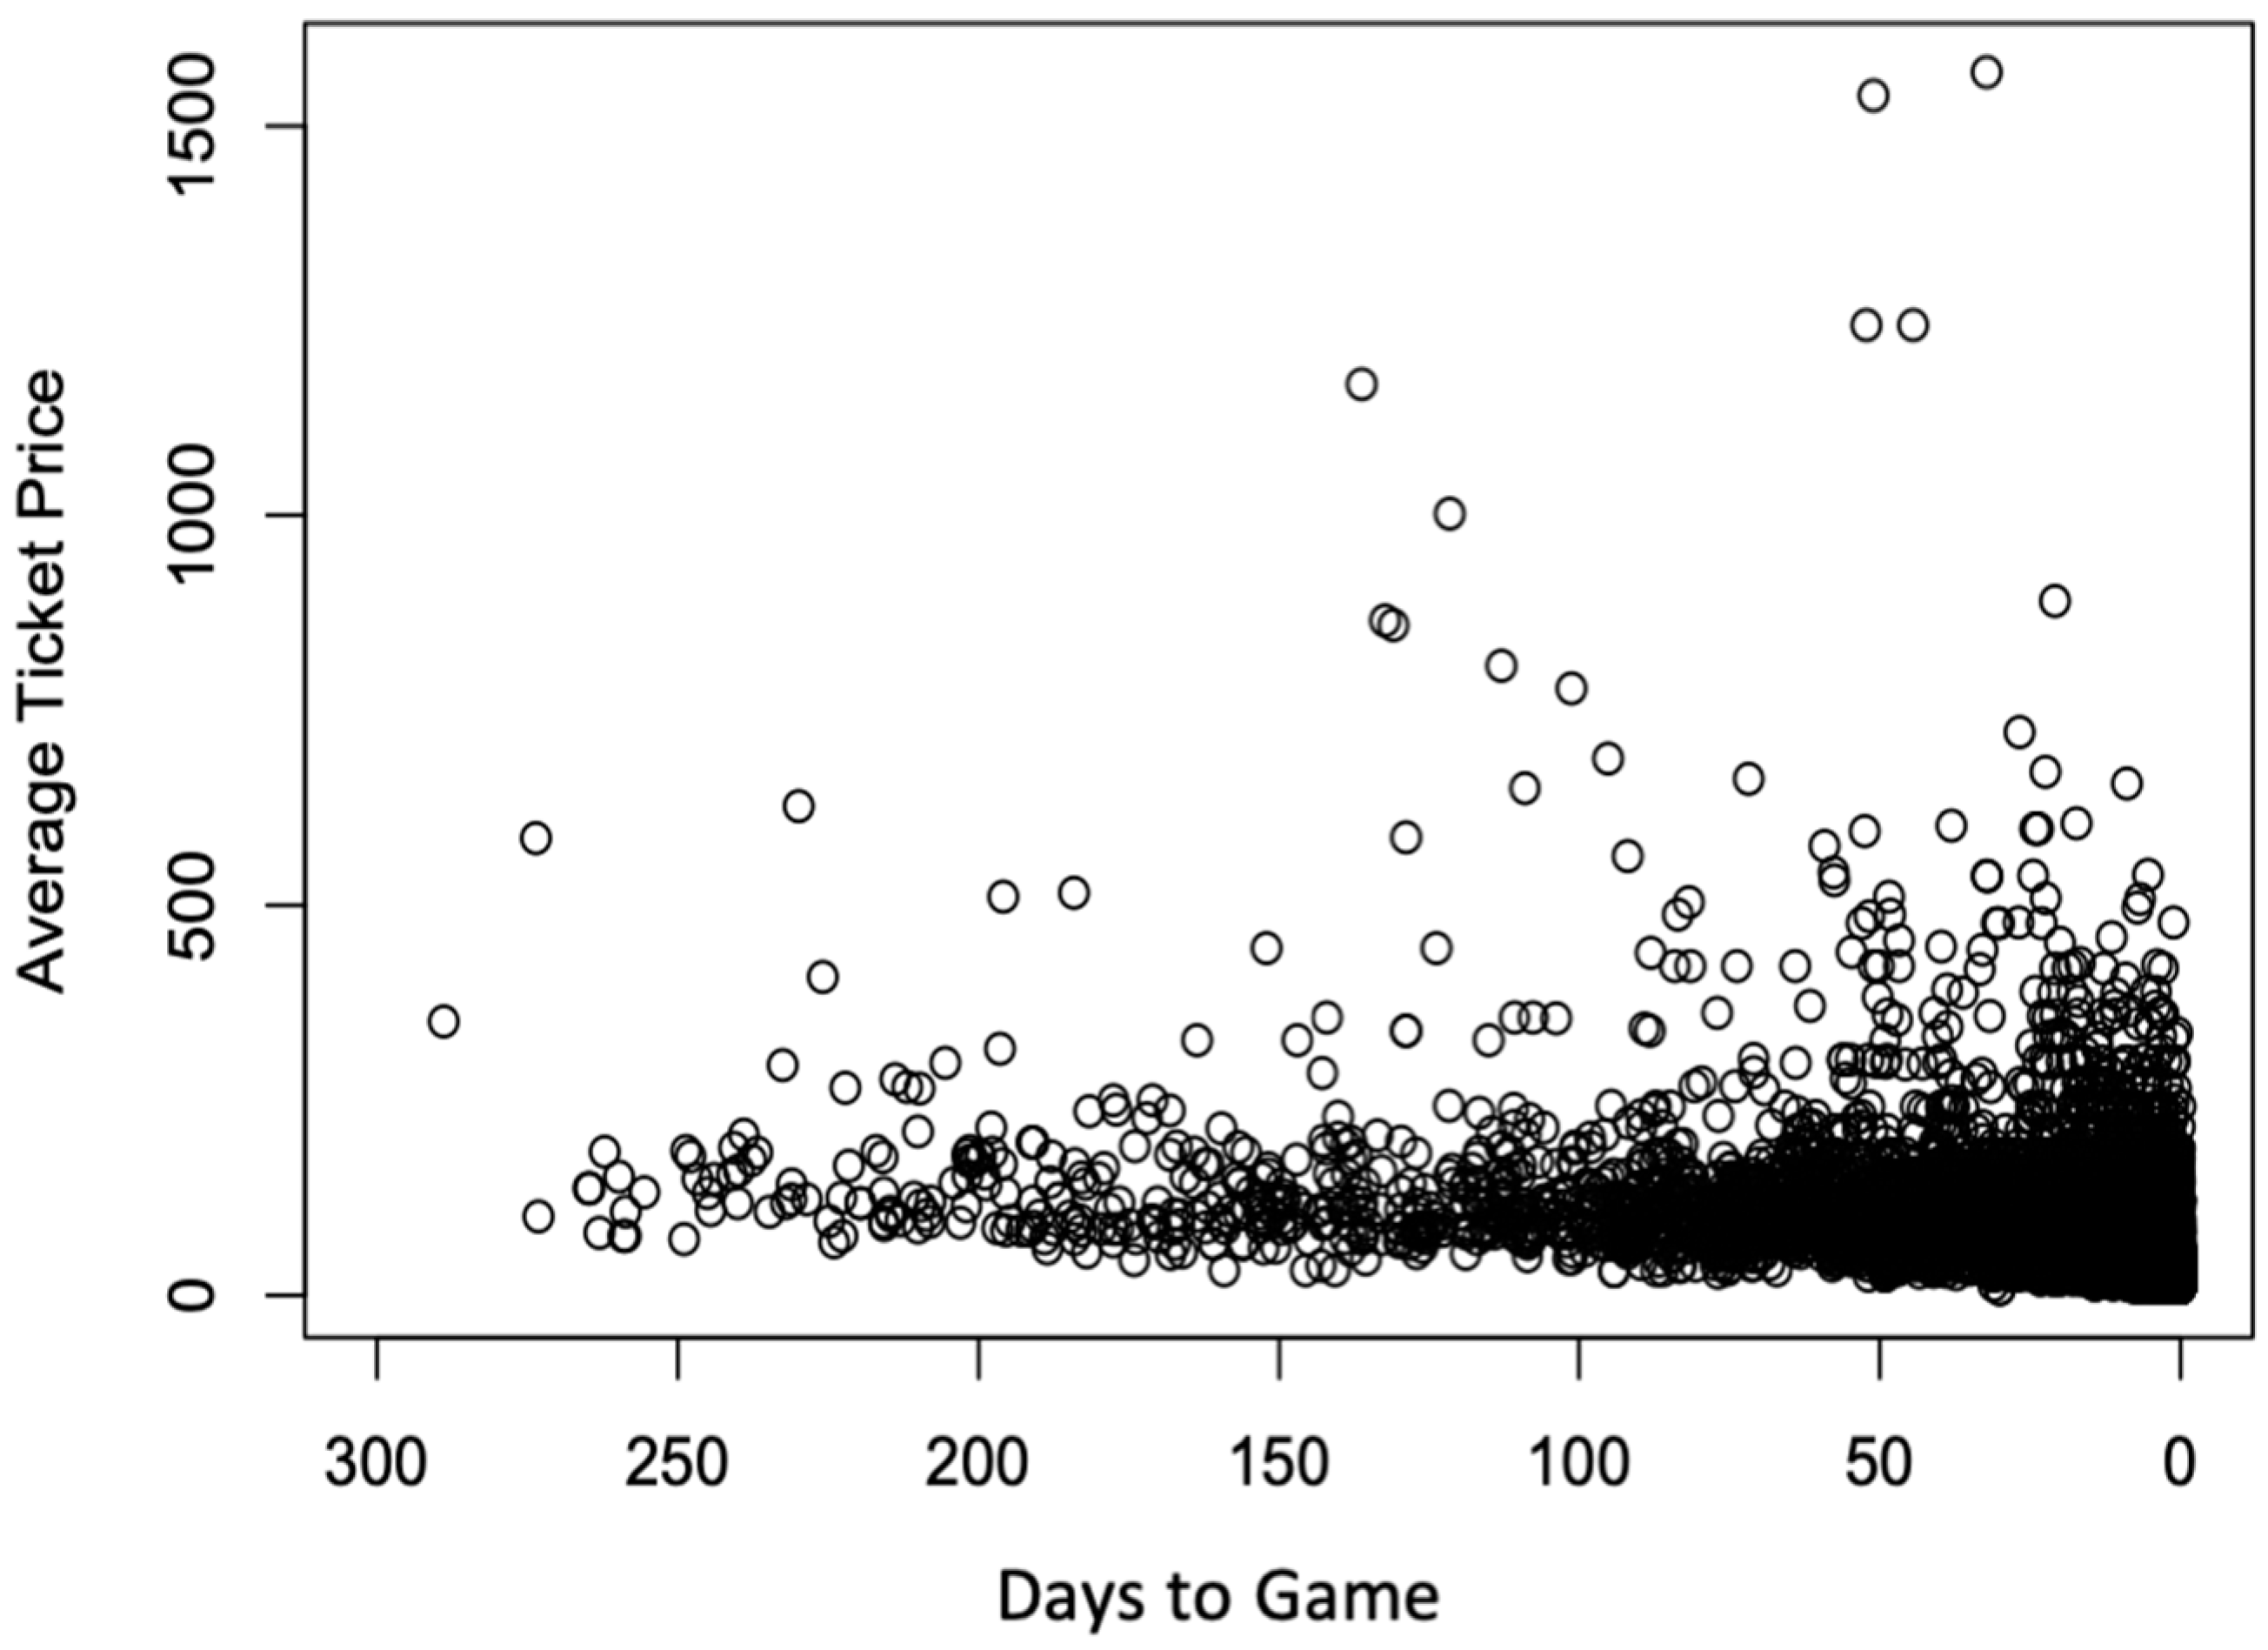
Figure 2 plots the ATP with respect to “Days to Game” for all seasons. As seen from the plot, as the game day approaches, the ATP increases. The conclusion is intuitive and realistic because as game day approaches, fans become more excited about the games and as a result the demand surcharges. Due to increase in ATP, the purchase probability decreases but more tickets are sold which is in conjunction with Figure 1. Some of the ATP points are higher than usual for some days, thus signifying that DP increases the price to maximize the revenues for those specific days. However, as discussed in Section 3, distance travelled by the audience and the transportation costs have been left out from our analysis due to data constraints and need to be considered for future research.

3.2. Optimal Fixed Price and Dynamic Price

The dynamic prices fluctuate on a real-time basis and the revenues are calculated according to the Bellman equation. The calculated optimal fixed price (OFP), p using the stochastic equation:
m a x p { t = 1 T ( T t ) d ( p ) t * ( 1 d ( p ) T t * m i n { t , C } ) }
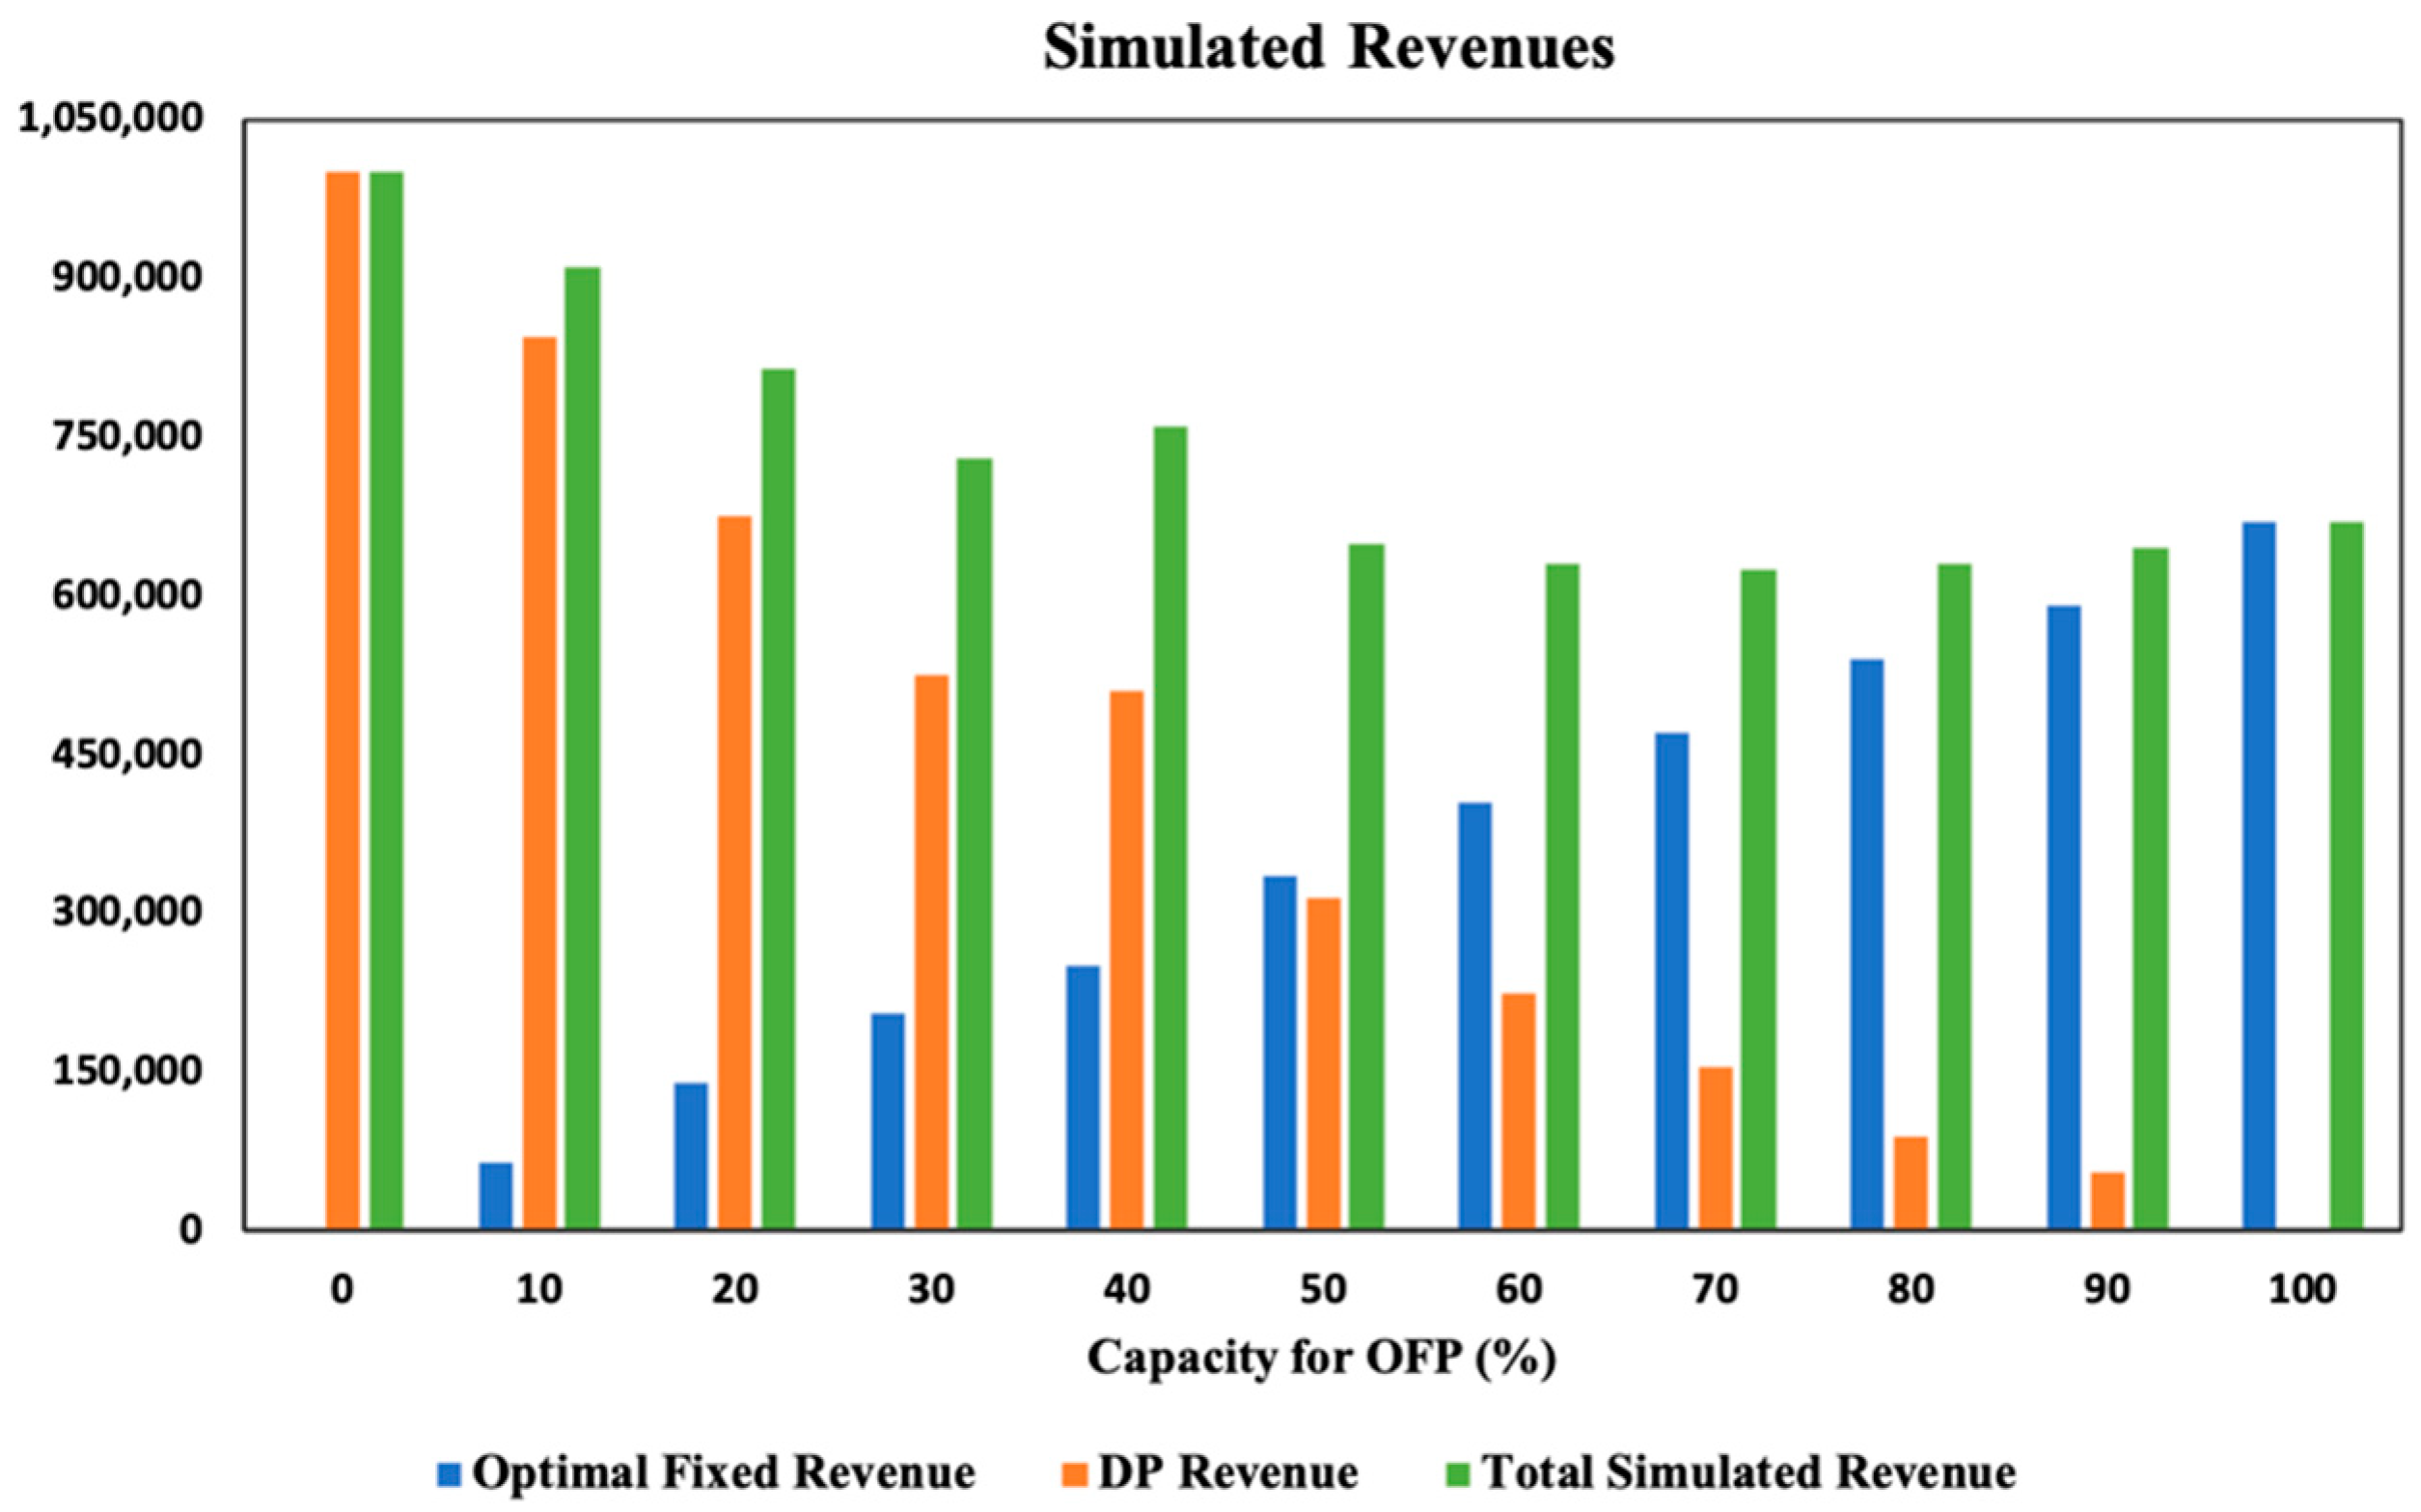
It is assumed that the sports club decides to sell a fraction of the ticket capacity using the dynamic pricing strategy and the rest of the capacity using an optimal fixed price. For doing so, the sports club wants to find out the optimal combination of using the dynamic pricing strategy along with the optimal fixed price to gain maximum revenues. In this case, Equation (1) is used for DP and Equation (4) is used to determine revenues using the optimal fixed price. Figure 3 below shows the simulated revenues from dynamic pricing and optimal fixed price. The x-axis represents the percent of the capacity (x = 0 means all the capacity priced by dynamic pricing) used for dynamic pricing and optimal fixed pricing.
Proposition 2.
Dynamic pricing strategy generates the maximum revenues.
Proposition 2 is best depicted in Figure 3. The results show that dynamically pricing the tickets generate the maximum revenues when the whole capacity is priced using Equation (1). However, as the portion of the capacity used for optimal fixed pricing increases from 10 to 100 percent, the DP revenues decrease, and the optimal fixed pricing portion of the revenues increase. However, the total revenues are the maximum when the entire capacity is priced dynamically. Apart from establishing the fact that it is always better to price tickets dynamically for maximum revenue generation, it can be concluded from Figure 3 that there exists an optimal capacity allocation for DP and optimal fixed pricing, where total revenues are almost the same. This can be seen from the fact that when (30–40%) of the tickets are using OFP and the rest DP, the total revenue generation is almost the same. This is also the case when the optimal allocation to OFP is 50–80%.

3.3. Optimal Capacity Allocation

The purchase probability of the customer (demand estimation) depends on certain factors such as date and time of the event, home team winning percentage and opposition team rankings. Let us suppose the university football team had a ranking of 10 for the end of the season 2016 and that during the season 2016, the university football team played against teams ranked 9, 14, 39, 55 and 60 in home games. Here the teams are divided according to their rankings as high (9,14), medium (39) and low (55,60) to determine what strategy the university should employ to sell its tickets based on the demand for specific games. The demand estimation ( d t ( p t ) ) were determined for all the five games that the university (say ranked 9) played with the opponents. As before the demand estimation were used in Equation (1) to price the tickets dynamically. Let C be the total capacity of tickets to be sold and let us assume that the club will sell a portion of the tickets directly to fans and the other portion will be sold to a retailer like Ticketmaster at a fixed price. It has been widely reported that clubs generally charge a commission (1%) on each ticket sold by the retailer. Let a fraction of the capacity x is sold by the club and C *   (1 − x) of the capacity is sold by the reseller (online retailer). The club charges a fixed optimal price (OFP) y for each ticket to the retailer and in turn also charges a commission z for each ticket sold by the retailer. It is assumed that the retailer is able to sell all tickets allocated to him. The objective is to maximize the revenue of the club:
V ( c , t ) = m a x p t { d t ( p t ) ( p t + V ( c 1 , t 1 ) ) + ( 1 d t ( p t ) ) V ( c , t 1 ) } + ( y + z ) C ( 1 x )
for all 0 c x C and t = T , , 1 , and 0 x , z 1
  • p t = D y n a m i c   P r i c e ,  
  • y = O p t i m a l   f i x e d   p r i c e   c h a r g e d   t o   t h e   r e t a i l e r ,  
  • z = 0.01 = C o m m i s i o n   o f t h e   c l u b   o n   e a c h   t i c k e t   s o l d   b y   t h e   r e t a i l e r .
The first part of Equation (5) is a DP method which the club uses to sell portion of the capacity. The second part of Equation (5) is the revenue generated by selling the rest of the capacity to the retailer and the commission earned.
Proposition 3.
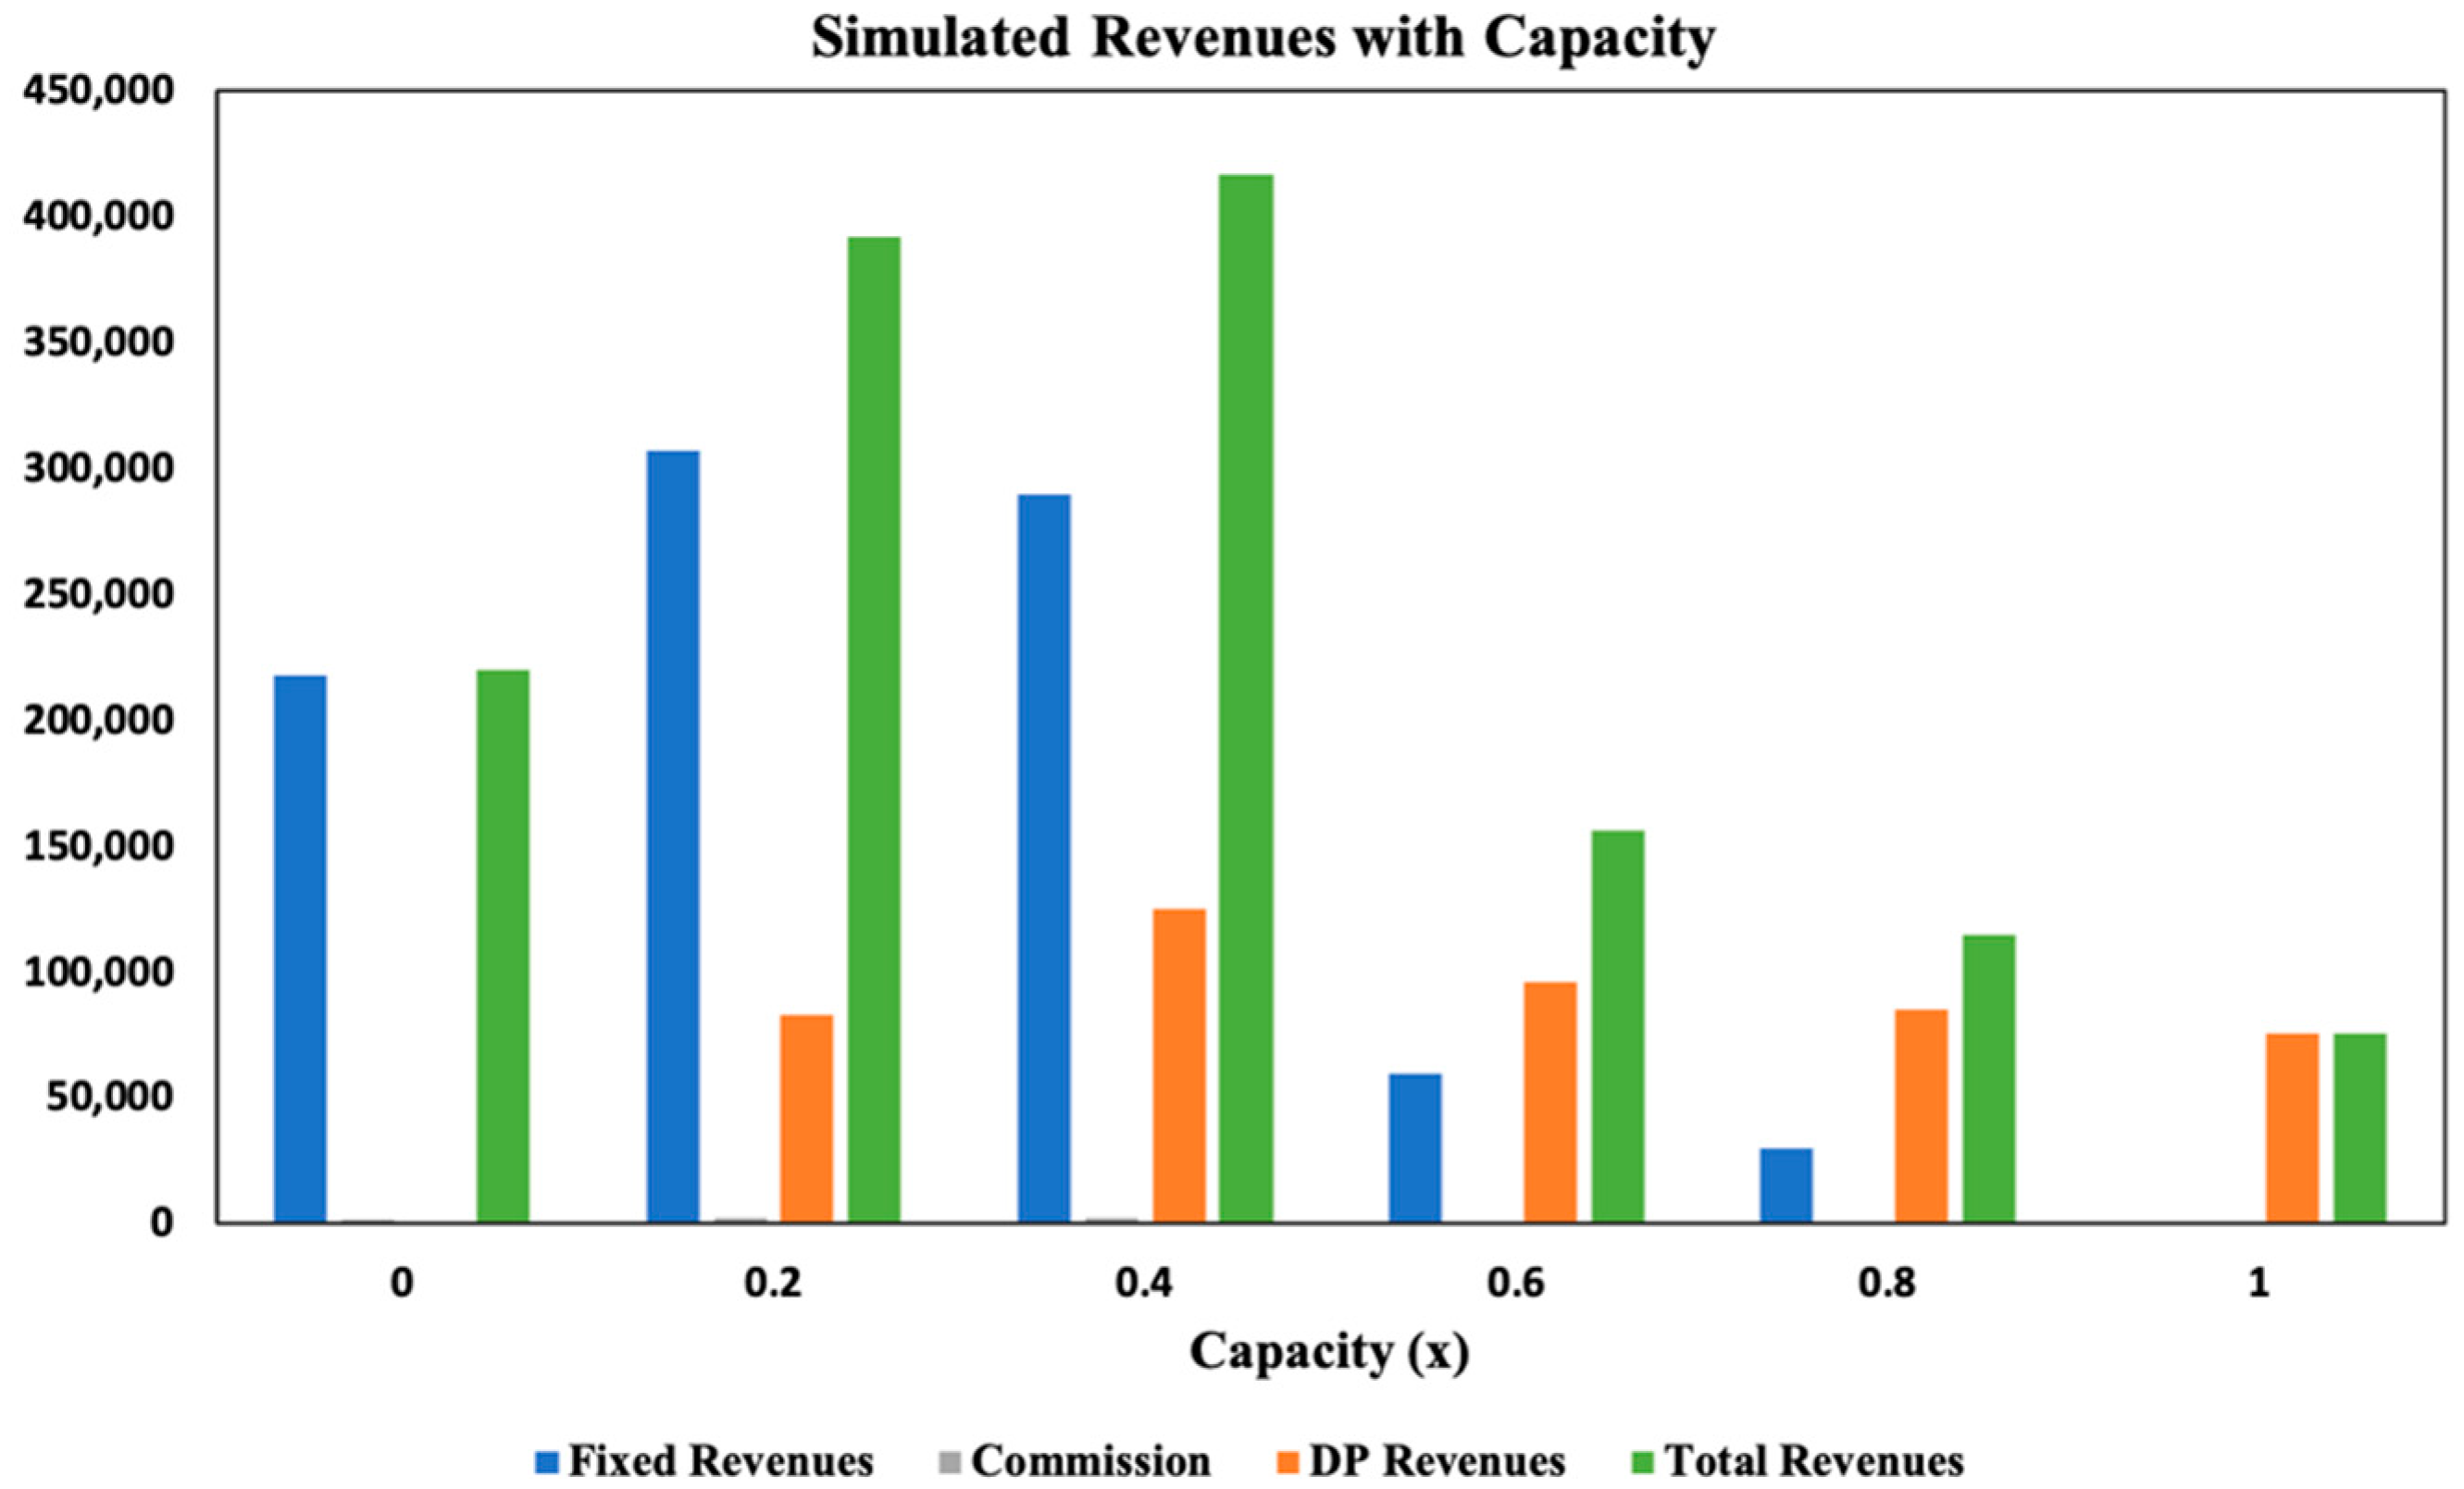
When two high ranked teams play each other, maximum revenue is generated when the full capacity of tickets are priced by dynamic pricing strategy. For a high ranked team vs a medium ranked team face off, 20–40% of the tickets should be dynamically priced. The remaining capacity should be sold at a fixed optimal price. Approximately 20% of the capacity should be priced by dynamic pricing when a high ranked team faces a low ranked team.
It is assumed that when the home team (high ranked) plays against an opponent (high ranked), then the club will try to sell maximum tickets by itself using the DP policy. This makes sense because the demand for tickets for such a game is high and the ticket prices are high as observed in our data. Consequently, the demand decreases for a high–medium ranked game and a high–low ranked game. Figure 4 below shows the simulated revenues for two high ranked teams playing the game. In this case, the demand is high, and the ATP is high.
A total of 2536 transactions were studied from the data set and Equation (1) was applied to these transactions. DP generates the highest revenues when the club sells all the tickets (x = 1) and the retailer’s direct sales of tickets is ineffective. If the sports club provides a portion of the capacity to the retailer, then the total revenue decreases as seen from Figure 4. The next scenario is when a high ranked team plays a medium ranked team in the home game. In this case, the optimal capacity allocation is not straightforward, as can be seen from Figure 5. A total of 1956 successful transactions were evaluated, and the DP was implemented. The result shows a decrease of revenue for the club when the club tries to sell the entire capacity. Thus, here it is optimal to sell a portion of the tickets (60–70%) to a retailer and earn commission from the retailer sales.
The intuition here is that the retailer charges more from the customer but the retailer can reach to a larger demand and thus ensures that more tickets are sold. The retailer maximizes his own revenue based by dynamically pricing the tickets, but the retailer pays only an optimal fixed cost for each ticket to the club plus a commission (assumed to be 1%) to the club.
Finally, the revenues are evaluated when a high ranked (such as the mid-western US university) team faces a low ranked team in a home match. The simulated revenues are shown in Figure 6. A total of 1411 transactions were studied to evaluate the demand estimation. A low number of transactions suggests that the demand is limited for this type of game. The DP strategy concludes that the home team club should sell 10–30% of the tickets and the rest should be allocated to a retailer.
This is the optimal strategy to maximize the revenues of the club. The club will earn a significant amount from the retailer and thus will be able to maximize the revenues. The OFP for x = 0, 0.2 and 0.4 are y = 190, 220 and 115. These values suggest that the club sells the tickets to the retailer at a considerably high cost to earn a high commission. Sports clubs generally sell season passes in the beginning of the season and the high price might be an attribution for that.

4. Conclusions and Limitations

The current study uses the mathematical principle of DP combined with empirical data to determine the demand functions for university football game tickets. These estimated demand functions are fundamental for specifying a DP model. Based on the calculated demand functions, it is established that the application of DP strategies would generate more revenues than the optimal fixed price. Therefore, the study contributes to the existing literature by analyzing a pricing approach that is applicable in the field of online ticket sales.
The other important result of our study is the capacity distribution according to the game intensity. It has been shown that it is not always optimal for a club to sell the entire capacity of tickets by itself. Getting involved with a retailer can be beneficial if the club can earn a commission based on the sales from the retailer. The results depict that for a high intensity game, the demand is generally high and thus the club should sell all the tickets by itself. On the other hand, as the demand fluctuates the capacity allocation is an important factor and a hard mathematical problem for the club to maximize its revenues from ticket sales. As shown in Figure 6. when the demand for tickets is relatively low, it is optimal for the club to retain 20–40% of the tickets and the rest of the capacity should be sold to online retailers. In the real world, this pricing technique has been used by football clubs and thus the secondary market online retailers like Ticketmaster and Vivid Seats have become popular in the last decade.
There are at some limitations to the present study. First, only the ticket prices of games played by the university football team have been studied. An evaluation of other sports clubs for different games in other leagues might reveal different demand functions, which are the core element of a DP model. Thus, it seems advisable to repeat this study in a different context. As mentioned in the introduction, several previous researches have pointed out to the fact that loyal fans are not always deterred by high ticket prices [30]. Due to this fact, several researchers have reported a positive correlation of game attendance with ticket prices [5,32,33,34,35,36,37]. Thus, a more robust data centric study considering all factors is required for further analysis. The present dataset does not contain transactions on season tickets; thus, the present study is limited to only individual transactions. As is evident, teams tend to hold on to their season ticket holders by offering a lower price; a future study involving season ticket transactions and DP is required to find the optimal fixed price for season tickets. Furthermore, the estimated demand functions for five games rely on a small sample data set. Hence, future research could extend the findings from the current study by analyzing a larger data set involving multiple teams and multiple games. Second, the designed DP model is based on only five demand functions, one for each home game played by the university. This study considers the home game as high ranked based on its previous performances. However, if the home game is either medium or low ranked then at least nine different demand functions need to be considered for all game types. This would provide a more detailed analysis of how the capacity distribution of tickets should be allocated by the club to maximize its revenues. However, one reason the DP strategy for pricing sports tickets has been studied extensively is due to interest in different kinds of factors, such as current position in the league standings or weather conditions, in order to price the tickets. These factors have not been considered in the present study. Finally, the present study considers only one type of seats for simplicity for pricing the tickets. Prices for different zones and seat types may yield different result in terms of distribution of the capacity. However, the main result of DP for generating maximum revenues should not change when different seat types are considered. Finally, the study has been done from the perspective of the home team club. The main objective is to maximize the revenue of the club from online ticket sales through third-party retailers. A further scope of research would be to consider sales from both the club and the retailer’s perspective and maximize the revenue of the supply chain. The online retailer might not be able to sell all the tickets, in which case a salvage value can be considered if the ticket is unsold. Thus, the retailer will have a differentiated strategy and the overall supply chain needs to be considered for the benefit of the club and the online retailer.

Author Contributions

Conceptualization, methodology, validation, formal analysis, data curation, writing—original draft preparation, writing—review and editing, A.D.

Funding

This research is not supported by any external grants.

Acknowledgments

High performance computing support was provided by The Center for Advanced Computing (CAC) at Queen’s University, Canada. A.D. would like to thank the support staff at CAC for their support.

Conflicts of Interest

The author declares no conflict of interest.

References

  1. McAfee, A.; Brynjolfsson, E. Big Data: The Management Revolution. Harv. Bus. Rev. 2012, 90, 60–68. [Google Scholar] [PubMed]
  2. Lovelace, R. The Data Revolution: Big Data, Open Data, Data Infrastructures and Their Consequences, by Rob Kitchen; Sage Publications: Thousand Oaks, CA, USA, 2014. [Google Scholar]
  3. Alfredo, C.; Song, Y., II; Karen, C.D. Analytics over large-scale multidimensional data: The big data revolution. In Proceedings of the ACM 14th international workshop on Data Warehousing and OLAP (DOLAP ‘11); ACM: New York, NY, USA; pp. 101–104. [CrossRef]
  4. Drayer, J.; Shapiro, S.L.; Lee, S. Dynamic ticket pricing in sports: An agenda for research and practice. Sports Mark. Q. 2012, 21, 184–194. [Google Scholar]
  5. Cairns, J.A.; Jennett, N.; Sloane, P.J. The economics of professional team sports: A survey of theory and evidence. J. Econ. Stud. 1986, 13, 3–80. [Google Scholar] [CrossRef]
  6. Borland, J.; MacDonald, R. Demand for sports. Oxf. Rev. Econ. Policy 2003, 19, 478–502. [Google Scholar] [CrossRef]
  7. Downward, P.; Dawson, A. The Economics of Professional Team Sports; Routledge: London, UK, 2000. [Google Scholar]
  8. Coates, D.; Humphreys, B.R. Ticket prices, concessions and attendance at professional sporting events. Int. J. Sports Financ. 2007, 2, 161–170. [Google Scholar]
  9. Krautmann, A.C.; Berri, D.J. Can we find it at the concessions? Understanding price elasticity in professional sports. J. Sports Econ. 2007, 8, 183–191. [Google Scholar] [CrossRef]
  10. Chang, Y.M.; Potter, J.M.; Sanders, S. Inelastic sports ticket pricing, marginal win revenue, and firm pricing strategy: A behavioral pricing model. Manag. Financ. 2016, 42, 922–927. [Google Scholar] [CrossRef]
  11. Gallego, G.; van Ryzin, G.J. Optimal dynamic pricing of inventories with stochastic demand over finite horizons. Manag. Sci. 1994, 40, 999–1020. [Google Scholar] [CrossRef]
  12. Gallego, G.; van Ryzin, G.J. A multiproduct dynamic pricing problem and its applications to network yield management. Oper. Res. 1997, 45, 24–41. [Google Scholar] [CrossRef]
  13. Lin, K.Y. Dynamic pricing with real-time demand learning. Eur. J. Oper. Res. 2006, 174, 522–538. [Google Scholar] [CrossRef] [Green Version]
  14. Robinson, D.R. A Dynamic Programming Solution to Cost-Time Tradeoff for CPM. Manag. Sci. 1975, 22, 139–260. [Google Scholar] [CrossRef]
  15. Berovic, D.P.; Vinter, R.B. The application of Dynamic Programming to Optimal Inventory Control. IEEE Trans. Autom. Control 2004, 49, 676–685. [Google Scholar] [CrossRef]
  16. Simon, H.A. Dynamic Programming Under Uncertainty with a Quadratic Criterion Function. Econommetrica 1956, 24, 74–81. [Google Scholar] [CrossRef]
  17. Lee, T.C.; Hersh, M. A Model for Dynamic Airline Seat Inventory Control with Multiple Seat Bookings. Transp. Sci. 1993, 27, 209–312. [Google Scholar] [CrossRef]
  18. Hung, W.; Shang, J.; Wang, F. Pricing determinants in the hotel industry: Quantile regression analysis. Int. J. Hosp. Manag. 2010, 29, 378–384. [Google Scholar] [CrossRef]
  19. Abrate, G.; Fraquelli, G.; Viglia, G. Dynamic pricing strategies: Evidence from European hotels. Int. J. Hosp. Manag. 2012, 31, 160–168. [Google Scholar] [CrossRef] [Green Version]
  20. Belobaba, P.P. Airline yield management: An overview of seat inventory control. Transp. Sci. 1987, 21, 63–73. [Google Scholar] [CrossRef]
  21. Belobaba, P.P. Application of a probabilistic decision model to airline seat inventory control. Oper. Res. 1989, 37, 183–197. [Google Scholar] [CrossRef]
  22. Choi, S.; Mattila, A.S. Hotel revenue management and its impact on customer fairness perceptions. J. Revenue Pricing Manag. 2004, 2, 303–314. [Google Scholar] [CrossRef]
  23. Choi, S.; Mattila, A.S. Impact of information on customer fairness perceptions of hotel revenue management. Cornell Hotel Restaur. Adm. Q. 2005, 46, 27–35. [Google Scholar] [CrossRef]
  24. Biller, S.; Chan, L.M.A.; Simchi-Levi, D.; Swann, J. Dynamic pricing and the directto-customer model in the automotive industry. Electron. Commer. Res. 2005, 5, 309–334. [Google Scholar] [CrossRef]
  25. Chan, L.; Shen, Z.; Simchi-Levi, D.; Swann, J. Coordination of Pricing and Inventory Decisions: A Survey and Classification. In Handbook of Quantitative Supply Chain Analysis; Simchi-Levi, D., Ed.; Kluwer Academic: Boston, MA, USA, 2004; pp. 335–392, ISBN-10: 1402079524. [Google Scholar]
  26. Kannan, P.; Kopalle, P. Dynamic pricing on the internet: Importance and implications for consumer behavior. Int. J. Electron. Commer. 2001, 5, 63–83. [Google Scholar]
  27. Leloup, B.; Deveaux, L. Dynamic pricing on the internet: Theory and simulations. J. Electron. Commer. Res. 2001, 1, 265–276. [Google Scholar] [CrossRef]
  28. Levin, Y.; McGill, J.; Nediak, M. Dynamic pricing in the presence of strategic consumers and oligopolistic competition. Manag. Sci. 2009, 55, 32–46. [Google Scholar] [CrossRef]
  29. Maglaras, C.; Meissner, J. Dynamic pricing strategies for multiproduct revenue management problems. Manuf. Serv. Oper. Manag. 2006, 8, 136–148. [Google Scholar] [CrossRef]
  30. Peiss, M.; Kirstein, R. Optimal ticket pricing in professional sports: A social identity approach. Econ. Bull. 2014, 34, 2138–2150. [Google Scholar]
  31. Dimitropoulos, P.; Alexopoulos, P. Attendance, revenues, profits and the on-field performance of the Greek football clubs. Int. J. Sci. Eng. Res. 2014, 2, 33–39. [Google Scholar]
  32. Bird, P.J. The demand for league football. Appl. Econ. 1982, 14, 637–649. [Google Scholar] [CrossRef]
  33. Dobson, S.M.; Goddard, J.A. The demand for standing and seated viewing accommodation in the English Football League. Appl. Econ. 1992, 24, 1155–1163. [Google Scholar] [CrossRef]
  34. Leeds, M.A.; Sakata, S. Take me out to the Yakyushiai: Determinants of attendance at Nippon professional baseball games. J. Sports Econ. 2012, 13, 34–52. [Google Scholar] [CrossRef]
  35. Watanabe, N.M. Japanese professional soccer attendance and the effects of regions, competitive balance and rival franchises. Int. J. Sport Financ. 2012, 7, 309–323. [Google Scholar]
  36. Burger, J.D.; Walters, S.J.K. Market Size, Pay and Performance. A general model application to Major League Baseball. J. Sports Econ. 2003, 4, 108–125. [Google Scholar] [CrossRef]
  37. Pinnuck, M.; Potter, B. Impact of on-field football success on the off-field financial performance of AFL football clubs. Account. Financ. 2006, 46, 499–517. [Google Scholar] [CrossRef]
  38. Berri, D.J.; Schmidt, M.B. On the road with the National Basketball Association’s superstar externality. J. Sports Econ. 2006, 7, 347–358. [Google Scholar] [CrossRef]
  39. Hausman, J.A.; Leonard, G.K. Superstars in the National Basketball Association: Economic value and policy. J. Labor Econ. 1997, 15, 586–624. [Google Scholar] [CrossRef]
  40. Mirabile, M.P. The determinants of attendance at neutral site college football games. Manag. Decis. Econ. 2015, 36, 191–204. [Google Scholar] [CrossRef]
  41. Clapp, C.M.; Hakes, J.K. How long a honeymoon? The Effect of new stadiums on attendance in Major League Baseball. J. Sports Econ. 2005, 6, 237–263. [Google Scholar] [CrossRef]
  42. Leadley, J.C.; Zygmont, Z.X. When is the honeymoon over? Major League Baseball attendance 1970–2000. J. Sport Manag. 2005, 19, 278–299. [Google Scholar]
  43. Kimes, S.E. The basics of yield management. Cornell Hotel Restaur. Adm. Q. 1989, 30, 14–19. [Google Scholar] [CrossRef]
  44. Drayer, J.; Shapiro, S.L. Value determination in the secondary ticket market: A quantitative analysis of the NFL playoffs. Sports Mark. Q. 2009, 18, 5–13. [Google Scholar]
  45. Moe, W.W.; Fader, P.S.; Kahn, B. Buying tickets: Capturing the dynamic factors that drive consumer purchase decision for sporting events. In Proceedings of the MIT Sloan Sports Analytics Conference, Boston, MA, USA, 4–5 March 2011. [Google Scholar]
  46. Cui, Y.; Duenas, I.; Shahin, O. Sports event revenue management with consumer resale. In Proceedings of the MIT Sloan Sports Analytics Conference, Boston, MA, USA, 2–3 March 2012. [Google Scholar]
  47. Phumchusri, N.; Swann, J.L. Dynamic pricing with updated demand for the sports and entertainment ticket industry. J. Comput. Sci. 2014, 10, 2240–2252. [Google Scholar] [CrossRef]
  48. Kemper, C.; Breuer, C. Dynamic ticket pricing and the impact of time-an analysis of price paths of the English soccer club Derby County. Eur. Sport Manag. Q. 2016, 16, 233–253. [Google Scholar] [CrossRef]
  49. Xu, J.J.; Fader, P.S.; Veer Raghavan, S. Designing and evaluating dynamic pricing policies for major league baseball tickets. Manuf. Serv. Oper. Manag. 2019, 21, 121–138. [Google Scholar]
  50. Paul, R.; Weinbach, A.P. Determinants of dynamic pricing premiums in Major League Baseball. Sports Mark. Q. 2013, 22, 152–165. [Google Scholar]
  51. Drayer, J.; Rascher, D.A.; McEvoy, C. An examination of underlying consumer demand and sports pricing using secondary market data. Sports Manag. Rev. 2012, 15, 448–460. [Google Scholar] [CrossRef]
  52. Simmons, R. The demand for English league football, a club-level analysis. Appl. Econ. 1996, 28, 139–155. [Google Scholar] [CrossRef]
  53. Garcia, J.; Rodriguez, P. The determinants of football match attendance revisited: Empirical evidence from the Spanish football league. J. Sport Econ. 2002, 3, 18–38. [Google Scholar] [CrossRef]
  54. Hayes, D.K.; Miller, A.A. Revenue Management for the Hospitality; John Wiley and Sons: Hoboken, NJ, USA, 2011. [Google Scholar]
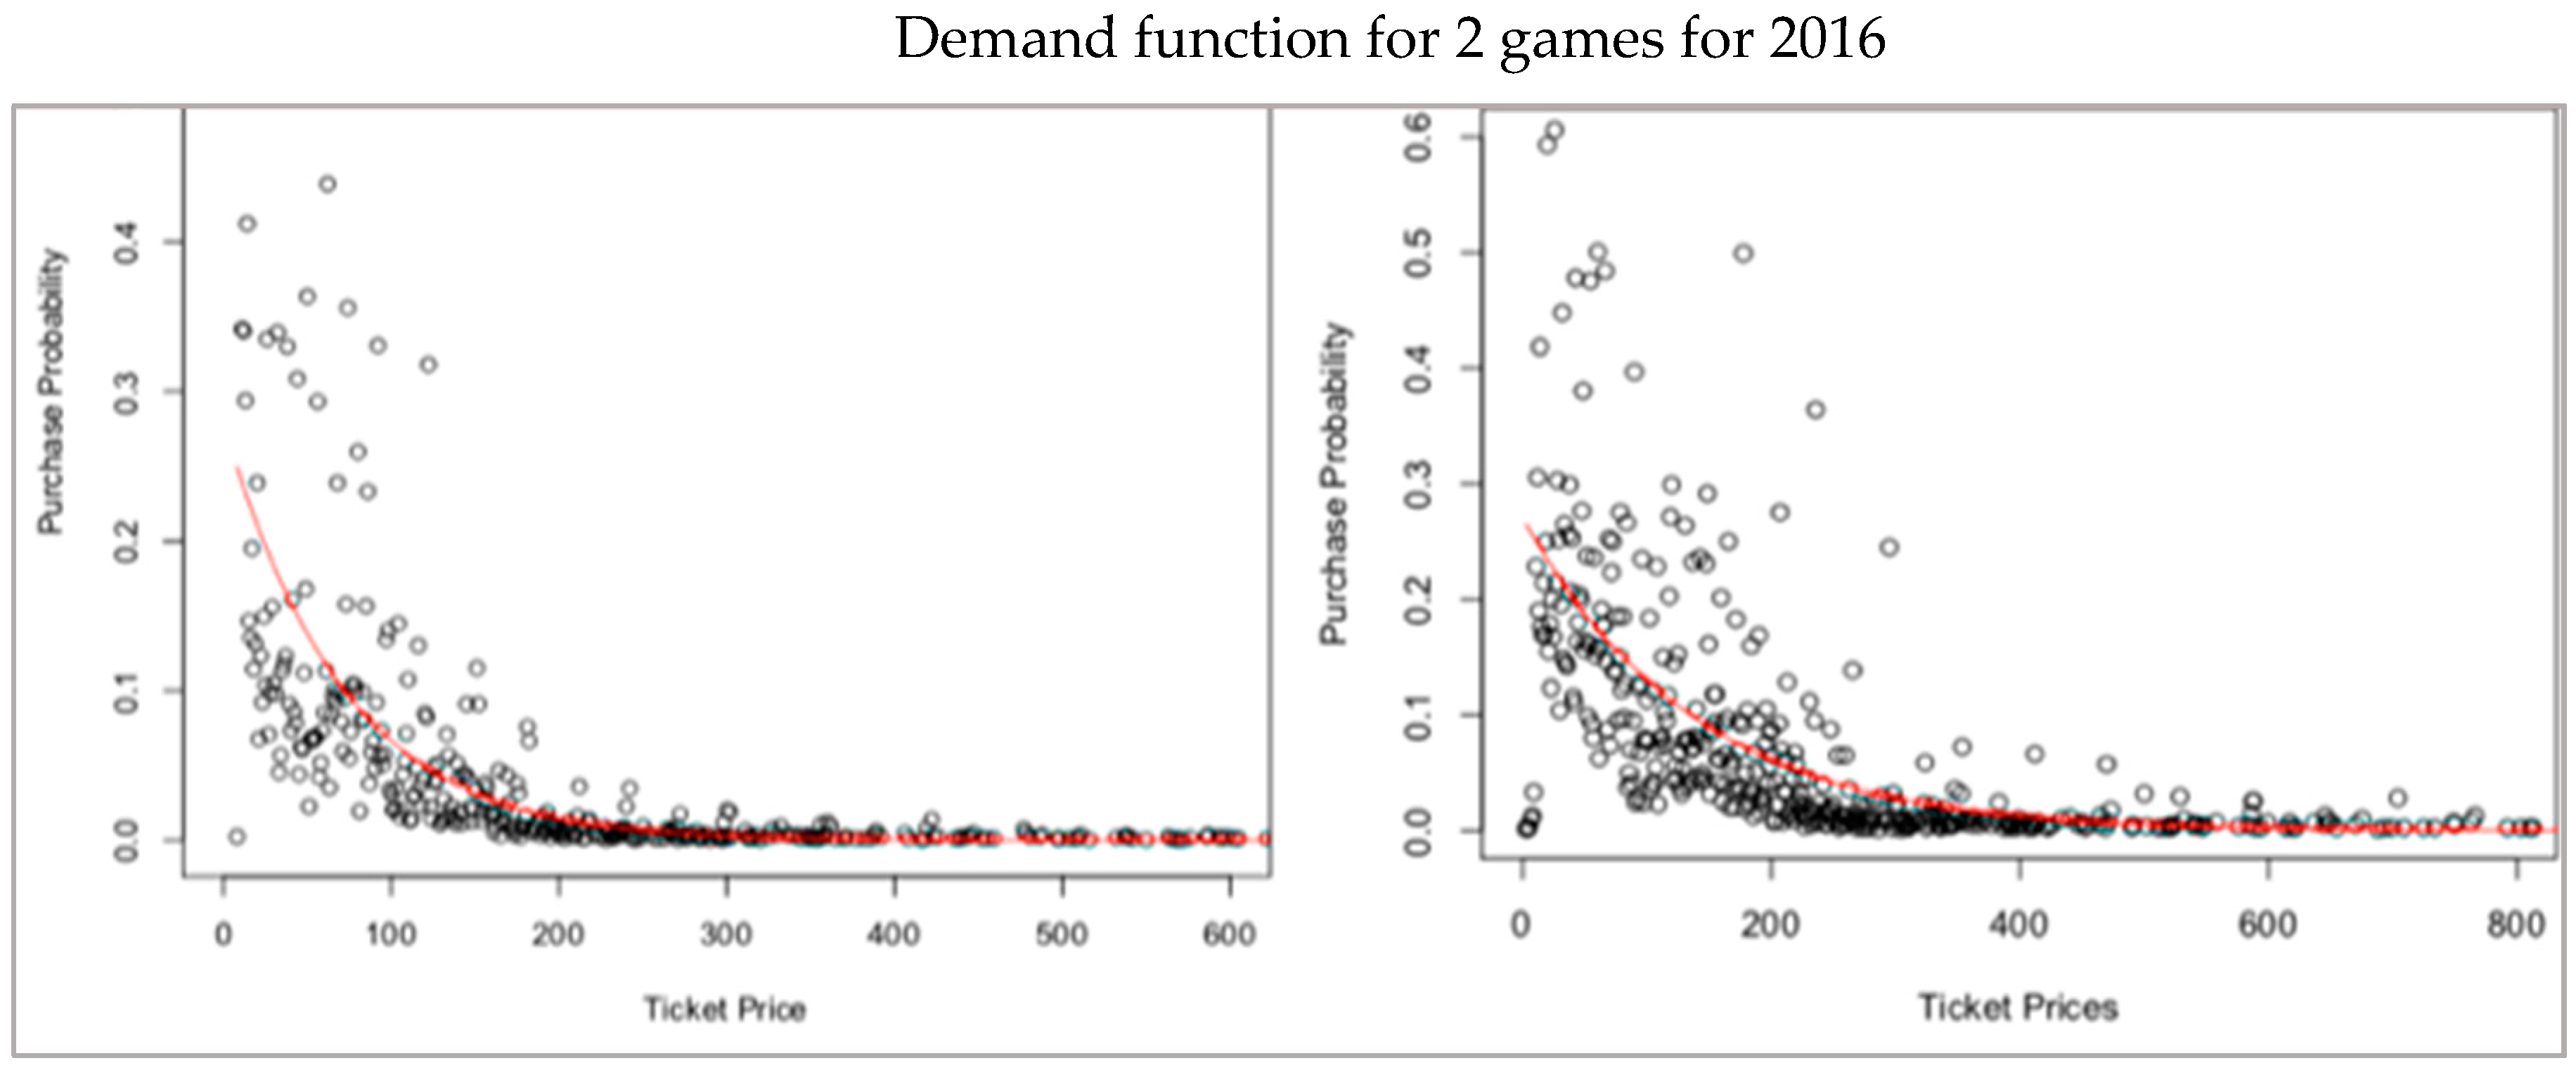
Figure 1. The estimated demand models for two games in 2016 football season. With increase in ticket price the purchase probability of customers decreases.
Data 04 00141 g001
Figure 2. Average ticket price (ATP) with days to game.
Data 04 00141 g002
Figure 3. Simulated revenues with increasing capacity for optimal fixed pricing (OFP).
Data 04 00141 g003
Figure 4. Simulated revenues for a (high–high) ranked team games.
Data 04 00141 g004
Figure 5. Simulated revenues for a (high–medium) ranked team games.
Data 04 00141 g005
Figure 6. Simulated revenues for a (high–low) ranked team games.
Data 04 00141 g006