Data Descriptor

Lifestyles and Cycling Behavior—Data from a Cross-Sectional Study

1
Department of Geoinformatics, University of Salzburg, 5020 Salzburg, Austria
2
Freelance Consultant, 1010 Vienna, Austria
3
Helios, 39100 Bolzano BZ, Italy
*
Author to whom correspondence should be addressed.
Data 2019, 4(4), 140; https://doi.org/10.3390/data4040140
Submission received: 26 September 2019 / Revised: 14 October 2019 / Accepted: 16 October 2019 / Published: 17 October 2019

Abstract

:
Cycling experiences a remarkable renaissance as an everyday mode of transport and in an increasing number of cities, cycling substantially contributes to the overall traffic. However, cyclists are not a homogeneous group of road users, but very diverse in terms of behavior, motivators, and deterrents. In order to gain better insights into driving forces and behavior patterns of cyclists, we conducted an opt-in online survey, in which socio-demographic, lifestyle, and mobility behavior data were collected. In total, 1234 responses with a completion rate of 87% (1073 complete survey) were collected between 3 May and 3 June 2019. With reference to complete responses, the gender ratio is balanced (53% female) and the mean age is 42 (σ = 12.75). A relative majority of participants cycles frequently. The fully anonymized dataset contains 107 data points per response, including survey metadata.
Dataset: The dataset is available in the supplementary file.
Dataset License: CC-BY

1. Summary

Cycling is promoted as a sustainable mobility option worldwide because of its numerous positive environmental, economic, and societal effects. The modal share of cycling has been increasing over the past few years in many regions and cities [1]. This cycling boom is also reflected in a growing body of scientific literature on various aspects of cycling [2]. Although cycling is high on the agenda, policy makers, planners, and researchers still regard cyclists as a homogenous group of road participants in many cases. However, enough evidence is available, which shows the heterogeneity of cyclists in terms of response to environmental variables and mobility patterns [3,4]. In order to further increase the modal share of cycling and to attract yet underrepresented groups, it is of great importance to investigate and consider the diversity among existing and potential cyclists [5]. Moreover, Banister [6] proposes a paradigmatic shift towards sustainable mobility, where the focus is on individuals instead of vehicles and the physical dimension is jointly considered with the social dimension.
The interdisciplinary research project “Bicycle Observatory” (https://bicycle-observatory.zgis.at), which runs from April 2018 to September 2020, aims to fuse technical sensor data (such as counting data or trajectories sensed with location-aware mobile devices) and data from social sciences (such as data from focus groups, expert interviews, or questionnaires) into a multi-dimensional, spatially differentiated picture of cycling mobility. The rationales behind these research efforts are twofold. First, systemic insights into cycling mobility should complement existing, domain-specific knowledge. Second, derived from an integrated data pool, varieties of cyclists with their respective behavior in space and time as well as their reasoning are subject to an in-depth investigation.
In the context of the latter, a cross-sectional study on cycling mobility was conducted as an opt-in online survey in 2019. We recruited participants for the survey through social media channels, email newsletters and at a two-day bicycle festival. Residents and commuters with a workplace in the test area of the project, the Salzburg region in Austria (see Figure 1), were primarily addressed. In total, approximately 25,000 persons in the Salzburg region received an invitation to the online survey via e-mail. Participants from other regions were not directly invited, but found the link to the survey on the web.

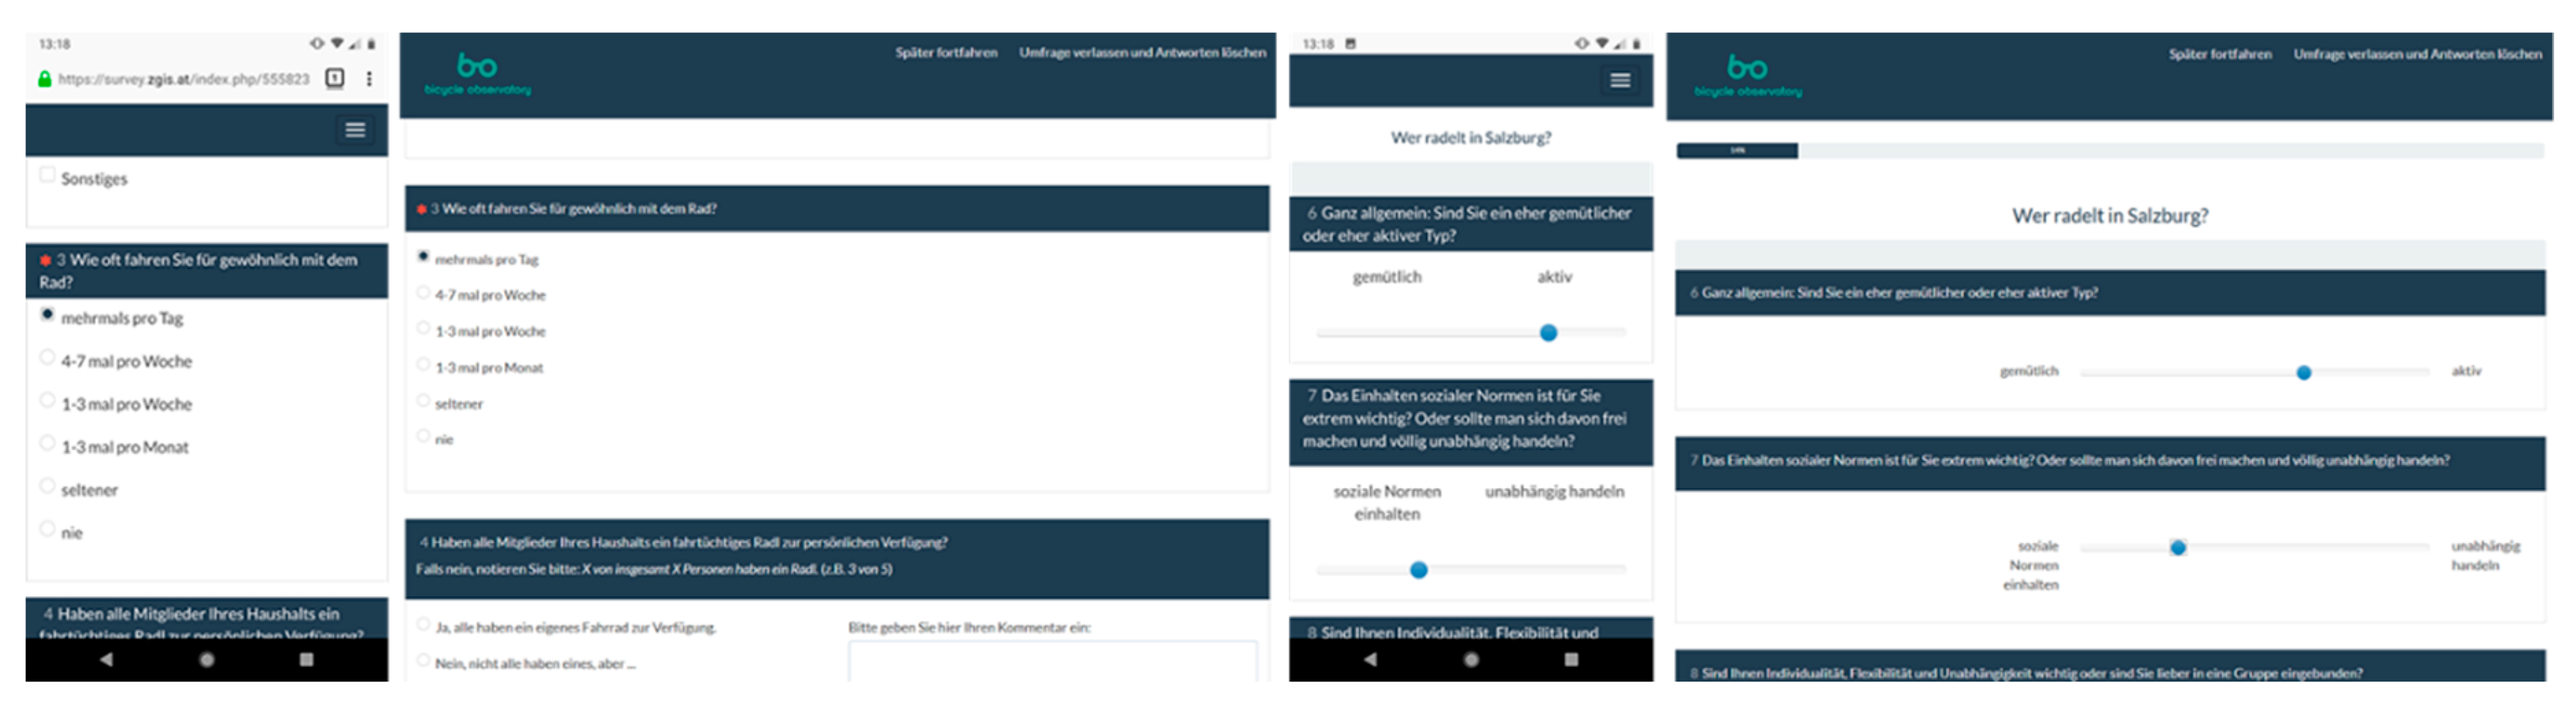
1.1. Data Acquisition

Previous studies mainly focus on socio-demographic variables and observable behavior. Our goal was to link these variables with information on lifestyles and personal characteristics. Consequently, the questionnaire revolved around the core research questions “Who is cycling?” and “Why are they cycling?” In order to answer these questions, we collected data in three different categories: personal, behavioral, and motivational. Table 1 provides an overview of the sections of the questionnaire with the respective topic, question format, and number of questions.
Sections 1 and 7 of the survey were designed as a conventional mobility survey with closed-ended questions. For the rest of the questionnaire, we used an extensive set of questions that were intended to stimulate ad hoc, emotional responses (“gut feeling”). For this, we provided two poles for each answer, which frame a spectrum of attitude, values, or behavior. The complete set of questions is documented in Appendix A.
In order to ensure full anonymity, we did not record the IP address or placed cookies on participants’ devices. Consequently, recorded metadata are limited to response characteristics (response time, point of break-off, etc.) and do not include any personal information. Since we acquired only anonymized data, which do not allow any connection to individual persons, the study did not need approval of the responsible ethic board.
Incentives are major motivators for participating in and completing online surveys [7,8]. At the final page of the survey, participants were invited to download a voucher for a local sports store. Additionally, all participants who were willing to enter their e-mail address took part in a final raffle with two main prizes. For this, we redirected participants to an input mask, which had no link to the database of the survey. Thus, the e-mail address could not be linked to the responses.
We used the open-source survey tool, LimeSurvey [9], hosted on our own IT infrastructure, for implementing the questionnaire. With this technical environment, we could ensure full control over the survey tool and the acquired data.

1.2. Data Usage

We acquired the dataset presented in this paper for a specific research question in the context of the project “Bicycle Observatory”. The data were primarily used for the identification and description of different types of cyclists. For this, we mined the dataset for patterns (clusters) and analyzed personal characteristics (socio-demographics, lifestyles, values, etc.) with self-reported mobility behavior. In the next step, these results were related to the rich data pool, which we established in our use case study. Results of these analyses are not part of this paper and the usage of the dataset is not limited to these research questions. It can be used for a wide variety of research in the context of mobility, specifically cycling, and social sciences such as environmental psychology, behavioral economics, or marketing. Besides, the cross-sectional survey can be reproduced and compared with the results presented in this dataset.
The rest of the paper is structured as follows: the dataset is described in Section 2 in detail. Data processing and quality control are presented in Section 3. A translated version of the online survey can be found in Appendix A.

2. Data Description

In total, 1234 persons started the online survey in the study period between 3 May and 3 June 2019. The participation was obviously triggered by invitations. On the first two days, visitors at a local cycling festival (“Radfrühling Salzburg”) were invited to participate using a tablet on site. The other two peaks can be traced back to institutional e-mail campaigns (see Figure 2).
The data were stored in a single database table and distributed as a TSV file (tab separated text file see the Supplementary Materials), which can be opened with any conventional text editor. For any further analysis, the TSV file can be imported either into a database or directly into the respective software environment.
The survey was presented on seven pages, which correspond to the sections listed in Table 1. Some questions were compulsory, in order to prevent participants from quickly clicking through the questionnaire without responding to the questions. The compulsory questions ensure a minimum of relevant information, even when the rest remained unanswered.
Question number 3 (see Table 2) was used as a key question. Participants who stated “never”, skipped sections 3 and 4.

2.1. Fields and Values

In this subsection, all fields (columns) of the presented dataset are listed and the values are explained. We do not provide any interpretation at this point, but leave this to the particular context in which the dataset is going to be used. The order of the fields in the dataset matches the order of the questions in the survey. Unanswered questions result in blank fields. Break-off responses do not have a submission time stamp and can thus be easily filtered out.
Questions with multiple response options result in binary-coded fields for each option. Where we provided the option for further comments, an additional field (with the suffix “detail”) is generated in the table. In sections 2–7, we largely made use of bipolar scales for the self-assessment of respondents, where they could locate themselves between two poles of a spectrum. Technically, these questions were implemented with a slider that represented numeric values between 0 and 100. Starting from the neutral position (50), the slider could be moved to the left (left pole of the spectrum, first mentioned option) or to the right side (right pole of the spectrum, second mentioned option). Thus, values <50 represent a tendency towards the left pole and values >50 represent a tendency towards the right pole of the provided spectrum. Sliders were also used for indicating the importance of a statement or the frequency of an activity, ranging from 0 for very unimportant/infrequently to 100 for very important/frequently.

2.2. Descriptive Data Statistics

The presented dataset contains 1234 responses, acquired between 3 May and 3 June, 2019. 1073 participants finished the survey, which results in a completion rate of roughly 87%. Forty-seven participants (3.8%) clicked on the survey link, but did not start with the first page of the survey. Most participants broke off the survey at the “Intro” section (52 or 4.2%). The number of break-offs decreases with the progress in the survey, with only 6 break-offs (0.5%) at section 6. Thus, it can be concluded that the major reason for breaking off the survey was a lack of personal interest and/or motivation, but not necessarily the design and content of the questionnaire. All of the following descriptive statistics are calculated from completed surveys only.
The duration, participants needed to complete the questionnaire, varied substantially ( x - = 711.8 seconds with σ = 795.5 s). However, half of the questionnaire was finished in less than 10 minutes ( x - = 574.6 s) and very long editing times can be due to breaks or deferred submissions. Figure 3 shows the distribution of response times for the entire questionnaire.
In total, 569 female, 501 male, and 3 non-binary participants completed the survey. The mean age of the participants was 42 years (σ = 12.75) with a range between 7 and 80 years. The age difference between female ( x - = 40.75, σ = 12.59) and male ( x - = 43.43, σ = 12.79) participants was highly significant (t = −3.45, p < 0.001). Participants with non-binary gender had an average age of 32 years (σ = 6.16).
In terms of educational background, the dataset inclined towards highly educated persons; 60.34% of all participants had a university degree, whereas the percentage is 25.18% in the city of Salzburg and 17.0% in the surrounding district (Salzburg-Umgebung) according to official statistics [10]. Participants with compulsory school as highest degree were underrepresented in our sample (0.65% compared to 21.66% and 11.86%, respectively, in the two reference-districts [10]).
The majority of respondents were frequent cyclists and among them, 38.40% were using the bicycle more than once a day. In the survey, 2.80% of all participants were non-cyclists (see Figure 4). Compared to national and regional modal split statistics [1,11], cyclists were overrepresented in the sample. The primary trip purpose of all the respondents was commuting to work, university, or school. Thus, we can conclude that the dataset represented the perspectives of mainly utilitarian cyclists.
Cyclists were asked to rate the importance of motivators for cycling on a continuous, bipolar scale. Averaging all respondents, the image and the social aspect of cycling are regarded as rather unimportant (Figure 5). Flexibility is the major motivator for cycling among all participants of this study. Eco-friendliness and health benefits are of similar importance.

3. Methods

The study design, the acquisition of survey participants, and the technical set up of the survey are described in Section 1 and Section 2. In this section, we briefly elaborate on the data processing. Figure 6 gives an overview of the four major steps.
We stored all responses in a MySQL database, which was hosted together with LimeSurvey on an Apache webserver. After the expiry date of the online survey, we exported all data in a flat table file. Metadata were automatically attached to the responses. The survey was conducted in German language. Thus, we added field names in English and translated the response options. Free text responses were provided in unchanged form and language. However, the free text responses to question 39 were tagged with English key words and semantically analyzed. We used the semantic analysis for classifying the reported key situations in negative or positive experiences. The tags and the classification were added to the dataset and flagged as derived fields in Table 2.
Due to the anonymity of all respondents, we cannot guarantee that all responses are unique. However, we inspected the dataset for conspicuous patterns such as identical responses or largely unanswered questionnaires, but could not find any. An additional indicator for the soundness of the data is the number of collected e-mail addresses from participants, who registered for the raffle: we collected 935 different e-mail addresses from 1073 completed questionnaires (note that the two databases cannot be linked). Given the fact that not all participants wanted to register for the raffle, we can assume a high percentage of unique participants in the survey.

Supplementary Materials

The dataset is attached as a TSV file at https://www.mdpi.com/2306-5729/4/4/140/s1.

Author Contributions

M.L., project leader of “Bicycle Observatory”, was involved in the conceptualization of the survey, and wrote the manuscript. C.W. did the entire data processing. L.H. was involved in the conceptualization of the survey and set up the online survey. P.K. and G.I. were responsible for the conceptualization of the survey.

Funding

The Project Bicycle Observatory (FFG Nr. 865176) is co-funded by the Austrian Ministry for Transport, Innovation and Technology (BMVIT) under the program “Mobility of the Future”. The following partners are involved in the project: (1) University of Salzburg, Department of Geoinformatics–Z_GIS (coordinator), (2) Salzburg Research Forschungsgesellschaft m.b.H., (3) Helios, and (4) PRISMA solutions EDV-Dienstleistungen GmbH.

Acknowledgments

The help of Christian Seekircher, who provided the technical infrastructure for the online survey, is greatly acknowledged. Further thanks go to the anonymous reviewers, who provided constructive feedback. We appreciate the support by three sponsors, who provided the incentives for the survey: Skinfit, IKO, and Salzburg Land Tourismus.

Conflicts of Interest

The authors declare no conflicts of interest. The funders had no role in the design of the study; in the collection, analyses, or interpretation of data; in the writing of the manuscript; or in the decision to publish the results.

Appendix A

The online survey used a reduced design, which was compatible with different devices. We put a special focus on user-friendly handling of sliders on mobile devices. The look and feel of the survey are shown in Figure A1.
Figure A1. Single-choice question (left) and a bipolar slider (right) on a mobile device and desktop respectively.
Data 04 00140 g0a1
In the following the questions and response options are translated from the original questionnaire in German language.
1.
With which means of transport have you been travelling today?
car
bicycle
bus
railway
walk
other
2.
Which means of transport do you usually use for your everyday trips?
car
bicycle
bus
railway
walk
other
3.
How often do you usually go by bicycle?
several times per day
4–7 times per week
1–3 times per week
1–3 times per month
less frequent
never
4.
Do all members of your household have access to a roadworthy bicycle for their personal use?
If not, please note: X out of X people have a bicycle. (e.g., 3 out of 5)
Yes, everyone has his or her own bicycle available
No, not all have one, but ... [free text]
No answer
5.
What type of bicycle do you use for your everyday trips? If you want, specify the type in the text input field.
eBike         [free text]
City or trekking bike  [free text]
Mountain bike    [free text]
Road race bike    [free text]
Special bike      [free text]
Other        [free text]
6.
In general: Are you a more comfortable or more active person?
  • Comfortable -------o------- Active
7.
Meeting social norms is extremely important to you. Or should one free his-/herself from it and act completely independently?
  • Meeting social norms -------o------- Acting independently
8.
Are individuality, flexibility and independence important to you, or do you prefer to be part of a group?
  • Independent -------o------- Integrated
9.
Are you an absolute outdoor and nature fan? Or do you prefer urban attractions?
  • Outdoor fan -------o------- Urban attractions
10.
Is it important for you to reach a destination as quickly as possible? Or is the journey the reward?
  • Destination -------o------- Journey
11.
Do you prefer a bit of chaos and freedom or rather order and safety?
  • Chaos and freedom -------o------- order and safety
12.
You are spontaneous, get excited quickly and then get started? Or are you deliberating on decisions before and after?
  • Spontaneous -------o------- Deliberative
13.
Everything should remain stable, just as it is. Or is every change an opportunity?
  • Stability -------o------- Change
14.
Better to go for a run and exercise for an hour, or to read three chapters of a book and stimulate the mind?
  • Go for a run -------o------- Reading
15.
You like to be active together with your family and friends? Or do you prefer individual activities?
  • Family and Friends -------o------- On my own
16.
Do you maintain many, rather loose friendships or do you have few, but very close friends?
  • Many loose friendships -------o------- Few, but close friendships
17.
You love it when everything runs smoothly and routinely? Or are you thriving when unforeseen things occur and you can show your talent for improvisation.
  • Routine -------o------- Improvisation
18.
Do you like it simple and clear or rather complex and detailed?
Data 04 00140 i001
  • Simple and clear -------o------- Complex and detailed
19.
You like small towns and down-to-earth traditions? Or do you prefer modern and dynamic cities?
Data 04 00140 i002
  • Traditions -------o------- Modern Cities
20.
Do you love luxury, or are you living modestly?
Data 04 00140 i003
  • Luxury -------o------- Modesty
21.
Do you only cycle when the weather is nice? Or does a little rain make no difference for you—you can dress accordingly!
  • Nice weather only -------o------- Any weather
22.
You do not necessarily need a bicycle way because you can cope with any traffic situation? Or would you rather cycle on a protected bicycle way?
  • In any traffic situation -------o------- On protected bicycle ways only
23.
Fast and short connections are important? Or are you accepting detours in order to gain more comfort?
  • Fastest, shortest route -------o------- more comfortable, longer route
24.
Signposted bicycle routes are important to you? Or do you find your own way and drive cross-country if necessary?
  • Signposted -------o------- Cross-country
25.
You always look several times in all directions before you start cycling? Or a quick look to the left and right and then start cycling self-confidently—the others will see you in any case?
  • Careful -------o------- Self-confidently
26.
You use your bicycle for your everyday trips to get fast from A to B? Or do you rather cycle gently and enjoy the surroundings?
  • Fast -------o------- Gently
27.
As a cyclist, are you wild and free? Or are you disciplined and follow all traffic rules?
  • Wild -------o------- Disciplined
28.
Intuitively: is cycling more classic or more punk for you?
  • Classic -------o------- Punk
29.
If the traffic was calm and orderly, then cycling is boring for you? Or you do not care for the thrill at all?
  • Thrill -------o------- Prefer calm and orderly
30.
Do you regard the bicycle primarily as a means of transport or is it for sports and recreational purposes?
  • Means of transport -------o------- Sports
31.
Do you use the bicycle for everyday trips or only on special occasions?
  • Everyday trips -------o------- Special occasions
32.
Are you cycling for pragmatic reasons, or is cycling an expression of your lifestyle?
  • Pragmatic -------o------- Lifestyle
33.
Do you cycle, because many do it, or because you love it and feel like it?
  • Because many do it -------o------- Because I feel like it
34.
Do you find cycling sometimes unnecessarily exhausting? Or do you regard it as a sporty challenge?
  • Sometimes exhausting -------o------- Sporty challenge
35.
How important are the following reasons for cycling for you personally?
  • Time savings         unimportant -------o------- very important
  • Flexibility            unimportant -------o------- very important
  • Comfort            unimportant -------o------- very important
  • Low cost              unimportant -------o------- very important
  • Health benefits         unimportant -------o------- very important
  • Eco-friendliness          unimportant -------o------- very important
  • Strengthening social contacts  unimportant -------o------- very important
  • Image of cycling       unimportant -------o------- very important
  • Pleasure of cycling      unimportant -------o------- very important
36.
Do you prefer travelling with others or alone?
  • Cycling together -------o------- Alone
37.
Do you already consider going by bicycle, when you make an appointment? Or do you make your plans independently and check afterwards if cycling was feasible?
  • Cycling is part of my planning -------o------- Planning independently and checking afterwards
38.
For which trip purposes do you use the bicycle most often?Put the words in the appropriate order.
  • Work, university, school, etc.
  • Visit friends/family
  • Holiday/leisure trips
  • Shopping etc.
  • City stroll/cultural events
  • Pick-up and delivery
39.
Was there a specific event in your life that (decisively) changed your attitude towards cycling or your cycling behavior? For example, a key event that made you more or less cycling. If yes, please describe this event in brief.
No
Yes, the following [free text]
No Answer
40.
Which means of transport should be pushed more in your city or community? Please indicate your priority.
  • Bicycle        -------o-------  Walking
  • Car           -------o-------  Public transport
  • Public transport    -------o-------  Bicycle
  • Car           -------o-------  Walking
41.
How important is the future role of cycling in Salzburg?
  • High priority -------o------- Irrelevant
42.
Would you like to cycle more often?
  • Yes, of course -------o------- No, it’s fine as it is
43.
What needs to happen to make you cycle more frequently?
  • [free text]
44.
Would you appreciate public cycling promotion activities by the mayor or celebrities? Or are you not interested in public role models at all?
  • Promotion activities are important -------o------- No interest in public role models
45.
How often do you use the following media outlets for getting information?
  • Daily/weekly newspaper     Never use it -------o------- Frequent use
  • News magazine                    Never use it -------o------- Frequent use
  • Television                              Never use it -------o------- Frequent use
  • Radio                                     Never use it -------o------- Frequent use
  • Online media (blogs etc.)    Never use it -------o------- Frequent use
  • Social media                         Never use it -------o------- Frequent use
46.
Your gender
Female
Male
Diverse
47.
Your year of birth
  • [Drop down menu]
48.
Your highest degree
Compulsory school
Apprenticeship
Post-secondary school diploma
University level degree
Other [free text]
49.
ZIP code of place of residence
  • [Numeric input field]

References

  1. TEMS. City Modal Split Database. Available online: http://www.epomm.eu/tems/ (accessed on 10 October 2019).
  2. Pucher, J.; Buehler, R. Cycling towards a more sustainable transport future. Transp. Rev. 2017, 37, 689–694. [Google Scholar] [CrossRef] [Green Version]
  3. Dill, J.; McNeil, N. Four Types of Cyclists? Examination of Typology for Better Understanding of Bicycling Behavior and Potential. Transp. Res. Rec. 2013, 2387, 129–138. [Google Scholar] [CrossRef]
  4. Damant-Sirois, G.; Grimsrud, M.; El-Geneidy, A.M. What’s your type: A multidimensional cyclist typology. Transportation 2014, 41, 1153–1169. [Google Scholar] [CrossRef]
  5. Aldred, R.; Woodcock, J.; Goodman, A. Does More Cycling Mean More Diversity in Cycling? Transp. Rev. 2015, 36, 28–44. [Google Scholar] [CrossRef] [Green Version]
  6. Banister, D. The sustainable mobility paradigm. Transp. Policy 2008, 15, 73–80. [Google Scholar] [CrossRef]
  7. Selm, M.V.; Jankowski, N.W. Conducting Online Surveys. Qual. Quant. 2006, 40, 435–456. [Google Scholar] [CrossRef]
  8. Revilla, M. Analyzing Survey Characteristics, Participation, and Evaluation Across 186 Surveys in an Online Opt-In Panel in Spain. Methods Data Anal. 2017, 11, 135–162. [Google Scholar]
  9. LimeSurvey Project Team. LimeSurvey: An Open Source Survey Tool; LimeSurvey GmbH: Hamburg, Germany, 2003. [Google Scholar]
  10. Statistik Austria. STATatlas. Available online: https://www.statistik.at/atlas/ (accessed on 10 October 2019).
  11. Tomschy, R.; Steinacher, I. Österreich Unterwegs—Mit dem Fahrrad; Bundesministerium für Verkehr. Infrastruktur und Technologie: Vienna, Austria, 2017; p. 68. Available online: https://www.bmvit.gv.at/service/publikationen/verkehr/fuss_radverkehr/downloads/ou_fahrrad_web.pdf (accessed on 17 October 2019).
Figure 1. Place of residence, according to participants’ response in the online survey. The majority of respondents is located in and around the project’s study area in Salzburg, Austria (75% within 15 km from the center of the study area).
Data 04 00140 g001
Figure 2. Timeline of responses: targeted invitations resulted in immediate increase of participants.
Data 04 00140 g002
Figure 3. Histogram of binned duration times in seconds for all completed questionnaires (N = 1073). The last bin contains completed questionnaires with a duration >2000 s.
Data 04 00140 g003
Figure 4. The relative majority of respondents use their bicycle several times a day (left). The primary purpose for cycling is commuting to work, university, or school (right).
Data 04 00140 g004
Figure 5. Averaged importance of motivators for cycling.
Data 04 00140 g005
Figure 6. Workflow of data processing.
Data 04 00140 g006
Table 1. Structure of the online survey.
SectionTopicQuestion FormatNumber of Questions
1. IntroMobility behavior: mode choice, cycling frequency, bicycle availabilityList (multiple and single choice)5
2. Personal informationLifestyles and habits (general)Bipolar scalar response (slider)15
3. BehaviorCycling behavior: preferences, sensitivity to environmental factors, cycling styleBipolar scalar response (slider)9
4. MotivatorsMotivators and deterrents for cyclingBipolar scalar response (slider), ranking9
5. ExperienceKey moments in cyclingFree text1
6. PerspectivesFuture role of cycling, potential promotersBipolar scalar response (slider), free text5
7. Socio-demographicsMedia consumption, age, gender, education, ZIP codeBipolar scalar response (slider), list (single choice), numeric response5
Table 2. Fields and values of the dataset. Compulsory questions are indicated with *.
SectionQuestion NumberField NameValuesExplanation & Comments
Metadata IDUnique ID for each session
time submittedTime stamp for submissionBreak-offs do not have a submission time stamp
last pageNumeric value [1 … 7]Last visited page: the number indicates at which point respondents broke off the survey
time startedTime stampTime stamp of starting the survey
time last activityTime stampTime stamp of last activity
1. Intro1mode used today—carYes/NoMultiple choice question (“No” for unclicked)
1mode used today—bicycleYes/NoMultiple choice question (“No” for unclicked)
1mode used today—busYes/NoMultiple choice question (“No” for unclicked)
1mode used today—railwayYes/NoMultiple choice question (“No” for unclicked)
1mode used today—walkYes/NoMultiple choice question (“No” for unclicked)
1mode used today—otherFree textParticipants could specify further modes (not translated)
2common mode—carYes/NoMultiple choice question (“No” for unclicked)
2common mode—bicycleYes/NoMultiple choice question (“No” for unclicked)
2common mode—busYes/NoMultiple choice question (“No” for unclicked)
2common mode—railwayYes/NoMultiple choice question (“No” for unclicked)
2common mode—walkYes/NoMultiple choice question (“No” for unclicked)
2common mode—otherYes/NoMultiple choice question (“No” for unclicked)
3 *cycling frequencyseveral times per day
4–7 times per week
1–3 times per week
1–3 times per month
less frequent
never
Single choice question (mandatory)
4everyone in household has an own bicycleYes/NoSingle choice question (blank for unanswered)
5everyday bicycle type—eBikeYes/NoMultiple choice question (“No” for unclicked)
5everyday bicycle type—eBike—detailFree textParticipants were invited to provide more detailed information on their bicycle model
5everyday bicycle type—city or trekkingYes/NoMultiple choice question (“No” for unclicked)
5everyday bicycle type—city or trekking—detailFree textParticipants were invited to provide more detailed information on their bicycle model
5everyday bicycle type—mtbYes/NoMultiple choice question (“No” for unclicked)
5everyday bicycle type—mtb—detailFree textParticipants were invited to provide more detailed information on their bicycle model
5everyday bicycle type—road bikeYes/NoMultiple choice question (“No” for unclicked)
5everyday bicycle type—road bike—detailFree textParticipants were invited to provide more detailed information on their bicycle model
5everyday bicycle type—specialYes/NoMultiple choice question (“No” for unclicked)
5everyday bicycle type—special—detailFree textParticipants were invited to provide more detailed information on their bicycle model
5everyday bicycle type—otherYes/NoMultiple choice question (“No” for unclicked)
5everyday bicycle type—other—detailFree textParticipants were invited to provide more detailed information on their bicycle model
2. Personal Information6comfortable—activeNumeric value [0…100]Blank = unmoved slider, 50 = neutral
7obey social norms—act independentlyNumeric value [0…100]Blank = unmoved slider, 50 = neutral
8independent—integratedNumeric value [0…100]Blank = unmoved slider, 50 = neutral
9outdoor activities—urban attractionsNumeric value [0…100]Blank = unmoved slider, 50 = neutral
10destination—journeyNumeric value [0…100]Blank = unmoved slider, 50 = neutral
11chaos and freedom—order and safetyNumeric value [0…100]Blank = unmoved slider, 50 = neutral
12spontaneous—deliberativeNumeric value [0…100]Blank = unmoved slider, 50 = neutral
13stability—changeNumeric value [0…100]Blank = unmoved slider, 50 = neutral
14rather go for a run—rather read a bookNumeric value [0…100]Blank = unmoved slider, 50 = neutral
15activities with friend or family—individual activitiesNumeric value [0…100]Blank = unmoved slider, 50 = neutral
16many loose friendships—few close friendshipsNumeric value [0…100]Blank = unmoved slider, 50 = neutral
17routine—improvisation
18prefer it simple and clear—complex and detailedNumeric value [0…100]Blank = unmoved slider, 50 = neutral. This question was illustrated with two images.
19traditions—modern citiesNumeric value [0…100]Blank = unmoved slider, 50 = neutral. This question was illustrated with two images.
20luxury—modestyNumeric value [0…100]Blank = unmoved slider, 50 = neutral. This question was illustrated with two images.
3. Behavior21 *nice weather—any weather Numeric value [0…100]Blank = unmoved slider, 50 = neutral
22 *in any traffic situation—only protected bicycle waysNumeric value [0…100]Blank = unmoved slider, 50 = neutral
23 *fastest, shortest route—more comfortable longer routeNumeric value [0…100]Blank = unmoved slider, 50 = neutral
24 *signposted routes—cross-countryNumeric value [0…100]Blank = unmoved slider, 50 = neutral
25careful—self confidentNumeric value [0…100]Blank = unmoved slider, 50 = neutral
26fast—gentlyNumeric value [0…100]Blank = unmoved slider, 50 = neutral
27wild—disciplinedNumeric value [0…100]Blank = unmoved slider, 50 = neutral
28classic—punkNumeric value [0…100]Blank = unmoved slider, 50 = neutral
29need thrill—prefer calm and orderlyNumeric value [0…100]Blank = unmoved slider, 50 = neutral
4. Motivators30means of transport—sports deviceNumeric value [0…100]Blank = unmoved slider, 50 = neutral
31 *use in everyday trips—special occasionsNumeric value [0…100]Blank = unmoved slider, 50 = neutral
32pragmatic—lifestyleNumeric value [0…100]Blank = unmoved slider, 50 = neutral
33many do it—feel like itNumeric value [0…100]Blank = unmoved slider, 50 = neutral
34exhausting—sporty challengeNumeric value [0…100]Blank = unmoved slider, 50 = neutral
35 *time savingsNumeric value [0…100]Blank = unmoved slider, 0 = unimportant, 100 = very important
35 *flexibilityNumeric value [0…100]Blank = unmoved slider, 0 = unimportant, 100 = very important
35 *comfortNumeric value [0…100]Blank = unmoved slider, 0 = unimportant, 100 = very important
35 *low costNumeric value [0…100]Blank = unmoved slider, 0 = unimportant, 100 = very important
35 *health benefitsNumeric value [0…100]Blank = unmoved slider, 0 = unimportant, 100 = very important
35 *eco-friendlinessNumeric value [0…100]Blank = unmoved slider, 0 = unimportant, 100 = very important
35 *strengthening social contactsNumeric value [0…100]Blank = unmoved slider, 0 = unimportant, 100 = very important
35 *image of cyclingNumeric value [0…100]Blank = unmoved slider, 0 = unimportant, 100 = very important
35 *pleasure of cyclingNumeric value [0…100]Blank = unmoved slider, 0 = unimportant, 100 = very important
36cycling together—aloneNumeric value [0…100]Blank = unmoved slider, 50 = neutral
37cycling is part of planning—planning independentlyNumeric value [0…100]Blank = unmoved slider, 50 = neutral
38common purpose 1 (most frequent) work ,   university ,   school ,   etc . visit   friends / family holiday / leisure   trips shopping   etc . city   stroll / cultural   events pick-up   and   delivery Ranking of provided six different trip purposes
38common purpose 2
38common purpose 3
38common purpose 4
38common purpose 5
38common purpose 6
5. Experience39key situation/turning pointYes/No
39key situation/turning point: detailFree textOriginal free text in German language
39key situation/turning point: classification pos/negPos/negSemantic classification of key situation in positive or negative experience (derived field)
39key situation/turning point: classification eventTagsTags for free text information (derived field)
6. Perspectives40 *bicycle—walkingNumeric value [0…100]Blank = unmoved slider, 50 = neutral
40 *car—public transportNumeric value [0…100]Blank = unmoved slider, 50 = neutral
40 *public transport—bicycleNumeric value [0…100]Blank = unmoved slider, 50 = neutral
40 *car—walkingNumeric value [0…100]Blank = unmoved slider, 50 = neutral
41high priority—irrelevantNumeric value [0…100]Blank = unmoved slider, 50 = neutral
42personally increase cycling—not necessaryNumeric value [0…100]Blank = unmoved slider, 50 = neutral
43required changes to increase my cycling frequencyFree textOriginal free text in German language
44promotion activities are important—no interest in public role modelsNumeric value [0…100]Blank = unmoved slider, 50 = neutral
7. Socio-demographics45daily/weekly newspaperNumeric value [0…100]Blank = unmoved slider, 0 = infrequently, 100 = very frequently
45news magazineNumeric value [0…100]Blank = unmoved slider, 0 = infrequently, 100 = very frequently
45televisionNumeric value [0…100]Blank = unmoved slider, 0 = infrequently, 100 = very frequently
45radioNumeric value [0…100]Blank = unmoved slider, 0 = infrequently, 100 = very frequently
45online mediaNumeric value [0…100]Blank = unmoved slider, 0 = infrequently, 100 = very frequently
45social mediaNumeric value [0…100]Blank = unmoved slider, 0 = infrequently, 100 = very frequently
46 *genderfemale/male/diverse
47 *year of birthNumeric valueYear of birth
48 *highest degreeCompulsory schoolApprenticeshipPost-secondary school diplomaUniversity level degreeOtherThe options in German language correspond to Austrian education levels (Pflichtschule, Lehre, Matura, Höherer Ausbildungsabschluss)
49 *ZIP codeNumeric valueZIP code of place of residence
Metadata duration: total surveyNumeric values (seconds)Duration of total survey in seconds
duration: introNumeric values (seconds)Duration of section 1 (page 1) in seconds
duration: general typeNumeric values (seconds)Duration of section 2 (page 2) in seconds
duration: cycling styleNumeric values (seconds)Duration of section 3 (page 3) in seconds
duration: reasonsNumeric values (seconds)Duration of section 4 (page 4) in seconds
duration: key situationNumeric values (seconds)Duration of section 5 (page 5) in seconds
duration: wishesNumeric values (seconds)Duration of section 6 (page 6) in seconds
duration: personNumeric values (seconds)Duration of section 7 (page 7) in seconds

