1. Introduction
The transition to university is a critical period for students, often marked by emerging academic, emotional, and behavioral challenges that affect early adaptation. In recent years, these difficulties have intensified, becoming more visible during and after the COVID-19 pandemic due to prolonged isolation, remote learning, and reduced peer interaction [
1]. Despite this context, higher education institutions continue to rely on reactive support models in which intervention depends on voluntary help-seeking behavior. This approach has been consistently associated with the underutilization of support services and a persistent gap between students’ perceived needs and their willingness to seek professional support, even when experiencing significant difficulties.
Advances in learning analytics and data-driven systems offer new opportunities to address this gap. Data pipeline architectures enable the transformation of large volumes of educational data into actionable insights by integrating data collection, preprocessing, analysis, and visualization processes [
2]. Recent work highlights the importance of structured and transparent pipeline models to improve traceability and interpretability in learning analytics [
3]. From a data engineering perspective, well-designed pipelines are essential for ensuring data quality and consistency in complex environments [
4]. Similar approaches in healthcare and artificial intelligence emphasize scalability and transparency as key requirements for trustworthy data ecosystems [
5]. However, most implementations in higher education remain focused on retrospective performance analysis or isolated indicators. They rarely connect data processing with early identification or coordinated institutional response.
This study introduces YuumCare, a digital screening framework designed to support early detection and structured monitoring of student well-being during the transition to university. The approach shifts from individual help-seeking models toward a population-level perspective supported by a transparent and modular structured data pipeline. Its main contribution lies in integrating structured digital screening, a reproducible data pipeline, and an institutional decision-support perspective. This integration enables the transformation of multidimensional student data into actionable insights for early intervention. The study evaluates the feasibility and operational value of this approach through a real-world deployment with first-year students and outlines a framework that can be adapted to similar higher education contexts.
2. Student Well-Being and Preventive Screening in Higher Education
The transition to university is widely recognized as a critical developmental stage characterized by intensified academic demands, evolving social roles, and increased psychological vulnerability. Longitudinal and cross-national studies consistently show that the first year is a sensitive period in which anxiety, depressive symptoms, and academic stress frequently emerge or intensify, particularly in the absence of structured support [
6,
7]. Prevalence studies across diverse higher education systems indicate that a substantial proportion of students exceed distress thresholds, with academic pressure and reduced sense of belonging strongly associated with adverse outcomes [
8,
9]. From this perspective, student mental health extends beyond individual clinical conditions and reflects broader interactions among institutional environments, pedagogical practices, and social integration processes [
10]. Socioecological approaches further situate well-being within the interplay of individual, interpersonal, and structural factors, reinforcing the need for coordinated responses embedded within educational systems rather than isolated interventions.
Data-informed approaches have gained relevance for understanding student experiences and supporting institutional decision-making [
11]. However, help-seeking patterns continue to reveal a persistent mismatch between identified needs and actual service utilization. Many students rely on informal support networks and face barriers such as stigma, limited awareness, or accessibility constraints when approaching formal services [
12]. As a result, reactive models based solely on voluntary engagement remain insufficient during high-risk transitional periods. In response, screening has emerged as a preventive, population-level strategy aligned with student retention and success objectives. Validated instruments support the detection of early signs of distress and enable large-scale monitoring [
7,
8]. Digital platforms have extended these capabilities by facilitating scalable data collection and remote assessment [
13,
14,
15]. Recent advances in artificial intelligence and digital mental health further expand these approaches through predictive analysis and automated risk identification [
16,
17,
18,
19,
20].
When integrated into structured support pathways, these approaches can function as early-awareness mechanisms that connect well-being monitoring with academic persistence strategies. Nevertheless, important limitations remain. Differences in infrastructure and analytical capacity, particularly in emerging contexts, constrain large-scale implementation [
21]. Fragmented governance, limited interpretability, and uneven validation also hinder effective integration into institutional decision-making [
22,
23,
24,
25,
26]. As a result, a disconnect persists between technological capability and coordinated implementation. Although existing research provides strong evidence on student vulnerability and the effectiveness of digital interventions, fewer studies examine how screening processes can be operationally embedded within institutional practices to support systematic identification and coordinated response. Limited attention has been given to how screening data can be consistently processed, organized, and translated into actionable decision-support mechanisms within real-world educational environments, particularly under constraints of scalability, interpretability, and institutional alignment. This gap is especially relevant in Latin American higher education systems, where variability in resources and institutional capacity requires solutions that are both scalable and operationally feasible. Within this context, YuumCare is introduced as a preventive, transition-focused approach that integrates structured screening, exploratory risk stratification, and coordinated support processes within a transparent and reproducible structured data pipeline, enabling early detection and more systematic, data-informed institutional responses.
3. The YuumCare Framework
YuumCare is conceived as a digital, process-oriented approach designed to support the early detection of students’ well-being needs and to guide preventive responses during the transition into university life. Rather than operating as a standalone application or a clinical intervention system, it integrates accessible digital tools, institutional actors, and structured decision pathways to enable coordinated support during critical academic stages. The design focuses on the entry period into higher education, where emerging emotional and academic challenges often remain unaddressed in the absence of mechanisms for capturing and organizing early signals of vulnerability.
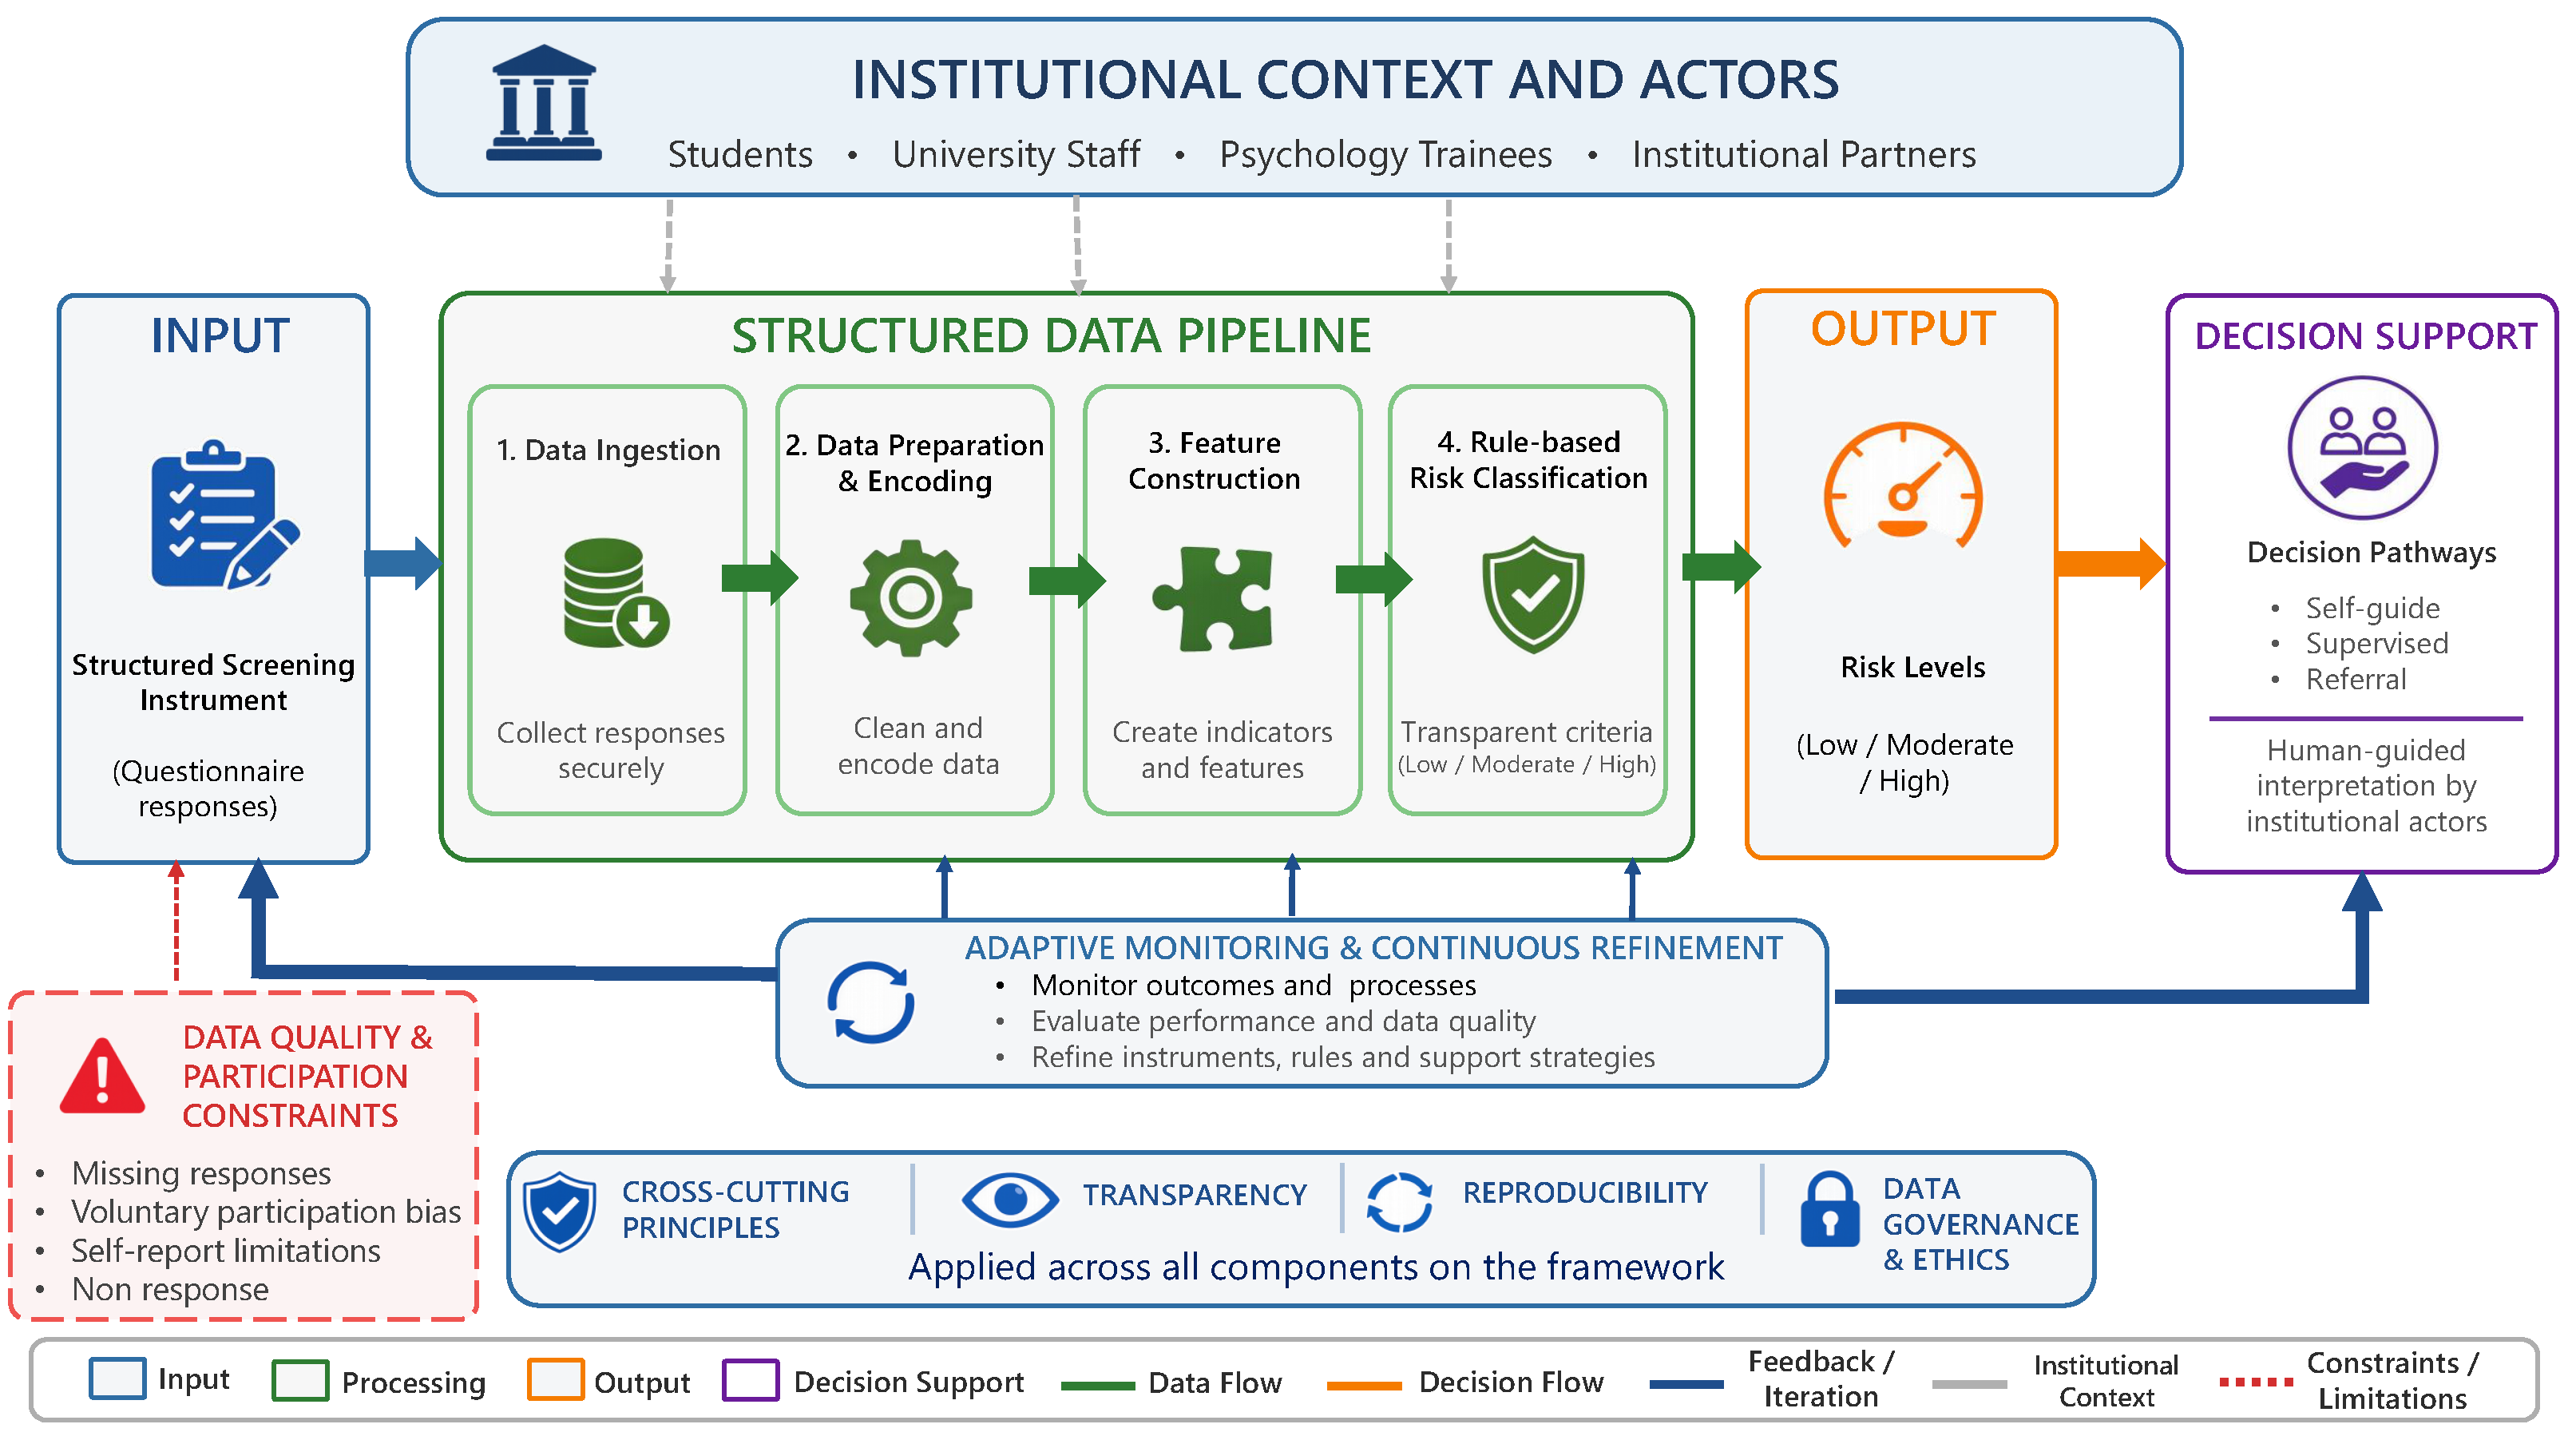
Figure 1 illustrates the conceptual architecture of YuumCare, situating digital screening, the structured data pipeline, output generation, and decision support within a broader institutional ecosystem composed of university personnel, psychology trainees, and commonly available digital resources. The system is organized into four components: (i) digital screening input, (ii) structured data pipeline, (iii) output generation in the form of risk levels, and (iv) decision support pathways. Together, these elements define how student-reported data are transformed into actionable insights through a transparent and reproducible workflow. The framework also incorporates iterative monitoring and contextual influences, allowing for the continuous refinement of instruments, classification rules, and support strategies under real-world conditions.
The pipeline constitutes the core of the system. It includes four stages: data ingestion, data preparation and encoding, feature construction, and rule-based risk classification. These stages represent a progressive transformation of raw questionnaire responses into interpretable indicators that support classification into predefined risk levels. The classification process relies on transparent criteria, allowing for consistent interpretation and facilitating institutional use without dependence on complex or opaque models.
Following classification, outputs are generated in the form of categorized risk levels (e.g., low, moderate, and high). These outputs are directly linked to defined decision pathways, including self-guided resources, supervised sessions facilitated by psychology trainees, and referral to institutional services when required. This linkage enables the system to operate as a bridge between data collection and institutional response. Decision support is interpreted within the institutional context, ensuring that outputs guide rather than automate responses.
The design also incorporates an adaptive monitoring and feedback mechanism that connects outcomes with earlier stages of the workflow. This enables continuous refinement of instruments, classification rules, and support strategies, while accounting for data quality constraints and participation variability inherent to voluntary screening processes. Cross-cutting principles—transparency, reproducibility, and data governance and ethics—are applied across all components, ensuring consistency and responsible data use.
The model is guided by three implementation conditions. It relies on widely adopted digital tools to facilitate participation without requiring specialized infrastructure. It maintains a preventive orientation by prioritizing early detection rather than clinical diagnosis or therapeutic intervention. It is designed to operate across multiple cohorts using existing institutional resources, allowing for gradual scaling without increasing technical complexity. The framework is intended to function under real-world conditions, including variability in participation, data completeness, and institutional capacity.
In this way, YuumCare functions as an operational process embedded within institutional practice.
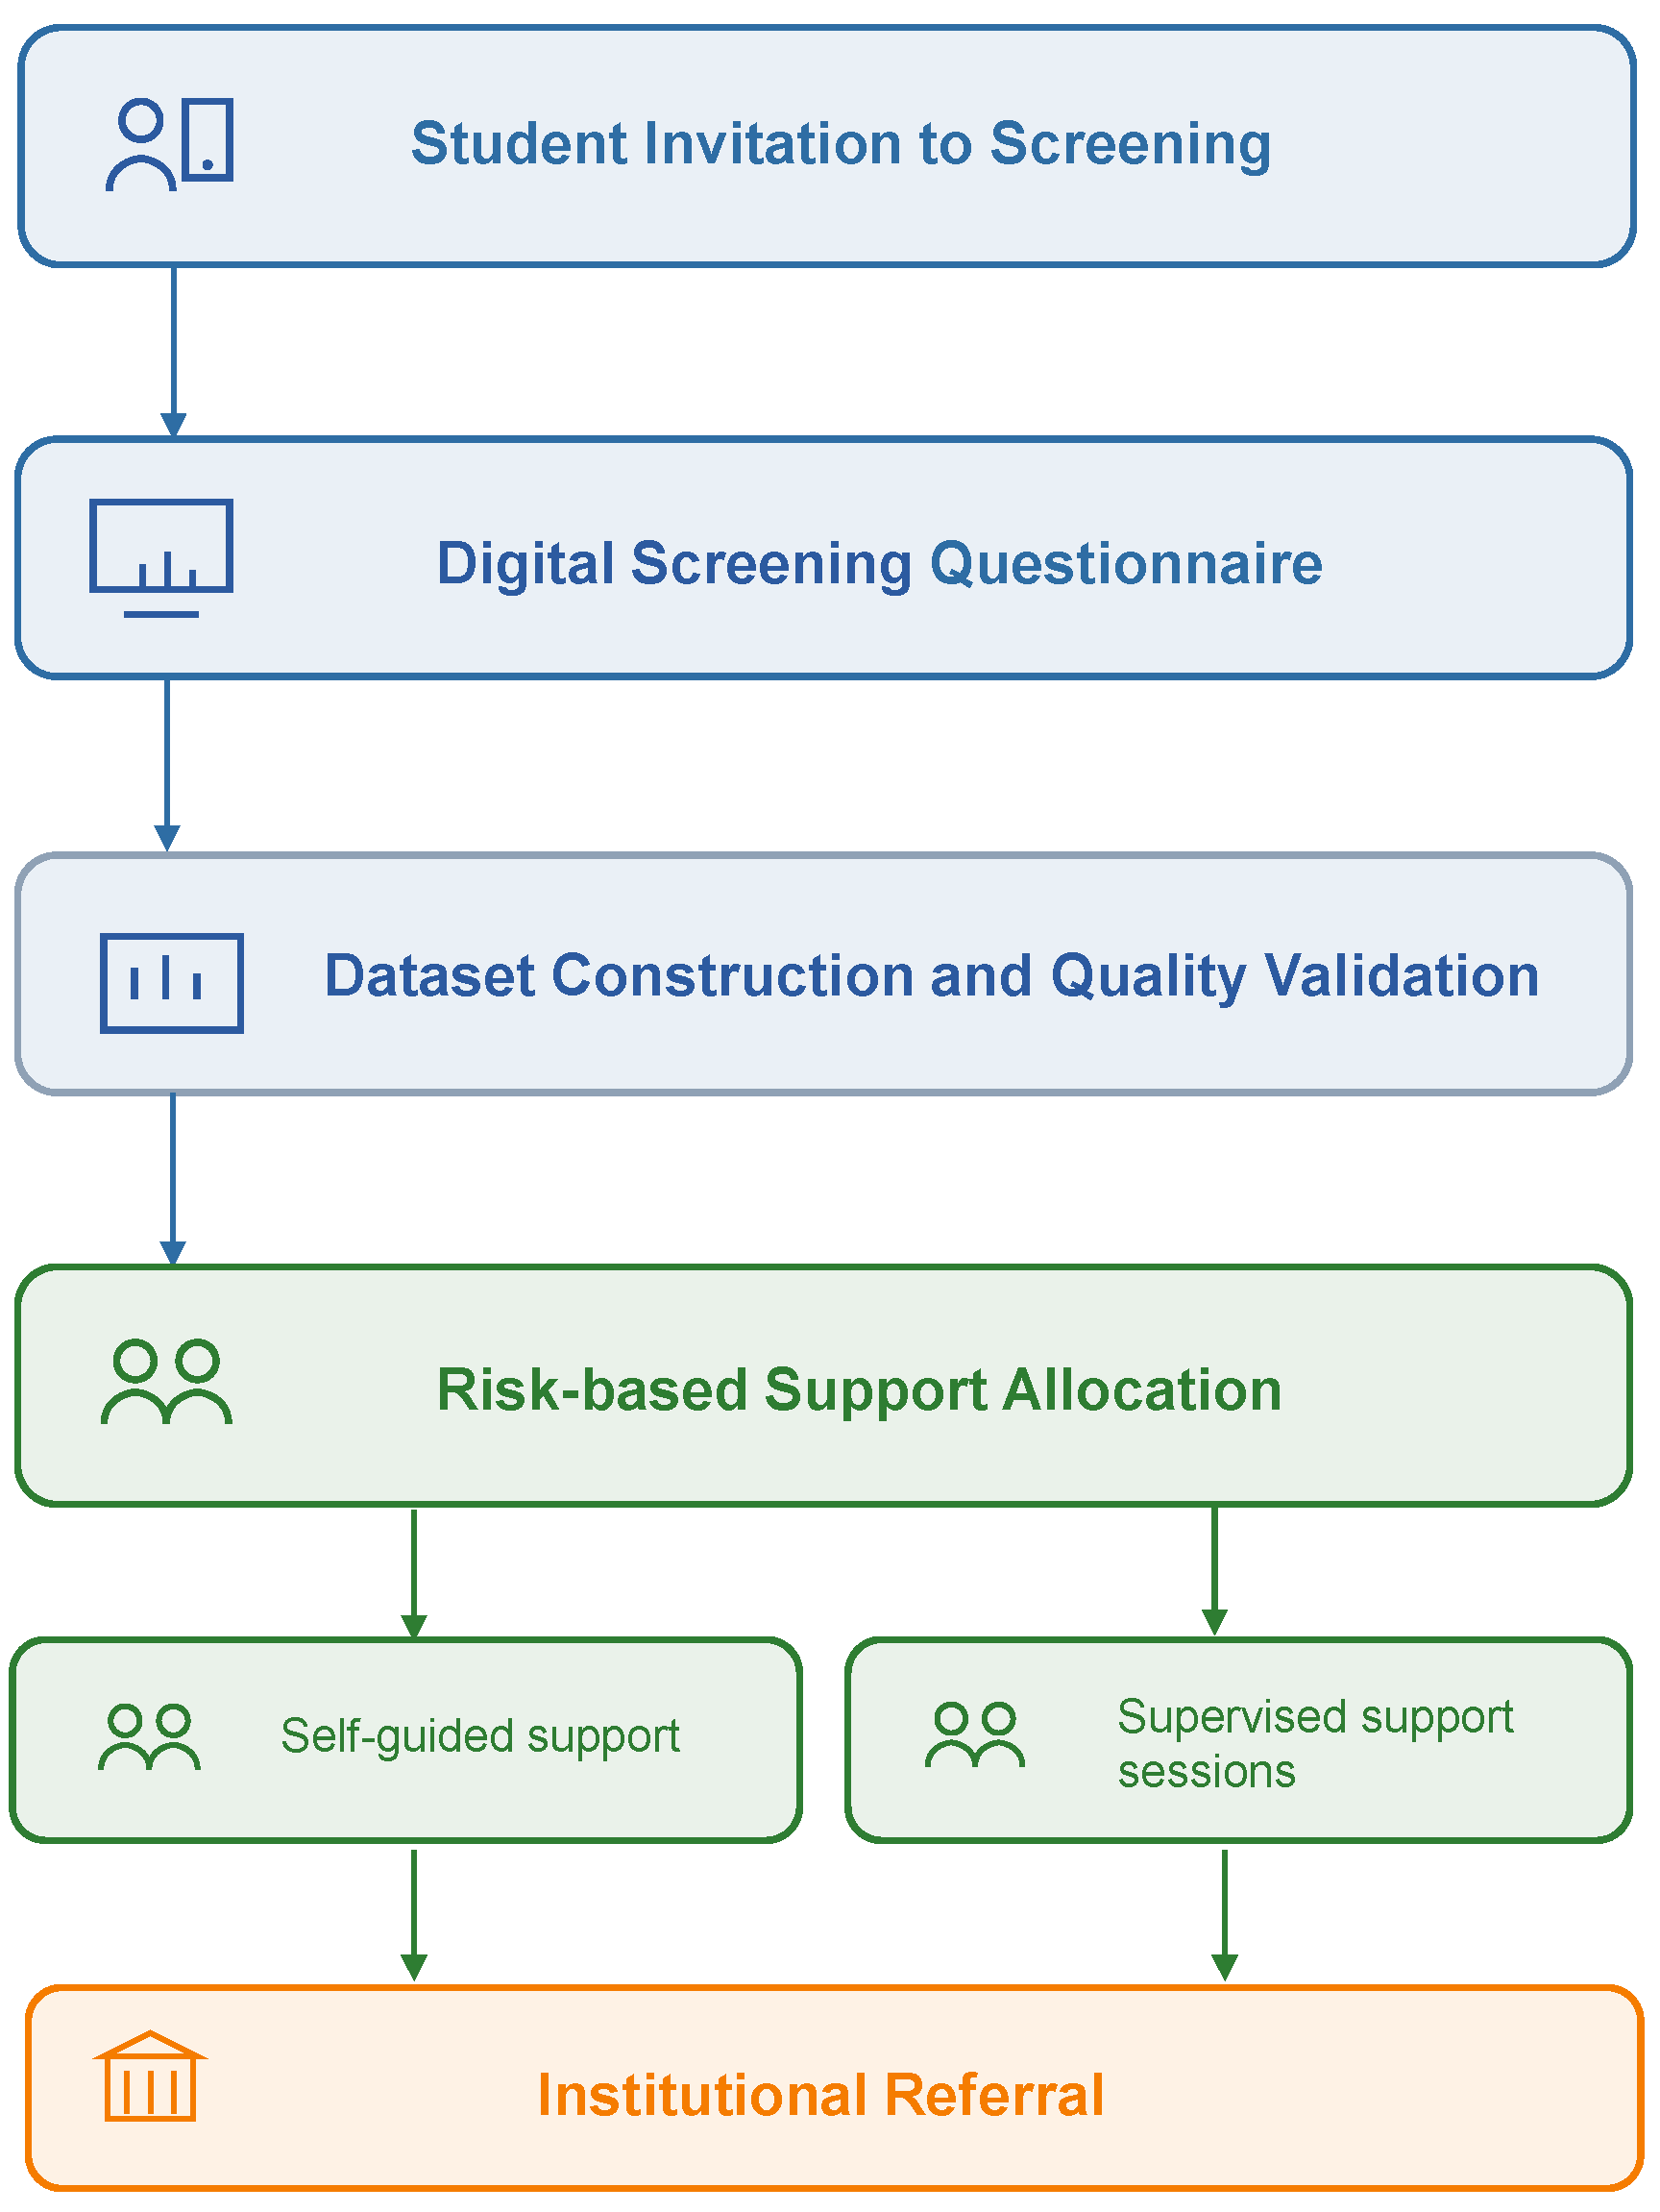
Figure 2 presents the operational workflow followed during the pilot implementation. The process begins with the invitation to participate in a voluntary digital screening, followed by the completion of a structured questionnaire capturing indicators of perceived well-being and support needs. Responses are consolidated through dataset construction and validation procedures and then processed through the data pipeline. The data are prepared, encoded, and transformed into indicators used in the rule-based classification process. Based on the resulting risk levels, students are guided toward appropriate support options aligned with the defined decision pathways. While the long-term vision includes the development of a dedicated platform for continuous monitoring, the present study focuses on this initial stage, examining the feasibility of screening, data organization, and classification within a structured and reproducible process.
4. Materials and Methods
This section operationalizes the YuumCare framework described in
Section 3, detailing its implementation during the pilot deployment. The study examines the initial use of a structured digital screening approach aimed at supporting the early detection of emotional and academic needs among first-year university students. A cross-sectional design was used to characterize patterns of well-being, academic adjustment, and support needs during the first weeks of the academic term. The study was conducted at a public higher education institution in Mexico. A total of 466 students voluntarily completed the screening questionnaire, representing 38.9% of the undergraduate population. Participants ranged in age from 16 to 46 years (
,
), with 62.9% male and 37.1% female. No incentives were provided.
The screening instrument was designed as a non-clinical tool focused on capturing early signals of need rather than producing diagnostic classifications. It includes self-reported indicators related to emotional distress, academic pressure, social adjustment, awareness of institutional resources, and expressed support needs. Each item is treated as an independent analytical variable, preserving interpretability and enabling flexible exploration of student experiences. The instrument can be understood as a structured set of observable indicators describing multiple dimensions of the transition into university.
Table 1 summarizes this structure.
Data were collected using a mixed format that combined online and paper-based responses, enabling digital capture alongside signed informed consent. All responses were consolidated into a single dataset and processed through a structured data pipeline aligned with the framework described in
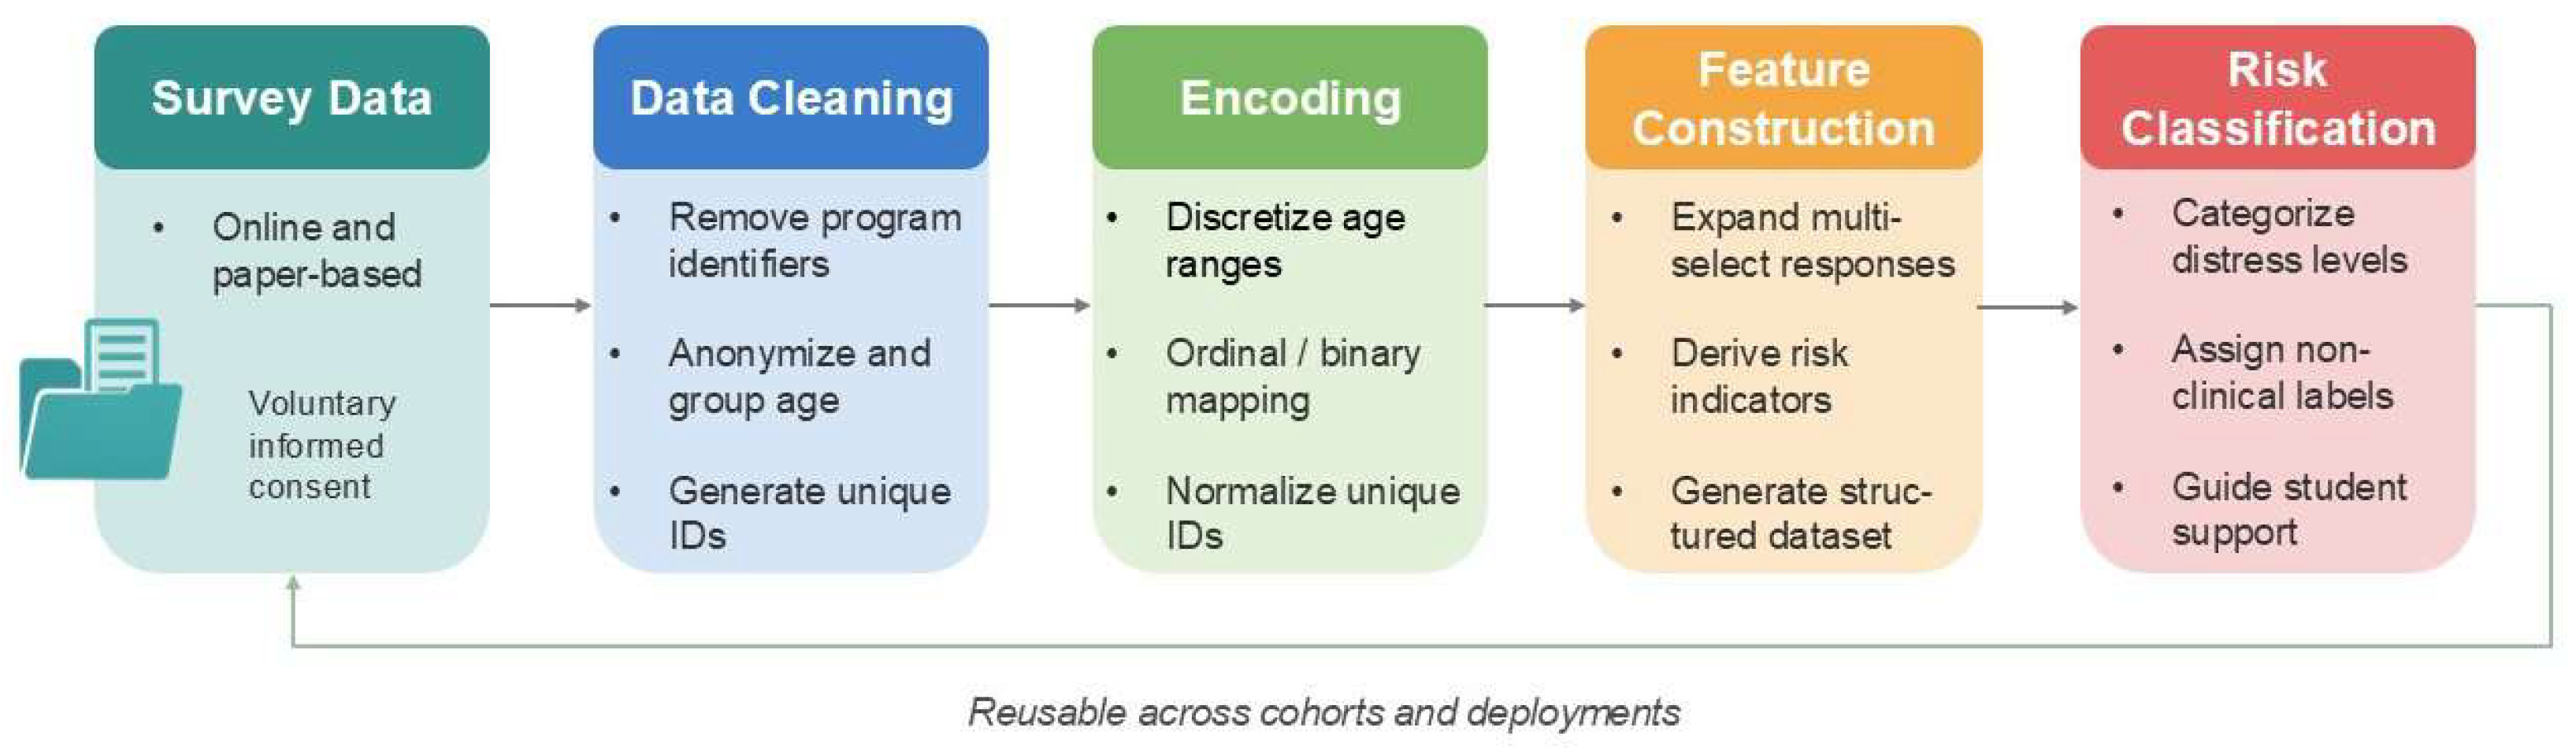
Section 3. During ingestion, responses were unified, while preparation involved removal of free-text fields, normalization of categorical variables, expansion of multi-select responses, and anonymization procedures such as age grouping, removal of program identifiers, and assignment of unique participant IDs (
Figure 3). From a systems perspective, the workflow transforms raw inputs into standardized features and decision-support signals.
Feature construction transforms responses into analytical variables using discretization, ordinal encoding, binary mapping, and multi-hot encoding. These transformations preserve semantic meaning while enabling comparison across individuals.
Table 2 and
Table 3 summarize the conversion of demographic, emotional, social, and support-related variables into structured features used for classification. Additional encoding schemes ensure consistent interpretation across the dataset (
Table 4). Some indicators were encoded using simplified ordinal schemes depending on the structure of the original questionnaire item.
The final stage corresponds to rule-based risk classification. Responses were evaluated using combinations of indicators associated with emotional distress, academic disengagement, and perceived support. Higher risk levels were assigned when multiple high-intensity indicators co-occurred, while lower levels reflected isolated or low-intensity signals. Students were grouped into four non-clinical categories: stable, moderate, severe, and critical (
Table 5). These categories function as operational markers for monitoring and prioritization rather than diagnostic labels, and the rules were intentionally designed to prioritize interpretability and institutional usability over predictive complexity. The classification process was conducted by trained psychology students under professional supervision, and results were directly linked to predefined decision pathways, including self-guided resources, supervised sessions, and referral to institutional services when required.
Although the instrument is not intended as a psychometrically validated clinical scale, its design is informed by widely recognized constructs in student mental health research, including emotional distress, academic adjustment, and perceived social support [
6,
7,
9]. These dimensions provide a conceptual basis for indicator selection while maintaining interpretability and operational usefulness. This study focuses on the initial implementation and does not include longitudinal follow-up of outcomes, so findings reflect feasibility and internal consistency rather than predictive validity over time.
All procedures followed established ethical guidelines, including voluntary participation, informed consent, and anonymization prior to analysis. Data processing and statistical analysis were conducted in Python 3.10 using reproducible scripts. The analysis focused on descriptive summaries of demographic characteristics, emotional and academic indicators, support needs, help-seeking attitudes, and risk classification distributions. Categorical variables were reported as frequencies and percentages, while continuous variables were described using measures of central tendency and dispersion. For selected indicators, 95% confidence intervals were estimated using the Wilson method. Missing data were minimal and were explicitly preserved using a dedicated “No response” category rather than imputation or record removal. This approach prioritizes transparency, interpretability, and reproducibility over predictive modeling.
During manuscript preparation, an AI-assisted writing tool was used to improve clarity and coherence. All content was carefully reviewed, revised, and approved by the authors to ensure its accuracy and originality.
5. Results
A total of 466 first-year students participated in the screening, representing 38.9% of the undergraduate population. This level of participation confirms the feasibility of voluntary large-scale screening during the initial weeks of the academic term and provides sufficient coverage to characterize population-level patterns of early-stage vulnerability. The precision of this estimate is supported by the Wilson 95% confidence interval for the response rate (38.9%, 95% CI: 36.2–41.7) [
27,
28]. This indicates that the sample is adequate for descriptive institutional analysis, although it is not intended for causal inference or predictive validation. The cohort reflects the typical entry profile, with a mean age of 18.06 years (
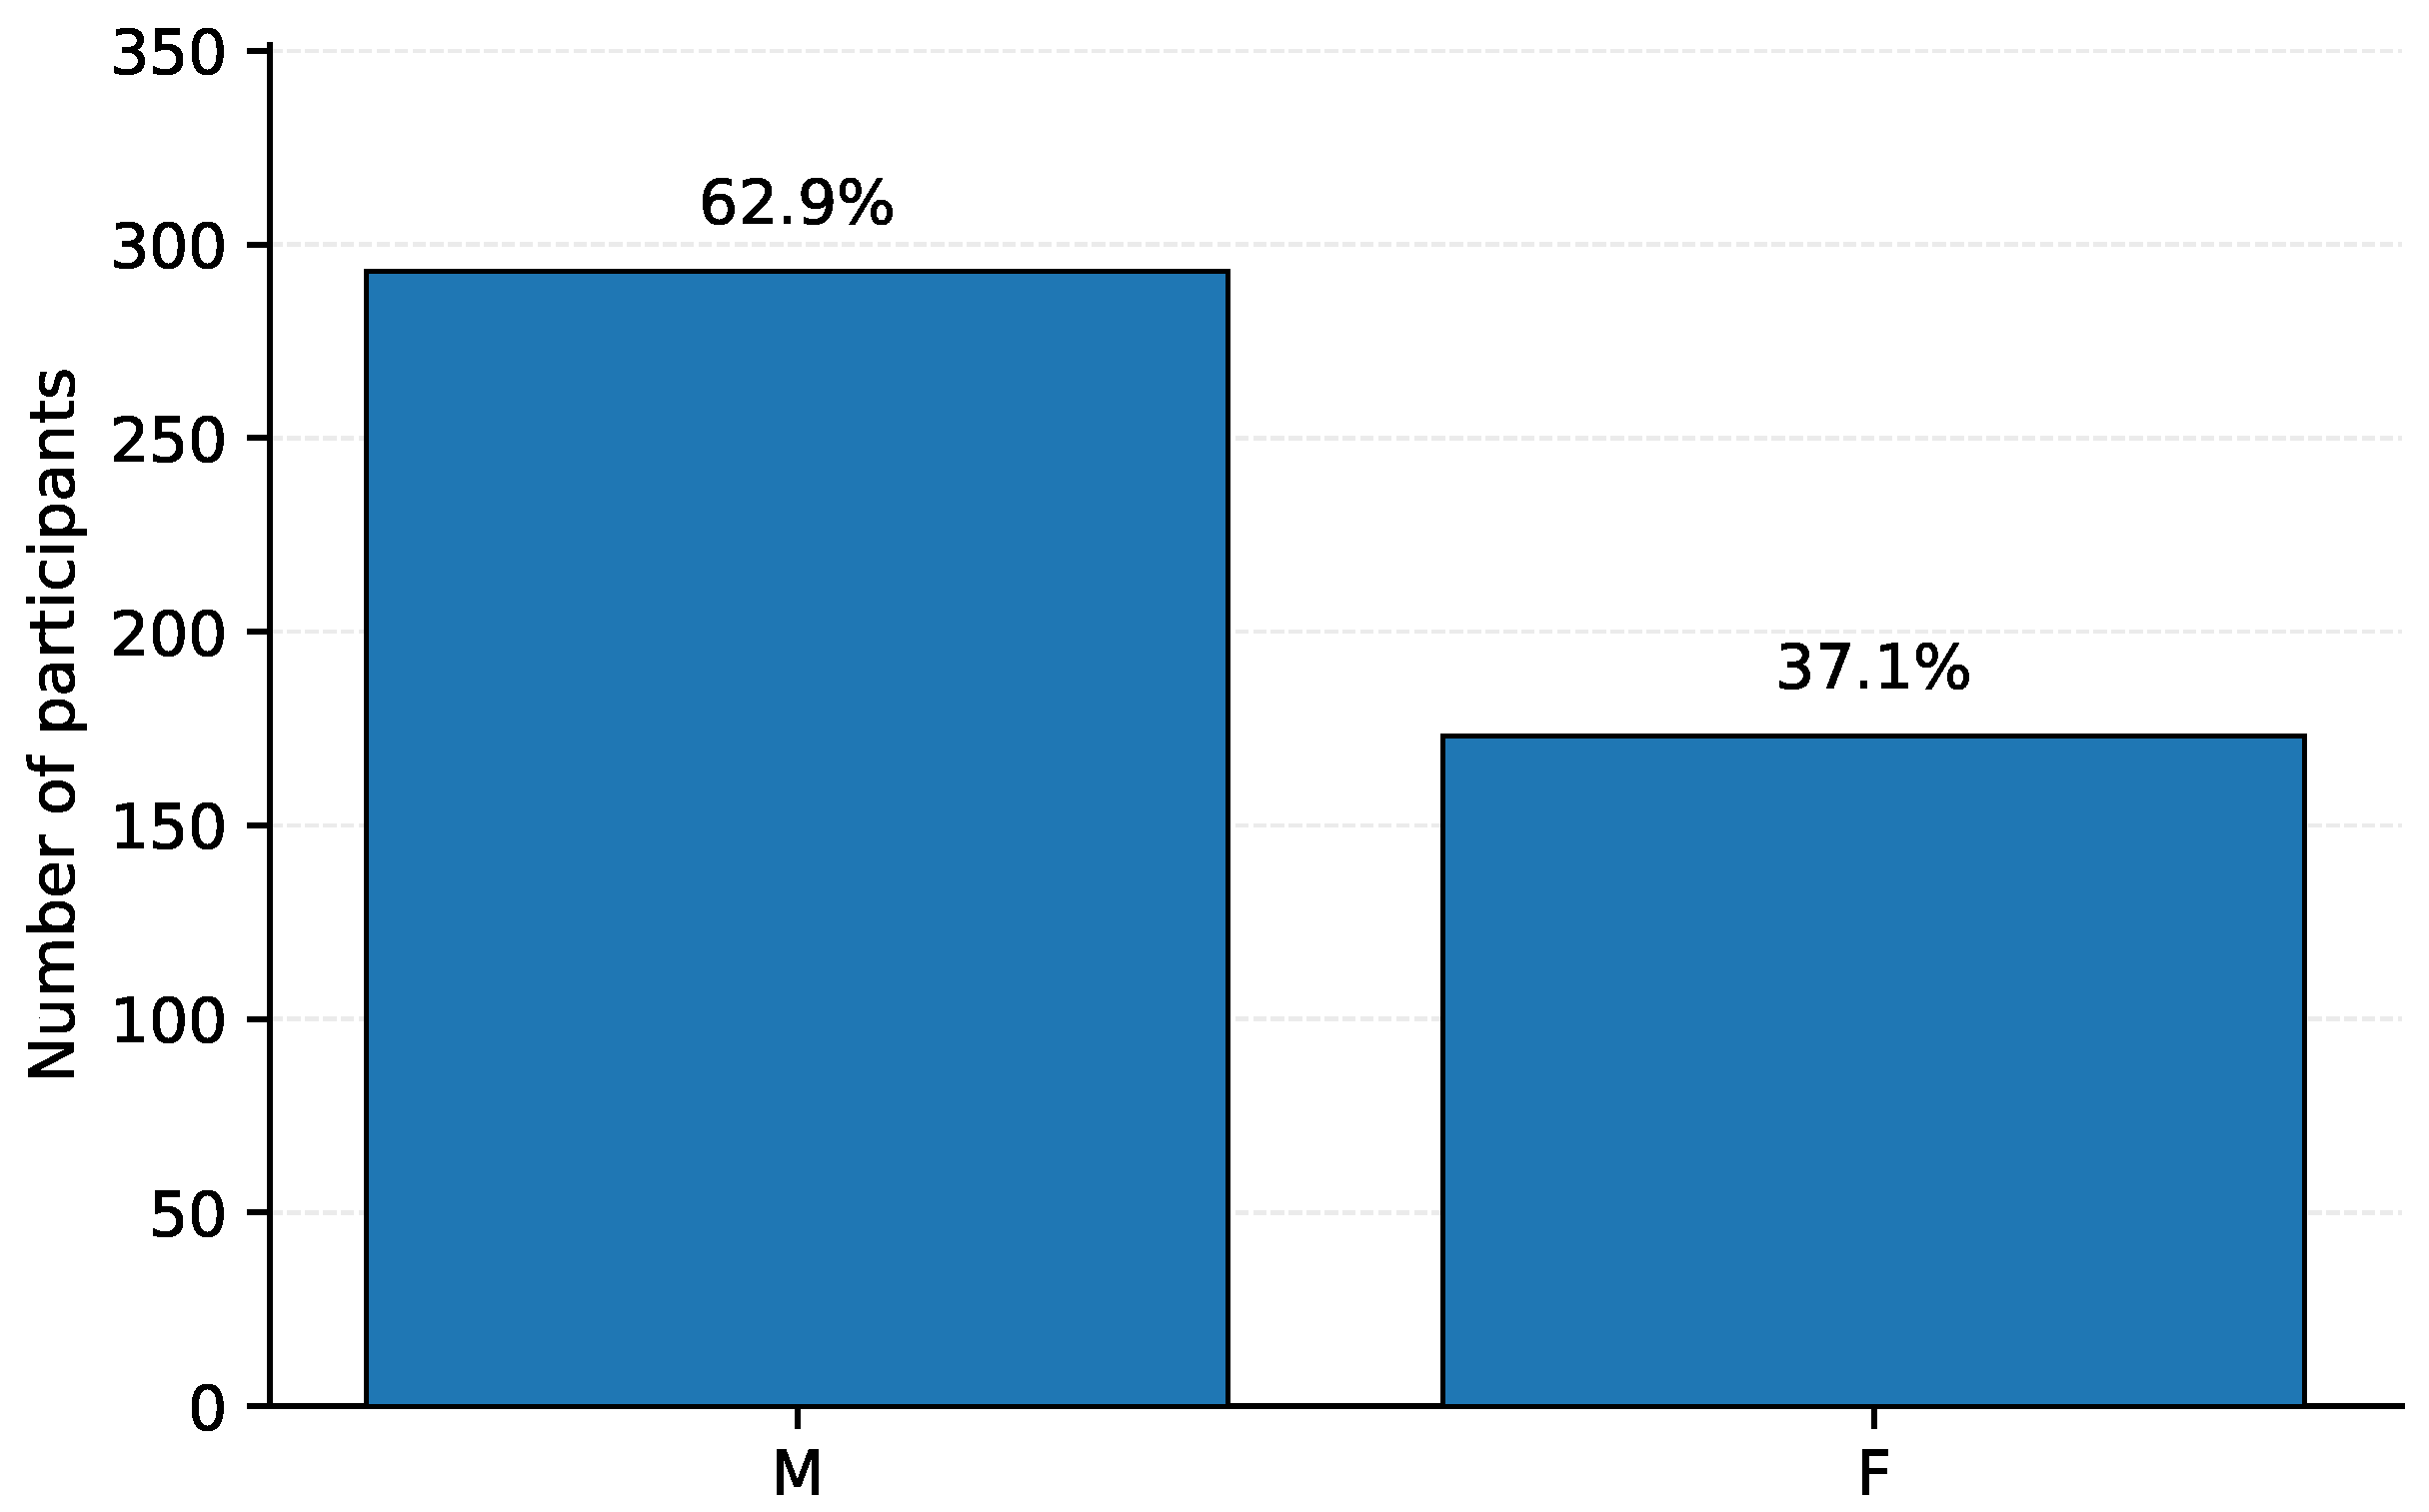
), a strong concentration in the 16–18 range (85.8%), and a gender distribution of 62.9% male and 37.1% female (
Table 6,
Figure 4). These characteristics provide the baseline for interpreting the patterns identified through the screening process.
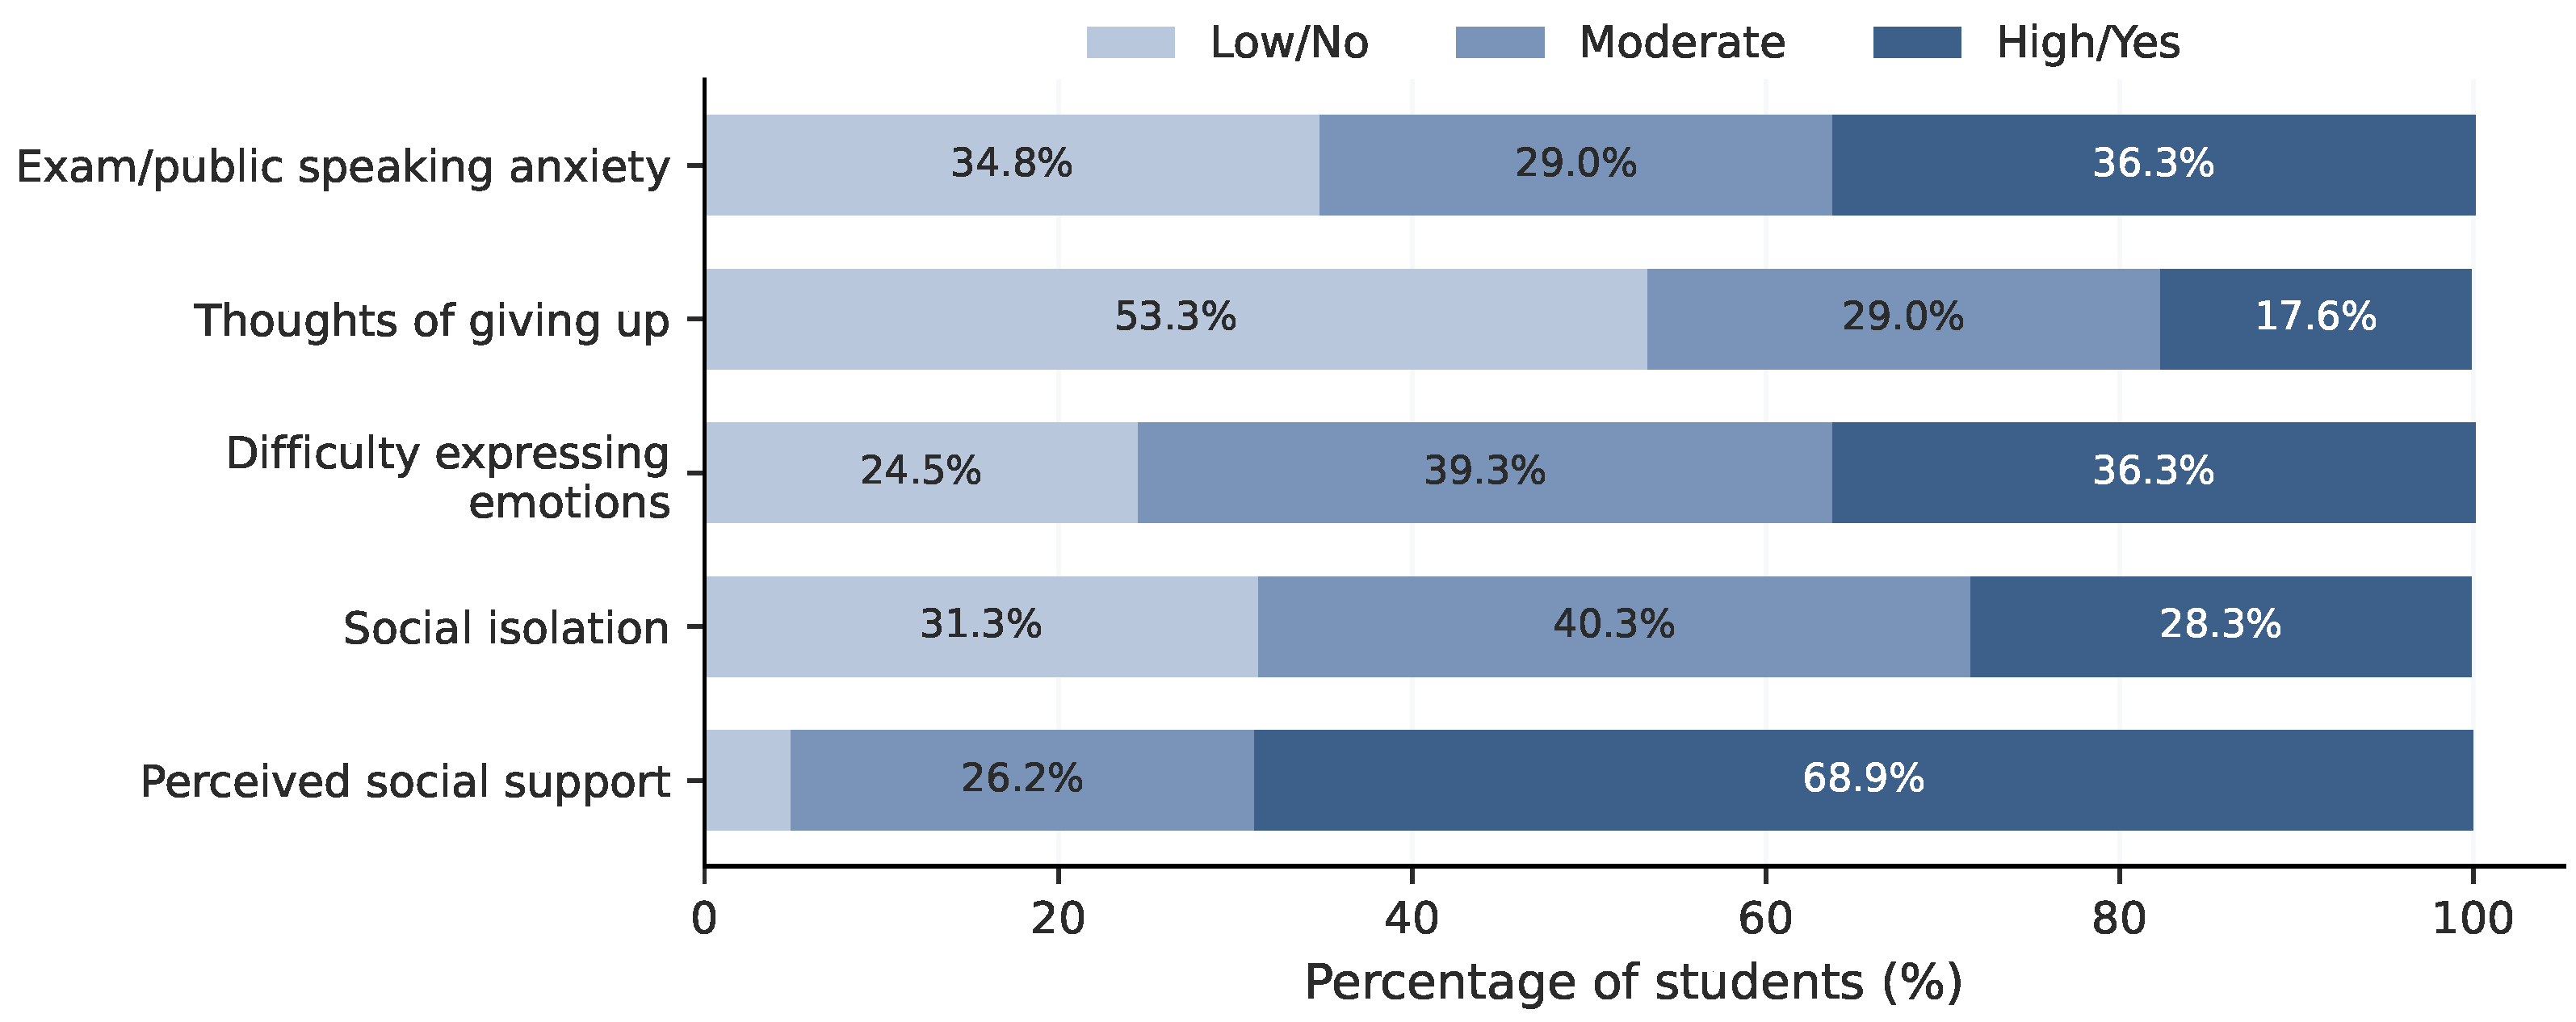
The processed indicators reveal consistent patterns across emotional and academic dimensions. Moderate to high levels of exam-related anxiety, difficulty expressing emotions, and social isolation are observed in a substantial portion of the cohort (
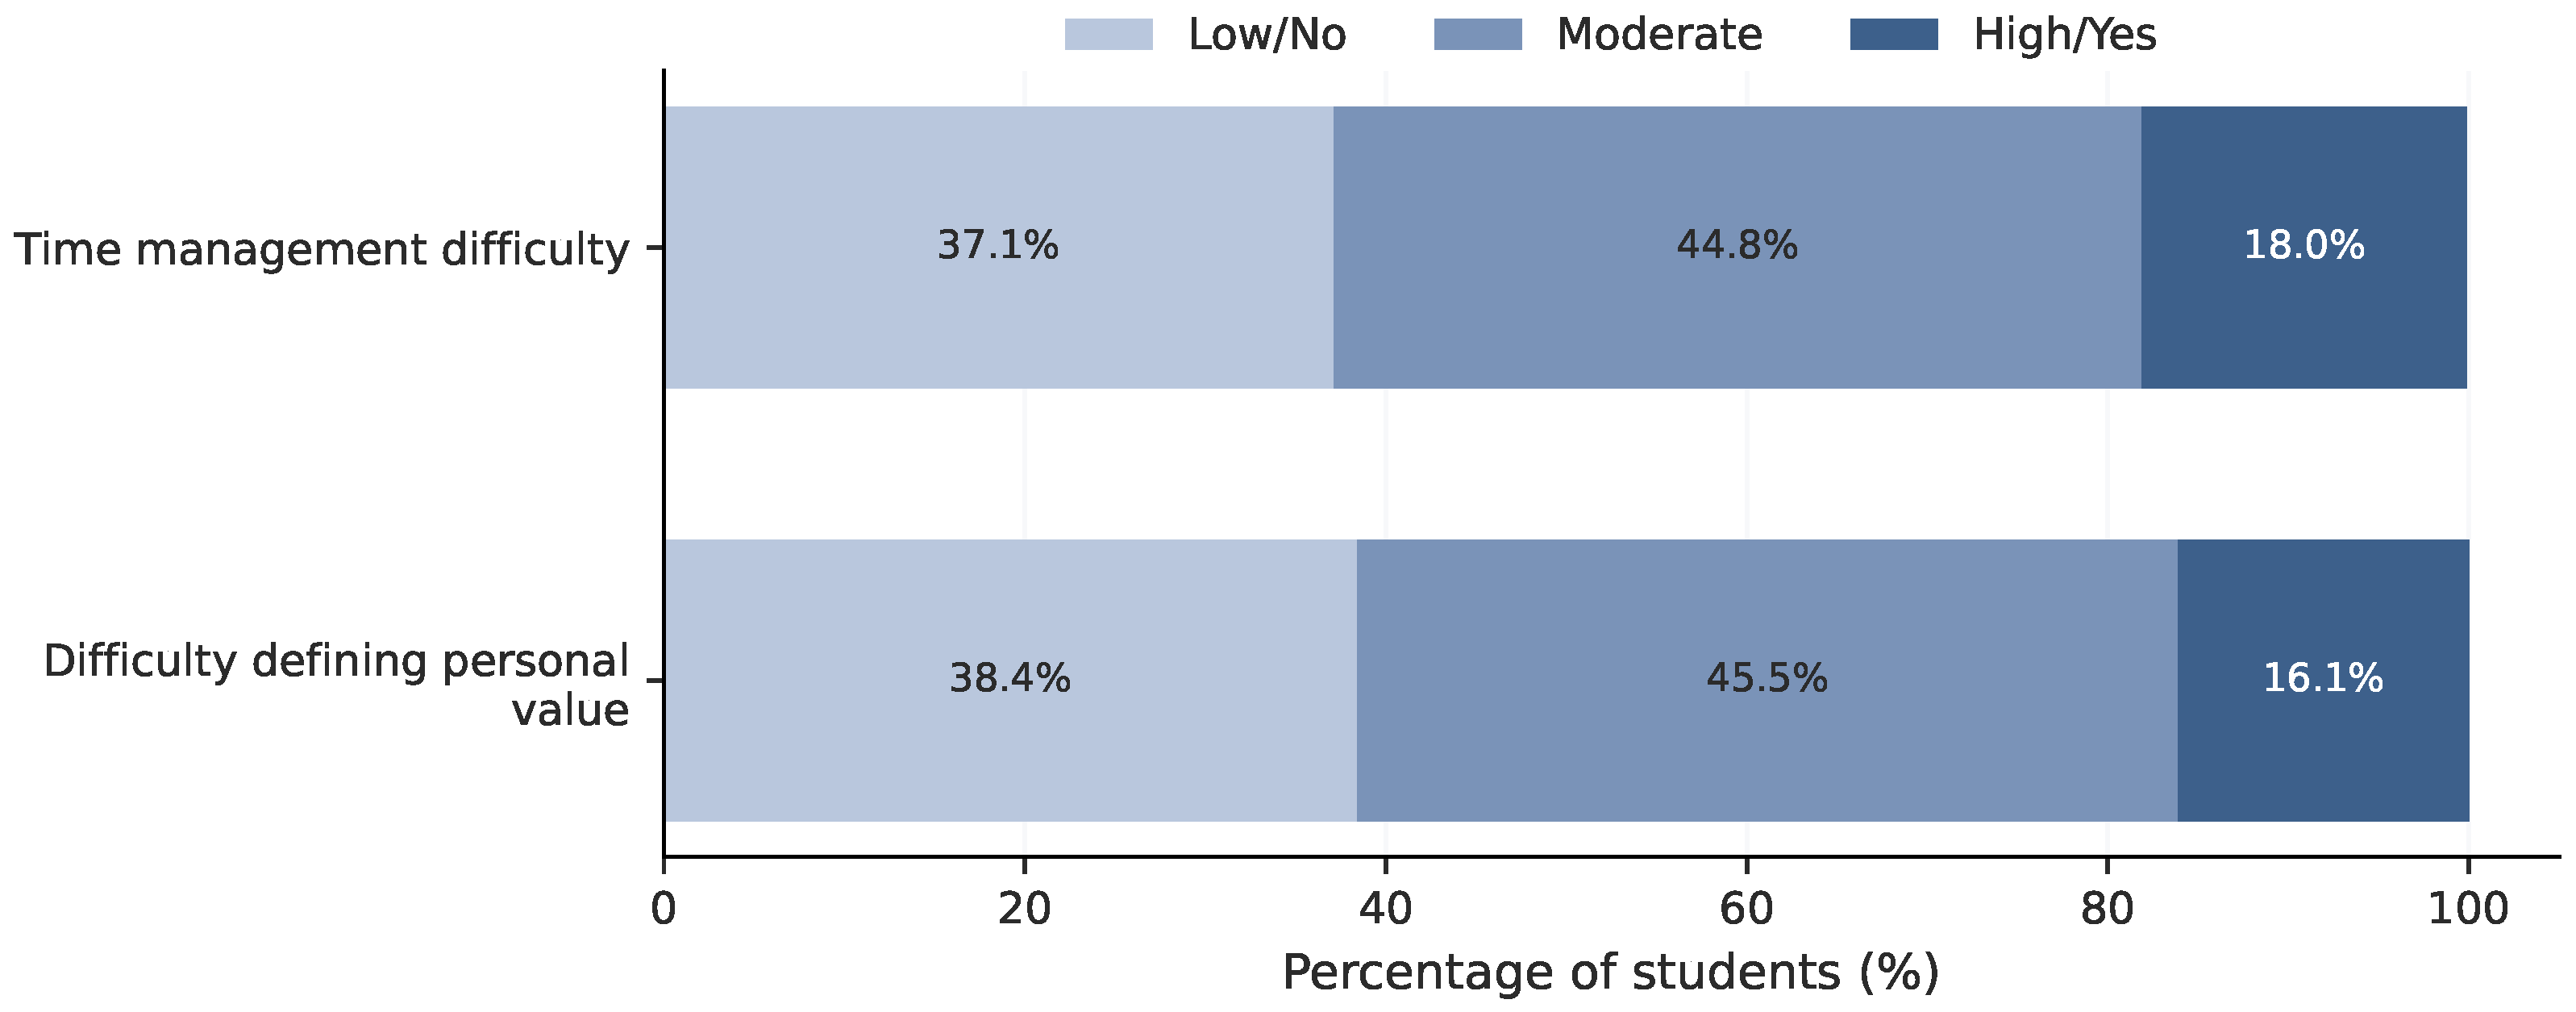
Figure 5), while academic indicators show similar trends, particularly in time management and perceived performance pressure (
Figure 6). These patterns suggest that emotional and academic challenges emerge concurrently during the first weeks of university life, forming overlapping signals captured through the screening process.
Despite these signals, help-seeking behavior remains limited. Most students reported low intention to seek professional psychological support (81.3%) (
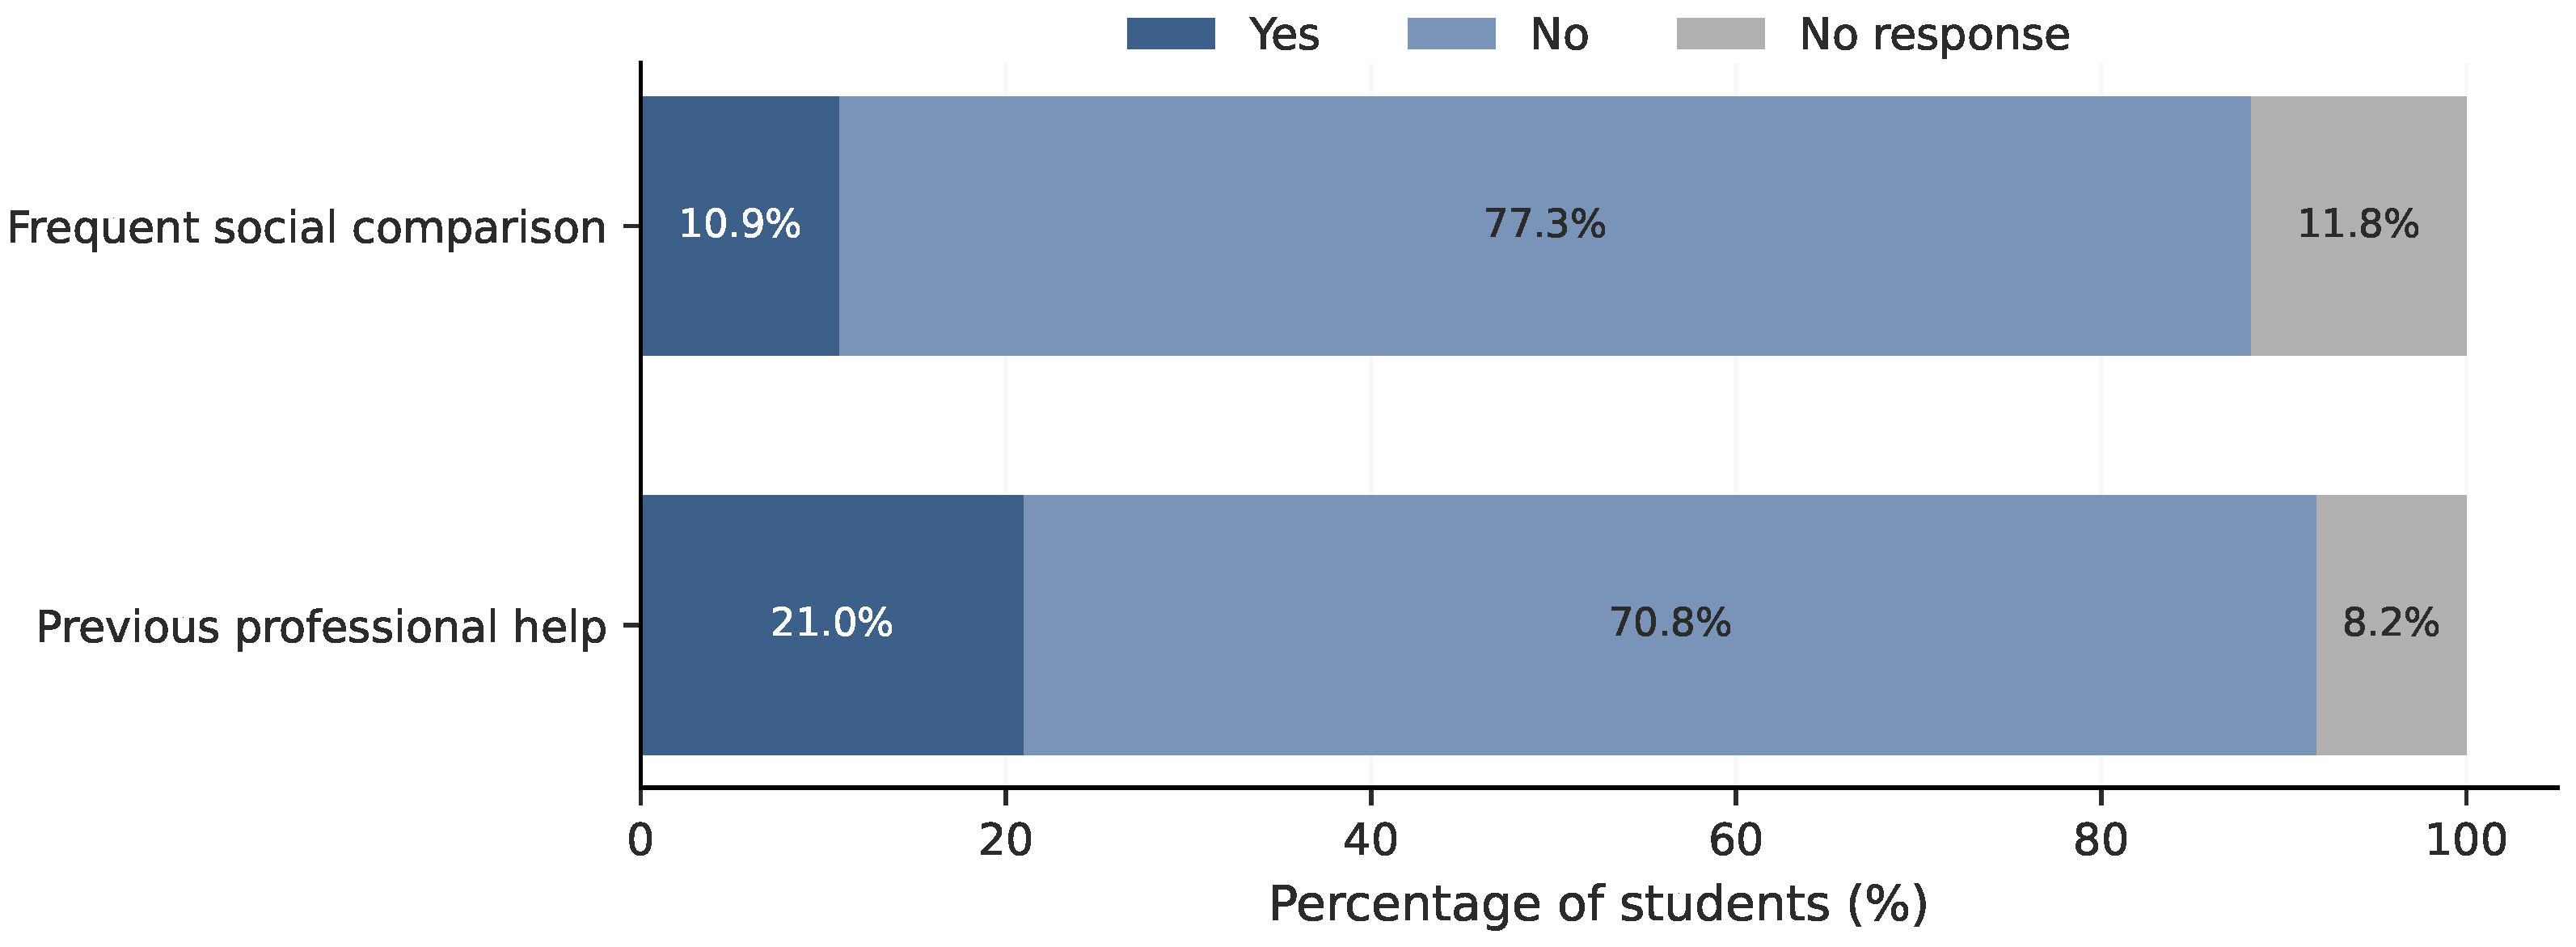
Table 7). Response patterns provide additional context: non-response rates in variables such as social comparison (11.8%) and previous professional help (8.2%) indicate hesitation or partial disclosure during screening (
Table 8,
Figure 7). This combination of reported need and limited engagement reinforces the mismatch identified in previous sections and highlights the role of structured screening as an alternative entry point for early detection.
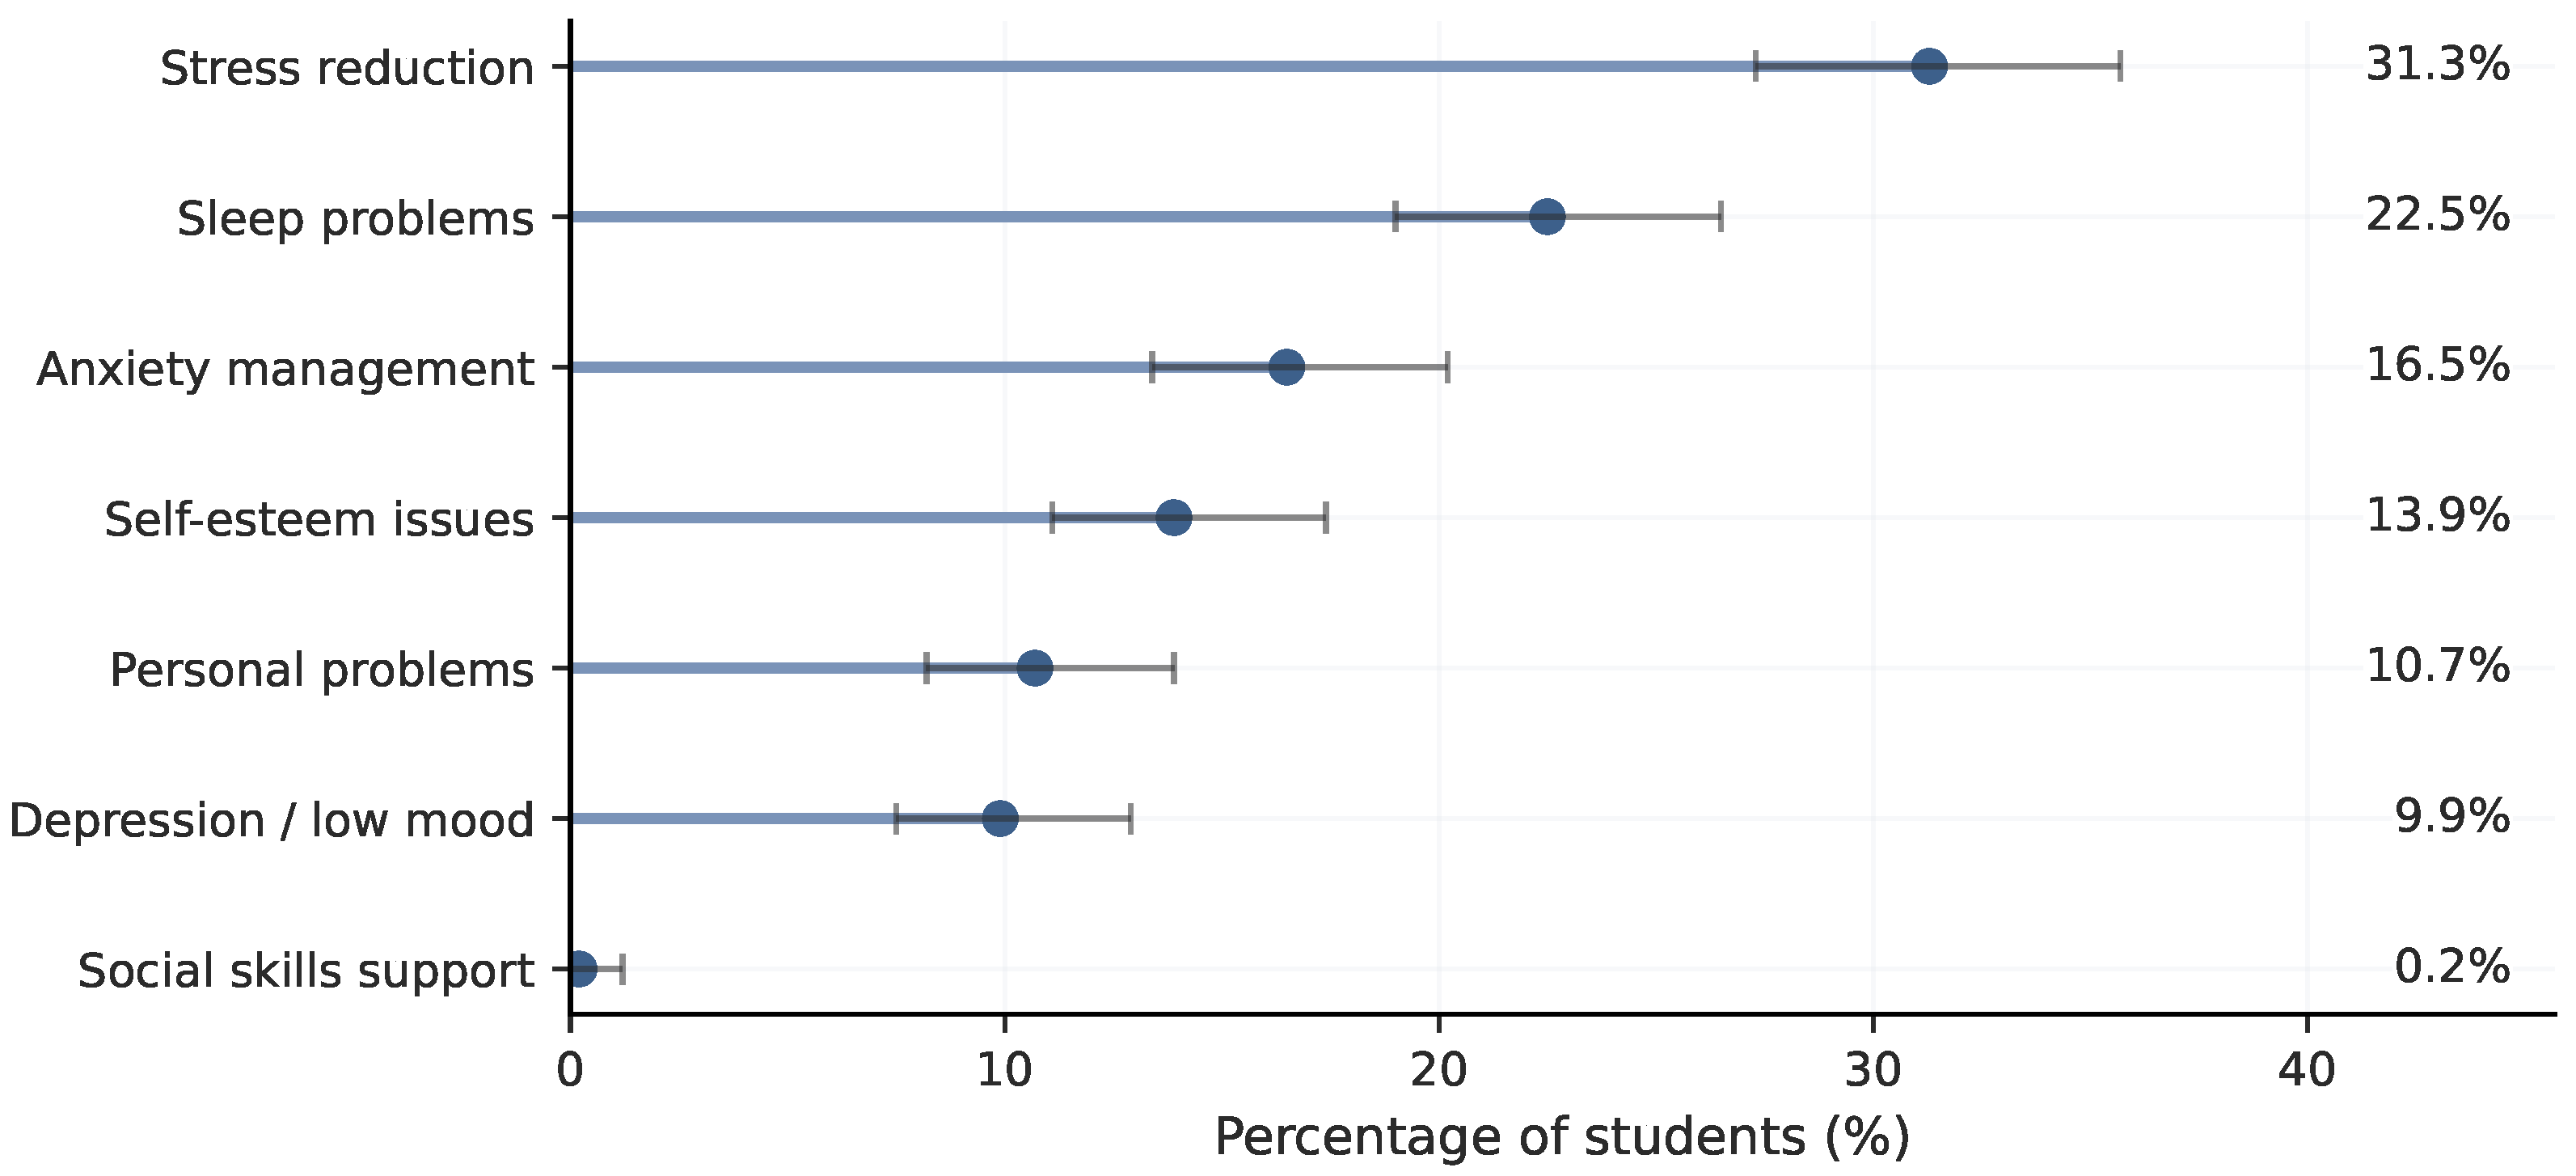
Support needs show clear prioritization patterns across domains. Emotional needs are led by stress reduction (31.3%), sleep-related difficulties (22.5%), and anxiety management (16.5%) (
Figure 8,
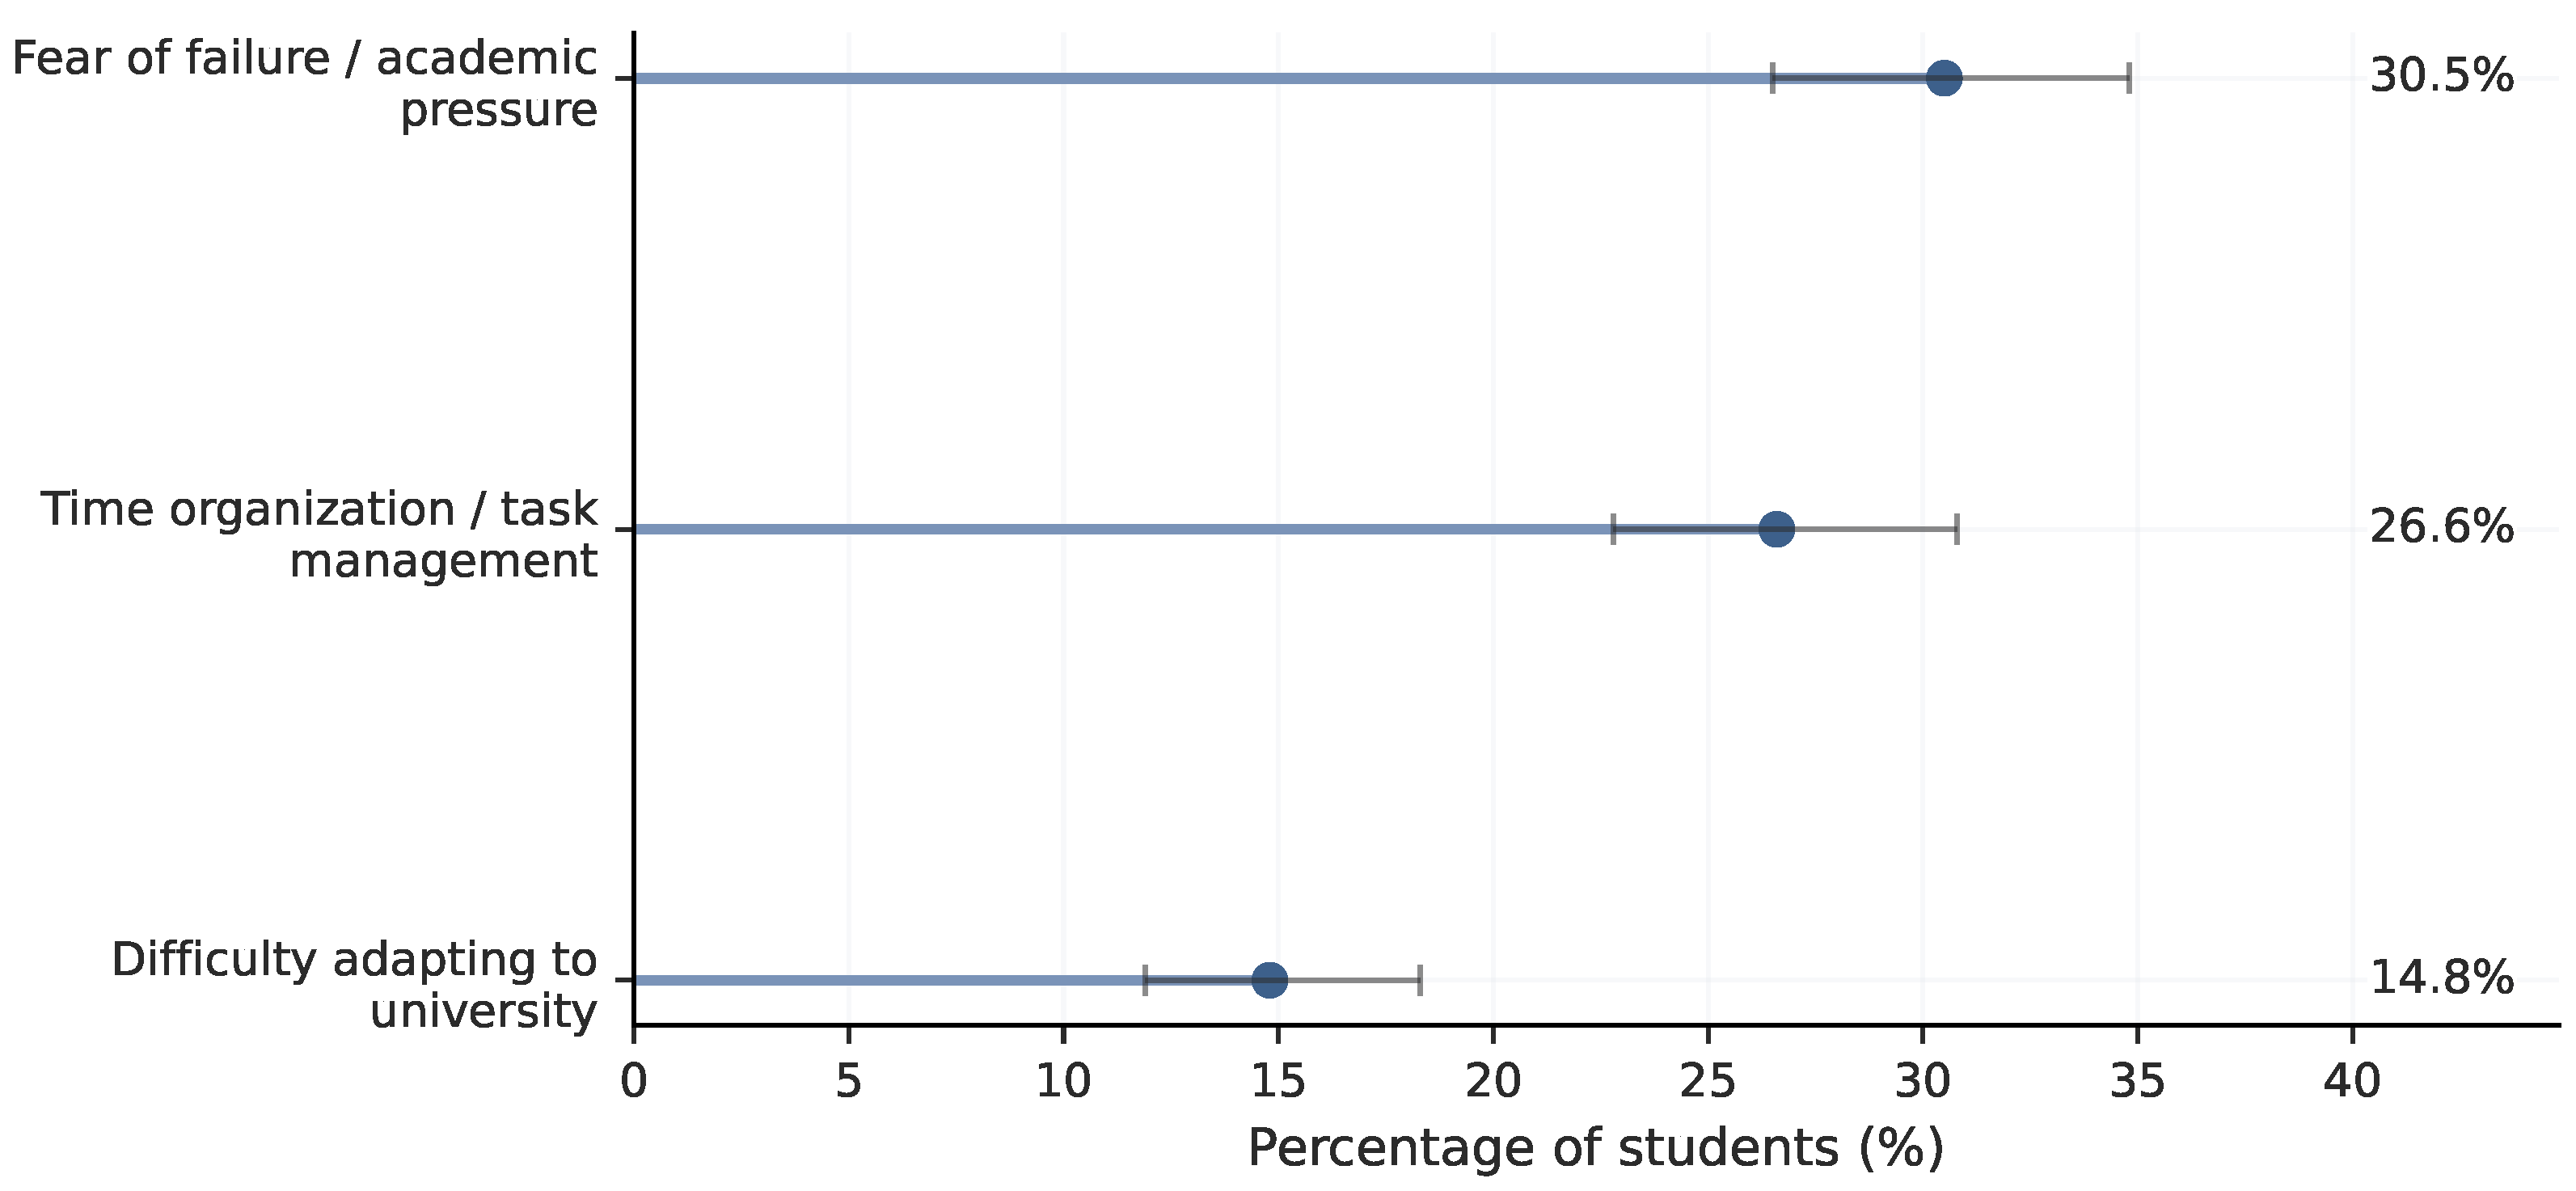
Table 9), while academic needs concentrate on fear of failure (30.5%), time organization (26.6%), and adaptation difficulties (14.8%) (
Figure 9,
Table 10). These distributions remain stable when uncertainty is considered. Confidence intervals estimated using the Wilson method show consistent ranges for key indicators, including at-risk classification (34.3%, CI: 30.1–38.7), stress-related needs (31.3%, CI: 27.3–35.6), and academic pressure (30.5%, CI: 26.5–34.9) (
Table 11), supporting the robustness of the observed patterns at the population level.
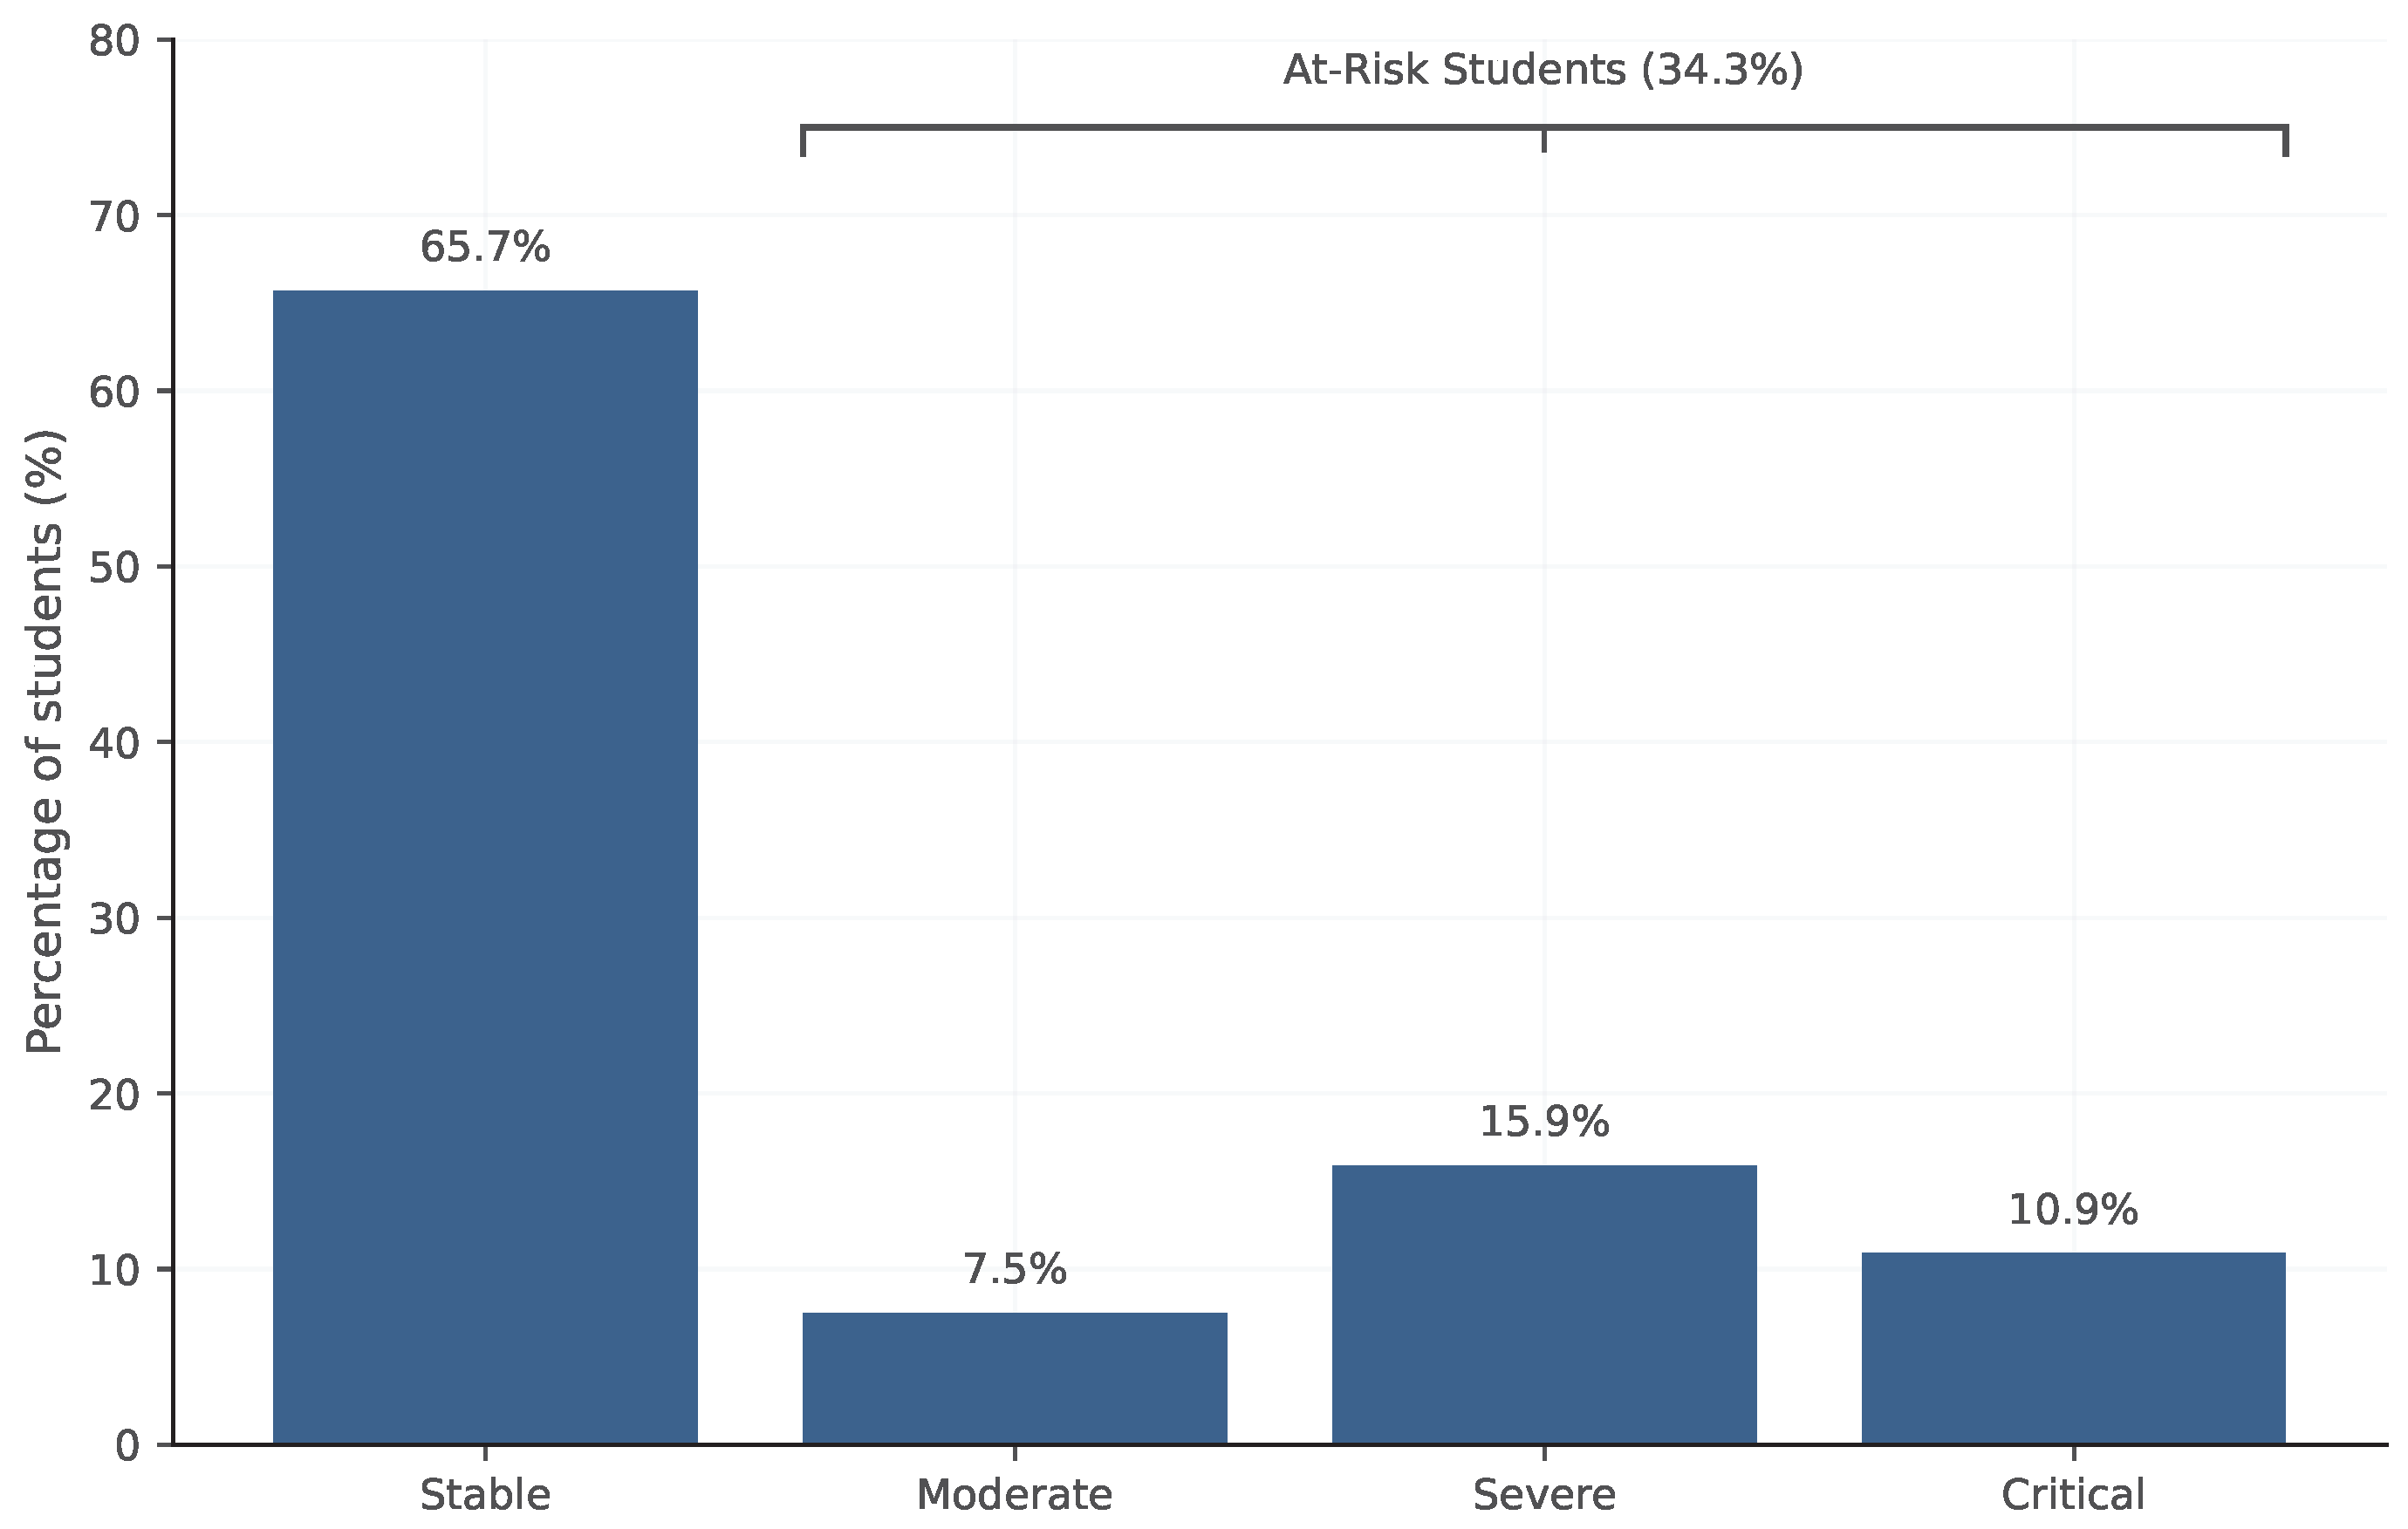
The integration of indicators through the rule-based classification stage results in a structured distribution of risk levels. Most students fall into the stable category, while approximately one third (34.3%) are classified as moderate, severe, or critical (
Figure 10). This proportion provides a practical estimate of students who may require monitoring or early support during the transition period. The classification output translates multidimensional responses into interpretable signals aligned with the decision-support pathways described in the framework.
At the institutional level, these results establish an operational baseline for planning targeted interventions and resource allocation. The achieved screening coverage (38.9%) demonstrates that large-scale participation can be obtained using accessible and low-cost digital tools (
Table 12). Overall, the findings show that early-stage vulnerability can be systematically identified using structured screening and a transparent data pipeline, generating consistent, interpretable outputs directly linked to decision-support mechanisms.
6. Discussion
This study demonstrates how structured digital screening can be operationalized as a decision-support process within higher education. It moves beyond descriptive reporting by connecting population-level data collection with a transparent and reproducible pipeline. By linking screening, structured processing, and decision pathways, the proposed approach enables early detection of emerging needs during the transition to university and translates them into interpretable outputs aligned with institutional action. The results show that emotional and academic challenges emerge early and tend to co-occur rather than appear as isolated conditions. Anxiety, stress-related needs, and time management difficulties form interconnected signals during the first weeks of academic integration, consistent with prior evidence on first-year vulnerability [
6,
7,
9]. At the same time, help-seeking behavior remains limited despite the presence of reported needs, reinforcing the mismatch identified in previous research [
12,
26,
29]. This reveals a structural limitation of models based exclusively on voluntary engagement. Structured screening offers an alternative entry point that does not depend on explicit demand and allows for early signals to be captured at scale.
The distribution of risk levels provides an operational perspective on these patterns. Approximately one third of the cohort falls into moderate to critical categories, offering a practical estimate of students who may benefit from monitoring or early support. These categories are not intended as clinical diagnoses but as interpretable indicators derived from transparent rules applied to multiple dimensions of self-reported data. The rule-based classification functions as a structured aggregation mechanism that prioritizes interpretability and institutional usability over predictive complexity, aligning with the objective of supporting coordinated responses rather than automated decision-making. From a systems perspective, the proposed structured data pipeline operates as a lightweight infrastructure, transforming distributed self-reported data into structured institutional signals. This approach is consistent with recent work on reproducible pipelines in applied domains [
3]. Its modular design supports traceability across stages, from data ingestion to decision pathways, and enables consistent interpretation without reliance on opaque models. This addresses limitations in existing implementations, which often focus on isolated indicators or retrospective analysis rather than integrated workflows. The inclusion of a monitoring and feedback loop reinforces the iterative nature of the approach and allows continuous refinement of instruments, classification rules, and support strategies.
Several limitations must be considered. Participation was voluntary, introducing potential selection bias, as students experiencing higher levels of distress may be less likely to participate, leading to a possible underestimation of vulnerability. The cross-sectional design limits the analysis of temporal dynamics and prevents assessment of how risk levels evolve over time. The absence of follow-up data restricts the ability to determine whether students classified as severe or critical experienced escalation of distress, academic difficulties, or dropout-related outcomes. In addition, the screening instrument was designed as a non-clinical tool that prioritizes accessibility and operational feasibility. While grounded in recognized dimensions of student well-being, it does not replace psychometrically validated scales, and its outputs should be interpreted within this scope.
Despite these limitations, the findings show that early-stage screening and classification can be implemented at scale using accessible tools and structured data processes. The approach does not depend on specialized infrastructure and can be adapted to resource-constrained environments, supporting its applicability across diverse institutional settings. Future work should extend this framework in three directions: longitudinal evaluation of risk trajectories and outcomes, assessment of the predictive validity of classification rules and potential integration with data-driven methods, and development of a dedicated digital platform to enable continuous monitoring and tighter integration with institutional services. In this context, YuumCare can be understood as a structured and scalable bridge between student-reported data and institutional decision-making, enabling earlier, more systematic, and data-informed strategies to support students during a critical stage of academic transition.
7. Conclusions
This study shows that structured digital screening can operate as a practical mechanism for early detection of emotional and academic support needs among first-year university students. The results indicate that relevant challenges emerge during the initial stages of the academic trajectory and can be consistently captured through accessible screening processes, even when students do not actively seek support. The proposed approach contributes an operational model that links data collection, structured processing, and decision pathways within a transparent and reproducible workflow. This design enables the transformation of self-reported data into interpretable signals that support institutional decision-making without relying on opaque models. The findings also confirm a persistent mismatch between perceived needs and help-seeking behavior, reinforcing the limitations of approaches based exclusively on voluntary engagement and highlighting the value of structured screening as a complementary pathway for identifying early-stage vulnerability.
The scope of this study is defined by several limitations. Participation was voluntary, which may lead to underrepresentation of the most vulnerable students. The cross-sectional design does not allow evaluation of temporal dynamics or predictive validity of classification outcomes. The instrument was designed as a non-clinical tool, prioritizing interpretability and operational feasibility over psychometric standardization. Future work should examine longitudinal trajectories, evaluate classification strategies, and explore the integration of digital platforms for continuous monitoring and coordinated response. Overall, the approach provides a scalable and transferable mechanism for linking student-reported data with institutional decision-making, supporting earlier and more data-informed strategies during a critical stage of academic transition.
Author Contributions
Conceptualization, A.P.-B.; Methodology, A.P.-B., M.G.H.-C. and G.A.F.-B.; Screening instrument design, M.d.J.H.-Q. and M.M.D.l.S.-A.; Data collection and investigation, M.G.H.-C., G.A.F.-B., M.d.J.H.-Q. and M.M.D.l.S.-A.; Validation and institutional supervision, G.A.F.-B. and M.d.J.H.-Q.; Formal analysis and data curation, A.P.-B.; Visualization, A.P.-B.; Writing—original draft preparation, A.P.-B.; Writing—review and editing, A.P.-B., M.G.H.-C. and G.A.F.-B.; Supervision and project administration, A.P.-B. All authors have read and agreed to the published version of the manuscript.
Funding
This research received institutional support from Tecnológico Nacional de México/Instituto Tecnológico de Matamoros.
Institutional Review Board Statement
This study was conducted in accordance with established ethical principles and institutional guidelines for research involving human participants in educational settings. The screening was implemented as part of an institutional student well-being initiative at the beginning of the academic semester. Participation was voluntary, and informed consent was obtained from all participants prior to data collection through digital or written consent procedures. All data were anonymized before analysis to ensure confidentiality and compliance with ethical standards for educational research.
Informed Consent Statement
Informed consent was obtained from all participants prior to data collection. Most participants provided consent digitally through an online information and agreement process that required active confirmation before accessing the questionnaire, while a smaller group provided written informed consent through signed paper forms. Participants were informed about the purpose, scope, voluntary nature, and non-clinical character of the screening prior to participation. No personally identifiable information was included in the dataset used for analysis.
Data Availability Statement
Acknowledgments
The authors acknowledge the support provided by the Secretaría de Ciencia, Humanidades, Tecnología e Innovación (SECIHTI), Mexico, through the National System of Researchers (SNII). During the preparation of this manuscript, the authors made use of AI-assisted writing tools to enhance language clarity and readability. All content was critically reviewed, edited, and validated by the authors, who take full responsibility for the accuracy, originality, and integrity of the work.
Conflicts of Interest
The authors declare no conflict of interest.
References
- Son, C.; Hegde, S.; Smith, A.; Wang, X.; Sasangohar, F. Effects of COVID-19 on college students’ mental health in the United States: Interview survey study. J. Med. Internet Res. 2020, 22, e21279. [Google Scholar] [CrossRef]
- Tsoni, R.; Kalles, D.; Verykios, V. A data pipeline approach for building learning analytics dashboards. In Proceedings of the 12th Hellenic Conference on Artificial Intelligence; Association for Computing Machinery: New York, NY, USA, 2022; pp. 1–6. [Google Scholar]
- Sghir, N.; Adadi, A.; Lahmer, M. Towards a comprehensive data pipeline model for learning analytics. In International Conference on Big Data and Internet of Things; Springer: Cham, Switzerland, 2024; pp. 297–307. [Google Scholar]
- Bono, C.A.; Cappiello, C.; Pernici, B.; Ramalli, E.; Vitali, M. Pipeline design for data preparation for social media analysis. ACM J. Data Inf. Qual. 2023, 15, 1–25. [Google Scholar] [CrossRef]
- Namli, T.; Sınacı, A.A.; Gönül, S.; Herguido, C.R.; Garcia-Canadilla, P.; Muñoz, A.M.; Esteve, A.V.; Ertürkmen, G.B.L. A scalable and transparent data pipeline for AI-enabled health data ecosystems. Front. Med. 2024, 11, 1393123. [Google Scholar] [CrossRef] [PubMed]
- Farrer, L.; Jackson, H.M.; Gulliver, A.; Calear, A.L.; Batterham, P.J. Mental health among first-year students transitioning to university in Australia: A longitudinal study. Psychol. Rep. 2024, 1–22. [Google Scholar] [CrossRef]
- Adams, K.L.; Saunders, K.E.A.; Keown-Stoneman, C.D.G.; Duffy, A. Mental health trajectories in undergraduate students over the first year of university: A longitudinal cohort study. BMJ Open 2021, 11, e047393. [Google Scholar] [CrossRef]
- Benjanirat, T.; Ounprasertsuk, J. Mental health status, related knowledge, and its influencing factors among first-year university students: A cross-sectional study in Thailand. J. Nurs. Midwifery Sci. 2025, 12, e163995. [Google Scholar] [CrossRef]
- Tholen, R.; Wouters, E.; Ponnet, K.; DeBruyn, S.; VanHal, G. Academic stress, anxiety, and depression among Flemish first-year students: The mediating role of sense of belonging. J. Coll. Stud. Dev. 2022, 63, 200–217. [Google Scholar] [CrossRef]
- Segú-Odriozola, M. The mental health of university students: A social ecology perspective. Societies 2025, 15, 110. [Google Scholar] [CrossRef]
- Pineda-Briseño, A.; Oblitas Cruz, J.; Cleofas Sánchez, L.; Sanchez, W.; Baltazar, R. A context-aware framework for sentiment analysis of student feedback to inform educational strategies in Latin America. Educ. Sci. 2026, 16, 399. [Google Scholar] [CrossRef]
- Samuel, R.A.; Kamenetsky, S.B. Help-seeking preferences and factors associated with attitudes toward seeking mental health services among first-year undergraduates. Can. J. High. Educ. 2022, 52, 30–50. [Google Scholar] [CrossRef]
- Pinho, A.M.; Oliveira, R. Evaluation of a mHealth Technology for the Promotion of Mental Health among University Students: Application “Mais Um Dia”. In Proceedings of the 2023 18th Iberian Conference on Information Systems and Technologies (CISTI), Aveiro, Portugal, 14–17 June 2023; pp. 1–5. [Google Scholar] [CrossRef]
- Lattie, E.G.; Lipson, S.K.; Eisenberg, D.; Mohr, D.C. Effectiveness of digital interventions on mental health and psychological well-being of college and university students. J. Med. Internet Res. 2023, 25, e45678. [Google Scholar] [CrossRef]
- Fleming, T.; Bavin, L.; Stasiak, K.; Hermansson-Webb, E.; Merry, S.; Cheek, C. Meeting the mental health needs of college-aged young adults: Evaluating the value and impact of digital mental health interventions. Internet Interv. 2022, 28, 100525. [Google Scholar] [CrossRef]
- Ebert, D.D.; Buntrock, C.; Mortier, P.; Auerbach, R.P.; Weisel, K.K.; Kessler, R.C.; Bruffaerts, R. Prediction of major depressive disorder onset in college students. Depress. Anxiety 2019, 36, 294–304. [Google Scholar] [CrossRef]
- Wang, L.; Li, S.; Xu, S. The application of artificial intelligence in mental health management for higher education students. In Management Science and Industrial Engineering: Proceedings of the 7th International Conference (MSIE 2025), Bali Island, Indonesia, 24–26 April 2025; SAGE Publications: Newcastle, England, 2025; pp. 393–400. [Google Scholar] [CrossRef]
- Onnela, J.P.; Rauch, S.L. Digital phenotyping for mental health of college students: A clinical review. Harv. Rev. Psychiatry 2022, 30, 123–134. [Google Scholar] [CrossRef]
- Juárez-Santiago, B.; Olvera-Raymundo, K.; Olivares-Ramírez, J.M.; Olguín-López, N.; Rodriguez Abreo, O.; Rodríguez-Reséndiz, J. Integrating deep learning into educational wellbeing: Early screening of anxiety, depression, and stress among university students. Educ. Sci. 2026, 16, 50. [Google Scholar] [CrossRef]
- Madrid-Cagigal, A.; Kealy, C.; Potts, C.; Mulvenna, M.D.; Byrne, M.; Barry, M.M.; Donohoe, G. Digital mental health interventions for university students with mental health difficulties: A systematic review and meta-analysis. Early Interv. Psychiatry 2025, 19, e70017. [Google Scholar] [CrossRef]
- Salas-Pilco, S.Z.; Yang, Y. Artificial intelligence applications in Latin American higher education: A systematic review. Int. J. Educ. Technol. High. Educ. 2022, 19, 21. [Google Scholar] [CrossRef]
- Kotouza, D.; Callard, F.; Garnett, P.; Rocha, L. Mapping mental health and the UK university sector: Networks, markets, data. Crit. Soc. Policy 2022, 42, 365–387. [Google Scholar] [CrossRef]
- Taja-on, E.P.; Vergara, F.A. The advocacy blueprint: A Delphi study on promoting and strengthening mental health programs and services in higher education. Educ. Point 2025, 2, e112. [Google Scholar] [CrossRef]
- Torous, J.; Bucci, S.; Bell, I.H.; Kessing, L.V.; Faurholt-Jepsen, M.; Whelan, P.; Carvalho, A.F.; Firth, J. Digital health interventions for delivery of mental health care: Systematic and comprehensive meta-review. JMIR Ment. Health 2022, 9, e35159. [Google Scholar] [CrossRef]
- Abelson, S.; Lipson, S.K.; Eisenberg, D. Mental health in college populations: A multidisciplinary review of what works, evidence gaps, and paths forward. In Higher Education: Handbook of Theory and Research; Perna, L.W., Ed.; Springer: Cham, Switzerland, 2022; Volume 37. [Google Scholar] [CrossRef]
- Rahmi, K.H.; Jamaluddin, Z.; Yahaya, M.; Chik, A.; Subardhini, M.; Huripah, E.; Fahrudin, A. Barriers to accessing mental health services among university students: A systematic review. Environ. Soc. Psychol. 2025, 10, 3936. [Google Scholar] [CrossRef]
- Brown, L.D.; Cai, T.T.; DasGupta, A. Interval estimation for a binomial proportion. Stat. Sci. 2001, 16, 101–133. [Google Scholar] [CrossRef]
- Agresti, A. Categorical Data Analysis, 3rd ed.; John Wiley & Sons: Hoboken, NJ, USA, 2013. [Google Scholar]
- Harrer, M.; Adam, S.H.; Baumeister, H.; Cuijpers, P.; Karyotaki, E.; Auerbach, R.P.; Ebert, D.D. Internet interventions for mental health in university students: A systematic review and meta-analysis. Int. J. Methods Psychiatr. Res. 2019, 28, e1759. [Google Scholar] [CrossRef] [PubMed]
Figure 1.
Conceptual architecture and adaptive workflow of the YuumCare framework, illustrating digital screening input, structured data pipeline, risk-level outputs, decision support pathways, iterative monitoring, and contextual constraints within an institutional ecosystem.
Figure 1.
Conceptual architecture and adaptive workflow of the YuumCare framework, illustrating digital screening input, structured data pipeline, risk-level outputs, decision support pathways, iterative monitoring, and contextual constraints within an institutional ecosystem.
Figure 2.
Operational workflow of YuumCare from screening to decision support pathways.
Figure 2.
Operational workflow of YuumCare from screening to decision support pathways.
Figure 3.
Data preprocessing and feature construction pipeline for standardized screening.
Figure 3.
Data preprocessing and feature construction pipeline for standardized screening.
Figure 4.
Gender distribution of the participants (N = 466).
Figure 4.
Gender distribution of the participants (N = 466).
Figure 5.
Ordinal distribution of emotional distress indicators.
Figure 5.
Ordinal distribution of emotional distress indicators.
Figure 6.
Ordinal distribution of academic difficulty indicators.
Figure 6.
Ordinal distribution of academic difficulty indicators.
Figure 7.
Distribution of selected support-related indicators including No response as an explicit category.
Figure 7.
Distribution of selected support-related indicators including No response as an explicit category.
Figure 8.
Prevalence of emotional support needs reported by students. Error bars indicate 95% confidence intervals estimated using the Wilson method.
Figure 8.
Prevalence of emotional support needs reported by students. Error bars indicate 95% confidence intervals estimated using the Wilson method.
Figure 9.
Prevalence of academic support needs among first-year students. Error bars represent 95% confidence intervals estimated using the Wilson method.
Figure 9.
Prevalence of academic support needs among first-year students. Error bars represent 95% confidence intervals estimated using the Wilson method.
Figure 10.
Distribution of students across the four institutional risk classification categories generated through the YuumCare screening framework (N = 466).
Figure 10.
Distribution of students across the four institutional risk classification categories generated through the YuumCare screening framework (N = 466).
Table 1.
Conceptual structure of the indicators included in the YuumCare screening questionnaire.
Table 1.
Conceptual structure of the indicators included in the YuumCare screening questionnaire.
| Indicator Dimension | Example Variable | Description |
|---|
| Emotional distress | Anxiety in exams or public speaking | Captures performance-related anxiety and emotional strain during academic activities |
| Cognitive–emotional patterns | Errors define self-worth | Reflects negative self-perception and cognitive bias associated with self-evaluation |
| Academic disengagement | Thoughts of giving up | Indicates early signs of disengagement or dropout intention |
| Social support | Perceived emotional support | Measures perceived availability of emotional support from others |
| Emotional expression | Difficulty expressing emotions | Identifies barriers in emotional communication |
| Social behavior | Social isolation tendency | Captures withdrawal or isolation behaviors in adverse situations |
| Comparative perception | Social comparison behavior | Reflects tendency to compare oneself with peers |
| Self-perception | Self-perceived satisfaction | Represents overall personal satisfaction and self-assessment |
| Support needs | Emotional support required | Identifies specific types of support students perceive they need |
| Help-seeking attitude | Interest in psychological support | Captures willingness to access institutional support services |
| Institutional awareness | Awareness of institutional resources | Measures knowledge of available support services |
Table 2.
Transformation of demographic, emotional, and social survey variables into structured analytical features.
Table 2.
Transformation of demographic, emotional, and social survey variables into structured analytical features.
Original
Variable | English
Description | Type | Output
Variable | Transformation and Purpose |
|---|
| Edad | Student age | Numeric | age_range | Binned into intervals for cohort-level
analysis. |
| Genero | Gender | Categorical | gender | Standardized categorical labels. |
| Ansiedad en exámenes o al hablar en público | Exam/public speaking anxiety | Ordinal | exam_anxiety_ord | Ordinal encoding of performance-related
anxiety. |
| Pensamientos de rendirse | Thoughts of giving up | Ordinal | dropout_thoughts_ord | Indicator of academic disengagement risk. |
| Errores definen valor personal | Errors define self-worth | Ordinal | error_self_perception_ord | Cognitive–emotional bias representation. |
| Apoyo emocional percibido | Perceived emotional support | Ordinal | social_support_ord | Measures perceived support network. |
| Dificultad para expresar emociones | Difficulty expressing emotions | Ordinal | emotion_expr_diff_ord | Emotional communication barriers. |
| Aislamiento social | Social isolation tendency | Ordinal | social_isolation_ord | Withdrawal behavior indicator. |
| Comparación social frecuente | Frequent social comparison | Binary | social_comparison | Binary comparison tendency. |
| Satisfacción personal | Self-perceived satisfaction | Ordinal | self_satisfaction_score | Likert-based self-perception scale. |
Table 3.
Transformation of academic, support-related, and derived survey variables into structured analytical features.
Table 3.
Transformation of academic, support-related, and derived survey variables into structured analytical features.
Original Variable
(Spanish) | English
Description | Type | Output
Variable | Transformation and Purpose |
|---|
| Ayuda emocional requerida | Type of emotional support required | Multi-select | support_need_*
variables | Multi-hot encoding of selected categories. |
| Interés en apoyo psicológico | Interest in psychological support | Ordinal | psych_support_
interest_ord | Preserves support-
seeking intention. |
| Dificultad para organizar el tiempo | Difficulty managing time | Ordinal | time_management_
difficulty_ord | Perceived time management difficulty. |
| Interés en orientación académica | Interest in academic guidance | Binary | wants_academic_
guidance | Demand for academic support. |
| Conocimiento de recursos institucionales | Awareness of institutional resources | Binary | knows_resources | Awareness of services. |
| Ayuda profesional previa | Previous professional help | Binary | previous_help | Prior engagement indicator. |
| Nivel de riesgo | Risk classification label | Derived | risk_level | Rule-based aggregation of indicators. |
Table 4.
Encoding schemes used for transformed variables.
Table 4.
Encoding schemes used for transformed variables.
| Variable Type | Encoding Method | Example |
|---|
| Ordinal | Integer encoding preserving order | Variable-dependent ordinal scales (e.g., 0–2 or 1–5 depending on the indicator) |
| Binary | Boolean mapping | 0 = no, 1 = yes |
| Multi-select | Multi-hot encoding | indicating selected categories |
| Numerical (binned) | Discretized categorical ranges | 16–18, 19–20, 21–22, 23–25, 26+ |
| Derived label | Rule-based classification | risk_level in {stable, moderate, severe, critical} |
Table 5.
Non-clinical risk classification criteria used for triage and decision support.
Table 5.
Non-clinical risk classification criteria used for triage and decision support.
| Risk Level | Description |
|---|
| Stable | No significant indicators of emotional distress or academic difficulty. Students show adequate adaptation and no immediate need for intervention. |
| Moderate | Presence of mild to moderate indicators such as occasional anxiety, difficulties in time management, or reduced perceived support. Monitoring is recommended. |
| Severe | Multiple indicators of distress, including persistent anxiety, social isolation, or negative self-perception. Requires follow-up and potential support intervention. |
| Critical | High-risk patterns such as strong disengagement signals, thoughts of giving up, or severe emotional distress. Immediate attention and referral are recommended. |
Table 6.
Participant overview.
Table 6.
Participant overview.
| Characteristic | n | % |
|---|
| Sample size (N) | 466 | 100.0 |
| Age range | | |
| 16–18 | 400 | 85.8 |
| 19–20 | 41 | 8.8 |
| 21–22 | 12 | 2.6 |
| 23–25 | 7 | 1.5 |
| 26+ | 4 | 0.9 |
| Unknown | 2 | 0.4 |
| Gender | | |
| Male | 293 | 62.9 |
| Female | 173 | 37.1 |
Table 7.
Distribution of help-seeking attitudes toward psychological support.
Table 7.
Distribution of help-seeking attitudes toward psychological support.
| Level of Help-Seeking Interest | Frequency (n) | Percentage (%) |
|---|
| Low/No | 379 | 81.3 |
| High/Yes | 87 | 18.7 |
Table 8.
Response distribution for selected support-related indicators with explicit inclusion of No response.
Table 8.
Response distribution for selected support-related indicators with explicit inclusion of No response.
| Indicator | Response Category | Frequency (n) | Percentage (%) |
|---|
| Frequent social comparison | Yes | 51 | 10.9 |
| | No | 360 | 77.3 |
| | No response | 55 | 11.8 |
| Previous professional help | Yes | 98 | 21.0 |
| | No | 330 | 70.8 |
| | No response | 38 | 8.2 |
Table 9.
Top reported emotional support needs among screened students.
Table 9.
Top reported emotional support needs among screened students.
| Support Need | Students (n) | Percentage (%) |
|---|
| Stress reduction | 146 | 31.3 |
| Sleep problems | 105 | 22.5 |
| Anxiety management | 77 | 16.5 |
| Self-esteem issues | 65 | 13.9 |
| Personal problems | 50 | 10.7 |
Table 10.
Top reported academic support needs among screened students.
Table 10.
Top reported academic support needs among screened students.
| Support Need | Students (n) | Percentage (%) |
|---|
| Fear of failure/academic pressure | 142 | 30.5 |
| Time organization/task management | 124 | 26.6 |
| Difficulty adapting to university | 69 | 14.8 |
Table 11.
Prevalence of selected screening indicators with 95% confidence intervals.
Table 11.
Prevalence of selected screening indicators with 95% confidence intervals.
| Indicator | Prevalence (%) | 95% CI (Wilson) |
|---|
| Students classified as at-risk (moderate, severe, or critical) | 34.3 | 30.1–38.7 |
| Stress reduction support need | 31.3 | 27.3–35.6 |
| Fear of failure/academic pressure | 30.5 | 26.5–34.9 |
Table 12.
Institutional screening coverage.
Table 12.
Institutional screening coverage.
| Indicator | Value |
|---|
| Total undergraduate population | 1198 |
| Students screened | 466 |
| Institutional coverage | 38.9% |
| Disclaimer/Publisher’s Note: The statements, opinions and data contained in all publications are solely those of the individual author(s) and contributor(s) and not of MDPI and/or the editor(s). MDPI and/or the editor(s) disclaim responsibility for any injury to people or property resulting from any ideas, methods, instructions or products referred to in the content. |




 ,
,