1. Introduction
Efficient and transparent waste management has become a critical challenge for cities and towns worldwide. As urban populations grow and environmental concerns intensify, municipalities face increasing pressure to optimize collection operations, reduce landfill waste, and promote recycling. Reliable information about when and where waste bins are emptied is essential not only for operational efficiency but also for implementing incentive-based billing systems such as Pay-as-you-throw (PAYT). These schemes, which align with the ‘polluter pays principle’ endorsed by the European Union’s Waste Framework Directive 2008/98/EC [
1], tie waste collection fees to the actual amount of waste generated by each household or business. By requiring precise data on individual waste disposals, PAYT systems can ensure fair billing, reduce residual waste, and encourage recycling [
1,
2]. While PAYT schemes have gained particular prominence in the European Union [
1,
2], similar usage-based pricing models have been adopted in thousands of municipalities across North America [
3,
4] and are increasingly implemented globally.
The AI4WASTE project addresses these challenges by developing artificial intelligence (AI) methods and Internet of Things (IoT) sensing to improve the identification and validation of waste collection events. Within this context, IoT sensor units were installed on waste collection vehicles to record multi-modal sensor streams during daily operations. Each unit integrates an RFID reader, radar sensor, accelerometer, GPS module, and GSM communication with some vehicles additionally equipped with rear-view cameras. These sensors continuously generate large amounts of data that describe the lifting and emptying of bins.
Although raw sensor signals provide valuable information, they must be processed and annotated to be useful for AI training and evaluation. In particular, each collection event must be identified with its start and end times, associated container arm (left, right or both), and, where available, the corresponding RFID tag. To this end, the dataset described in this work combines raw IoT sensor data with verified annotations of waste collection events. The data were annotated in two ways: automated labels produced by an algorithm that detects arm movements and matches them with RFID and radar readings, which were then manually reviewed and corrected based on sensor data, and manually validated labels obtained from synchronized video recordings, representing the ground truth.
The resulting dataset contains measurements from multiple waste collection vehicles operating on different routes, each covering multiple collection days with varying distributions and types of waste bins. This diversity makes the dataset well suited for training and benchmarking AI models for waste collection event detection, anomaly recognition, and explainable AI studies in the context of smart waste management.
The remainder of this paper is organized as follows:
Section 2 describes the IoT hardware setup, data collection process, and data structure.
Section 3 details the annotation methods, including typical collection scenarios, video-based manual annotation, and automated annotation procedures.
Section 4 provides a comprehensive statistical overview of the dataset and a comparison of annotation methods.
Section 5 discusses potential applications and limitations.
Section 6 concludes this paper.
2. Data Collection and Description
2.1. IoT Hardware Setup
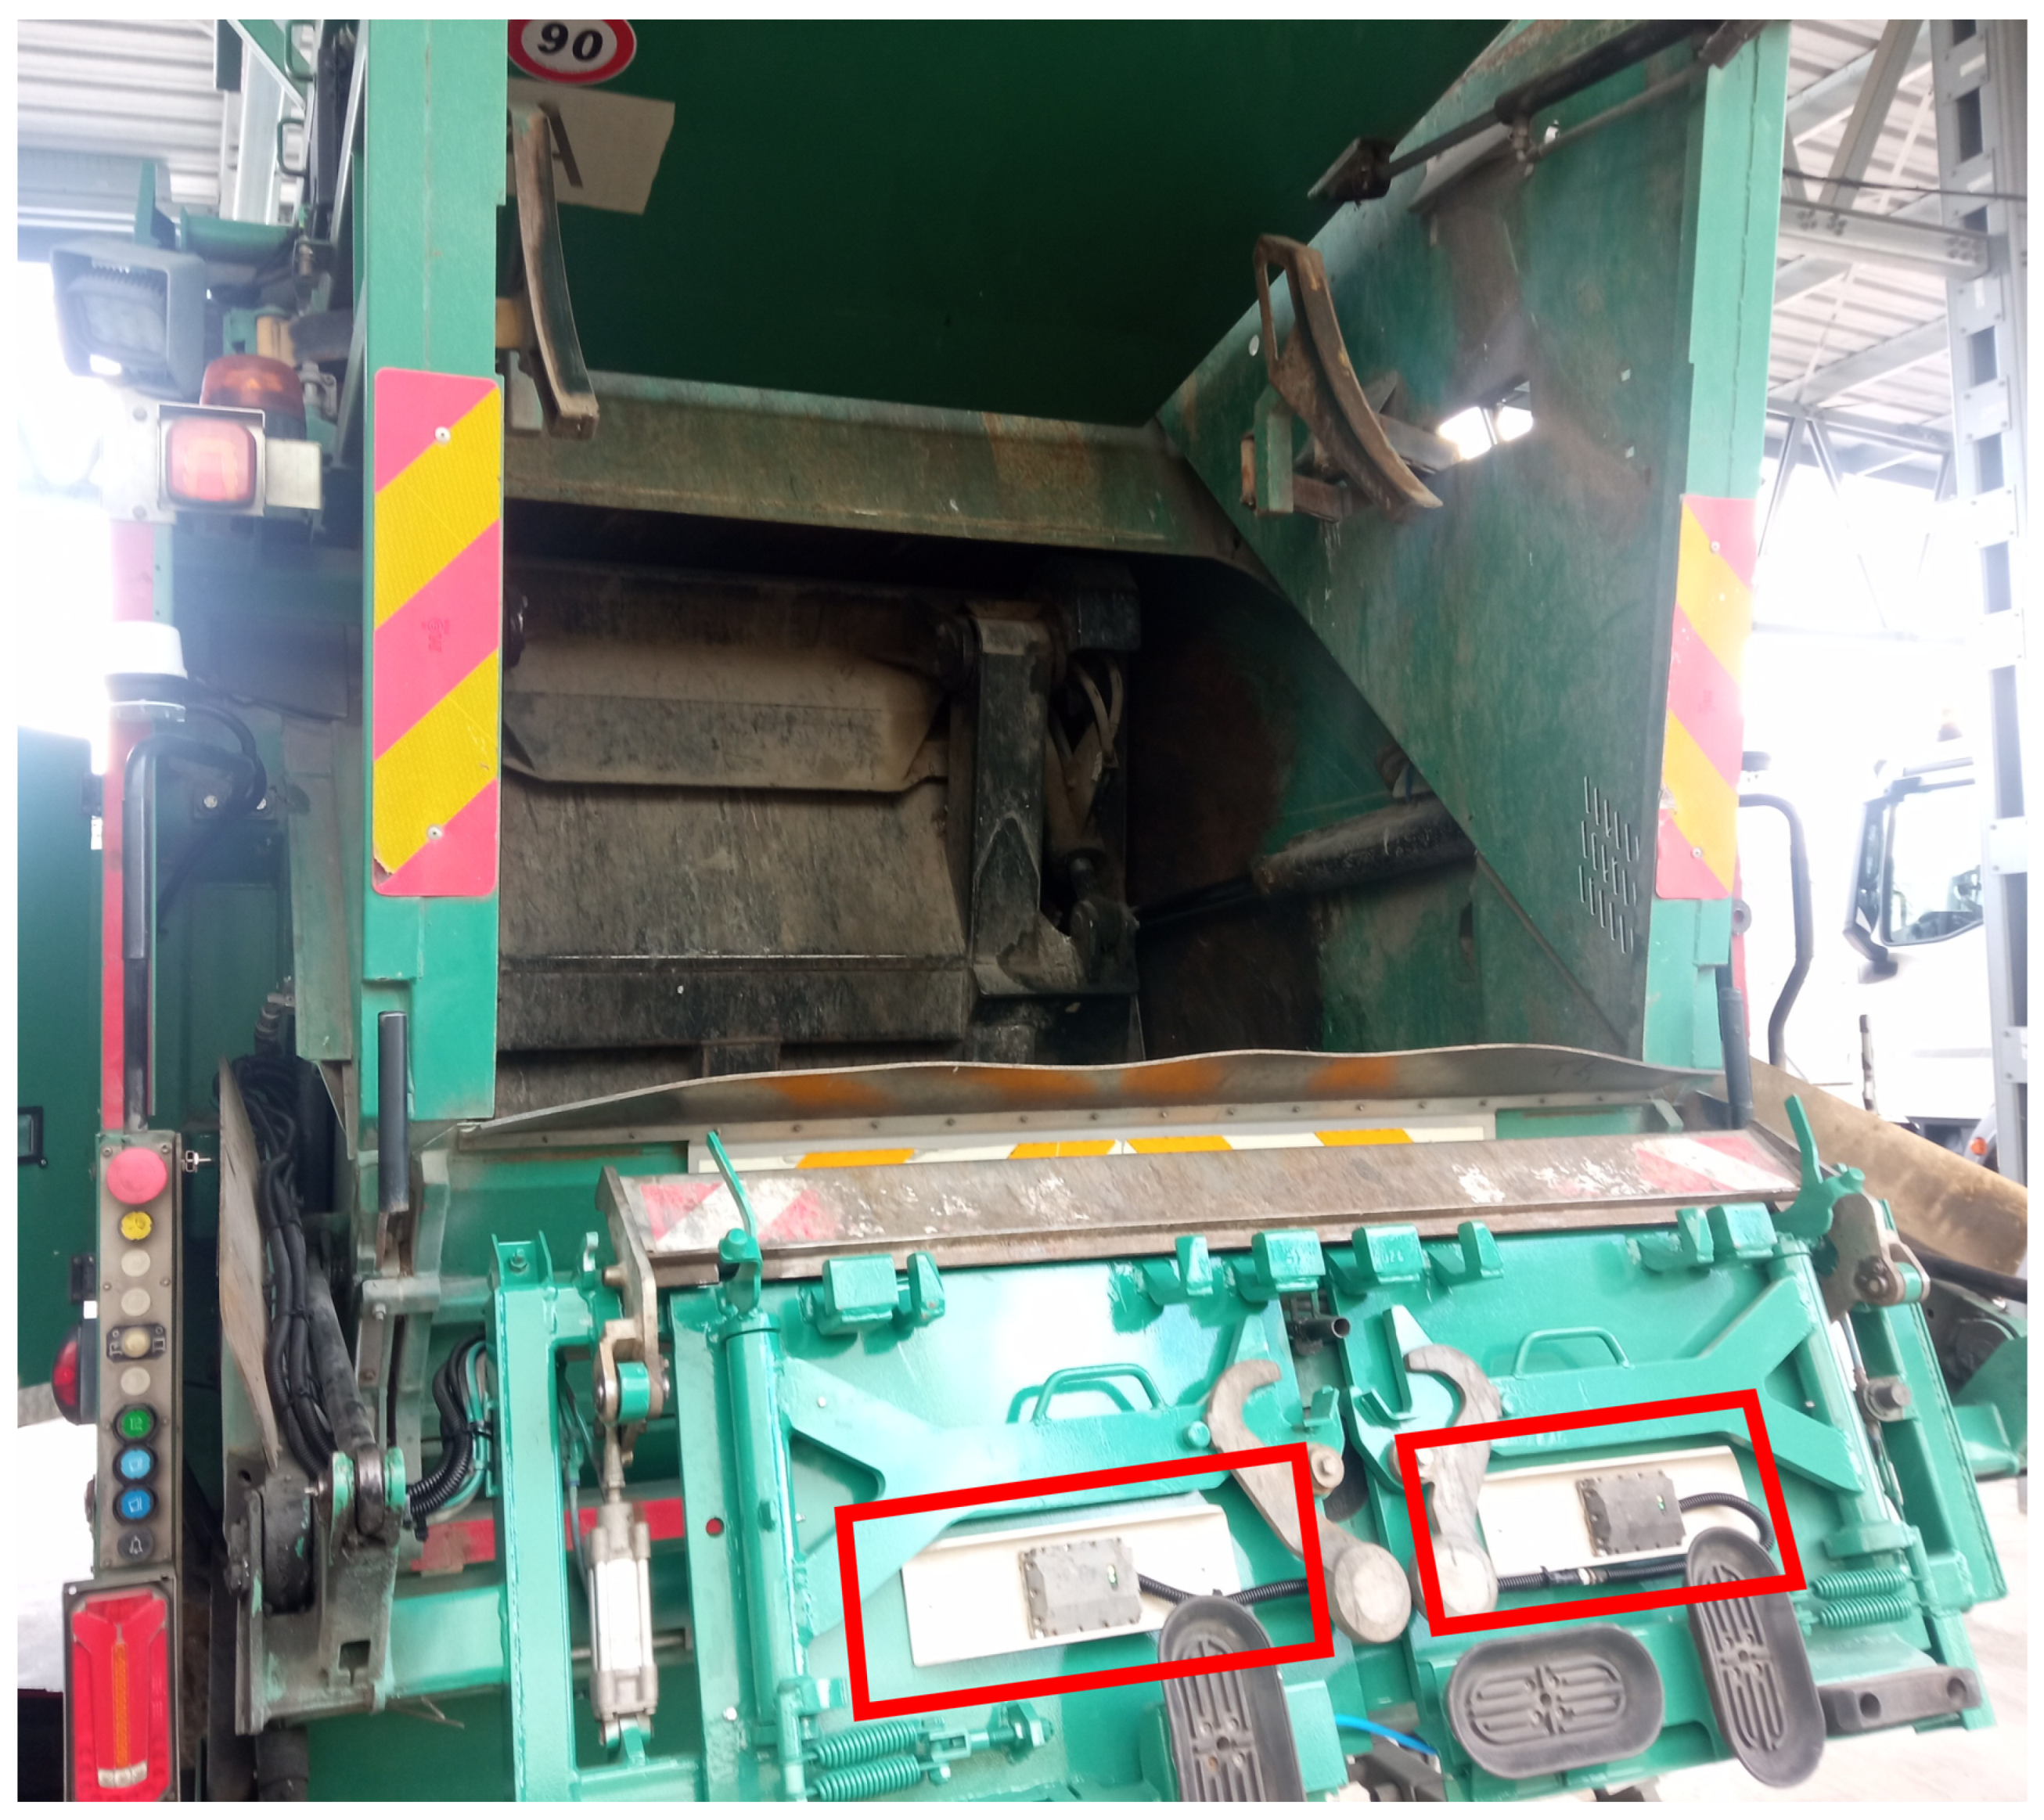
The dataset consists of time-series measurements collected by IoT sensor units mounted on waste collection vehicles. Each vehicle is equipped with two IoT sensor units, one on the left and one on the right lifting arm, which continuously record sensor signals during the operation of the lifting mechanism (
Figure 1). In addition, some vehicles are fitted with cameras used for manual validation of collection events.
Each sensor unit integrates multiple sensing components designed to detect waste collection events. The proximity of containers is measured by a pulsed coherent radar sensor (Acconeer A111) operating at 60 GHz with a measurement range of up to 2 m [
5]. The identification of containers using RFID tags is ensured by an Omron M7E-PICO RFID reader [
6]. The movement of the lifting arms is captured by an Analog Devices ADXL325 three-axis MEMS accelerometer [
7] that monitors the motion of the lifting arms along three axes. All sensors are connected to an IoT control unit equipped with GPS and GSM modules, which synchronize measurements and transmit data to the central server.
2.2. IoT Data Collection Process
Sensor data are sampled at 500 ms intervals and transmitted in 20 s batches via GSM to a central server. This results in approximately 40 sensor samples per transmission cycle.
The original firmware design ensured that each device generated records at nearly fixed intervals of 500 ms. In later firmware versions, however, additional high-priority event handling was introduced. As a result, small temporal shifts between consecutive samples may occur, although the overall batch duration remains close to 20 s.
Occasional irregularities can also arise from hardware issues or unstable connectivity. For instance, frequent device restarts or GSM transmission problems may lead to missing samples and extended intervals between observations, sometimes increasing the nominal 500 ms spacing to 1–2 s or more. These effects do not alter the overall structure of the dataset but need to be considered when performing temporal analyses.
2.3. IoT Data Structure
The data collected by IoT sensor units is structured into two main tables: sen_status_header and sen_status_data.
2.3.1. Sensor Status Header
This table contains metadata about each transmitted sensor message. Its main attributes are:
id: database identifier of the record.
unit_id: unique identifier of the IoT sensor unit installed on the vehicle.
msg_id: sequence number of the message.
msg_type: type of message, typically “7”, representing a sensor_status report.
device_timestamp: timestamp generated by the IoT device.
server_timestamp: timestamp of message arrival on the server.
2.3.2. Sensor Status Data
This table stores raw sensor measurements recorded by the IoT sensor units. Each record corresponds to a single sensor sample with the following fields:
id: database identifier of the record.
unit_id: identifier of the IoT sensor unit
msg_id: sequence number of the message.
rel_time: relative offset in milliseconds from the message timestamp, allowing for precise reconstruction of the measurement time.
axis_x_acc, axis_y_acc, axis_z_acc: accelerometer readings describing the acceleration of the lifting arm along three axes.
sig_pwr: radar measurement indicating the distance to an obstacle (typically the presence of a bin) in centimeters.
rfid_tag: identifier of the RFID tag detected during the measurement; may also be “decoding_error” if the tag could not be read, or empty if no tag was detected.
rssi_rfid: received signal strength indicator of the RFID reading.
a: diagnostic status code of the RFID reader (e.g., CRC errors, multiple tag detections).
b: diagnostic temperature of the RFID reader (in °C).
c: diagnostic counter indicating radar reinitialization, typically “1” in this dataset.
velocity: instantaneous speed of the vehicle.
timestamp: absolute timestamp of data transmission
2.4. RFID Tag Encoding
The memory of each RFID tag stores a unique 12-character identifier, which links containers to their physical and functional properties. From this identifier, the following information can be derived:
Container type: distinguishes between plastic and metal bins. It is encoded in the 5th character of the RFID code together with volume and mounting method.
Container volume: specifies the nominal capacity of the bin in liters (e.g., 120 L, 240 L, 1100 L); encoded in the 5th character of the RFID code together with container type and mounting method.
Mounting method: indicates whether the bin is designed for single-arm lifting (small containers) or dual-arm lifting (large containers); also part of the 5th character encoding.
The character in the fifth position encodes the following information:
- –
Plastic containers:A (110 L, small), B (120 L, small), C (140 L, small), D (240 L, small), E (1100 L, large), J (660 L, large), K (770 L, large).
- –
Galvanized steel containers: F (80 L, small), G (240 L, small), Y (110 L, small), Z (1100 L, large).
Waste type: defines the waste fraction assigned to the container (e.g., mixed municipal, plastics, paper, glass, biowaste); encoded in the 6th character of the RFID code.
For example, in the case of RFID: X6PDBZ000182, the fifth character, B, indicates a small plastic container with a volume of 110 L. The sixth character, Z, denotes mixed municipal waste.
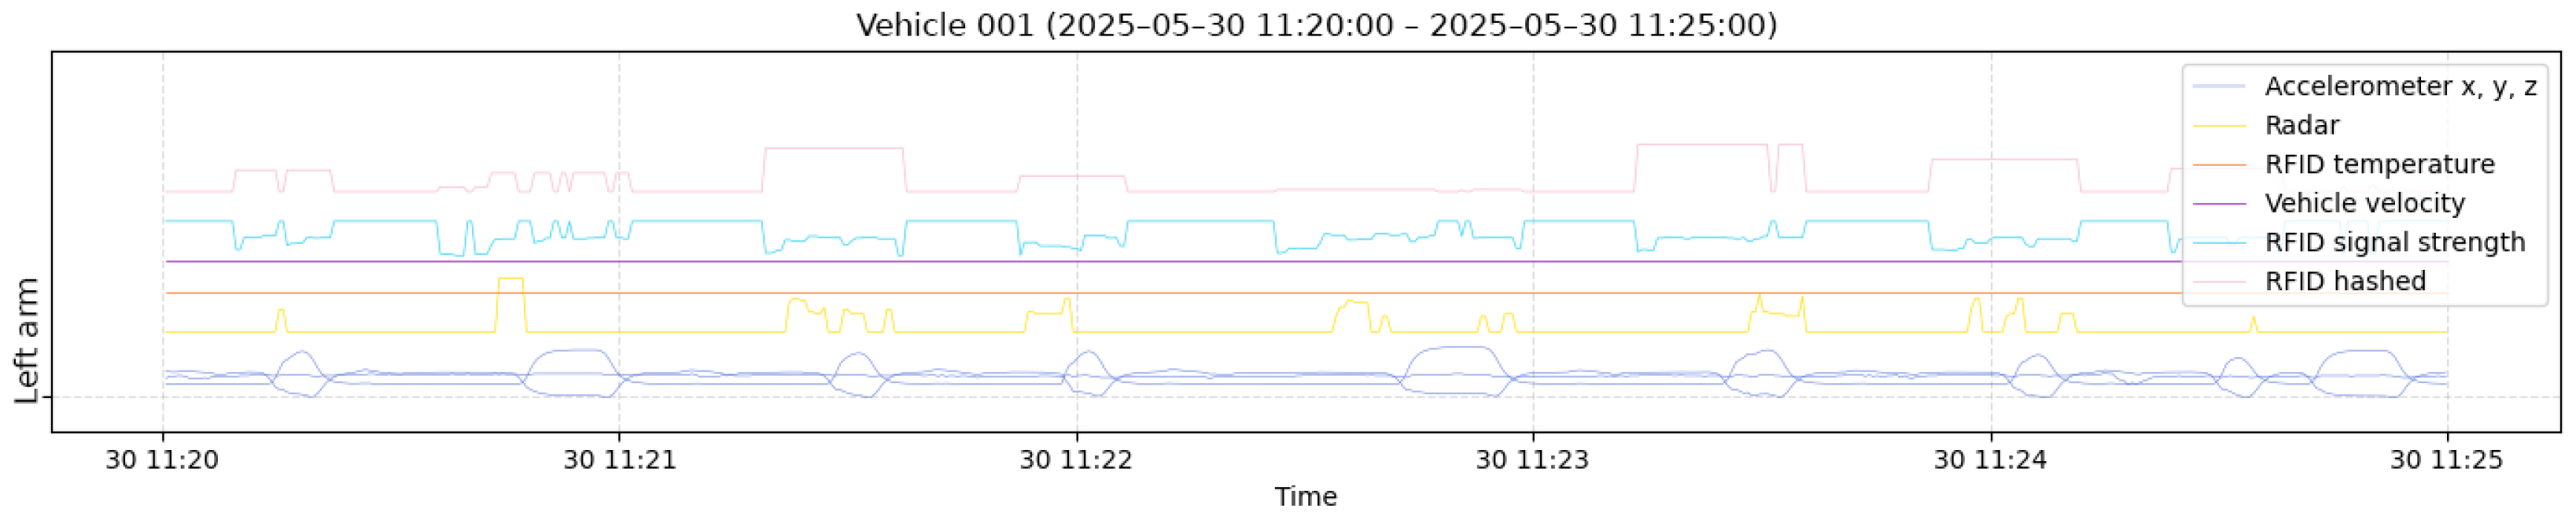
2.5. Visual Example of Sensor Data
Figure 2 provides a visualization of the basic sensor measurements introduced in
Section 2.3. The data were normalized to the range 0–1 prior to plotting. The RFID hashed contains RFID values transformed using a hashing function into the 0–1 range so that different RFID tags appear at different heights. Each sensor is plotted at a different vertical offset to make individual readings easier to interpret, with the exception of the x, y, and z accelerometer channels, which convey similar information and are therefore shown at the same height.
3. Data Annotation
The raw measurements described in
Section 2.3 were further processed to identify individual bin collection events, referred to as collection events. Each event is defined as the complete emptying operation of a single bin: the time interval from when the bin is first lifted by the vehicle arm until it is finally placed back on the ground after being fully emptied. If a bin requires multiple lifts to be fully emptied, all lifts are recorded as a single event. Annotations include the start and end timestamps of the event, the arm used (L, R, or B), and, when available, the corresponding RFID tag. We created two types of annotations for the dataset—manual video annotations and automated annotations based on sensor data.
3.1. Typical Collection Scenarios
Waste collection vehicles in the dataset are equipped with lifting devices that can be either split (two independent arms) or non-split (synchronized arms). Depending on the type of container and the lifting mechanism, several distinct scenarios of collection events can occur.
Large container emptying: Large containers (typically 1100 L) require the simultaneous use of both arms of the vehicle. In vehicles equipped with two independent arms, these arms must be mechanically joined and lifted together to empty a single container.
Single small container: Smaller containers (120–240 L) can in principle be emptied using only one arm of the vehicle. The event may occur on either the left or the right arm. In practice, however, the behavior depends on the mechanical design of the lifting device. If the arms are permanently coupled, both arms move simultaneously even when only one small bin is actually attached. In vehicles where the arms can be mechanically decoupled, operators sometimes prefer not to disengage the mechanism and therefore raise both arms together even though a single bin is being emptied. In such cases, the dataset records sensor activity on both arms, while only one arm (L or R) is physically carrying a container.
Two small containers simultaneously: When two small bins are placed next to each other, it is possible to attach one to each arm and lift them simultaneously. This results in a synchronized upward movement of both arms. The problem is further complicated by the possibility that the lifting mechanism operates in coupled mode, so that both arms always move together, regardless of whether one or two bins are actually attached.
From the perspective of Pay-as-you-throw schemes, the primary goal is not to determine the precise start and end of each collection event, but rather to establish the number of bins that were actually emptied. This distinction is crucial because, in some situations, the sensor data alone may not unambiguously indicate whether the vehicle emptied one large container, two small containers simultaneously, or only a single small container while both arms were in motion. RFID-based identification cannot be fully relied upon, as RFID tags may be missing, damaged, or temporarily unreadable due to environmental or operational conditions. This ambiguity could directly affect the accuracy of PAYT-based billing.
3.2. Video Based Manual Annotation
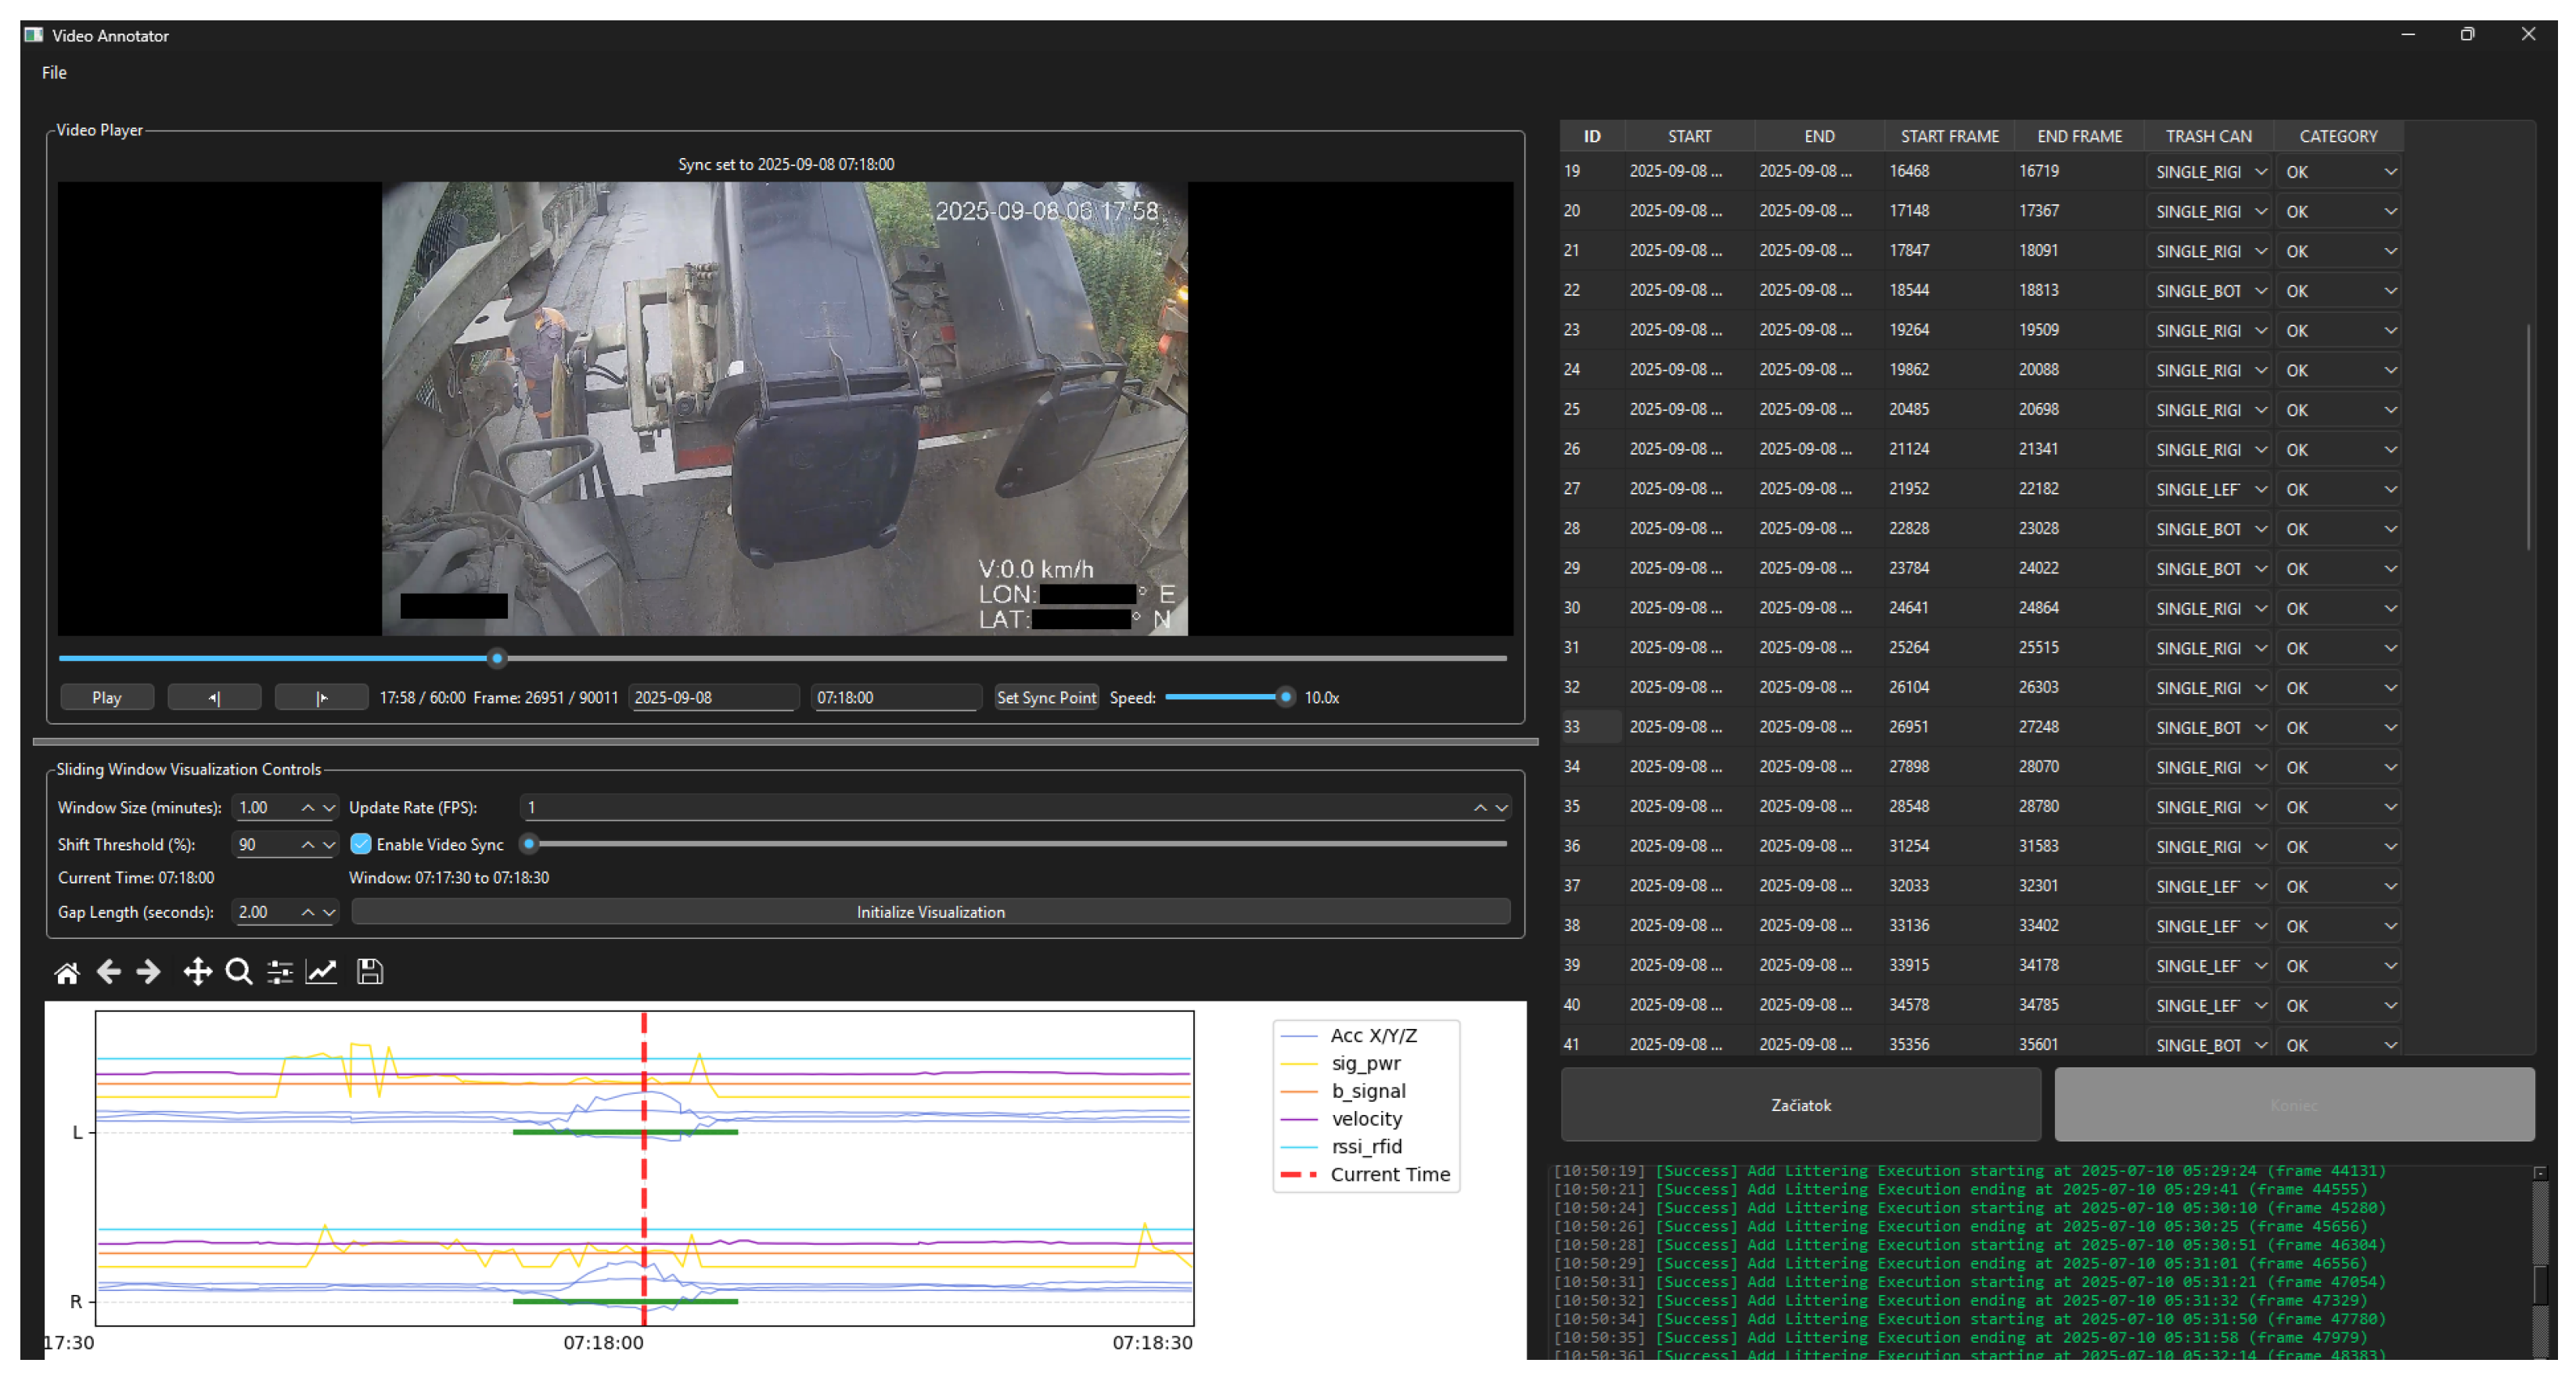
For selected days of specific vehicles, synchronized video recordings were used to create ground-truth labels. Human annotators marked each event. For each event, the start and end times were recorded using anotator application,
Figure 3. In some cases, after the bin was emptied and placed back on the ground, residual waste remained inside. The operator then reattached the bin to the lifting arm and repeated the emptying process, sometimes more than once. In such situations, the manual annotation defines the event start as the first moment when the bin was attached and the arm began moving upwards, and the event end as the last moment when the same bin was attached and the arm returned downwards. Each manually annotated event was saved together with fields describing the type of lifting operation.
An automated matching algorithm was applied to associate collection events with corresponding RFID tag in the sensor data. From the sen_status_data records, a time window was extracted from the start to the end timestamps of each annotated event. If exactly one RFID detection occurred within this window, it was assigned to the event, provided that the container types matched. If two detections were identified with different container types, the RFID corresponding to the event’s container type was selected. In cases where multiple RFIDs of the same container type were detected, the one with the longest detection duration (i.e., the highest number of occurrences) was assigned to the event.
3.3. Automated Annotation
The second part of the dataset was created using automated annotations. A rule-based algorithm primarily utilizing accelerometer, radar, and RFID data was used to generate a set of candidate collection events. The automatically generated candidate events exhibited several recurring problems, which were addressed through a structured postprocessing pipeline described below.
First, candidate events with zero duration were removed. These events occasionally occurred due to boundary conditions in the rule configuration and did not correspond to any physical lifting action.
Second, overlapping events generated independently for each arm were resolved. In some cases, one arm detected the lifting of a large container (based on RFID information), while the other arm simultaneously detected an event classified as a small container lift. Such overlaps were resolved according to the following decision rules: if only one of the overlapping events was associated with an RFID tag, the event without an RFID tag was removed. If both events had associated RFID tags, the corresponding sensor signals (accelerometer, radar, and RFID activity) were visualized and manually reviewed. The decision was based on temporal alignment of motion patterns across both arms and consistency with the expected lifting dynamics of either a single small-container lift involving both arms or a large container lift.
Third, for each vehicle, intervals were identified in which an RFID tag was detected but could not be matched to any lifting event (“delta RFID” intervals). These intervals were visualized and manually reviewed to determine whether a lifting action could plausibly have occurred during that time window based on the available sensor signals. If no evidence of lifting was observed, the interval was discarded.
Finally, all remaining collection events were processed in chronological order. Consecutive events detected on the same arm and associated with the same RFID tag were merged, as they were considered repeated lifting rather than distinct events.
Although this postprocessing pipeline was designed to address the most common errors in automated annotations, some cases could not be reliably resolved and were retained in the dataset and are further discussed in
Section 4.3.
3.4. Collection Event
For both datasets, collection event table contains the processed and annotated collection events inferred from the raw sensor data. Its attributes are:
id: database identifier of the event.
unit_id: identifier of the IoT sensor unit.
timestamp: central timestamp of the collection event.
timestamp_start, timestamp_end: start and end timestamps of the lifting motion.
car_id: identifier of the vehicle where the event was recorded.
car_arm: possible values are “L” (small container on left arm), “R” (small container on right arm), or “B” (big container using both arms).
rfid_tag: identifier of the RFID tag of the emptied bin, if detected.
4. Dataset Overview and Statistics
4.1. Overview by Vehicle
Table 1 provides an overview of the dataset for each waste collection vehicle and its sensor units. For each vehicle, two independent IoT sensor units recorded sensor measurements from the left and right lifting arms. Those measurements were later used to identify collection events and annotate container types.
The table reports several metrics per arm. “Vehicle” describes vehicle ID and indicates the number of observation days available for each vehicle. “CE All” indicates the total number of collection events detected at the sensor level—this represents arm activity regardless of container type. “CE No RFID” shows the subset of these events for which no RFID tag was detected. “Small All” and “Big All” indicate the number of annotated small and big containers respectively. “Small No RFID” and “Big No RFID” show the subsets of these containers for which RFID identification was unavailable. Note that lifting large containers requires both arms; so, a single large container generates sensor activity on both the left and right arms (contributing 1 to CE all on each arm and 1 to Big all on each arm), but represents only one physical container. “Data Count” reports the total number of sensor data messages collected by each unit.
The row labeled “both” aggregates metrics across both IoT sensor units. For collection events (CE All), the sum of left and right arm values does not equal the “both” value because large containers detected simultaneously by both arms are counted twice in the per-arm rows but represent a single collection event in the aggregate. For container counts (Small and Big), the “both” row shows the total number of unique containers in the dataset.
Vehicles 101, 102, and 103 were manually annotated based on videos, whereas vehicles 001, 002, 003, 004, and 005 were annotated by the automated process. We suggest that vehicles 101–103 are used for validation and testing, while vehicles 001–005 are used for training.
4.2. Temporal Analysis
4.2.1. Time Gaps Between Collection Events
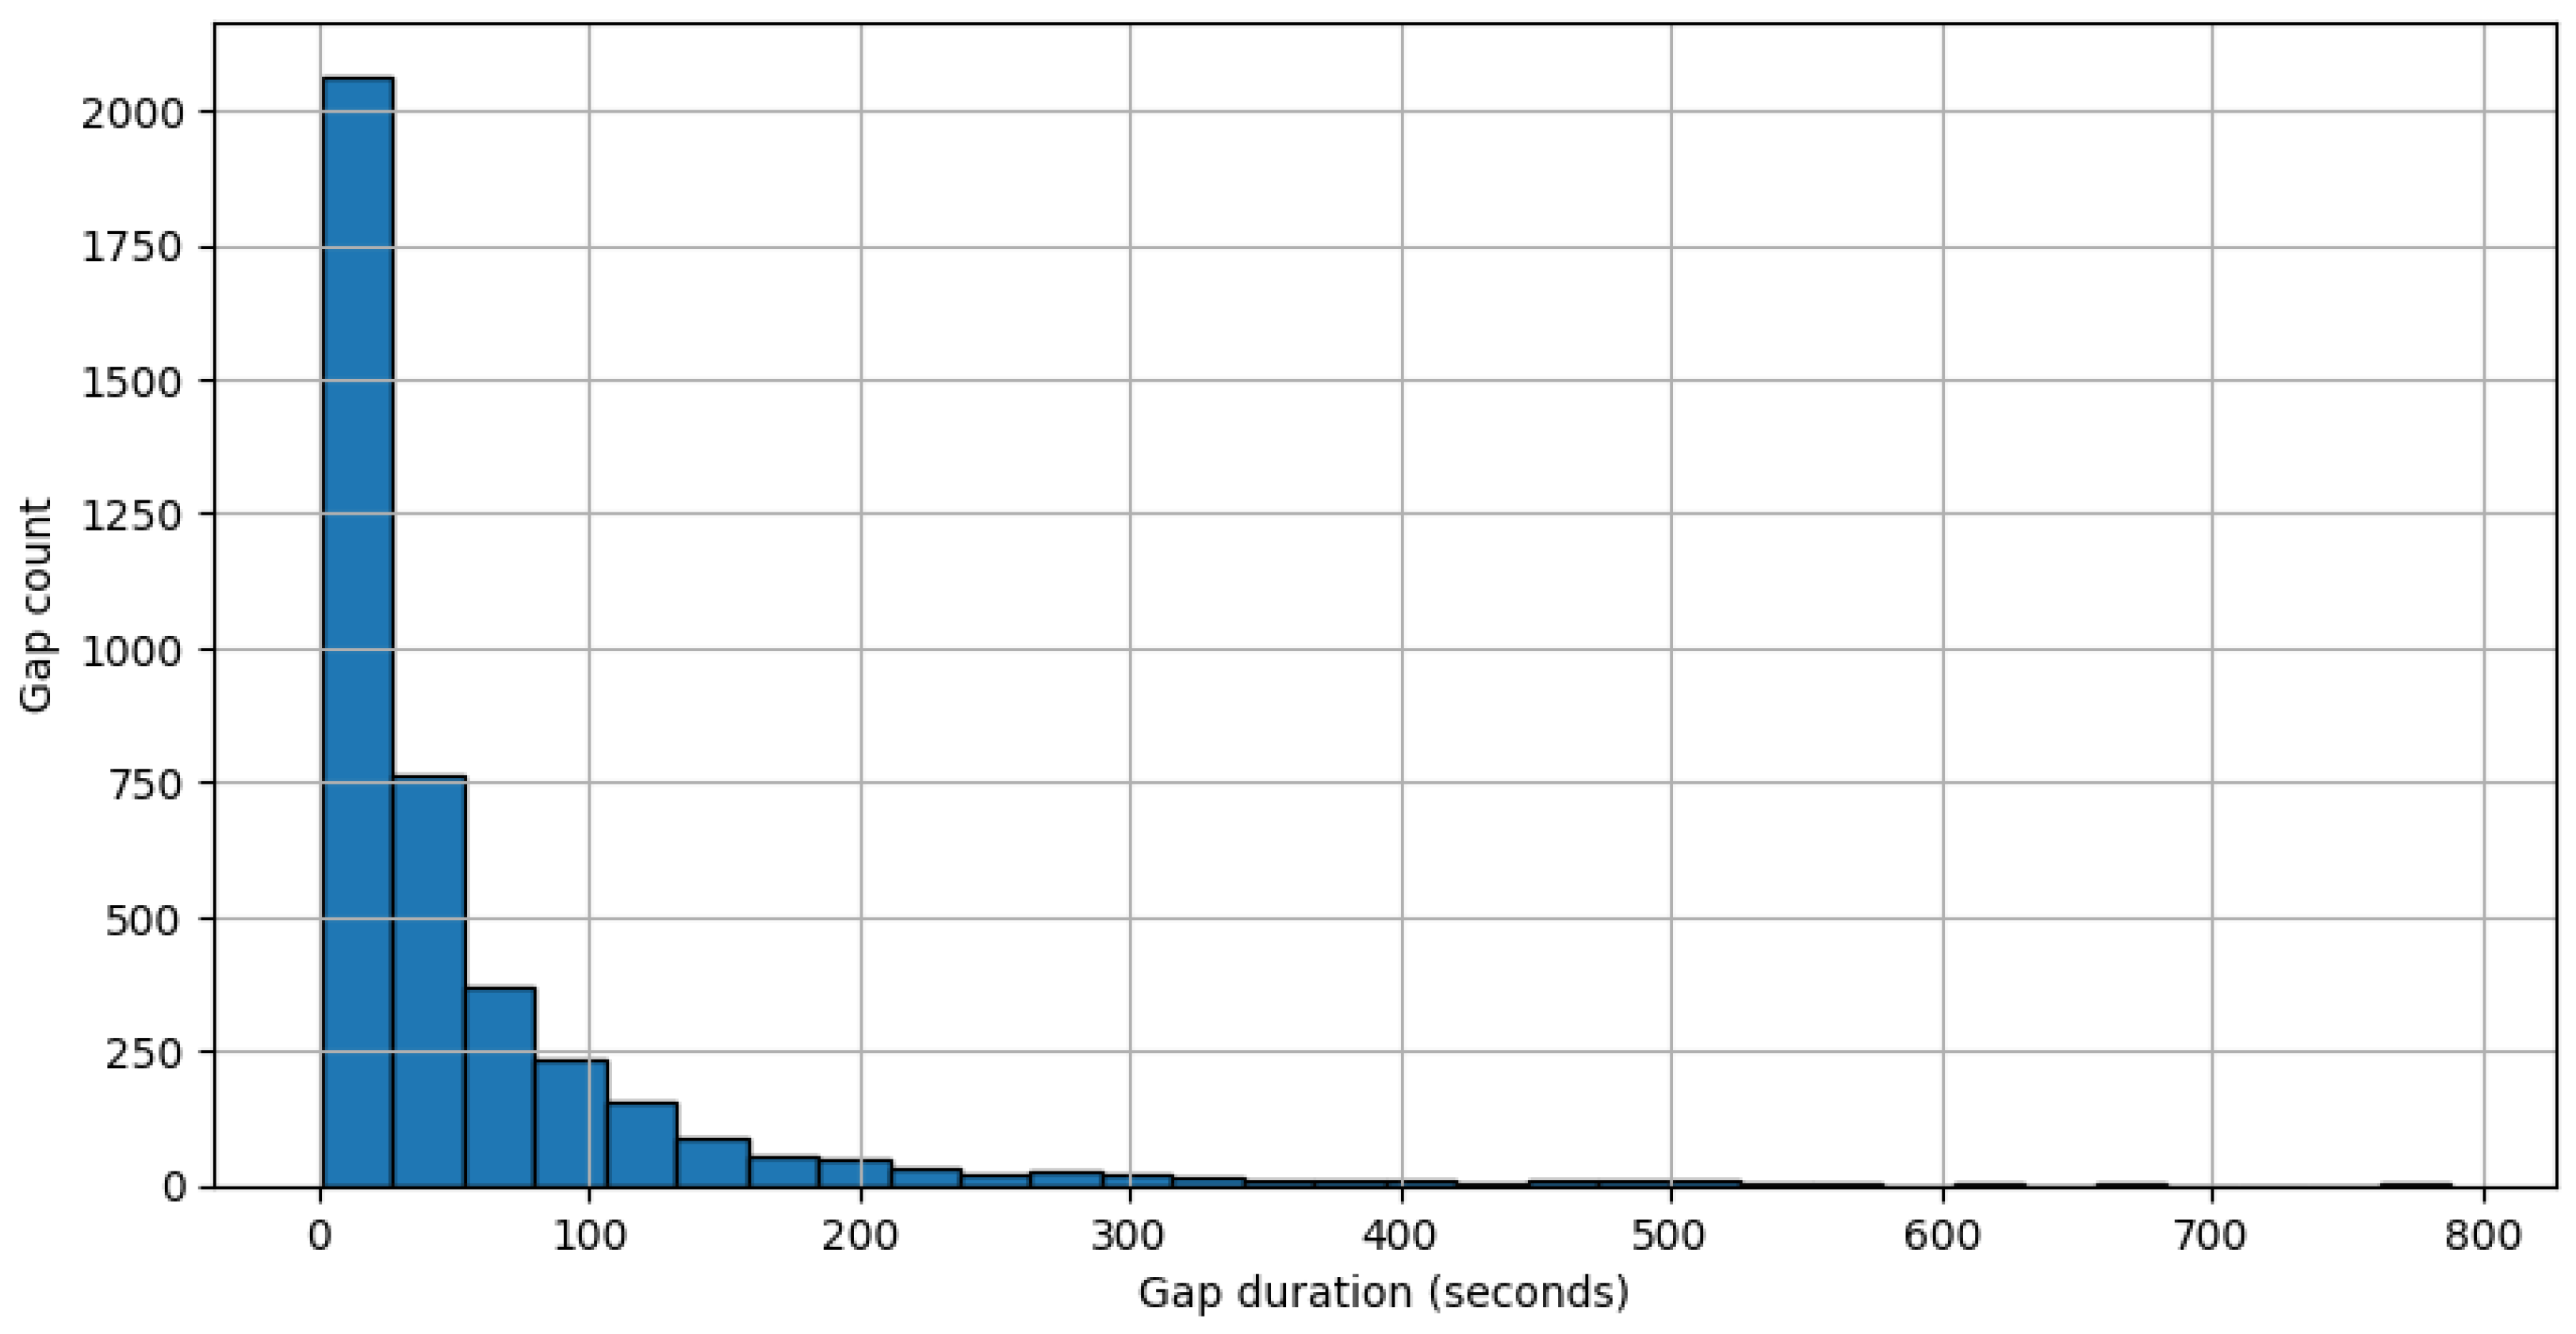
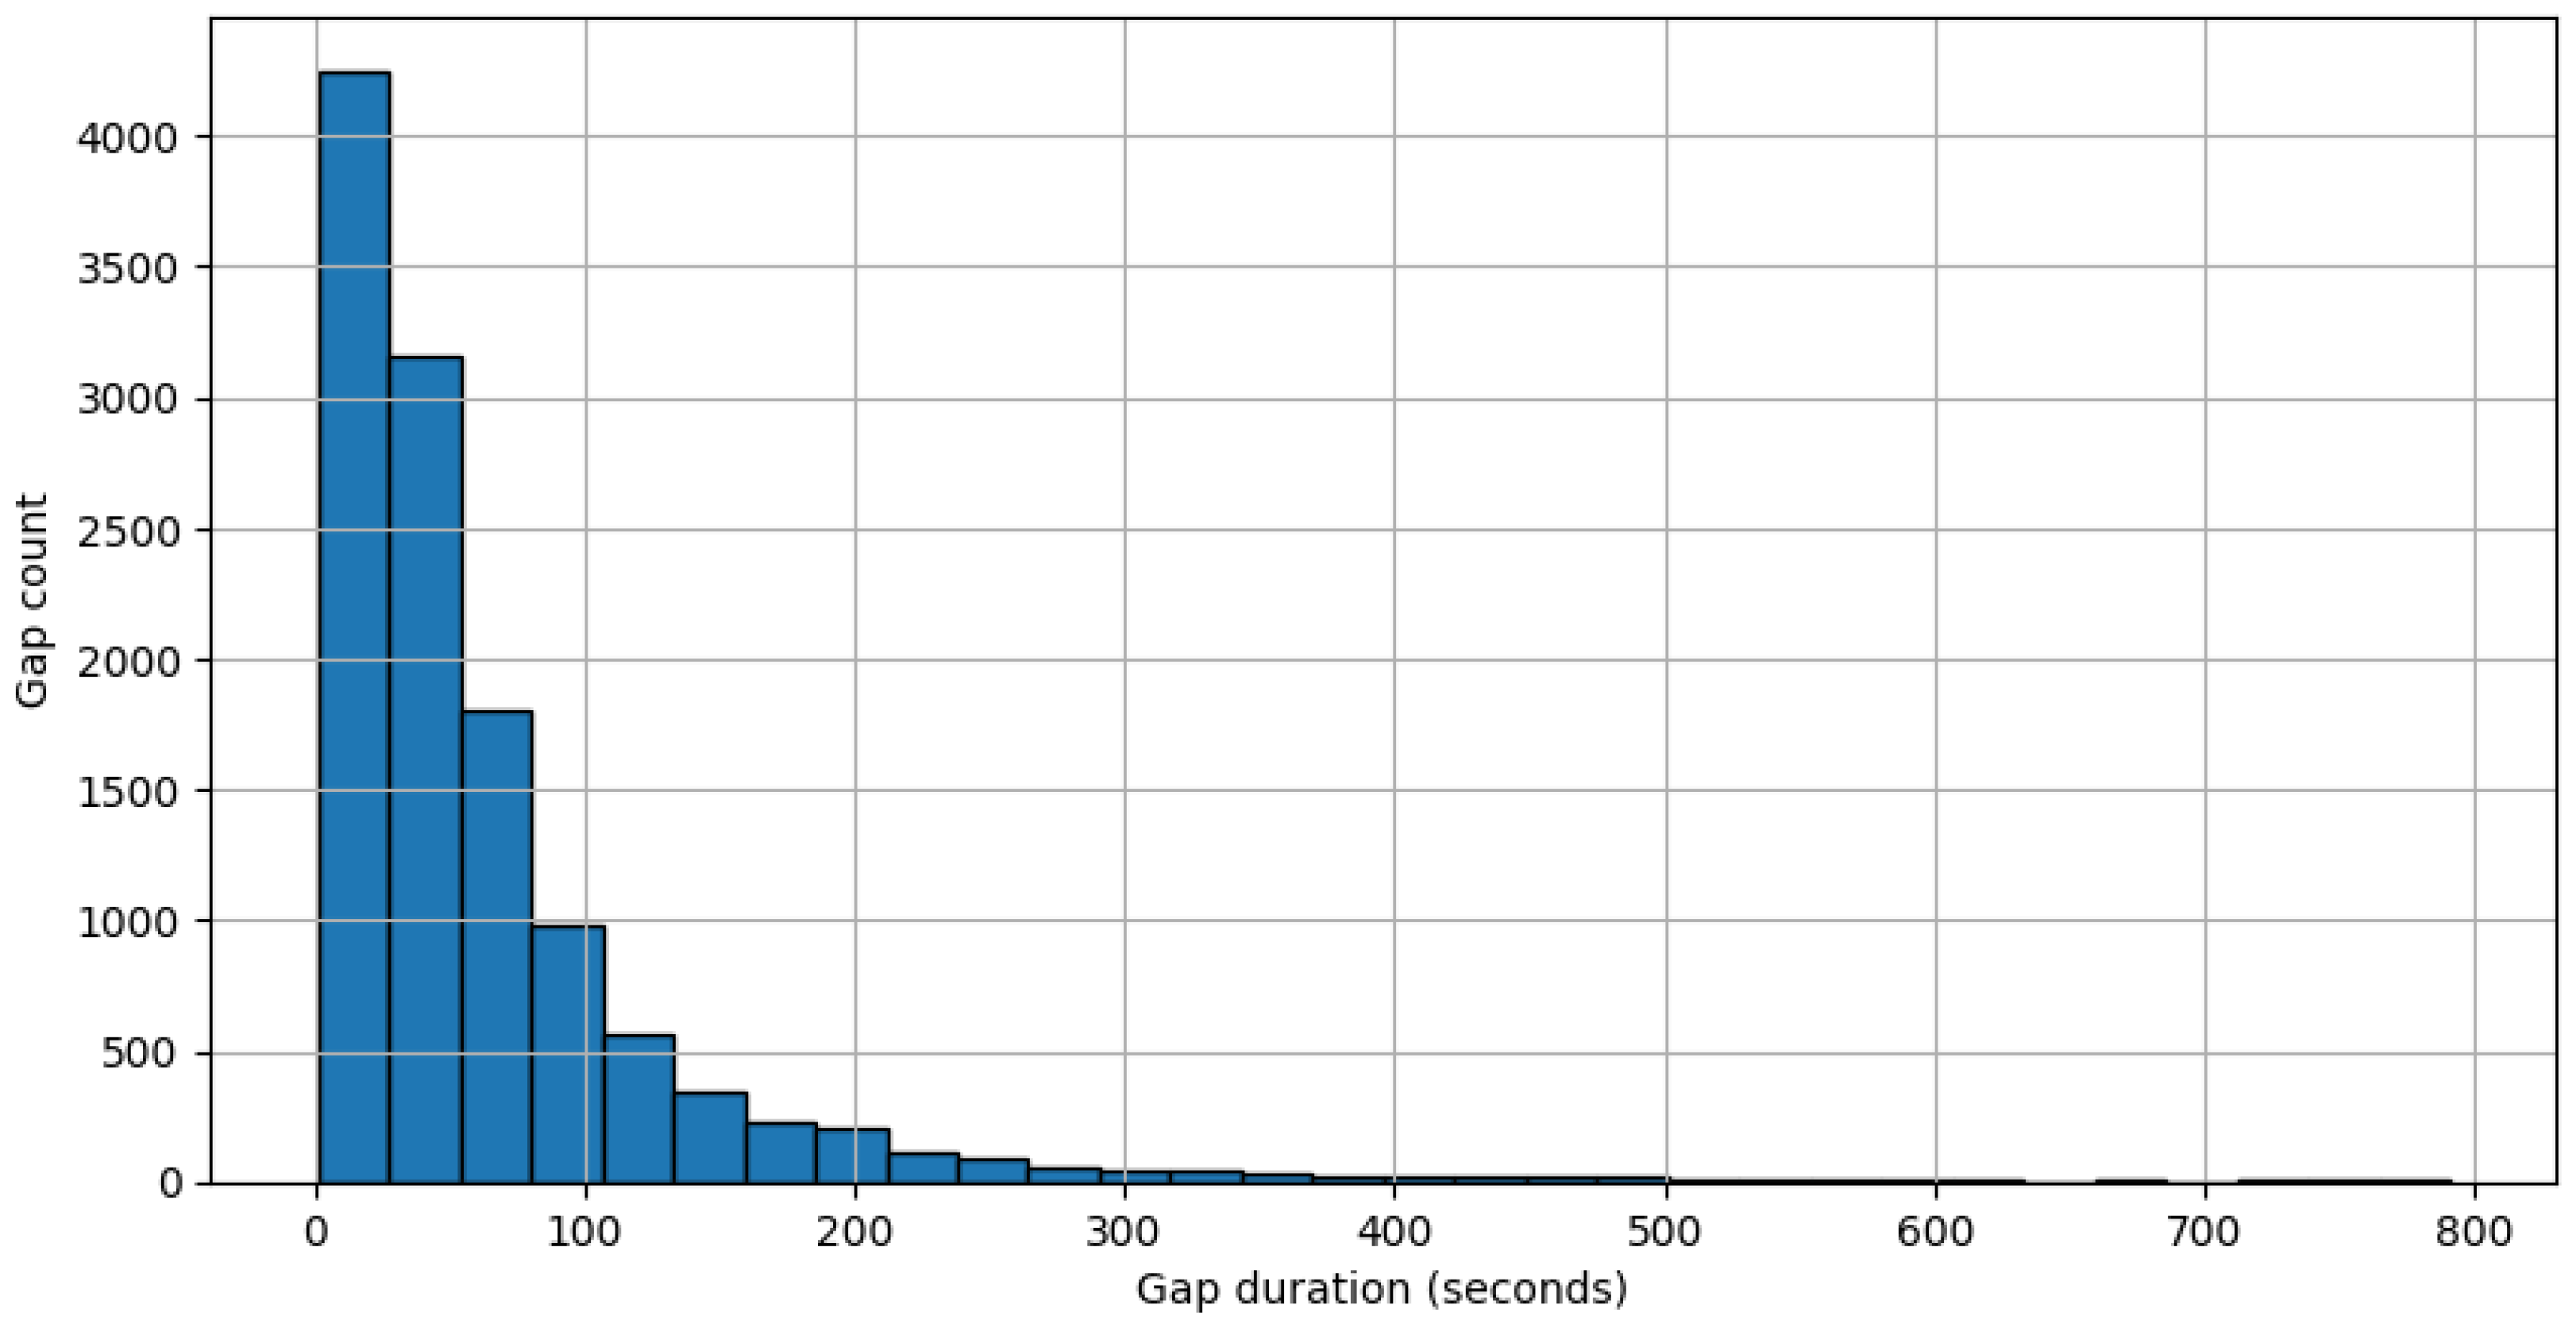
In order to better understand the temporal distribution of collection events, we analyzed the time gaps between pairs of collection events for each lifting arm. This analysis is relevant for the development of detection methods that rely on sliding windows, where the choice of window size must account for the natural temporal variability in the process. Since collection vehicles regularly experience interruptions in their operating schedule (such as relocations between collection points, traffic-related delays, or driver breaks), we excluded gaps longer than 800 s from the statistics. The summary of minimum, maximum, average, and standard deviation of the gaps for each unit is shown in
Table 2. The distribution of these gaps is further illustrated in
Figure 4 and
Figure 5, where it can be seen that gaps longer than 400 s (approximately 6.6 min) occur only rarely.
4.2.2. Event Duration
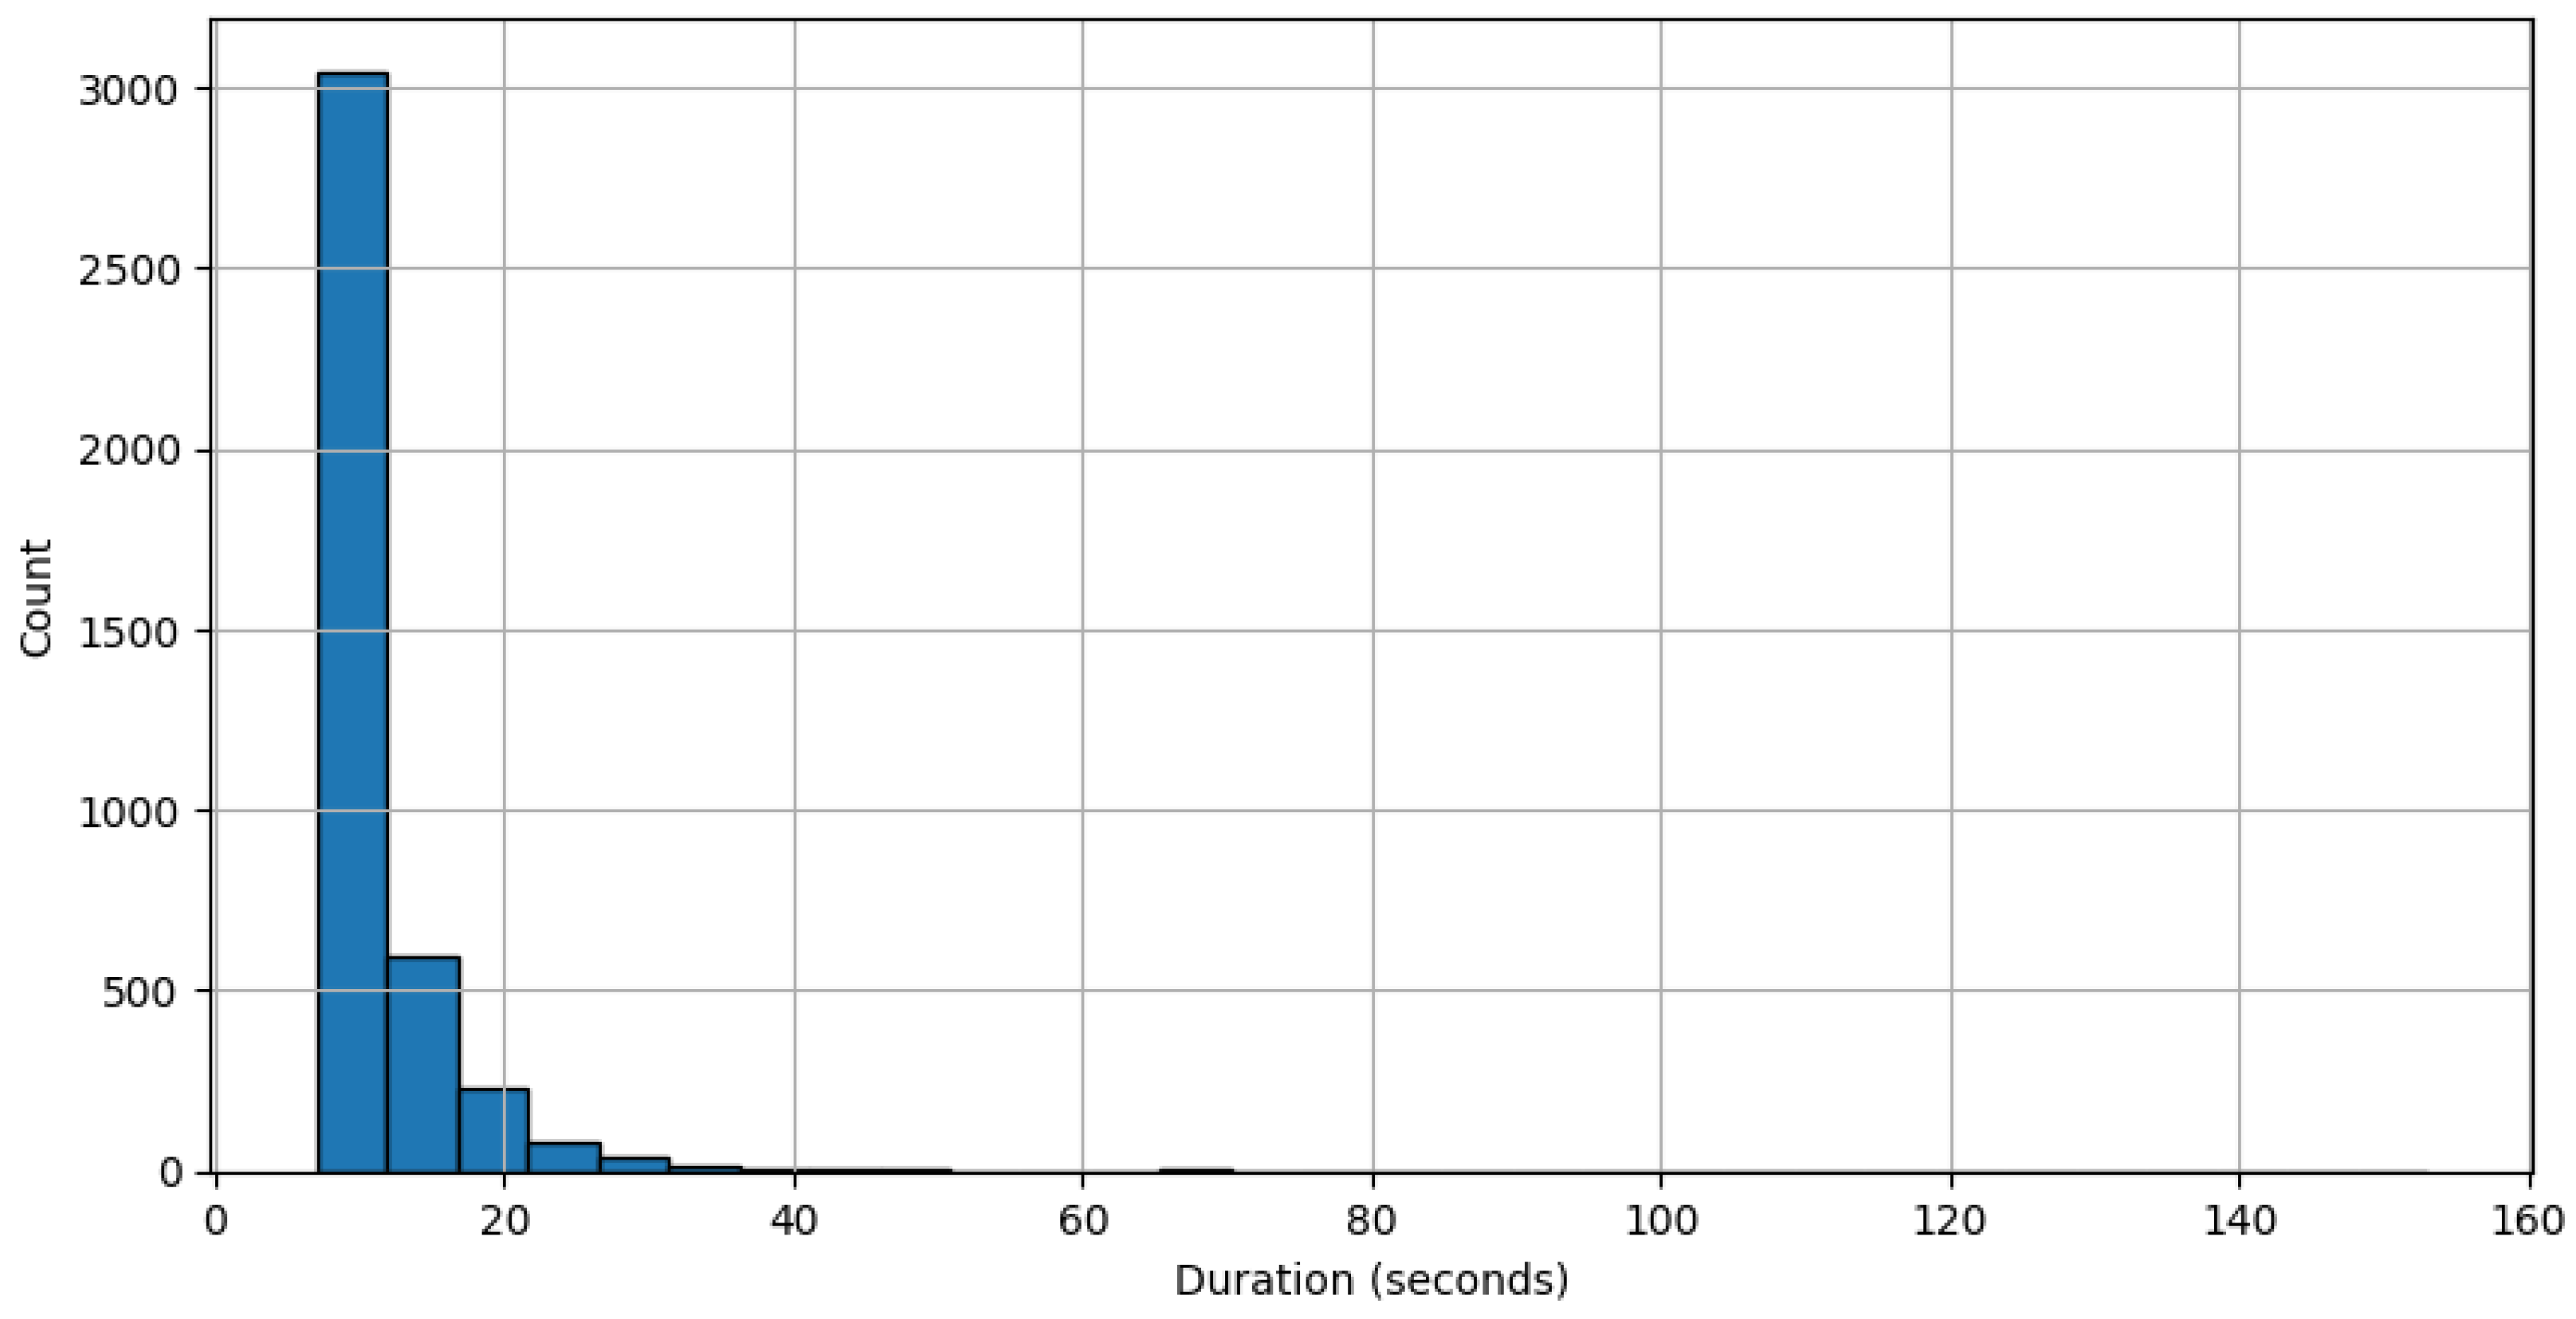
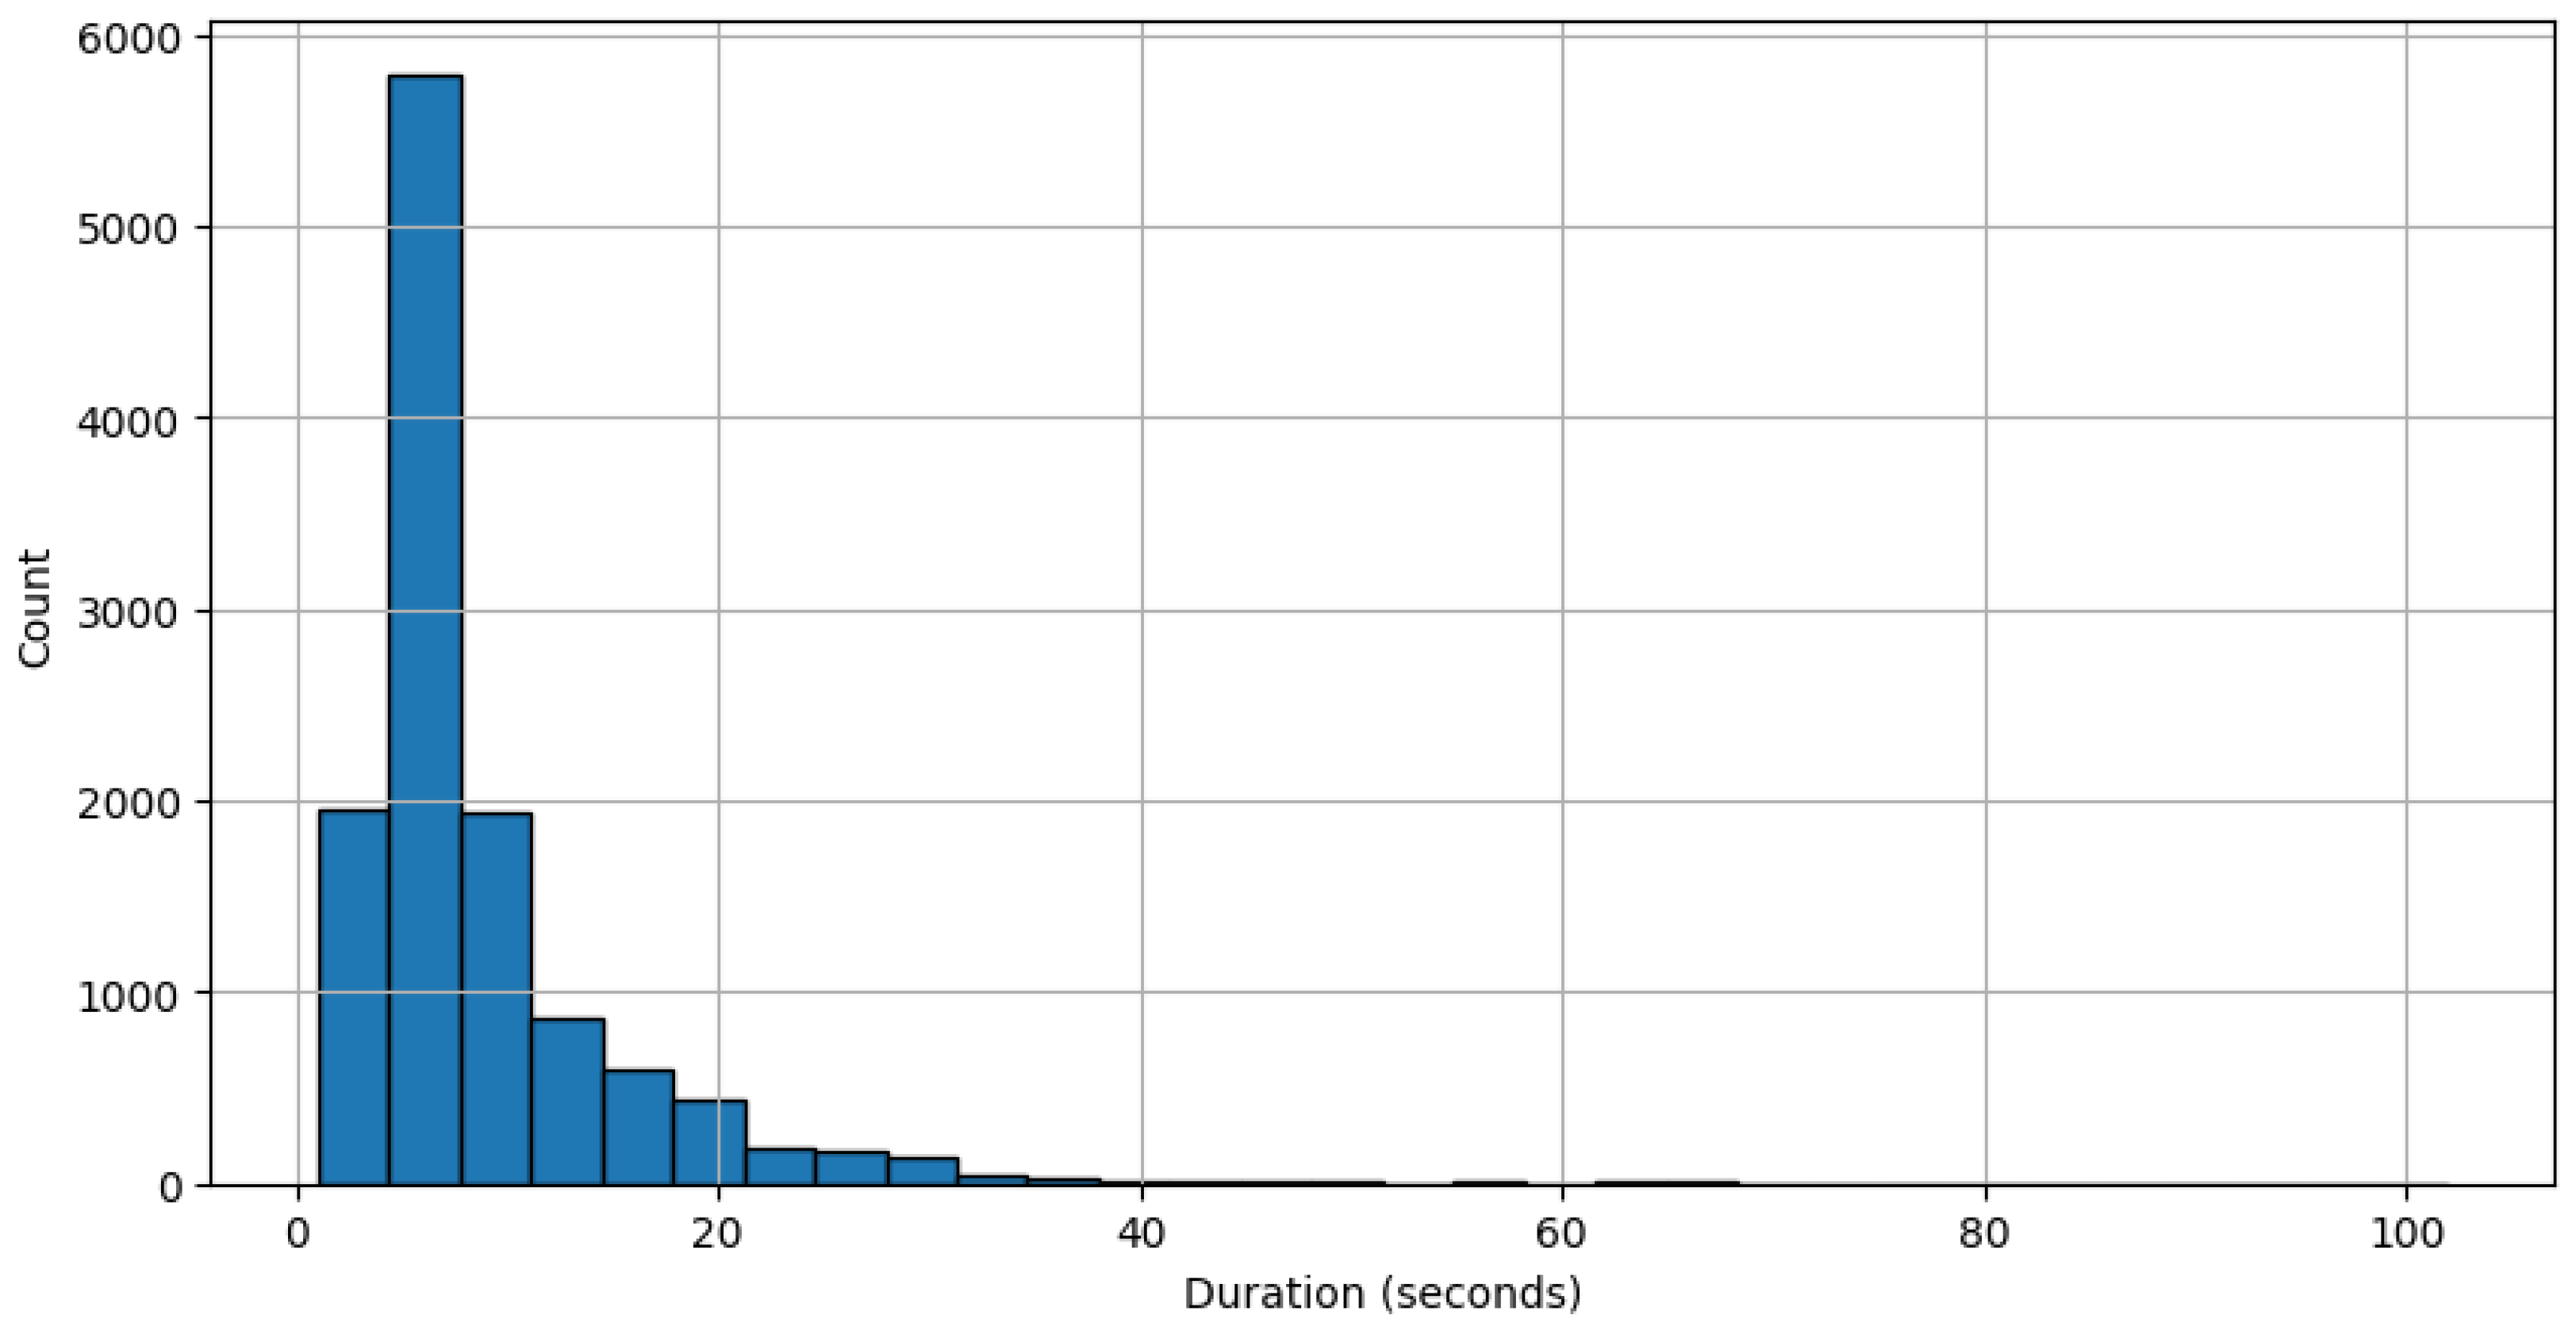
Table 3 summarizes the duration of individual collection events measured in seconds. The statistics were computed separately for each lifting arm, as well as for the entire dataset. The average emptying duration typically ranges between 3–20 s, while only a few outliers exceed one minute. The maximum observed duration reached 153 s, which represents an exceptional case. These results illustrate the typical duration required to complete a container emptying operation, which is useful for modeling and validating detection algorithms. The distribution of event durations is further illustrated by the histograms shown in
Figure 6 and
Figure 7, which compare the video-validated and automated datasets.
4.2.3. Sensor Sampling Intervals
Within the dataset, the time gaps between consecutive
SensorData messages are expected to be approximately 0.5 s. To validate this assumption on real-world data, we performed an analysis of the temporal gaps. The results are summarized in
Table 4.
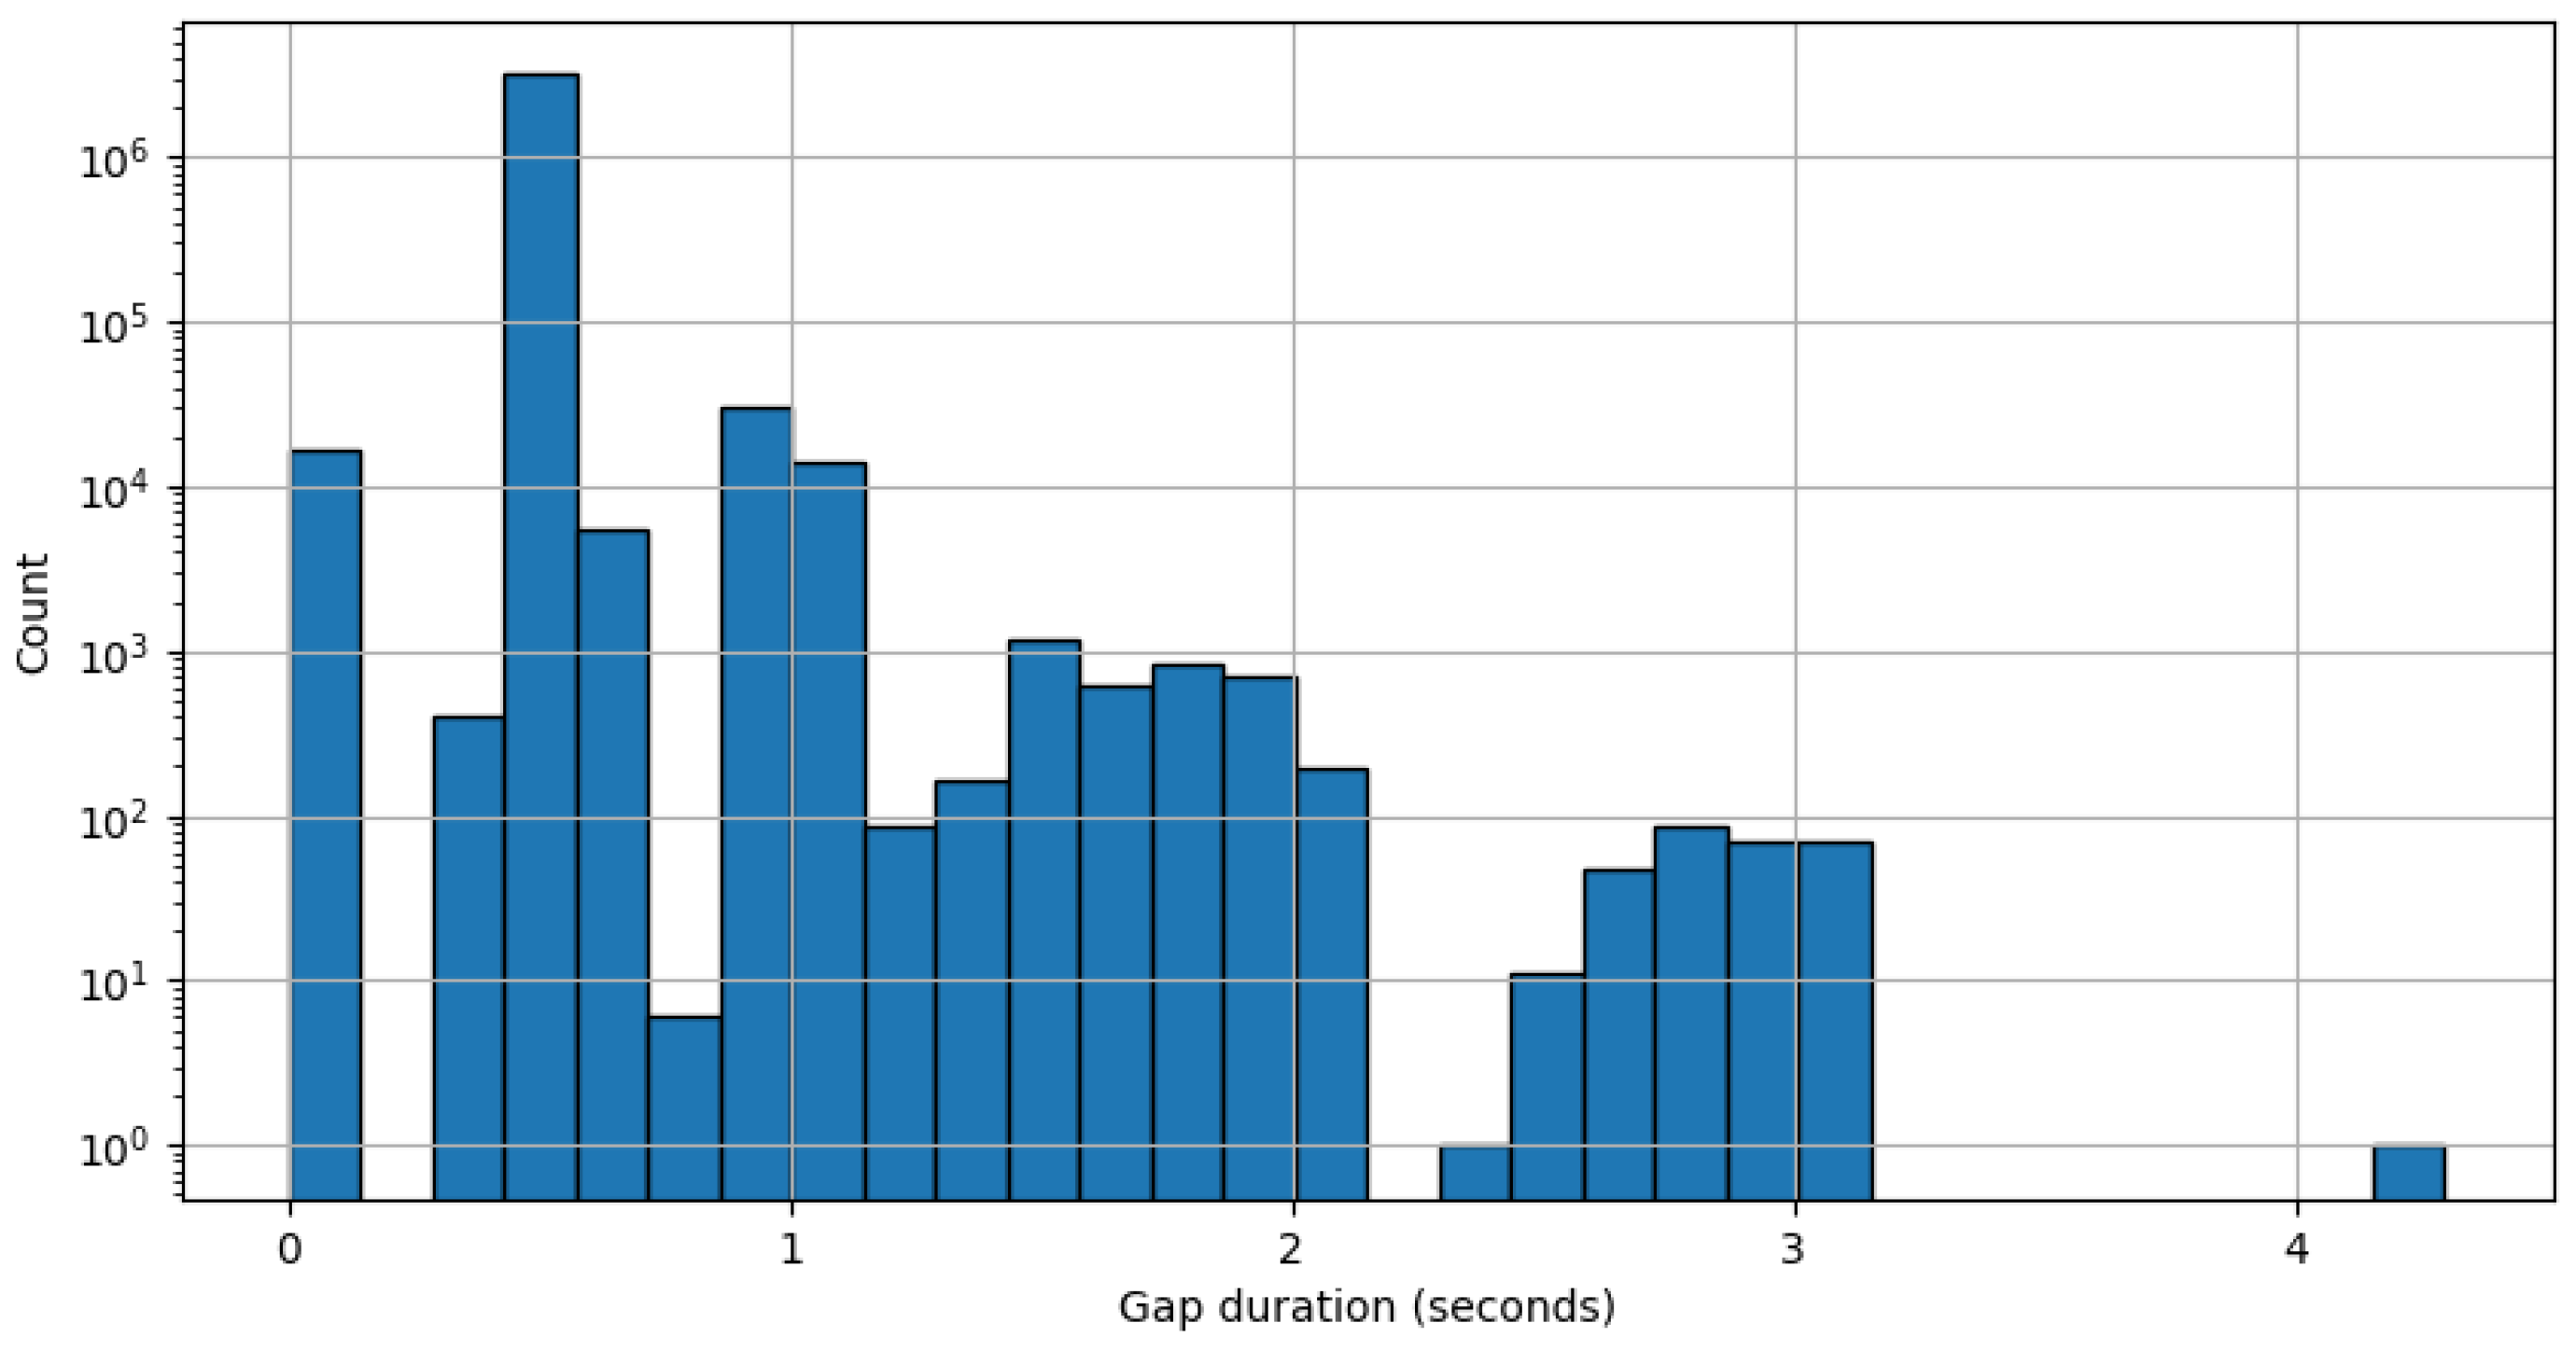
In addition to standard statistical indicators such as minimum, maximum, average, and standard deviation, we also tracked the number of zero gaps, i.e., duplicate sensor measurements with identical timestamps. On average, sensor measurements are spaced about half a second apart. Therefore, we also identified cases in which the spacing exceeded 0.75 s (50% longer than the average). The counts of such occurrences are summarized in the column “Count of Gaps > 0.75 s” in
Table 4. The distribution of the gaps on logarithmic scale is further illustrated in
Figure 8. While the majority of observations lie close to the expected 0.5 s interval, the plot also reveals smaller secondary clusters, for example around 1 s.
4.3. Comparison of Annotation Methods
To verify the quality of the automated annotation process, we applied it to the same vehicles for which manual video annotations were available (vehicles 101–103). The automated and manual annotations were then matched based on temporal overlap and class consistency. Each automated detection was paired with at most one manual annotation, and vice versa. A True Positive (TP) occurs when an automated detection correctly matches a manual annotation in both timing and class (small left/small right/large). A False Positive (FP) indicates an automated detection with no corresponding manual annotation, or one that matches in time but has incorrect class. A False Negative (FN) indicates a manual annotation that was not matched by any automated detection. Note that class mismatches can generate both FP and FN: for example, if the annotation process detects two small containers but the ground truth shows one large container, this produces two FPs (misclassified small containers) and one FN (unmatched large container).
We evaluated automated annotation quality separately for events with and without RFID tags.
Table 5 shows the results. For events with RFID tags, the automated annotations achieved high reliability (F1 = 0.9891) with only 13 false positives and 16 false negatives out of 1329 ground truth events. For events without RFID tags, performance decreased to F1 = 0.8690, with 249 false positives and 180 false negatives out of 1603 ground truth events.
Error analysis reveals two primary sources of misclassification in non-RFID events. First, when both lifting arms move synchronously, the automated annotation process cannot reliably distinguish between a large container requiring both arms, two small containers lifted simultaneously, or a single small container on a coupled lifting mechanism. The annotation procedure defaults to labeling such ambiguous cases as two small containers lifted simultaneously, which can be seen as an upper bound on the number of individual collections.
Second, repeated lifting of the same container—when residual waste requires the operator to lift and sometimes reattach the container multiple times in succession—results in multiple detected events. Without RFID-based identity tracking, the annotation process cannot recognize that consecutive lifts belong to the same container and therefore records them as separate collection events. Manual inspection of error cases identified 24 distinct instances of repeated lifting in the non-RFID subset, with each instance potentially generating multiple classification errors depending on how many times the container was re-lifted. Notably, even manual verification of sensor data alone cannot reliably distinguish repeated lifting from legitimate consecutive collections of different containers; such disambiguation requires either RFID tags or video recordings.
These error patterns reflect the inherent challenges of collection event detection in scenarios where container identification is unavailable, and should be considered when using the automated annotation subset (vehicles 001–005) for model training.
5. Potential Applications and Limitations
5.1. Applications
The primary purpose of this dataset is to support the development and evaluation of AI models for automatic detection and classification of waste collection events from multimodal IoT sensor data. A key focus is enabling robust detection in scenarios both with and without RFID identification. This capability is foundational for implementing Pay-as-you-throw (PAYT) billing schemes, which can use volume/frequency-based billing or weight-based billing. Our dataset, originating from vehicles without weighing systems, is primarily designed to support volume/frequency-based approaches. However, models trained on this dataset can be deployed on weight-equipped vehicles, as weight data can be paired with detected events through temporal matching (similar to RFID pairing in our annotation process) or the models can be fine-tuned on data with weighting information as an additional input feature.
The substantial variation in RFID availability across vehicles in our dataset makes it particularly valuable for developing RFID-independent detection methods that rely on accelerometer, radar, and GPS data alone. Such RFID-free detection is critical not only for municipalities with incomplete RFID infrastructure, but also for detecting unauthorized waste disposal where container identification may be deliberately avoided or infrastructure deliberately tampered with.
Beyond this primary application, the dataset supports several additional research directions. The dataset structure facilitates research in anomaly detection, including identification of implausible event sequences, missing sensor signals, mechanical malfunctions, or fraudulent behavior patterns.
5.2. Limitations
While the dataset serves as a realistic foundation for waste collection identification research, several challenges must be taken into account when interpreting the results and deploying trained models in operational settings.
5.2.1. RFID Cross-Talk
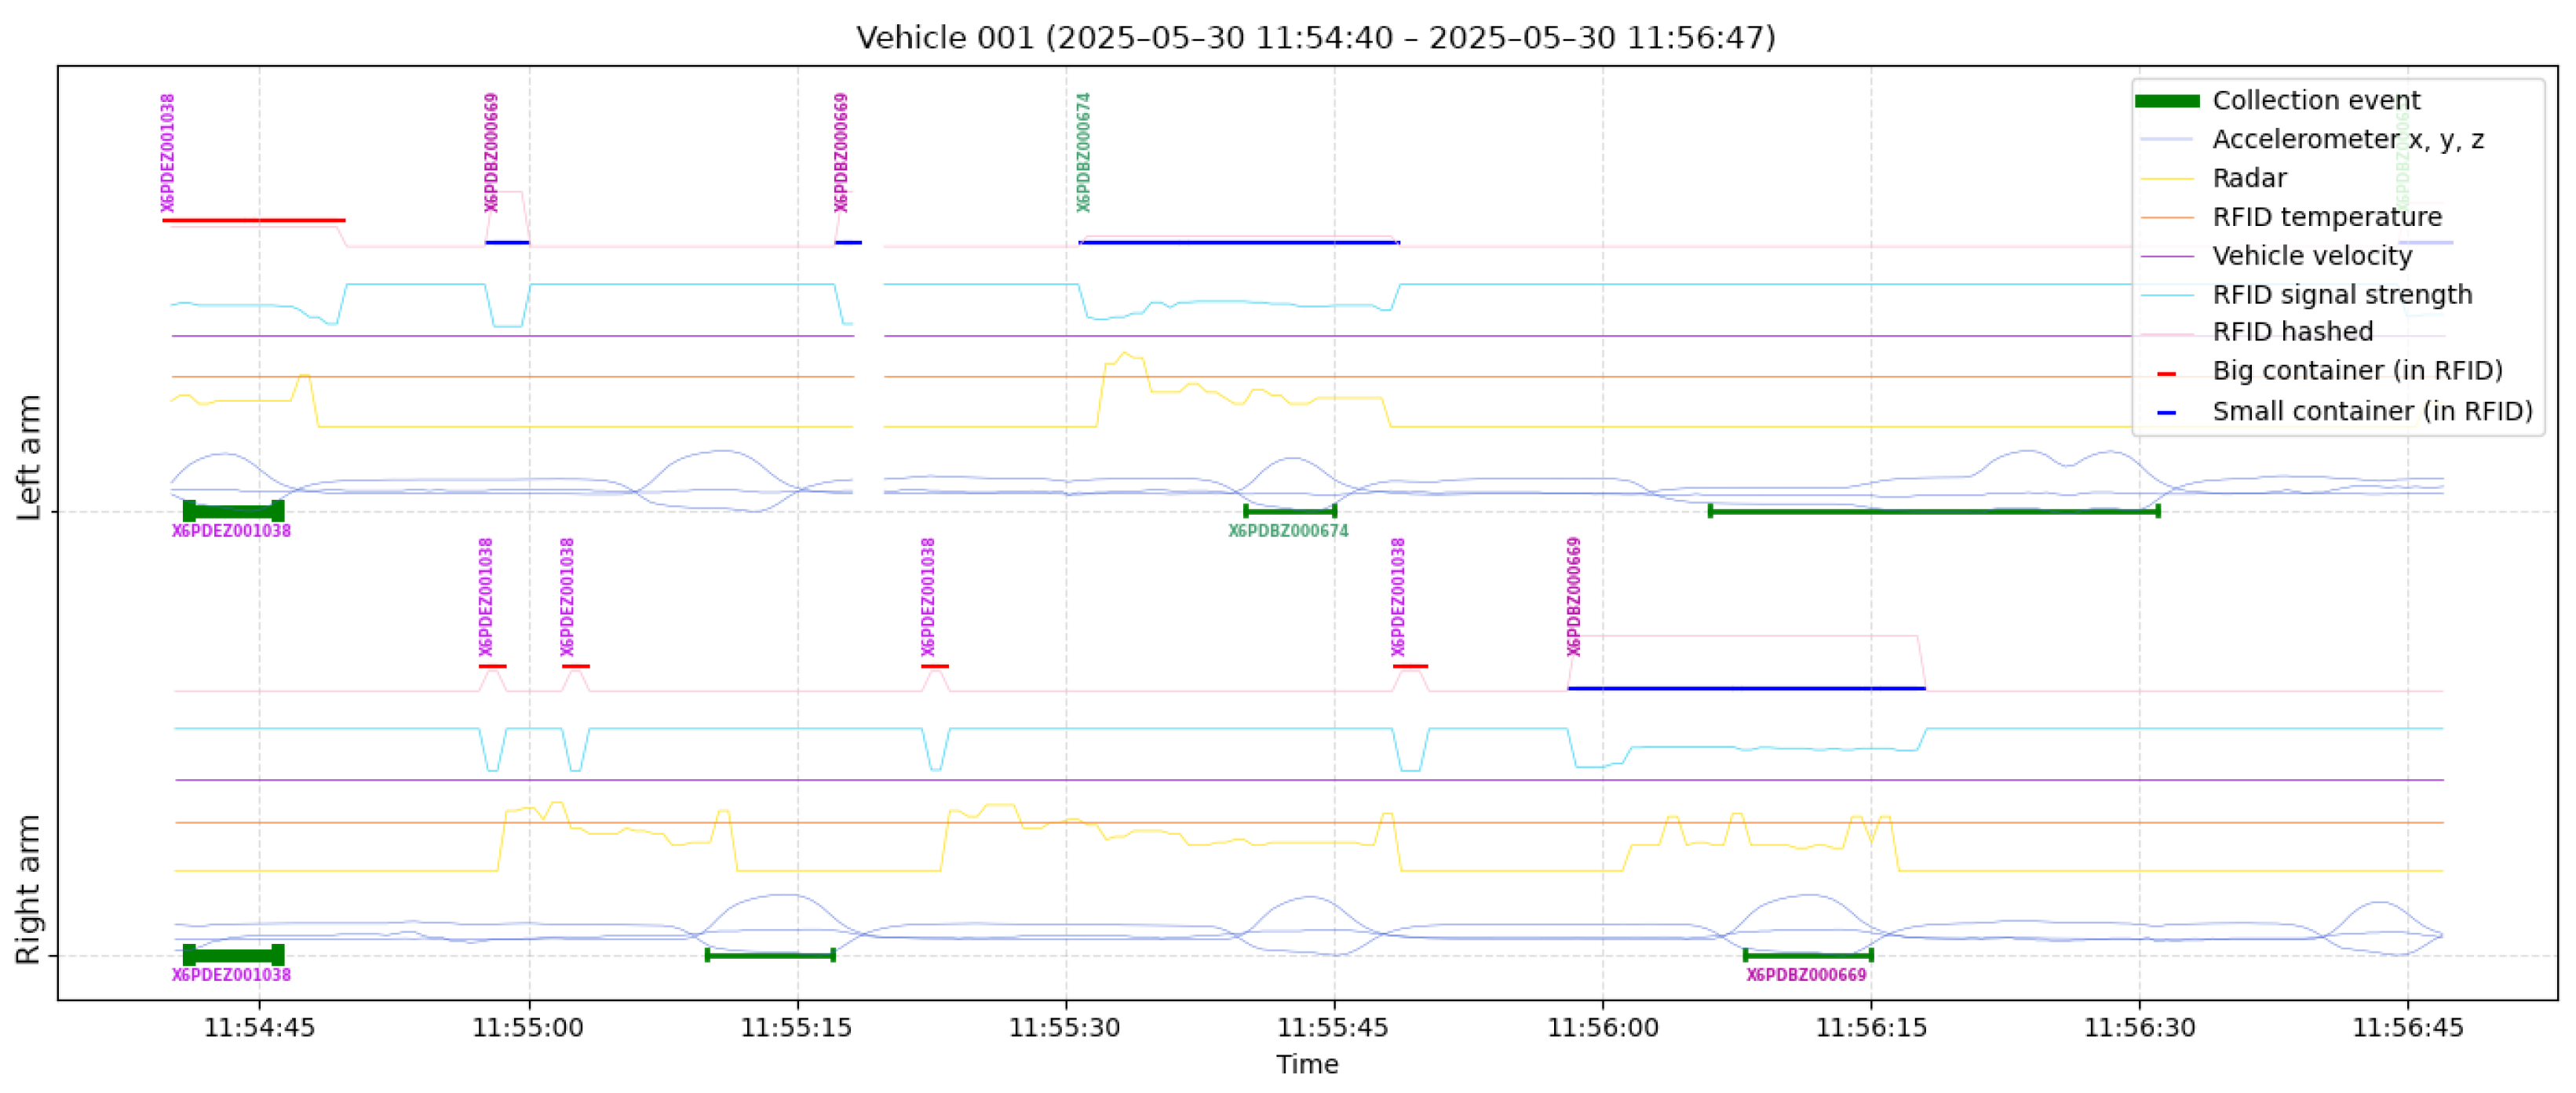
Despite its strengths, the dataset also reflects the limitations of real-world data collection. One important issue is the occurrence of RFID cross-talk. RFID readers can occasionally register a tag even if the corresponding container is not the one being emptied, but is only located in the vicinity of the antenna. This typically occurs when multiple bins are positioned close to each other. A practical example is the simultaneous lifting of two small bins, where only one is equipped with an RFID tag. In such a case, the antenna may capture the tag from the bin that is present on the opposite arm, and the system can mistakenly assign the RFID identifier to the wrong container. RFID signals can also be captured when a container is located near the vehicle while another container is being emptied. A more complex situation involving the detection of multiple RFID signals is illustrated in
Figure 9. These false detections may lead to collection events being incorrectly annotated. These situations were manually reviewed and cleaned up; however, rare errors may still appear in the data, especially in cases where a container without an RFID tag is being emptied. In such situations, cross-talk from a nearby container of the same type (e.g., both small bins or both large bins) may result in an incorrect RFID being assigned to the collection event.
5.2.2. Repeated Lifting and Non-RFID Ambiguity
Collection events without RFID identification present two significant challenges for automated annotation, both of which affect the quality of training data in the automated annotation subset (vehicles 001–005).
The first challenge is repeated lifting of the same container (
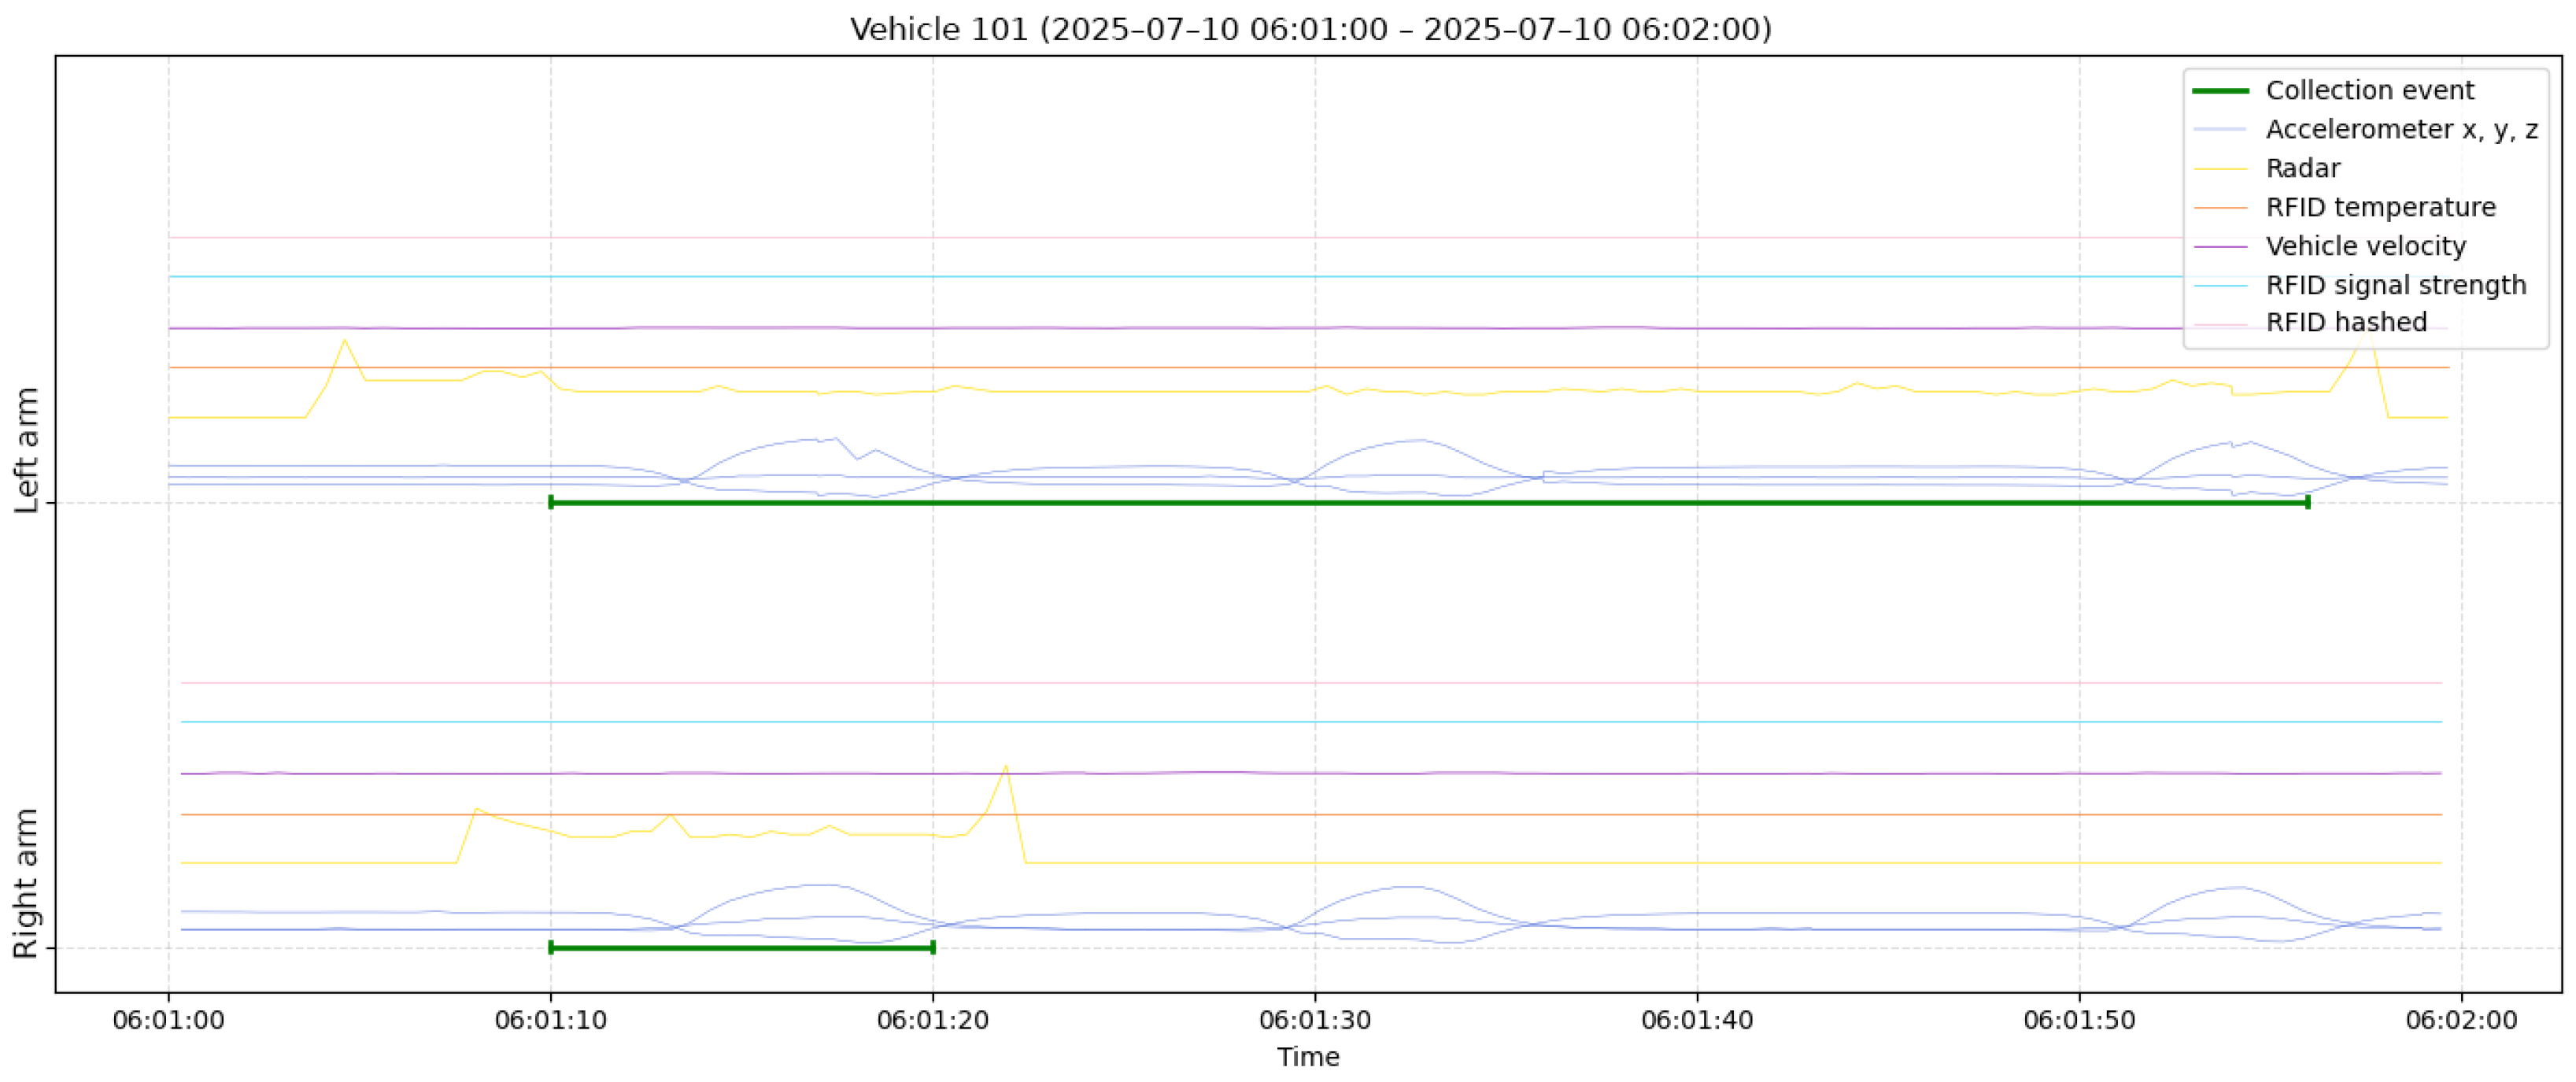
Figure 10). This situation occurs when a bin is emptied, placed back on the ground, but still contains residual waste. The operator then immediately reattaches the bin and lifts it again, sometimes several times in succession. Without RFID-based identity tracking, the automated annotation process cannot recognize that consecutive lifts belong to the same container and therefore records them as separate collection events, resulting in overestimation of the number of collections. Even manual verification of sensor data alone cannot reliably distinguish repeated lifting from legitimate consecutive collections of different containers. However, manual annotation based on video recordings can identify these situations and merge repeated lifts into a single event (from first attachment to final placement).
The second challenge arises when both lifting arms move synchronously. In such cases, the automated annotation cannot reliably distinguish between a large container requiring both arms, two small containers lifted simultaneously, or a single small container on a coupled lifting mechanism. As detailed in
Section 4.3, the automated annotation defaults to labeling these ambiguous cases as two small containers lifted simultaneously, which represents an upper bound on the number of individual collections.
For AI model training, these non-RFID annotation characteristics have specific implications. Models trained on the automated annotations without RFID will learn two systematic behaviors: first, to count repeated lifts as separate events rather than merging them; and second, to default to the upper-bound interpretation (two small containers) when both arms move synchronously. While this leads to reduced precision on non-RFID events (F1 = 0.8690 compared to F1 = 0.9891 for events with RFID, see
Table 5), these annotations still provide valuable training signal for the fundamental task of detecting collection events from sensor patterns. Deployed models trained primarily on this data may therefore exhibit similar overcounting behavior in non-RFID scenarios unless supplemented with sufficient RFID-labeled examples.
5.2.3. Missing RFID Tags
If RFID technology were completely reliable, each waste collection event could be identified solely based on the RFID signal, rendering the remaining sensor data unnecessary. In practice, however, RFID tags have several limitations. Besides the RFID cross-talks, RFID tags can be damaged or entirely missing. In such cases, waste collection events must be identified using other available sensor data.
5.2.4. Operational Gaps
Another limitation concerns the temporal coverage of the data. For each vehicle, the dataset contains sensor readings covering the entire operating day. However, within a given day, there are often time gaps during which no measurements are available from the IoT sensor units. These gaps may result from communication outages, device restarts, or periods when the vehicle was idle (e.g., during breaks). As a consequence, downstream analyses must account for the fact that the data stream is not always continuous and that missing intervals do not necessarily indicate sensor failure, but can also reflect operational pauses.
5.3. IoT Sensor Unit Synchronization
A further challenge arises from the fact that each vehicle is equipped with two independent IoT sensor units, one per lifting arm, which operate and transmit data separately. In practice, waste collection is typically analyzed at the level of the entire vehicle, since some containers (e.g., large 1100 L bins) require both arms to operate simultaneously. Because the two units are not hardware-synchronized, their data streams may contain different numbers of messages or misaligned timestamps. This can lead to situations in which one unit provides a complete sequence of readings, while the other shows missing or delayed samples. Algorithms must therefore account for these discrepancies and carefully merge information from both units when reconstructing vehicle-level events.
6. Conclusions
This work presents a comprehensive multimodal dataset of waste collection events captured by IoT sensor units installed on waste collection vehicles. The dataset comprises measurements from eight vehicles operating across different routes, with five vehicles (001–005) covering 5 collection days each and three vehicles (101–103) covering 1–4 days each. In total, the dataset contains 12,391 collection events, capturing real-world operational conditions with diverse container sizes (120 L to 1100 L) and including both RFID-equipped and non-RFID bins.
The dataset provides two forms of annotation. Automated annotations were generated by a rule-based algorithm combining accelerometer, radar, and RFID data, then manually cleaned through visual inspection of sensor signals (without video verification), offering large-scale coverage with demonstrated reliability. Manual annotations, derived from synchronized video recordings, provide reliable ground truth suitable for model evaluation. Comparative analysis demonstrates that automated annotations achieve very high agreement with manual ground truth for events with RFID tags (F1 score of 0.9891). However, agreement decreases considerably for events without RFID tags available (F1 score of 0.8690), highlighting the challenges of RFID-free detection.
The dataset supports multiple research and practical applications. It can be used to train and evaluate artificial intelligence models for automated waste collection event detection from multimodal IoT data, develop sensor fusion methods that are more robust than RFID-only approaches, and conduct research in anomaly detection and explainable AI. Statistical analyses of the dataset characterize the temporal patterns of waste collection operations, including event durations, time gaps between consecutive events, and sensor sampling intervals. These analyses provide practical insights for designing detection algorithms, selecting appropriate parameters for time-series analysis.
However, several limitations inherent to real-world data collection must be acknowledged. RFID cross-talk can lead to incorrect tag associations when multiple containers are positioned close together. Repeated lifting of partially emptied bins may result in multiple detected events for a single actual collection. Missing or damaged RFID tags create gaps in identification data, necessitating detection methods that can operate without RFID information. Operational gaps due to communication outages or device restarts result in incomplete temporal coverage. Finally, the use of two independent, unsynchronized IoT sensor units per vehicle introduces challenges in merging data streams for vehicle-level event reconstruction. These limitations represent realistic challenges that AI methods for waste collection monitoring must address.
Author Contributions
Conceptualization, P.T.; methodology, P.T. and A.M.; software, Ľ.K. and A.M.; validation, A.M., P.T. and R.H.; formal analysis, P.T. and A.M.; investigation, A.M. and R.H.; resources, K.D.; data curation, A.M., R.H. and K.D.; writing—original draft preparation, A.M. and P.T.; writing—review and editing, P.T. and A.M.; visualization, A.M.; supervision, P.T.; project administration, P.T.; funding acquisition, P.T. All authors have read and agreed to the published version of the manuscript.
Funding
This research was funded by the EU NextGenerationEU through the Recovery and Resilience Plan for Slovakia under the project No. 09I05-03-V02-00029-AI methods for IoT data-driven waste container collection.
Data Availability Statement
The dataset is publicly available at [
https://github.com/AI4WASTE/Dataset] under a Creative Commons Attribution 4.0 International (CC BY 4.0) license (accessed on 2 December 2025).
Acknowledgments
The authors would like to thank the waste collection operators and municipal staff who participated in the data collection process. We also wish to thank Matej Šiškovič for organizational support.
Conflicts of Interest
Author Karol Decsi was employed by the company MIM, s.r.o. The remaining authors declare that this research was conducted in the absence of any commercial or financial relationships that could be construed as potential conflicts of interest.
Abbreviations
The following abbreviations are used in this manuscript:
| AI | Artificial Intelligence |
| CE | Collection Event |
| FN | False Negative |
| FP | False Positive |
| GPS | Global Positioning System |
| GSM | Global System for Mobile Communications |
| IoT | Internet of Things |
| PAYT | Pay-As-You-Throw |
| RFID | Radio Frequency Identification |
| TP | True Positive |
References
- European Parliament and Council of the European Union. Directive 2008/98/EC of the European Parliament and of the Council of 19 November 2008 on Waste and Repealing Certain Directives (Waste Framework Directive). Official Journal of the European Union, 2008. Available online: https://eur-lex.europa.eu/eli/dir/2008/98/oj/eng (accessed on 8 November 2025).
- European Commission. Communication from the Commission to the European Parliament, the Council, the European Economic and Social Committee and the Committee of the Regions: A New Circular Economy Action Plan—For a Cleaner and More Competitive Europe. COM(2020) 98 Final, Brussels, 2020. Available online: https://eur-lex.europa.eu/legal-content/EN/TXT/?uri=celex:52020DC0098 (accessed on 8 November 2025).
- Skumatz, L.A. Pay as You Throw in the US: Implementation, Impacts, and Experience. Waste Manag. 2008, 28, 2778–2785. [Google Scholar] [CrossRef]
- US Environmental Protection Agency. Pay-As-You-Throw. Available online: https://archive.epa.gov/wastes/conserve/tools/payt/web/html/index.html (accessed on 8 November 2025).
- Acconeer AB. A111 Pulsed Coherent Radar Sensor—Datasheet. 2022. Available online: https://www.mouser.com/datasheet/2/1126/A111_datasheet-2933990.pdf (accessed on 9 October 2025).
- ThingMagic. M7E-PICO RFID Sensor Module Datasheet. 2021. Available online: https://mm.digikey.com/Volume0/opasdata/d220001/medias/docus/6240/M7E-PICO.pdf (accessed on 9 October 2025).
- Analog Devices. ADXL325—Small, Low Power, 3-Axis ±5 g Accelerometer Datasheet. 2020. Available online: https://www.analog.com/media/en/technical-documentation/data-sheets/ADXL325.pdf (accessed on 9 October 2025).
Figure 1.
Rear view of a vehicle with installed IoT sensor units.
Figure 1.
Rear view of a vehicle with installed IoT sensor units.
Figure 2.
Visualization of sensor data.
Figure 2.
Visualization of sensor data.
Figure 3.
Application used to create video based manual annotations for collection events.
Figure 3.
Application used to create video based manual annotations for collection events.
Figure 4.
Histogram of time gaps between consecutive collection events in the video-validated dataset (vehicles 101–103).
Figure 4.
Histogram of time gaps between consecutive collection events in the video-validated dataset (vehicles 101–103).
Figure 5.
Histogram of time gaps between consecutive collection events in the automated dataset (vehicles 001–005).
Figure 5.
Histogram of time gaps between consecutive collection events in the automated dataset (vehicles 001–005).
Figure 6.
Duration histogram of collection events in the video-validated dataset (vehicles 101–103).
Figure 6.
Duration histogram of collection events in the video-validated dataset (vehicles 101–103).
Figure 7.
Duration histogram of collection events in the automated dataset (vehicles 001–005).
Figure 7.
Duration histogram of collection events in the automated dataset (vehicles 001–005).
Figure 8.
Histogram of time gaps between sensor data messages using logarithmic scale for all vehicles.
Figure 8.
Histogram of time gaps between sensor data messages using logarithmic scale for all vehicles.
Figure 9.
RFID cross-talk example: The RFID tag X6PDEZ001038 (purple) is correctly detected on the left arm during its collection event, but is then falsely detected multiple times on the right arm. The vertical RFID tag represents the RFID value from a sensor data message, for clarity, it is displayed only when the value changes. Its color is randomly hashed based on the tag value so that tags with the same value share the same color. The horizontal text below each collection event indicates the RFID tag paired with that event. The bold green line represents the collection event for the big container, and the thin line represents the collection event for the small container.
Figure 9.
RFID cross-talk example: The RFID tag X6PDEZ001038 (purple) is correctly detected on the left arm during its collection event, but is then falsely detected multiple times on the right arm. The vertical RFID tag represents the RFID value from a sensor data message, for clarity, it is displayed only when the value changes. Its color is randomly hashed based on the tag value so that tags with the same value share the same color. The horizontal text below each collection event indicates the RFID tag paired with that event. The bold green line represents the collection event for the big container, and the thin line represents the collection event for the small container.
Figure 10.
Example of repeated lifting of a small container on the left arm. Although the arm moved up and down several times (as seen in the accelerometer data), it represents a single collection event. In this case, it could be identified as one event based on the radar data, since the operator did not place the bin back on the ground. However, based on our experience, radar data are not always reliable for this distinction.
Figure 10.
Example of repeated lifting of a small container on the left arm. Although the arm moved up and down several times (as seen in the accelerometer data), it represents a single collection event. In this case, it could be identified as one event based on the radar data, since the operator did not place the bin back on the ground. However, based on our experience, radar data are not always reliable for this distinction.
Table 1.
Dataset overview by vehicle. CE: collection events at sensor level (arm activity). Small/Big: small and big containers. “All”: total count. “No RFID”: subset with no RFID tag detected. Data count: sensor data messages. The “both” row aggregates data across arms.
Table 1.
Dataset overview by vehicle. CE: collection events at sensor level (arm activity). Small/Big: small and big containers. “All”: total count. “No RFID”: subset with no RFID tag detected. Data count: sensor data messages. The “both” row aggregates data across arms.
| Vehicle | Car Arm | CE All | CE No RFID | Small All | Small No RFID | Big All | Big No RFID | Data Count |
|---|
| 101 | L | 775 | 762 | 705 | 698 | 70 | 64 | 218,489 |
| (days: 4) | R | 859 | 839 | 789 | 775 | 70 | 64 | 218,407 |
| | both | 1564 | 1537 | 1494 | 1473 | 70 | 64 | 436,896 |
| 102 | L | 237 | 55 | 77 | 33 | 160 | 22 | 50,553 |
| (days: 1) | R | 270 | 24 | 110 | 2 | 160 | 22 | 55,924 |
| | both | 347 | 57 | 187 | 35 | 160 | 22 | 106,477 |
| 103 | L | 926 | 8 | 64 | 0 | 862 | 8 | 151,085 |
| (days: 3) | R | 957 | 9 | 95 | 1 | 862 | 8 | 148,912 |
| | both | 1021 | 9 | 159 | 1 | 862 | 8 | 299,997 |
| 001 | L | 1454 | 145 | 1408 | 145 | 46 | 0 | 250,018 |
| (days: 5) | R | 1129 | 179 | 1083 | 179 | 46 | 0 | 198,891 |
| | both | 2537 | 324 | 2491 | 324 | 46 | 0 | 448,909 |
| 002 | L | 1152 | 106 | 439 | 106 | 713 | 0 | 242,802 |
| (days: 5) | R | 1322 | 150 | 609 | 150 | 713 | 0 | 250,879 |
| | both | 1761 | 256 | 1048 | 256 | 713 | 0 | 493,681 |
| 003 | L | 1185 | 28 | 85 | 28 | 1100 | 0 | 240,260 |
| (days: 5) | R | 1210 | 28 | 110 | 28 | 1100 | 0 | 240,711 |
| | both | 1295 | 56 | 195 | 56 | 1100 | 0 | 480,971 |
| 004 | L | 1239 | 507 | 828 | 507 | 411 | 0 | 243,458 |
| (days: 5) | R | 1343 | 543 | 932 | 543 | 411 | 0 | 240,711 |
| | both | 2171 | 1050 | 1760 | 1050 | 411 | 0 | 484,169 |
| 005 | L | 1323 | 587 | 857 | 587 | 466 | 0 | 256,209 |
| (days: 5) | R | 838 | 51 | 372 | 51 | 466 | 0 | 257,726 |
| | both | 1695 | 638 | 1229 | 638 | 466 | 0 | 513,935 |
Table 2.
Summary statistics of time gaps (s) between collection events.
Table 2.
Summary statistics of time gaps (s) between collection events.
| Vehicle | Car Arm | Min | Max | Avg | Std |
|---|
| 101 | L | 1.0 | 785.0 | 68.42 | 100.49 |
| | R | 4.0 | 785.0 | 63.55 | 95.95 |
| 102 | L | 5.0 | 788.0 | 59.06 | 84.49 |
| | R | 4.0 | 324.0 | 47.48 | 53.42 |
| 103 | L | 3.0 | 559.0 | 46.46 | 68.16 |
| | R | 3.0 | 559.0 | 44.59 | 65.74 |
| 001 | L | 8.0 | 761.0 | 60.56 | 69.83 |
| | R | 8.0 | 786.0 | 66.72 | 71.83 |
| 002 | L | 9.0 | 747.0 | 65.25 | 85.49 |
| | R | 1.0 | 722.0 | 55.80 | 73.33 |
| 003 | L | 8.0 | 791.0 | 70.76 | 75.51 |
| | R | 5.0 | 791.0 | 69.74 | 75.90 |
| 004 | L | 1.0 | 609.0 | 61.43 | 65.70 |
| | R | 1.0 | 703.0 | 58.12 | 64.51 |
| 005 | L | 1.0 | 770.0 | 65.65 | 83.99 |
| | R | 1.0 | 777.0 | 77.74 | 103.42 |
| all | all | 1.0 | 791.0 | 62.05 | 78.12 |
Table 3.
Summary statistics of collection event durations (s) for each unit.
Table 3.
Summary statistics of collection event durations (s) for each unit.
| Vehicle | Car Arm | Min | Max | Avg | Std |
|---|
| 101 | L | 7.0 | 70.0 | 10.48 | 4.25 |
| | R | 7.0 | 153.0 | 10.77 | 6.67 |
| 102 | L | 8.0 | 49.0 | 14.88 | 7.49 |
| | R | 7.0 | 75.0 | 14.31 | 8.25 |
| 103 | L | 7.0 | 44.0 | 10.76 | 3.86 |
| | R | 7.0 | 44.0 | 10.70 | 3.66 |
| 001 | L | 3.0 | 82.0 | 8.83 | 8.22 |
| | R | 3.0 | 102.0 | 8.57 | 7.90 |
| 002 | L | 3.0 | 57.0 | 8.62 | 5.94 |
| | R | 1.0 | 57.0 | 8.47 | 5.76 |
| 003 | L | 1.0 | 64.0 | 10.74 | 7.49 |
| | R | 3.0 | 64.0 | 10.54 | 7.34 |
| 004 | L | 1.0 | 61.0 | 8.60 | 5.71 |
| | R | 1.0 | 68.0 | 9.20 | 5.60 |
| 005 | L | 1.0 | 75.0 | 5.99 | 4.63 |
| | R | 3.0 | 33.0 | 6.85 | 4.35 |
| all | all | 1.0 | 153.0 | 9.29 | 6.43 |
Table 4.
Summary statistics of time gaps between consecutive SensorData messages.
Table 4.
Summary statistics of time gaps between consecutive SensorData messages.
| Vehicle | Car Arm | Min | Max | Avg | Std | 0 s Gap Count | Count of Gaps > 0.75 s |
|---|
| 101 | L | 0.00 | 1.53 | 0.51 | 0.13 | 0 | 6918 |
| | R | 0.00 | 1.56 | 0.51 | 0.13 | 0 | 6952 |
| 102 | L | 0.51 | 3.00 | 0.57 | 0.16 | 0 | 5369 |
| | R | 0.00 | 3.01 | 0.52 | 0.04 | 82 | 43 |
| 103 | L | 0.51 | 3.14 | 0.52 | 0.03 | 0 | 31 |
| | R | 0.51 | 4.30 | 0.52 | 0.10 | 0 | 894 |
| 001 | L | 0.00 | 3.00 | 0.53 | 0.10 | 41 | 8108 |
| | R | 0.51 | 2.02 | 0.53 | 0.10 | 0 | 7765 |
| 002 | L | 0.00 | 3.02 | 0.53 | 0.10 | 41 | 7674 |
| | R | 0.00 | 3.14 | 0.51 | 0.05 | 943 | 255 |
| 003 | L | 0.00 | 3.15 | 0.52 | 0.05 | 574 | 197 |
| | R | 0.00 | 2.03 | 0.52 | 0.01 | 41 | 47 |
| 004 | L | 0.00 | 3.14 | 0.52 | 0.04 | 410 | 175 |
| | R | 0.00 | 3.14 | 0.52 | 0.07 | 533 | 3833 |
| 005 | L | 0.00 | 3.15 | 0.51 | 0.05 | 656 | 178 |
| | R | 0.51 | 2.06 | 0.52 | 0.04 | 0 | 315 |
| All | All | 0.00 | 4.30 | 0.52 | 0.08 | 3321 | 48,754 |
Table 5.
Quality of automated annotations compared to manual ground truth.
Table 5.
Quality of automated annotations compared to manual ground truth.
| Dataset Portion | TP | FP | FN | Precision | Recall | F1 |
|---|
| Events with RFID | 1313 | 13 | 16 | 0.9902 | 0.9880 | 0.9891 |
| Events without RFID | 1423 | 249 | 180 | 0.8511 | 0.8877 | 0.8690 |
| Disclaimer/Publisher’s Note: The statements, opinions and data contained in all publications are solely those of the individual author(s) and contributor(s) and not of MDPI and/or the editor(s). MDPI and/or the editor(s) disclaim responsibility for any injury to people or property resulting from any ideas, methods, instructions or products referred to in the content. |