1. Summary
Indoor environmental comfort is a key factor influencing occupants’ well-being, cognitive performance, and productivity in educational and working environments [
1,
2]. In university campuses, where classrooms and laboratories are intensively used and host heterogeneous populations, understanding and predicting comfort conditions is particularly challenging due to varying occupancy patterns, pedagogical activities, and individual preferences. As campuses increasingly evolve toward the smart campus paradigm, data-driven approaches based on pervasive sensing and analytics have become central to supporting energy efficiency, environmental quality, and user-centered services [
3].
Within smart campus research, datasets play a foundational role by enabling reproducible experimentation, benchmarking of algorithms, and cross-campus comparisons. Existing datasets largely focus on two complementary but often separate dimensions. The first concerns energy and environmental monitoring, where datasets capture fine-grained measurements of electrical consumption and indoor environmental parameters to support energy management and sustainability. Representative examples include long-term electrical monitoring in university laboratories [
4], multimodal IoT datasets combining energy, environmental, and occupancy data for smart campus transformation initiatives [
5], large-scale campus-wide electricity metering curated through semantic schemas [
6], and air quality-focused datasets highlighting the impact of CO
2 on health and academic performance [
7]. Recent work has also evaluated IoT sensors and standardized protocols (e.g., KNX) for continuous monitoring of indoor conditions in educational facilities, demonstrating the feasibility of scalable data-driven environments [
8], and investigated the spatial distribution of CO
2 within university classrooms to inform optimal sensor placement and Indoor Air Quality (IAQ) assessment strategies [
9]. In parallel, energy consumption indicators have been developed for residential and non-residential building benchmarking [
10], yet these approaches typically focus on aggregate energy metrics rather than fine-grained IEQ or occupant comfort perception. These resources provide rich insights into infrastructure behavior but typically lack direct links to occupants’ subjective experience.
Beyond campus-specific resources, broader building datasets have addressed indoor monitoring in office and residential contexts. The Building Data Genome Project 2 [
11] offers large-scale electricity meter data from over 1600 non-residential buildings worldwide, supporting energy benchmarking and anomaly detection, but does not include occupant comfort perception or fine-grained Indoor Environmental Quality (IEQ) measurements beyond energy proxies. Similarly, the ROBOD dataset [
12] provides multi-zone office building sensor data (temperature, CO
2, occupancy) suitable for control algorithm development, but subjective comfort labels are absent.
A smaller but growing number of datasets explicitly integrate environmental sensing with subjective feedback. The ASHRAE Global Thermal Comfort Database II [
13] includes approximately 81,000 paired objective indoor climatic observations and “right-here-right-now” subjective thermal comfort evaluations collected in multiple field studies across office and commercial buildings worldwide. While it provides a large global perspective on comfort preferences, the data are aggregated from independent studies rather than continuous monitoring during regular operational activities in the same spaces. The Scales Project [
14] dataset provides longitudinal environmental monitoring (temperature, humidity, CO
2, light) and occupant feedback for 37 office buildings, yet focuses on aggregated monthly satisfaction surveys rather than event-level perception during specific occupancy instances. Then, datasets such as LifeSnaps integrate ecological momentary assessments with multi-modal sensor data collected unobtrusively in everyday environments, enabling longitudinal analysis of subjective states in relation to contextual and behavioral factors [
15]. While not specifically focused on indoor environmental comfort, these datasets demonstrate the value of combining continuous sensing with repeated in-situ self-reports, an approach that remains relatively underexplored in educational buildings.
A second line of work addresses space occupation and teaching, where datasets are designed to measure classroom usage, attendance patterns, and space efficiency. Studies such as [
16,
17] demonstrate how IoT-based occupancy sensing and predictive modeling can reduce classroom underutilization and optimize room allocation. Complementary work on smart meeting rooms has shown how occupancy profiles can be modeled and predicted to improve space utilization and energy efficiency [
18]. While these datasets effectively capture how spaces are used, they generally do not account for environmental quality or perceived comfort during teaching activities, limiting their applicability for occupant-centric comfort modeling.
In this context, the dataset presented in this article complements and bridges these two research directions by explicitly integrating environmental monitoring, occupancy-related information, and subjective comfort perception. Collected at the Cesena Campus of the University of Bologna, the dataset combines continuous measurements of temperature, humidity, noise, air pressure, and CO2 concentration with repeated comfort perception reports gathered from students during real lectures, as well as a one-time comfort definition phase capturing individual relevance weights. Unlike laboratory-controlled studies, the dataset reflects realistic academic conditions, including daily fluctuations in attendance, teaching styles, and environmental dynamics.
A distinctive feature of the dataset is the joint availability of objective measurements and subjective perceptions, enabling analyses that go beyond average comfort indices and supporting personalized and occupant-aware modeling approaches [
19]. Moreover, the inclusion of control measurements collected with additional sensors placed near occupants allows researchers to investigate the impact of sensor placement and spatial variability, a known challenge in indoor environmental monitoring [
20].
With respect to existing datasets that combine multi-location sensing and subjective feedback, this work offers three novel and complementary contributions. First, the dataset targets a real educational setting (classrooms and laboratories) and captures repeated in-lecture comfort perception reports aligned with continuous IEQ monitoring, enabling event-level analyses under authentic teaching conditions rather than isolated campaigns or aggregated satisfaction surveys. Second, it includes both (i) ceiling-mounted longitudinal monitoring and (ii) near-occupant control measurements collected during lectures, supporting practical studies on sensor representativeness and sensor-placement effects using the same sensing technology. Third, beyond perception labels, we provide a one-time comfort definition questionnaire that records how individuals weigh comfort dimensions, enabling research on personalization and inter-individual variability together with the released categorical encodings.
Overall, this dataset contributes to the smart campus literature by providing a holistic view of classrooms and laboratories as socio-technical systems, where energy use, environmental quality, space utilization, and human perception interact. It is intended to support research on comfort prediction, human-centered building analytics, and adaptive control strategies, while complementing existing datasets focused on energy systems and space occupation. By releasing this dataset openly, we aim to foster reproducibility and advance occupant-centric approaches for healthier, more sustainable, and more effective educational campuses.
2. Data Description
This section describes the structure and contents of the released dataset. The data are distributed as a collection of CSV files, complemented by a YAML file that documents the categorical encodings used in questionnaire-based variables. The dataset was collected in real laboratories and classrooms at the University of Bologna (Cesena campus) and is intended to support occupant-centric analyses and the development of machine learning models for indoor comfort prediction.
2.1. Dataset Structure
The dataset is organized into six main files, each corresponding to a specific data source or annotation layer:

2.2. Data Conventions
All timestamps are provided in UTC using ISO 8601 format, with a trailing Z suffix (e.g., 2025-09-15T07:00:05Z). The data sources have different typical acquisition patterns: (i) environmental measurements (1_room_measurements.csv and 2_control_measurements.csv) are recorded at approximately 5 min intervals; (ii) room occupancy (3_room_occupancy.csv) is recorded at approximately 20 min intervals and is generally available only during campus opening hours; (iii) questionnaire-based data (4_comfort_perception.csv and 5_comfort_definition.csv) are event-based, with typically one survey submission per student per lecture.
Missing data are mainly represented as temporal gaps (i.e., missing rows for a given room/sensor/time) due to sensor downtime, network issues, room closure periods, or the absence of a given data source in a specific room (e.g., occupancy is available only for Room 2.12 in this release). Owing to these factors and to heterogeneous acquisition patterns, users merging multiple sources should therefore define a temporal alignment strategy (e.g., resampling and aggregation to a common grid, and/or nearest-neighbor matching within a tolerance window) and explicitly account for missing data.
Measurement units follow the sensor specifications and are used consistently throughout the dataset.
Table 1 summarizes the measurement units and the observed value ranges (min/mean/max) over the full dataset.
2.3. Environmental Measurements
The files 1_room_measurements.csv and 2_control_measurements.csv share the same column schema and contain objective environmental data collected by the sensing infrastructure. Each record corresponds to a single sensor reading at a specific point in time and location. The common columns are:
timestamp: time at which the measurement was recorded.
sensorId: unique identifier of the sensing device.
room: identifier of the classroom or laboratory.
temperature: air temperature.
humidity: relative humidity.
noise: acoustic level proxy.
pressure: barometric pressure.
CO2: carbon dioxide concentration proxy.
The file 1_room_measurements.csv contains longitudinal measurements collected during standard classroom and laboratory operation using permanently installed ceiling-mounted sensors. The file 2_control_measurements.csv provides additional environmental traces collected during control and validation sessions. In these sessions, sensors were placed closer to occupants, which may result in systematic differences with respect to the ceiling-level measurements.
2.4. Room Occupancy Data
The file
3_room_occupancy.csv provides room-level occupancy data, reporting the estimated number of people present (
peopleCount) over time. In the current release, occupancy data are available only for Room 2.12, as the people-counting system has been installed and validated only in that room so far. The counting system and its deployment in educational environments are described in [
21].
Each record contains the following columns:
timestamp: time at which the occupancy estimate was recorded.
room: identifier of the classroom or laboratory.
peopleCount: estimated number of people present in the room at that time.
Occupancy values can be aligned with environmental measurements and comfort perception reports by time and room using an appropriate temporal join (e.g., nearest-neighbor matching or resampling to a common time grid). When performing analyses across multiple rooms, users should treat occupancy as missing for rooms other than Room 2.12 in this release. If specifically required, users could restrict occupancy-grounded analyses (e.g., CO2–occupancy relationships, crowding-related comfort effects) to Room 2.12, where peopleCount is available. Finally, if occupancy estimates are required for the other rooms, users may train and validate an occupancy estimation model using Room 2.12 as ground truth; any resulting values for the other rooms should be clearly reported as derived estimates rather than measured occupancy.
2.5. Comfort Perception Reports
The file 4_comfort_perception.csv contains subjective comfort reports provided by participants at specific times and in specific rooms. Each record represents a single comfort assessment and includes the following columns:
timestamp: time at which the response was submitted.
respondentId: anonymous identifier of the participant.
room: identifier of the classroom or laboratory.
comfortValue, comfortLabel: overall comfort evaluation (numeric code and corresponding label).
temperatureValue, temperatureLabel: perceived thermal sensation (code and label).
humidityValue, humidityLabel: perceived humidity sensation (code and label).
airQualityValue, airQualityLabel: perceived air quality (code and label).
noiseValue, noiseLabel: perceived noise level (code and label).
degreesValue, degreesLabel: perceived temperature interval (code and label).
between, and: textual fields used to compose the natural-language representation of the perceived temperature interval.
For the main comfort dimensions, both the encoded numeric value (*Value) and the corresponding human-readable label (*Label) are explicitly included to facilitate interpretability and reuse.
Because questionnaires are collected during scheduled lectures and participation is voluntary, the number of comfort perception reports is not uniformly distributed across rooms and courses, and some categorical labels may be under-represented. This class imbalance and uneven coverage should be explicitly considered when building predictive models.
Section 3.6 provides recommended reuse practices.
2.6. Comfort Definition and Relevance
The file 5_comfort_definition.csv captures how participants weigh different factors when forming their notion of indoor comfort. This questionnaire was administered once per respondent, at the beginning of the data collection process. The file includes the following columns:
timestamp: time at which the response was submitted.
respondentId: anonymous identifier of the participant.
temperatureRelevance, temperatureLabel: relevance of temperature (code and label).
humidityRelevance, humidityLabel: relevance of humidity (code and label).
airQualityRelevance, airQualityLabel: relevance of air quality (code and label).
otherParametersRaw: optional open-text description of additional comfort factors provided by the respondent.
otherParametersStandardized: optional standardized representation of the open-text factors.
It is worth noting that the respondentId field can be used to match records in this CSV file with the ones from 4_comfort_perception.csv, as this column uniquely identifies the same individual across both files.
2.7. Categorical Encodings
Categorical variables appearing in the questionnaire-based files are encoded numerically and documented in labels.yml. This file provides the mapping from each numeric code to its human-readable label and, where applicable, to an explicit numeric interval.
Two different encoding logics are used: (i) Ordinal Likert-type scales, where higher codes indicate a higher level of the measured construct (e.g., comfort or relevance); (ii) Signed deviation scales for perception of environmental factors, where zero represents a neutral/optimal condition and negative/positive codes represent deviations toward the two opposite extremes.
The dataset includes the following 1–5 ordinal scales:
For temperature and humidity, the encoding is symmetric around a neutral point: 0 corresponds to Optimal, negative values represent the “too low” side (e.g., −2 = Cold, −1 = Cool for temperature; −2 = Arid, −1 = Slightly arid for humidity), and positive values represent the “too high” side (e.g., 1 = Warm/Slightly humid, 2 = Hot/Humid). This design allows users to distinguish direction (low vs. high) and intensity (slight vs. extreme) of discomfort.
For airQuality and noise, only one direction represents worsening conditions. In particular, 0 represents Optimal, while increasing values represent increasingly negative perceptions: for airQuality, 1 = Acceptable and 2 = Poor; for noise, 1 = Slightly noisy and 2 = Loud. Unlike temperature/humidity, these variables do not include negative codes because the underlying concept is not naturally bidirectional (i.e., “too quiet” or “too clean” are not modeled as separate discomfort extremes in this survey).
The key degrees in labels.yml defines discrete temperature intervals used when participants specify comfort definitions based on measured conditions. Each bin provides a label and its numeric bounds (inclusive), with open-ended extremes ( 13 °C and 29 °C) and intermediate bins that cover contiguous ranges (e.g., 20–22 °C, 23–25 °C). When analyzing or merging data, these bins can be interpreted as categorical representations of the continuous temperature measurements.
3. Methods
This section describes the methodological framework adopted for data collection, integration, and documentation.
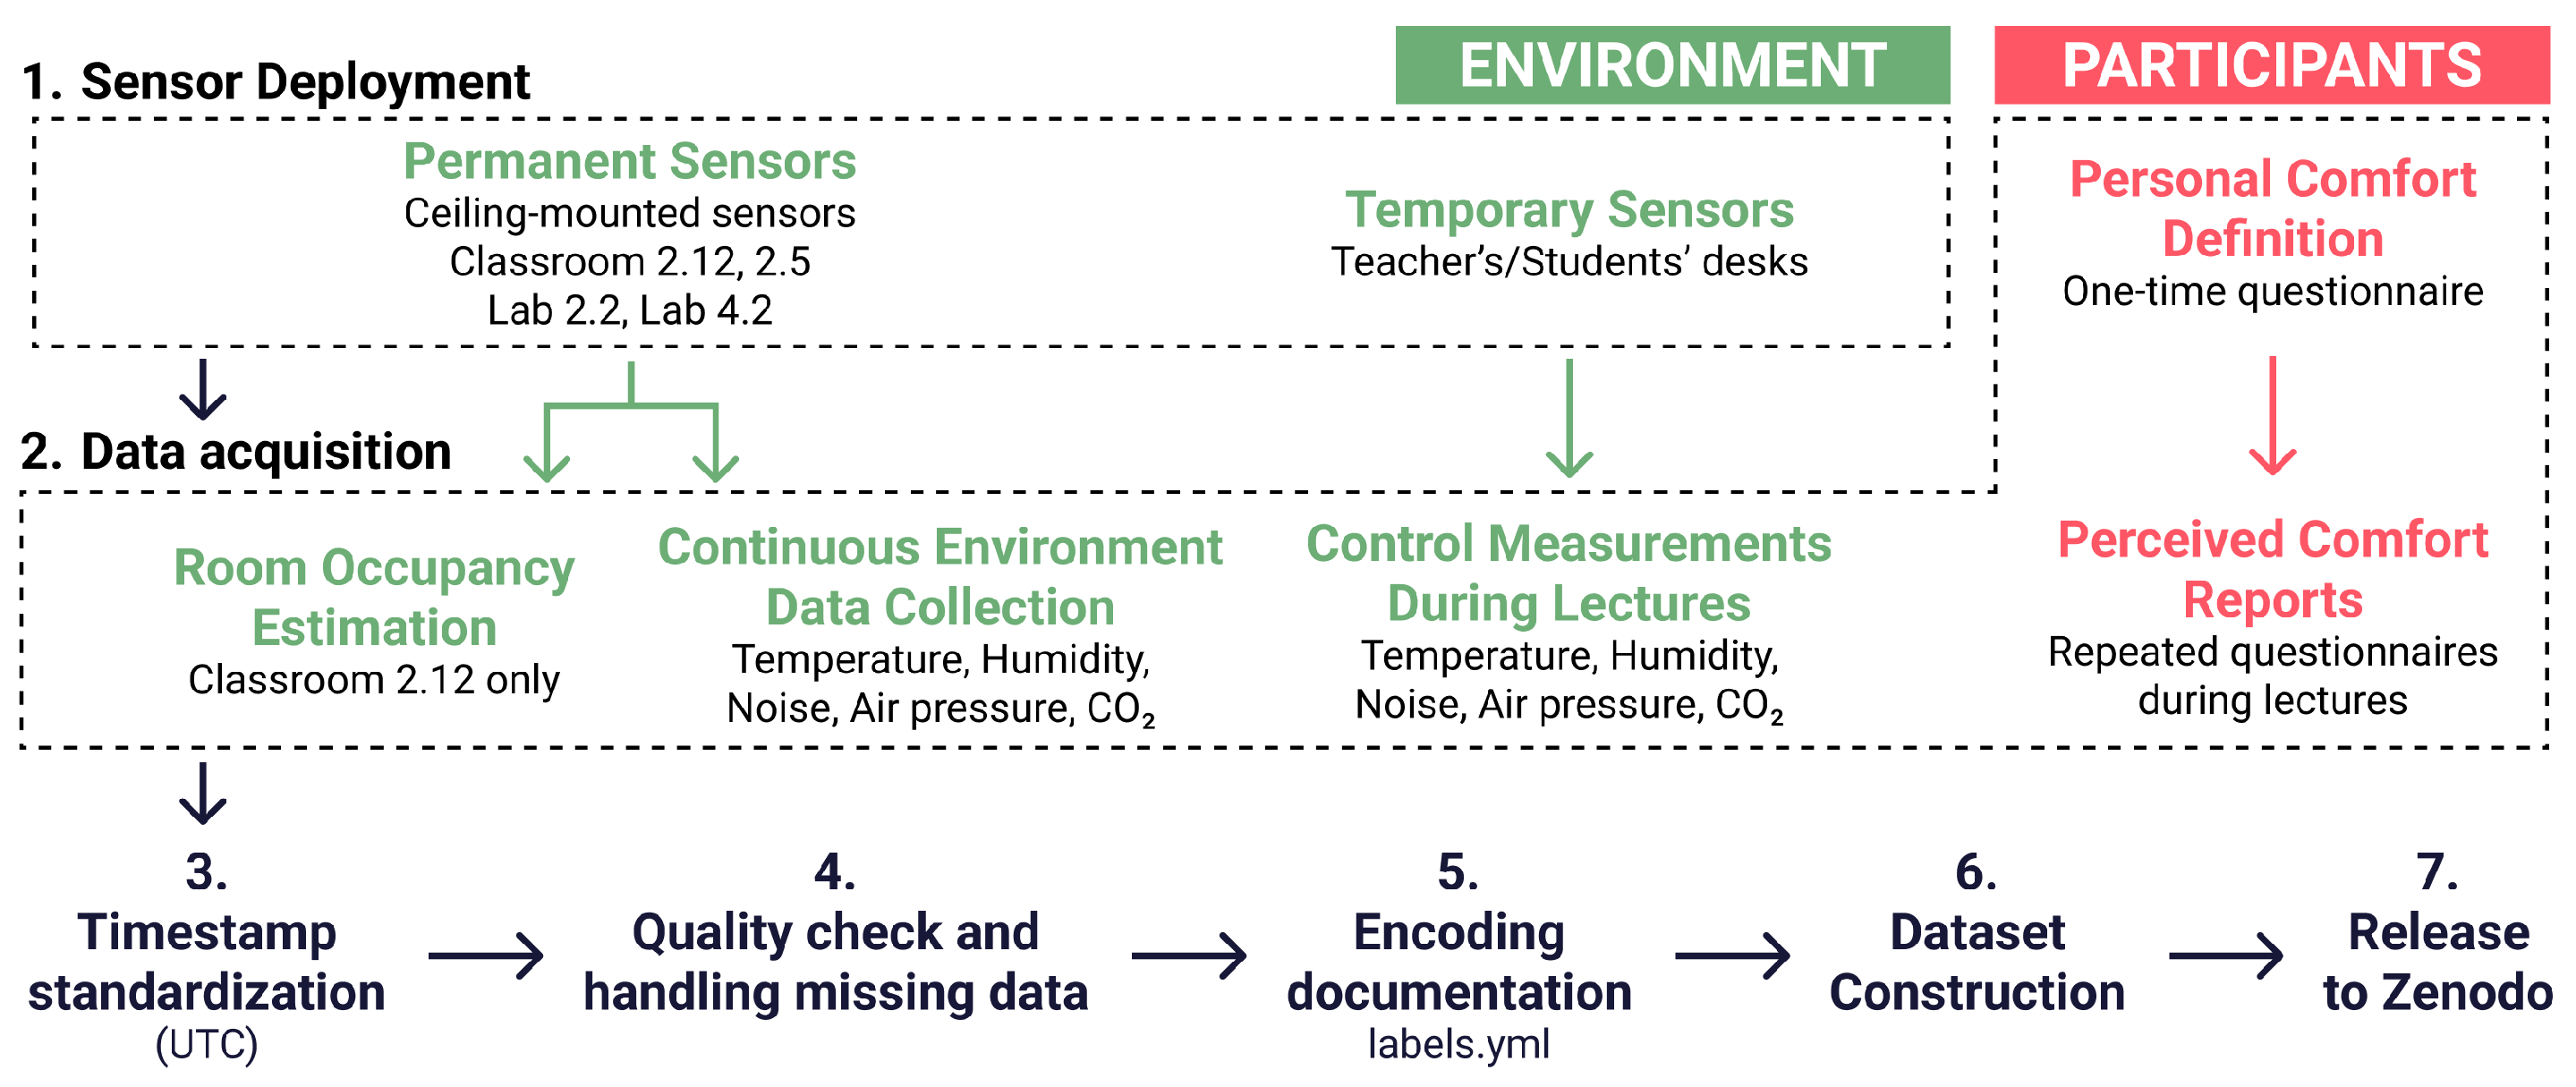
Figure 1 summarizes the main steps used to produce the released dataset, from sensor deployment and UTC timestamp standardization to quality checks, missing-data handling, and final packaging for Zenodo. The dataset was designed to capture indoor environmental conditions, occupancy dynamics, and occupants’ comfort perceptions in real academic settings, while ensuring minimal disruption to teaching activities and enabling reproducibility. To this end, continuous sensing infrastructure was combined with room-level occupancy estimates and repeated subjective feedback from students, and all data sources were timestamped in UTC and documented as separate streams that can be aligned during analysis into a unified dataset suitable for occupant-centric analysis and modeling.
3.1. Campus, Rooms, and Environmental Sensing
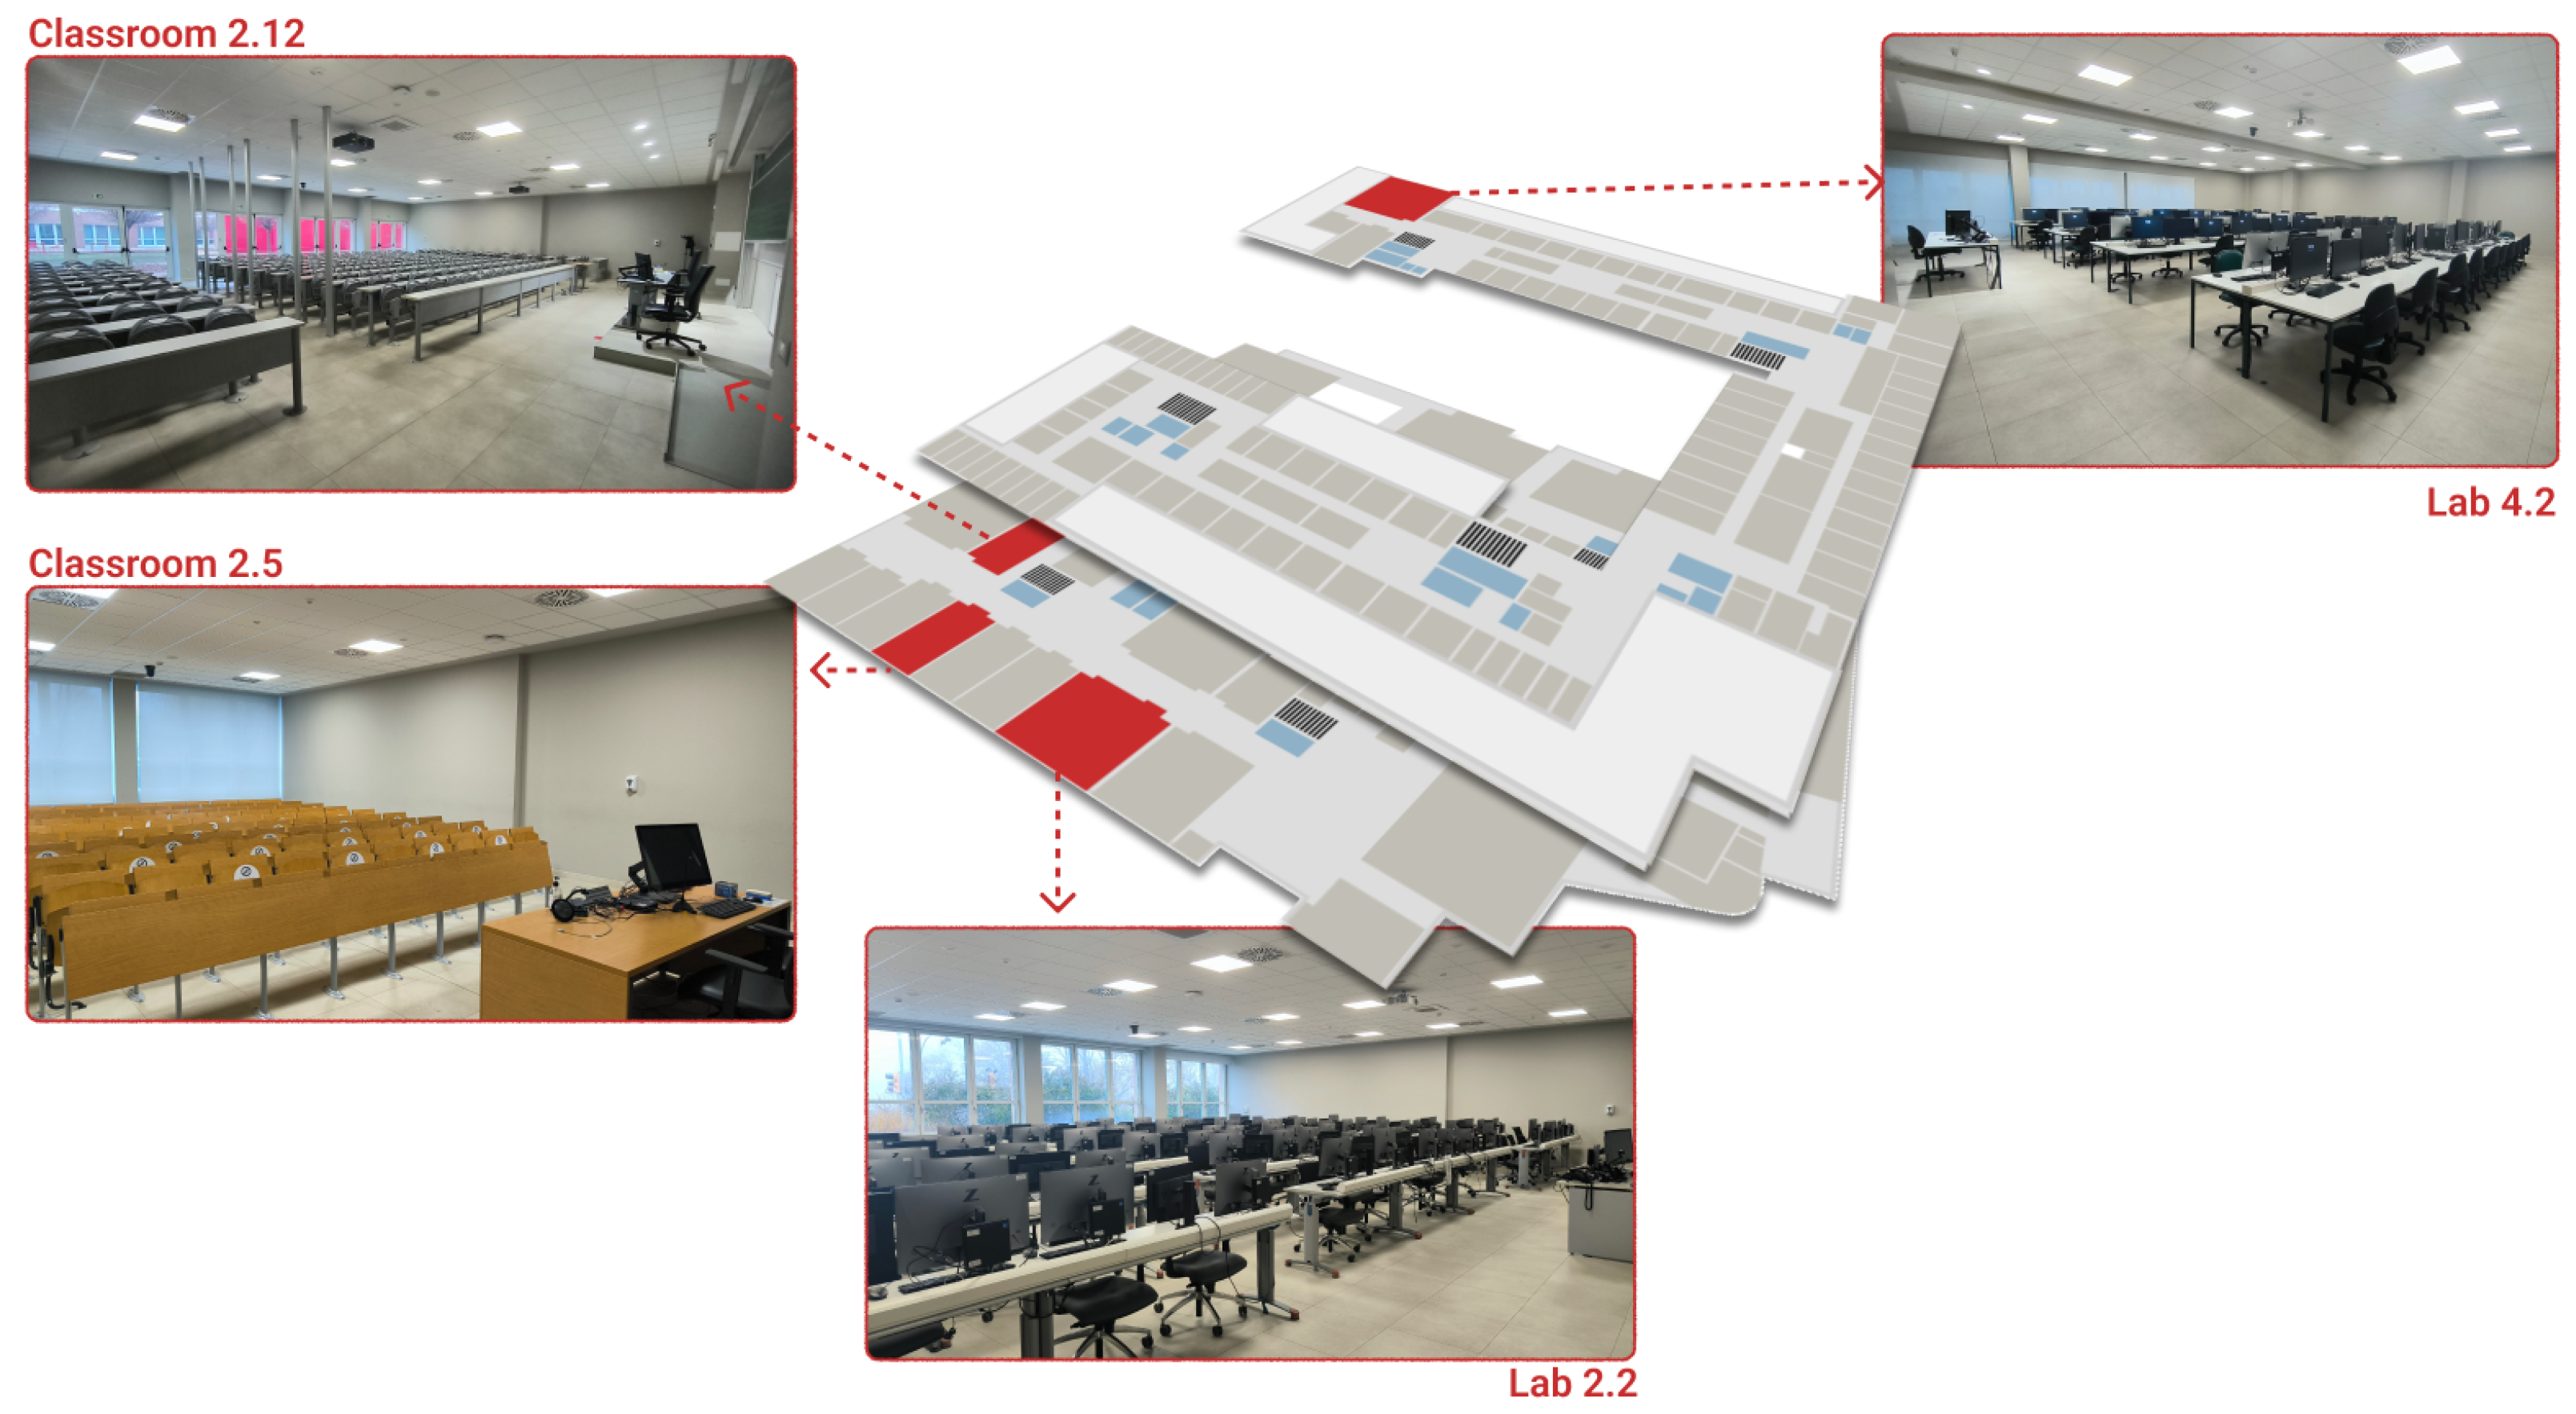
Data were collected at the Cesena Campus of the University of Bologna (Italy), within a real educational setting composed of both classrooms and computer laboratories. The monitoring period spans from 15 September 2025 to 19 December 2025. The monitored environments include four rooms located in the same building: Classroom 2.12, Classroom 2.5, Lab 2.2, and Lab 4.2. As illustrated in
Figure 2, these rooms differ in size, layout, usage patterns, and occupancy density, providing heterogeneous conditions for comfort analysis.
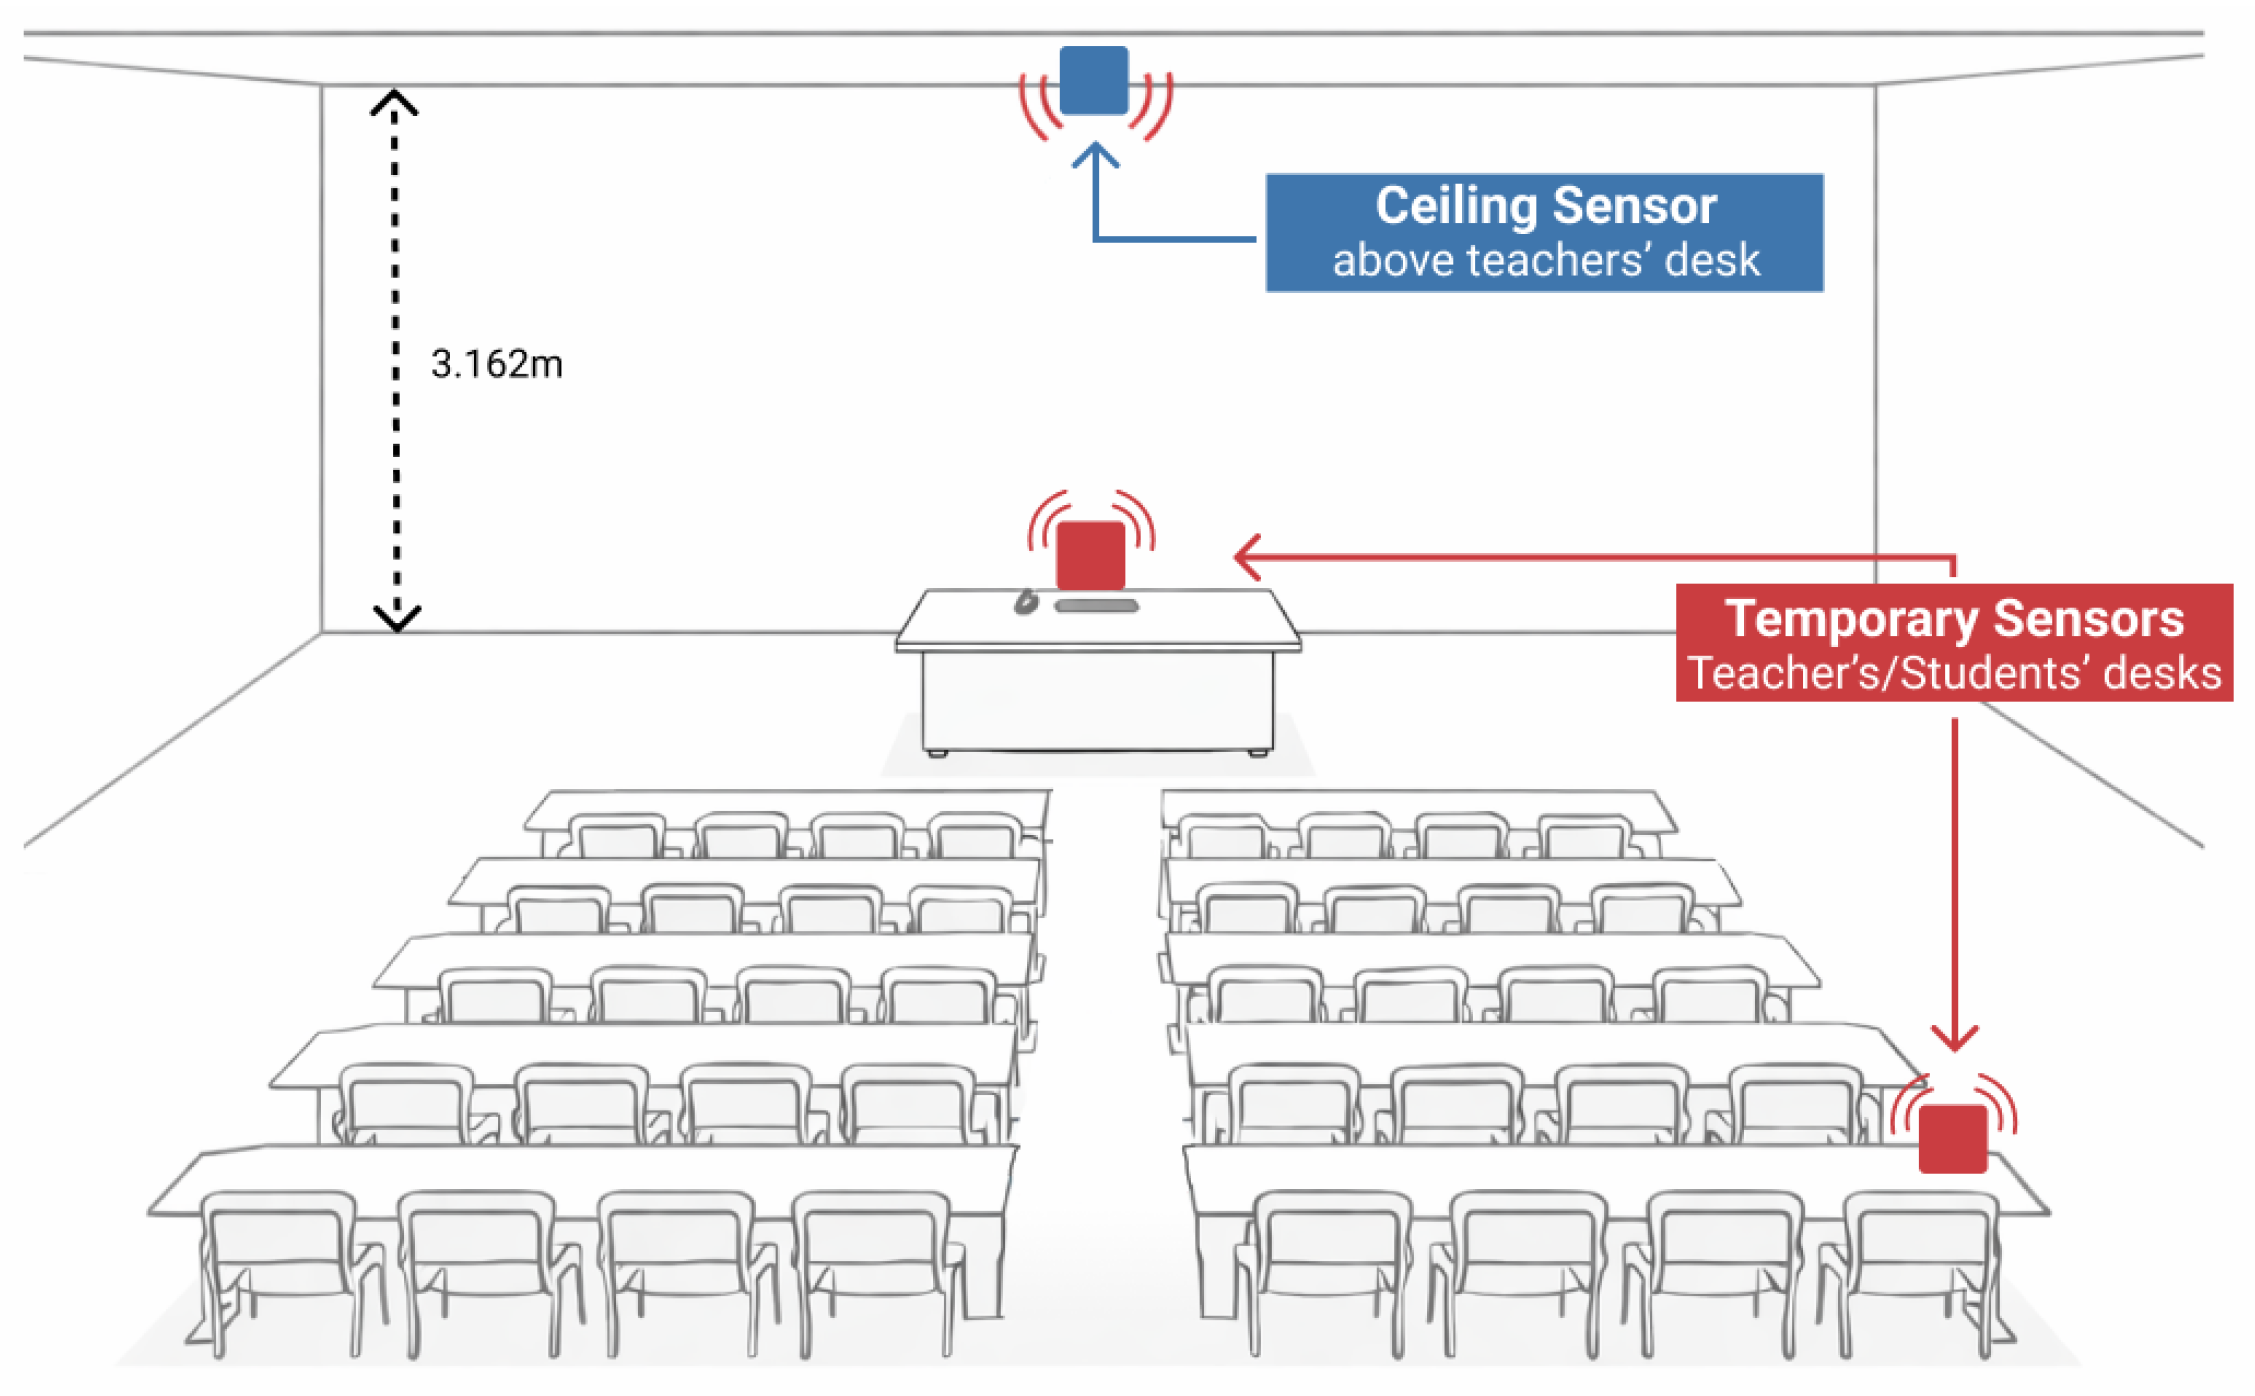
Figure 3 illustrates the spatial distribution of the monitoring system, uniformly adopted in each classroom and laboratory. In each room, one environmental sensor was permanently installed on the ceiling, that has a height of 3.162 m. The ceiling placement was chosen to ensure continuous and unobtrusive monitoring while minimizing interference from occupants, furniture, and localized sources of heat or noise. This permanent installation enabled long-term data acquisition during standard academic activities.
However, sensors height and location can introduce spatial bias with respect to the occupied zone (e.g., due to vertical stratification, plume effects, or local airflow patterns), particularly for variables influenced by occupancy such as CO
2 and temperature. In fact, sensor placement, height, and density are known to affect the representativeness of routine IAQ monitoring [
20].
To partially quantify and mitigate this bias, we collected control measurements during lectures using temporary sensors positioned closer to occupants: (i) on the teacher’s desk and/or (ii) within the students’ seating area) which can be used as a near-occupant reference for validation or sensitivity analyses against ceiling-level measurements. Temporary sensors were positioned at least 1 m away from occupants and other localized sources (e.g., direct exhalation/heat sources), in line with ASHRAE Standard 55 guidance for measurements representative of the occupied zone.
Environmental data were collected using the Netatmo Smart Indoor Air Quality Monitor (Netatmo, Boulogne-Billancourt, France), a commercial multi-sensor device capable of measuring temperature, relative humidity, noise level, air pressure, and carbon dioxide (CO
2) concentration. The technical details of the sensor are available at
https://www.netatmo.com/smart-indoor-air-quality-monitor (accessed on 15 December 2025). The sensors continuously recorded environmental parameters at regular time intervals, producing longitudinal measurements representative of the indoor conditions experienced by occupants during teaching activities. In terms of measurement uncertainty, we report the manufacturer-stated ranges as a reference for data reuse. For CO
2 (NDIR sensor; 0–5000 ppm), the stated accuracy is ±50 ppm in the 0–1000 ppm range and ±5% in the 1000–5000 ppm range; the device performs periodic self-calibration. For temperature (0–50 °C), the stated accuracy is ±0.3 °C, and for relative humidity (0–100%), the stated accuracy is ±3%. For noise (35–120 dB), Netatmo does not provide an official ±dB precision rating and the sensor should be interpreted as a general-purpose acoustic proxy (not a certified Class 1/2 sound level meter); values correspond to an average sound level over 5 min intervals. These measurements constitute the baseline room data used for subsequent analysis and modeling.
In parallel, room occupancy was estimated during the same monitoring period and released as an independent time series (3_room_occupancy.csv). In the current release, the occupancy signal is available only for Room 2.12, where the people-counting system was installed and validated. The occupancy signal provides an explicit representation of attendance variability in educational settings and is meant to be integrated with environmental and perceptual records during analysis.
3.2. Participants, Educational Context, and Comfort Data
The study involved students attending two degree programs at the University of Bologna, Cesena Campus: (i) the Web Technologies course of the Bachelor’s degree in Computer Science and Engineering, and (ii) the Web Applications and Services course of the Master’s degree in Computer Science and Engineering. Students participated on a voluntary basis during regular lectures, ensuring that both environmental and perceptual data reflect realistic classroom dynamics, including variations in attendance, activity levels, and teaching styles. Students completed the questionnaires using the web-based e-learning platform dedicated to each course.
The data collection process combined objective environmental measurements with subjective human feedback. At the beginning of the study, students were asked to define their personal notion of indoor comfort through a one-time questionnaire. This comfort definition phase aimed to capture the perceived relevance of different comfort dimensions, optionally enriched with open-text comments. During each lecture, students were then asked to report their comfort perception. These time-stamped comfort perception reports were collected repeatedly, enabling the analysis of how subjective comfort evolves over time and in response to changing environmental conditions.
The comfort perception questionnaire, while remaining study-specific rather than standardized, was designed following general principles for subjective environmental assessment as described in ISO 10551:2019 [
22]. The questionnaire was not formally derived from the standard, but several elements were kept consistent with it, including the use of subjective self-reports of perceived environmental conditions and comfort, ordinal scales, and bipolar wording for sensation (e.g., cold-hot, arid-humid).
3.3. Control Measurements and Dataset Construction
In addition to the permanently installed ceiling sensors, control measurements were collected during lectures using additional Netatmo sensors. These control sensors were temporarily placed either on the teacher’s desk or among the students’ desks. Sensors were installed vertically on the ceiling, that has a height of 3.162 m. The goal of these measurements was to capture localized environmental conditions closer to occupants, enabling comparison with ceiling-level data and supporting validation of the permanent sensing infrastructure.
A control session corresponds to the time interval in which the temporary sensor remained in a fixed position during a lecture; session start and end are defined by the first and last valid records of the temporary sensor in 2_control_measurements.csv. In practice, sessions typically last for the duration of a lecture, and repeated sessions across the semester enable test–retest comparisons under different occupancy and operating conditions.
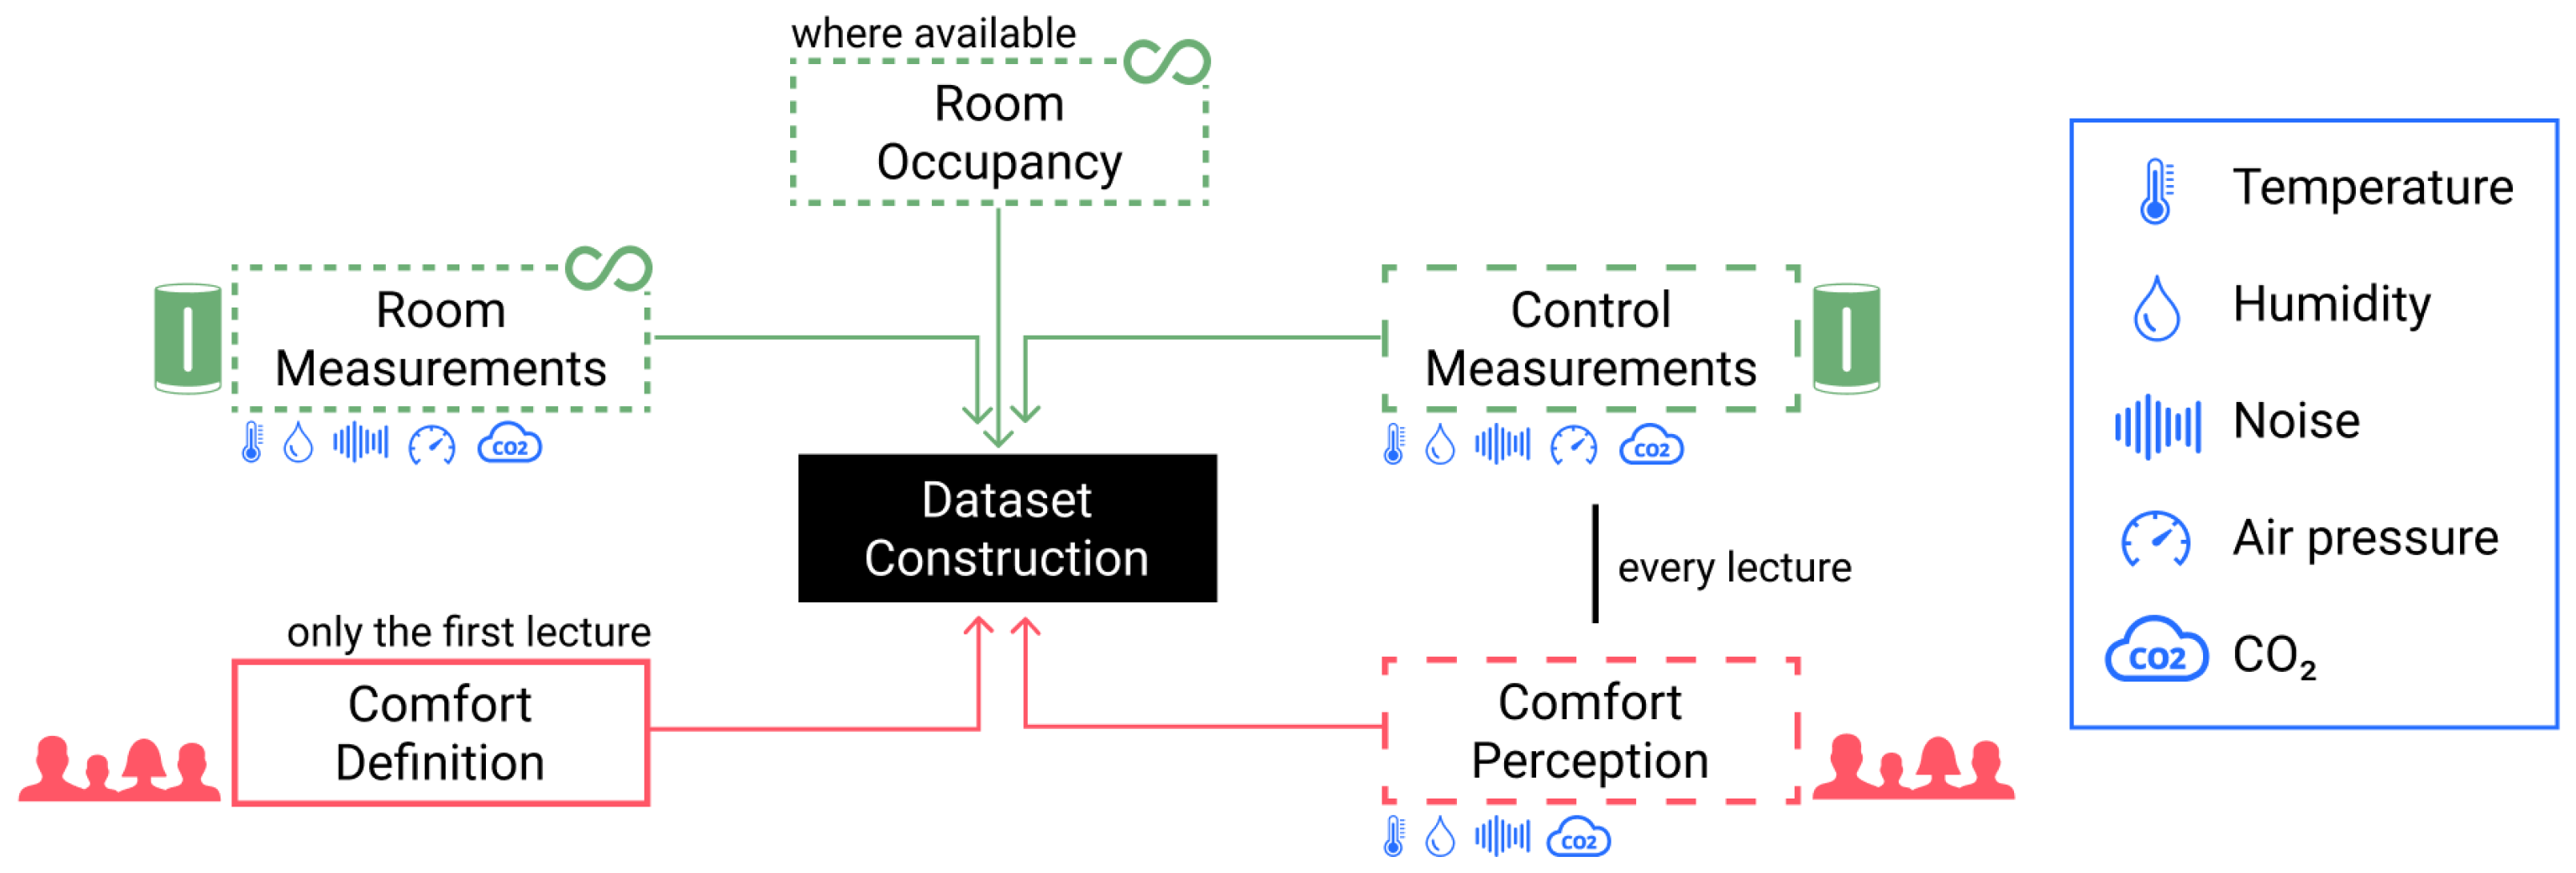
All data sources were synchronized in time and integrated into a unified dataset, as summarized in
Figure 4. Longitudinal room measurements from permanent sensors and control measurements collected during lectures were merged with the room-level occupancy signal, students’ one-time comfort definitions, and repeated comfort perception reports. This integration process resulted in a coherent dataset that serves as the basis for subsequent descriptive analyses and comfort prediction models.
When constructing analysis-ready tables from the released CSV files, we recommend aligning sources by room and UTC timestamp using a nearest-neighbour join with a symmetric tolerance window, while preserving the original streams in the released dataset. In particular, 1_room_measurements.csv (ceiling sensors) should be treated as the reference time axis because it is the most complete longitudinal stream. For any event-based record (e.g., a questionnaire submission in 4_comfort_perception.csv), associate it with the closest ceiling measurement within ±2.5 min; if no ceiling record falls within the tolerance, the environmental context should be marked as missing for that event. Occupancy measurements in 3_room_occupancy.csv (available only for Room 2.12) can be joined using the same strategy but with a larger tolerance window (e.g., ±10 min) consistent with the nominal ∼20 min sampling interval.
3.4. Validation and Data Quality Checks
This subsection provides descriptive validation to quantify internal consistency and the agreement between ceiling-mounted and near-occupant control measurements. Since 1_room_measurements.csv and 2_control_measurements.csv are recorded asynchronously (both at approximately 5 min intervals), comparisons require an explicit temporal alignment strategy.
Temporal alignment rule. For each room, control measurements are matched to the closest ceiling record using nearest-neighbor timestamp matching in UTC. A match is accepted only if the absolute time difference satisfies min (half of the nominal 5 min sampling interval); otherwise, the control record is treated as unmatched for the purpose of ceiling–control comparison.
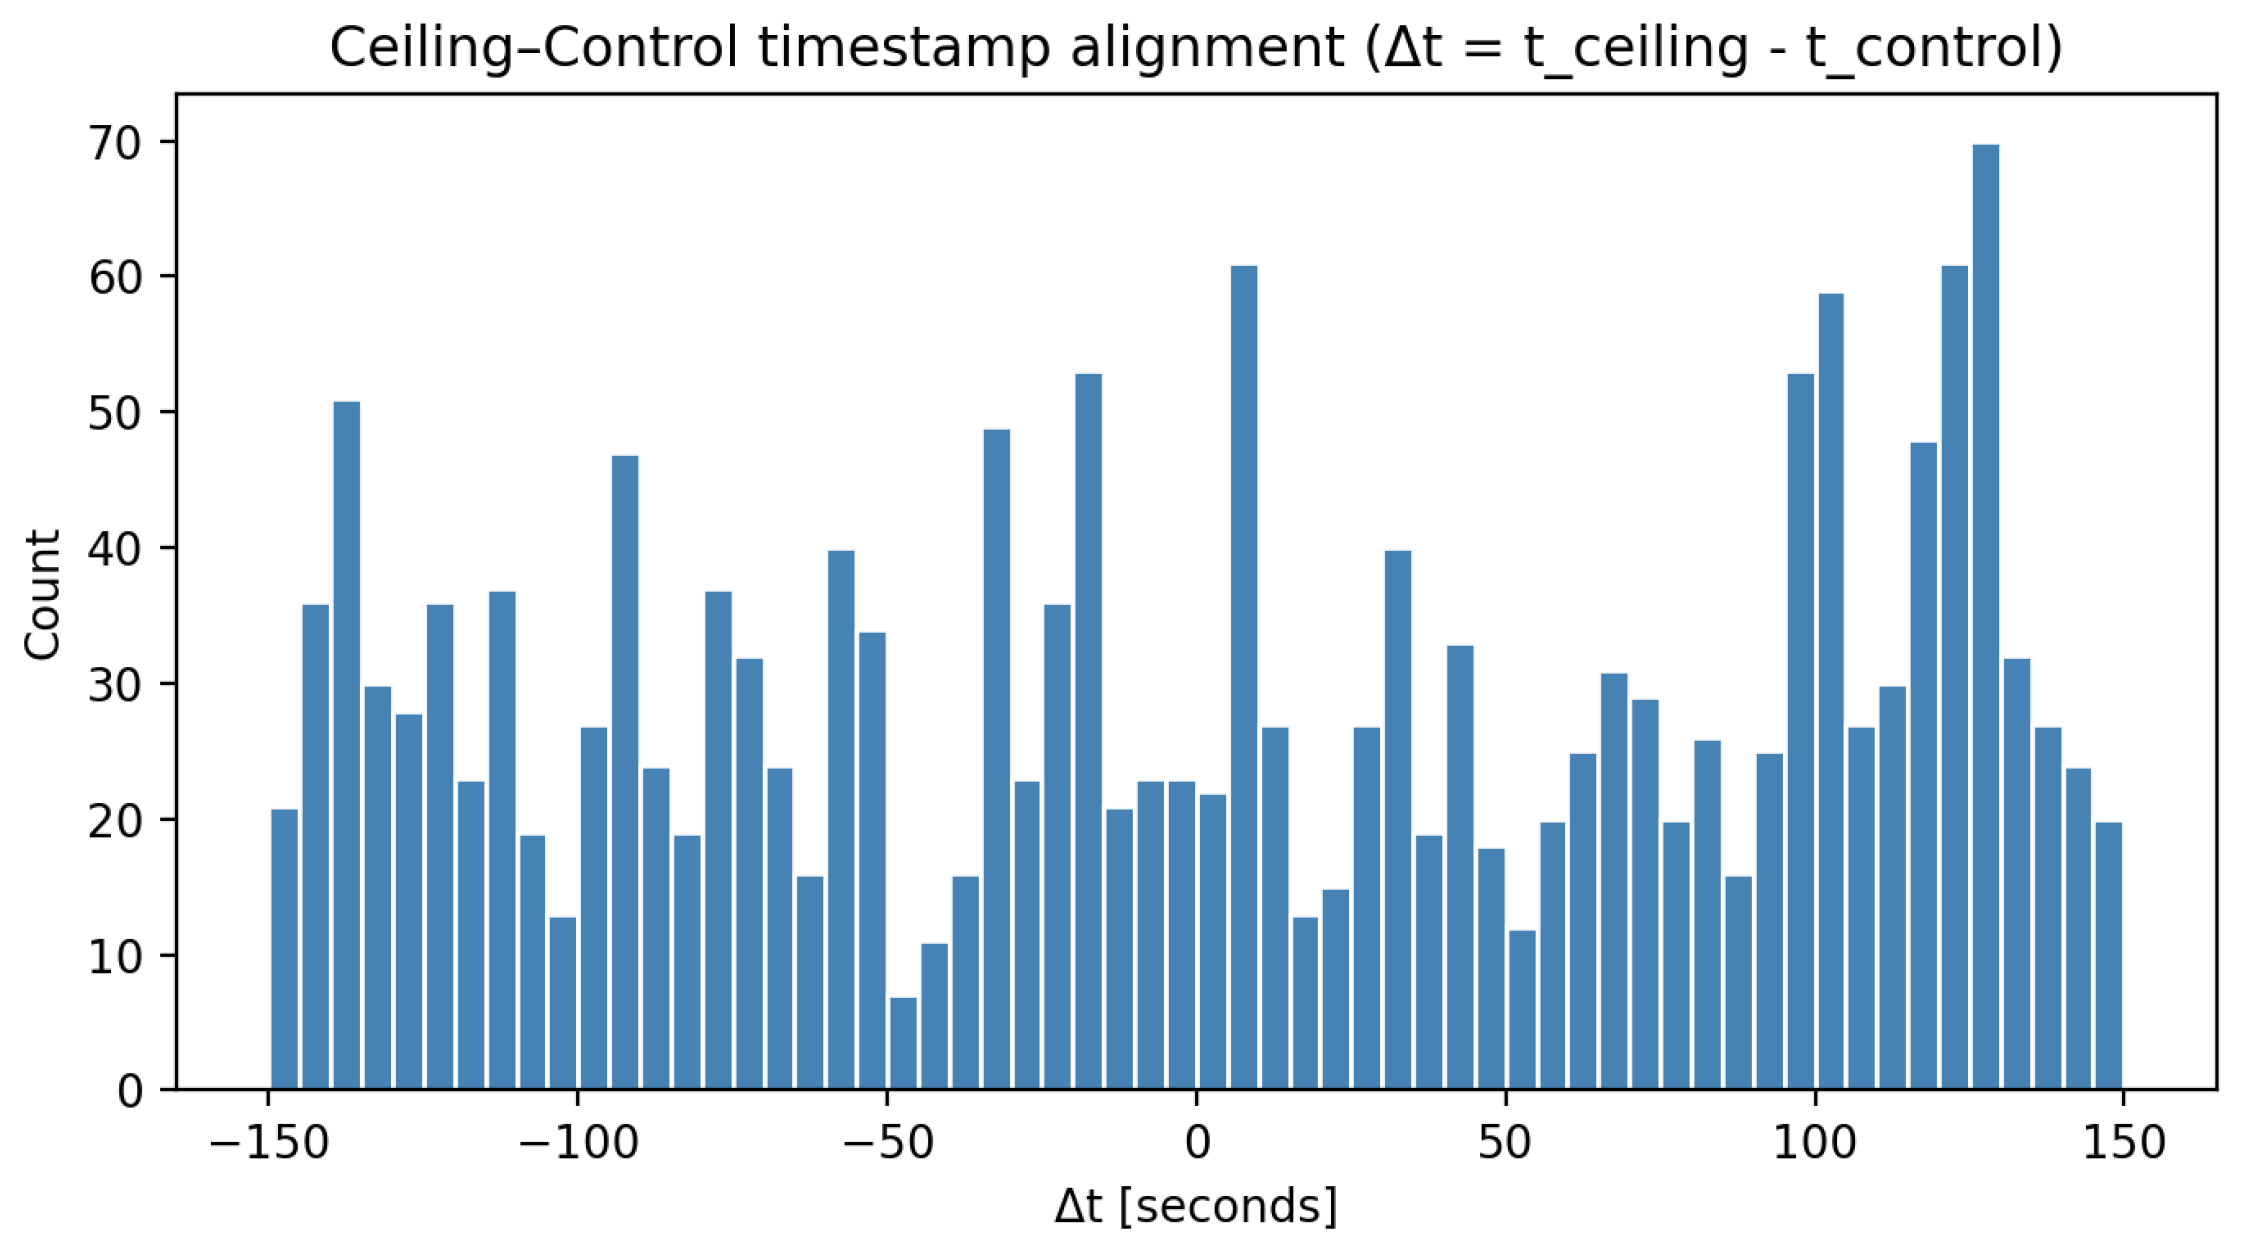
Join quality metrics. To make temporal joins auditable, we report (i) the match rate, i.e., the percentage of records for which a match is found within the tolerance, and (ii) summary statistics of the alignment offset (mean, median, and 95th percentile of ). For the ceiling–control join (tolerance ±2.5 min), 1786 out of 1836 control records (97.3%) are matched; has a mean of 4.7 s and a median of 6 s, and the 95th percentile of is 141 s. These metrics quantify the uncertainty introduced by time alignment and allow readers to assess its potential impact on downstream analyses.
Agreement metrics. On matched pairs, we compute the quantitative agreement measures between control and ceiling sensors for each variable: (i) mean bias, ; (ii) mean absolute difference, ; (iii) root mean squared error, ; and (iv) Pearson correlation coefficient, r. These statistics summarize the systematic offsets and co-variation and are intended to support representativeness assessments and sensitivity analyses rather than to claim traceable calibration.
Interpretation and expected deviations. As reported in
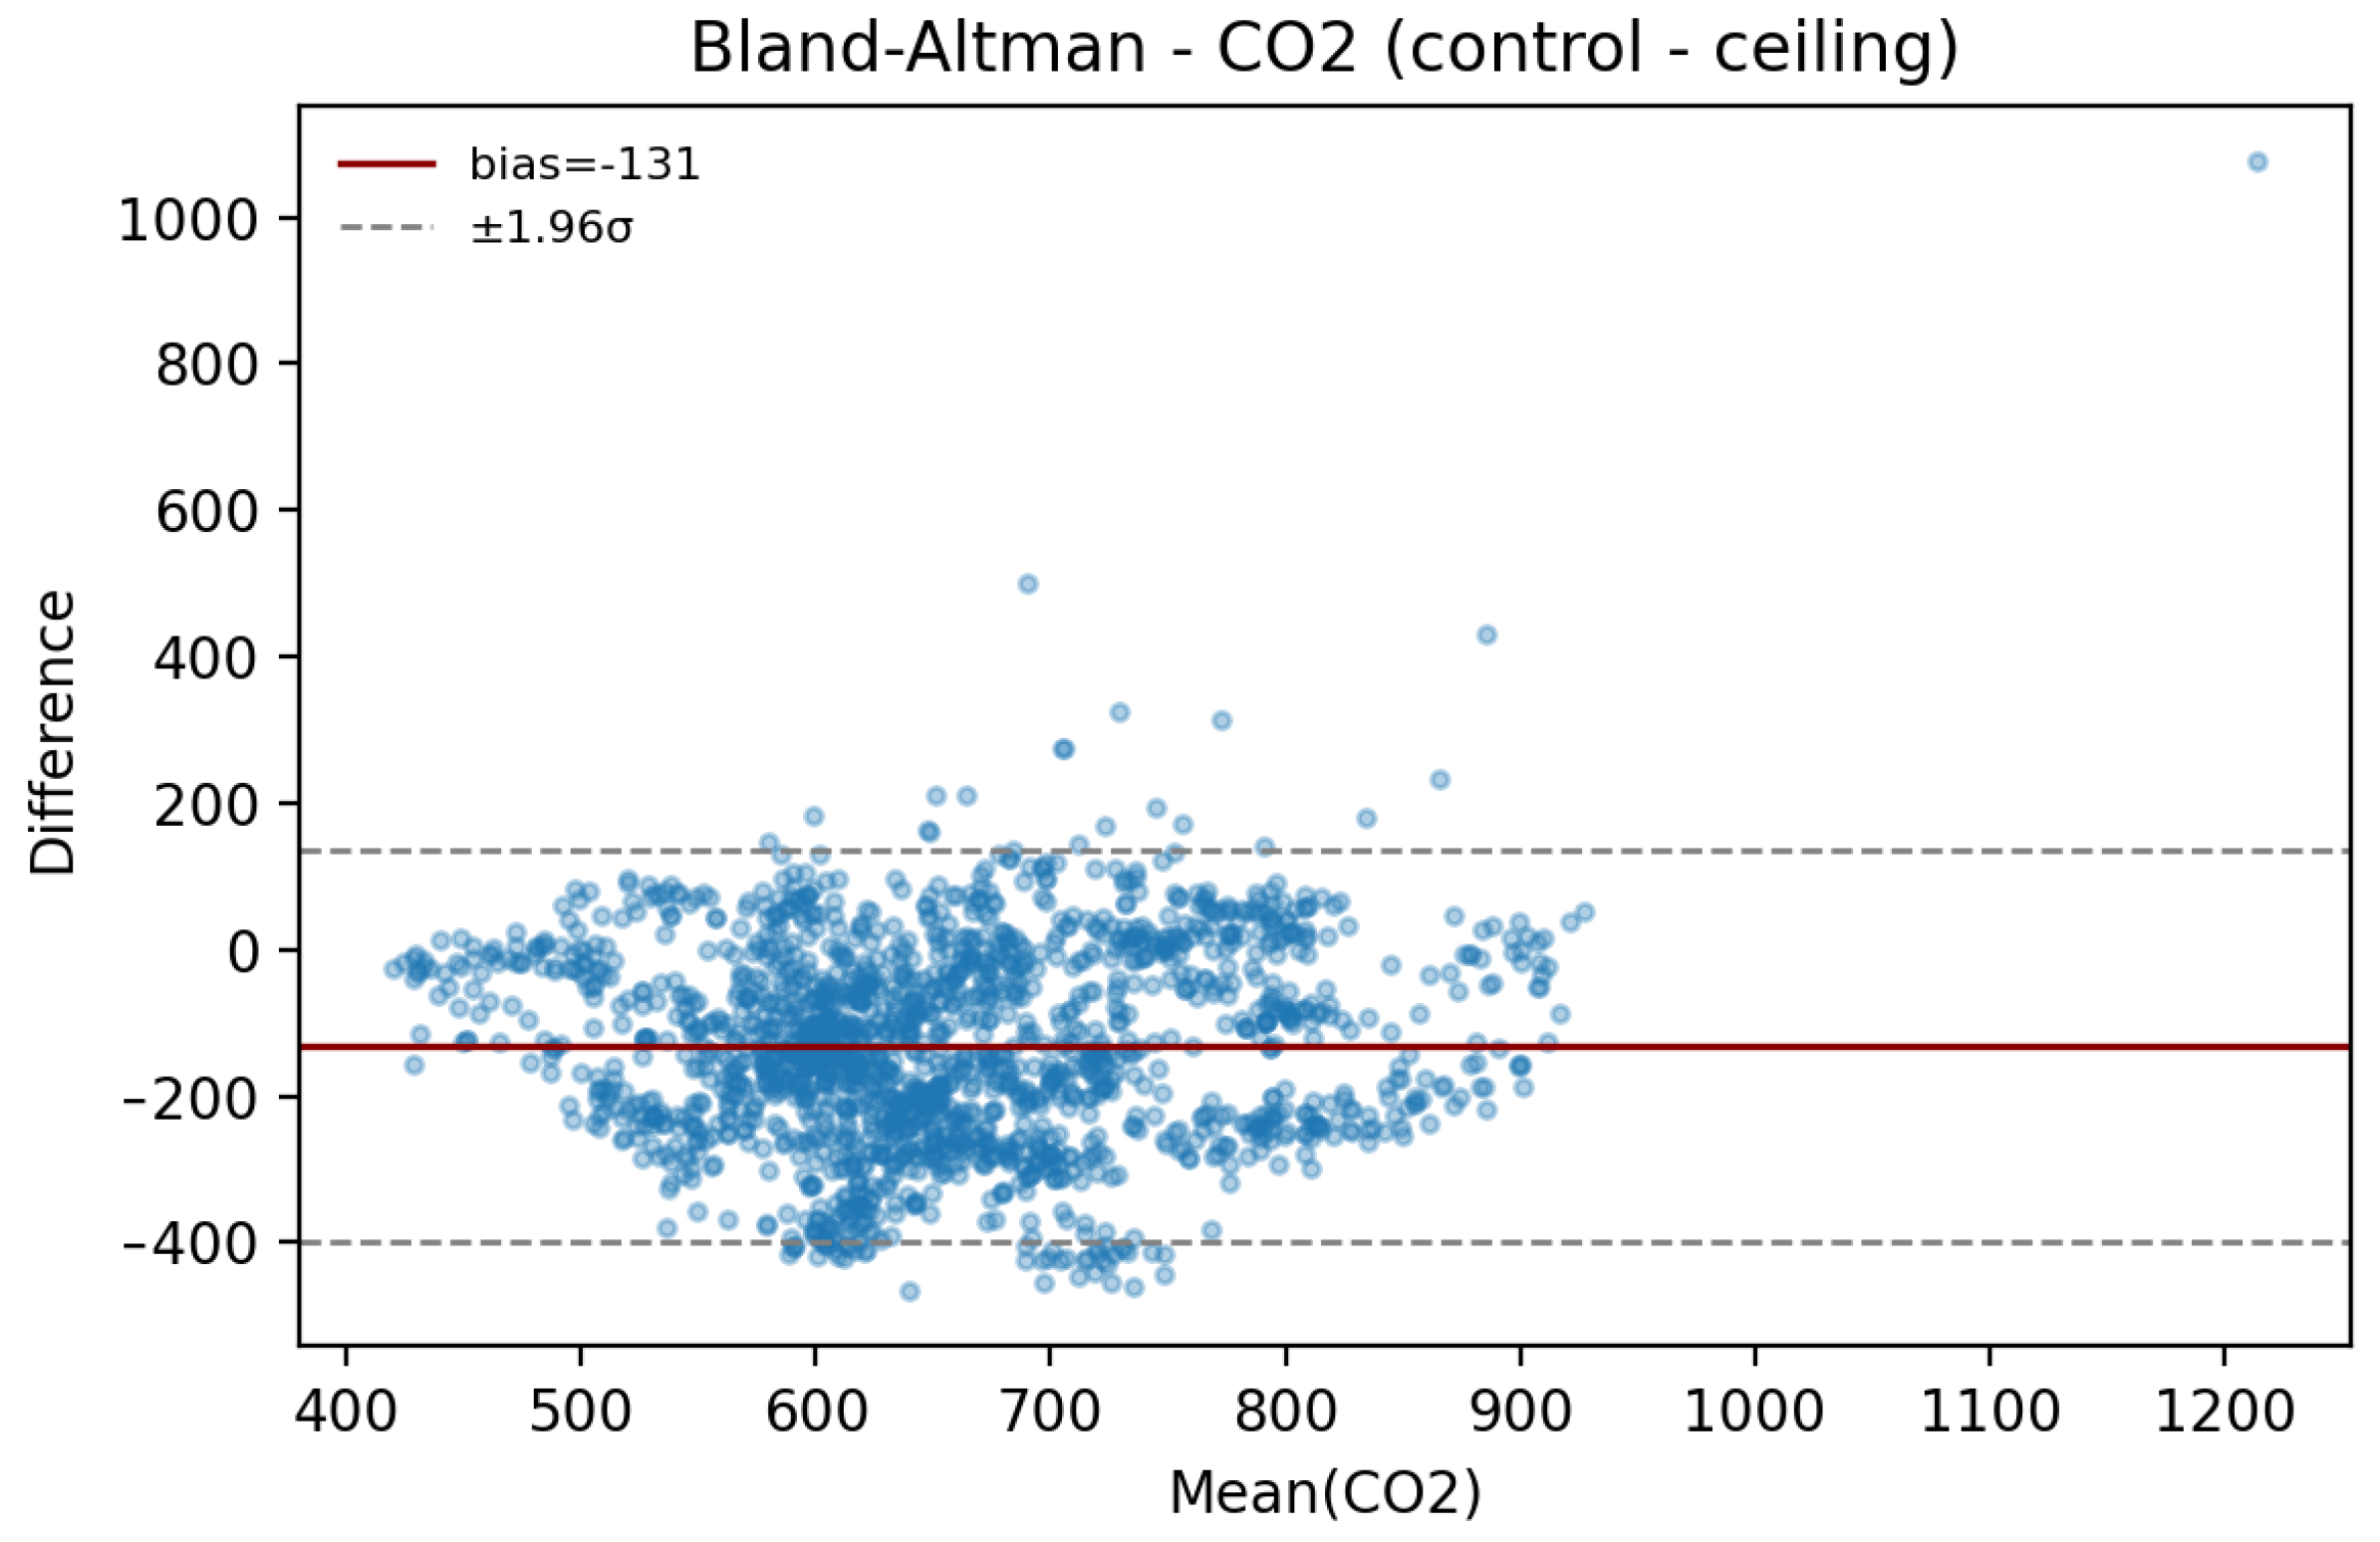
Table 2, pressure and relative humidity exhibit the strongest agreement (high correlation and low errors), while temperature and noise show moderate agreement. CO
2 shows the largest discrepancies and the weakest correlation, consistent with the fact that CO
2 is strongly influenced by proximity to occupants and short-range airflow patterns; therefore, ceiling-level CO
2 should be interpreted as a room-level proxy rather than as a direct estimate of breathing-zone exposure during lectures. Additional deviations may arise from localized sources (e.g., occupants’ thermal plumes and exhaled CO
2), micro-scale airflow patterns, and transient noise bursts near the temporary sensor.
To visually support these checks,
Figure 5 reports the distribution of alignment offsets,
, and
Figure 6 illustrates agreement using a Bland–Altman plot (difference vs. mean) for CO
2.
3.5. Dataset Characterization and Example Visualizations
To support reuse and to make temporal variability and dataset coverage explicit, we provide descriptive characterizations of both objective and subjective data. First, some labels are under-represented (
Table 3) and questionnaire coverage is uneven across rooms (
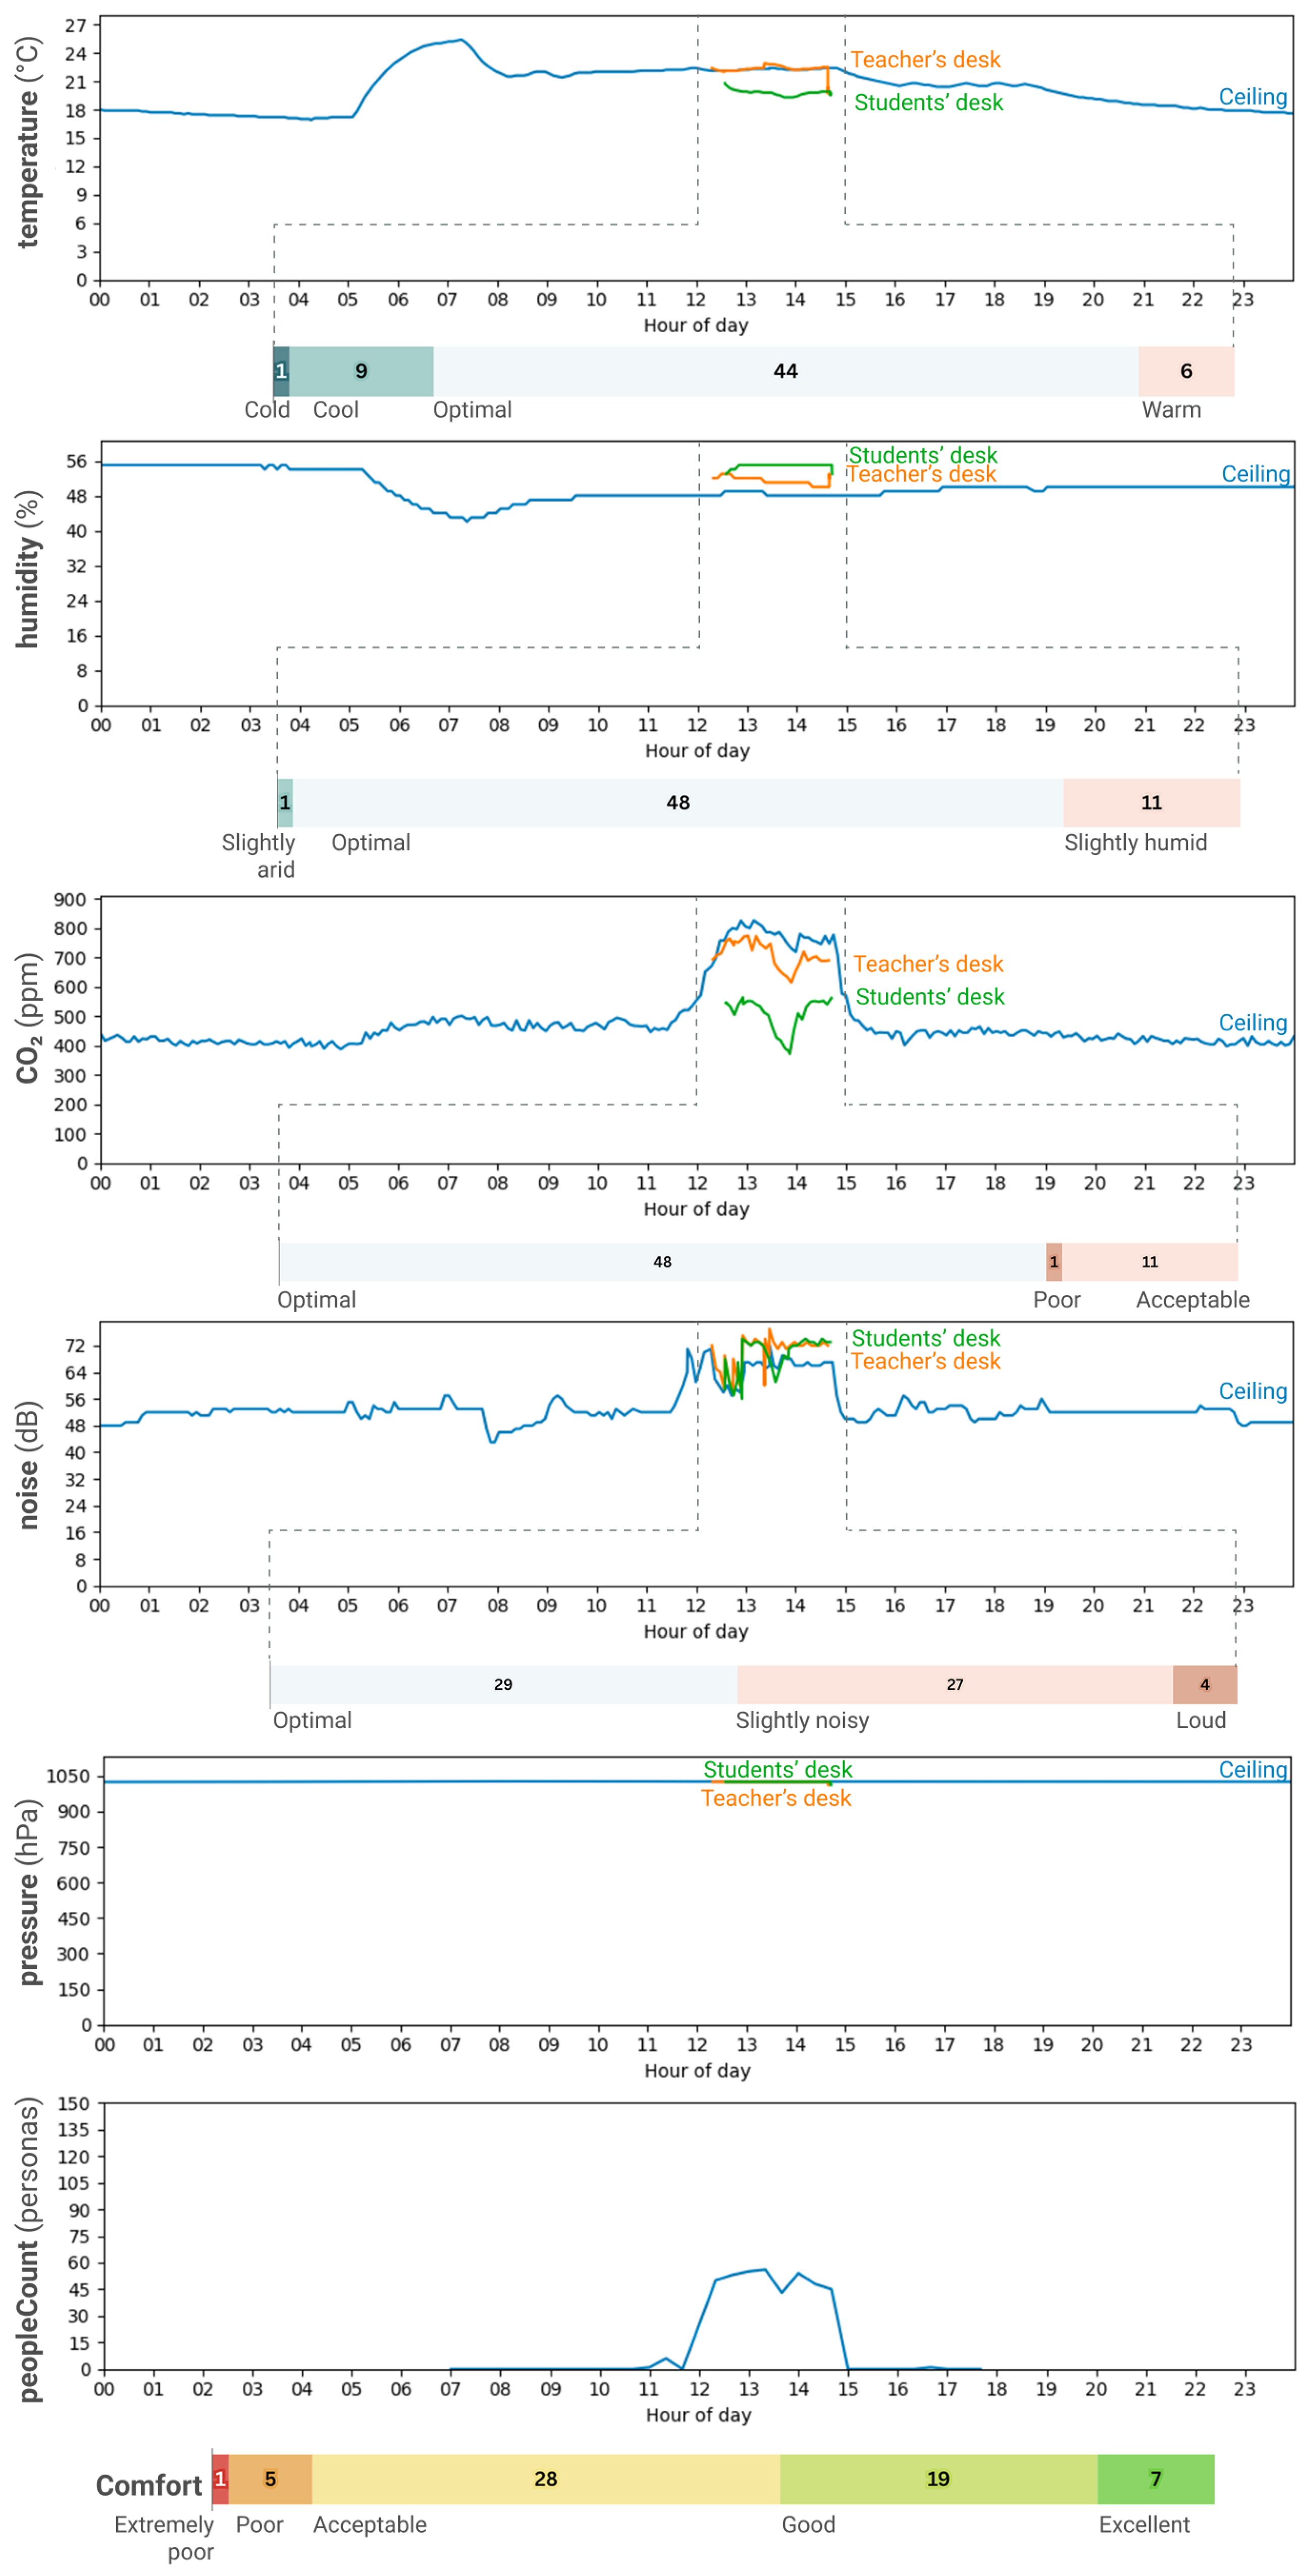
Table 4); these aspects should be considered in predictive modeling (e.g., class weighting and per-room reporting). Second, indoor environmental parameters exhibit time-varying dynamics (e.g., lecture-driven changes and transient peaks) that are not captured by global min/mean/max alone;
Figure 7 provides an example day in Room 2.12 in which ceiling and near-occupant traces, together with lecture-time questionnaires, highlight short-term fluctuations and peak events.
Because the dataset does not include the number of attendees per lecture, we report questionnaire coverage as the number of submitted responses per lecture session rather than a normalized response rate. Here, a lecture session is approximated as the combination of
room and UTC calendar date derived from the questionnaire timestamp. Moreover, since
4_comfort_perception.csv does not include an explicit course identifier, the course is inferred from the room schedule: Web Technologies (Room 2.12 and Lab 2.2) and Web Applications and Services (Room 2.5 and Lab 4.2).
Table 4 reports coverage by room,
Table 5 reports coverage by inferred course, and
Table 6 summarizes the distribution of responses per lecture session to support assessment of uneven participation and potential non-response bias.
3.6. Usage and Application
The dataset is intended to support research and development activities in the areas of smart campuses, indoor environmental quality, and occupant-centric comfort modeling. By combining continuous environmental sensing with repeated subjective comfort feedback, the data enable both descriptive and predictive analyses of comfort in real educational environments.
Based on the descriptive validation, ceiling measurements are best interpreted as room-level proxies, while near-occupant control measurements are preferable for analyses focused on occupied-zone exposure (especially for CO2), or for estimating systematic offsets between ceiling and near-occupant readings.
Typical usage scenarios include: (i) training and evaluation of machine learning models for comfort prediction based on environmental variables and occupancy information; (ii) analysis of correlations between objective measurements (e.g., temperature, CO2, noise) and perceived comfort; (iii) validation of sensor placement strategies by comparing ceiling-mounted measurements with control measurements collected closer to occupants; and (iv) investigation of inter-individual variability in comfort perception and relevance weighting across different courses and room types.
The dataset is also suitable for benchmarking occupant-centric control strategies, testing data fusion techniques, and supporting educational use cases in data analytics and human-centered computing courses. While collected in a university campus, the methodological approach and data structure generalize to other shared indoor environments such as offices, libraries, and coworking spaces.
3.7. Compliance with FAIR Principles
The dataset was designed and released in compliance with FAIR principles [
23].
Findable: The dataset is organized into clearly named files with a documented structure. Each variable is explicitly described in the accompanying metadata, and categorical encodings are centralized in a dedicated YAML file.
Accessible: Data are distributed using open, non-proprietary formats (CSV and YAML), which can be accessed and processed using a wide range of software tools and programming languages without restrictions.
Interoperable: Standard units of measurement and common data representations are used throughout the dataset. Environmental variables follow widely adopted conventions, and categorical variables are explicitly mapped to human-readable labels to facilitate reuse and integration with other datasets.
Reusable: The dataset is accompanied by detailed documentation describing the data collection context, sensing infrastructure, participant involvement, and dataset construction process. Anonymized identifiers are used to protect participants’ privacy while still enabling longitudinal and user-centric analyses.
3.8. Dataset Limitations
Despite its breadth, the dataset presents several limitations that should be considered when interpreting results.
First, data were collected in a limited number of rooms within a single university campus. While the monitored spaces differ in layout and usage, the results may not directly generalize to other buildings, climates, or cultural contexts.
Second, environmental measurements rely on commercial off-the-shelf sensors, which, while suitable for long-term monitoring, may exhibit measurement noise or calibration drift. Differences between ceiling-mounted sensors and control sensors placed near occupants can introduce systematic variations in the readings.
Third, comfort perception data are subjective and self-reported and are thus influenced by individual preferences, expectations, and momentary conditions not directly captured by the sensors. Additionally, comfort perception reports were collected during lectures, leading to an uneven temporal distribution driven by teaching schedules rather than continuous sampling.
Finally, the number of participants and responses varies across rooms and courses, which may result in class imbalance when training predictive models. Users of the dataset are encouraged to account for these factors through appropriate preprocessing, validation strategies, and statistical analysis.
4. Conclusions and Future Work
This paper introduced a comprehensive dataset for indoor comfort analysis collected in real classrooms and laboratories at the Cesena Campus of the University of Bologna. By jointly capturing continuous environmental measurements and subjective comfort feedback from students, the dataset enables occupant-centric investigations that go beyond traditional building-level monitoring approaches. The inclusion of multiple room types, heterogeneous occupancy conditions, and both permanent and control sensor measurements enhances the realism and analytical value of the data.
The dataset is particularly suited for research on comfort prediction, sensor validation, and smart campus services. Its structure supports the development of machine learning models that account for temporal dynamics, spatial variability, and individual differences in comfort perception. Moreover, the explicit documentation of categorical encodings and the use of open data formats facilitate reproducibility and reuse across different research communities.
Future work will focus on extending the dataset both spatially and temporally. Additional rooms and buildings will be instrumented to improve coverage and generalizability, and longer monitoring periods will enable seasonal analyses and the study of adaptation effects. Another promising direction is the integration of contextual information, such as teaching activities, window-opening behavior, and HVAC system states, to further enrich comfort modeling. Finally, future releases will explore privacy-preserving personalization techniques and real-time comfort-aware control strategies, contributing to the design of healthier, more sustainable, and human-centered smart campuses.