1. Introduction
The cactus pear tree belongs to the genus
Opuntia of the
Cactaceae family. The family contains almost 300 species utilised by human. However, only a few cactus plants may be cultivated for the production of fruits [
1]. The cactus pear grows in conditions where few other plants can survive because of its ability to thrive in harsh conditions, such as extremely high temperatures and limited water supply [
1,
2]. The tree can grow up to 5 m tall with the step that is divided into multiple green flattened leaf pads, called
cladodes or
nopalitos, covered with a dull [
3]. Cactus pear produces orange flowers, which give rise to oval-shaped thorny fruits with colours ranging from yellow to red and purple, and it ripens between January and March. In other countries, such as Mexico, the entire plant, including the stem (
cladode), and the fruit is used for medicinal purposes, animal feed and the production of other food products [
3]. The entire plant is reported to have antiviral and anti-inflammatory properties; hence, it is used to decrease blood sugar levels in people with type 2 diabetes and lessens the unpleasant effects of a hangover due to its anti-inflammatory effects [
4].
Spontaneous fermentation is naturally used to produce beverages from indigenous fruits [
5,
6,
7]. The activities of the native micro-organisms are influenced by the biochemical reactions and metabolites produced by the fermentation process [
5,
8]. Some of these native microbes were successfully developed into starter cultures for the industrial production of food and beverages in the past decades [
8,
9]. Understanding the ecological studies in spontaneous fermentation can provide significant knowledge about microbial interactions and the output of their reactions. This is important in the selection of desirable strains, thus enabling the design of good biotechnological processes and consequently achieving the desired flavour characteristics. Many traditional beverages are still produced based on the fermentation knowledge gained from traditional fermentation methods. Recent studies have indicated that inoculating native or mixed cultures obtained from spontaneous fermentation can improve wine characteristics, such as aroma and structure; however, little is known on what informs the choice of native microbes [
5,
8,
9,
10] for the fermentation of food products.
The pure starter culture has recently been used to produce cactus pear wine to achieve desired flavours such as aroma, taste and mouthfeel; however, the technology used is applied without comprehensive understanding of the principles of the fermentation and co-evolution of the cactus pear’s microbial community and substrate. This results in producing wine with minimal chemical characteristics that affect the organoleptic properties of the wine. Rodrigues-Lerma et al. [
10] used statistical inference to achieve a wine with good quality characteristics from a mixed culture fermentation process with the non-fermenting yeasts
Pichia fermentans and
Saccharomyces cerevisiae. In another study, Navarrete-Bolanos et al. [
11] introduced malolactic fermentation to optimise cactus pear wine by
Oenococcus oeni bacteria. This points to the importance of understanding the microbial interactions and their associated metabolites during traditional fermentation to achieve quality characteristics. Hence, investigation into the spontaneous fermentation of cactus pear should advance the knowledge of microbial interactions that can be used to generate new starter cultures from the autochthonous yeasts and bacteria.
Cactus pear fruit has a desirable nutrient composition such as ascorbic acid, beta-carotene, lycopene and a variety of minerals, which makes it an attractive substrate for wine fermentation [
3,
12]. The fruit contains high levels of vitamin C and essential minerals such as calcium, potassium, magnesium and phosphate, among others. It also contains a total sugar content of between 6% and 14%, which is higher than that of other fruits used in wine production such as apples, berries and pears [
13,
14]. Mexico is one of the countries where traditional alcoholic cactus pear beverages are produced. “Colonche”, or cactus pear “wine”, is the traditional sweet alcoholic red wine produced from red cactus pear fruit (
Opuntia streptacantha) in Mexico [
15]. There are limited studies reporting on the production of wine using cactus pear fruit in the past three decades since the fruit is highly perishable and is seasonal. There are only a few studies that report on the specific characteristics of wine such as taste, alcoholic content, specific gravity, colour, flavour, sensory analysis and study techno-economic feasibility analysis [
12,
16].
Cactus pear fruit has a short shelf life, resulting in serious post-harvest losses, since the fruits are highly perishable [
16,
17]. It ferments rapidly when inoculated with
Saccharomyces cerevisiae and becomes ready for consumption within a few hours of production [
12]. The fermented juice has a shelf life of two to three days [
16,
18]. The natural fermentation process is driven by different microbes that ultimately influence the character of the fermented wine through enhanced sensory and chemical properties; however, spoilage can occur due to the activity of spoilage microbes, reducing the quality of the wine [
18,
19]. Very little is known about the micro-organisms responsible for spoiling cactus fruit juice and wine [
17].
Although the production of cactus fruit products remains a challenge, developing predictable fermentation process models can benefit the producers of cactus wine worldwide, especially with the production of organic products [
20,
21]. Understanding the activity of micro-organisms involved in spontaneous fermentation and storage of the fermented juice can assist in developing long-lasting cactus pear wine [
22]; hence, the purpose of this study was to profile the contributing micro-organisms and evaluate the chemical parameters of cactus pear wine. The outcome of this study will assist in improving the shelf life and preservation of cactus fruit juice wine.
2. Materials and Methods
2.1. Collection and Selection of the Cactus Pear Fruits
Red cactus pear fruits were harvested from trees in the wild at Ga-Mamaila village, Limpopo, in South Africa (23°21′39.9″ S 30°13′34.5″ E) in April 2019 and transported to the laboratory of the Department of Biochemistry, Microbiology and Biotechnology at the University of Limpopo using paper boxes. The fruits were selected carefully based on their physical appearance and washed with sterilised deionised water to remove the spines.
2.2. Extraction of Cactus Pear Juice
About 25 kg of cactus pear fruit was manually peeled with sanitised hands. The juice was extracted from the fleshy part of the fruits with an electronic juicer machine (Milex, Sovenga, South Africa) purchased from a local store. The juice was collected into a sterile measuring bucket to determine the volume. The juice was then diluted, using the sterile distilled water following the ratio of 1:2 (water:juice) to liquify the juice. The mixture was filtered through a sterile cheesecloth to remove the remaining seeds and fibres.
2.3. Fermentation and Maturation
An equal amount of the filtered juice was transferred into two sterile 5 L glass fermenters connected with an air locker and sampling pipe. The juice was allowed to ferment spontaneously at room temperature for 13 days in a dark room. After 13 days of fermentation, the fermenters were transferred to cold storage at 4 °C or three months for wine maturation.
2.4. Sampling
A volume of 100 mL fermenting juice was aseptically transferred from the fermenter to two separate 50 mL sterile centrifuge tubes daily for the first 13 days. The same process was carried out in four-week intervals during the cold storage period.
2.5. Microbiological Analysis
The daily collected ferments were transferred into 2 mL sterile centrifuge tubes, and the samples were centrifuged using a Sorvall RC 6+ centrifuge machine (Thermo Fischer Scientific, Johannesburg, South Africa) at 5000 rpm for 10 min. The supernatant was transferred into new sterile centrifuge tubes and stored at –20 °C for chemical analysis, and the pellet was suspended in 1 mL of 0.85% saline solution. The pellet was resuspended by mixing it gently with a vortex and centrifuged at 5000 rpm for five minutes. The pellet was suspended in 1 mL saline solution and 1 mL sterilised absolute glycerol and stored at –80 °C as a stock culture.
2.6. Isolation of Yeast and Bacteria
Ten times serial dilutions of the culture were prepared in triplicates, and 100 μL from each tube was transferred and spread on Wallerstein Laboratory Nutrient agar (WLN) for yeasts, Wallerstein Differential agar (WLD) for acetic acid bacteria, Yeast Extract Peptone Dextrose medium agar (YPD) for yeasts, De Man Rogosa and Sharpe agar (MRS) for lactic acid bacteria and Yeast Extract Peptone Dextrose medium (YPD) agar supplemented with 5% ethanol for yeasts. The cultures on WLD, WLN and YPD agar were incubated aerobically at 30 °C for 42 to 72 h, and the cultures on MRS agar were incubated anaerobically at 30 °C for 72 to 94 h. After incubation, different colonies were enumerated and identified by morphology. At least 10% of each colony was sub-cultured on the same medium, using four-way streaking techniques for purification.
2.7. Microbial Identification
Bacterial isolates were identified with the 16S rDNA sequencing technique, using the universal primers 27F (5′-AGAGTTTGATCTGGCTCAG-3′) and 1492R (5′-CGGTTACCTTGTTACGACTT-3′). Genomic DNA was isolated from the culture, using Quick-DNATM Fungal/Bacterial Miniprep Kit (Zymo Research, Inqaba Biotec, Pretoria, South Africa). The 16S rDNA target region was amplified, using OneTaq Quick-Load 2X Master Mix (NEB). One percent agarose gel electrophoresis was performed to observe the amplicons; the bands were excised from the gel and the DNA was extracted with the ZymocleanTM Gel DNA Recovery Kit (Zymo Research). The extracted fragments were sequenced in the forward and reverse direction (Nimagen, BrilliantDyeTM Terminator Cycle Sequencing Kit V3.1, BRD3-100/1000, Inqaba Biotec, Pretoria, South Africa) and purified, using Zymo Research ZR-96 DNA Sequencing Clean-up KitTM. The purified fragments were analysed on the ABI 3500xl Genetic Analyzer (Applied Biosystems, Thermo Fisher Scientific, Johannesburg, South Africa) for each reaction of every sample. CLC Bio Main Workbench v7.6 was used to analyse the ab1 files generated by the ABI 3500XL Genetic Analyser and Basic Local Alignment Search Tool (BLAST) searches at the National Center for Biotechnology Information (NCBI) were performed to obtain the identity of the isolates.
2.8. Analysis of the Chemical Parameters
2.8.1. Sugar Content
Glucose and fructose concentrations were measured, using High-Performance Liquid Chromatography (Shimadzu Prominence 20 HPLC System, Shimadzu, Johannesburg South Africa). The standard curve was prepared, using standard analytical sugar fructose and glucose in the concentration range of 0.390 mg/mL to 400 mg/mL. Wine samples were filtered using sterile GxF/0.45 µm membrane into 9 mm, 2 mL screw vials. The column used was a Rezex RHM monosaccharide H+ (300 × 8 mm), and deionised water was used as the mobile phase. The column was operated at a temperature of 85 °C and a flow rate of 0.6 mL per minute. A sample volume of 20 µL was used. A refractive index detector was used to detect the separated components. The sample sugar concentration was calculated using the standard curve.
2.8.2. Ethanol Concentration
The ethanol concentration was determined by collecting 2 mL of the fermenting wine samples into a microcentrifuge tube. The samples were centrifuged at the speed of 10,000 rpm for 5 min to pellet the cells. The supernatant was filtered through 0.22 µm Whatman filters into 1.5 mL auto-sampler clear vial tubes. The concentration of ethanol was determined using a gas chromatography instrument (model GC-2014; Shimadzu Seisakusho, Kyoto, Japan) on a zb-wax capillary column, L × I.D. 30 m × 0.25 mm, df 0.25 μm. The external standard was prepared for a concentration range of 7.81–125 g/L. A volume of 1 µL was injected into the column at an injection temperature of 220 °C. Nitrogen was used as the carrier gas, and detection was achieved with flame ionisation detectors (FID), with the detector temperature maintained at 280 °C. The peaks were processed, using GC Solutions software.
2.8.3. Titratable Acidity
The benchtop pH meter, Crison pH-meter basic 20+ was used. The beaker was filled with 100 mL of purified water and mixed with 10 mL of the wine sample. The mixture was boiled for a minute on the stir plate stove with continuous stirring. The mixers were allowed to cool at room temperature, and 0.1N NaOH solution was slowly dripped into the beaker, using a measuring burette and stopped when the pH had risen to 8.2. The volume of the alkaline solution was measured and used to calculate total acidity in grams per 100 mL, using the formula Total acidity = 75 × V × N/S, where V = mL of alkaline solution used for titration, N = Normality of alkaline solution and S = wine sample volume.
2.8.4. Juice and Wine pH
The changes in the pH levels of the wines were evaluated during fermentation and maturation, where a pH meter was used to measure the pH of a collected 10 mL of each juice wine.
2.8.5. Tannin Content
The tannin content was determined by using the Folin–Ciocalteu method described elsewhere [
23], with minor modifications. Twenty microliters of each sample was added into a test tube containing a mixture of 1.5 mL of distilled water, 0.1 mL of the Folin-Ciocalteu reagent and 2 mL of 35% sodium carbonate (Na
2CO
3). The blank tube was prepared in the same manner except without an experimental sample. All the test tubes were placed in a 25 °C water bath and shaken for 30 min. The absorbance of the samples was measured against the blank at 725 nm, using a Genesys 10S UV-Vis spectrophotometer (Thermo Fisher Scientific, Johannesburg, South Africa).
2.8.6. Mineral Content
A total of 5 mL fermenting and maturing wine samples were digested by 7.5 mL nitric acid and 1.5 mL hydrogen peroxide in a digestion vessel. The solutions were mixed by carefully shaking the vessels and digesting the samples in a microwave mineral digester for 15 min. After incubation, the digestion vessels were cooled in the laminar flow for 10 min. The digested contents were transferred to 50 mL centrifuge tubes. Deionised water was used to make up the content volume to 50 mL. All contents were then run, using the Shimadzu Inductively Coupled Plasma Emission Spectroscopy (ICPE-9000, Shimadz, Johannesburg, South Africa). For each sample, the measurements were repeated three times and expressed in mg/L.
2.8.7. Ash Content
Ash content analysis of cactus pear juice and wine was conducted, using the method described elsewhere [
24]. The porcelain crucibles were washed and placed in the furnace at 600 °C for 30 min for sterilisation and then cooled in a desiccator for 30 min. Each crucible was weighed on a Radwag (PS 750/c/2) weighing balance; then, the weighing balance was tarred, and 5 g of the juice and wine samples was added into each crucible. The crucibles with samples were placed in the furnace for at least 16 h at 600 °C. Thereafter, the crucibles were removed from the furnace and allowed to cool in a desiccator. Each crucible was weighed again for the dry sample mass to be determined by subtracting the initial mass of the crucible without the sample from the crucible with the dry sample.
2.8.8. Determination of Vitamin C (Ascorbic Acid)
Ascorbic acid was quantified by adding 2 mL of 4.5% meta-phosphoric acid to 0.1 g of cactus pear juice and wine. The mixture was sonicated in a water bath for 2 min, then centrifuged at the speed of 5000 rpm for 10 min. The mixture was filtered through 0.45 µm nylon filters into 2 mL clear HPLC vials. Ascorbic acid was quantified in a HPLC chromatogram (Shimadzu Prominence 20 HPLC System, Shimadzu, Johannesburg, South Africa) that was connected to a UV detector with a 100 RP-18 column (250 mm × 4.6 mm and 5 µm particle size). The external standard was prepared for a concentration range of 0.623–10 g/L. Potassium dihydrogen phosphate (0.2 M at pH 2.3–2.4) was used as a mobile phase, with a flow rate of 1.0 mL/min for 15 min at λ = 243 nm and an injection volume of 20 µL. The ascorbic acid was estimated using the calibration equation from an external standard.
3. Results
The presented results indicate the microbial content and chemical parameters of a spontaneously fermented cactus pear wine.
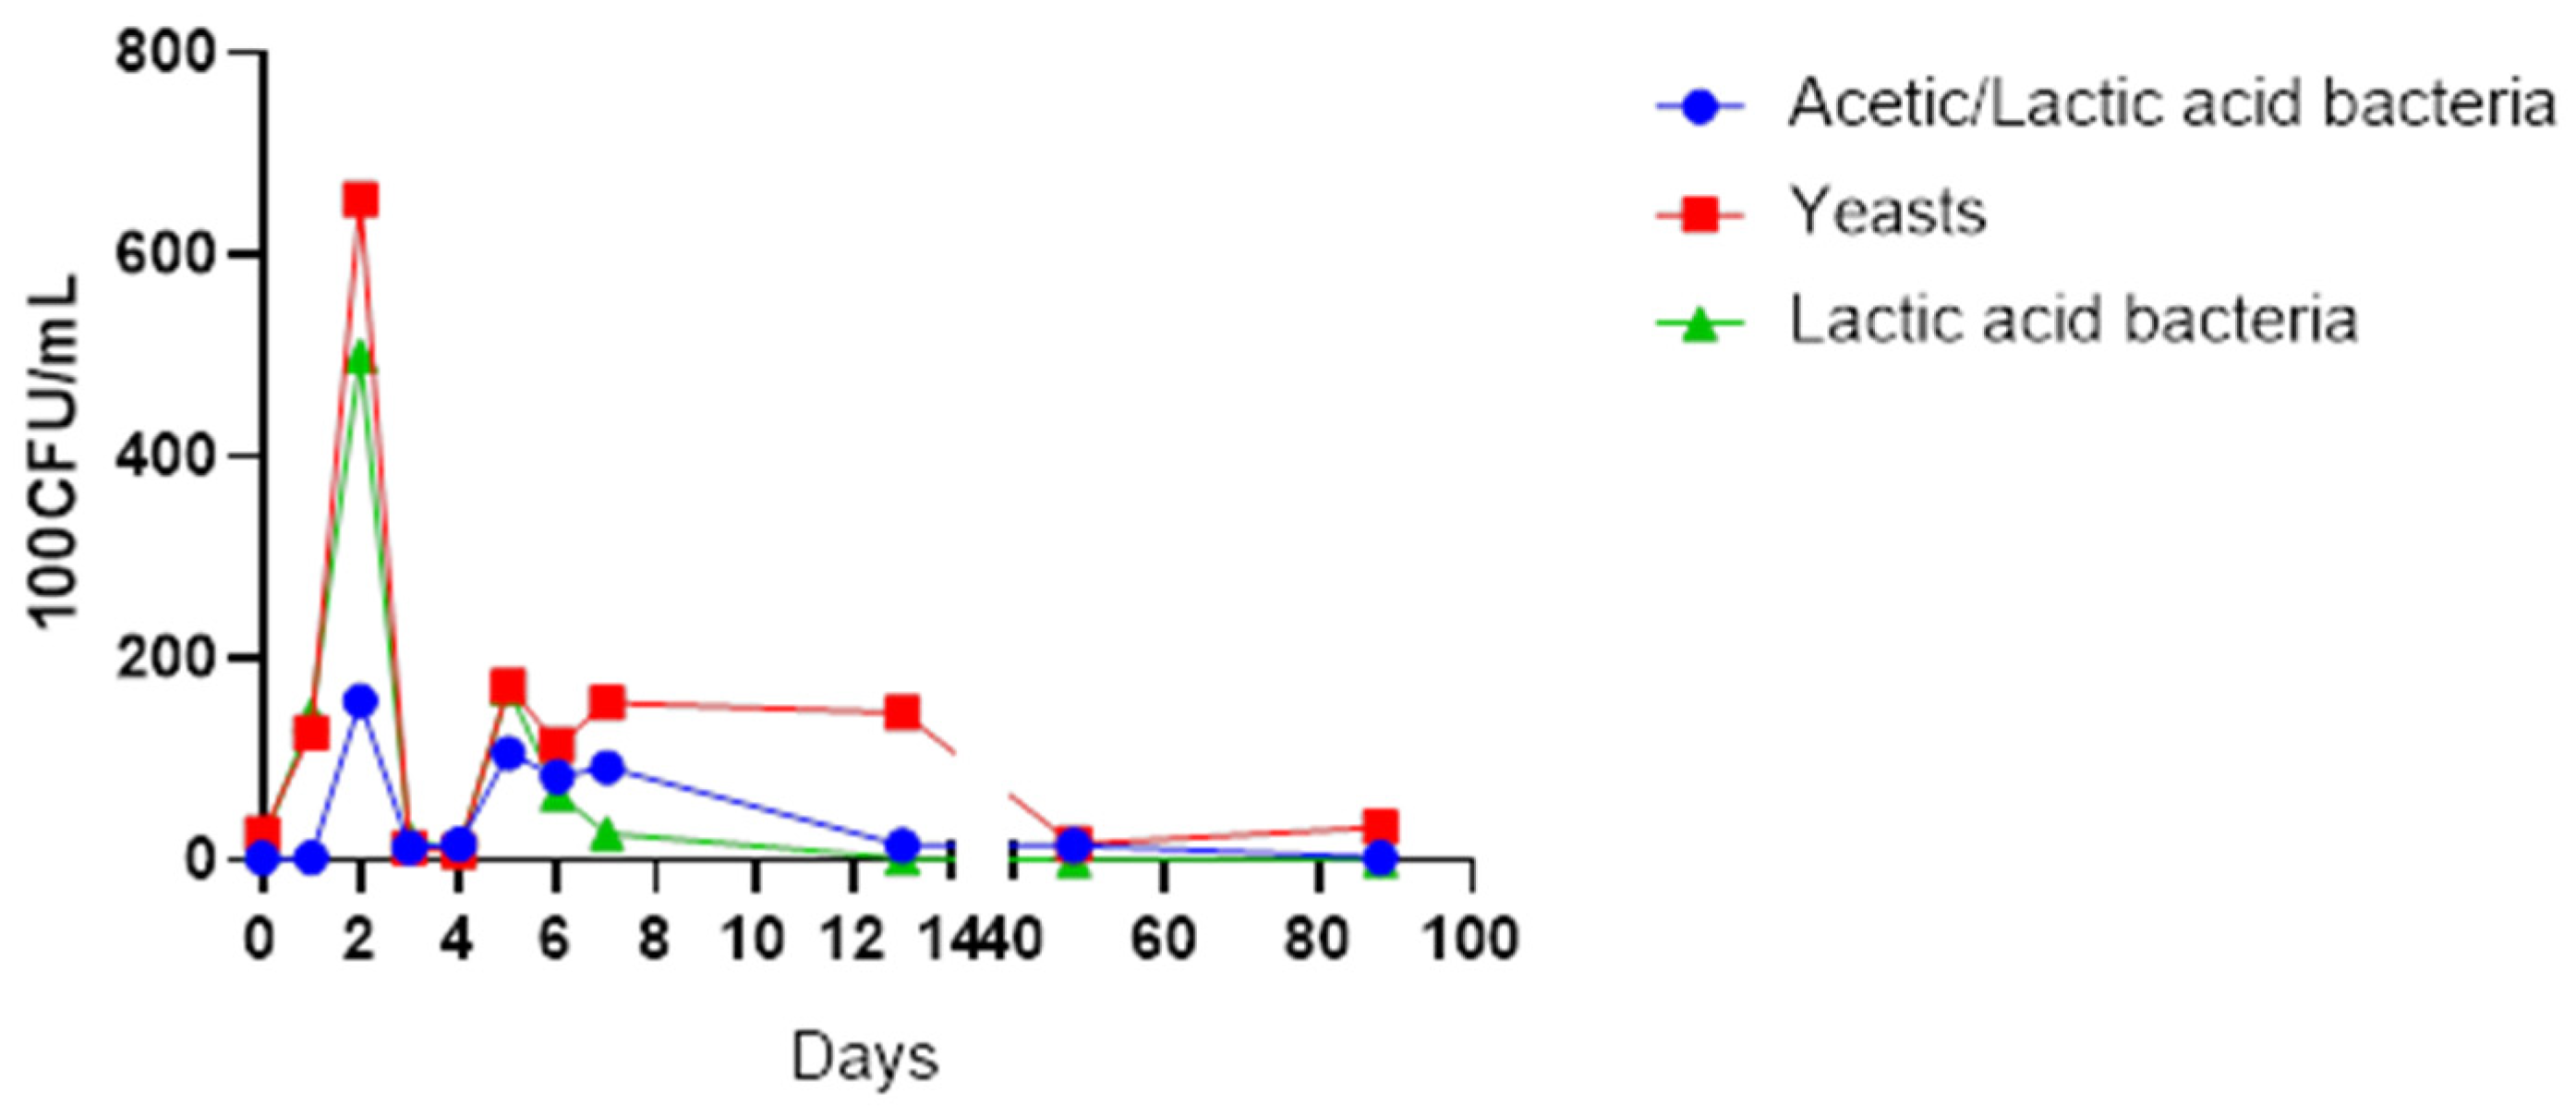
Table 1 depicts the yeasts and bacterial strains that were isolated from the fermenting cactus pear fruit juice throughout the 13-day period, whereas
Figure 1 illustrates the growth pattern of the selected yeasts, acetic acid and lactic acid bacteria.
A total number of 22 microbial species were isolated from the fermenting juice. Non-fermenting species such as Starmerella bacillaris, Hanseniaspora opuntiae, Hanseniaspora uvarum, Pichia kluyveri and Pichia fermentans appeared in the early stages of fermentation from days 0 to 4, dominated by Starmerella bacillaris. All non-fermenting yeasts disappeared from day 5. Fermenting yeast, Saccharomyces cerevisiae, dominated the mid-fermentation stage from day 6 onwards, while the acetic acid bacteria Gluconobacter kondonii and Gluconobacter albidus dominated the early stages of fermentation, that is, days 0 to 2. Interestingly, the Bacillus species was present from day 0 until the last day of fermentation. Of concern was the presence of Staphylococcus epidermidis and Rothia dentocariosa in the fermenting matrix.
The yeasts species were the most abundant throughout the fermentation and maturation stages, although the counts reduced greatly after the third day of fermentation (
Figure 1). The yeast species present in the earlier days of fermentation included non-fermenting species such
as Starmerella bacillaris,
Hanseniaspora opuntiae,
Hanseniaspora uvarum,
Pichia kluyveri and
Pichia fermentans, while
S. cerevisiae emerged in larger numbers from day 6. The acetic acid bacteria were comparatively present in low numbers than the lactic acid bacteria at the start of fermentation. The isolates observed in the early days of fermentation infer the presence of
Gluconobacter kondonii and
Gluconobacter albidus.
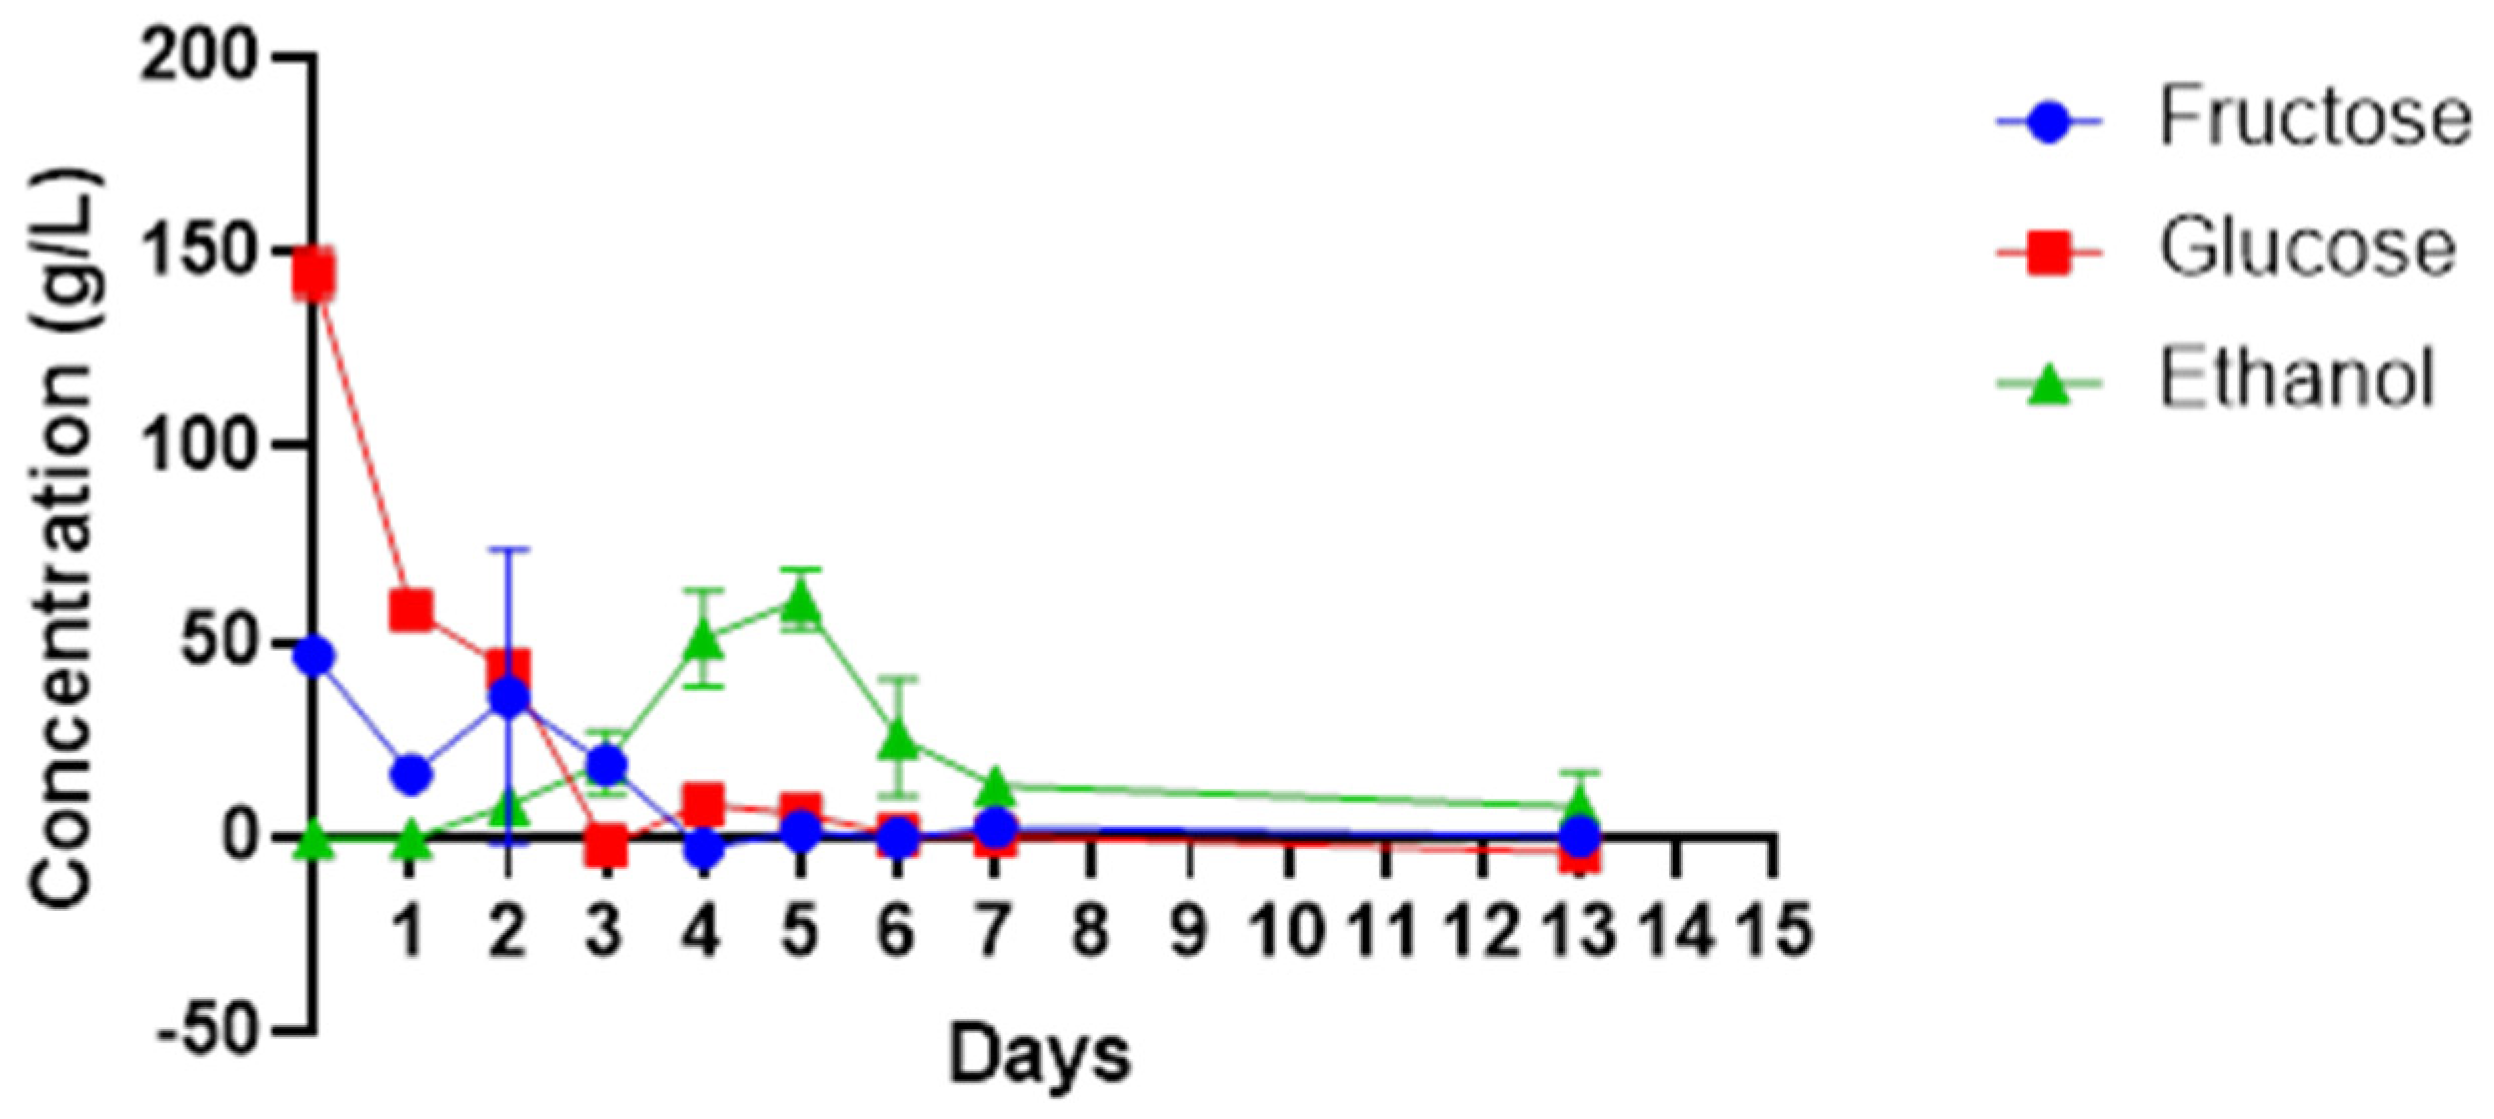
Higher amounts of the sugars were present in the beginning of fermentation process, and both glucose and fructose decreased rapidly from 149 g/L to 8.9 g/L and 49 g/L to 0 g/L, respectively, between days 0 and 4 (
Figure 2). This corresponds with the increase in the number of microbes as shown in
Figure 1, specifically the abundance of non-
Saccharomyces yeasts species and bacteria such as
Gluconobacter species. The decline in sugar content matched with the increase in the amount of total alcohol from 0 to 60.88 g/L between days 0 and 5. There was a decrease in ethanol concentration, from 60.88 g/L to 13, 26 g/L, between days 5 and 13. Microbes such as
Gluconobacter spp., which oxidise ethanol into acetaldehyde and acetic acid for their survival were present during this period.
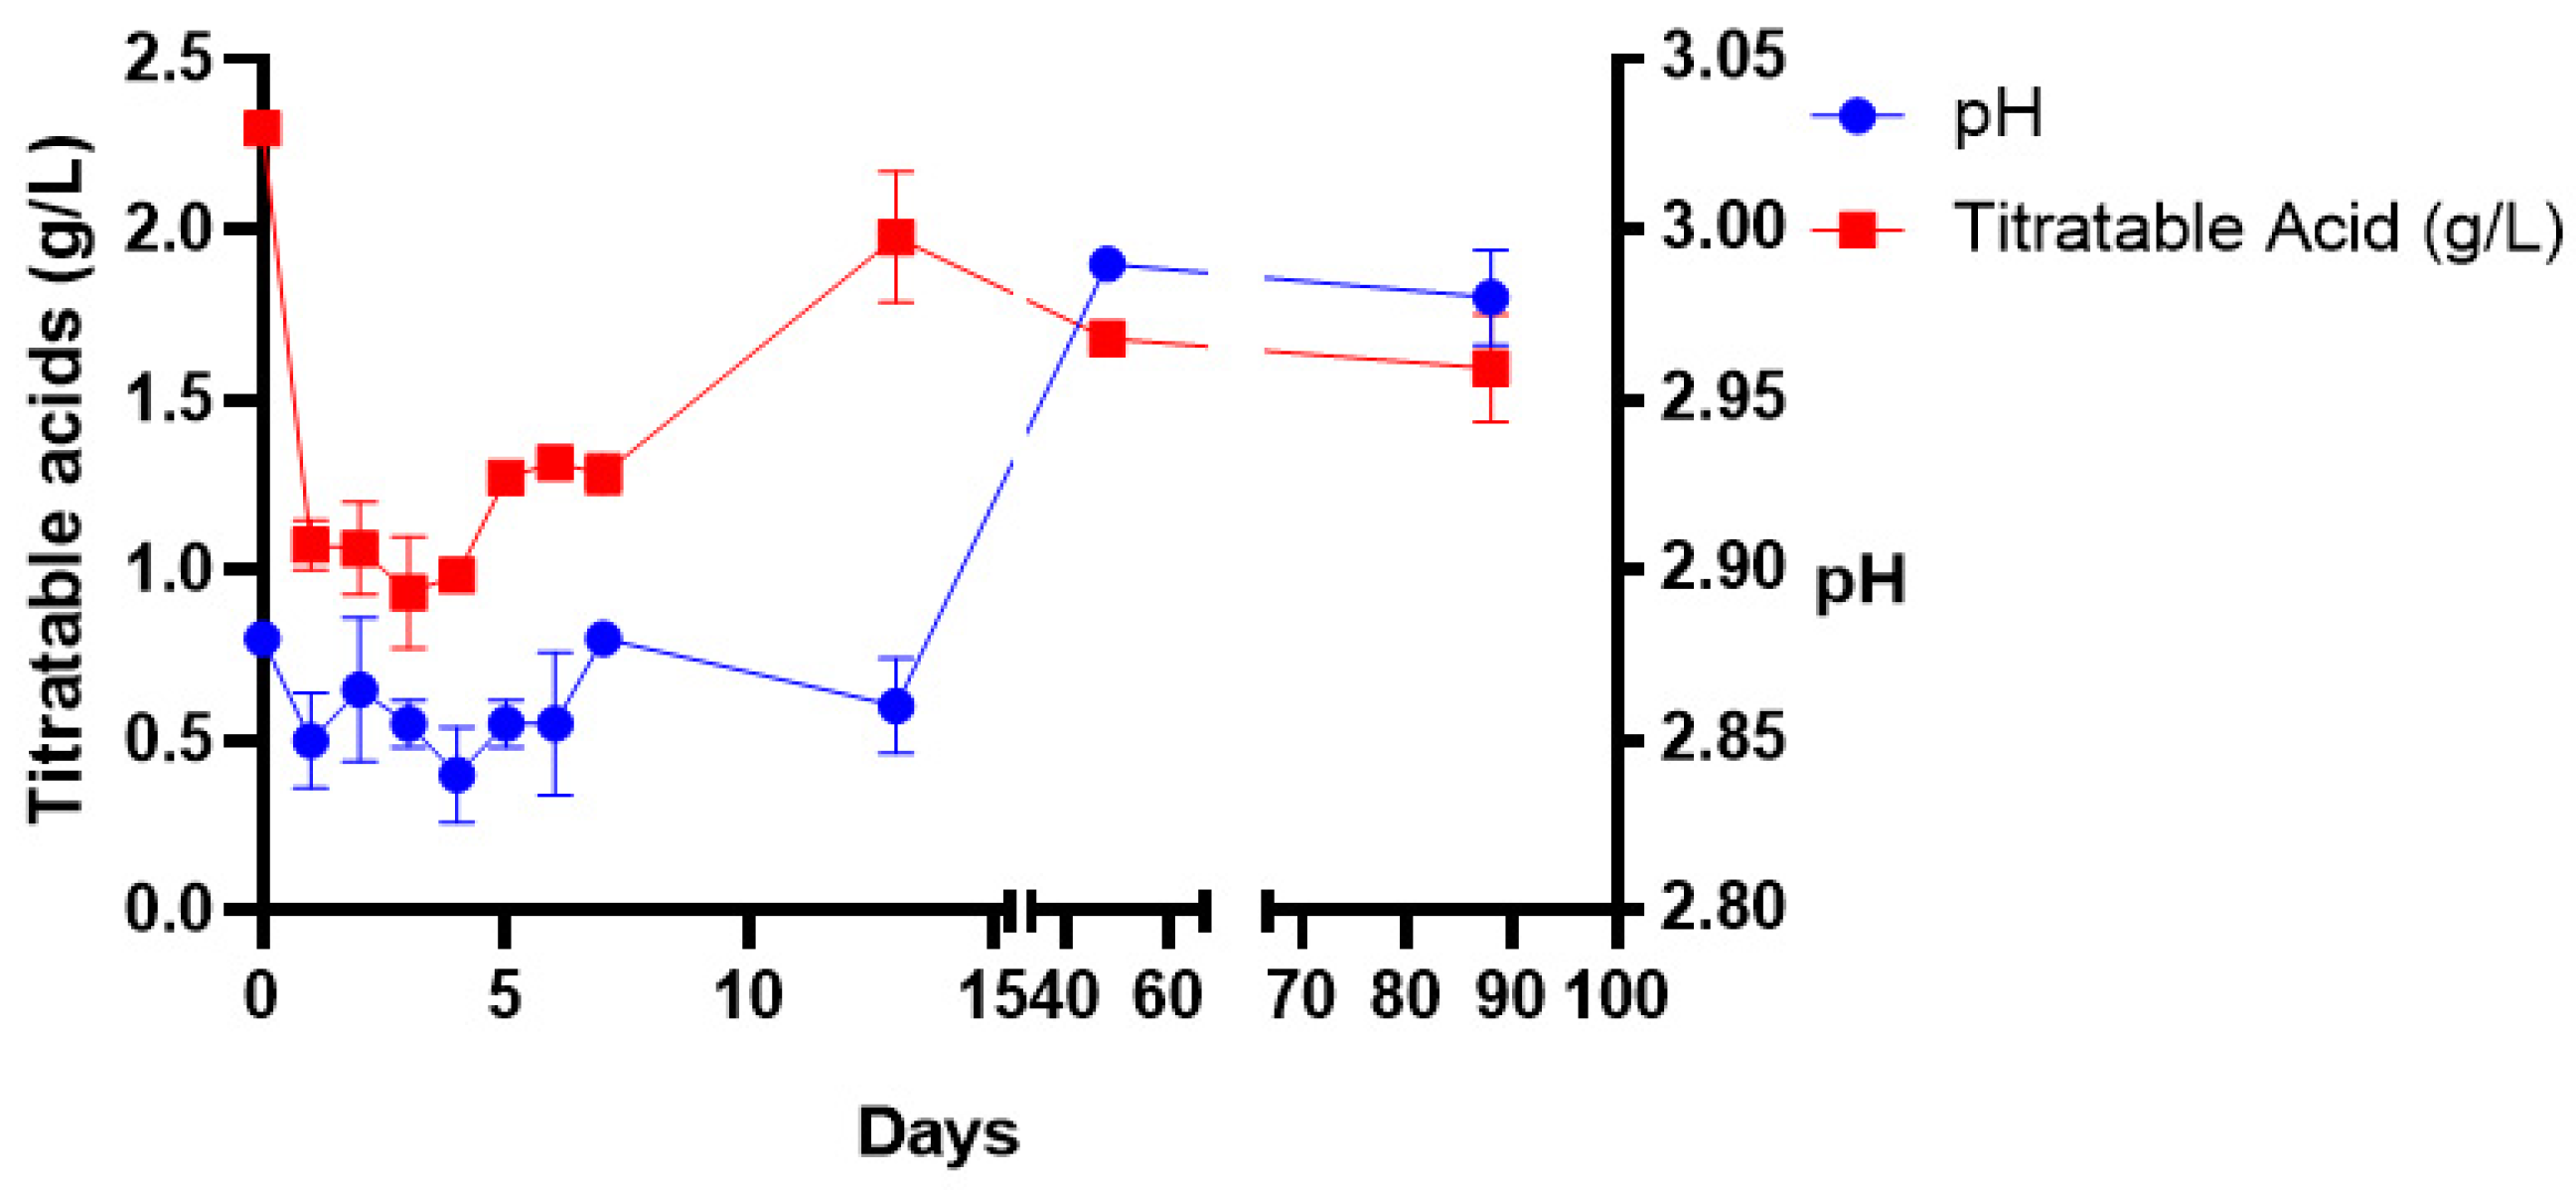
The amount of titratable acid decreased from 2.29 to 0.9 g/L between days 0 and 3 and increased to 1.98 g/L on the last day of fermentation (
Figure 3). The acid concentration remained constant during the storage stage and there was less microbial activity during this period. The wine pH ranged between 2.80 and 2.90 throughout primary fermentation. Basically, the pH stayed acidic throughout the wine production process.
A sudden decrease in tannin concentration from 0.33 to 0.02 mg/mL between days 0 and 2 was observed (
Figure 4). Notably, a gradual increase in tannin content was observed from days 5–13.
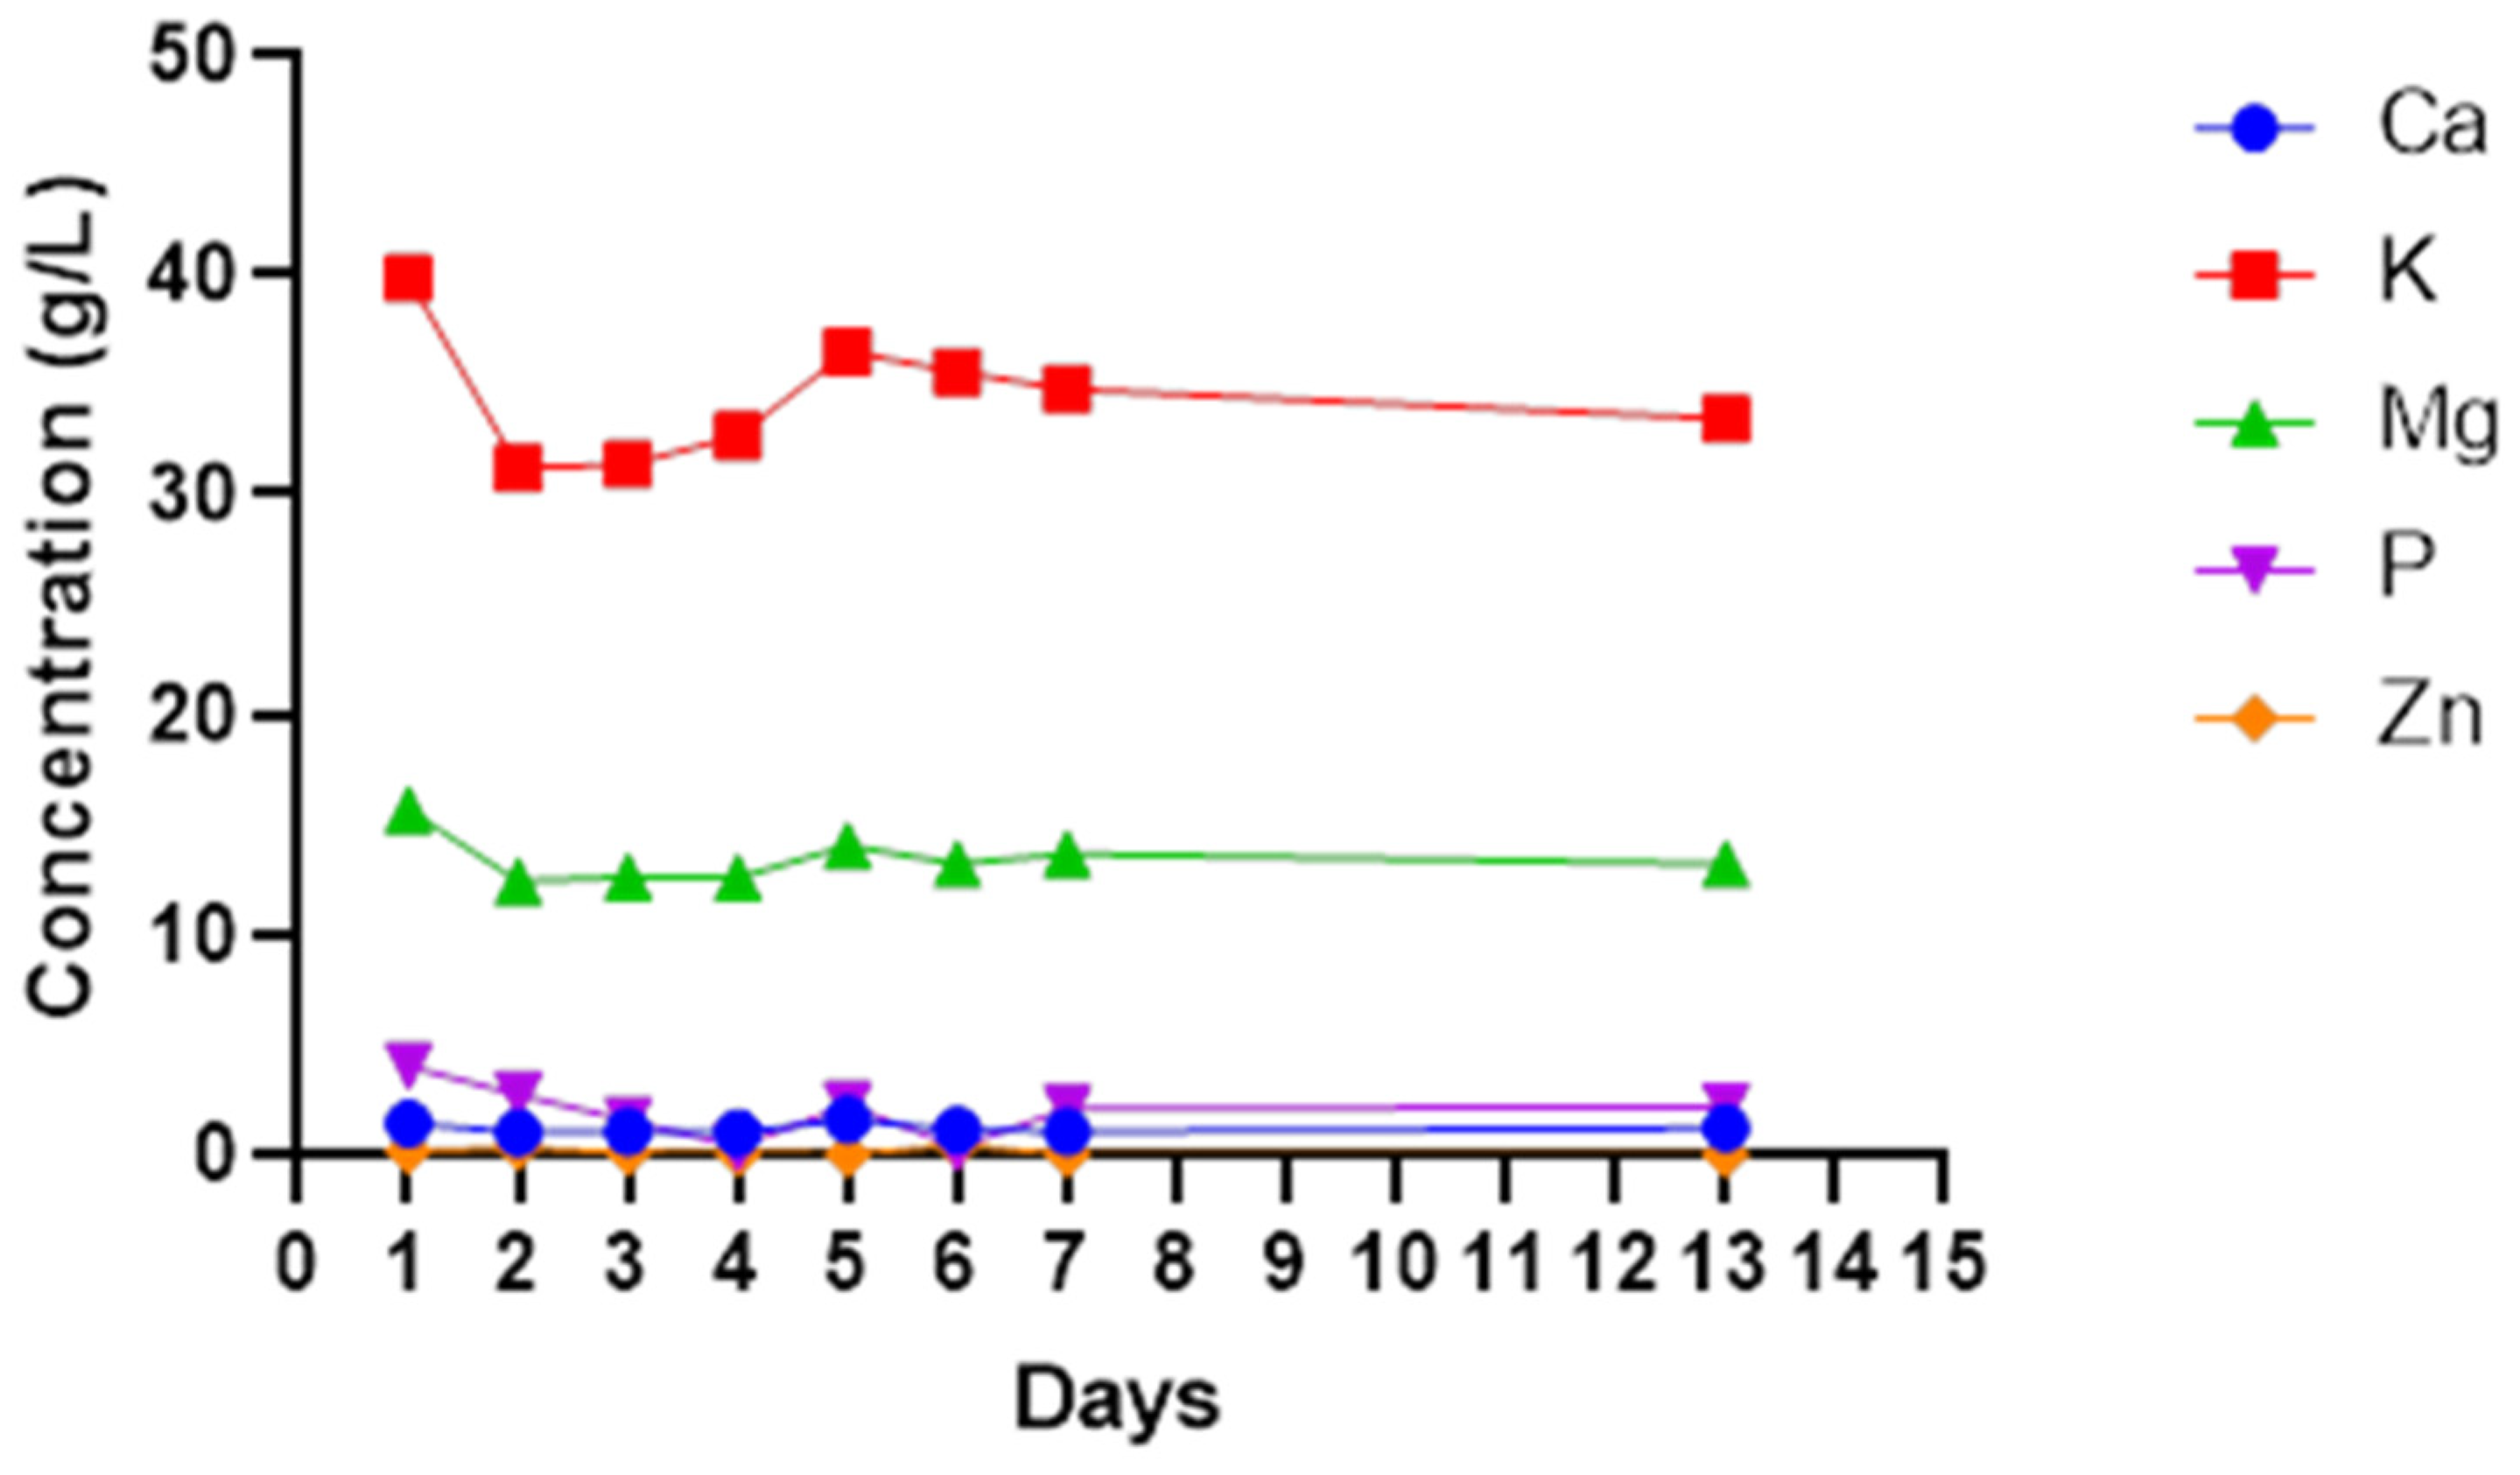
The most dominant minerals found in most wines include calcium, magnesium, potassium and phosphorus. However, sodium, iron, copper and zinc are present in smaller quantities. Potassium was the highest mineral in cactus pear wine ranging from 30 to 40 mg/L. Magnesium was the second highest mineral followed by calcium at a range of 12.4–15.7 mg/L and 4.5 mg/L to 11.01 mg/L, respectively. Zinc was the lowest mineral found ranging from 0.03 to 0.18 mg/L with phosphorus closer to zinc concentration (
Figure 5). All the minerals show a similar pattern. A non-significant (
p > 0.05) decrease in all minerals was observed from day 1 to day 2, and they also increased non-significantly (
p < 0.05) as fermentation continued up to the fifth day for calcium, potassium and magnesium. After day 5 of fermentation, all the minerals slightly decreased and remained constant until the end of fermentation.
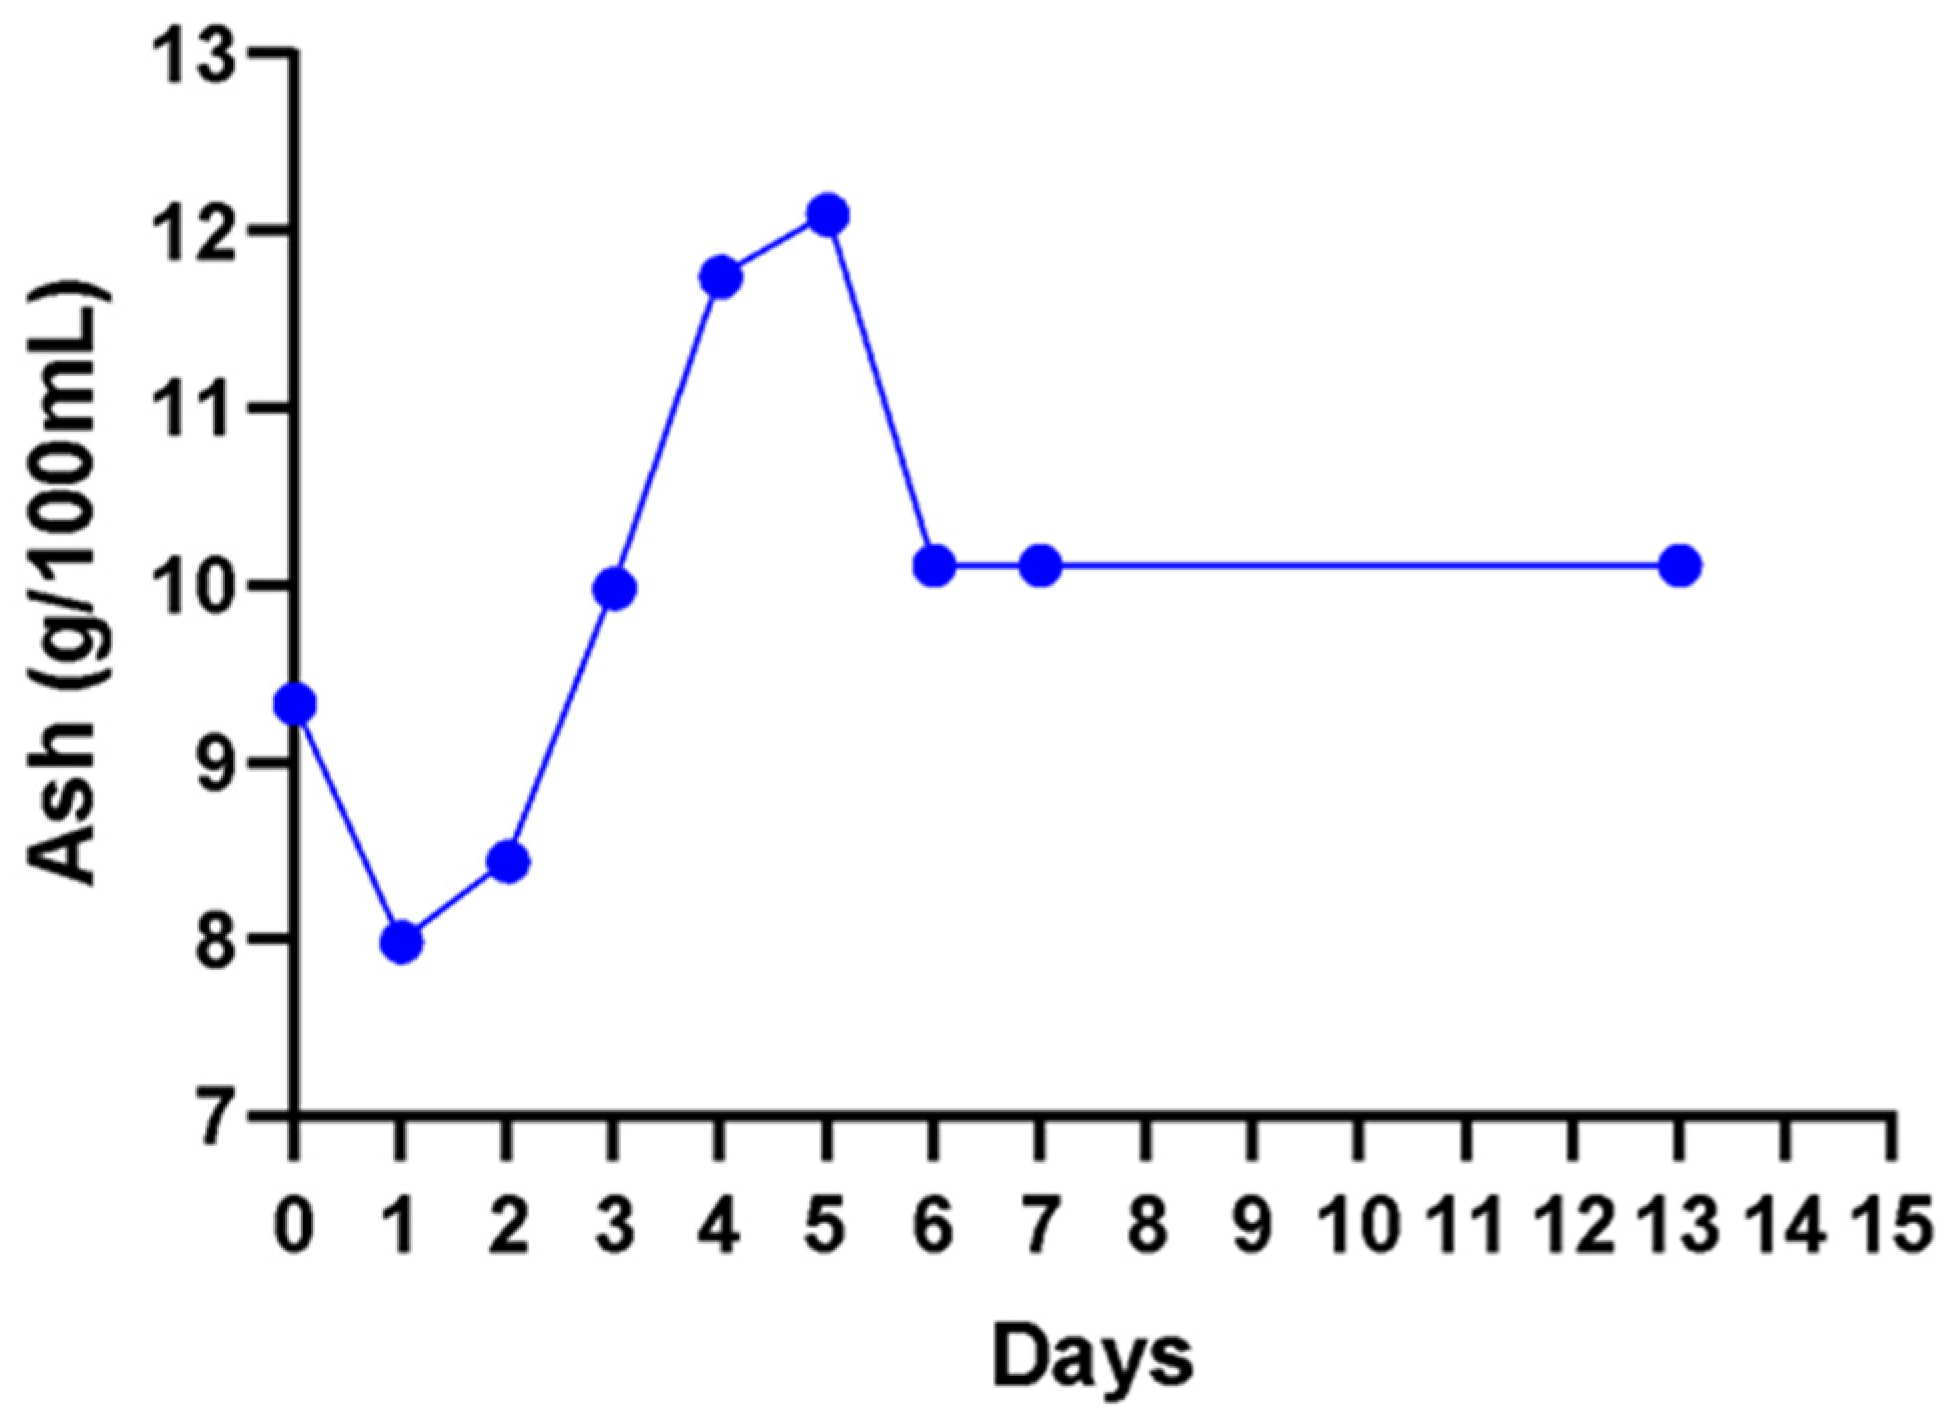
Ash content represents the sum of substances found in wines which remain after removal of all organic matter. A non-significant (
p < 0.05) increase in ash content was observed from day 2 to day 5 (
Figure 6). A non-significant (
p < 0.05) decrease from 12.1 g/100 mL to a stable concentration of 10.1 g/100 mL from day 6 to day 13 in the fermenting wine was observed.
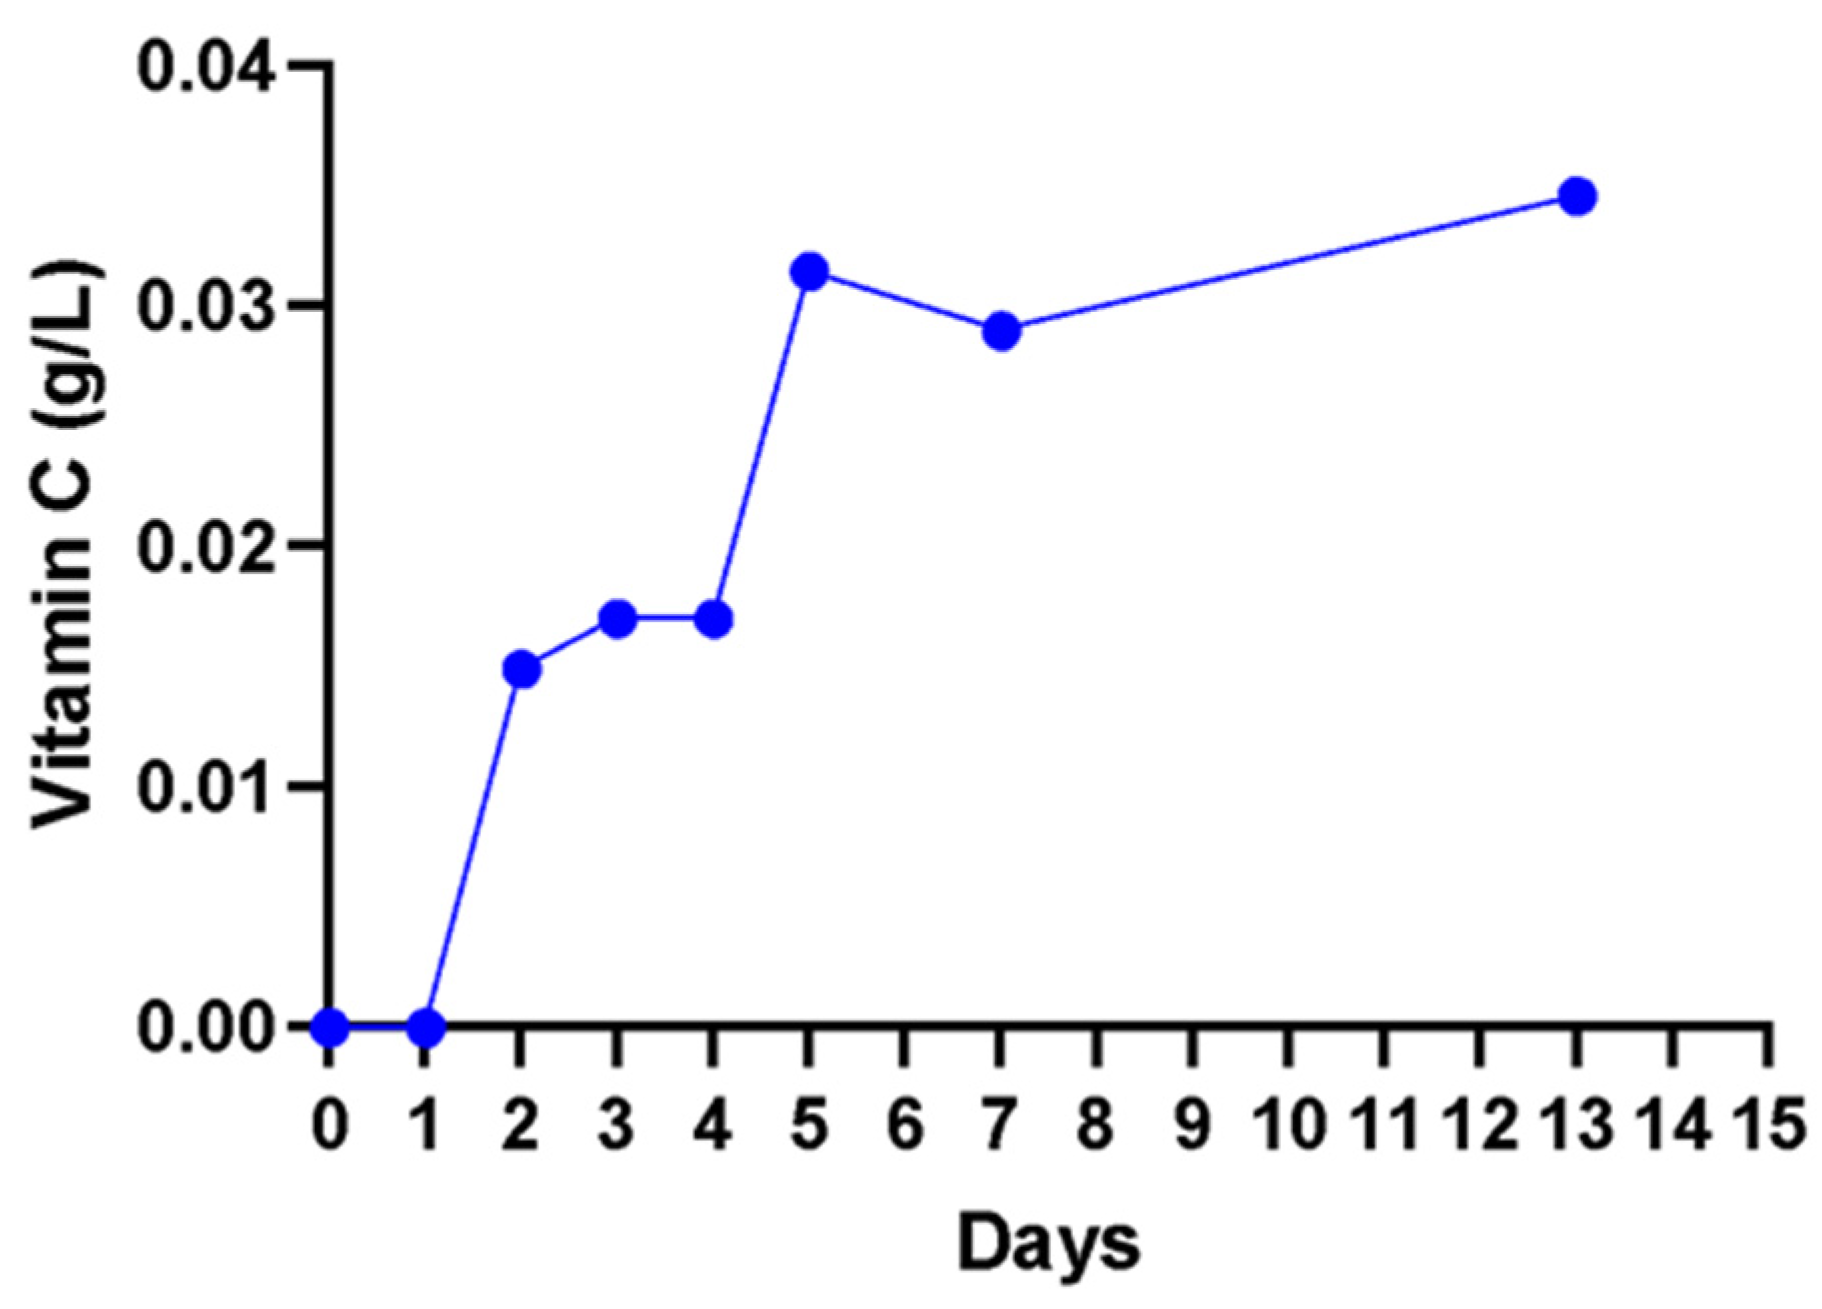
A non-significant (
p > 0. 05) increase in vitamin C content from 0.00 to 0.02 g/L in the first 3 days was observed, and a further increase to 0.04 g/L on day 13 was observed (
Figure 7). The method used detected only the free unbound ascorbic acid (vitamin C) in the solution.
4. Discussion
Resident micro-organisms found on the fruit are responsible for the fermentation process and undesirably the spoilage during spontaneous fermentation. Knowledge of the contributing micro-organisms will add value to the improvement of the fermentation process, specifically when selecting starter cultures for stable wine production. By studying the dynamics during spontaneous fermentation, the activities of micro-organisms responsible for fermentation and spoilage will also be understood. The aim of this study was to investigate the microbiological and chemical changes in cactus pear fruit juice during fermentation and storage. The micro-organisms responsible for fermenting the cactus pear fruit juice were isolated and characterised. There is currently a dearth of knowledge on wine fermentation and studies of the microbiological properties of cactus pear juice.
Various yeast and bacterial species were identified in the juice and fermented wine.
Bacillus species were the most dominant microbes throughout the fermentation process. This genus is commonly found in soil, and some species are responsible for plant growth [
25]. The
Bacillus species are mostly associated with spoilage in wine fermentation due to the organic acid metabolites that they produce [
26,
27]. The isolated
Bacillus species are reported to produce a wide range of enzymes, such as polygalacturonase and pectin esterase involved in smoothening and liquefying the fermenting juice on the last few days of fermentation [
28].
Bacillus spp. also produces high amounts of lactic acid under aerobic and anaerobic conditions [
27,
28], which can be more than 3.7 g/L of lactic acid with a glucose conversion yield of more than 49% [
29]. When in abundance, as in the instance of cactus pear juice and wine,
Bacillus spp. produces an acidic and bitter wine, which affects the wine quality and ultimately results in spoiling the wine [
26].
Yeast species were the second dominant microbes throughout the fermentation period. Yeast species are highly active in the presence of sugars. They convert simple sugars into ethanol and carbon dioxide during fermentation processes. The non-fermenting yeasts
Aureobasidium pullulans, Aurobasidium leucospermi and
Starmerella bacillaris were observed earlier in the fermentation process. These were previously reported elsewhere in spontaneous fermentation studies [
27].
Starmerella bacillaris is commonly isolated by winemakers from different fruits [
29]. The two strains of
Starmerella bacillaris were isolated from days 0 to 6 of fermentation because this species is known for its strong fructophilic character [
30]. Jolly et al. [
31] reported that
starmerella bacillaris showed greater variability in sugar consumption when compared with the
S. cerevisiae under the same conditions. The
Starmerella bacillaris species also contribute to the reduction in ethanol and acetic acid for the production of high-quality wines [
32]. Non-fermenting yeasts such as
Hanseniaspora guilliermondii,
Hanseniaspora opuntiae,
Hanseniaspora uvarum,
Pichia guilliermondii,
Pichia fermentans and
Pichia kluyveri were only observed during the early stages of fermentation from day 2, while
Saccharomyces was isolated at the mid and final stages of fermentation. Notably, all the non-
Saccharomyces yeasts dominated the early stages of fermentations and became undetectable soon after the commencement of alcoholic fermentation initiated by
Saccharomyces [
33] due to the rising ethanol concentration and depletion of oxygen and other nutrients [
24,
33]. It is a common phenomenon that the early fermentation stage in spontaneous fermentation is dominated by species with low fermentative capacity such as
Hanseniaspora,
Pichia and
Candida followed by the alcoholic fermentation stage, where the most ethanol-tolerant yeast,
Saccharomyces cerevisiae, dominates [
10]. In this study,
Pichia fermentans and
Saccharomyces cerevisiae were selected as the preferred microbes to produce a good-quality cactus pear wine. The non-
Saccharomyces species such as
Kloeckera,
Pichia,
Candida and
Hanseniaspora uvarum are currently used in industrial wine production using modern fermentor technology that supports the growth of non-fermenting yeasts [
10,
34]. On the contrary,
Starmerella bacillaris yeast was observed as the dominating non-fermenting yeast during the first stages of fermentation in this study. In recent years, most wineries have opted to use a mixed culture of non-
Saccharomyces and
Saccharomyces in a single batch fermentation process to enhance the specific characteristics of wine flavour and aroma complexity [
34,
35]. Notably, well-structured wines with rich flavours and full-body were produced from non-
Saccharomyces activities, and these are preferred by most consumers in the market [
36,
37].
Gluconobacter species, namely,
G. albidus,
G. kondonii and other
Gluconobacter sp. were isolated in the early stages of fermentation. Unsurprisingly, this species prefers sugar-rich environments. Expectedly, their numbers decrease to between zero and 10
2 cells/mL at the end of alcoholic fermentation [
38]. The acetic acid bacteria are commonly present in the latter stages of fermentation [
38,
39,
40] and are associated with the spoilage of wine during fermentation and maturation because they are known to oxidise ethanol into acetaldehyde and acetic acid. The presence of the acetic acid bacteria in fermenting wine can lead to the production of wines with complex aroma volatile compounds, which is defined as wine secondary aroma that is released during malolactic fermentation [
24,
41]. The challenge lies in understanding the microbial interaction during traditional fermentation to assess their participation in the development of a wine’s secondary aroma.
The flesh of cactus pear can harbour high numbers of lactic acid bacteria [
41,
42], while bacteria of concern such as
E. coli,
Salmonella spp. and
Listeria monocytogenes were not observed [
41,
43]. The dominant lactic acid bacteria in the wine-making process include species of the genera
Lactobacillus, Oenococcus, Pediococcus and
Leuconostoc and acetic acid bacteria, such as
Acetobacter, Gluconobacter/Gluconacetobacter.
The number of yeast cells was observed to increase from the start of fermentation until day two and slightly increased on day four. This pattern is commonly [
44] due to depleting nutrients, mainly the sugars. Similar patterns were observed with acetic and lactic acid bacteria, although the yeast count was higher due to its fast growth rate and optimal fermentative capacity. Although bacteria rely on yeasts for nutrients, interestingly,
Saccharomyces cerevisiae can suppress the growth of some species while supporting the growth of others during the alcoholic fermentation process [
44].
Wine sugars can affect the quality flavour, stability and sensory parameters of the wine. The starting sugar content of cactus pear juice, mainly glucose and fructose, were 144 g/L and 46.6 g/L, respectively. Gebremedhin et al. [
16] report similar higher reducing sugar levels in the cactus pear juice (160 g/L to 163 g/L) while Gurries et al. [
45] reported lower glucose concentration at 60 g/L and higher fructose concentration at 54 g/L from a red cactus pear. This points to variations that can emanate from geospatial attributes. Nonetheless, high sugar concentrations in wine encourage the growth of fermenting microbes, thus resulting in wines with a high alcohol content. The microbiota in this study achieved complete fermentation of the sugar. The residual sugar was less than 0.308 g/L on the last days of fermentation. The presence of microbes such as
Starmerella bacillaris and
Gluconobacter spp. The early stages of fermentation are known to be first in the hydrolysis of sugars [
32,
38,
39,
40], as evident from the rapid decline in fructose and glucose within the first three days of fermentation.
The ethanol concentration was observed to increase from the early days of fermentation and reached a maximum concentration of 60.9 g/L (6.09 %
w/
v) on the fifth day but declined to a final concentration of 13.26 g/L (1.326%
w/
v).
Gluconobacter spp. were isolated in this study, and these belong to the acetic acid bacteria known to oxidise ethanol to acetaldehyde and acetic acid for their survival in the late stage of fermentation. In comparison, Gebremedhin et al. [
17] achieved a higher ethanol content in cactus pear wine, which ranged between 7 and 8.5 (%
w/
v). The alcohol content contributes to the character of the wine, which leads to the production of different wine styles. Notably, wine styles with high alcohol concentration have gained high consumer acceptance and preference [
46].
The presence and dominance of acetic acid bacteria in the early stages of fermentation could explain the low pH of the juice and fermenting wine which was at 2.88 and the upper level was at 2.98 during the fermentation period. Gurrier et al. [
47] asserted that a pH level below 3.5 in fermenting wines is commonly dominated by acetic acid bacteria. Other researchers [
44,
48] have reported a pH value of 5.5 in the cactus pear juice, which is higher than the pH of 2.9 recorded in this study. Another study documented lower pH values of between 3.9 and 4.2 [
17]. Lower pH values are possible due to the presence of natural organic acids such as citric acid, tartaric acid, succinic acid, tartaric, malic, citric and ascorbic acid in the ripening cactus pear fruit [
49]. These are commonly present in high concentrations. The fluctuation of pH values in wine production is facilitated by microbes responding to acid stress by preventing a damaging drop in intracellular pH below a threshold level of pH ranging from 2.9 to 4 [
50,
51].
Although acids can spoil the wine when present in high concentrations above the taste threshold (0.3–0.5 g/L), the balanced acidity of wine is important for the quality and taste of wines [
52]. The cactus juice contained 2.29 g/L titratable acidity, which was higher than the 1.2 g/L reported by Ayed and Hamdi [
44] and less than the 3.1 g/L–4.3 g/L of six cactus pear juices reported by Gebremedhin et al. [
17]. The starting fruit’s chemical contents are affected by the genotypes, place of origin, type of soil, climate (rain falls) and harvesting time [
53,
54], hence this observation. The noticeable drop in titratable acidity to 0.9 g/L during fermentation and the later increase to the final concentration of 1.59 g/L during storage was not congruent with observations in other studies where the final concentration ranged between 6 g/L and 7.4 g/L [
17,
44,
48].
Tannins are the most abundant phenolics found on the skin and seeds of the wine- producing fruits [
23]. The tannin content in this study ranged from 0.014 mg/mL to 0.034 mg/mL, which is lower than the 30–1895 mg/L reported in red wine by Harbertson et al. [
55] and the 0.11 mg/mL–0.72 mg/mL range reported by Gebremedhin et al. [
17] in six fermented cactus wines. The observed decrease in the tannin concentration during the fermentation process could be attributed to the activity of lactic acid bacteria known to effectively remove tannins in the fruits [
18,
56].
The fruits used to produce wines naturally come with mineral composition, which varies from one region to another [
57]. Mineral content can be lost through precipitation and crystallisation during fermentation. The crystallised material will settle out with dead cells as sediments. Some minerals are used up by microbes for growth. These aspects may explain the sudden decrease in all the tested minerals on day 1 and day 2. Potassium and magnesium were the most abundant minerals at concentrations between 30 and 40 mg/L and 12.4 and 15.7 mg/L, respectively. Mabotja et al. [
58] reported the high concentration of potassium in the cactus pear Direkteur at 4980 mg/100 g DW and 4146.67 mg/ 100 g DW in cultivar Muscatei. The lower concentrations were reported by Gurries et al. [
44] for other minerals at 2.9 ± 0.3 mg/L, 0.4 ± 0.2 mg/L and 1.2 ± 0.3 mg/L for Mn
2+, Zn
2+ and Fe
2+, respectively. The retention of minerals at the same level throughout the fermentation gives credence to the observed high ash content. This could infer that the other elements that were not investigated in this study are also not depleted during cactus wine fermentation.
Vitamin C (ascorbic acid) is considered one of the critical antioxidants with free radical scavenging activity in humans [
25,
33]. Cactus pear is reported to contain a high concentration of vitamin C compared to other fruits such as apples, pears, grapes and bananas [
59,
60]. Other studies on grape wine fermentation similarly observed an increase in vitamin C concentration during the fermentation process [
61]. However, the wine produced from cactus pear had a relatively lower vitamin C concentration at 0.035 g/L when compared to red grape wine at 25.4–26.12 ± 1.62 mg/100 mL [
19].


