Article

Influence of Soil Management on the Red Grapevine (Vitis vinifera L.) Mencía Must Amino Acid Composition and Wine Volatile and Sensory Profiles in a Humid Region

by
Yolanda Bouzas-Cid
1,2,
Emiliano Trigo-Córdoba
1,
Ignacio Orriols
1,
Elena Falqué
2 and
José Manuel Mirás-Avalos
1,3,*
1
Estación de Viticultura e Enoloxía de Galicia (EVEGA-INGACAL), Ponte San Clodio s/n, Leiro, 32428 Ourense, Spain
2
Depto. Química Analítica, Facultad de Ciencias, Universidade de Vigo, As Lagoas s/n, 32004 Ourense, Spain
3
Dpto. Ingeniería Agroforestal, Escola Politécnica Superior de Enxeñaría, Universidade de Santiago de Compostela, GI-1716, Campus Universitario s/n, 27002 Lugo, Spain
*
Author to whom correspondence should be addressed.
Beverages 2018, 4(4), 76; https://doi.org/10.3390/beverages4040076
Submission received: 25 September 2018 / Revised: 10 October 2018 / Accepted: 12 October 2018 / Published: 15 October 2018
(This article belongs to the Special Issue Viticulture for Wine Production)

Abstract

:
Adopting cover crops for vineyard soil management can provide several benefits, including soil protection, reductions in vine vigor, and enhancements in berry composition. However, the effects of this practice on wine aroma have seldom been addressed. This study aimed to determine the influence of different cover crops and soil tillage on the must and wine amino acid composition and wine volatile compounds of the red cultivar, ‘Mencía’ (Vitis vinifera L.), grown in Northwest Spain. Treatments consisted of soil tillage (ST), native vegetation (NV), English ryegrass (ER), and subterranean clover (SC). Cover crops did not alter the macro-constituents of musts; however, musts from NV and SC tended to lower concentrations of amino acids. Some color attributes of wines were influenced by cover crops in the vineyard. Methanol and trans-linalool oxide (pyran) concentrations in wines were significantly affected by soil management. Professional tasters encountered differences in visual, aroma, and palate descriptors of wines depending on the treatment imposed in the vineyard. These alterations in sensory properties seemed to obey to slight modifications of wine chemical characteristics due to vineyard soil management. According to these results, cover crops might be useful for modulating wine aroma in humid climates.

1. Introduction

Aroma is one of the main attributes of wines and results from the complex balance of the concentrations of a high number of volatile compounds with distinct characteristics and intensities [1]. These volatiles accumulate in grapes during ripening and they are affected by temperature and water availability that, among other factors, can be affected by vineyard management practices [1,2]. Soil management in vineyards has multiple goals that encompass improving weed management, soil conservation, nutrient and water management, enhanced biodiversity for pest control, and reduce the availability of soil resources to control vine vigor [2,3,4]. Since these aspects are important to vine growth, soil management has relevant implications for wine quality [5,6,7].
One of the techniques for managing vineyard soils is the use of cover crops, although their application has been limited due to the concern of excessive water and nutrient competition between these crops and the vines [8,9]. However, a great number of environmental and agronomic benefits can be expected from cover crops in these agroecosystems, including soil protection against erosion [10], improvements in soil properties [11], reductions in vine vigor [12], etc. Despite these advantages, vineyards are usually managed through tillage in the inter-row and herbicides in the vine row [13].
Soil management can contribute to alter the balance between grapevine (Vitis vinifera L.) vegetative growth and yield; thereby, modifying temperature and solar irradiation in the cluster zone [14]. Moreover, the use of cover crops as a means of soil management can reduce water availability for grapevines [9]. Furthermore, wine aroma depends on must quality, which is influenced by nitrogen composition that affects fermentation kinetics and the production of ethanol, glycerol, and both aroma and spoilage compounds [15]. Among the nitrogen compounds present in grapes, amino acids are related to wine aroma compounds [16]. Vineyard soil management can alter the concentrations of these amino acids in grapes and musts [17], although some studies reported no effects on the yeast assimilable nitrogen composition [18].
Few studies have addressed the effects that soil management through cover crops may exert on wine aroma and they reached contrasting results [19,20]. For instance, establishing cover crops in a Cabernet Sauvignon vineyard increased the concentrations of wine volatile compounds when compared to soil tillage [19]. In contrast, Negroamaro wines coming from the soil tillage treatment had greater concentrations of aroma compounds than those coming from a cover crop treatment [20]. These discrepancies can be explained by the different climate and soil conditions and the different varieties considered in both studies. Therefore, further research on other grapevine varieties and vine growing regions is needed.
In Galicia (North-West Spain), favorable temperatures and soil water availability during springtime enable a fast canopy establishment in vineyards, which may lead to unbalanced vines with high vegetative growth. In these situations, the employment of cover crops as a soil management system can reduce this excessive vegetative growth [21]. In this region, the main cultivar grown for red wine production is Mencía and the use of cover crops for floor management in these vineyards could help to achieve a better balance between vegetative growth and yield, as well as enhance the color potential of this variety. Although the chemical and phenolic profiles of Mencía wines have been previously characterized [22,23,24,25], the effect of soil management systems on Mencía wine aroma has not been previously determined.
In this context, the aims of the current study were to assess the effects of establishing permanent cover crops for vineyard soil management on the amino acid composition of musts and wines, and the aromatic and sensory profiles of wines from the red grapevine cultivar, Mencía, grown under an Atlantic climate during three consecutive years.

2. Materials and Methods

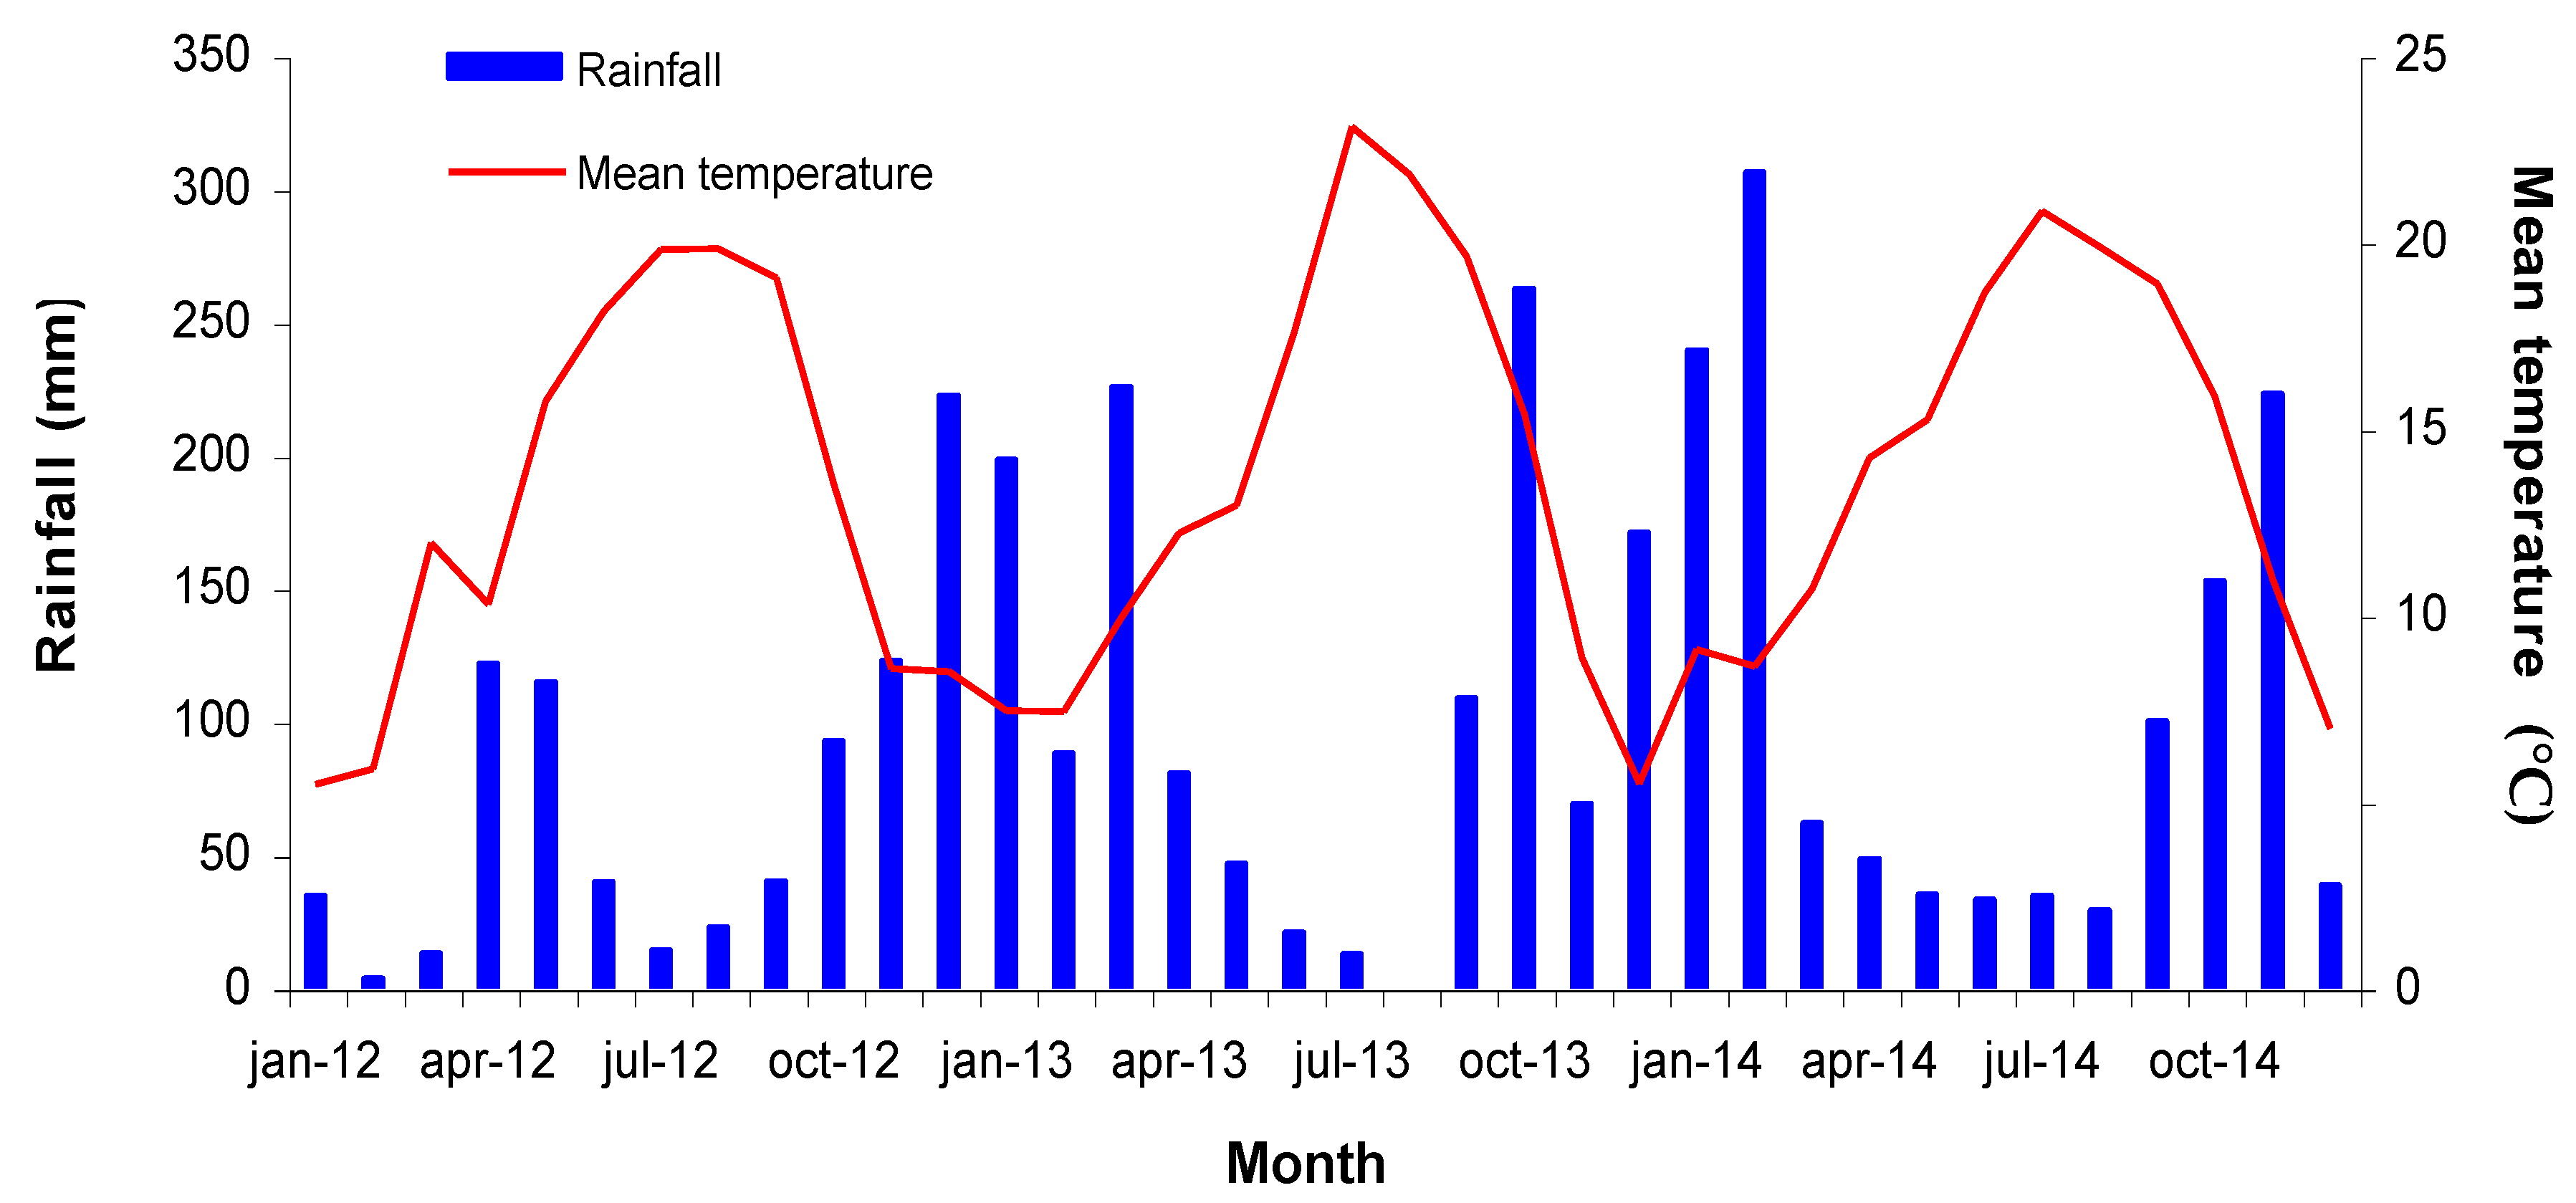
2.1. Description of the Study Site

The current study was conducted in a 0.1 ha rain-fed vineyard (Vitis vinifera L. cv. Mencía) located in Leiro (42°21.6′ N, 8°7.02′ W, elevation 115 m), Ourense, North-West Spain, within the Ribeiro Designation of Origin. The vineyard was planted in 2007, with vines grafted onto 196-17C rootstock and trained to a vertical trellis on a single cordon system (10–12 buds per vine). Rows were East-West oriented; vines were spaced 1.25 m between plants and 2.3 m between rows. Soil at the site is sandy-loamy, acidic, and with a high organic matter content. Soil depth is about 1 m and available water capacity is, approximately, 100 mm m−1. Climate is temperate, humid with cool nights [26], with an average annual rainfall of 900 mm, of which about 70% falls during the dormant period. Figure 1 displays the dynamics of the mean air temperature and monthly rainfall for the study site over the three years considered.

2.2. Experimental Design

The experiment was conducted over three consecutive years: 2012, 2013, and 2014. Four treatments were established in a randomized block design with three replications. Each replicate consisted of three rows, with seven vines per row. The five vines in the center of the middle row were used for sampling. The treatments consisted of four different soil management systems:
  • Soil tillage (ST);
  • native vegetation (NV);
  • English ryegrass (Lolium perenne L.) sown at 40 kg ha−1 (ER); and
  • subterranean clover (Trifolium subterraneum L.) sown at 30 kg ha−1 (SC).
The three cover crop treatments were mowed three times per year. The ST treatment was kept with no vegetation through cultivation. With the exception of soil management, agricultural practices (such as pest and disease control, canopy management, etc.) were the same for all treatments. Further information and data on physiological, vegetative growth, and yield variables can be found in a previous report [21].

2.3. Sampling and Winemaking

The different treatments were harvested manually on the same day. Winemaking was performed separately on samples of about 35 kg per treatment. Due to limitations on grape production and fermentation tanks, and to fulfill the requirements of a wider project, only one vinification per treatment was carried out each year, by mixing the grapes from the three replications from each treatment.
Grapes were destemmed mechanically and put into stainless steel tanks. A replicated sample from each treatment was collected. During grape processing, 50 mg L−1 of SO2 were added to the mass, which was fermented at room temperature (22–24 °C). Excellence XR (Lamothe-Abiet, Bordeaux, France) yeast was added following the producer’s instructions. Daily, wine lots were punched down until alcoholic fermentation ended (8 days). Then, lots were pressed, racked into new tanks, and kept at room temperature for two days. Then, wines were stabilized at 4 °C in a chamber for one month, approximately. After this period, wines were filtered, bottled, and stored.

2.4. Basic Parameters of Musts and Wines

The general parameters of Mencía musts (total soluble solids, pH, total acidity, tartaric and malic acid concentrations) and wines (alcohol content, pH, total acidity, volatile acidity, dry extract, and tartaric and malic acid concentrations) were determined by Fourier transform infrared spectrometry (FTIR) using a WineScan FT120 analyzer (FOSS Electric, Barcelona, Spain) calibrated according to the official methods [27].
Wine color attributes, including color intensity, color hue, total polyphenol index (TPI), total anthocyanins, and total tannins contents, were determined using the methodology described by Zamora [28] using an ultraviolet-visible Helios Zeta spectrophotometer (Thermo Fisher Scientific Ltd., Waltham, MA, USA). Absorbances at 420 nm, 520 nm, and 620 nm were determined and color intensity was computed by summing these values, whereas color hue was calculated as the ration between absorbances at 420 nm over that at 520 nm and expressed in percentage.

2.5. Analytical Methods

2.5.1. Chemical Reagents

A Milli-Q equipment (Millipore, Bedford, MA, USA) was used for obtaining ultra-pure water. Amino acid solutions were prepared using standards from Acros Organics (Geel, Belgium). Acetronitrile and methanol were from Scharlau (Sentmenat, Spain), whereas ammonium chloride was from Merck (Darmstadt, Germany).
Dichloromethane, n-pentane, and anhydrous sodium sulphate (Scharlau, Sentmenat, Spain) were used for the extraction of volatile compounds. The internal standards (Merck, Madrid, Spain) were 4-methyl-2-pentanol for major volatile compounds; 4-decanol for terpenes and C6 alcohols; and 1-heptanol for volatile fatty acids, ethyl esters, and acetates of higher alcohols. All the standards were prepared in 50% hydro-alcoholic solutions.

2.5.2. Quantification of Amino Acids in Musts and Wines

A method based on a derivatization reaction in a basic methanolic medium and high performance liquid chromatography (HPLC) allowed us to determine the concentrations of amino acids present in musts and wines [29]. An Agilent 1100 series equipment (Agilent Technologies, Palo Alto, CA, USA) was used for performing the HPLC determinations. Chromatographic separation of amino acids was made in a Zorbax Eclipse AAA column (C18), with 5 μm particle size (150 mm × 4.6 mm, Agilent Technologies, Palo Alto, CA, USA) thermostated at 22 °C. Extraction method, reagents, and elution conditions are described elsewhere [30]. Determinations were performed in triplicate.

2.5.3. Determination of Volatile Compounds

Concentrations of wine volatiles were determined by gas chromatography (GC) as described elsewhere [30,31], thus methods are outlined briefly.
Major volatile compounds were quantified by direct injection using a 7890A gas chromatograph (Agilent Technologies, Palo Alto, CA, USA) after adding 50 μL of internal standard (5 g L−1 of 4-methyl-2-pentanol in 50% ethanol) to 50 mL of wine [30,31].
Terpenes, C6 alcohols, volatile fatty acids, ethyl esters of fatty acids, and acetates of higher alcohols were extracted by modifying an established protocol [32] consisting of the addition of internal standards to the wine sample, passing this mixture through a cartridge (Isolute ENV + SPE, Biotage, Uppsala, Sweden), cleaning the sample, adding n-pentane, and injecting the extract into a chromatograph following previously published conditions [30,31].
The National Institute of Standards and Technology (NIST) Mass Spectral library allowed us to identify volatiles by comparing their mass spectra and retention times with those of pure standard compounds. Calibration curves for each single compound were built for quantifying volatiles as a function of the internal standards. These curves showed high regression coefficients, indicating excellent linearity. All determinations were performed in triplicate.

2.5.4. Odor Activity Values

The contribution of a given volatile compound to the wine aroma was assessed by the calculation of its odor activity value (OAV). This indicator is the ratio between the concentration of an individual compound and its perception threshold [33,34]. Theoretically, this value should be greater than one; however, due to synergic effects among different substances, those compounds with values greater than 0.2 can be active aromas [35]. Nevertheless, we used those compounds with an OAV > 0.5 for data analysis.

2.6. Sensory Evaluation

A panel of nine judges composed of oenologists and technicians with experience in tasting Mencía wines participated in the sensory evaluation of the wines from the current experiment. This panel consisted of five males and four females between 30 and 64 years old. A scorecard including 26 descriptors (6 for color, 10 for aroma, and 10 for palate) was used. The descriptors were chosen for Galician red wines and were scored from 0 (not present) to 9 (most intense) [36]. Furthermore, judges scored the global quality of each wine. The wines were coded and presented arbitrarily to the panel in clear tulip-shaped glasses. The tasting sessions were held in April or May the year after the vintage. Data were processed with Big Sensory Soft 1.02 (Centro Studi Assagiatori, Brescia, Italy).

2.7. Statistical Analysis

As there were no replicates, the different years were considered as ‘temporal replicates’ and the statistical significance between soil management strategies was evaluated using analysis of variance When needed, means were separated using the Tukey’s test. Principal Component Analysis (PCA) was carried out for separating must samples according to the concentrations of the eight most abundant amino acids. In addition, PCA allowed us to correlate aromatic descriptors from the sensory evaluation with those volatile compounds that appeared in the wines at concentrations at least 0.5 times their corresponding OAV. Statistical tests were performed using R software v3.4.1 [37] (R Core Team, Vienna, Austria).

3. Results and Discussion

3.1. Physiological, Vegetative Growth, and Yield Performance

A previous work reported data on grapevine performance under the four management treatments considered in the current study and for the same years [21]. Therefore, it is interesting to summarize these findings, as they may explain differences in must amino acids and wine volatiles.
Stem water potential at midday was more negative in NV, causing significant reductions in leaf stomatal conductance on certain dates, especially in 2013. This is a common response in field studies comparing grapevines growing with cover crops against a tilled soil in the inter-row [38]. In contrast, vines in SC showed less negative stem water potential values, likely due to a reduced leaf surface that caused a lower transpiration [39].
The competition exerted by cover crops produced significant reductions in leaf surface and pruning and berry weight; whereas soil management did not affect yield and cluster weight [21]. The high water supply by rainfall, which was enough to fulfill the water requirements of both the grapevines and the cover crops, can explain these results. Moreover, these findings were in accordance with those observed in regions with a similar climate to the one studied here [6,8,40].

3.2. General Attributes of Musts and Wines

As pointed out above, the competition between grapevines and cover crops was not severe and this explains the absence of significant differences among treatments for must compositional attributes (Table 1). Despite the fact that cover crops reduced berry size [21], berries from the cover crop treatments did not accumulate more sugars (Table 1). This is likely caused by a greater leaf surface in vines from ST that compensated the greater berry size in this treatment, as reported for other regions with similar climate conditions [8,40].
Although not significant, cover crop treatments tended to increase total acidity in Mencía musts, as previously reported for Cabernet Franc [41]. This trend is more evident in the case of the SC treatment, where musts had lower total soluble solids contents and greater total acidities than the rest of the studied treatments. Finally, organic acids contents were very similar for all treatments, as observed for Tempranillo in La Rioja [13]. Therefore, our results are in accordance with previous indications that soil management did not affect grape macro-constituents at maturity [19,42].
Wine composition was determined at the same time as the tasting sessions, five months after bottling, and soil management did not cause significant differences for any of the wine general attributes (Table 2), in accordance with the observations in the musts. However, cover crop treatments significantly altered color intensity, color hue, and the concentration of total tannins (Table 2). Wines from ER showed lower color hue values when compared to those from the other treatments, except for those from SC (Table 2).

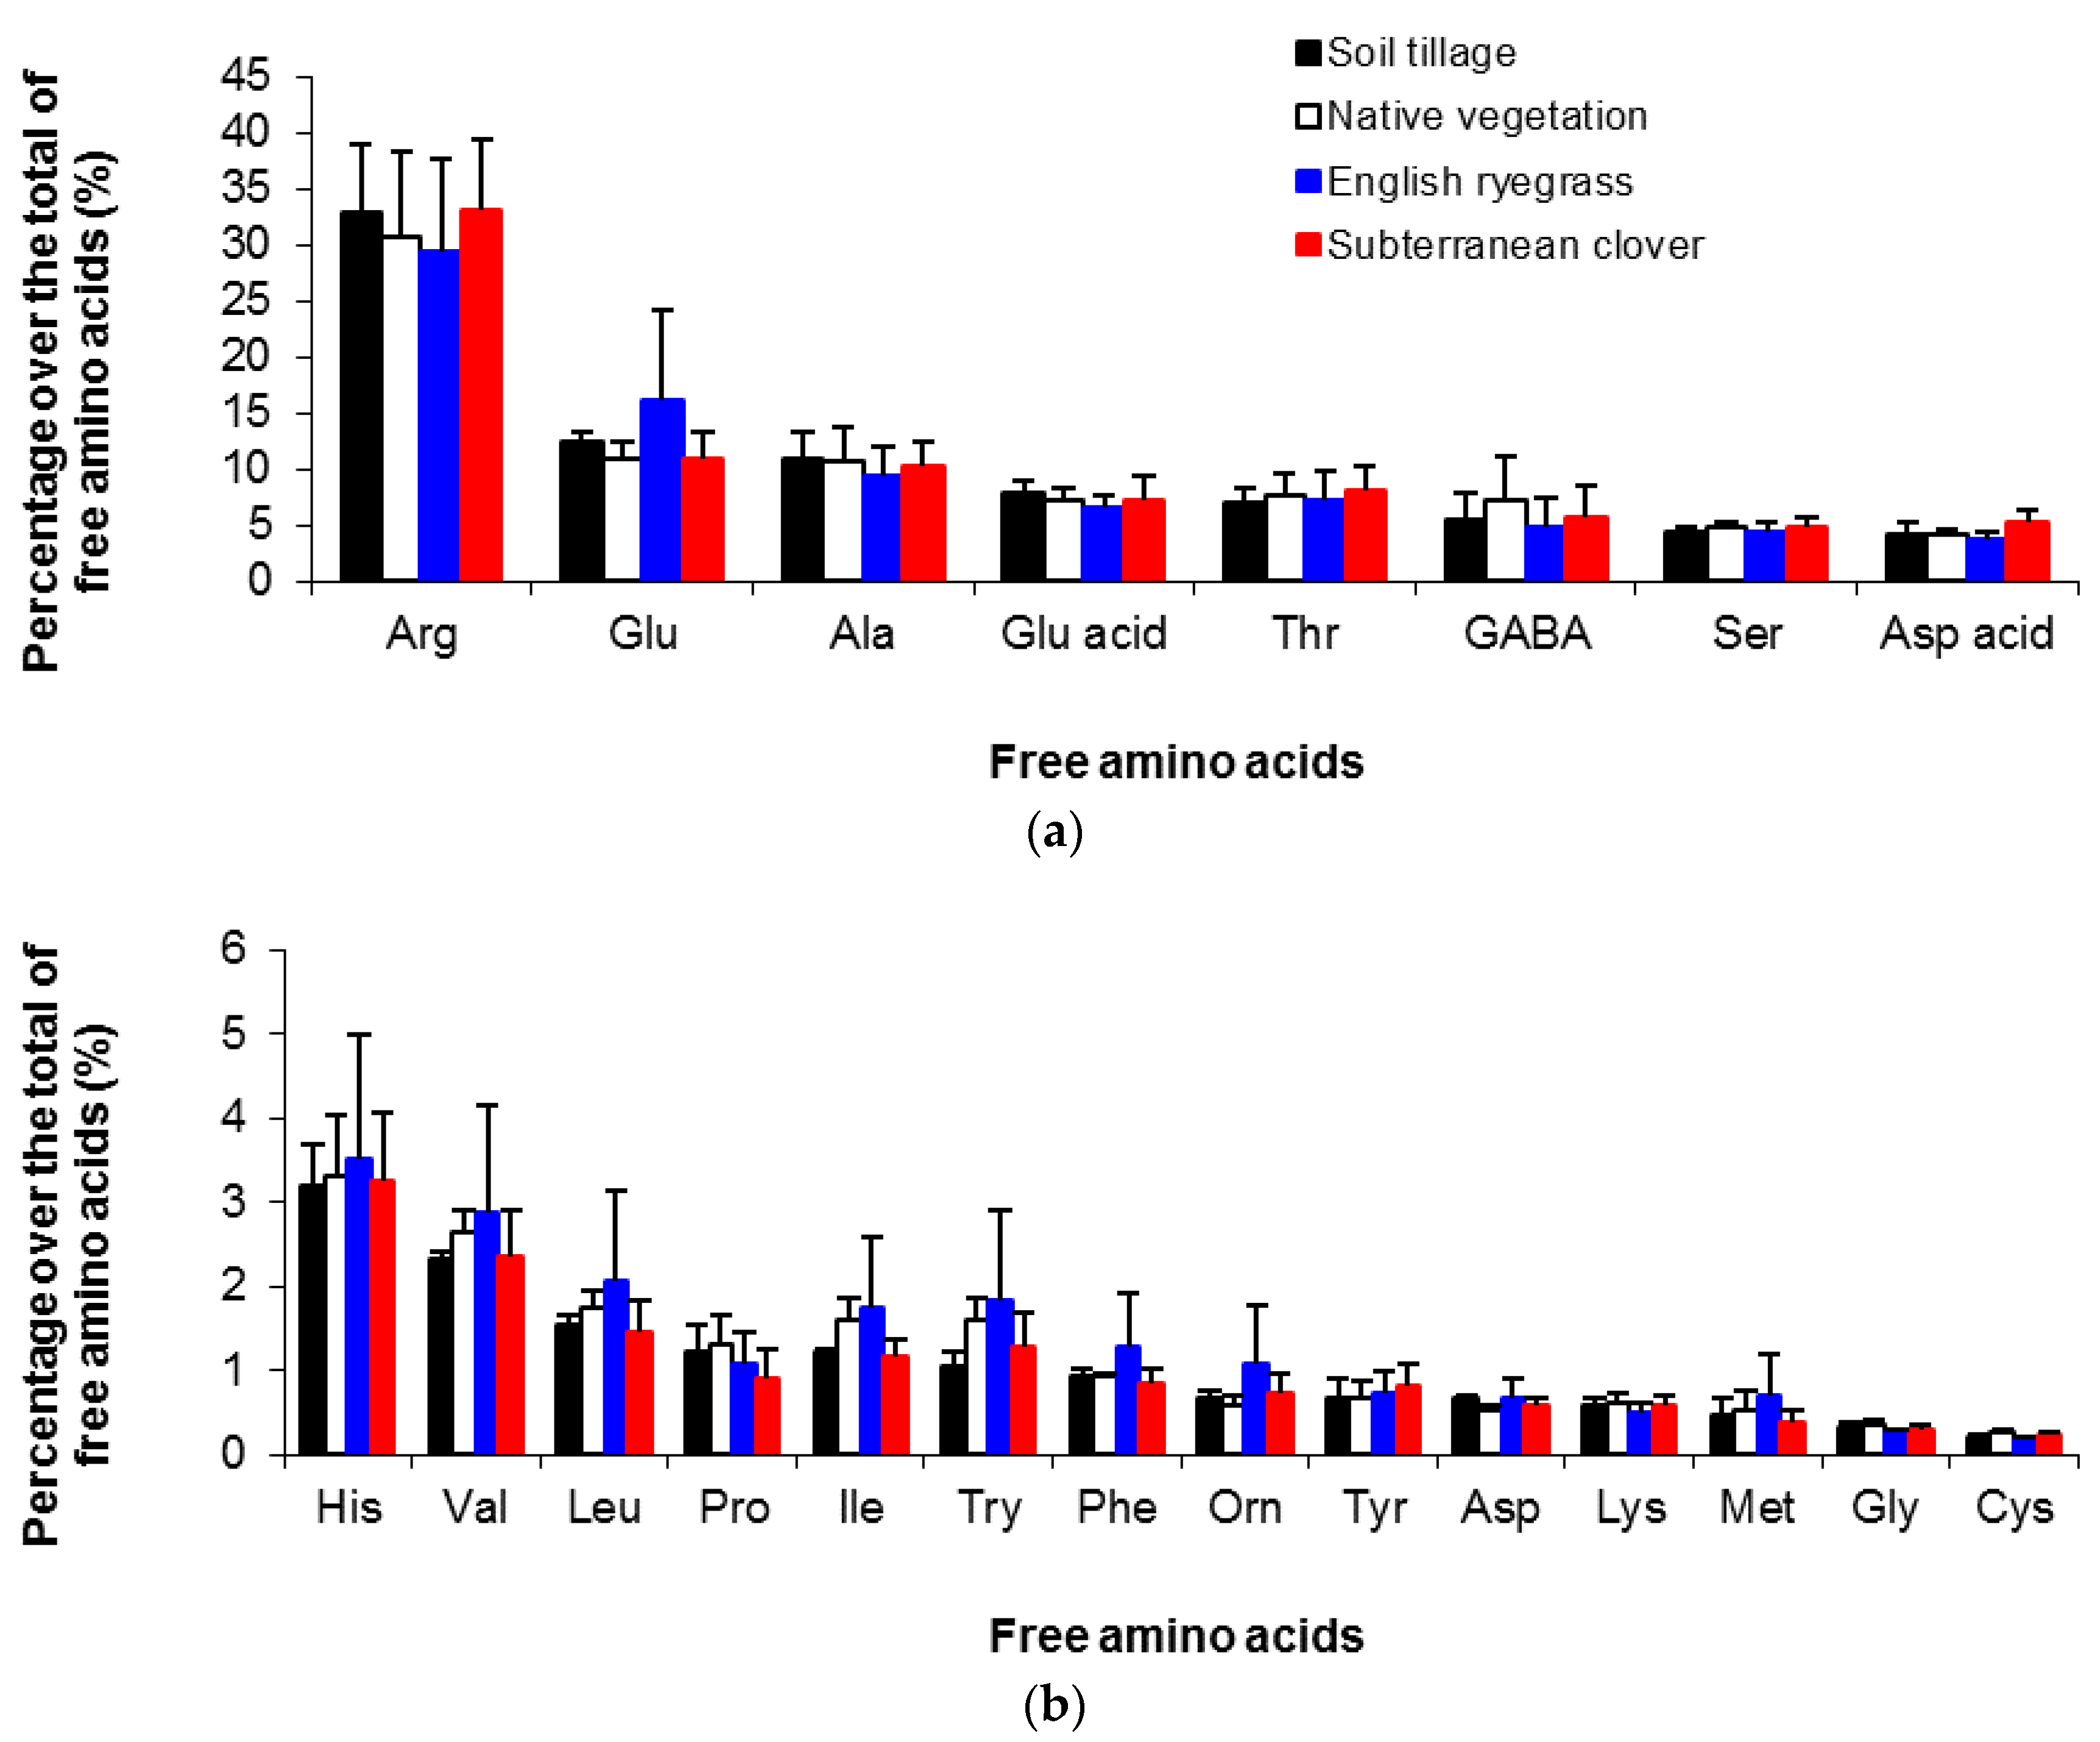
3.3. Amino Acid Composition of Musts and Wines

Although a previous study in another Galician winegrowing region (Ribeira Sacra) reported total amino acid contents in Mencía musts [43], the current work is the first one to determine the concentrations of individual amino acids in Mencía musts (Table 3). Independently of the soil management treatment, the total amino acid contents were lower in the current study than those reported for Ribeira Sacra [43], although a high variability was observed in both studies. However, the concentrations of individual compounds (Table 3) were within previously reported ranges [44], except for those of tryptophan, which were slightly greater.
Soil management system did not affect the concentrations of amino acids in Mencía musts (Table 3), due to the high interannual variability observed. In this sense, other authors did not find significant differences in the amino acid concentrations among Tempranillo musts coming from grapevines grown under soil tillage or cover crop treatments during the first year of their study, while the differences among treatments detected in subsequent years did not coincide between years [45]. The concentrations of amino acids in musts depend on many factors, including grapevine variety, maturation stage, weather conditions, and management practices [46], and a combination of these factors might have caused these differences with previous studies on other cultivars and also explain the absence of differences among the treatments considered in the current work.
The NV and SC treatments tended to cause lower (p-value < 0.1) concentrations of amino acids in Mencía musts (Table 3). In contrast, ER tended to increase the concentration of amino acids (p-values < 0.08), such as valine, isoleucine, leucine, and phenylalanine (Table 3). These modifications on the amino acid composition can be explained by the different water status observed on vines from the different treatments [21]. Since these amino acids are precursors of wine volatile compounds [47], these slight alterations might modify the wine aroma.
Independently of soil management, arginine was the most abundant amino acid in Mencía musts (Table 3). Therefore, this cultivar can be considered an arginine accumulator, similarly to other red grapevine varieties, such as Syrah, Merlot [48], Garnacha, and Pinot noir [44]. Moreover, previous studies carried out by our research group proved that other three Galician grapevine varieties—namely Albariño, Godello, and Treixadura—are also arginine accumulators [30,31,49].
In fact, arginine represented about 31.6% of the total free amino acids in Mencía musts, independently of the treatment (Figure 2a). Other amino acids present at relevant concentrations in the musts from this variety were glutamine (12.6%), alanine (10.3%), glutamic acid (7.2%), and threonine (7.5%). These compounds were also abundant in other Spanish grapevine varieties, such as Monastrell and Verdejo [48,50,51]. Soil management caused very slight differences on the percentages of each free amino acid, although they were greater in the case of minor amino acids (Figure 2b). The high variability among samples prevented the detection of significant differences among treatments. The ER treatment presented the highest variability for most of these compounds (Figure 2b). Therefore, soil management slightly altered the Mencía amino acid profile, and this could allow for discerning among management systems [48].
When considering the eight most abundant amino acids in Mencía musts, representing around 84% of the total amino acid content, PCA was able to separate samples from each treatment (Figure 3). The two first principal components (PC) explained 93.5% of the total variance in the dataset: PC1 accounted for 73.1% and PC2 for 20.4%. Musts from the ER treatment were located on the positive side of PC1 due to their high concentrations in arginine, threonine, serine, glutamic acid, glutamine, and alanine. Similarly, samples from the ST treatment were located also on the positive side of PC1, although close to the origin. The SC and NV treatments were located on the negative side of PC1; SC was on the positive side of PC2 due to its high concentration of aspartic acid, whereas NV was on the negative side of PC2 due to its high GABA content. These results agree with the fact that the amino acid profile could be a means for discerning vineyard management systems [48].
Cover crops did not affect the amino acid concentrations of Mencía wines (Table 4) due to the inter-annual variability on these concentrations, as observed for musts. However, wines from the cover crop treatments tended to have lower amino acid concentrations than those from the ST treatment (Table 4); however, these trends were not significant at the 95% level. The total and individual concentrations of amino acids in Mencía wines were greater than those detected in red wines from other varieties [52,53]. This confirmed the significant effect of grapevine variety on the amino acid concentrations observed in wines and could allow detection of the wine origin [48,54].

3.4. Volatile Composition of Mencía Wines

Forty-three volatile compounds were quantified in Mencía wines (Table 5). According to their chemical characteristics, they were grouped into higher alcohols, other alcohols, acetates of higher alcohols, esters, volatile fatty acids, terpenes, and other compounds.
Previous reports characterized the aroma composition of Mencía wines from other regions within Galicia [22,25,43], so it is expected that the concentrations of volatile compounds observed in wines from the current study would differ from those previously published. For instance, the concentrations of 1-hexanol and benzyl alcohol were greater in wines from our study than in those previously reported [22].
Soil management slightly altered the concentrations of volatiles in Mencía wines (Table 5). According to the quantitative data, the total concentration of volatiles in wines from the four treatments ranged from 1616 to 1938 mg L−1. Wine from ER had the lowest amount while that from the ST treatment had the highest. Methanol contents were greater in samples from ST than in those from the cover crop treatments. The other compound that showed significant differences due to soil management was trans-linalool oxide (pyran), which appeared at lower levels in wines coming from ER when compared to those from ST (Table 5). The rest of the volatiles did not show significant differences among soil managements, although we observed trends to greater concentrations of esters and volatile fatty acids in wines from the cover crop treatments. Moreover, 2-phenylethanol, which imparts rose nuances [23,55], was present at greater concentrations in wines from NV.
Vineyard-soil management effects on the volatile composition of wines disagree among studies. For instance, significant differences depending on the soil management system for almost all the volatile compounds quantified in Cabernet Sauvignon wines have been found; wines from the soil tillage treatment showed the lowest concentrations of volatiles [19].
In contrast, higher levels of volatiles in Negroamaro wines coming from the cover crop treatments were detected when compared to those coming from soil tillage [20]. These discrepancies are due to the different level of competence between cover crops and grapevines in each study, which greatly depends on soil and climate conditions in the study region. Furthermore, an effect of the grapevine cultivar cannot be discarded. In our case, the lack of differences in grapevine water status and the slight alterations in leaf surface and berry size caused the absence of alterations in wine volatile compound concentrations [21].
In the current study, higher alcohols in wines from all treatments appeared at concentrations greater than the threshold considered to contribute negatively to wine complexity, 300 mg L−1 [56], although they were similar to those previously detected in commercial Mencía wines from Ribeira Sacra and Monterrei [22]. Moreover, higher alcohols constitute more than 95% of the concentration of volatiles in Mencía wines from Valdeorras [23]. Similarly, other alcohols that impart positive nuances, such as 2-phenylethanol, appeared at concentrations within the range reported for commercial wines from this variety [22]. Moreover, the use of commercial yeasts could have homogenized the volatile contents in wines from the different treatments.
Only two acetates of higher alcohols were detected in the wines from the current study: Isoamyl acetate and 2-phenylethyl acetate, which did not differ among treatments (Table 5). They appeared at concentrations similar to those of commercial wines from this cultivar [22].
Ethyl esters constitute one of the most important groups of aroma compounds in wines because they impart fruity notes. Since yeasts produce them during fermentation as secondary products of sugar metabolism [57], soil management is not supposed to alter significantly their concentrations, as occurred in this study (Table 5). However, other studies reported higher concentrations of these compounds in Cabernet Sauvignon wines coming from the cover crop treatments when compared to those coming from soil tillage [19], while the opposite was found in Negroamaro wines [20].
Similarly, soil management did not alter the concentrations of volatile fatty acids in Mencía wines (Table 5). These compounds originate from the metabolism of fatty acids by yeast [57]. These molecules may contribute negatively to wine aroma, providing rancid and cheese notes; however, concentrations between 4 and 10 mg L−1 of C6-C10 volatile fatty acids provide mild and pleasant aromas to wines due to synergistic effects [58]. In this study, all wines had C6-C10 volatile fatty acid contents within this range (Table 5).
Terpenes are relevant contributors to the wine aroma, and correlations between floral sensory attributes and high levels of some of these molecules, such as α-terpineol and linalool, have been documented [1]. In our case, soil management did not affect the concentrations of terpenes in Mencía wines, except for that of trans-linalool oxide (pyran) (Table 5). Furthermore, wines from ER and SC tended to have greater concentrations of terpenes, which might be caused by the fact that precursors of these compounds abound in berry skin [23,59] and, in these two treatments, berries were smaller and, likely, they had a lower flesh:skin ratio [21]. However, these compounds appeared in concentrations lower than their perception thresholds and their contribution to wine aroma would be not important. In fact, the contents of terpenes detected in the current study were lower than those previously observed in Mencía wines [22]. Nevertheless, linalool and α-terpineol appeared at concentrations similar to those observed in Mencía wines from Valdeorras [23].
When considering the OAV as an index of the contribution of a given compound to wine aroma [33,34], only 18 compounds had an OAV greater than 0.5 (Table 6). Among these compounds, the ones with the greatest OAV were 1-propanol, ethyl octanoate, isovaleric acid, isoamyl acetate, and acetaldehyde. Soil management did not alter the OAV of the volatile compounds determined in Mencía wines (Table 6) due to the high variability among samples. However, the OAV found in the current study were higher than those reported for the same cultivar [36]. Ethyl esters had a great influence on the aroma of the wines from the current study, and cover crop treatments tended to induce higher OAV for these compounds (Table 6). Ethyl butyrate, hexanoate, and octanoate (notes to strawberry, apple, and pear, respectively) showed high OAV in the wines of Mencía, in accordance with previous reports [23].

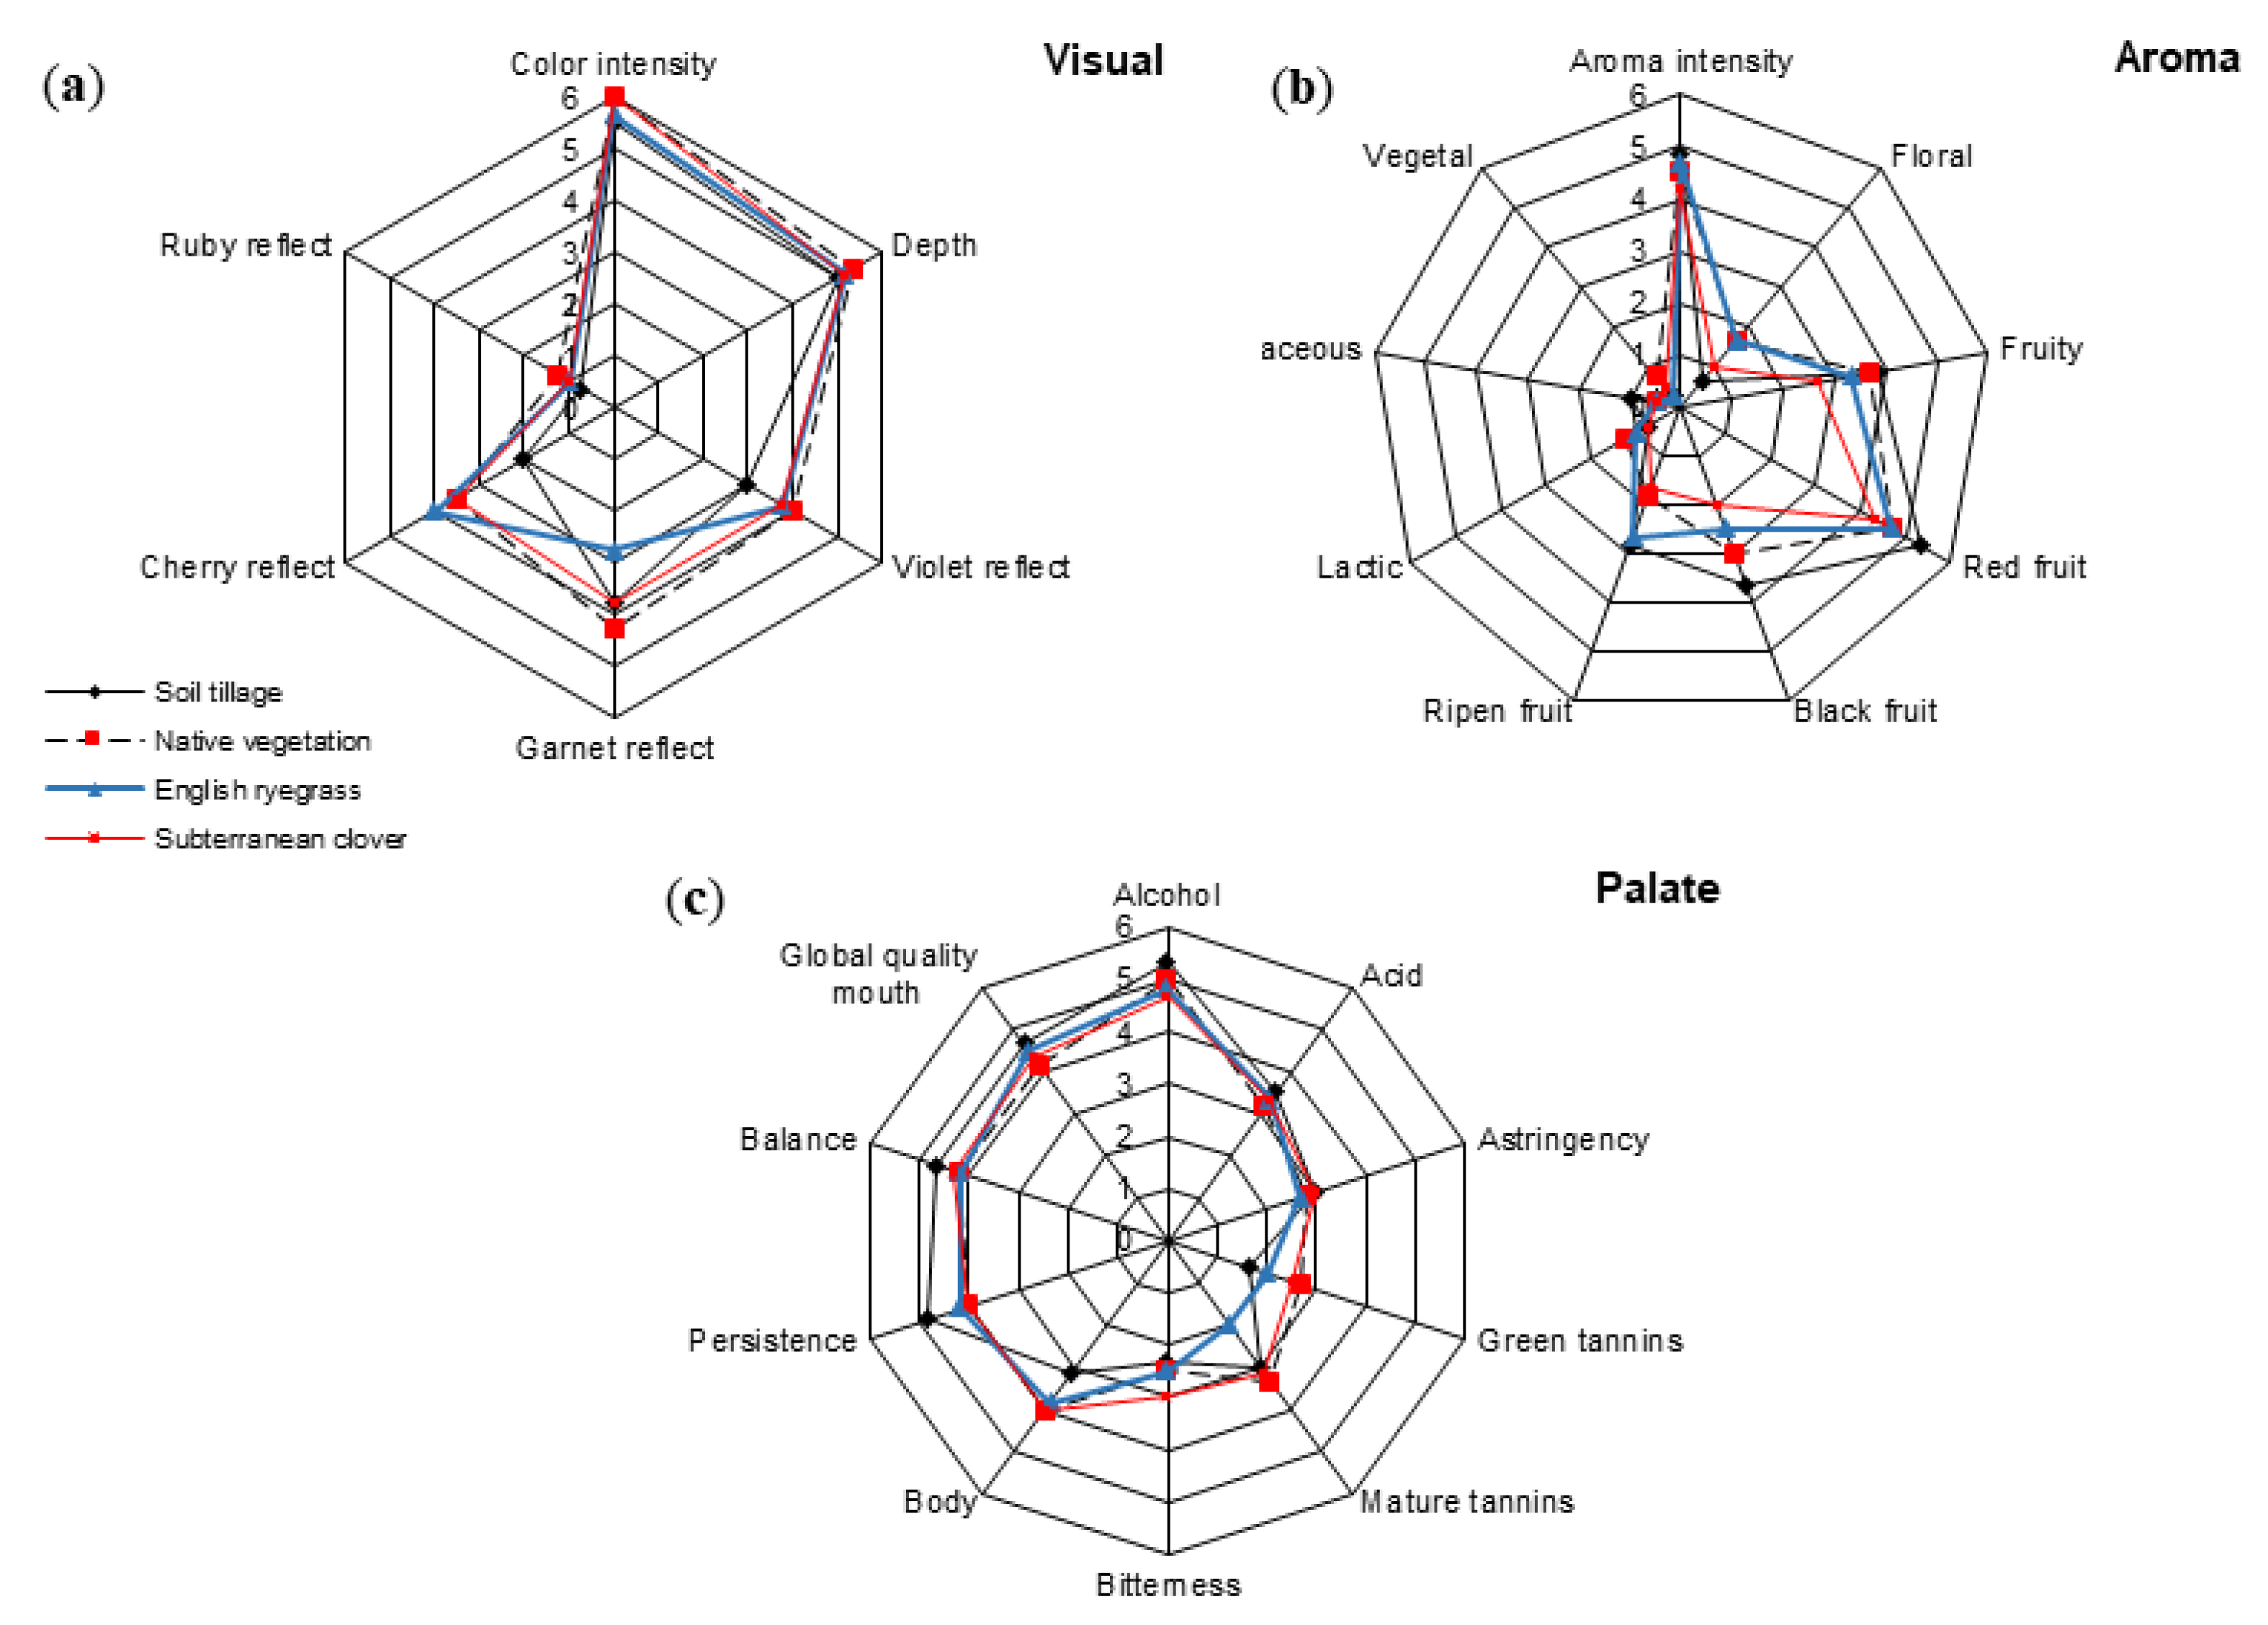
3.5. Sensory Profiles of Mencía Wines

Figure 4 shows the sensory profiles for Mencía wines from the different soil management systems studied, as averaged for the three years considered.
Visually, wines from the ST had lower violet and cherry reflects than wines from the cover crop treatments (Figure 4a). Aromatically (Figure 4b), the wine from SC received the lowest scores for black, red, and ripened fruit. In contrast, wines from ST received the highest marks for these descriptors. Judges perceived floral notes more intensely in wines from the NV and EC treatments. Palate descriptors showed slight differences among treatments (Figure 4c). Wines from ST received higher marks for persistence, but lower for body and green tannins. Finally, wines from NV, ER, and SC received global quality scores 6.5%, 9.7%, and 19.4%, respectively; lower than wines from ST.
These results seem in contradiction with those previously found [6,19], which showed that Cabernet Sauvignon wines coming from the cover crop treatments scored higher than those from the soil tillage control. However, this contradiction can be explained by the different climate conditions on each site, since in our case, grapes from the ST treatment were ripened when harvested in contrast to other studies [6]. Although Xi et al. [19] did not report data from musts in their study, wine alcohol in wines from the tilled soil treatment was significantly lower than that of wines from the cover crop treatments, which could lead to an unbalanced wine.
Furthermore, non-trained consumers tasted the same wines from this study and they ranked the wine from the ST treatment in fourth place [21]. This clearly contrasts with the results from the current sensory analysis, adding information to the debate on the selection of wine tasters [60].

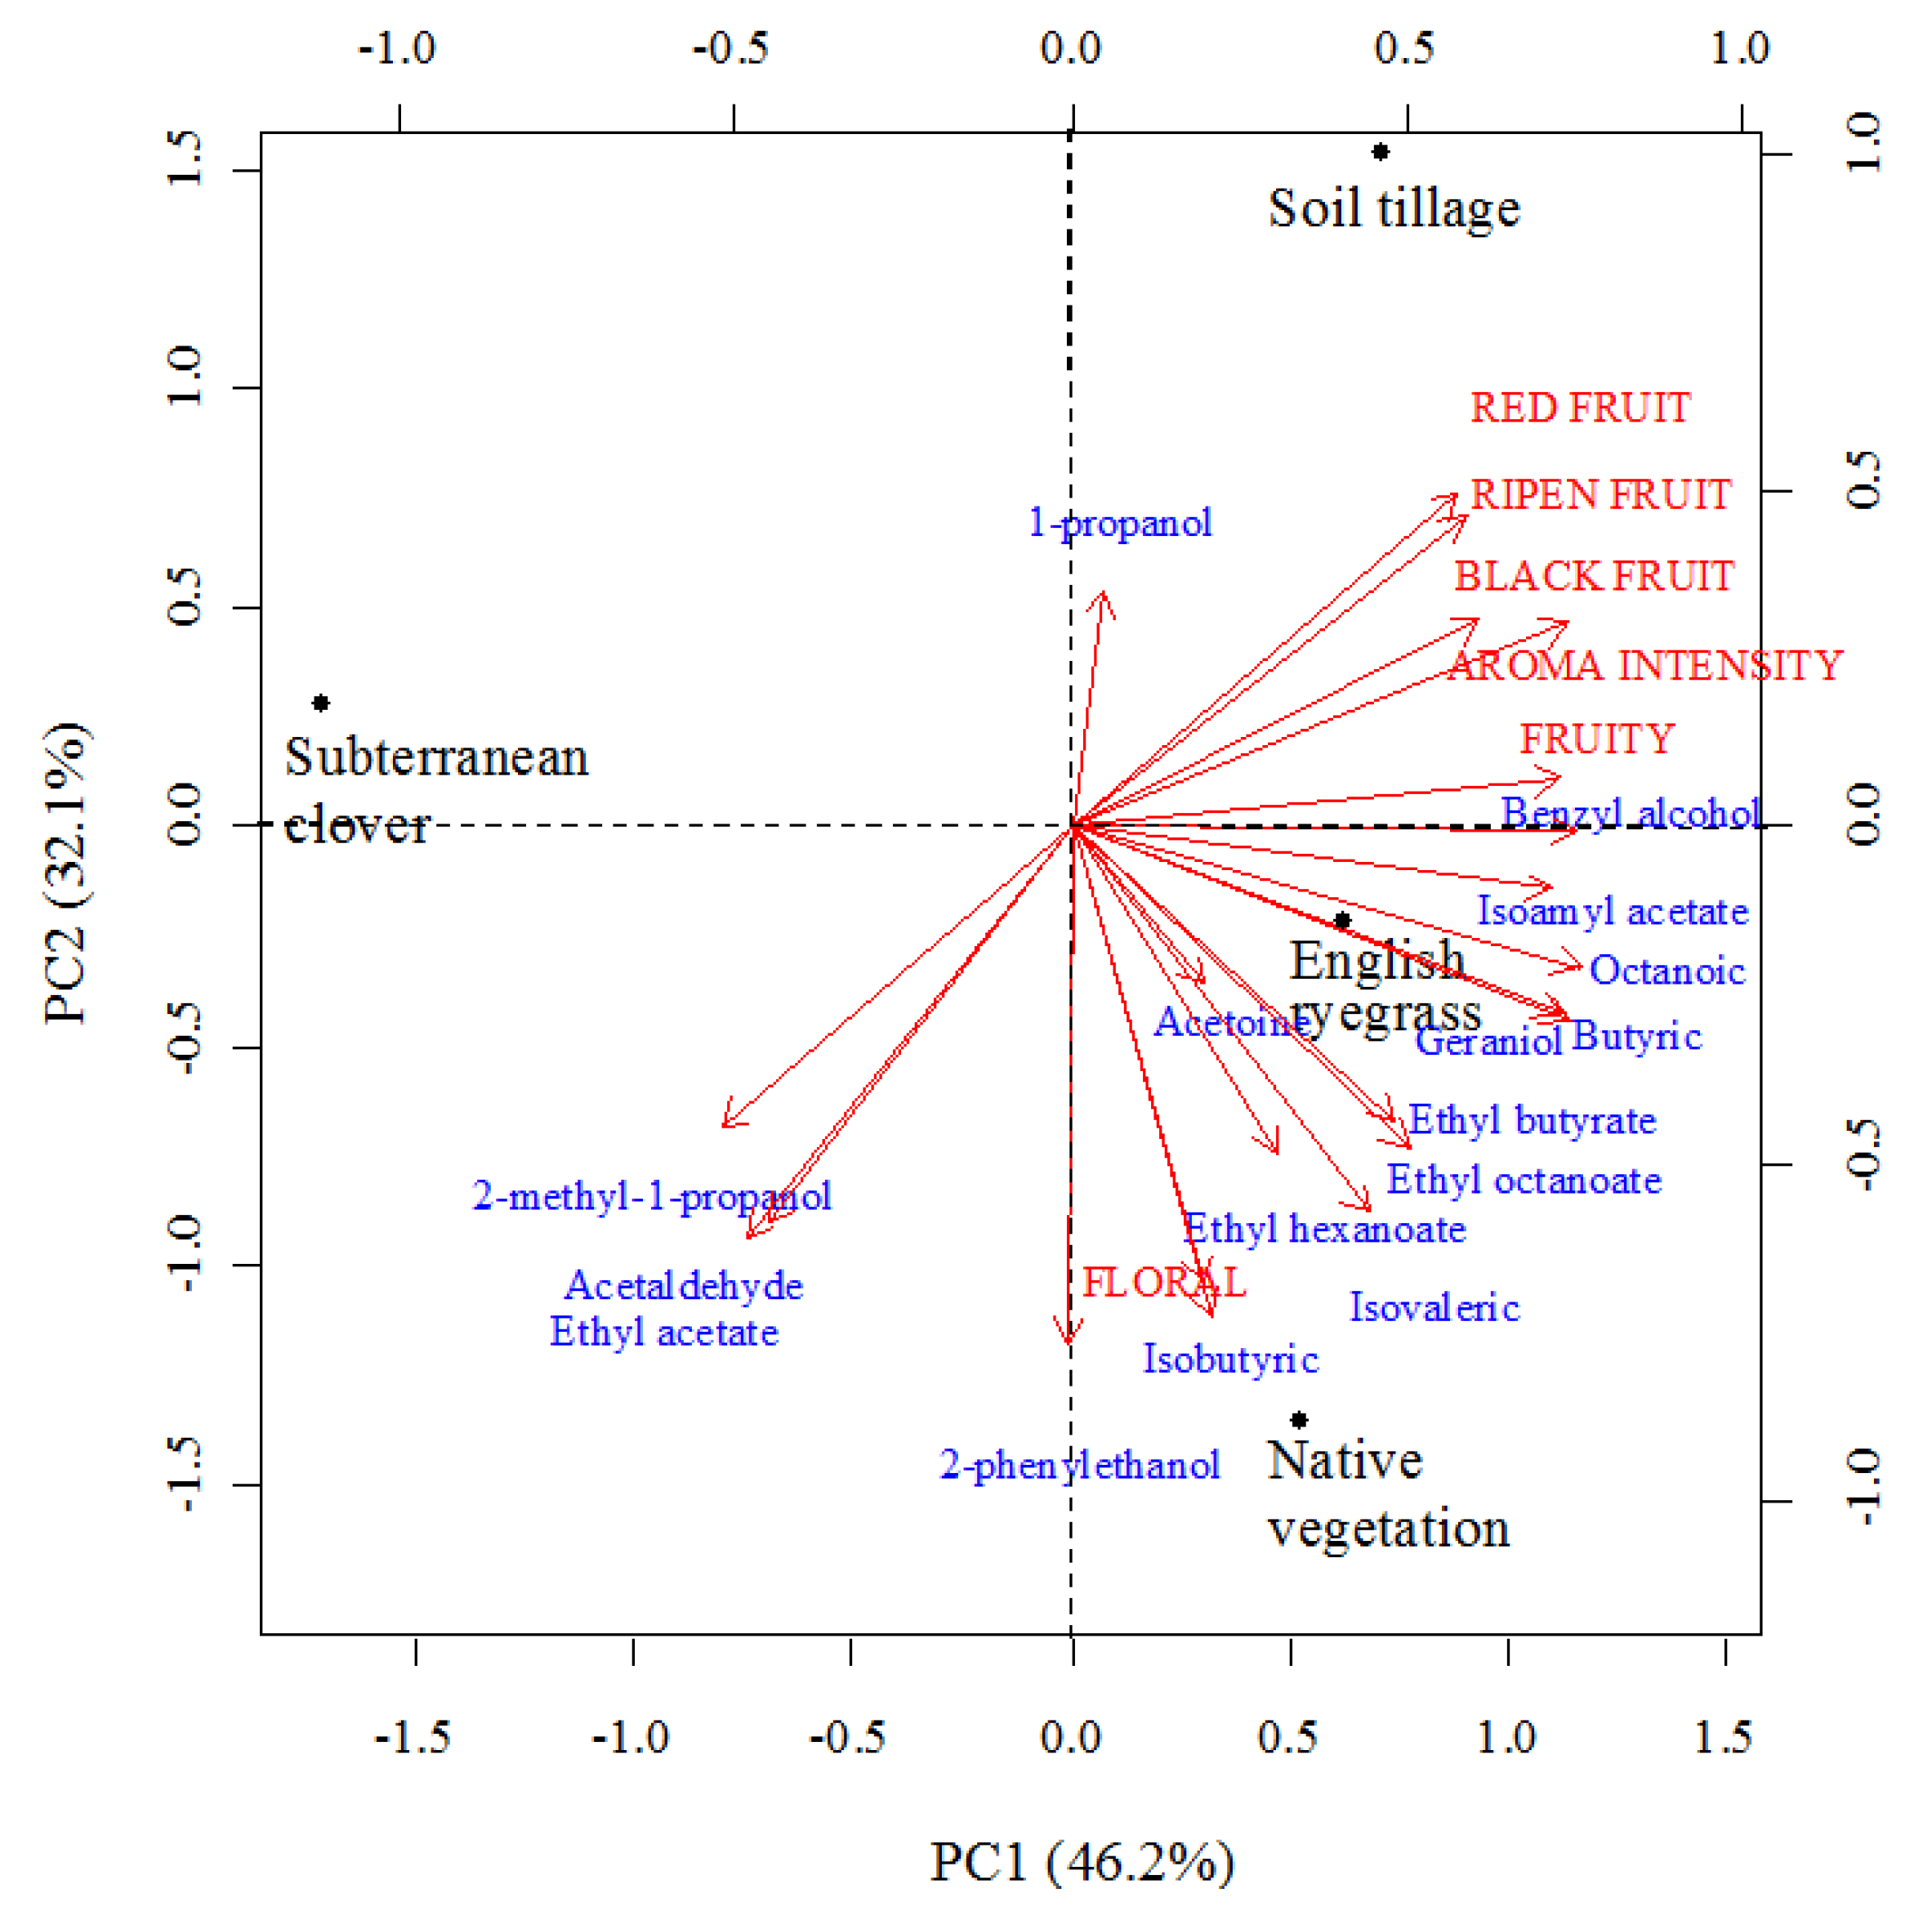
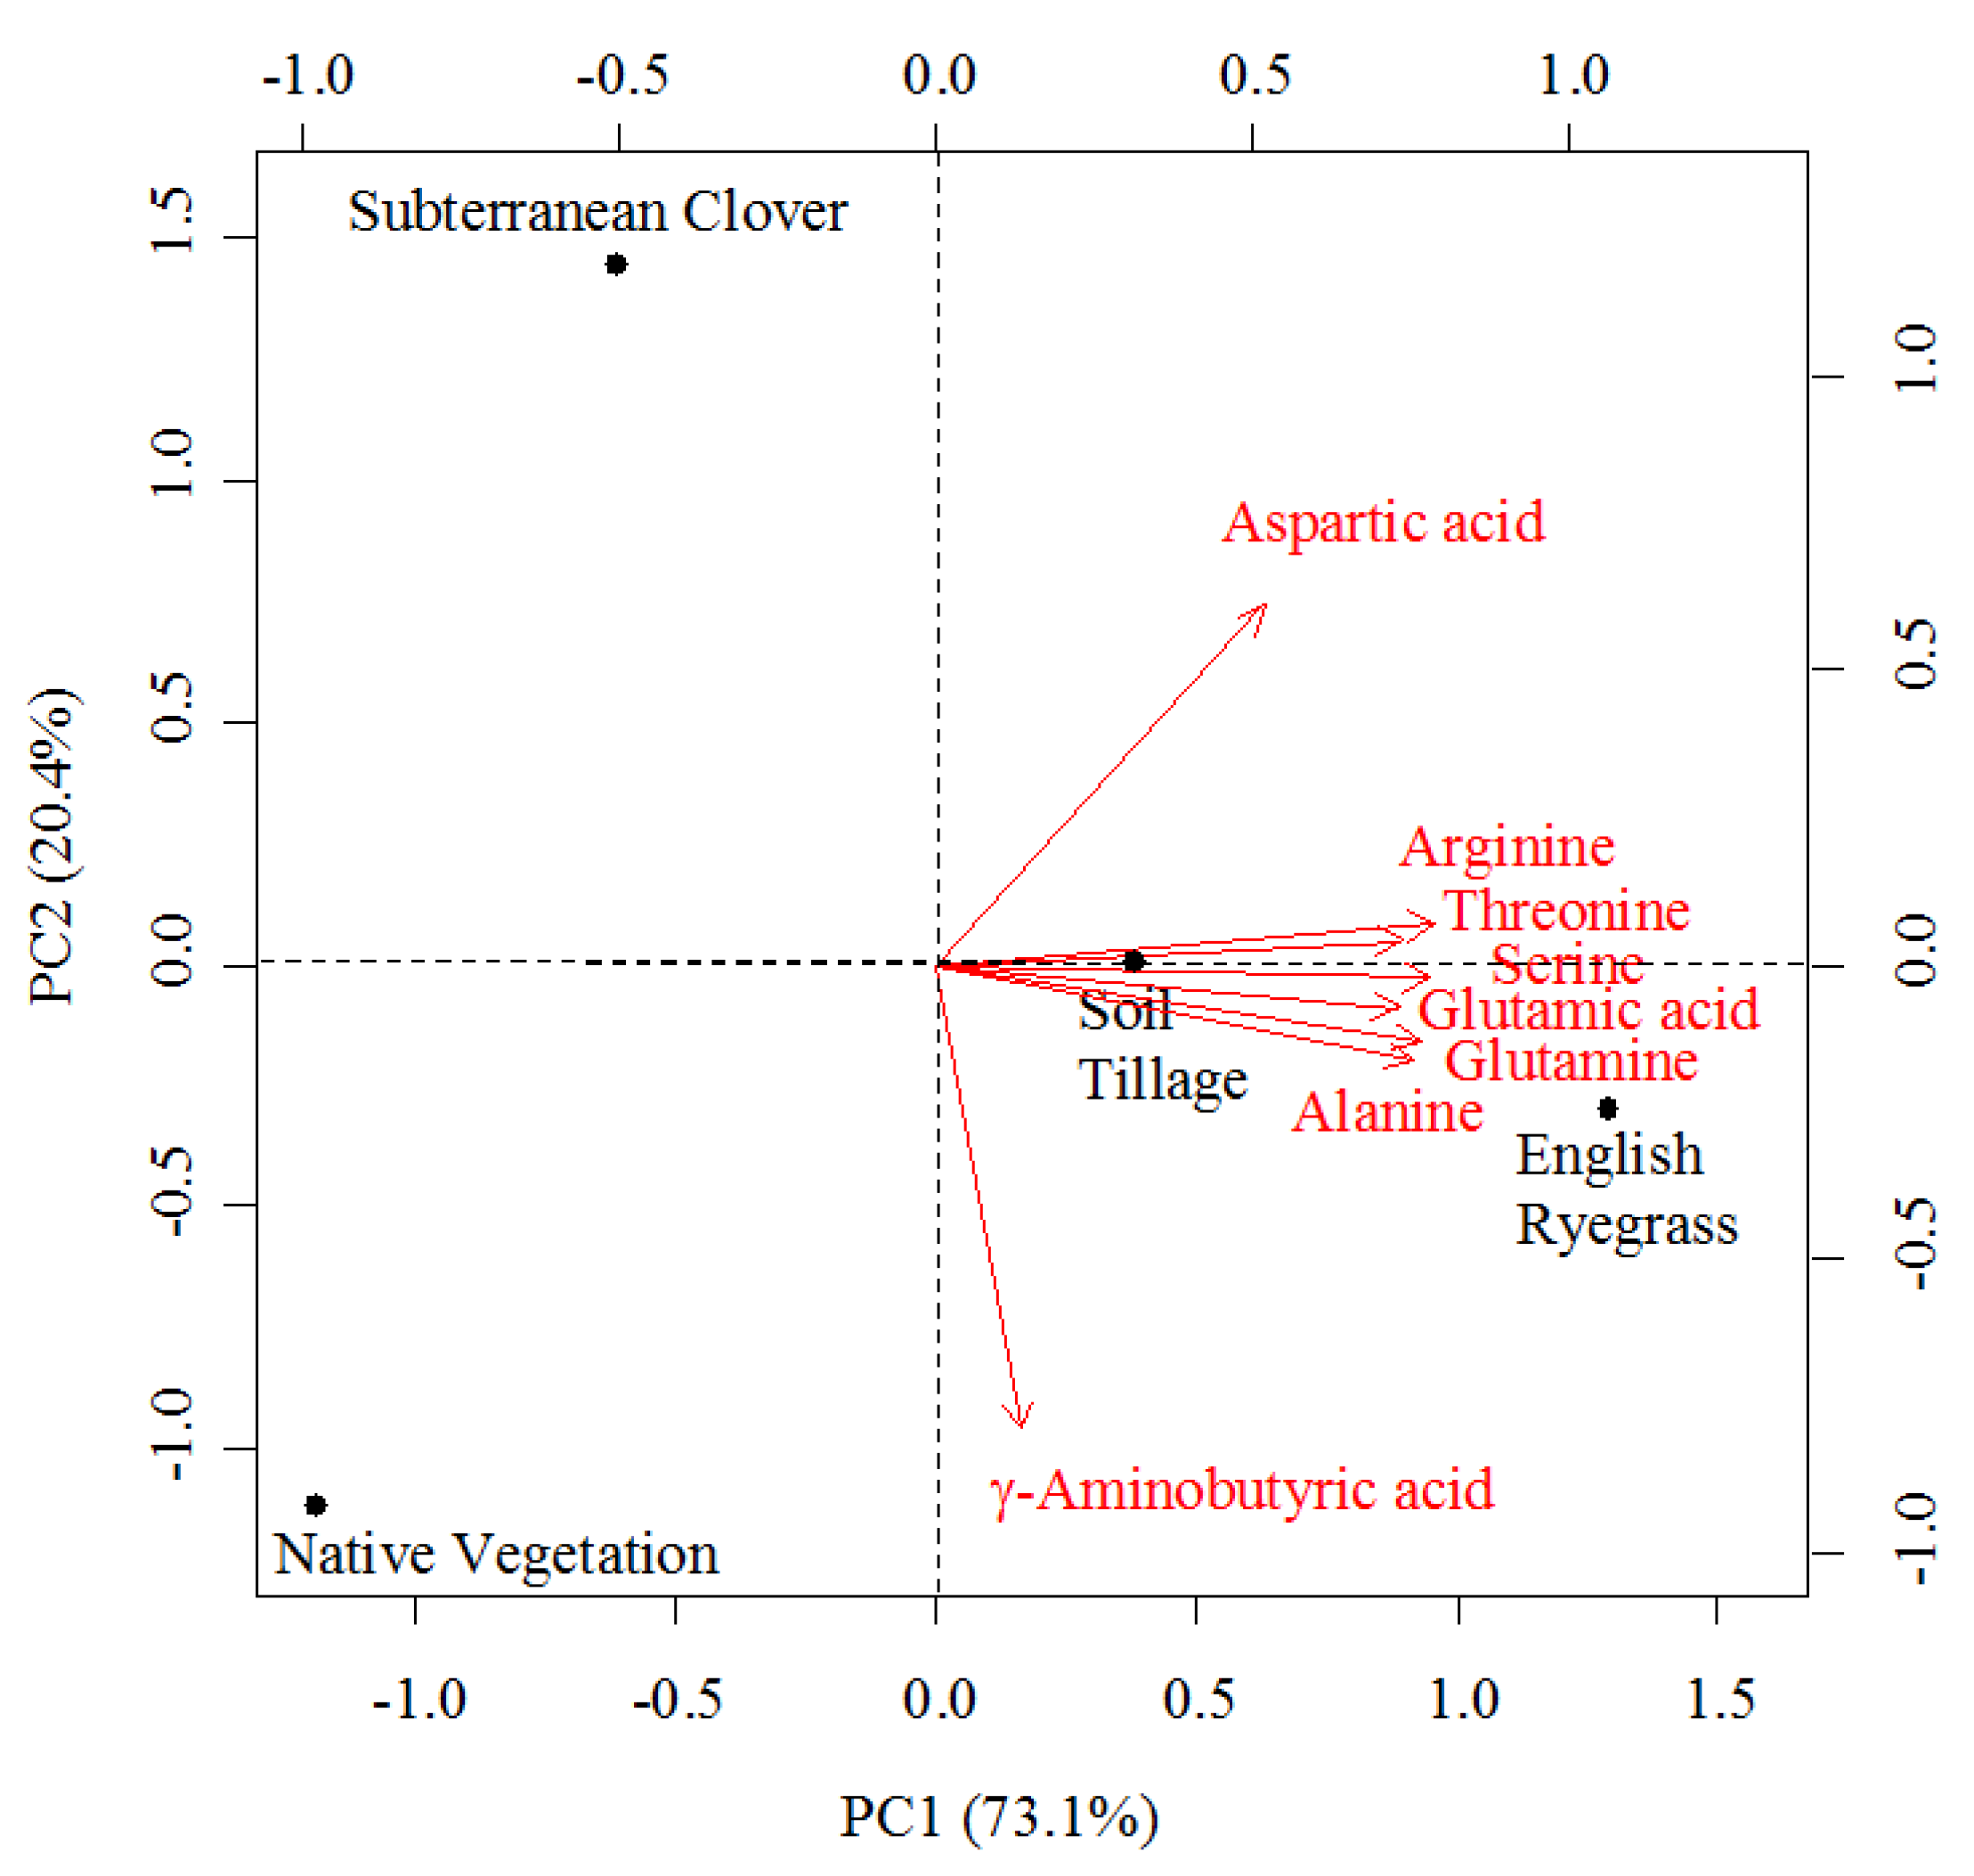
3.6. Relationships among Amino Acids, Volatile Compounds, and Sensory Descriptors

Previous studies proved the close relationship between the concentrations of amino acids in musts and volatiles in wines [16,31]. In the current study, concentrations of several amino acids correlated significantly with those of wine volatiles. For instance, cysteine and aspartic acid concentrations in musts correlated with those of 26 and 22 individual volatile compounds in wines, respectively. In contrast, asparragine and phenylalanine concentrations in musts related only to that of an individual volatile (data not shown).
When considering those volatiles with an OAV greater than one and the aroma descriptors, a PCA revealed a clear separation of the wines produced under each treatment (Figure 5). The first two principal components accounted for 78.3% of the total variance in our dataset: PC1 explained 46.2% of this variance and PC2 explained 32.1%. Wines from ST appeared on the positive sides of both PC1 and PC2, due to their high scores in red, black, and ripened fruits, as well as for high concentrations in 1-propanol. Wines from NV and ER were located on the positive side of PC1, but on the negative side of PC2. High concentrations in 2-phenylethanol and isobutyric acid, as well as high scores for the floral descriptor, characterized NV wines. Great concentrations of butyric and octanoic acids and geraniol characterized wines from ER. Finally, wines from SC appeared on the negative side of PC1, but on the positive side of PC2 due to their low concentrations on volatile compounds.

4. Conclusions

The current study provided insights about the effects of establishing cover crops in the vineyard may have on Mencía must and wine composition under the climate conditions of Galicia (NW Spain). Must general attributes were not altered by the use of cover crops; however, the color characteristics of the wines were modified by the soil management system. Moreover, some tendencies were detected, although significant differences among treatments were not established in most cases. Musts from the NV and SC treatments tended to have lower amino acid concentrations. Wines from the cover crop treatments tended to have higher concentrations of ethyl esters, volatile fatty acids, and free terpenes than wines from the ST control. A correlation between volatile compounds with concentrations higher than their perception thresholds and aroma descriptors has been observed. In conclusion, vineyard soil management using cover crops seem to be an appropriate option for modulating must and wine composition in Mencía under humid climate conditions.

Author Contributions

I.O., E.F. and J.M.M.-A. conceived/designed the experiments and contributed reagents/materials; E.T.-C. and J.M.M.-A. performed the fieldwork and winemaking; Y.B.-C. carried out analytical determinations; I.O. and E.F. advised on analytical chemistry and sensory evaluation; Y.B.-C. and J.M.M.-A. analyzed the data; Y.B.-C., E.T.-C., I.O., E.F. and J.M.M.-A. discussed the results; Y.B.-C. and J.M.M.-A. wrote the manuscript; Y.B.-C., E.T.-C., I.O., E.F. and J.M.M.-A. discussed and revised the paper.

Funding

This research was funded by Instituto Nacional de Tecnología Agraria y Alimentaria (INIA) grant number RTA2011-00041-C02-01, with 80% FEDER funds.

Acknowledgments

Y.B.C. and E.T.C. thank INIA for their PhD. scholarships. J.M.M.A. thanks Xunta de Galicia for his “Isidro Parga Pondal” contract. Thanks to the professionals that participated in the wine sensory evaluation sessions.

Conflicts of Interest

The authors declare no conflict of interest. The founding sponsors had no role in the design of the study; in the collection, analyses, or interpretation of data; in the writing of the manuscript, and in the decision to publish the results.

References

  1. Robinson, A.L.; Boss, P.K.; Solomon, P.S.; Trengove, R.D.; Heymann, H.; Ebeler, S.E. Origins of grape and wine aroma. Part 1. Chemical components and viticultural impacts. Am. J. Enol. Vitic. 2014, 65, 1–24. [Google Scholar] [CrossRef]
  2. Guerra, B.; Steenwerth, K. Influence of floor management technique on grapevine growth, disease pressure, and juice and wine composition: A review. Am. J. Enol. Vitic. 2012, 63, 149–164. [Google Scholar] [CrossRef]
  3. Celette, F.; Findeling, A.; Gary, C. Competition for nitrogen in an unfertilzed intercropping system: The case of an association of grapevine and grass cover in a Mediterranean climate. Eur. J. Agron. 2009, 30, 41–51. [Google Scholar] [CrossRef]
  4. Ripoche, A.; Celette, F.; Cinna, J.P.; Gary, C. Design of intercrop management plans to fulfill production and environmental objectives in vineyards. Eur. J. Agron. 2010, 32, 30–39. [Google Scholar] [CrossRef]
  5. Afonso, J.M.; Monteiro, A.M.; Lopes, C.M.; Lourenço, J. Enrelvamento do solo em vinha na região dos Vinhos Verdes. Três anos de estudo na casta ‘Alvarinho’. Ciência e Técnica Vitivinícola 2003, 18, 47–63. [Google Scholar]
  6. Wheeler, S.J.; Black, A.S.; Pickering, G.J. Vineyard floor management improves wine quality in highly vigorous Vitis vinifera ‘Cabernet Sauvignon’ in New Zealand. N. Z. J. Crop Hortic. Sci. 2005, 33, 317–328. [Google Scholar] [CrossRef]
  7. Nazrala, J.B. Influencia del manejo del suelo y las coberturas vegetales en el microclima de la canopia de la vid, la composición de la uva y el vino. Rev. FCA UNCuyo 2008, XL, 85–104. [Google Scholar]
  8. Lopes, C.M.; Monteiro, A.; Machado, J.P.; Fernandes, N.; Araujo, A. Cover cropping in a sloping non-irrigated vineyard: II—Effects on vegetative growth, yield, berry and wine quality of ‘Cabernet Sauvignon’ grapevines. Ciência e Técnica Vitivinícola 2008, 23, 37–43. [Google Scholar]
  9. Celette, F.; Gary, C. Dynamics of water and nitrogen stress along the grapevine cycle as affected by cover cropping. Eur. J. Agron. 2013, 45, 142–152. [Google Scholar] [CrossRef]
  10. Ruiz-Colmenero, M.; Bienes, R.; Marqués, M.J. Soil and water conservation dilemas associated with the use of green cover in steep vineyards. Soil Tillage Res. 2011, 117, 211–223. [Google Scholar] [CrossRef]
  11. Virto, I.; Imaz, M.J.; Fernández-Ugalde, O.; Urrutia, I.; Enrique, A.; Bescansa, P. Soil quality evaluation following the implementation of permanent cover crops in semiarid vineyards. Organic matter, physical and biological soil properties. Span. J. Agric. Res. 2012, 10, 1121–1132. [Google Scholar] [CrossRef]
  12. Coniberti, A.; Ferrari, V.; Disegna, E.; Garcia Petillo, M.; Lakso, A.N. Under-trellis cover crop and planting density to achieve vine balance in a humid climate. Sci. Hortic. 2018, 227, 65–74. [Google Scholar] [CrossRef]
  13. Ibáñez Pascual, S. Gestión del suelo en viñedo mediante cubiertas vegetales. Incidencia sobre el control del rendimiento y el vigor. Aspectos ecofisiológcos, nutricionales, microclimáticos y de calidad del mosto y del vino. Ph.D. Thesis, Universidad de La Rioja, Logroño, Spain, 2013. [Google Scholar]
  14. Smart, R.E.; Robinson, M. Sunlight into Wine. A Hand-Book for Winegrape Canopy Management; Winetitles: Adelaide, Australia, 1991; p. 88. ISBN 978-1875130108. [Google Scholar]
  15. Albers, E.; Larsson, C.; Liden, G.; Niklasson, C.; Gustafsson, L. Influence of the nitrogen source on Saccharomyces cerevisiae anaerobic growth and product formation. Appl. Environ. Microbiol. 1996, 62, 3187–3195. [Google Scholar] [PubMed]
  16. Hernández-Orte, P.; Cacho, J.F.; Ferreira, V. Relationship between varietal amino acid profile of grapes and wine aromatic composition. Experiments with model solutions and chemometric study. J. Agric. Food Chem. 2002, 50, 2891–2899. [Google Scholar] [CrossRef] [PubMed]
  17. Pérez Álvarez, E.P.; García Escudero, E.; Peregrina, F. Soil nutrient availability under cover crops: Effects on vines, must and wine in a Tempranillo vineyard. Am. J. Enol. Vitic. 2015, 66, 311–320. [Google Scholar] [CrossRef]
  18. Lee, J.; Steenwerth, K.L. Rootstock and vineyard floor management influence on ‘Cabernet Sauvignon’ grape yeast assimilable nitrogen (YAN). Food Chem. 2011, 127, 926–933. [Google Scholar] [CrossRef] [PubMed]
  19. Xi, Z.M.; Tao, Y.S.; Zhang, L.; Li, H. Impact of cover crops in vineyard on the aroma compounds of Vitis vinifera L. cv. Cabernet Sauvignon wine. Food Chem. 2011, 127, 516–522. [Google Scholar] [CrossRef] [PubMed]
  20. Toci, A.T.; Crupi, P.; Gambacorta, G.; Dipalmo, T.; Antonacci, D.; Coletta, A. Free and bound aroma compounds characterization by GC-MS of Negroamaro wine as affected by soil management. J. Mass Spectrom. 2012, 47, 1104–1112. [Google Scholar] [CrossRef] [PubMed]
  21. Trigo-Córdoba, E.; Bouzas-Cid, Y.; Orriols-Fernández, I.; Díaz-Losada, E.; Mirás-Avalos, J.M. Influence of cover crop treatments on the performance of a vineyard in a humid region. Span. J. Agric. Res. 2015, 13, e0907. [Google Scholar] [CrossRef]
  22. Calleja, A.; Falqué, E. Volatile composition of Mencía wines. Food Chem. 2005, 90, 357–363. [Google Scholar] [CrossRef]
  23. Noguerol-Pato, R.; González-Barreiro, C.; Cancho-Grande, B.; Simal-Gándara, J. Quantitative determination and characterisation of the main odourants of Mencía monovarietal wines. Food Chem. 2009, 117, 473–484. [Google Scholar] [CrossRef]
  24. Añón, A.; López, J.F.; Hernando, D.; Orriols, I.; Revilla, E.; Losada, M.M. Effect of five enological practices and of the general phenolic composition on fermentation-related aroma compounds in Mencia young red wines. Food Chem. 2014, 148, 268–275. [Google Scholar] [CrossRef] [PubMed] [Green Version]
  25. Revilla, E.; Losada, M.M.; Gutiérrez, E. Phenolic composition and color of single cultivar young red wines made with Mencia and Alicante-Bouschet grapes in AOC Valdeorras (Galicia, NW Spain). Beverages 2016, 2, 18. [Google Scholar] [CrossRef]
  26. Fraga, H.; Malheiro, A.C.; Moutinho-Pereira, J.; Cardoso, R.M.; Soares, P.M.M.; Cancela, J.J.; Pinto, J.G.; Santos, J.A. Integrated analysis of climate, soil, topography and vegetative growth in Iberian viticultural regions. PLoS ONE 2014, 9, e108708. [Google Scholar] [CrossRef] [PubMed]
  27. OIV. Recueil des Méthodes Internationales d’Analyses des Vins et des Moûts; Office International de la Vigne et du Vin: Paris, France, 2009; p. 544. ISBN 979-10-91799-82-9. [Google Scholar]
  28. Zamora, F. Elaboración y Crianza del Vino Tinto: Aspectos Científicos y Prácticos; Mundi-Prensa: Madrid, Spain, 2003; p. 225. ISBN 978-84-89922-88-4. [Google Scholar]
  29. Gómez Alonso, S.; Hermosín-Gutiérrez, I.; García Romero, E. Simultaneous HPLC analysis of biogenic amines, amino acids and ammonium ion as aminoenone derivatives in wine and beer samples. J. Agric. Food Chem. 2007, 55, 608–613. [Google Scholar] [CrossRef] [PubMed]
  30. Bouzas-Cid, Y.; Falqué, E.; Orriols-Fernández, I.; Mirás-Avalos, J.M. Effects of irrigation over three years on the amino acid composition of Treixadura (Vitis vinifera L.) musts and wines, and on the aromatic composition and sensory profiles of its wines. Food Chem. 2018, 240, 707–716. [Google Scholar] [CrossRef] [PubMed]
  31. Bouzas-Cid, Y.; Trigo-Córdoba, E.; Falqué, E.; Orriols, I.; Mirás-Avalos, J.M. Influence of supplementary irrigation on the amino acid and volatile composition of Godello wines from the Ribeiro Designation of Origin. Food Res. Int. 2018, 111, 715–723. [Google Scholar] [CrossRef] [PubMed]
  32. López-Vázquez, C.; Bollaín, M.H.; Moser, S.; Orriols, I. Characterization and differentiation of monovarietal grape pomace distillate from native varieties of Galicia. J. Agric. Food Chem. 2010, 58, 9657–9665. [Google Scholar] [CrossRef] [PubMed]
  33. Guth, H. Quantitation and sensory studies of character impact odorants of different white wine varieties. J. Agric. Food Chem. 1997, 45, 3027–3032. [Google Scholar] [CrossRef]
  34. Ferreira, V.; López, R.; Cacho, J.F. Quantitative determination of the odorants of young red wines from different grape varieties. J. Sci. Food Agric. 2000, 80, 1659–1667. [Google Scholar] [CrossRef]
  35. Ferreira, V. Volatile aroma compounds and wine sensory attributes. In Managing Wine Quality: Viticulture and Wine Quality, 1st ed.; Reynolds, A.G., Ed.; Woodhead Publishing Limited: Cambridge, UK, 2010; pp. 3–28. ISBN 978-18-45694-84-5. [Google Scholar]
  36. Vilanova, M.; Campo, E.; Escudero, A.; Graña, M.; Masa, A.; Cacho, J. Volatile composition and sensory properties of Vitis vinifera red cultivars from North West Spain: Correlation between sensory and instrumental analysis. Anal. Chim. Acta 2012, 720, 104–111. [Google Scholar] [CrossRef] [PubMed]
  37. R Core Team. R: A Language and Environment for Statistical Computing; R Foundation for Statistical Computing: Vienna, Austria; Available online: https://www.R-project.org (accessed on 9 July 2017).
  38. Monteiro, A.; Lopes, C.M. Influence of cover crop on water use and performance of vineyard in Mediterranean Portugal. Agric. Ecosyst. Environ. 2007, 121, 336–342. [Google Scholar] [CrossRef]
  39. Intrigliolo, D.S.; Castel, J.R. Response of grapevine cv. ‘Tempranillo’ to timing and amount of irrigation: Water relations, vine growth, yield and berry and wine composition. Irrig. Sci. 2010, 28, 113–125. [Google Scholar] [CrossRef]
  40. Maigre, D.; Aerny, J. Enherbement permanent et fumure azotée sur cv. ‘Gamay’ dans le Valais Central. Rev. Suis. Vitic. Arboric. Hortic 2001, 114, 255–258. [Google Scholar]
  41. Delalande, M.; Forguet, C.; Cazals, G.; Tauzin, D. Enherbement du vignoble méditerranéen avec des luzemes annuelles. Prog. Agric. Vitic. 2009, 126, 135–148. [Google Scholar]
  42. De Pascali, S.A.; Coletta, A.; Del Coco, L.; Basile, T.; Gambacorta, G.; Fanizzi, F.P. Viticultural practice and winemaking effects on metabolic profile of Negroamaro. Food Chem. 2014, 161, 112–119. [Google Scholar] [CrossRef] [PubMed]
  43. Vilanova, M.; Rodríguez, I.; Canosa, P.; Otero, I.; Gamero, E.; Moreno, D.; Talaverano, I.; Valdés, E. Variability in chemical composition of Vitis vinifera cv. Mencía from different geographic areas and vintages in Ribeira Sacra (NW Spain). Food Chem. 2015, 169, 187–196. [Google Scholar] [CrossRef] [PubMed]
  44. Bell, S.J.; Henschke, P.A. Implications of nitrogen nutrition for grapes, fermentation and wine. Aust. J. Grape Wine Res. 2005, 11, 242–295. [Google Scholar] [CrossRef]
  45. Pérez Álvarez, E.P.; Garde Cerdán, T.; Santamaría, P.; García Escudero, E.; Peregrina, F. Influence of two different cover crops on soil N availability, N nutritional status, and grape yeast-assimilable N (YAN) in a cv. Tempranillo vineyard. Plant Soil 2015, 390, 143–156. [Google Scholar] [CrossRef] [Green Version]
  46. Lee, J.; Schreiner, R.P. Free amino acid profiles from ‘Pinot noir’ grapes are influenced by vine N-status and sample preparation method. Food Chem. 2010, 119, 484–489. [Google Scholar] [CrossRef]
  47. Styger, G.; Prior, B.; Bauer, F.F. Wine flavor and aroma. J. Ind. Microbiol. Biotechnol. 2011, 38, 1145–1159. [Google Scholar] [CrossRef] [PubMed]
  48. Garde-Cerdán, T.; Lorenzo, C.; Lara, J.F.; Pardo, F.; Ancín-Azpilicueta, C.; Salinas, M.R. Study of the evolution of nitrogen compounds during grape ripening. Application to differentiate grape varieties and cultivated systems. J. Agric. Food Chem. 2009, 57, 2410–2419. [Google Scholar] [CrossRef] [PubMed]
  49. Bouzas-Cid, Y.; Díaz-Losada, E.; Trigo-Córdoba, E.; Falqué, E.; Orriols, I.; Garde-Cerdán, T.; Mirás-Avalos, J.M. Effects of irrigation over three years on the amino acid composition of Albariño (Vitis vinifera L.) musts and wines in two different terroirs. Sci. Hortic. 2018, 227, 313–325. [Google Scholar] [CrossRef]
  50. Martínez-Gil, A.M.; Garde-Cerdán, T.; Lorenzo, C.; Lara, J.F.; Pardo, F.; Salinas, M.R. Volatile compounds formation in alcoholic fermentation from grapes collected at 2 maturation stages: Influence of nitrogen compounds and grape variety. J. Food Sci. 2012, 71, C71–C79. [Google Scholar] [CrossRef] [PubMed]
  51. Ortega-Heras, M.; Pérez-Magariño, S.; Del-Villar-Garrachón, V.; González-Huerta, C.; Moro González, L.C.; Guadarrama Rodríguez, A.; Villanueva Sánchez, S.; Gallo González, R.; Martín de la Helguera, S. Study of the effect of vintage, maturity degree, and irrigation on the amino acid and biogenic amine content of a white wine from the Verdejo variety. J. Sci. Food Agric. 2014, 94, 2073–2082. [Google Scholar] [CrossRef] [PubMed]
  52. Soufleros, E.H.; Bouloumpasi, E.; Zotou, A.; Loukou, Z. Determination of biogenic amines in Greek wines by HPLC and ultraviolet detection after dansylation and examination of factors affecting their presence and concentration. Food Chem. 2007, 101, 704–716. [Google Scholar] [CrossRef]
  53. Martínez-Pinilla, O.; Guadalupe, Z.; Hernández, Z.; Ayestarán, B. Amino acids and biogenic amines in red varietal wines: The role of grape variety, malolactic fermentation and vintage. Eur. Food Res. Technol. 2013, 237, 887–895. [Google Scholar] [CrossRef]
  54. Soufleros, E.H.; Bouloumpasi, E.; Tsarchopoulos, C.; Bilianderis, C.G. Primary amino acid profiles of Greek white wines and their use in classification according to variety, origin and vintage. Food Chem. 2003, 80, 261–273. [Google Scholar] [CrossRef]
  55. Culleré, L.; Escudero, A.; Cacho, J.; Ferreira, V. Gas chromatography-olfactometry and chemical quantitative study of the aroma of six premium quality Spanish aged red wines. J. Agric. Food Chem. 2004, 52, 1653–1660. [Google Scholar] [CrossRef] [PubMed]
  56. Hirst, M.B.; Richter, C.L. Review of aroma formation through metabolic pathways of Saccharomyces cerevisiae in beverage fermentations. Am. J. Enol. Vitic. 2016, 67, 361–370. [Google Scholar] [CrossRef]
  57. Lambrechts, M.G.; Pretorius, I.S. Yeast and its importance to wine aroma: A review. S. Afr. J. Enol. Vitic. 2000, 21, 97–129. [Google Scholar]
  58. Shinohara, T. Gas chromatographic analysis of volatile fatty acids in wines. Agric. Biol. Chem. 1985, 49, 2211–2212. [Google Scholar] [CrossRef]
  59. González-Barreiro, C.; Rial-Otero, R.; Cancho-Grande, B.; Simal-Gándara, J. Wine aroma compounds in grapes: A critical review. Crit. Rev. Food Sci. Nutr. 2015, 55, 202–218. [Google Scholar] [CrossRef] [PubMed]
  60. Hopfer, H.; Heymann, H. Judging wine quality: Do we need experts, consumers or trained panelists? Food Qual. Prefer. 2014, 32, 221–233. [Google Scholar] [CrossRef]
Figure 1. Monthly rainfall and mean temperature at the experimental vineyard over the three years studied (2012–2014).
Beverages 04 00076 g001
Figure 2. Percentage of each amino acid over the total amino acids in Mencía musts from different soil management systems averaged for three seasons (2012–2014). The upper and lower graphs depict the major (a) and minor (b) amino acids, respectively. Bars indicate standard errors. Arginine (Arg); glutamine (Glu); alanine (Ala); glutamic acid (Glu acid); threonine (Thr); γ-aminobutyric acid (GABA); serine (Ser); aspartic acid (Asp acid); histidine (His); valine (Val); leucine (Leu); proline (Pro); isoleucine (Ile); tryptophan (Try); phenylalanine (Phe); ornithine (Orn); tyrosine (Tyr); asparragine (Asp); lysine (Lys); methionine (Met); glycine (Gly); cysteine (Cys).
Beverages 04 00076 g002
Figure 3. Principal component analysis (PCA) of Mencía musts: Biplot for the first two components (PC) for the eight most abundant amino acids in musts.
Beverages 04 00076 g003
Figure 4. Sensory profile of Mencía wines (average values for 2012–2014) as a function of the soil management system: (a) Visual, (b) aroma, and (c) palate descriptors.
Beverages 04 00076 g004
Figure 5. Principal component analysis (PCA) of Mencía wines: Biplot for the first two components (PC) for volatile compounds with odor activity values greater than one (lower-case letters) and the sensory descriptors related to wine aroma (capital letters).
Beverages 04 00076 g005
Table 1. General parameters of Mencía musts for the different soil management treatments averaged for three seasons (2012–2014). Data are averages ± standard errors.
AttributeSoil TillageNative VegetationEnglish RyegrassSubterranean CloverStatistical Significance
Total soluble solids (° Brix)22.8 ± 0.722.4 ± 0.522.2 ± 0.721.1 ± 1.1ns
Total acidity (g L−1 tartaric acid)4.1 ± 0.34.0 ± 0.34.5 ± 0.24.8 ± 0.6ns
pH3.85 ± 0.063.79 ± 0.043.74 ± 0.053.65 ± 0.10ns
Tartaric acid (g L−1)5.0 ± 0.15.0 ± 0.05.1 ± 0.15.2 ± 0.1ns
Malic acid (g L−1)3.4 ± 0.23.1 ± 0.23.4 ± 0.13.3 ± 0.3ns
ns = not significant.
Table 2. General parameters of Mencía wines for the different soil management treatments after five months bottled and averaged for three seasons (2012–2014). Data are averages ± standard errors.
AttributeSoil TillageNative VegetationEnglish RyegrassSubterranean CloverStatistical Significance
Alcohol content (% vol.)13.2 ± 0.512.9 ± 0.612.7 ± 0.512.1 ± 0.4ns
Total acidity (g L−1 tartaric acid)4.0 ± 0.74.0 ± 0.74.1 ± 0.43.9 ± 0.2ns
Volatile acidity (g L−1 acetic acid)0.30 ± 0.070.23 ± 0.040.23 ± 0.040.33 ± 0.06ns
pH4.42 ± 0.144.37 ± 0.104.32 ± 0.074.31 ± 0.05ns
Tartaric acid (g L−1)1.8 ± 0.42.0 ± 0.41.7 ± 0.41.9 ± 0.2ns
Malic acid (g L−1)1.5 ± 0.81.4 ± 0.61.4 ± 0.31.7 ± 0.6ns
Lactic acid (g L−1)1.6 ± 0.41.2 ± 0.31.5 ± 0.11.7 ± 0.3ns
Dry extract (g L−1)32.2 ± 3.329.9 ± 2.428.2 ± 1.528.0 ± 1.0ns
Absorbance 420 nm0.349 ± 0.032 ab0.380 ± 0.070 ab0.327 ± 0.012 a0.431 ± 0.063 b*
Absorbance 520 nm0.388 ± 0.047 ab0.394 ± 0.087 ab0.387 ± 0.004 a0.502 ± 0.102 b*
Absorbance 620 nm0.152 ± 0.0180.146 ± 0.0290.132 ± 0.0050.168 ± 0.021ns
Color intensity9.5 ± 0.9 a10.1 ± 1.6 ab9.1 ± 0.7 a10.8 ± 1.3 b*
Color Hue (%)86.9 ± 4.6 b87.1 ± 9.4 b77.9 ± 7.2 a80.5 ± 8.0 ab*
Total Polyphenol Index54.3 ± 3.853.0 ± 7.453.8 ± 3.854.3 ± 4.6ns
Total anthocyanins (mg L−1)570 ± 100571 ± 127606 ± 112562 ± 111ns
Total tannins (g L−1)2.0 ± 0.1 b1.8 ± 0.2 a2.1 ± 0.1 b2.1 ± 0.1 b*
Different letters in the row indicate significant differences among treatments. ns = not significant; * = significant at p < 0.05.
Table 3. Soil management effects on the amino acid concentrations (mean ± standard error, mg L−1) of musts from Mencía averaged for three seasons (2012–2014).
CompoundSoil TillageNative VegetationEnglish RyegrassSubterranean CloverStatistical Significance
Aspartic acid43.5 ± 9.734.8 ± 4.445.3 ± 9.245.8 ± 10.1ns
Glutamic acid81.1 ± 10.759.8 ± 10.180.5 ± 12.962.4 ± 19.4ns
Asparagine6.9 ± 0.44.5 ± 0.48.1 ± 3.15.2 ± 0.6ns
Serine44.9 ± 5.239.5 ± 4.853.2 ± 12.542.0 ± 7.7ns
Glutamine128.1 ± 9.791.7 ± 12.3198.8 ± 98.396.1 ± 20.4ns
Histidine33.0 ± 5.027.9 ± 6.043.1 ± 18.228.6 ± 7.0ns
Glycine3.3 ± 0.63.0 ± 0.43.1 ± 0.42.7 ± 0.4ns
Threonine71.2 ± 13.964.9 ± 15.187.8 ± 32.070.7 ± 19.4ns
Arginine339.4 ± 61.7258.0 ± 62.8361.9 ± 99.1291.0 ± 55.7ns
Alanine111.4 ± 25.590.4 ± 25.8114.7 ± 31.990.1 ± 18.4ns
γ-Aminobutyric acid (GABA)56.8 ± 24.160.7 ± 32.858.9 ± 31.049.3 ± 25.5ns
Proline12.6 ± 3.311.0 ± 3.113.2 ± 4.77.9 ± 3.1ns
Tyrosine6.9 ± 2.55.7 ± 1.78.9 ± 3.17.3 ± 2.3ns
Ammonium ion174.3 ± 21.4162.5 ± 18.2182.8 ± 19.2183.0 ± 23.3ns
Valine24.0 ± 1.022.2 ± 2.135.5 ± 15.720.8 ± 4.8ns
Methionine4.9 ± 2.04.4 ± 1.98.7 ± 5.93.4 ± 1.2ns
Cysteine2.1 ± 0.32.2 ± 0.32.2 ± 0.32.1 ± 0.3ns
Isoleucine12.5 ± 0.413.4 ± 2.121.2 ± 10.610.2 ± 1.9ns
Tryptophan10.8 ± 1.813.3 ± 2.322.6 ± 13.011.3 ± 3.6ns
Leucine15.9 ± 1.314.7 ± 1.625.3 ± 13.112.9 ± 3.2ns
Phenylalanine9.6 ± 1.07.8 ± 0.315.9 ± 7.87.6 ± 1.5ns
Ornithine7.0 ± 0.84.9 ± 1.113.3 ± 8.36.3 ± 2.0ns
Lysine5.9 ± 0.75.2 ± 0.86.1 ± 1.55.2 ± 0.9ns
Sum of amino acids1031.8 ± 118.9839.7 ± 148.51228.3 ± 401.8878.8 ± 162.6ns
ns = not significant. Sum of amino acids does not account for ammonium ion concentration.
Table 4. Soil management effects on the amino acid concentrations (mean ± standard error, mg L−1) of wines from Mencía averaged for three seasons (2012–2014).
CompoundSoil TillageNative VegetationEnglish RyegrassSubterranean CloverStatistical Significance
Aspartic acid53.6 ± 10.735.2 ± 5.140.7 ± 8.038.6 ± 0.7ns
Glutamic acid26.9 ± 9.913.8 ± 4.312.9 ± 5.913.9 ± 6.8ns
Asparagine9.0 ± 4.26.8 ± 3.314.3 ± 7.910.3 ± 5.1ns
Serine13.6 ± 1.78.8 ± 1.910.7 ± 3.110.8 ± 2.6ns
Glutamine3.9 ± 1.32.4 ± 0.74.4 ± 2.33.5 ± 1.3ns
Histidine18.9 ± 3.212.5 ± 1.516.5 ± 5.913.3 ± 2.8ns
Glycine26.4 ± 2.616.9 ± 3.222.5 ± 6.820.0 ± 4.6ns
Threonine12.7 ± 1.58.1 ± 2.110.7 ± 3.511.2 ± 3.3ns
Arginine44.3 ± 18.115.7 ± 3.336.3 ± 21.220.0 ± 11.8ns
Alanine43.8 ± 6.625.4 ± 5.941.7 ± 17.335.2 ± 9.4ns
γ-Aminobutyric acid (GABA)31.7 ± 2.019.7 ± 4.034.9 ± 13.127.7 ± 6.4ns
Proline4833.8 ± 1347.24144.6 ± 1087.34377.5 ± 1673.93892.8 ± 1207.9ns
Tyrosine8.1 ± 3.36.2 ± 2.57.6 ± 3.73.3 ± 2.7ns
Ammonium ion25.6 ± 0.820.8 ± 4.022.7 ± 4.825.1 ± 5.0ns
Valine31.2 ± 6.117.8 ± 3.523.8 ± 9.623.4 ± 5.5ns
Methionine5.9 ± 0.74.0 ± 1.35.1 ± 1.94.5 ± 1.2ns
Cysteine0.9 ± 0.60.8 ± 0.61.0 ± 0.60.7 ± 0.6ns
Isoleucine10.4 ± 1.76.3 ± 1.07.5 ± 2.37.8 ± 1.1ns
Tryptophan4.9 ± 2.13.8 ± 1.74.7 ± 2.23.3 ± 1.4ns
Leucine22.8 ± 5.914.0 ± 4.919.1 ± 7.419.1 ± 5.4ns
Phenylalanine13.0 ± 2.78.3 ± 2.810.9 ± 4.211.1 ± 3.2ns
Ornithine25.6 ± 5.822.4 ± 11.828.8 ± 13.734.9 ± 17.6ns
Lysine33.8 ± 3.521.3 ± 6.127.3 ± 8.926.5 ± 6.0ns
Sum of amino acids441.5 ± 54.1270.1 ± 46.5381.4 ± 126.3338.9 ± 68.7ns
Sum of amino acids does not account for ammonium ion and proline concentrations. ns = not significant.
Table 5. Soil management effects on the concentrations (mean ± standard error) of volatile compounds in wines from Mencía averaged for three seasons (2012–2014).
CompoundSoil TillageNative VegetationEnglish RyegrassSubterranean CloverStatistical Significance
Methanol (mg L−1)171 ± 10 c126 ± 14 a136 ± 12 ab150 ± 13 b**
Ethyl acetate (mg L−1)50 ± 153 ± 851 ± 752 ± 11ns
Acetaldehyde (mg L−1)6 ± 314 ± 68 ± 213 ± 9ns
Higher alcohols (mg L−1)
1-propanol39 ± 637 ± 833 ± 736 ± 9ns
2-methyl-1-propanol43 ± 250 ± 243 ± 250 ± 7ns
2-methyl-1-butanol215 ± 10235 ± 6210 ± 13203 ± 22ns
3-methyl-1-butanol57 ± 466 ± 656 ± 654 ± 6ns
Σ Higher alcohols355 ± 15389 ± 7342 ± 18344 ± 39ns
Other alcohols (mg L−1)
1-hexanol1.7 ± 0.61.8 ± 0.61.7 ± 0.61.9 ± 0.6ns
trans-3-hexen-1-ol0.11 ± 0.040.11 ± 0.020.09 ± 0.020.10 ± 0.04ns
cis-3-hexen-1-ol0.13 ± 0.000.13 ± 0.010.12 ± 0.020.13 ± 0.05ns
Benzyl alcohol3.91 ± 0.263.89 ± 0.633.79 ± 0.513.53 ± 0.63ns
2-phenylethanol25 ± 834 ± 624 ± 323 ± 4ns
Other compounds (mg L−1)
Ethyl lactate31 ± 526 ± 933 ± 1429 ± 10ns
Acetoine12 ± 613 ± 910 ± 311 ± 3ns
Acetol38 ± 434 ± 731 ± 537 ± 8ns
2,3-butanediol levo875 ± 126806 ± 67687 ± 57688 ± 112ns
2,3-butanediol meso293 ± 94269 ± 71224 ± 67227 ± 76ns
Methionol1.23 ± 0.221.02 ± 0.111.08 ± 0.31 1.23 ± 0.42ns
γ-butyrolactone58 ± 1650 ± 1947 ± 1550 ± 10ns
Acetates of higher alcohols (mg L−1)
Isoamyl acetate0.6 ± 0.10.6 ± 0.10.5 ± 0.00.6 ± 0.2ns
2-phenylethyl acetate0.25 ± 0.080.26 ± 0.090.22 ± 0.070.23 ± 0.08ns
Σ Acetates of higher alcohols0.85 ± 0.120.86 ± 0.140.72 ± 0.080.78 ± 0.23ns
Esters (mg L−1)
Ethyl butyrate0.09 ± 0.030.12 ± 0.050.15 ± 0.050.12 ± 0.06ns
Ethyl hexanoate0.11 ± 0.040.15 ± 0.090.19 ± 0.070.18 ± 0.08ns
Ethyl octanoate0.15 ± 0.050.18 ± 0.090.20 ± 0.100.21 ± 0.09ns
Ethyl decanoate0.03 ± 0.020.05 ± 0.030.26 ± 0.200.03 ± 0.02ns
Σ Ethyl esters C6-C100.38 ± 0.130.48 ± 0.260.71 ± 0.360.54 ± 0.25ns
Volatile fatty acids (mg L−1)
Isobutyric acid1.77 ± 0.232.59 ± 0.561.91 ± 0.272.73 ± 1.13ns
Butyric acid1.41 ± 0.231.60 ± 0.391.52 ± 0.351.41 ± 0.53ns
Isovaleric acid1.04 ± 0.141.40 ± 0.161.09 ± 0.131.37 ± 0.50ns
Σ Volatile fatty acids C4-C54.22 ± 0.565.60 ± 1.114.52 ± 0.725.51 ± 1.56ns
Hexanoic acid2.06 ± 0.432.46 ± 0.582.34 ± 0.422.15 ± 0.78ns
Octanoic acid1.55 ± 0.361.67 ± 0.361.80 ± 0.331.43 ± 0.50ns
Decanoic acid0.31 ± 0.060.33 ± 0.070.32 ± 0.100.27 ± 0.10ns
Σ Volatile fatty acids C6-C103.93 ± 0.844.46 ± 1.014.46 ± 0.823.85 ± 0.67ns
Free terpenes (μg L−1)
trans-linalool oxide (furan) a5.8 ± 0.45.6 ± 0.96.5 ± 1.64.8 ± 1.9ns
cis-linalool oxide (furan) a1.9 ± 0.80.8 ± 0.31.1 ± 0.40.9 ± 0.3ns
trans-linalool oxide (pyran) a3.6 ± 0.1 b3.3 ± 0.4 ab1.9 ± 0.4 a2.5 ± 0.9 ab*
cis-linalool oxide (pyran) a1.4 ± 0.31.2 ± 0.21.0 ± 0.30.7 ± 0.4ns
Linalool (L)3.8 ± 1.34.5 ± 1.46.4 ± 2.13.9 ± 1.5ns
Hotrienol (3,7-dimethyl-1,5,7-octatriene-3-ol) a5.3 ± 4.13.9 ± 2.92.7 ± 1.56.3 ± 2.7ns
α-terpineol (αT)3.9 ± 0.63.0 ± 0.64.0 ± 0.34.7 ± 1.6ns
Citronellol (C)16.6 ± 0.817.8 ± 0.114.9 ± 3.020.0 ± 7.2ns
Nerol (N)17.2 ± 5.810.8 ± 4.119.4 ± 6.517.3 ± 6.0ns
Geraniol (G)30.7 ± 3.334.0 ± 1.536.1 ± 8.032.9 ± 11.0ns
Σ Free terpenes (L + αT + C + N + G)83.8 ± 13.880.9 ± 6.986.8 ± 11.194.0 ± 31.4ns
Hodiol I (trans-3,7-dimethyl-1,5-octadiene-3,7-diol) a4.9 ± 2.04.9 ± 2.54.2 ± 2.13.2 ± 1.3ns
2,7-dimethyloctane-4,5-diol a119.9 ± 9.7112.0 ± 5.0110.3 ± 18.599.5 ± 38.2ns
Different letters in the row indicate significant differences among treatments according to Tukey’s test. ns = not significant; * = p < 0.05; ** = p < 0.01. a indicates that the compound is expressed in μg L−1 of internal standard (4-decanol).
Table 6. Soil management effects on the odor activity values (mean ± standard error) of volatile compounds in wines from Mencía averaged for three seasons (2012–2014).
CompoundOdor Threshold (μg L−1)DescriptorSoil TillageNative VegetationEnglish RyegrassSubterranean CloverStatistical Significance
Ethyl acetate7500Pineapple6.6 ± 0.17.0 ± 1.06.8 ± 1.07.0 ± 1.4ns
Acetaldehyde500Fruity13.0 ± 5.527.4 ± 12.816.0 ± 4.225.4 ± 17.6ns
Higher alcohols
1-propanol750Alcohol52.2 ± 7.549.6 ± 11.243.9 ± 9.848.2 ± 11.3ns
2-methyl-1-propanol40,000Alcohol1.1 ± 0.11.3 ± 0.11.1 ± 0.01.3 ± 0.2ns
Other alcohols
Benzyl alcohol620Blackberry6.3 ± 0.46.3 ± 1.06.1 ± 0.85.7 ± 1.0ns
2-phenylethanol14,000Rose1.8 ± 0.12.4 ± 0.41.7 ± 0.21.7 ± 0.3ns
Other compounds
Acetoine10,000Butter, almond1.2 ± 0.61.3 ± 0.91.0 ± 0.31.1 ± 0.3ns
Acetates of higher alcohols
Isoamyl acetate30Banana19.1 ± 3.919.6 ± 4.216.6 ± 1.718.4 ± 1.6ns
2-phenylethyl acetate250Rose, honey1.0 ± 0.01.1 ± 0.00.9 ± 0.00.9 ± 0.0ns
Esters
Ethyl butyrate20Fruity4.7 ± 1.35.9 ± 2.67.3 ± 2.36.2 ± 2.7ns
Ethyl hexanoate14Fruity7.5 ± 3.210.4 ± 6.713.8 ± 4.812.7 ± 5.9ns
Ethyl octanoate5Fruity30.7 ± 9.836.9 ± 17.940.7 ± 19.141.3 ± 18.5ns
Volatile fatty acids
Isobutyric acid2300Cheese0.8 ± 0.11.1 ± 0.20.8 ± 0.11.2 ± 0.4ns
Butyric acid173Cheese8.1 ± 1.39.2 ± 2.38.8 ± 2.08.1 ± 2.0ns
Isovaleric acid33Cheese31.7 ± 4.142.5 ± 4.832.9 ± 3.941.4 ± 8.3ns
Hexanoic acid3000Cheese0.7 ± 0.10.8 ± 0.20.8 ± 0.10.7 ± 0.1ns
Octanoic acid500Rancid3.1 ± 0.73.3 ± 0.73.6 ± 0.72.9 ± 0.4ns
Free terpenes
Geraniol30Flower1.0 ± 0.11.1 ± 0.11.2 ± 0.31.1 ± 0.1ns
ns = not significant. Only the compounds with odor activity values greater than 0.5 are shown. Odor thresholds have been taken from Guth (1997) and Ferreira et al. (2000) [33,34].

