Article

Increasing the Sustainability of the Coffee Agro-Industry: Spent Coffee Grounds as a Source of New Beverages

1
CEB–Centre of Biological Engineering, University of Minho, Campus Gualtar, 4710-057 Braga, Portugal
2
Novo Nordisk Foundation Center for Biosustainability, Technical University of Denmark, Kemitorvet, Building 220, 2800 Kongens Lyngby, Denmark
3
Misión Biológica de Galicia (CSIC), P.O. Box 28, 38080 Pontevedra, Spain
*
Author to whom correspondence should be addressed.
Beverages 2018, 4(4), 105; https://doi.org/10.3390/beverages4040105
Submission received: 19 November 2018 / Revised: 9 December 2018 / Accepted: 11 December 2018 / Published: 17 December 2018
(This article belongs to the Special Issue Valorization of Beverage Industry By-products)

Abstract

:
This work describes a new process for the production of beverages from spent coffee grounds (SCG), as well as the chemical and sensory profiles. The process consisted of the extraction of antioxidant phenolic compounds of SCG, followed by the fermentation of this extract supplemented with sucrose and fermented broth distillation. Thus, two fermented (10.4% and 10.0% of ethanol, by volume) and two distillated (38.1% and 40.2% of ethanol, by volume) beverages were obtained. A total of 45 and 59 volatile compounds (alcohols, esters, aldehydes, terpenes, lactones, pyrazines, norisoprenoids, volatile phenols and acids) identified and quantified by GC-MS characterized the aroma and flavor of the fermented and distilled beverages, respectively. Twenty sensory descriptors define the sensory profile of the two beverages which corroborated the pleasant smell and taste of coffee in the distillate beverage. Therefore, this work demonstrates that the fermented and distilled beverages obtained from spent coffee grounds have acceptable organoleptic qualities that make them suitable for human consumption.

1. Introduction

Spent coffee grounds (SCG) that are obtained during the process of raw coffee powder production to prepare instant coffee is a waste generated in large amounts in the coffee industry [1]. This waste has a composition rich in compounds of industrial interest such as carbohydrates, proteins, and high levels of phenolic compounds with significant antioxidant activity [2]. This residue presents an extraordinary residual aroma of roasted coffee beans, being an interesting feedstock for the production of a new distilled beverage [3].
The beverage industry has shown great interest in the development of new products from different raw materials, so the development of products with flavor extracts and natural flavors has received great emphasis due to restrictions on the use of synthetic chemicals in foods and beverages [4]. The use of fruit in the preparation of fermented alcoholic or distilled beverages is a form of exploitation in order to avoid waste when it is not possible to have immediate consumption, as well as to generate new applications and technologies [3].
Microwave-assisted extraction (MAE) is a technology of interest to the industry, which represents an alternative to conventional extraction processes [5]. This technique has little impact on the environment, compared to traditional techniques, and MAE has aroused great interest for its application in the extraction of high-value compounds. Machado [6] evaluated the extraction of sugars and antioxidant phenolic compounds from SCG through the technique of MAE and determined the operating condition that maximizes the release of the compounds, at which the optimum point for extraction was achieved (microwave power at 71%, extraction time 20 min, pressure 827.6 kPa, and using solvent/solid ratio of 20 mL/g SCG).
Fermented and distilled beverages are famous for containing a considerable amount of volatile compounds that arise during the fermentation, distillation, and storage processes. The composition and concentration of such compounds may vary widely from beverage to beverage [7]. So, the identification of these compounds has a high importance, because it allows determination of the flavor characteristics of the beverage, in order to identify anomalies that may occur during the manufacturing process. The sensory attributes are also one of the most important features to be considered when developing a new product, since they are the feature of the product and largely contribute to its acceptability in the market. Sensory evaluation methods are extensively used in wine, beer, and distilled beverage characterization [3]. The sensory analyses are made using Quantitative Descriptive Analysis (QDA), which is the best method to identify and quantify a beverage’s sensory attributes [8].
The aim of this work was to study the process for the elaboration of fermented and distilled beverages from SCG, as well as chemical characterization of volatile compounds and determination of the sensory profile.

2. Materials and Methods

2.1. Sample Material and Chemicals

The raw material used was spent coffee grounds (SCG) which was supplied by a Portuguese company of reference in this sector NovaDelta–Comércio e Indústria de Cafés, Lda (Campo Maior, Portugal). The provided material was dried in an oven at 60 °C until approximately 10% moisture content and stored afterwards for use in the following steps. The chemical composition of SCG was determined according to Sampaio et al. [3], consisting of (g/100 g): glucan (8.6), arabinan (1.7), galactan (13.8), mannan (21.2), protein (13.6), lignin (32.1), ashes (1.6), acetyl groups (2.2), and extractives (5.2).

2.2. Extraction Process and Fermentation Medium

In the first step, the SCG was submitted to a microwave-assisted extraction process aiming to extract antioxidant phenolic compounds, using the optimum point previously obtained [6]. Prior to extraction, SCG was mixed with water using water (mL) to material (g) ratio 20:1. The extraction conditions consisted were as follow microwave power 71%, pressure 827.6 kPa, time 20 min. In the end, the residual solid material was separated by vacuum filtration and the SCG extract obtained was stored at 5 °C. In the following step, for fermentation medium, SCG extract was supplemented with 135 g to 576 g of sucrose to a final concentration of 180 g/L sucrose and 0.13125 g to 0.55 g in the concentration of 175 mg/L potassium metabisulfite, for the two different methods of fermentations realized [9]. The pH was adjusted between 5 and 5.5 by adding up calcium carbonate in order to proceed with the fermentation with the yeast Saccharomyces cerevisiae.

2.3. Microorganism and Inoculum Preparation

The fermentations of SCG extract were performed with Saccharomyces cerevisiae (RL–11), previously reported to be able to produce ethanol from this fermentation medium [10]. Cultures of this yeast were maintained at 4 °C in Petri dishes containing malt extract agar prepared with the following composition (g/L): yeast extract (3.0), malt extract (3.0), peptone (5.0), glucose (10.0), and agar (20.0).
In order to obtain the inoculum, the yeast (S. cerevisiae) was cultured in a semisynthetic culture medium composed by (g/L): glucose (30.0), (NH4)2HPO4 (3.0), MgSO4·7H2O (1.0), and yeast extract (3.0). The concentrated solutions of each compound were prepared separately and sterilized in an autoclave at 121 °C for 20 min. Additionally, glucose and yeast extract were autoclaved at 112 °C for 15 min. The obtained solutions were mixed aseptically in a laminar flow hood to obtain the desired concentration of each nutrient in the culture medium. The inoculum was prepared by pitching cells from the Petri dishes that were inoculated in 500 mL Erlenmeyer flasks containing 200 mL of the medium of fermentation and incubated on a rotary shaker at 30 °C, 200 min−1, 24 h.

2.4. Fermentation and Distillation Conditions

The fermentation assays were performed by two different methods, each in duplicate. The first method was conducted in a 6.5 L bioreactor (B. Braun Biotech International, Melsungen, Germany) containing 3 L of fermentation medium inoculated at an initial cell concentration of 1 g/L. Fermentations were incubated at 30 °C with continuous stirring at 150 min−1. During the fermentations, samples were collected from the fermentation broth, and immediately centrifuged (5000× g, 10 °C, 15 min) for separation and determination of the concentration of biomass. The obtained supernatant was filtered by sterile cellulose acetate membrane of 0.2 µm and used for determining the total sugars concentration in order to determine the end of the fermentation. At the end of the fermentation, the fermented broth was centrifuged (5000× g, 10 °C, 15 min) to separate the biomass, and the liquid phase was stored at 4 °C for further distillation. This method was used for the production of distilled beverages.
The second method was performed in 2 L Erlenmeyer flasks containing 75 mL of fermentation medium inoculated at an initial cell concentration of 1 g/L. The inoculated flasks were incubated at 30 °C on a rotary shaker at 150 min−1. The remaining process was done similarly but, in this time, the final products were the fermented beverages.
The distillation of fermented broth was done using a system comprising a vigreux column (36 cm of length), a condenser, a heating mantle, and a 4 L flask filled with 1 L to 1.5 L of fermented broth. After the fermentations by the first method, the fermentation medium was split in three similar shares to be distilled. The first fermentation medium was split in one share with a volume of 1.2 L and the two other ones with about 1.1 L. The second fermentation medium was split in one share with a volume of 1.2 L, another one with about 1 L and the last one with 1.25 L. During the distillation were recovered samples of approximately 5 mL to 25 mL of different fractions of distilled product, at different temperatures (70 °C, 80 °C, and 90 °C) and the ethanol content in each one of them was determined by HPLC. In this process, there are three fractions according to their ethanol content: the foreshot or “head” (>70 mL/100 mL), the middle cut or “heart” (70 mL/100 mL to 40 mL/100 mL), and the feints or “tail” (<40 mL/100 mL). The fraction corresponding to the heart was corrected for an ethanol concentration to 40 mL/100 mL by adding SCG extract and was stored in glass bottles with caps and plastic coverings at room temperature for chemical and sensory analyses.

2.5. Analytical Methods

The cell concentration was measured by the dry weight of a sample which was dried at 105 °C to constant weight. The biomass was obtained by the weight difference between the crucibles before and after the addition and in a further phase the samples were dried out. The cell concentration was expressed as dry weight per volume. The total amount of sugars in the concentration was determined by the anthrone method [11]. Standard glucose solutions were prepared with concentrations between 0.1 g/L and 0.7 g/L. Then, 0.5 mL of each solution (or water, for the blank) was transferred to test tubes where 1 mL of anthrone solution was added and then the tubes were placed on ice to cool. After cooling, the tubes were placed in a bath at 80 °C for 15 min and then allowed to cool in an ice bath. Finally, the absorbance was read at 630 nm. The concentration of ethanol was determined by high-performance liquid chromatography (HPLC) on a Jasco chromatograph (Jasco, Tokyo, Japan) that is equipped with a refractive index detector and a Varian Metacarb 67H column (300 mm × 6.5 mm). To operate, the conditions consisted in using a temperature of 60 °C, 5 mmol/L sulfuric acid as eluent at a flow rate of 0.7 mL/min and also a sample volume of 20 µL. The ethanol content, expressed as volumetric percentage was obtained with the ratio between formed product, expressed as mass concentration and the density of ethanol (0.789 g/mL).
The major volatiles were evaluated after adding 100 µL of an ethanolic solution of 4.02 g/L of internal standard (4-nonanol) to 5 mL of sample. The analysis was performed with the injection of 1 µL of the sample. The volatile compounds were studied in a Chrompack CP–9000 gas chromatograph (Chrompack, Middelburg, The Netherlands) equipped and a split/splitless injector and a flame ionization detector (FID) and a capillary column, coated with Meta–Wax (30 m × 0.25 mm, 0.2 µm film thickness). The injector and detector temperatures were both set to 250 °C at the split ratio of 15:1 mL/min. The oven temperature was held at 50 °C for 2 min, then programmed to rise from 50 °C to 177.5 °C, at 5 °C/min, and then programmed to rise again from 177.5 °C to 225 °C, at 10 °C/min, and finally maintained at 220 °C for 20 min. The carrier gas was helium 4× at an initial flow rate of 1 mL/min.
The minor volatile compounds were evaluated by addition of 100 µL of an ethanolic solution of 40.2 mg/L of internal standard (4-nonanol) to 8 mL of sample. The extraction was performed through mixing the sample with 400 µL of dichloromethane for 15 min on a magnetic stir plate [12]. Then, after cooling at 0 °C for 10 min, the organic phase was separated by centrifugation (5118× g, 5 min, 4 °C). The volatile compounds were examined by GC–MS (Varian 3800 GC gas chromatograph equipped with a 1079 injector, and a Varian Saturn 2000 ion–trap mass detector). Each 1 µL extract was injected in splitless mode (30 s), in a Sapiens–Wax MS column (30 m × 0.15 mm, 0.15 µm film thickness). The carrier gas was helium 4× at a constant flow rate of 1.3 mL/min. The detector was used in electron impact mode with ionization energy of 70 eV and acquisition mass range (m/z) between 35 and 300, acquiring at intervals of 610 ms. The oven temperature was held at 60 °C for 2 min, then programmed to rise from 60 °C to 234 °C, at 3 °C/min, and then programmed to rise again from 234 °C to 260 °C, at 5 °C/min. Finally, was maintained at 260 °C during 5 min. The injector’s and transfer line temperatures were maintained at 250 °C during the analysis time and a split flow rate of 30 mL/min.
The identification of volatiles was performed using the software Star-Chromatography Workstation version 6.9.3 (Varian, Walnut Creek, CA. USA) by comparing the mass spectra and retention indices with those of pure reference compounds [12]. All compounds were quantified as equivalents of 4-nonanol. The distillate samples were pre-diluted with water to 15/40 and fermented samples did not undergo any dilution. Each sample was extracted in triplicate.

2.6. Sensory Analysis

Sensory analysis of beverages was carried out by five trained panelists from Appellation Orujo de Galicia (Galicia, Spain). The sensory analysis was performed in a professional-standard room [13]. The evaluation was carried out in two sessions. In the first one, descriptors of the fermented and distillate samples were established by using the QDA methodology [8]. Two training periods of 1 h were carried out, where judges generated descriptive terms in visual, olfactory, and gustatory phases to define the spirits. In the second session, a constant sample volume of 30 mL of each fermented and spirit beverage was evaluated in spirit-taster glasses at 12 °C. The panelists scored the intensity of each attribute using a 9-point scale, where 9 indicated a very high intensity. The descriptors were classified for each beverage by using the Geometric Mean (GM) according to the ISO Norm 11035 [14,15].

3. Results

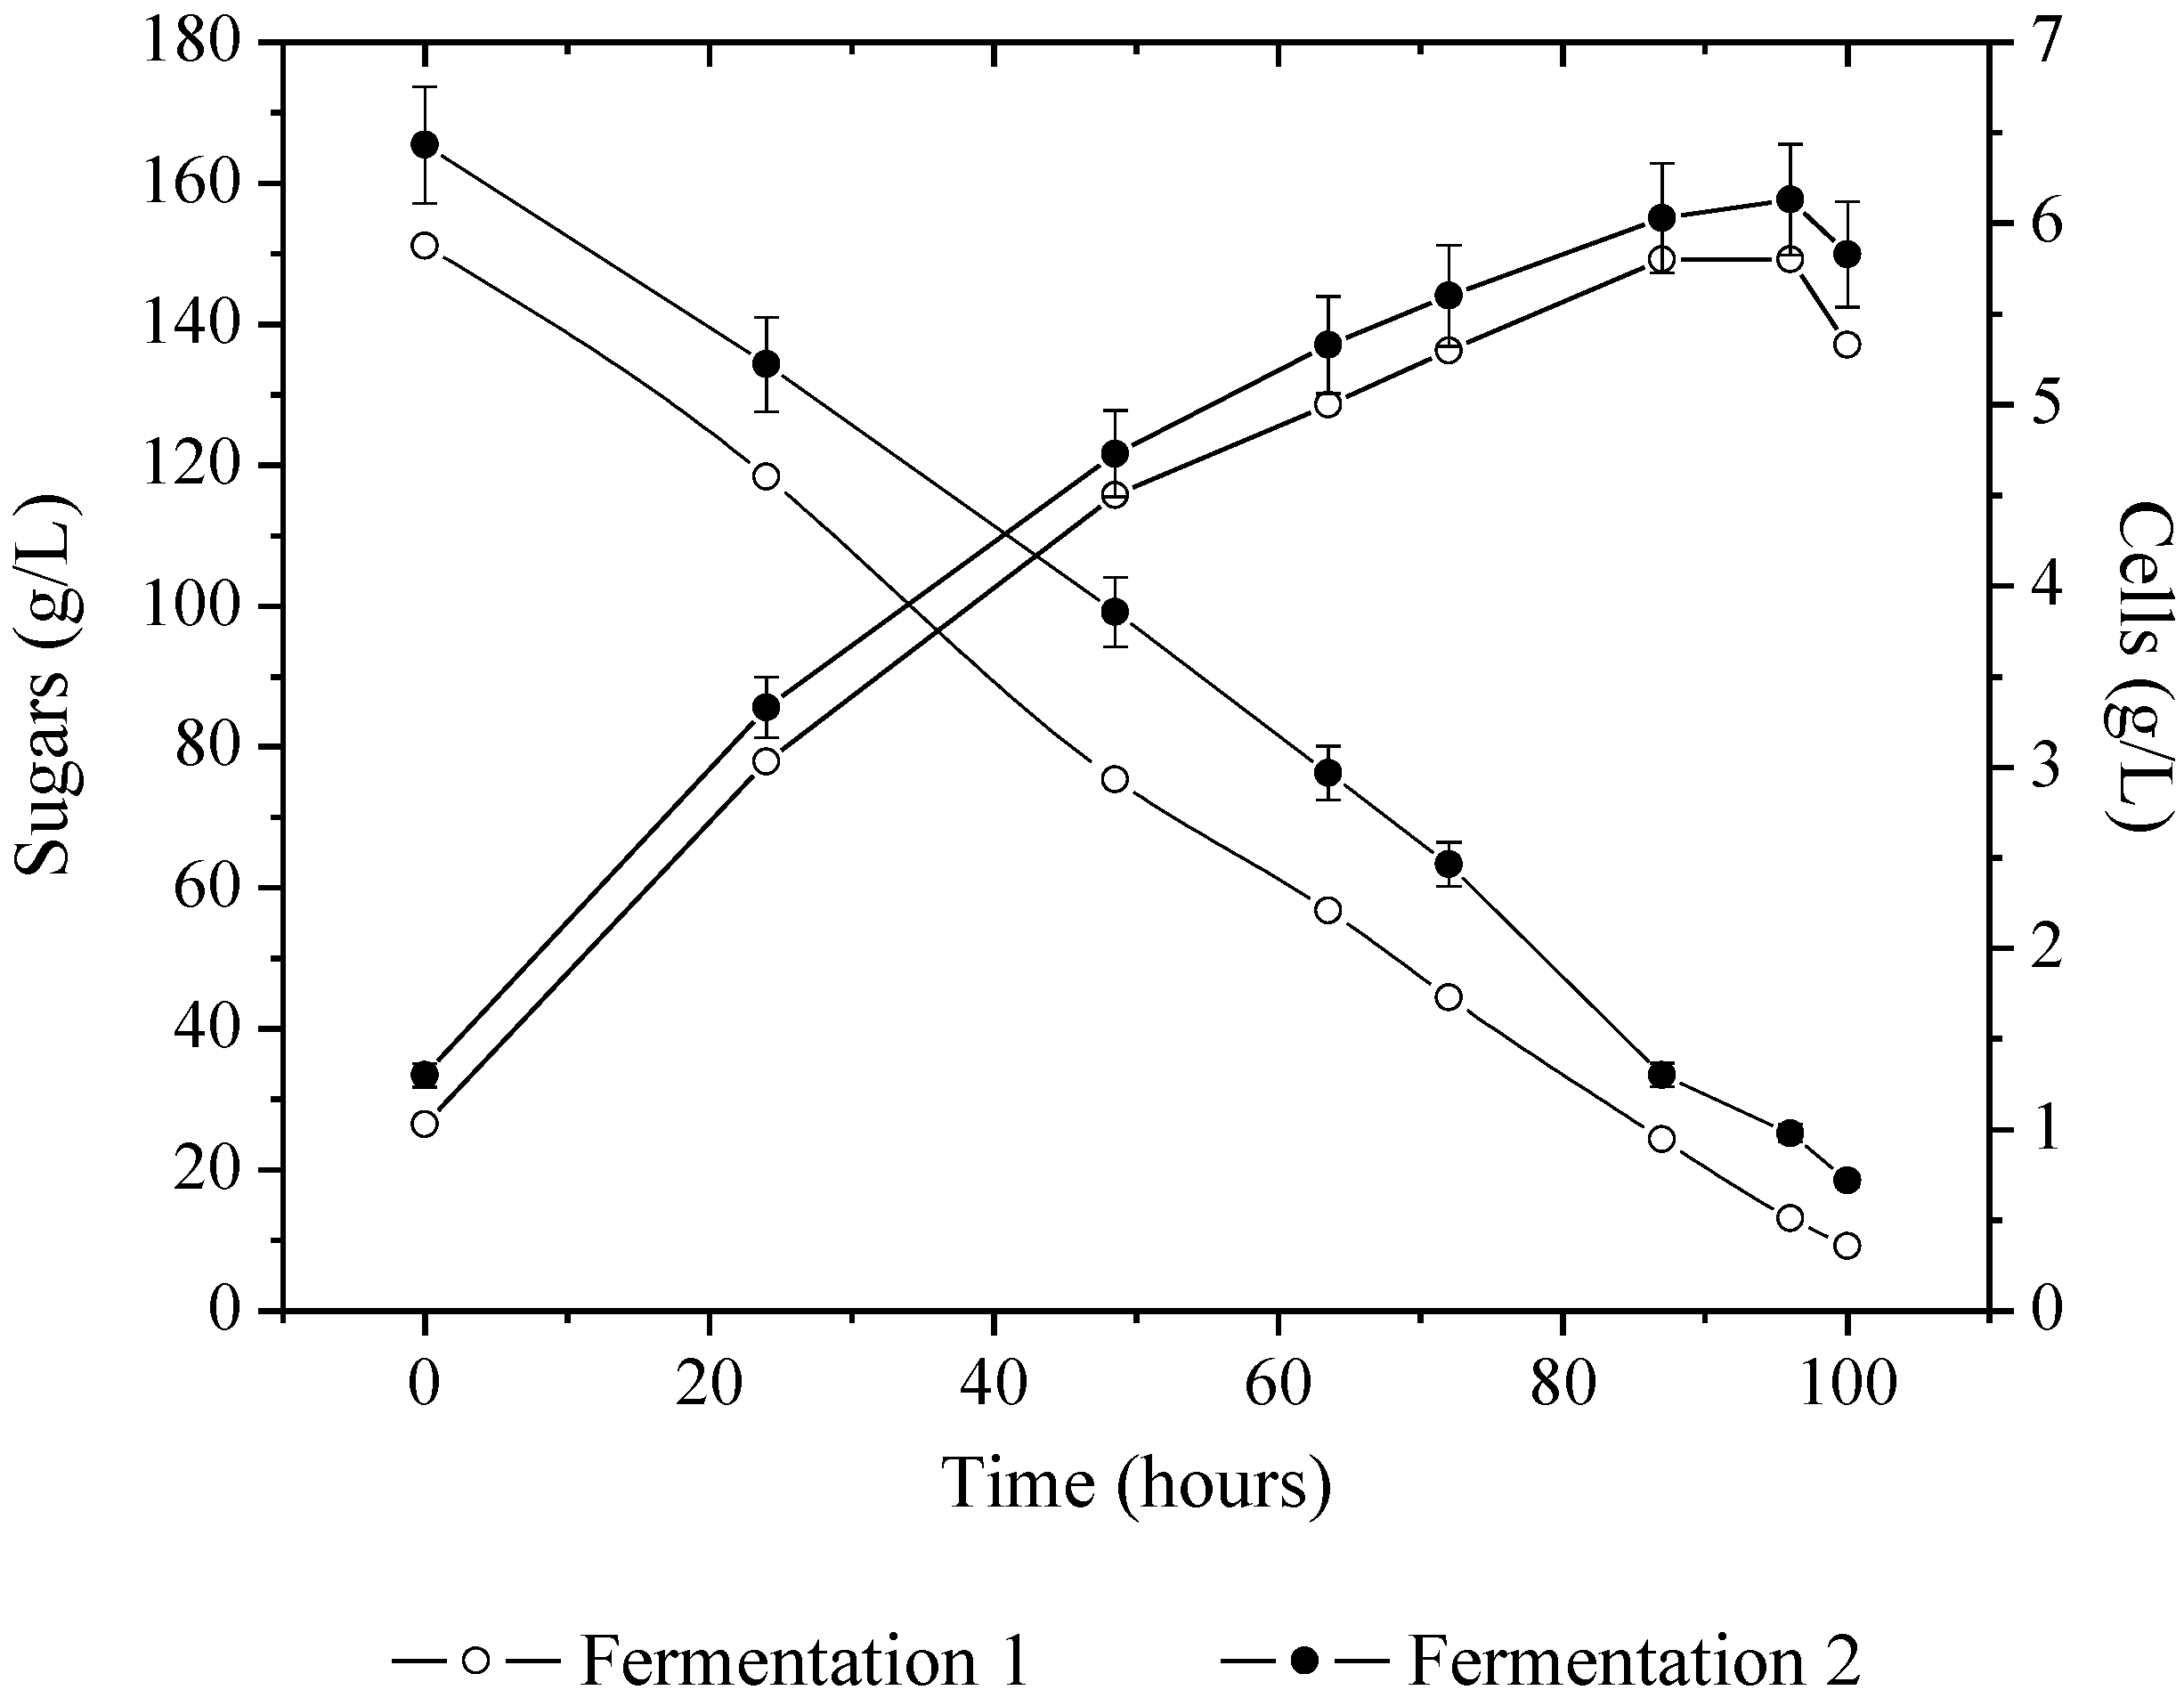
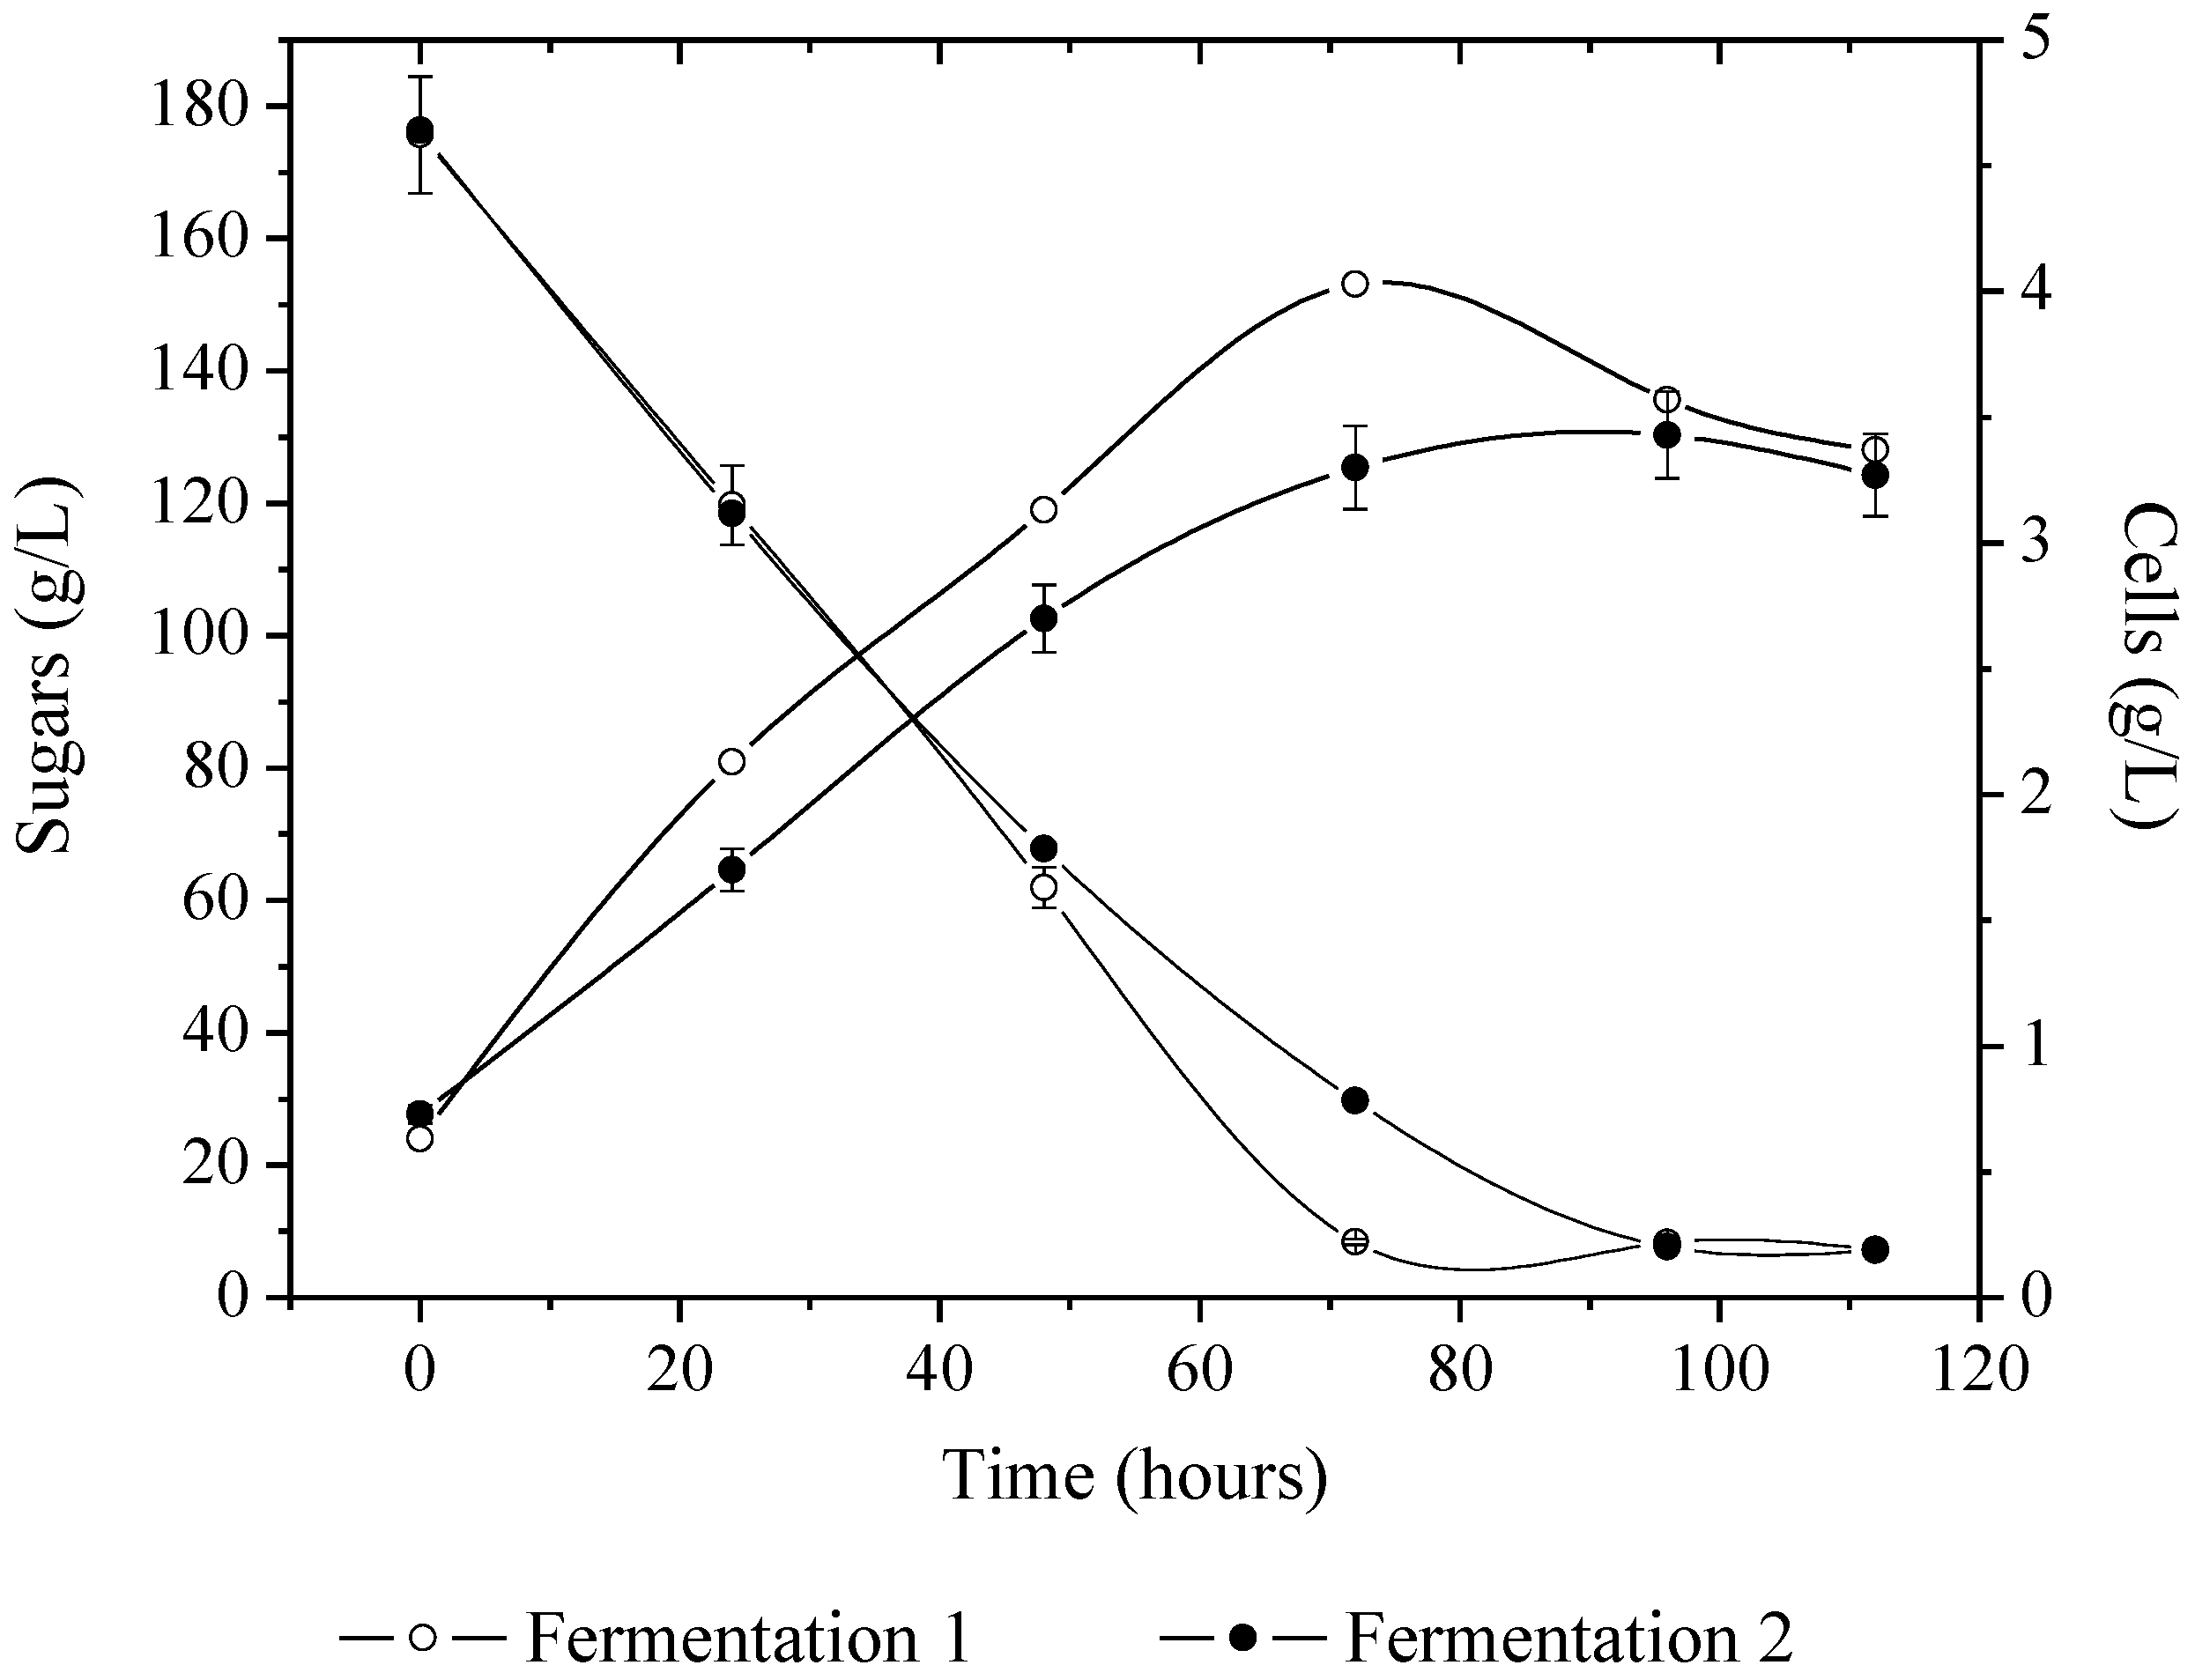
3.1. Beverage Production

In the first method, two fermentations were performed that afterwards were submitted to a distillation process in order to obtain two distilled beverages: distilled beverage 1 (D1) and distilled beverage 2 (D2). The kinetic behavior of sucrose consumption and cell growth of S. cerevisiae RL–11 cultivated in this medium is shown in Figure 1. During the two fermentations it was possible to verify that the yeast consumed practically all the sugar in the fermentation medium, in 100 h of processing (Figure 1). Part of this carbon source that was consumed was employed for cellular growth and the rest was used for the production of ethanol. The cellular concentration in these two media increased in an equivalent way from 1 g/L until the maximum of 5.80 g/L for fermentation 1 and 6.13 g/L for fermentation 2, showing that the yeasts remained very active during the fermentation process.
In the second method, two more fermentations were performed, resulting in two fermented beverages: fermented beverage 1 (F1) and fermented beverage 2 (F2). The kinetic behavior of sucrose consumption and cell growth of S. cerevisiae RL–11 cultivated in this medium for this method are shown in Figure 2. During the two fermentations, it was possible to verify that the yeast consumed practically all the existent sugar in the fermentation medium in 112 h of processing (Figure 2). In comparison with the first method it was able to observe a 12 h disparity for the end of the process. The cellular concentration in these two mediums has increased in a very equivalent way, from 0.63 g/L until the maximum of 3.37 g/L for fermentation 1 and 3.27 g/L for fermentation 2, but in comparison with the first method, these results were lower. At the end of these fermentations, we had obtained two fermented beverages with a volumetric percentage of 10.4% and 10.0% of ethanol, fermented beverage 1 (F1) and fermented beverage 2 (F2), respectively.
An efficient conversion of sugars to ethanol by the yeast is advantageous for the process, as the greater the ethanol content in the fermented broth, the greater the volume of spirit that can be achieved. This yeast strain is reported to have great capacity to convert sugars to ethanol, so it is recommended for the production of alcoholic beverages [3].
The different fractions of distillate collected accordingly to the conditions previously optimized by Dragone et al. [16] were characterized for their ethanol content. The fractions with a volumetric percentage between 40% and 70% were mixed to form the distillate heart. After mixing the collected fractions near these values, we obtained two distilled beverages: the first one (D1) with a volumetric percentage of 66.1% of ethanol and the second one (D2) with a volumetric percentage of 58.8% of ethanol. These drinks were afterwards diluted with an extract collected by microwave-assisted extraction, which was previously filtrated, instead of water, to have a more intense flavor of coffee and thus getting a final volumetric percentage of 38.1% and 40.2% of ethanol, distilled beverage 1 (D1) and distilled beverage 2 (D2), respectively.

3.2. Volatile Composition of Fermented and Spirit Beverages

Major and minor compounds were analyzed in the fermented and distillate beverages. The major volatile compounds are usually formed during the fermentation process, with their formation influenced by the conditions used. On the other hand, the minor volatile compounds are largely from the raw material used, so they are responsible for the distinctive aroma in the produced beverage. The improvement of the aroma was attributed to the modification of the composition of aroma precursors in green coffee beans observed following fermentation [17]. On the other hand, a coffee with a distinctive aroma of fruits could be produced using the starter cultures in coffee. The selection of yeast strains has great potential for use as starter cultures and to help standardize the fermentation process and produce coffee beverages with novel and desirable flavor profiles [18].
In fermented beverage 1 (F1) the most present compound was acetaldehyde (339.6 mg/L), followed by two higher alcohols, i.e., 2-methyl-1-propanol (152.1 mg/L) and 3-methyl-1-butanol (106.8 mg/L) (Table 1). Ethyl acetate was also detected in fermented beverage F1 at a concentration of 73.5 mg/L. Ethyl acetate contents between 50 mg/L to 80 mg/L contribute positively to the beverage aroma [19], while values above 150 mg/L provide deterioration characteristics [20]. In fermented beverage 2 (F2), an increase of isobutanol and a decrease of acetaldehyde was observed. This can be explained by the fact that after the production of the fermented beverages, they weren’t properly stored at a temperature of −20 °C, but rather at a temperature of 5 °C in a cold room. In these circumstances, some changes of fermented beverages 1 and 2 may have occurred.
The majority of volatile compounds largely presented in the distilled beverages from SCG were higher alcohols as shown in Table 1. In distilled beverage 1 (D1), isoamyl alcohol (3-methyl-1-butanol), isobutyl alcohol (2-methyl-1-propanol), 2-phenylethanol, and active amyl alcohol (2-methyl-1-butanol) were found with highest quantities (191.1 mg/L, 49.4 mg/L, 35.6 mg/L and 31.5 mg/L, respectively). On the other hand, for distilled beverage 2 (D2), the volatile compounds that obtained highest concentrations were 3-methyl-1-butanol, 2-methyl-1-propanol, and 2-methyl-1-butanol (633.2 mg/L, 222.0 mg/L, and 137.1 mg/L, respectively), increasing the beverage’s aroma compounds concentration.
The concentration of these compounds in D2 is comparable to the values found by Sampaio et al. [3] and Dragone et al. [21]. Sampaio et al. [3] showed contents of 810 mg/L, 269 mg/L, and 185 mg/L of 3-methyl-1-butanol, 2-methyl-1-propanol, and 2-methyl-1-butanol, respectively, for a distillate prepared from the spent coffee grounds hydrolysate. Dragone et al. [21] prepared a distillate from cheese whey, which contained 887 mg/L of 3-methyl-1-butanol, 542 mg/L of 2-methyl-1-propanol, and 176 mg/L of 2-methyl-1-butanol. Additionally, the relations 3-methyl-1-butanol/2-methyl-1-propanol, and 2-methyl-1-propanol/1-propanol, are considered indicative of the quality of the drink and must be greater than one unit [3]. In our study, distillates D1 and D2 showed this relation >1.
Among the identified and quantified esters, ethyl acetate was the most abundant (7.8 mg/L and 18.7 mg/L for the D1 and D2, respectively), as well as acetaldehyde (6.3 mg/L and 19.6 mg/L for the D1 and D2, respectively). The concentration of this compound in the distillate was less than the amount reported for other spirits, such as spent coffee grounds spirit (80 mg/L) [3], cheese whey spirit (36.7 mg/L) [16], bagaceiras (600 mg/L) [22], and orujo (262 mg/L) [23]. Ethyl acetate and acetaldehyde are the major compounds responsible for the flavor of alcoholic beverages and their amounts determine the quality of the distillate [16,20]. Ethyl acetate has a significant effect on the organoleptic characteristics of distillates. The presence of this ester in low concentrations results in a pleasant aroma with fruity properties, which turns vinegary at levels above 150 mg/L, providing features of deterioration to the beverage [20]. On the other hand, low concentrations of acetaldehyde in SCG spirit are interesting since it gives an aroma of walnuts, sherry, and ripe apples. Higher concentrations than 125 mg/L for this compound negatively affect the organoleptic properties of the beverage [3].
In SCG distillate, other major volatile compounds were identified and quantified, such as 1-propanol, 2-phenylethanol, and methanol, but in lower concentrations (Table 1). Low concentrations of 1-propanol promote a pleasant, sweet odor, but very high concentrations of this compound exhale an odor of “solvent” that does not allow one to detect the positive odors of the distillate [24]. The concentration obtained in distillates D1 and D2 was 23.2 mg/L and 35.7 mg/L, respectively; low values that did not impair the odor of the beverages. For 2-phenylethanol, values of 35.6 mg/L and 21.5 mg/L, respectively, were obtained for distillates D1 and D2. Low concentrations of this compound provide a sweet and rose-like aroma to the distillate [25].
The presence of methanol in the distillate of SCG was also confirmed at a very low concentration (14.0 mg/L and 7.6 mg/L for D1 and D2, respectively). Many distillates contain this compound at low concentrations, which is a positive aspect due to the toxicity of this compound. Methanol can be harmful to the human health when present in high concentrations (>4000 mg/L). According to Regulation (EC) No 110/2008 of the European Parliament and of the Council, the legal limit for this compound in this kind of beverages is 1000 mg/hL in 100% volume of ethanol [26].
The difference in the values between the two distilled beverages can be explained by the fact that in the first distilled beverage the collected fractions were not made in the most effective way, since they were performed according to Sampaio et al. [3]. It was verified that for this work the same mode of collection could not be followed, once higher values of alcoholic degree were obtained from the fractions collected by this author, which led to only two fractions collected between 40% and 70% ethanol for the “heart of the distillate”. However, in the second distilled beverage, the quantities of fractions to be collected for a certain temperature were modified, and thus more than two fractions could be added. Considering this aspect, the distilled beverage produced from SCG may be considered as having organoleptic quality acceptable for human consumption.
Table 2 shows the minor volatile compounds concentrations, as 4-nonanol equivalents, identified in fermented and distillate SCG. Fermented beverages (F1 and F2) were characterized mainly by volatile acids with the highest concentration for hexanoic, octanoic, and 2-methylpropanoic acids. The most abundant compound in fermented beverages was 2-furanmethanol (308.4 µg/L for F1 and 329.5 µg/L for F2). This compound was found in the headspace of the oil obtained from the coffee residue and was identified as being responsible for the coffee-like aroma [27]. Among terpenes, nerol was quantified in fermented beverages but at a low concentration (2.7 µg/L and 1.0 µg/L for F1 and F2) below its odor threshold (400 µg/L; [28]).
Although the minor compounds are found in low concentrations in distilled beverages, they are of great importance to their aroma. In fact, compounds appearing in trace quantities in alcoholic beverages quite frequently have a greater influence on their sensory properties than those compounds that appear in high concentrations [7]. Among the minor volatile compounds identified in the SCG spirits, the volatile acids were the most abundant, followed by esters. Among volatile acids, hexanoic, octanoic, and decanoic acids were in high concentration in SCG distillates D1 and D2, but these acids are reported to have low flavor effects in the distillates [29].
The most abundant esters were ethyl octanoate (239.4 µg/L and 698.0 µg/L for D1 and D2), ethyl hexanoate (57.9 µg/L and 156.9 µg/L for D1 and D2), and 2-phenylethyl acetate (104.7 µg/L and 126.4 µg/L for D1 and D2). Sampaio et al. [3] showed higher values for SCG spirit (842 µg/L of ethyl octanoate, 337 µg/L of ethyl hexanoate and 130 µg/L of 2-phenylethyl acetate). These compounds contribute a pleasant fruity flavor and floral aroma to the drink [30]. On the other hand, 4-vinylguaiacol was the most abundant phenol volatile in D1 and D2 SCG distillates. 4-vinylguaiacol and 4-vinylphenol identified in the steam volatile concentrate were considered to be produced from ferulic and p–coumaric acids during steam-distillation of rice bran [31]. 4-Vinylguaiacol had the greatest impact on the flavor of ground coffee [32].
Pyrazines also are present in SCG distillates D1 and D2 but in low concentrations. Pyrazines are heterocyclic aromatic compounds containing a six-membered ring with two nitrogen atoms in positions 1 and 4, and they occur naturally in vegetables and insects. Pyrazines are the products of primary and secondary metabolic processes that take place in some microorganisms. In the case of agricultural distillates, pyrazines are the products of the Maillard reaction, which occurs when thermal processing is not optimal [33].
Among the aldehydes, furfural was identified at a high level in the distillates D1 and D2. This compound is formed during processes that involve heating or roasting, e.g., roasting of coffee beans and/or distillation, due to degradation of fermentable pentose sugars, caused by heating in acid conditions, and/or Maillard reaction [34,35,36]. Thus, high amounts of furfural might be attributed to the presence of high quantities of residual pentose sugars due to unfavourable fermentation conditions of the substrate. Its odour is reminiscent of bitter almond and cinnamon [20].

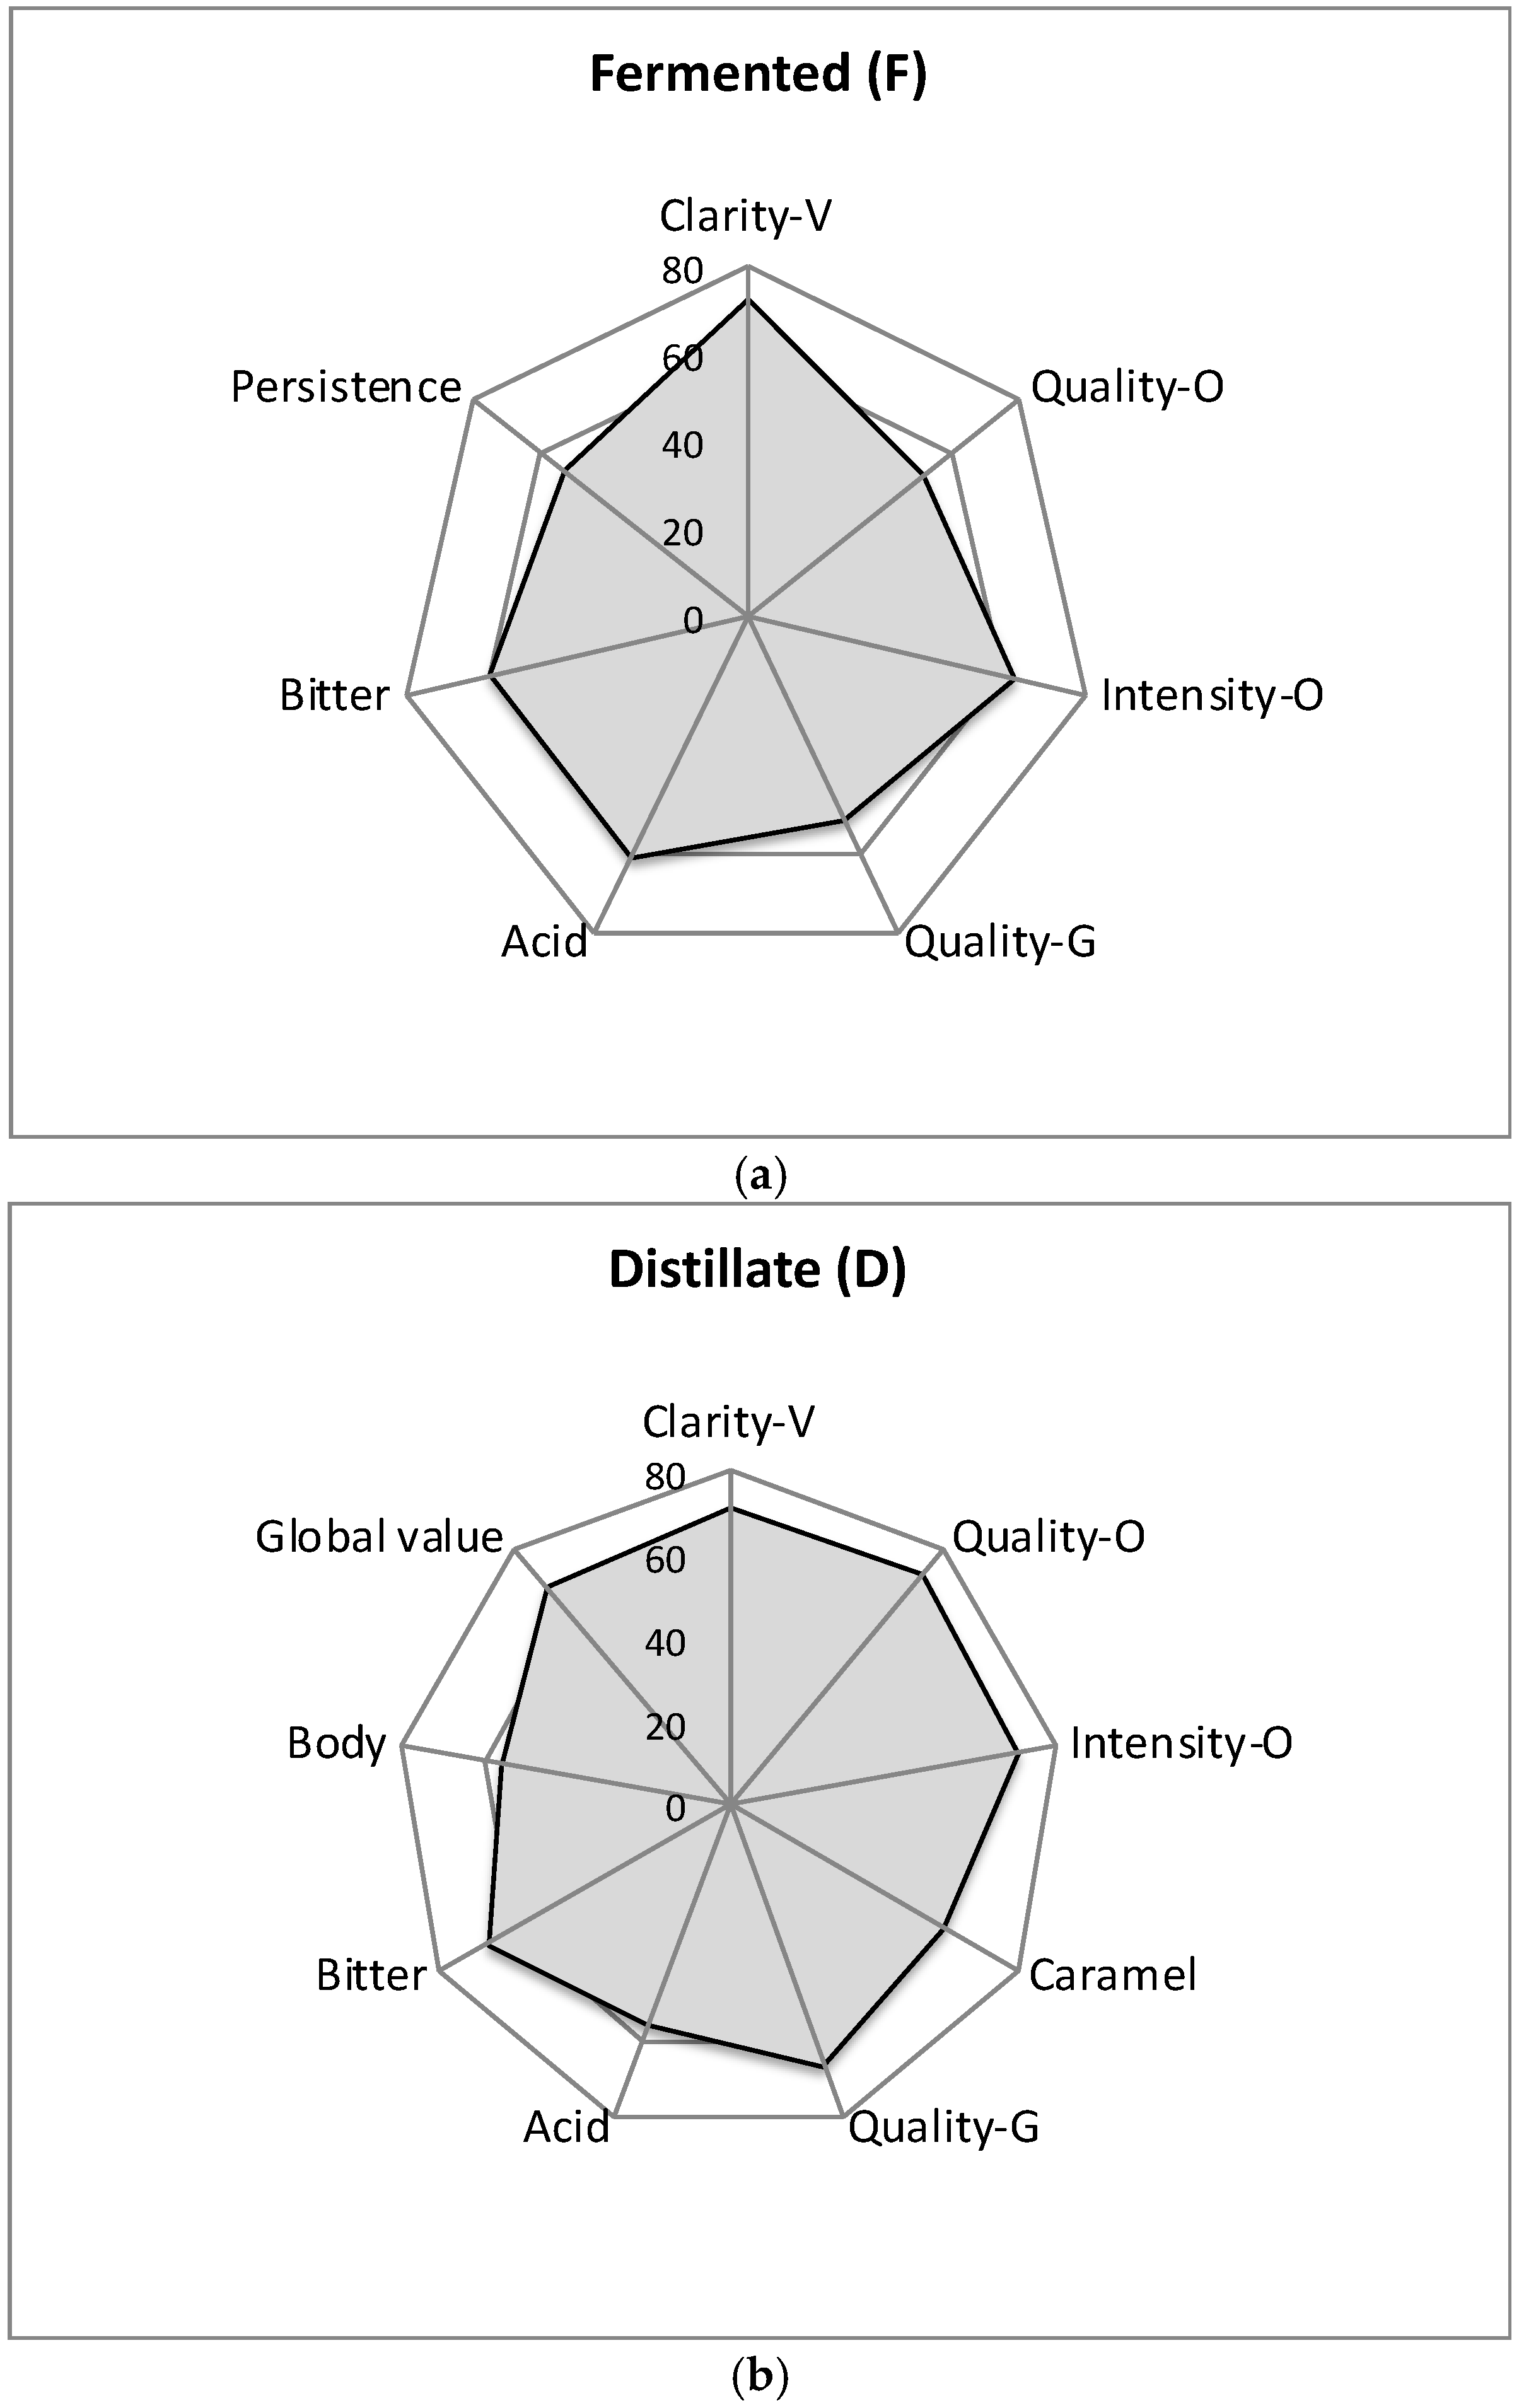
3.3. Sensory Analysis of Fermented and Spirit Beverages

In the sensory analysis, the duplicates of the fermented and distilled beverages were added, i.e., the fermented beverage 1 (F1) and the fermented beverage 2 (F2) were added in the same volumetric proportion, obtaining a final fermented beverage (F), as well as the distilled beverage 1 (D1) and the distilled beverage 2 (D2) in order to obtain a final distilled beverage (D).
Table 3 shows visual, olfactory, and gustatory sensory descriptors identified in spirits and their correspondent means of frequency (F) and intensity (I) obtained by the tasting panels. Spirits were characterized with 17 sensory descriptors, one by visual analysis, eight by olfactory analysis, eight by gustatory analysis, and by a global value.
In the visual analysis, the clarity descriptor showed medium intensity in the fermented (F) and distilled (D) samples (53% and 51%, respectively) and the highest frequency (100%) in both. Therefore, the Geometric Mean (GM) was slightly higher for fermented (F) than distillates (D) samples in visual analysis.
In olfactory analysis, the quality and intensity of distillate (D) were higher than in the fermented beverage (F) with GM > 70% in spirit beverage. Among the descriptors defining the beverages’ aroma, all descriptors showed the highest GM value for Spirit, with an exception of apple (GM = 13% in both beverages). Toasted was described for the fermented beverage, however caramel, vanilla, and coffee characterized the distillate beverage. Coffee was the most representative aroma descriptor by olfactory analysis in a novel spirit developed from spent coffee [3]. Caramel, vanilla, and coffee were not detected in the F sample by the tasting panel. Toasted was not detected in the D sample. Similar descriptors to caramel and toasted have been used in other studies to describe the flavor properties of coffee products [32,37].
Quality and bitter were the most important descriptors in the D sample (GM = 67%). However, acidity and bitter were the most representative descriptors in the gustatory analysis of fermented beverages (61% and 60% of GM respectively). The flavor profile of Turkish coffee brews showed as roasted/burnt, spicy, bitter, acidic, sweet, salty, astringent (dry), woody, fermented, earthy, and tobacco-like flavor characteristics [38]. On the other hand, the global value of samples was higher for distillate (D) in intensity and frequency than for the fermented sample (F).
For descriptors, the GM obtained through the values of intensity and frequency of each attribute in fermented and spirit beverages was represented in Figure 3. Descriptors with GM greater than 50% were considered the descriptors with the highest contribution in this study. Thus, seven descriptors (with GM > 50%) defined the sensory characteristics of the fermented sample (Figure 3a), including clarity (visual analysis), quality and intensity (olfactory analysis), and quality, acid, bitter, and persistence (gustatory analysis). However, nine descriptors (GM > 50%) defined the sensory characteristics of distillated sample (Figure 3b), clarity in visual analysis, quality, intensity, and caramel in olfactory analysis and quality, acid, bitter, and body in gustatory analysis. Global Value also showed GM > 50% in D sample. Figure 3 shows the characteristic profiles of the fermented and distillated samples.

4. Conclusions

Fermented and distilled beverages from spent coffee grounds were characterized by chemical and sensory analysis. In fermented samples, an efficient conversion of sugars to ethanol by the yeast was achieved with a volumetric percentage of 10.4% and 10.0% of ethanol, and the distilled beverages reached a volumetric percentage of 38.1% and 40.2% of ethanol. The fermented beverages were characterized by the higher alcohols, such as isobutanol and isoamylic, and esters contributing positively to the beverage aroma. Alcohols as major compounds and volatile acids and esters as minor compounds were most abundant in the distillate beverages, contributing to the pleasant fruity flavor and floral aroma of the drink. Olfactory quality and intensity showed a geometric mean value > 50% for fermented beverages and GM > 70% for distillates. The global value was major for the distillate beverage. This work demonstrates that the fermented and distilled beverages have acceptable organoleptic qualities for human consumption, thus adding value to spent coffee grounds and increasing the sustainability of the coffee agro-industry.

Author Contributions

J.T. and S.I.M.—conceptualization, supervision and discussion of the work; M.V. implementation of sensory evaluation, discussion and writing of the results; J.O.—discussion of analytical data and writing of the results; E.M.—development of experimental work, discussion of the results and writing of the results.

Funding

This research was funded by Portuguese National Fund through FCT—Fundação para a Ciência e a Tecnologia (grant SFRH/BD/75195/2010).

Acknowledgments

This study was supported by the Portuguese Foundation for Science and Technology (FCT) under the scope of the strategic funding of UID/BIO/04469/2013 unit and COMPETE 2020 (POCI-01-0145-FEDER-006684) and BioTecNorte operation (NORTE-01-0145-FEDER-000004) funded by European Regional Development Fund under the scope of Norte2020—Programa Operacional Regional do Norte. Thanks to Appellation Orujo de Galicia (Galicia, Spain).

Conflicts of Interest

The authors declare no conflict of interest.

References

  1. Mussatto, S.I.; Machado, E.M.S.; Martins, S.; Teixeira, J.A. Production, composition and application of coffee and its industrial residues. Food Bioprocess. Technol. 2011, 4, 661–672. [Google Scholar] [CrossRef]
  2. Mussatto, S.I.; Carneiro, L.M.; Silva, J.P.A.; Roberto, I.C.; Teixeira, J.A. A study on chemical constituents and sugars extraction from spent coffee grounds. Carb. Polym. 2011, 83, 368–374. [Google Scholar] [CrossRef]
  3. Sampaio, A.; Dragone, G.; Vilanova, M.; Oliveira, J.M.; Teixeira, J.A.; Mussatto, S.I. Production, chemical characterization, and sensory profile of novel spirit elaborated from spent coffee ground. LWT Food Sci. Technol. 2013, 54, 557–563. [Google Scholar] [CrossRef]
  4. Coelho, E.; Vilanova, M.; Genisheva, Z.; Oliveira, J.M.; Teixeira, J.A.; Domingues, L. Systematic approach for the development of fruit wines from industrially processed fruit concentrates, including optimization of fermentation parameters, chemical characterization and sensory evaluation. LWT Food Sci. Technol. 2015, 62, 1043–1052. [Google Scholar] [CrossRef] [Green Version]
  5. Moreira, M.M.; Barroso, M.F.; Boeykens, A.; Withouck, H.; Morais, S.; Delerue-Matos, C. Valorization of apple tree wood residues by polyphenols extraction: Comparison between conventional and microwave–assisted extraction. Ind. Crops Prod. 2017, 104, 210–220. [Google Scholar] [CrossRef]
  6. Machado, E.M.S. Extraction of Valuable Compounds from Spent Coffee Grounds and Its Use in the Preparation of Fermented and Distilled Beverages. Ph.D. Dissertation, University of Minho, Braga, Portugal, March 2018. [Google Scholar]
  7. Plutowska, B.; Wardencki, W. Application of gas chromatography–olfactometry (GC–O) in analysis and quality assessment of alcoholic beverages—A review. Food Chem. 2008, 107, 449–463. [Google Scholar] [CrossRef]
  8. Lawless, H.T.; Heymann, H. Sensory Evaluation of Food: Principle and Practices, 2nd ed.; Springer: New York, NY, USA, 2010. [Google Scholar]
  9. Mussatto, S.I.; Ballesteros, L.F.; Martins, S.; Teixeira, J.A. Extraction of antioxidant phenolic compounds from spent coffee grounds. Sep. Purif. Technol. 2011, 83, 173–179. [Google Scholar] [CrossRef] [Green Version]
  10. Machado, E.M.S. Reaproveitamento de Resíduos da Indústria do Café Como Matéria-Prima para a Produção de Etanol. Master’s Dissertation, Universidade do Minho, Braga, Portugal, December 2009. [Google Scholar]
  11. Dreywood, R. Qualitative test for carbohydrate material. Ind. Eng. Chem. Anal. 1946, 18, 499. [Google Scholar] [CrossRef]
  12. Oliveira, J.M.; Faria, M.; Sá, F.; Barros, F.; Araújo, I.M. C6-alcohols as varietal markers for assessment of wine origin. Anal. Chim. Acta 2006, 563, 300–309. [Google Scholar] [CrossRef] [Green Version]
  13. International Organization for Standardization. Norme ISO 8589—Sensory Analysis: General Guidance for the Design of Test Rooms; International Organization for Standardization: Geneva, Switzerland, 1988. [Google Scholar]
  14. International Organization for Standardization. Norme ISO 11035—Sensory Analysis: Identification and Selection of Descriptors for Establishing a Sensory Profile by a Multidimensional Approach; International Organization for Standardization: Geneva, Switzerland, 1994. [Google Scholar]
  15. Dravnieks, A.; Bock, F.C.; Powers, J.J.; Tibbetts, M.; Ford, M. Comparison of odours directly and through profiling. Chem. Senses 1978, 2, 191–225. [Google Scholar] [CrossRef]
  16. Dragone, G.; Mussato, S.I.; Oliveira, J.; Teixeira, J.A. Characterization of volatile compounds in an alcoholic beverage produced by whey fermentation. Food Chem. 2009, 112, 929–935. [Google Scholar] [CrossRef]
  17. Lee, L.W.; Cheong, M.W.; Curran, P.; Yu, B.; Liu, S.Q. Coffee fermentation and flavor. An intricate and delicate relationship. Food Chem. 2015, 15, 182–191. [Google Scholar] [CrossRef] [PubMed]
  18. De Melo Pereira, G.V.; Soccol, V.T.; Pandey, A.; Medeiros, A.B.; Andrade Lara, J.M.; Gollo, A.L.; Soccol, C.R. Isolation, selection and evaluation of yeasts for use in fermentation of coffee beans by the wet process. Int. J. Food Microbiol. 2014, 188, 60–66. [Google Scholar] [CrossRef] [PubMed]
  19. Steger, C.L.C.; Lambrechts, M.G. The selection of yeast strains for the production of premium quality South African brandy base products. J. Ind. Microbiol. Biotechnol. 2000, 24, 431–440. [Google Scholar] [CrossRef]
  20. Apostolopoulou, A.A.; Flouros, A.I.; Demertzis, P.G.; Akrida-Demertzi, K. Differences in concentration of principal volatile constituents in traditional Greek distillates. Food Control 2005, 16, 157–164. [Google Scholar] [CrossRef]
  21. Dragone, G.; Mussato, S.I.; Vilanova, M.; Oliveira, J.; Teixeira, J.A.; Silva, J. Obtenção e caracterização de bebida destilada a partir da fermentação do soro de queijo. Braz. J. Food Technol. 2009, 120–124. Available online: http://bjft.ital.sp.gov.br/edicao_especial.php (accessed on 16 December 2018).
  22. Silva, M.L.; Malcata, F.X.; de Revel, G. Volatile contents of grape marcs in Portugal. J. Food Comp. Anal. 1996, 9, 72–80. [Google Scholar] [CrossRef]
  23. Cortés, S.; Gil, M.L.; Fernández, E. Volatile composition of traditional and industrial orujo spirits. Food Control 2005, 16, 383–388. [Google Scholar] [CrossRef]
  24. Fundira, M.; Blom, M.; Pretorius, I.; van Rensburg, P. Selection of yeast starter culture strains for the production of marula fruit wines and distillates. J. Agric. Food Chem. 2002, 50, 1535–1542. [Google Scholar] [CrossRef]
  25. Falqué, E.; Fernandez, E.; Dubourdieu, D. Differentiation of white wines by their aromatic index. Talanta 2001, 54, 271–281. [Google Scholar] [CrossRef]
  26. EUR–Lex. Available online: http://eur-lex.europa.eu/ (accessed on 15 March 2018).
  27. Turek, I.A. The Effect of Microwave Extraction on the Chemical Composition and the Antioxidant Properties of the Coffee Residue. Master’s Thesis, Universidade de Aveiro, Aveiro, Portugal, August 2010. [Google Scholar]
  28. Marais, I. Terpenes in the aroma of grapes and wines: A review. S. Afr. J. Enol. Vitic. 1983, 4, 49–60. [Google Scholar] [CrossRef]
  29. Soufleros, E.H.; Mygdalia, A.S.; Natskoulis, P. Characterization and safety evaluation of the traditional Greek fruit distillate “Mouro” by flavor compounds and mineral analysis. Food Chem. 2004, 86, 625–636. [Google Scholar] [CrossRef]
  30. Escudero, A.; Gogorza, B.; Melús, M.A.; Ortín, N.; Cacho, J.; Ferreira, V. Characterization of the aroma of a wine from Maccabeo. Key role played by compounds with low odor activity values. J. Agric. Food Chem. 2004, 52, 3516–3524. [Google Scholar] [CrossRef]
  31. Fujimaki, M.; Tsugita, T.; Kurata, T. Fractionation and identification of volatile acids and phenols in the steam distillate of rice bran. J. Agric. Biol. Chem. 1977, 41, 1721–1725. [Google Scholar] [CrossRef]
  32. Mayer, F.; Czerny, M.; Grosch, W. Sensory study of the character impact aroma compounds of a coffee beverage. Eur. Food Res. Technol. 2000, 211, 272–276. [Google Scholar] [CrossRef]
  33. Wiśniewska, P.; Śliwińska, M.; Dymerski, T.; Wardencki, W.; Namieśnik, J. The analysis of raw spirits—A review of methodology. J. Inst. Brew. 2016, 122, 5–10. [Google Scholar] [CrossRef]
  34. Mangas, J.; Rodríguez, R.; Moreno, J.; Blanco, D. Changes in the major volatile compounds of cider distillates during maturation. LWT Food Sci. Technol. 1996, 29, 357–364. [Google Scholar] [CrossRef]
  35. Vignoli, J.A.; Viegas, M.C.; Bassoli, D.G.; Benassi, M.T. Roasting process affects differently the bioactive compounds and the antioxidant activity of arabica and robusta coffees. Food Res. Int. 2014, 61, 279–285. [Google Scholar] [CrossRef]
  36. Chaichia, M.; Ghasemzadeh-Mohammadia, V.; Hashemib, M.; Mohammadia, A. Furanic compounds and furfural in different coffee products by headspace liquid-phase micro-extraction followed by gas chromatography–mass spectrometry: Survey and effect of brewing procedures. Food Addit. Contam. Part B 2015, 8, 73–80. [Google Scholar] [CrossRef]
  37. Czerny, M.; Mayer, F.; Grosch, W. Sensory study on the character impact odorants of roasted Arabica coffee. J. Agric. Food Chem. 1999, 47, 695–699. [Google Scholar] [CrossRef]
  38. Kıvançlı, J.; Elmacı, Y. Characterization of Turkish-Style Boiled Coffee Aroma by Gas Chromatography and Mass Spectrometry and Descriptive Analysis Techniques. Int. J. Food Prop. 2016, 19, 1681–1686. [Google Scholar] [CrossRef]
Figure 1. Sugars consumption and cell growth of S. cerevisiae (RL–11) from spent coffee ground extract using the first method of fermentation.
Beverages 04 00105 g001
Figure 2. Sugars consumption and cell growth of S. cerevisiae (RL–11) from spent coffee ground extract using the second method of fermentation.
Beverages 04 00105 g002
Figure 3. Sensory profile (GM > 50%) of fermented (a) and distillate (b) samples. (V—visual analysis; O—olfactory analysis; G—gustatory analysis).
Beverages 04 00105 g003
Table 1. Concentration (C) and standard deviation (SD) of major volatile compounds identified and quantified in fermented and distillate samples.
CompoundF1F2D1D2
C/(mg/L)SDC/(mg/L)SDC/(mg/L)SDC/(mg/L)SD
acetaldehyde339.622.2192.52.16.30.519.61.0
ethyl acetate73.51.772.111.47.81.318.72.6
methanol30.11.344.11.614.01.37.61.0
1-propanol15.50.517.10.923.21.535.71.2
2-methyl-1-propanol152.11.4231.76.349.42.2222.06.6
2-methyl-1-butanol40.90.436.00.731.50.3137.14.0
3-methyl-1-butanol106.82.097.12.5191.14.2633.219.2
2-phenylethanol34.74.638.24.435.63.821.52.1
Fermented beverage 1 (F1) and 2 (F2); Distilled beverage 1 (D1) and 2 (D2).
Table 2. Concentration (C) and standard deviation (SD) of minor volatile compounds identified and quantified in fermented and distillate samples.
Compound F1F2D1D2
LRIC/(µg/L)SDC/(µg/L)SDC/(µg/L)SDC/(µg/L)SD
ethyl butyrate99510.30.83.90.8tr-tr-
ethyl 2-methylbutyrate1052----17.02.433.73.9
ethyl 3-methylbutyrate1070----6.52.828.63.6
3-methylbutyl acetate111938.11.933.82.8--35.23.6
ethyl hexanoate122942.91.920.21.657.91.3156.910.1
1-pentanol123921.01.216.90.719.62.437.91.7
2-methylpyrazine1255----13.80.613.00.8
2,6-dimethylpyrazine1318----36.53.942.92.0
2-ethylpyrazine1324----6.61.27.20.3
2,3-dimethylpyrazine1334----8.32.14.70.1
ethyl lactate133521.60.3103.19.454.13.645.95.6
1-hexanol134423.90.919.32.610.51.544.14.5
ethyl octanoate142913.21.5--239.411.1698.088.7
furan linalool oxide, trans-1434----tr-4.80.6
1-heptanol14484.20.84.00.51.30.611.70.5
furfural145758.43.054.73.23054.9187.52853.8262.5
2-ethyl-1-hexanol148311.61.615.71.2--6.00.5
benzaldehyde15117.26.311.10.980.36.1315.321.8
furfuryl acetate15329.11.35.20.4--tr -
linalool1542----tr-22.30.9
propanoic acid15456.10.76.40.8--tr -
5-methylfurfural15645.40.74.70.9732.136.0474.341.9
2-methylpropanoic acid1574277.532.9364.219.5122.57.9182.522.0
ethyl decanoate1632----17.81.9324.147.6
2-furanmethanol1653308.442.3329.59.8156.09.889.314.6
diethyl succinate166816.71.819.91.7146.89.9722.876.0
2-methylbutyric + 3-methylbutyric acids1675187.08.1175.06.7534.634.4564.376.4
γ-caprolactone168517.51.418.50.79.00.53.30.8
methionol170526.02.019.30.5----
citronellol17598.10.62.40.2--12.81.3
ethyl phenylacetate17743.10.97.11.08.42.016.32.4
nerol17902.70.51.00.1--tr-
2-phenylethyl acetate1801----104.75.6126.414.3
β-damascenone1804------tr-
hexanoic acid1850239.223.1203.02.7453.023.6425.432.9
guaiacol185131.53.133.51.4138.86.289.99.8
benzyl alcohol18629.70.119.21.87.00.44.10.2
γ-nonalactone200967.02.862.03.3168.79.6106.211.1
4-ethylguaiacol20175.11.34.90.5174.56.1106.58.6
nerolidol, trans-2034----86.39.7138.621.7
octanoic acid2065246.06.5168.05.15614.9207.84179.0348.5
γ-decalactone21226.90.13.70.128.71.027.83.4
4-vinylguaiacol218142.93.524.61.9224.16.3343.537.9
γ-undecalactone2237----9.21.16.80.9
decanoic acid22797.11.62.10.52995.4211.82535.4193.9
E,E-farnesol2344----54.29.4133.315.8
dodecanoic acid2492----39.34.427.93.9
5-hydroxymethylfurfural2494----26.71.880.39.2
3-hydroxyl-β-damascone25136.30.54.50.3--4.30.1
vanillin254312.82.411.61.325.42.248.45.1
acetovanillone261541.84.345.01.926.50.720.33.6
tyrosol298918.45.016.92.1----
Fermented beverage 1 (F1) and 2 (F2); Distilled beverage 1 (D1) and 2 (D2). LRI, linear retention index; -, not detected; tr, traces.
Table 3. Intensity (I), frequency (F), and geometric mean (GM) for each descriptor of spent coffee grounds (SCG); fermented (F) and distilled (D) beverages.
PhasesDescriptorFermented (F)Distillated (D)
I/%F/%GM/%I/%F/%GM/%
VisualClarity53100735110071
OlfactoryQuality27100525310073
Intensity40100635110071
Toasted132016000
Caramel000448060
Vanilla000204028
Strawberry92013132016
Coffee000204028
Apple9201392013
GustatoryQuality27100524410067
Sweet136028188038
Salt166031228042
Acid38100613110056
Bitter4480604410067
Body94019388055
Persistence368053366046
Astringent186033296042
Global Value 2080404710068

