Article

Optimization of Some Quality Parameters of Functional Pumpkin Puree Enriched with Banana Peel Powder Using Response Surface Methodology

by
Weiam A. Alhemaid
,
Elfadil E. Babiker
*,
Isam A. Mohamed Ahmed
and
Fahad Y. Al Juhaimi
Department of Food Science and Nutrition, College of Food and Agricultural Sciences, King Saud University, Riyadh 11451, Saudi Arabia
*
Author to whom correspondence should be addressed.
Beverages 2025, 11(4), 106; https://doi.org/10.3390/beverages11040106
Submission received: 24 April 2025 / Revised: 9 June 2025 / Accepted: 16 July 2025 / Published: 21 July 2025
(This article belongs to the Topic Nutritional and Phytochemical Composition of Plants)

Abstract

We intend to prepare pumpkin puree based on the health benefits of both the flesh of pumpkins (Cucurbita maxima) and the peel of bananas (Musa spp.). However, before we begin we would like to optimize the conditions by using thermosonication, rather than conventional pasteurization, and a quantity of banana peel powder. Therefore, this study aimed to use response surface methodology (RSM) to find the best temperature and time settings for the ultrasonication process of functional pumpkin puree (FPP) with banana peel powder (BPP) to increase the amount of total phenolics and DPPH scavenging activity while also making the quality of the puree better. To enhance the FPP production process, quality attributes (responses), including total phenolic content (TPC), 2, 2-Diphenyl-1-picrylhydrazyl (DPPH) free-radical scavenging activity, pH, acidity, and color change (ΔE) were assessed. The model demonstrated validity (R2 = 0.97–0.988) and was highly significant (p < 0.0001). The experimental values of the responses supported the validity of the utilized RSM model, which closely matched the expected values at the ideal processing conditions of process temperature (40 °C), ultrasonic process duration (8.23 min), and BPP (2 g/100 g). Under these conditions, the generated FPP had quality attributes of 205.79 mg GAE/100 mL, 83.01%, 5.78, 0.32 g/100 g, and 3.81 for responses, respectively.

1. Introduction

Diets worldwide have become more similar, focusing on highly processed foods, low-calorie options, and overconsumption. Imbalanced diets are a leading source of malnutrition and chronic non-communicable diseases [1]. Drinking beverages, particularly juices prepared from fruits and vegetables, is a practical way of consuming large amounts of biologically active chemicals, and hence, they can be employed as vehicles to deliver health-promoting components [2]. Functional meals provide value by increasing the amount of health-promoting compounds, reducing undesirable components, and/or introducing novel constituents with technical qualities [3]. Fruits and vegetables, particularly, are functional foods since they contain considerable amounts of bioactive substances that protect against certain harmful physiological activities, such as metabolic and cardiovascular disorders [4].
Pumpkin is known for its nutritional, therapeutic, and economic benefits. It was shown to contain low energy and high amounts of vitamins A and C, fiber, and potassium. In addition, pumpkin contains a large amount of dietary fiber, which helps keep normal cholesterol levels, and antioxidants play vital roles in protecting cells from oxidative stress [5]. Pumpkin is a versatile food that retains its position among vegetables, in general, due to its peel, flesh, and seeds, all of which contain good phytochemicals that can be utilized to cure and prevent medical disorders [6]. Various sections of pumpkin include high levels of physiologically active compounds, as well as considerable antioxidant activity [7]. An investigation of the nutritional profile of pumpkin pulp flour revealed that it was a good source of carotenoids, phenolic components, and antioxidant activity. This flour may create nutrient-dense food products [8].
Annually, large amounts of banana peels are discarded as byproducts (approximately 36 million tons), with the present endpoint being linked with considerable economic and environmental losses [9]. Furthermore, they discovered that many tons of banana peels are produced daily in markets and homes waste, resulting in a foul odor due to anaerobic decomposition of the biomass, which leads to the formation of gases that disrupt the natural balance of the environment. According to Pereira and Maraschin [10], peels have long been used to cure various ailments, including anemia, burns, cough, diarrhea, diabetes, inflammation, snakebite, ulcers, and heavy menstruation. Peels are plentiful in soluble fiber and phenolic compounds and have antioxidant, antibacterial, and antimicrobial properties [11]. Peels of bananas contain various phenolic components, including anthocyanins, catechin, epicatechin, gallic acid, and tannins, making them an up-and-coming product with potential applications in the nutraceutical and pharmaceutical industries [12]. Moreover, gallo-catechin levels in banana peels are five times higher than in pulp, indicating that the peel is an excellent source of antioxidant bioactives.
Drinks, primarily vegetable and fruit beverages, have been employed as carriers to deliver considerable amounts of bioactive compounds due to their ease of consumption [13]. However, because these goods deteriorate quickly due to microbial growth and enzymatic activity, treatments are essential to ensure their storage life and organoleptic quality [14]. To date, the most common method for extending the shelf life of food is pasteurization with heat. It preserves vegetables, fruits, and beverages; nevertheless, this technique may have an impact on the beverages’ nutritional and physicochemical properties, such as color, pH, organic acids, polyphenols, vitamins (C and E), and carotenoids [15].
Novel pasteurization procedures have grown in prominence in the food industry. New technologies offer food processing options that ensure product storage life and quality. Consumers prefer juices made from fruits and vegetables with no additives and little processing. Thermosonication is a single, useful technology that takes the place of traditional heat processing. It was discovered to have a small effect on the nutritional value and general quality of fruit and vegetable juices [16]. Based on the health benefits of both pumpkin and banana peels, we are planning to prepare a pure pumpkin puree, and before starting we would like to optimize the use of thermosonication instead of conventional pasteurization. Therefore, this study aimed to use response surface methodology (RSM) to optimize the thermosonication process variables (temperature and time) for a functional pumpkin puree containing banana peel to maximize the total phenolic contents and DPPH scavenging activity while improving puree quality.

2. Materials and Methods

2.1. Materials

The fruit and vegetable market in Riyadh, Kingdom of Saudi Arabia, offered fresh, ripe pumpkins and bananas of excellent quality. Sigma Chemical Co. (St. Louis, MO, USA) supplied the DPPH and Folin–Ciocalteu reagents. Anhydrous sodium carbonate was obtained from Avon Chemical Limited (Cheshire, UK), whereas gallic acid was obtained from Acros Organics Chemical Co. (Morris Plains, NJ, USA). Unless otherwise specified, all reagents were chemical grade.

2.2. Response Surface Methodology (RSM) Design

RSM was applied using the Box–Behnken design, and 20 experimental runs involving three independent and five dependent variables were conducted to optimize pumpkin puree with BPP. The optimization took into account the following three independent variables: sonication temperature (X1: 40, 50, and 60 °C), sonication time (X2: 5, 7.5, and 10 min), and BPP concentration (X3: 1, 1.5, and 2 g/100 g). The dependent variables included total phenolic content (TPC), DPPH activity, pH, acidity, and ΔE. A three-factor experimental design was employed, along with design expert version 13 software (Stat-Ease Company, Minneapolis, MN, USA). The setup of the experiment was designed on a series of preliminary experiments, with the center points being a 7.5 min thermosonication processing period, a temperature of 50 °C, and 1.5 g/100 g banana peel powder for 20 experimental runs (Table 1). The results of three measurements of each response were reviewed using regression methods, and the data were then subjected to response surface analysis to determine the best circumstances.
The equation below was used to determine the appropriate amounts of variables:
Y = ∑β0 + ∑βiXi + ∑βiiXi2 + ∑∑βijXi Xj
where Xi and Xj are the coded independent factors, Y is the response, and β0, βi, βjj, and βij are regression coefficients of the intercept, linear, quadratic, and interaction components, respectively.

2.3. Preparation and Thermosonication of FPP

The pumpkins were cleaned to remove clinging dirt, and unwanted bits were carefully snipped off with a knife before peeling: pumpkin pulps were sliced into little pieces. The banana peels were manually removed, immersed in 1% citric acid for 5 min to avoid color change, and then the samples were frozen at −20 °C overnight and dried in a freeze-drier (Telstar Lyoalfa-6, Telstar, Terrassa, Spain) for 24 h. The BPP was then combined with pumpkin pulp pieces in various ratios (1, 1.5, and 2 g/100 g), which were placed in a sterilized electric mixer (MJ-PB12, Media, Guiyang, China) and blended to generate a high-purity puree. For the thermosonication treatments, 100 mL of pumpkin puree mixed with BPP was placed in a sterilized Erlenmeyer flask and immersed in an ultrasonic bath (SB-4200 DTD, Xinzhi, Ningbo, China) with a power of 110 W and a continuous frequency of 40 kHz. Both the temperature and the length of the thermosonication treatment were adjustable and regulated via the control panel. The mixture of FPP and BPP was permitted to attain the specified temperature (40–60 °C) and duration (5, 7.5, and 10 min) in the heated ultrasound water bath (adjusted to the requisite sonication temperature) by gauging the temperature at the geometric center of the bottle containing the FPP using a digital probe thermocouple (Oakton Eutech Instruments, Oakton, VA, USA). Following thermosonication, FPP samples were quickly chilled in an ice bath for further testing.

2.4. Determination of TPC and DPPH of FPP

With a few minor modifications, the Folin–Ciocalteu method was used to calculate the TPC following Cho et al.’s approach [17]. The samples were vortexed after adding 700 μL of Na2CO3, 100 μL of MeOH, 100 μL of Folin–Ciocalteu reagent, and 100 μL of freeze-dried FPP methanolic extract to 1.5 mL microcentrifuge tubes. The tubes were left at room temperature for twenty minutes in the dark. An Eppendorf Centrifuge 5417R (Eppendorf AG, Hamburg, Germany) was used to centrifuge the samples for three minutes at 13,000 rpm. Aqueous gallic acid (10–400 mg/L) was used as the reference when measuring the sample’s absorbance at 735 nm. Milligrams of gallic acid equivalent per 100 milliliters of the puree were used to illustrate the results. Every measurement was made three times. Following Lee et al.’s [18] method, the antioxidant activity of the puree samples was assessed using DPPH radical scavenging activity. The sample was prepared by mixing 200 μL with 1 mL of DPPH-methanolic solution (100 μmol/L) and letting it sit in the dark for at least 15 min. A Lambda EZ 150, PerkinElmer, Waltham, USA, spectrophotometer was used to measure the absorbance at 517 nm. The results were then converted to percentage inhibition using the following formula:
DPPH inhibition (%) = (ΔA Control 517 − ΔA Sample 517)/(ΔA Control 517) × 100

2.5. pH, Titratable Acidity (TA), and Color Determination

The pH was assessed using an electronic pH meter (Universal Motion, model H1-1131B, Mumbai, India). The acidity was quantified as a g/100 g using phenolphthalein as an indicator and titrated with NaOH (0.1 N). The results were expressed as a g/100 g of lactic acid. The color of the FPP samples was assessed using a HunterLab colorimeter (ColorFlex, Model A60-1010-615, Hunter Associates Laboratory Inc., Reston, VA, USA). The instrument, featuring a 65°/0° geometry, D25 optical sensor, and 10° observer, underwent calibration with white (L = 92.8; a = −0.8, b = 0.1) and black reference tiles. The color values were represented as L* (lightness), a* (red–green axis), and b* (yellow–blue axis). The color difference (ΔE), representing the extent of color change post-treatment, was calculated using the subsequent formula:
ΔE = [(∆L)2 + (∆a)2 + (∆b)2]0.5

2.6. Statistical Analysis

In this study, all measurements were conducted in triplicate, and the results were averaged. The TPC, DPPH, pH, acidity, and ΔE results were statistically analyzed using SPSS, version 22. The RSM data was analyzed using Stat-Ease Inc.’s Design Expert software (version 13.0, Minneapolis, MN, USA). The analysis of variance (ANOVA) was employed to assess the linear, quadratic, and interaction effects of the independent variables on the dependent variables. The models’ adequacy and precision were assessed through various statistical measures, such as the coefficient of determination (R2), adjusted coefficient of determination (adjusted R2), coefficient of variation (CV), and acceptable precision. The dependent variables demonstrated statistical significance at the 95% (p < 0.05) and 99% (p < 0.01) levels.

3. Results

3.1. Process Modeling of FPP

A preliminary study indicated that thermal processing at 70 °C for 5 min caused a 17% reduction in the TPC of pumpkin puree combined with BPP. Therefore, the study examined the effects of thermosonication, involving both sonication and temperature treatments lower than those used in high-heat processing, alongside the addition of BPP on the TPC and DPPH scavenging activities and some physicochemical properties. Table 1 outlines the conditions of the complete design of the 20 tests, TPC and DPPH scavenging activity results, and some physicochemical properties. The entire model was utilized to generate three-dimensional response surface plots, which forecasted the correlation between the independent and dependent variables. The design experiment employed 3 independent variables, each with 3 levels, resulting in 20 experimental runs (Table 1). Data analysis revealed that the responses were observed within the following ranges: TPC ranged from 167.52 to 209.83 mg GAE/100 mL, DPPH varied from 64.31 to 83.69%, pH levels were between 5.74 and 6.25, acidity ranged from 0.22 to 0.42 g/100 g, and color change was noted from 3.63 to 5.74.
Table 2 summarizes the findings from the ANOVA, model adequacy assessments, and regression coefficient analyses. The quadratic polynomial models developed using Equation (1) accounted for over 97% of the variance in TPC, DPPH, pH, acidity, and ΔE. The models demonstrated high significance, with p-values less than 0.0001. For robust statistical models, R2, adjusted R2, and predicted R2 must exhibit comparability. The adjusted R2 values for TPC, DPPH, pH, acidity, and ΔE were 0.977, 0.942, 0.971, 0.964, and 0.989, respectively. The predicted R2 values for the responses were 0.934, 0.868, 0.941, 0.926, and 0.978, respectively, indicating a robust model. The regression coefficients (R2, predicted R2, and adjusted R2) approached 1, signifying a robust correlation between predicted and actual values. The proposed models effectively aligned with the experimental data, exhibiting no significant lack of fit for TPC (p = 0.055), DPPH (p = 0.239), pH (p = 0.544), acidity (p = 0.555), or color change (p = 0.665) at the 0.05 significance level. This investigation demonstrated that the CV values for TPC (1.03), DPPH (1.99), pH (0.342), acidity (3.39), and ΔE (1.63) are precise and reliable.

3.2. Total Phenolic Contents of FPP
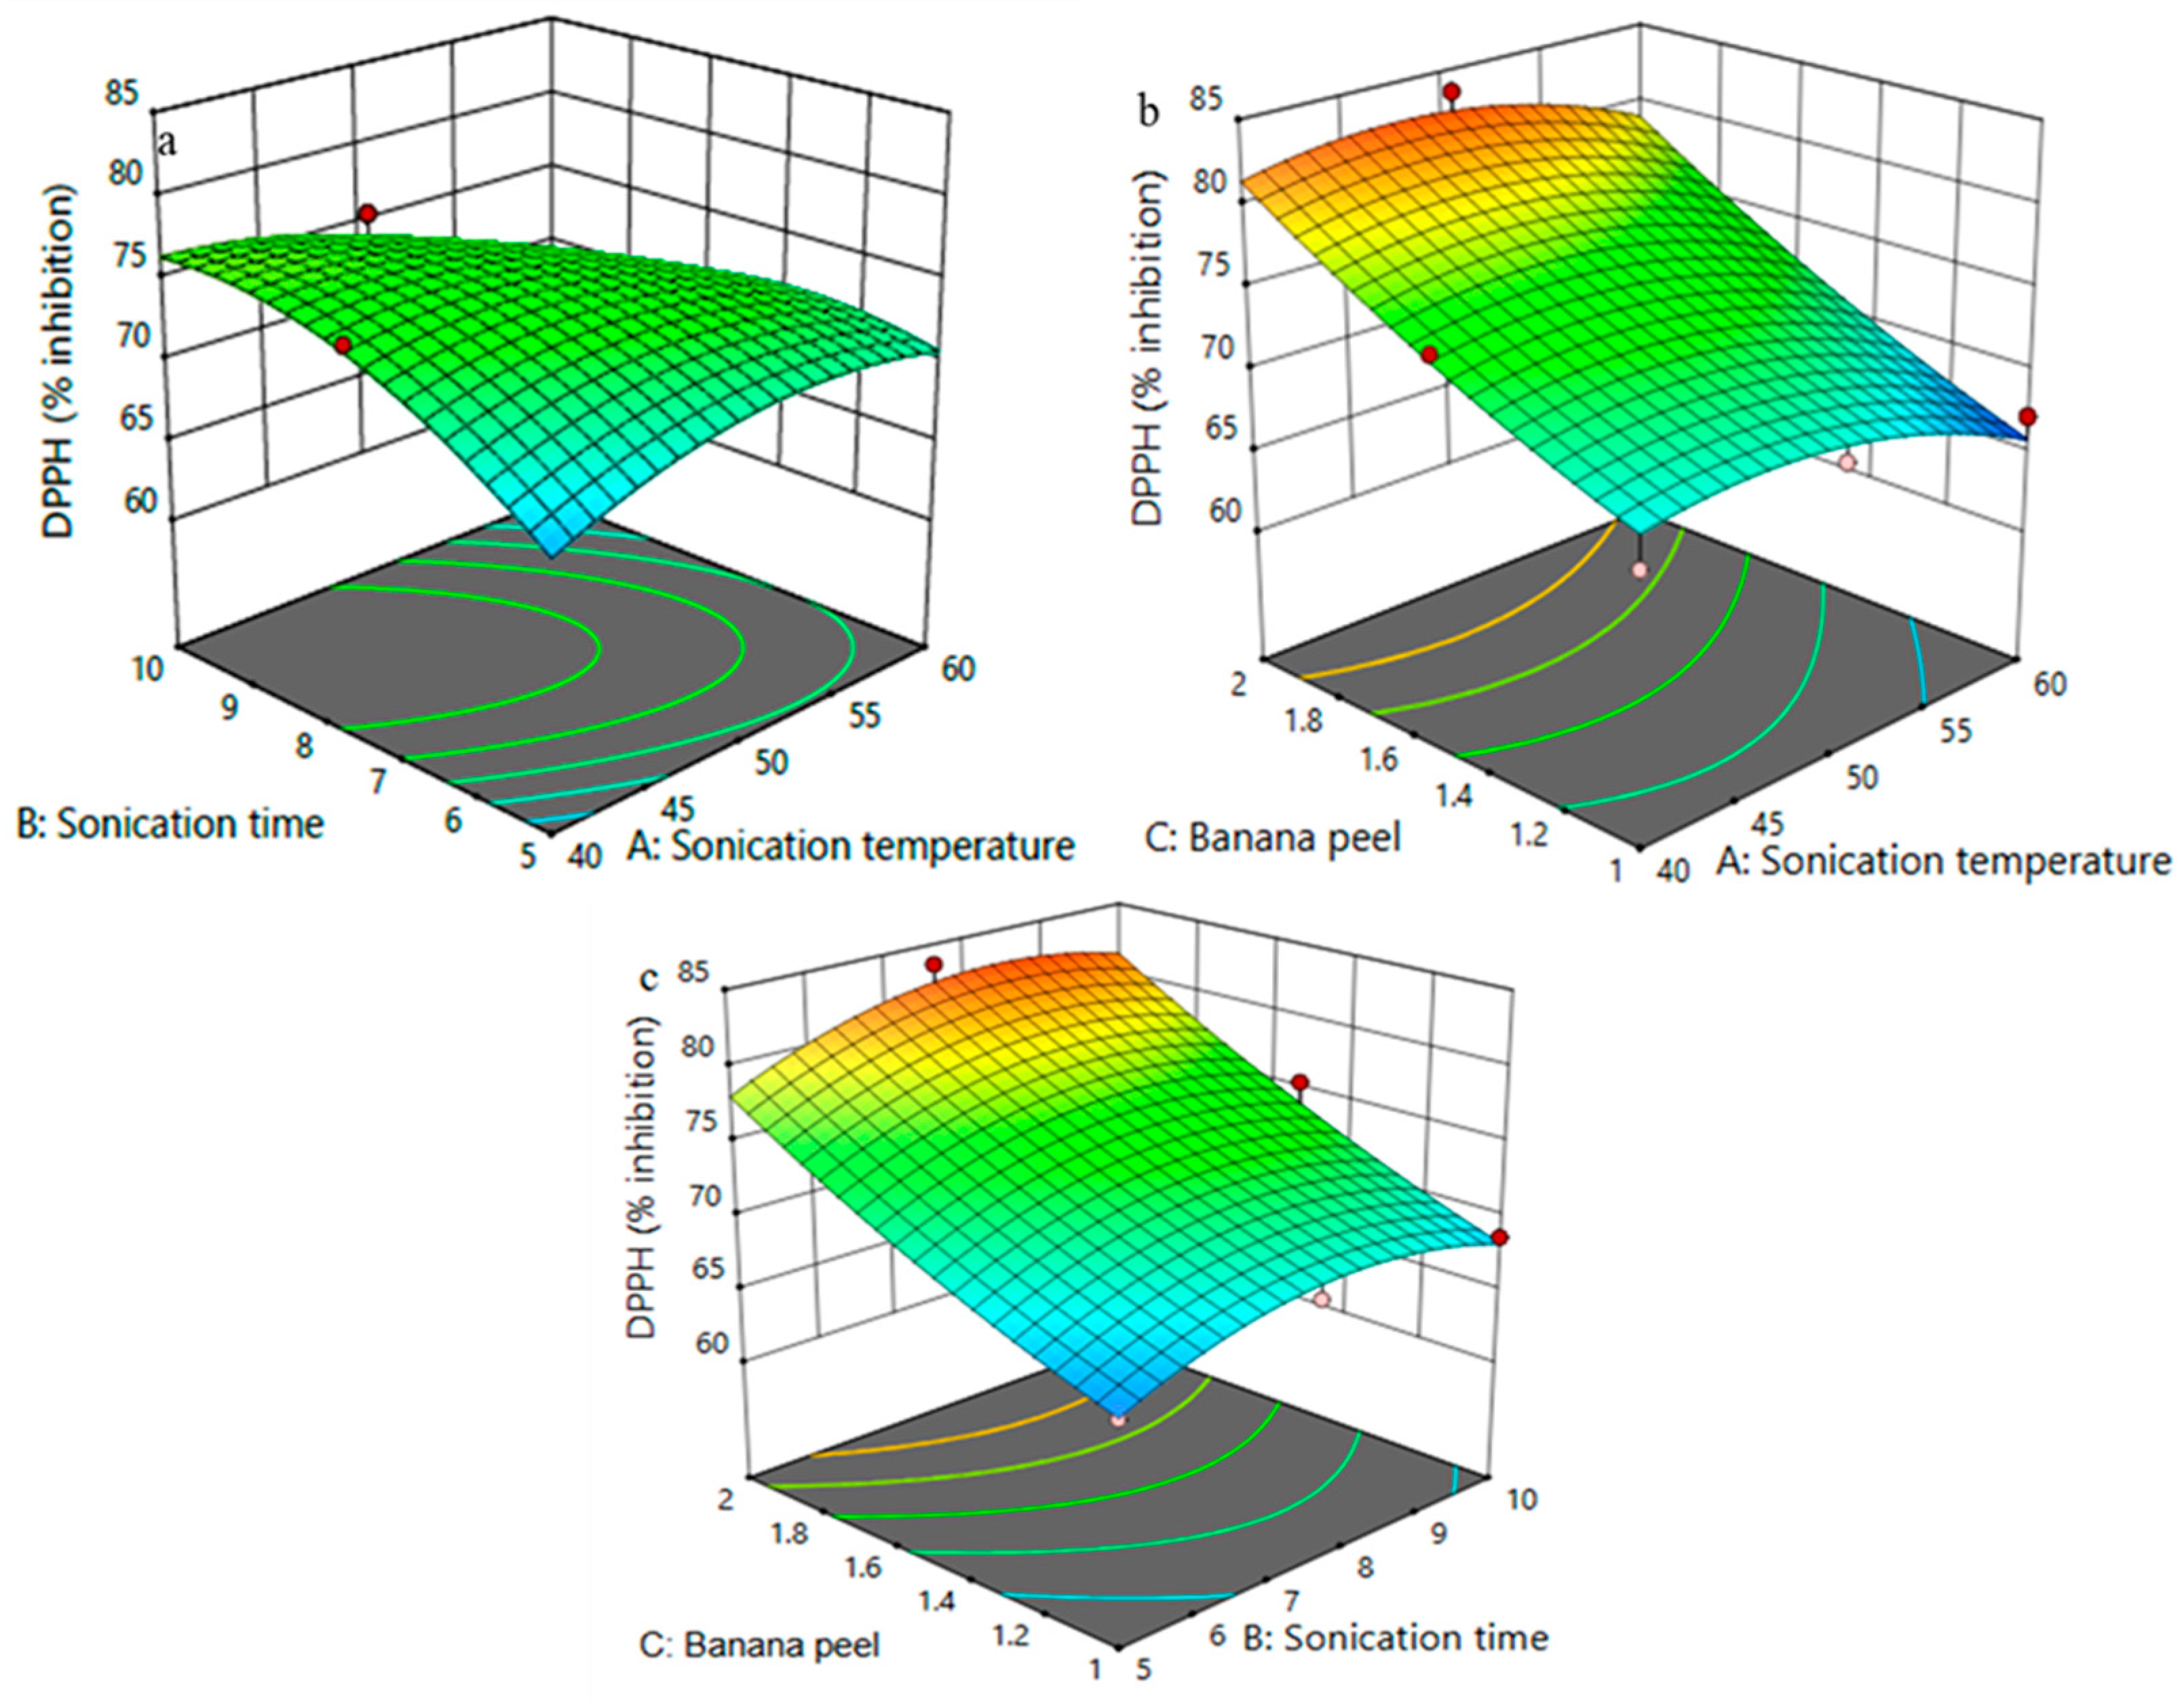
The incorporation of fruit peel powder, such as that from bananas, is anticipated to influence FPP’s antioxidant content and various physicochemical properties. Additionally, incorporating BPP is anticipated to enhance all other quality standards. Table 1 presents the mean values of the data regarding the impact of independent variables on puree TPC. The findings indicated that the highest TPC of 209.83 mg GAE/100 mL was achieved at 40 °C, 5 min of thermosonication, and a concentration of 2 g/100 g of BPP.
The subsequent prediction equation illustrates the effectiveness of TPC extraction from the puree using relevant terms:
YTPC = 189.964 − 7.521X1 − 4.462X2 + 10.521X3 − 3.353X1 X3 − 3.420X22
where YTPC indicates TPC (mg GAE/100 mL) in puree, and X1, X2, and X3 represent the sonication temperature, sonication time, and banana peel powder concentration (g/100 g), respectively.
To investigate the impact of independent variables on the puree TPC level, three-dimensional surface plots were generated by changing two variables within the experimental data range while maintaining the third. Figure 1a illustrates that the TPC diminished as sonication temperature increased, while it exhibited a slight increase followed by a decrease with varying sonication time, all under a constant concentration of BPP. The TPC level remained stable with sonication temperature at a constant duration and increased significantly with BPP concentration (Figure 1b). At a constant sonication temperature, the TPC exhibited a significant increase with increasing BPP concentration while showing relative stability with respect to the duration of sonication (Figure 1c). Data from Figure 1, Table 2, and Equation (2) indicate that increasing independent parameters, including sonication temperature (p < 0.0001) and sonication time, significantly negatively affected the puree TPC (p < 0.0001). BPP concentration (p < 0.0001) significantly positively affects the TPC of the puree. The interaction between sonication temperature and BPP concentration had an adverse effect on TPC (p < 0.001). This interaction suggests that augmenting the combination of those variables will substantially reduce the TPC in the puree. The quadratic components of sonication time negatively affected the puree TPC, suggesting that increased values of this variable led to a decrease in TPC.

3.3. DPPH of FPP

The prediction equation for the DPPH of puree extract, utilizing significant terms, is presented as follows:
YDPPH = 75.324 − 1.555X1 + 1.318X2 + 6.236X3 − 3.062X1 X2 − 2.217X12 − 2.670X22
where YDPPH denotes the DPPH radical scavenging activity (%) in puree, and X1, X2, and X3 represent the sonication temperature, sonication time, and BPP concentration (g/100 g), respectively.
Three-dimensional response surface plots were employed to analyze the relationship among the independent variables, DPPH radical scavenging activity, and the interactions between these variables. Figure 2 illustrates a modest increase in FPP DPPH corresponding to elevated sonication temperature and duration while maintaining a constant BPP concentration (Figure 2a). At constant sonication duration, DPPH exhibited a gradual increase with rising sonication temperature. In contrast, a significant increase was observed with higher BPP concentration (Figure 2b). Figure 2c illustrates that at a constant temperature DPPH exhibited a rapid increase with rising BPP concentration and a marginal increase with extended sonication time. Figure 2, Table 2, and Equation (3) indicate that sonication temperature (p < 0.01) significantly negatively affects DPPH radical scavenging activity. In contrast, sonication time (p < 0.05) and BPP concentration (p < 0.0001) significantly enhance the DPPH radical scavenging activity of the puree. The findings indicate that an increase in BPP concentration and sonication duration enhances the DPPH radical scavenging activity of the puree, while a rise in sonication temperature results in a reduction in this activity. The interaction of sonication temperature and time (p < 0.0001) significantly affected the DPPH radical scavenging activity of the puree. This finding indicates that an increase in this combination reduces the puree’s DPPH levels. Increasing the BPP concentration at an optimal sonication temperature and duration enhances the yield of bioactive compounds with significant antioxidant activity. Conversely, reduced BPP concentration reduces bioactive compounds, thereby diminishing antioxidant activity. The quadratic effects of sonication temperature (p < 0.05) and time (p < 0.01) negatively influenced the puree DPPH, suggesting that increased levels of these variables led to a reduction in DPPH.

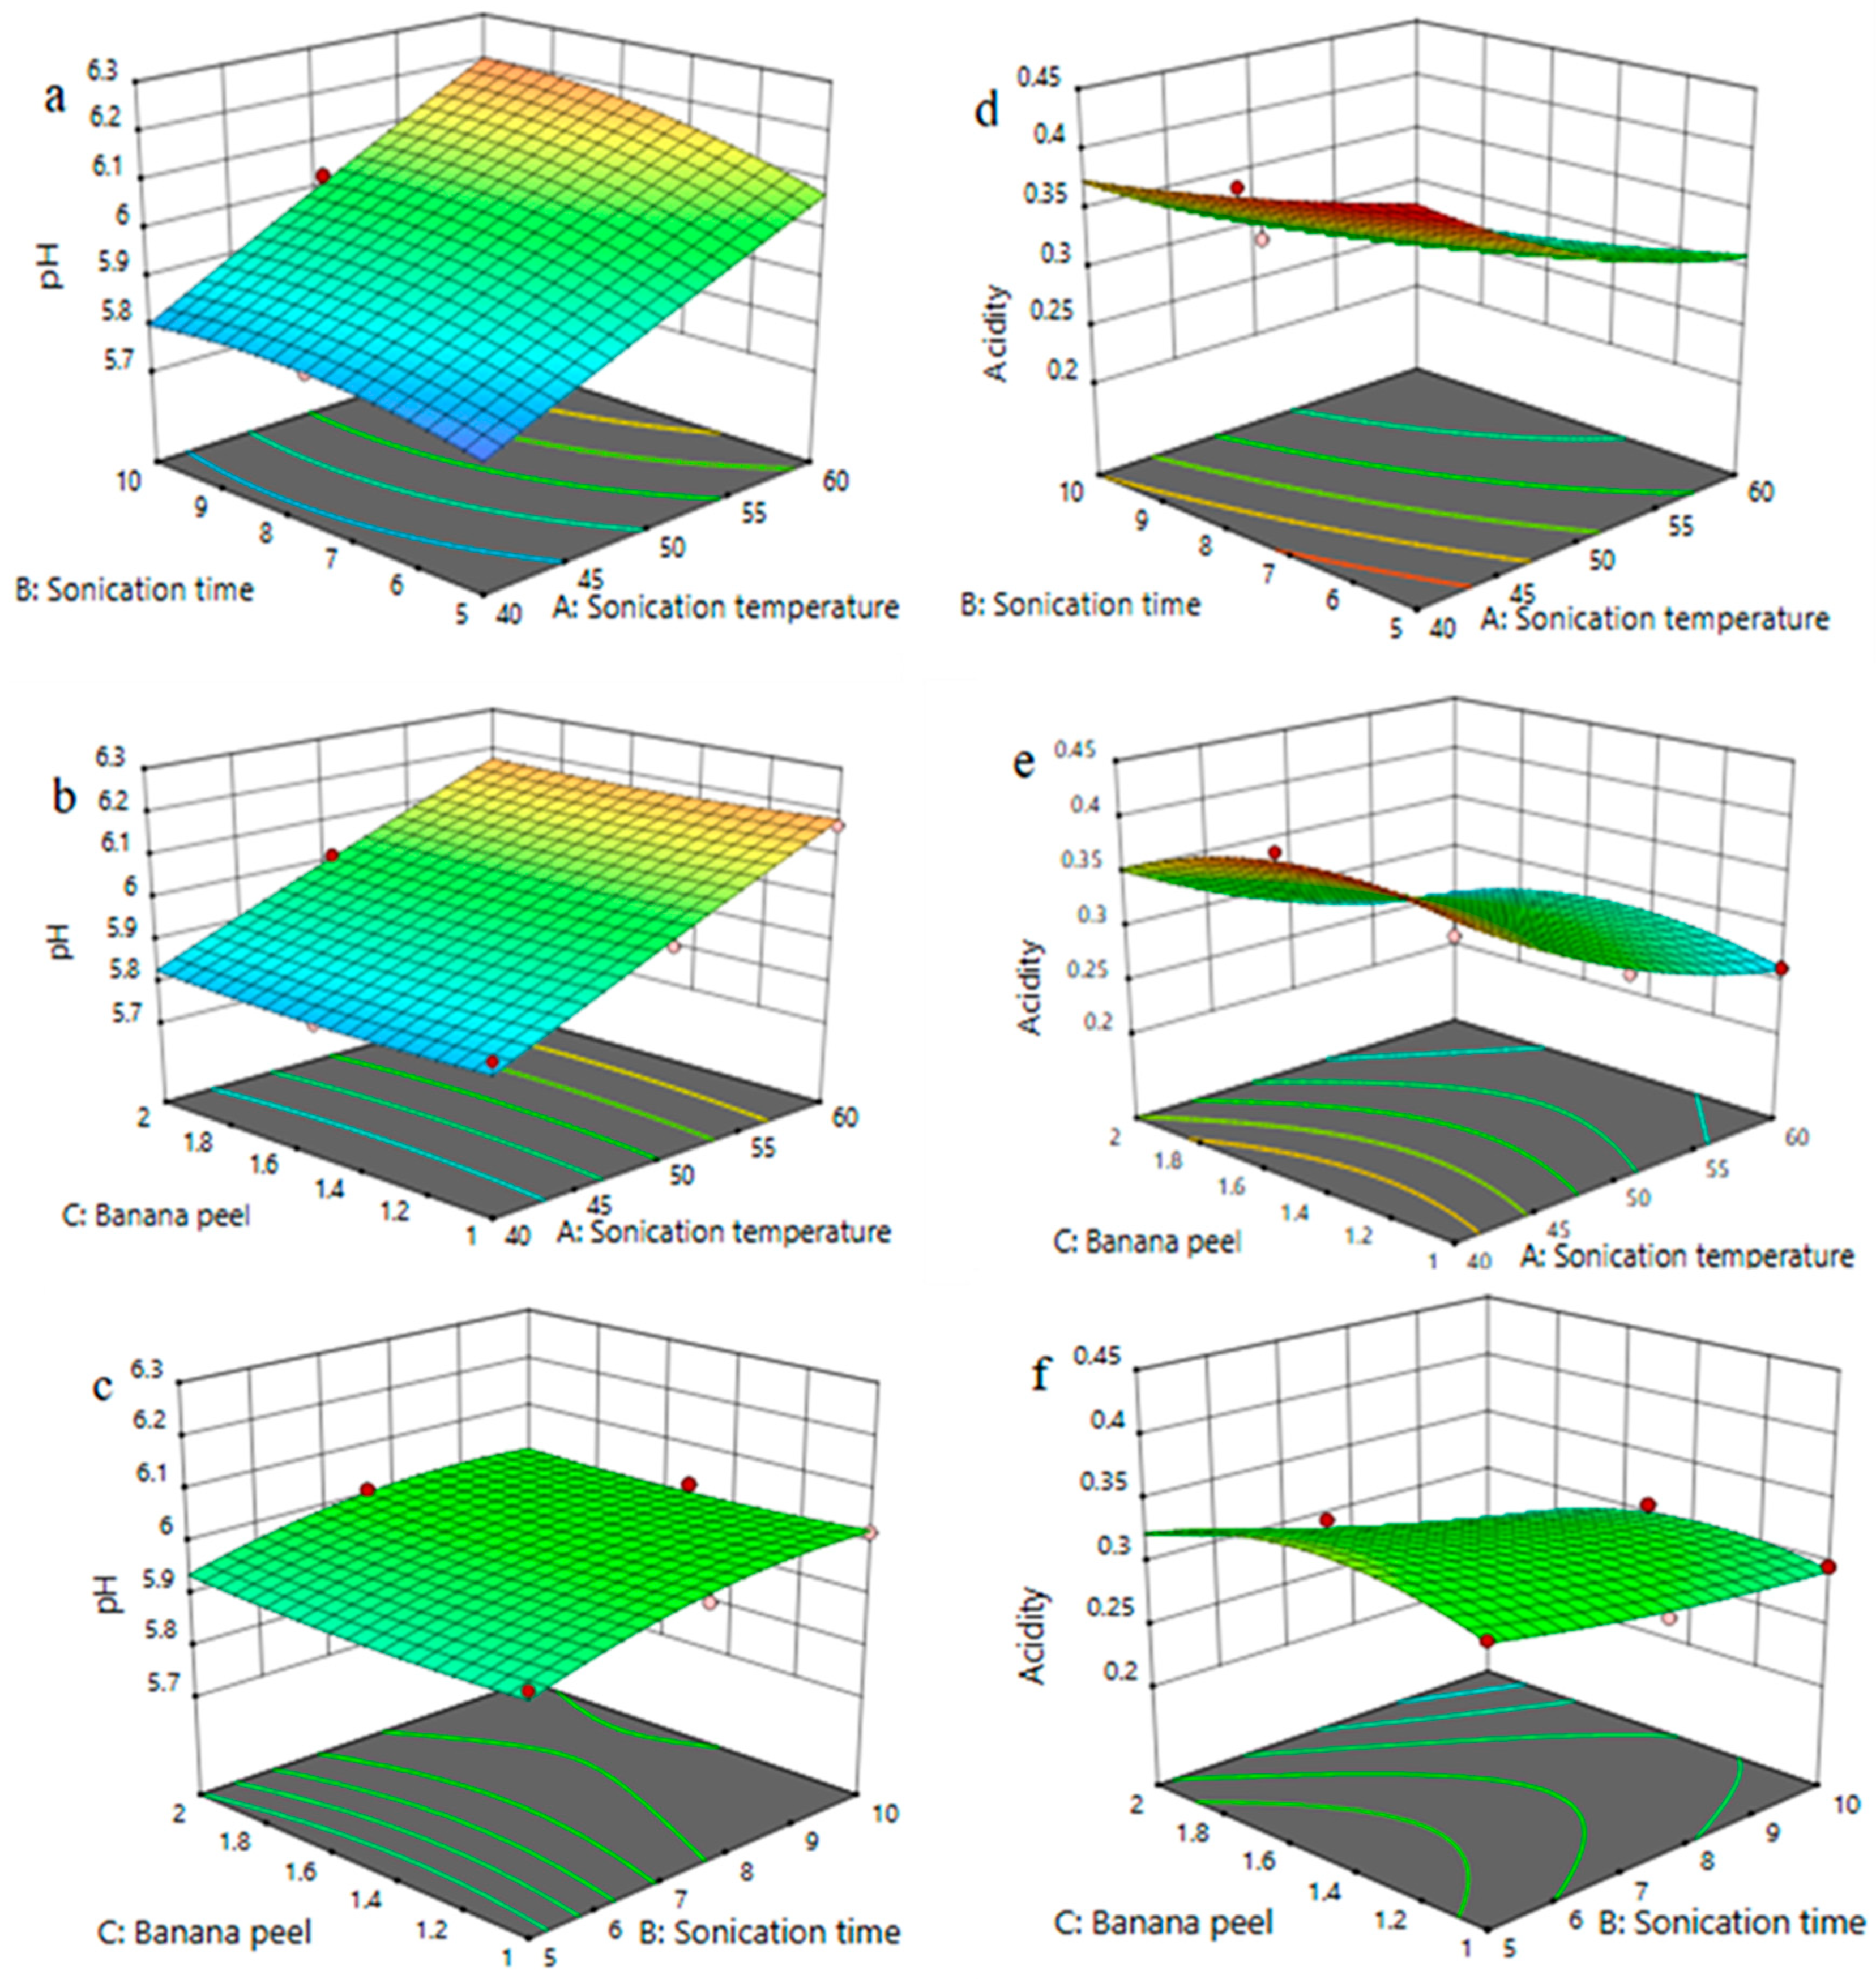
3.4. Effect of Process Variables on pH and Acidity of FPP

The prediction equation for the pH of puree using significant terms is presented as follows:
YpH = 5.996 + 0.177X1 + 0.042X2 + 0.023X1 X2 − 0.032X22
where YpH denotes the pH of the puree, and X1 represents the sonication temperature.
Figure 3 illustrates the relationship between pH and the experimental independent variables. At a constant BPP concentration (g/100 g), the pH exhibited a steady increase with rising sonication temperature, while an increase in sonication time resulted in a modest elevation of pH (Figure 3a). Additionally, at a fixed sonication duration the pH exhibited a significant increase with rising sonication temperature, while it showed a gradual increase with increasing BPP concentration (Figure 3b). The pH slightly increased with BPP concentration and sonication duration while maintaining a constant sonication temperature (Figure 3c). Figure 3, Table 2, and Equation (4) indicate that sonication temperature (p < 0.0001) and time (p < 0.001) significantly influenced FPP pH positively. The findings indicate that increasing the temperature and duration of sonication would elevate the pH of the puree. Additionally, the relationship between sonication temperature and time (p < 0.05) had a significant impact on the puree pH. This finding indicated that enhancing this combination will elevate the pH of the puree. The quadratic aspects of sonication time negatively influenced the concentration’s pH level, suggesting that increased values of this variable led to a decrease in pH.
The equation for predicting puree acidity, utilizing the significant terms, can be articulated as follows:
YAcidity = 0.321 − 0.057X1 − 0.026X2 − 0.011X3 − 0.009X2 X3 + 0.019X12 − 0.026X32
where YAcidity denotes the acidity of the puree, and X1, X2, and X3 represent the sonication temperature, sonication time, and BPP concentration (g/100 g), respectively.
Figure 3 illustrates the connection between acidity and the independent variables in the experiment. At a constant BPP concentration (Figure 3d) the acidity exhibited a slight decrease with increasing sonication temperature, while remaining unchanged with varying sonication time. Additionally, the reduction in sonication temperature decreased FPP acidity when the sonication time was kept constant. Simultaneously, the concentration of BPP exhibited a slight influence on the acidity of FPP (Figure 3e). At a constant sonication temperature, the duration of sonication had no impact on the FPP acidity. In contrast, the concentration of BPP increased FPP acidity (Figure 3f). Figure 3, Table 2, and Equation (5) indicate that sonication temperature (p < 0.0001), time (p < 0.0001), and BPP concentration (p < 0.01) significantly negatively affected FPP acidity. The findings indicate that increasing these variables would lead to a reduction in the acidity of the puree. Furthermore, the relationship between sonication time and BPP concentration (p < 0.05) had a significant negative impact on the pH of the puree. This finding indicated that enhancing this combination will lower the pH of the puree. The quadratic components of sonication temperature (p < 0.05) positively affected the acidity level in the puree, suggesting that increased values of this variable led to a higher pH. Nevertheless, the quadratic elements of BPP concentration (p < 0.01) affected the FPP acidity, suggesting that increased levels of this variable led to a decreased pH.

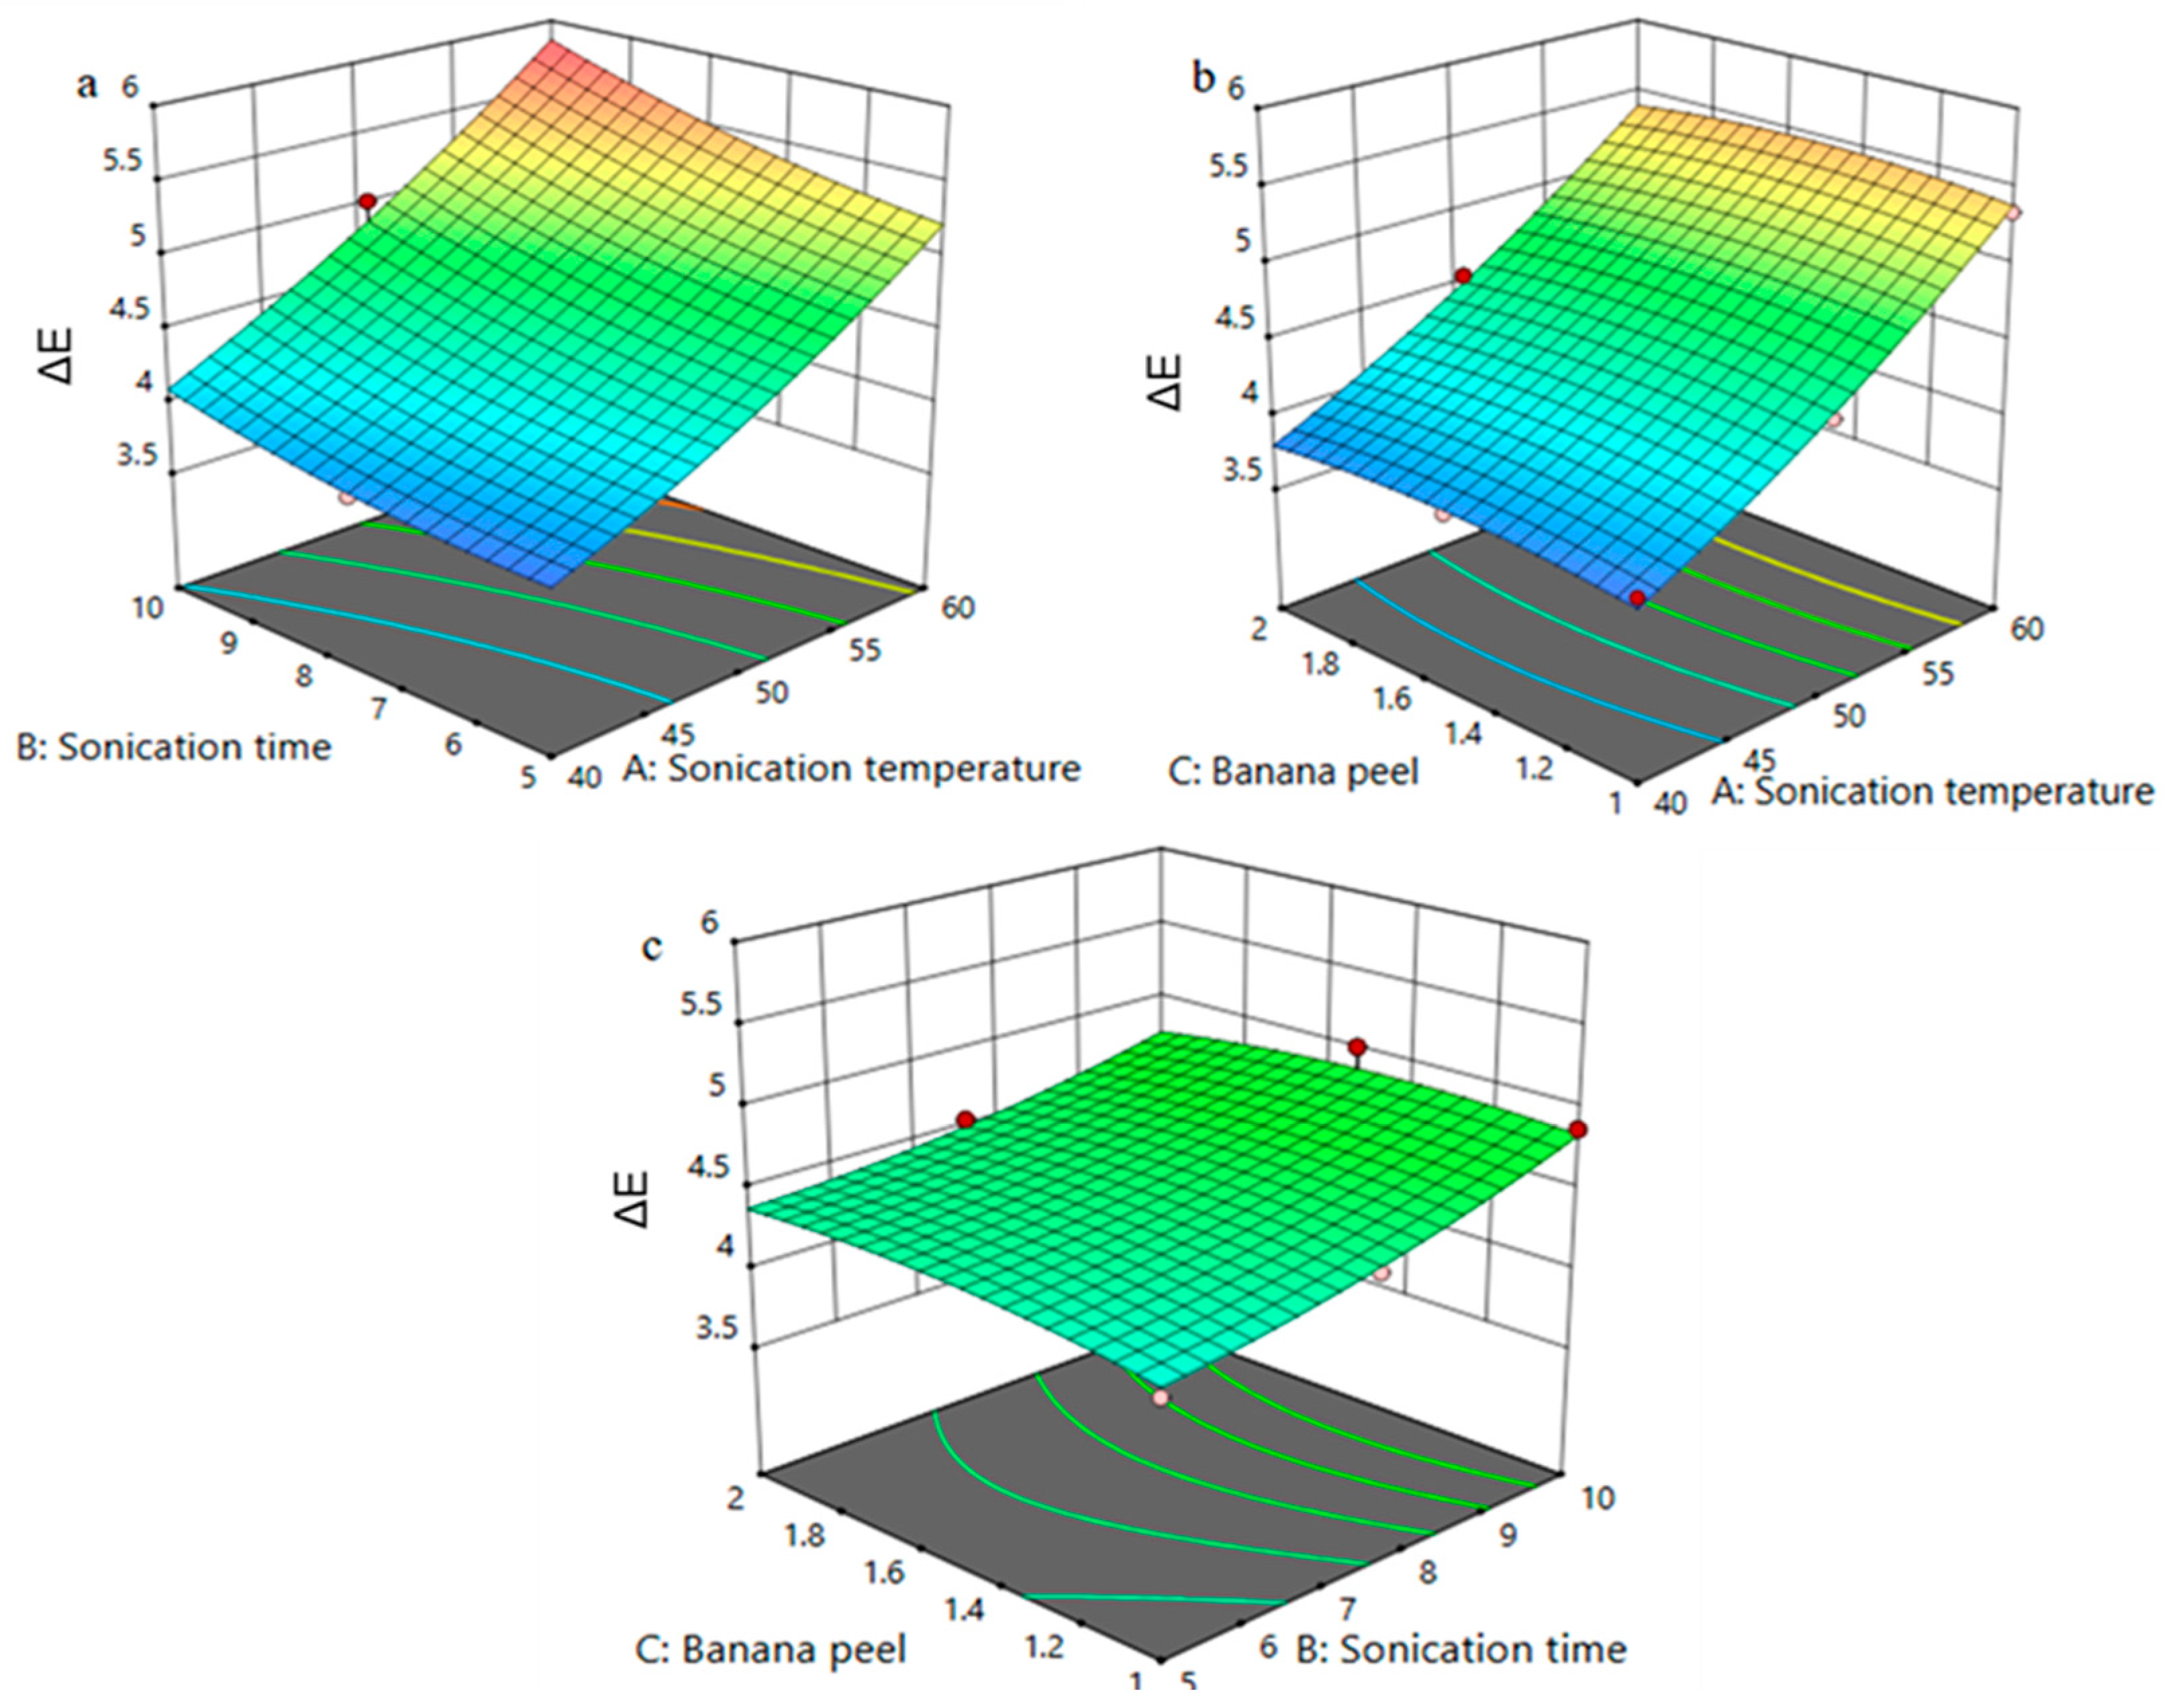
3.5. Effect of Process Variables on ΔE of FPP

The equation for predicting the ΔE of puree, using the significant terms, can be stated as follows:
YΔE = 4.559 + 0.805X1 + 0.242X2 + 0.079X1 X2 − 0.050X2 X3 + 0.099X12
where YΔE denotes the change in color of the puree, and X1, X2, and X3 represent the sonication temperature, sonication time, and BPP concentration (g/100 g), respectively.
Figure 4 illustrates the connection between ΔE and the experimental independent variables and the interactions among the components. Figure 4a illustrates that with a constant BPP concentration, ΔE increased notably with the sonication temperature and slightly with the sonication time. With a fixed sonication time ΔE increased slightly as BPP concentration rose, but it showed a significant increase with sonication temperature maintained at a constant time (Figure 4b). Figure 4c illustrates that the puree’s ΔE increased modestly with BPP concentration and considerably with sonication time at a constant temperature. Figure 4, Table 2, and Equation (6) indicate that sonication temperature (p < 0.0001) and time (p < 0.0001) significantly positively affected puree ΔE. The findings showed that elevating the sonication temperature and duration increased ΔE. Moreover, the slight positive interaction observed between sonication temperature and time (p < 0.01), along with BPP concentration and sonication time (p < 0.05), suggests that enhancing the combination of these factors will lead to an increase in puree ΔE. The quadratic components of sonication temperature (p < 0.05) positively affected the ΔE of the puree, suggesting that increased values of this variable led to a higher ΔE.

3.6. Optimization of the Extraction Process

The present study refined the concentration process to yield elevated amounts of TPC and DPPH whilst enhancing some physicochemical characteristics. To improve TPC and DPPH levels in the puree whilst enhancing its physicochemical properties, the suggested processing parameters were 40 °C, 8.23 min, and 2% for sonication temperature, time, and BPP concentration, respectively. The anticipated TPC, DPPH, pH, acidity, and ∆E values were 206.77 mg GAE/100 mL, 82.52%, 5.83, 0.34%, and 3.84, respectively. The experimental results for parameters under optimum conditions were 205.79 mg GAE/100 mL, 83.01%, 5.78, 0.32 g/100 g, and 3.81 for responses, respectively. The comparison of the experimental and predicted results showed a significant level of similarity, affirming RSM’s validity through a robust correlation. The desirability function, ranging from 0 to 1, was utilized to predict optimal conditions to achieve the highest TPC and DPPH along with enhanced physicochemical properties. In optimal circumstances, the experiment produced a significant desire level (D = 0.92).

4. Discussion

The nutritional quality of pumpkin pulp puree was assessed, revealing a high phenolic content and antioxidant activity. This puree has the potential to create nutritious food products [8]. Pumpkin bioactive compounds are believed to offer protection against various diseases, such as hypertension, diabetes, cancer, and coronary heart disease. Additionally, the fruit pulp treats intestinal inflammation or enteritis, dyspepsia, and stomach disorders [19]. Due to current challenges associated with non-communicable diseases, initial research has shown that pumpkin puree, particularly when paired with banana peel powder, is anticipated to be the most effective component for enhancing product quality by boosting the antioxidant potential (TPC and DPPH) and physicochemical parameters (pH, acidity, and color change) compared to pumpkin puree alone. We plan to prepare a pure puree that takes advantage of the health benefits of pumpkin and banana peel. Before starting, the study aimed to optimize the temperature and time for using thermosonication as an alternative to conventional pasteurization, as well as the BPP concentration. For optimization the study utilized response surface methodology (RSM). The goal was to maximize the content of total phenolics and improve DPPH scavenging activity levels while enhancing other quality attributes of the puree.
The process modeling of the puree indicated that all response results fell within ranges, demonstrating that the enhancement of these parameters is heavily dependent on the independent variables. The findings indicate that improving the quality of pumpkin puree is essential for achieving optimal TPC, DPPH, and overall quality attributes. A recent study aimed at optimizing carrot juice responses through the response surface technique demonstrated the notable impact of including extracts from orange peel and pulp in the carrot juice [20]. Maoto and Jideani [21] utilized a response surface technique to enhance watermelon juice’s processing and quality characteristics. All dependent factors (responses) were found to be significant in relation to the independent variables assessed. The ANOVA results demonstrated that the model was robust and highly significant, with p-values less than 0.0001 and regression coefficients close to 1, showing a strong relationship between the predicted and actual values [22]. The study’s high precision levels demonstrated that the models generated accurate signals, as noted by Martínez-Patiño et al. [23] who discovered that data with low coefficients of variation (CVs) are more precise and reproducible. The results indicated that the models applied are valid and the results obtained are reliable and accurate for predicting and optimizing puree processing settings to enhance bioactive components and physicochemical qualities.
The data indicates that increasing independent parameters, such as sonication temperature and time, significantly reduced the puree TPC. Conversely, BPP concentration notably enhanced the TPC of the puree. The increase in puree TPC with BPP concentration is likely attributed to the high TPC found in banana peels [24], which are rich in a range of biologically active compounds such as carotenoids, biogenic amines, polyphenols, phytosterols, and antioxidants. Moreover, these peels may serve as a valuable source of antioxidants and bioactive components in industrial food production [25]. While extended sonication time adversely affects the concentration’s TPC level, applying sonication for an appropriate duration will enhance the TPC. The observed rise in phenolic levels with extended sonication time could be attributed to cavitation. This process leads to the rupture of cell walls in the extracts and purees constituents due to sudden pressure changes caused by shear forces from bubble implosions. Such events may release the bound forms of such phenolic compounds, enhancing their presence in the juice, as noted in carrot juice [26]. As the sonication time increases, certain phenolic compounds may be degraded in the extracts and purees, leading to reductions in the TPCs. Jabbar et al. [27] noted comparable findings, indicating that carrot juice total phenols diminished as sonication time extended from 5 to 10 min at both 40 and 60 °C. The current research revealed that the inclusion of BPP diminished the influence of temperature on FPP phenolic content. Ultrasonication’s efficiency can be attributed to its ability to enhance hydration and fragmentation while promoting the mass transfer of solutes to the liquid [28].
Phenolic compounds derived from plants are increasingly recognized for their antioxidant properties, enabling them to mitigate and control oxidative stressors by functioning as reducing agents, free-radical scavengers, and metal ion chelators [29]. The method most frequently used to measure antioxidant activity is the DPPH radical scavenging activity method due to its straightforwardness, rapid execution, consistent results, and dependability [30]. This study evaluated the antioxidant activity of pumpkin puree fortified with BPP through the DPPH method. The results of the TPC and DPPH antioxidant activity assays demonstrated a comparable trend. The increased DPPH radical scavenging activity with BPP concentration is likely attributed to the high TPC of BPP [24]. Similarly, Mahomud et al. [31] found that banana peel could be a potential source of polyphenols, with fortified foods exhibiting significantly higher TPC levels than control foods. The initial enhancement in antiradical activity is ascribed to an increase in phenolic compounds in functional carrot juice, augmented by cavitation generated during sonication. This process facilitated the extraction and accessibility of these compounds from the extracts [27]. The reduced antiradical activity observed with increased sonication at elevated temperatures can be linked to the diminished levels of associated TPC generated during that period. Nonetheless, incorporating BPP might mitigate the impact of sonication temperature on phenolic compounds; as a result, we noted a modest rise in both TPC and DPPH with increasing temperature. Wu et al. [32] have also noted a reduction in antioxidant activity as the treatment temperature of thermosonicated blueberry juice increases. The above studies suggest that increasing temperatures may augment the extraction and accessibility of phenolic compounds by enhancing solute solubility and the diffusion coefficient. However, excessively elevated temperatures may lead to the denaturation of these compounds, emphasizing the significance of determining ideal temperature thresholds and enhancing process efficiency [33].
The data indicates that raising independent parameters like sonication temperature and sonication time notably elevated the puree pH while simultaneously reducing acidity. In contrast, BPP concentration resulted in an insignificant decrease in the puree’s pH while significantly increasing acidity. In line with the current finding, Baltacıoğlu’s [34] research on peach juice indicated that higher temperatures increased titratable acidity as pH decreased. Additionally, ultrasonic treatments of peach juice led to a significant decrease in pH compared to fresh juice [35]. Titratable acidity rose as pH values decreased. Zhang et al. [36] found that the sonication of pumpkin juice did not affect its pH or acidity. Choo et al. [37] observed no differences in pH and titratable acidity across fresh, sonicated, and pasteurized juice samples. Farhadi Chitgar et al. [38] found no significant differences in pH or titratable acidity between fresh, sonicated, and pasteurized barberry juice. Li et al. [39] noted minor alterations in the pH of thermosonicated tomato juice.
The data indicate that increasing independent parameters like sonication temperature and sonication time leads to significant changes in puree ∆E, while the BPP concentration did not cause any changes. Whilst the sonication temperature and duration significantly influenced the puree color, this observation aligns with the findings of Baltacıoğlu [34] indicated that extending the heating duration at each temperature led to a darker peach juice, a reduction in yellowness as a decline in b* value, and an increase in redness. Zhang et al. [36] observed that ultrasonic treatment led to a slight decrease in ΔE values for pumpkin juice, but with time and temperature it increased compared to the untreated samples. Additionally, the thermosonication of freshly squeezed tomato juice increased ΔE with both temperature and time [39]. Zahid et al. [29] found that the incorporation of banana peel powder led to a decrease in lightness (L*) and an increase in redness (a*) whilst not affecting yellowness (b*). The rapid decline in brightness and the heightened redness were ascribed to the hue of the banana peel.

5. Conclusions

This research demonstrated that incorporating banana peel phenolic-rich powder into pumpkin puree notably enhanced its phenolic content and antioxidant activity. The findings indicated that a puree with ideal properties can be produced by adjusting sonication temperature and time along with BPP content, as independent variables, while RSM is the mathematical optimization tool used. Statistical and graphical analyses demonstrated that sonication temperature and duration decreased the puree’s TPC and DPPH levels. Additionally, their interaction and quadratic effects negatively influenced DPPH, while the quadratic effect of sonication time adversely affected TPC. Nonetheless, the BPP concentration notably enhanced the antioxidant capacity of the puree; however, when paired with sonication time it reduced the TPC. The pH increased linearly and in combination with sonication temperature and time, along with a corresponding rise in acidity. The puree pH decreased quadratically as the sonication time increased, accompanied by a rise in acidity. The change in puree color intensified as sonication temperature and time increased, even when these factors were combined. The statistical and graphical analysis indicated that sonication temperature, time, and BPP concentration are the key parameters influencing the puree’s TPC, DPPH, and various physicochemical properties. To attain significant antioxidant potential and impressive physicochemical characteristics, we maintained the sonication temperature at 40 °C, the sonication duration at 8.23 min, and the BPP content at 2 g/100 g.

Author Contributions

W.A.A.: Contributed to the design of the work, analysis, and interpretation of the work data, and drafting of the work and revising it critically. E.E.B.: Contributed to the design of the work, analysis, and interpretation of the work data, drafting of the work, revising it critically and approving the final version for submission, and communication with the journal during the manuscript submission, peer review, and publication process, I.A.M.A.: Contributed to the design of the work, analysis, and interpretation of the work data, drafting of the work, revising it critically and approving the final version for submission, and agreed to be accountable for all aspects of the work. F.Y.A.J.: Contributed to the interpretation of the work data, and the drafting of the work, revising it critically, and approving the final version for submission. All authors have read and agreed to the published version of the manuscript.

Funding

This work was supported and funded by Ongoing Research Funding program (ORF-2025-83), King Saud University, Riyadh, Saudi Arabia.

Data Availability Statement

Data will be made available upon the request of the corresponding author.

Conflicts of Interest

The authors declare no conflicts of interest. The work described has not been published previously except in the form of a preprint, an abstract, a published lecture, academic thesis or registered report. The article is not under consideration for publication elsewhere. The article’s publication is approved by all authors and tacitly or explicitly by the responsible authorities where the work was carried out.

References

  1. Rodríguez, L.G.R.; Gasga, V.M.Z.; Pescuma, M.; Van Nieuwenhove, C.; Mozzi, F.; Burgos, J.A.S. Fruits and fruit byproducts as sources of bioactive compounds. Benefits and trends of lactic acid fermentation in the development of novel fruit-based functional beverages. Food Res. Int. 2021, 140, 109854. [Google Scholar] [CrossRef] [PubMed]
  2. Gupta, A.; Sanwal, N.; Bareen, M.A.; Barua, S.; Sharma, N.; Olatunji, O.J.; Sahu, J.K. Trends in functional beverages: Functional ingredients, processing technologies, stability, health benefits, and consumer perspective. Food Res. Int. 2023, 170, 113046. [Google Scholar] [CrossRef] [PubMed]
  3. Jiménez-Moreno, N.; Esparza, I.; Bimbela, F.; Gandía, L.M.; Ancín-Azpilicueta, C. Valorization of selected fruit and vegetable wastes as bioactive compounds: Opportunities and challenges. Crit. Rev. Environ. Sci. Technol. 2020, 50, 2061–2108. [Google Scholar] [CrossRef]
  4. Peng, M.; Tabashsum, Z.; Anderson, M.; Truong, A.; Houser, A.K.; Padilla, J.; Biswas, D. Effectiveness of probiotics, prebiotics, and prebiotic-like components in common functional foods. Compr. Rev. Food Sci. Food Saf. 2020, 19, 1908–1933. [Google Scholar] [CrossRef] [PubMed]
  5. Kaur, S.; Panghal, A.; Garg, M.K.; Mann, S.; Khatkar, S.K.; Sharma, P.; Chhikara, N. Functional and nutraceutical properties of pumpkin—A review. Nutr. Food Sci. 2020, 50, 384–401. [Google Scholar] [CrossRef]
  6. Sharma, P.; Kaur, G.; Kehinde, B.A.; Chhikara, N.; Panghal, A.; Kaur, H. Pharmacological and biomedical uses of extracts of pumpkin and its relatives and applications in the food industry: A review. Int. J. Veg. Sci. 2020, 26, 79–95. [Google Scholar] [CrossRef]
  7. Asif, M.; Raza Naqvi, S.A.; Sherazi, T.A.; Ahmad, M.; Zahoor, A.F.; Shahzad, S.A.; Mahmood, N. Antioxidant, antibacterial and anti-proliferative activities of pumpkin (cucurbit) peel and puree extracts-an in vitro study. Pakistan J. Pharm. Sci. 2017, 30, 1327–1334. [Google Scholar]
  8. Bemfeito, C.M.; Carneiro, J.D.D.S.; Carvalho, E.E.N.; Coli, P.C.; Pereira, R.C.; Boas, E.V.D.B.V. Nutritional and functional potential of pumpkin (Cucurbita moschata) pulp and pequi (Caryocar brasiliense Camb.) peel flours. J. Food Sci. Technol. 2020, 57, 3920–3925. [Google Scholar] [CrossRef] [PubMed]
  9. Gomes, S.; Vieira, B.; Barbosa, C.; Pinheiro, R. Evaluation of mature banana peel flour on physical, chemical and texture properties of a gluten free Rissol. J. Food Proc. Pres. 2022, 46, e14441. [Google Scholar] [CrossRef]
  10. Pereira, A.; Maraschin, M. Banana (Musa spp.) from peel to pulp: Ethnopharmacology, source of bioactive compounds and its relevance for human health. J. Ethnopharm. 2015, 160, 149–163. [Google Scholar] [CrossRef] [PubMed]
  11. Zaini, H.M.; Roslan, J.; Saallah, S.; Munsu, E.; Sulaiman, N.S.; Pindi, W. Banana peels as a bioactive ingredient and its potential application in the food industry. J. Func. Foods 2022, 92, 105054. [Google Scholar] [CrossRef]
  12. Sidhu, J.S.; Zafar, T.A. Bioactive compounds in banana fruits and their health benefits. Food Qual. Saf. 2018, 2, 183–188. [Google Scholar] [CrossRef]
  13. Lepaus, B.M.; Valiati, B.S.; Machado, B.G.; Domingos, M.M.; Silva, M.N.; Silva, L.F.; de São José, J.F.B. Impact of ultrasound processing on the nutritional components of fruit and vegetable juices. Trends Food Sci. Technol. 2023, 138, 752–765. [Google Scholar] [CrossRef]
  14. da Rocha Cordeiro Dias, D.; Barros, Z.M.P.; de Carvalho, C.B.O.; Honorato, F.A.; Guerra, N.B.; Azoubel, P.M. Effect of sonication on soursop juice quality. LWT-Food Sci. Technol. 2015, 62, 883–889. [Google Scholar] [CrossRef]
  15. Aghajanzadeh, S.; Ziaiifar, A.M.; Verkerk, R. Effect of thermal and non-thermal treatments on the color of citrus juice: A review. Food Rev. Int. 2023, 39, 3555–3577. [Google Scholar] [CrossRef]
  16. Juang, E.K.; De Koninck, L.H.; Vuong, K.S.; Gnanaskandan, A.; Hsiao, C.T.; Averkiou, M.A. Controlled hyperthermia with high-intensity focused ultrasound and ultrasound contrast agent microbubbles in porcine liver. Ultras. Med. Biol. 2023, 49, 1852–1860. [Google Scholar] [CrossRef] [PubMed]
  17. Cho, W.Y.; Yeon, S.J.; Hong, G.E.; Kim, J.H.; Ayush, C.T.; Lee, C.H. Antioxidant activity and quality characteristics of yogurt added green olive powder during storage. Korean J. Food Sci. Anim. Resour. 2017, 37, 865–872. [Google Scholar] [CrossRef] [PubMed]
  18. Lee, S.K.; Mbwambo, Z.H.; Chung, H.S.; Luyengi, L.; Games, E.J.C.; Mehta, R.G. Evaluation of the antioxidant potential of natural products. Comb. Chem. High Throu. Scr. 1998, 1, 35–46. [Google Scholar] [CrossRef]
  19. Wang, S.; Lu, A.; Zhang, L.U.; Shen, M.; Xu, T.; Zhan, W.; Wang, W. Extraction and purification of pumpkin polysaccharides and their hypoglycemic effect. Int. J. Biol. Macromol. 2017, 98, 182–187. [Google Scholar] [CrossRef] [PubMed]
  20. Adiamo, O.Q.; Ghafoor, K.; Juhaimi, F.A.; Babiker, E.E.; Ahmed, I.A.M. Thermosonication process for optimal functional properties in carrot juice containing orange peel and pulp extracts. Food Chem. 2018, 245, 79–88. [Google Scholar] [CrossRef] [PubMed]
  21. Maoto, M.M.; Jideani, A.I. Optimization of thermosonication conditions for critical quality parameters of watermelon juice using response surface methodology. Sci. Rep. 2024, 14, 13803. [Google Scholar] [CrossRef] [PubMed]
  22. Fadimu, G.J.; Ghafoor, K.; Babiker, E.E.; Juhaimi, F.A.; Abdulraheem, R.A.; Adenekan, M.K. Ultrasound-assisted process for optimal recovery of phenolic compounds from watermelon (Citrullus lanatus) seed and peel. J. Food Meas. Charact. 2020, 14, 1784–1793. [Google Scholar] [CrossRef]
  23. Martínez-Patiño, J.C.; Gullón, B.; Romero, I.; Ruiz, E.; Brnčić, M.; Šic Žlabur, J.; Castro, E. Optimization of ultrasound-assisted extraction of biomass from olive trees using response surface methodology. Ultrason. Sonochem. 2019, 51, 487–495. [Google Scholar] [CrossRef] [PubMed]
  24. Zahid, H.F.; Ranadheera, C.S.; Fang, Z.; Ajlouni, S. Utilization of mango, apple and banana fruit peels as prebiotics and functional ingredients. Agriculture 2021, 11, 584. [Google Scholar] [CrossRef]
  25. Oguntoyinbo, O.; Olumurewa, J.A.V.; Omoba, O.S. Chemical composition, dietary fiber and antioxidant activity of fermented ripe banana peel flour. J. Food Stab. 2020, 3, 27–42. [Google Scholar] [CrossRef]
  26. Adiamo, O.Q.; Ghafoor, K.; Juhaimi, F.A.; Mohamed Ahmed, I.A.; Babiker, E.E. Effects of thermosonication and orange byproducts extracts on quality attributes of carrot (Daucus carota) juice during storage. Int. J. Food Sci. Technol. 2017, 52, 2115–2125. [Google Scholar] [CrossRef]
  27. Jabbar, S.; Abid, M.; Hu, B.; Hashim, M.M.; Lei, S.; Wu, T.; Zeng, X. Exploring the potential of thermosonication in carrot juice processing. J. Food Sci. Technol. 2015, 52, 7002–7013. [Google Scholar] [CrossRef]
  28. Devos, C.; Bampouli, A.; Brozzi, E.; Stefanidis, G.D.; Dusselier, M.; Van Gerven, T.; Kuhn, S. Ultrasound mechanisms and their effect on solid synthesis and processing: A review. Chem. Soc. Rev. 2024, 54, 85–115. [Google Scholar] [CrossRef] [PubMed]
  29. Zahid, H.F.; Ranadheera, C.S.; Fang, Z.; Ajlouni, S. Functional and healthy yogurts fortified with probiotics and fruit peel powders. Fermentation 2022, 8, 469. [Google Scholar] [CrossRef]
  30. Munteanu, I.G.; Apetrei, C. Analytical methods used in determining antioxidant activity: A review. Int. J. Mol. Sci. 2021, 22, 3380. [Google Scholar] [CrossRef] [PubMed]
  31. Mahomud, M.S.; Islam, M.N.; Hossen, D.; Wazed, M.A.; Yasmin, S.; Sarker, M.S.H. Innovative probiotic yogurt: Leveraging green banana peel for enhanced quality, functionality, and sensory attributes. Heliyon 2024, 10, e38781. [Google Scholar] [CrossRef] [PubMed]
  32. Wu, Y.; Xu, L.; Liu, X.; Hasan, K.F.; Li, H.; Zhou, S.; Zhou, Y. Effect of thermosonication treatment on blueberry juice quality: Total phenolics, flavonoids, anthocyanin, and antioxidant activity. LWT-Food Sci. Technol. 2021, 150, 112021. [Google Scholar] [CrossRef]
  33. Baron, G.; Ferrario, G.; Marinello, C.; Carini, M.; Morazzoni, P.; Aldini, G. Effect of extraction solvent and temperature on polyphenol profiles, antioxidant and anti-inflammatory effects of red grape skin byproduct. Molecules 2021, 26, 5454. [Google Scholar] [CrossRef] [PubMed]
  34. Baltacıoğlu, H. Thermosonication of peach juice: Investigation of PPO and POD activities, physicochemical and bioactive compounds changes, and development of FT-IR–based chemometric models for the evaluation of quality. Int. J. Food Sci. Technol. 2022, 57, 1688–1697. [Google Scholar] [CrossRef]
  35. Yildiz, G. Application of ultrasound and high-pressure homogenization against high temperature-short time in peach juice. J. Food Proc. Eng. 2019, 42, e12997. [Google Scholar] [CrossRef]
  36. Zhang, M.; Zhou, C.; Ma, L.; Su, W.; Jiang, J.; Hu, X. Influence of ultrasound on the microbiological, physicochemical properties, and sensory quality of different varieties of pumpkin juice. Heliyon 2024, 10, e27927. [Google Scholar] [CrossRef] [PubMed]
  37. Choo, Y.X.; Teh, L.K.; Tan, C.X. Effects of sonication and thermal pasteurization on the nutritional, antioxidant, and microbial properties of noni juice. Molecules 2022, 28, 313. [Google Scholar] [CrossRef] [PubMed]
  38. Chitgar, M.F.; Aalami, M.; Maghsoudlou, Y.; Milani, E. Comparative study on the effect of heat treatment and sonication on the quality of barberry (Berberis vulgaris) juice. J. Food Proc. Pres. 2017, 41, e12956. [Google Scholar] [CrossRef]
  39. Li, L.; Su, H.; Pang, L.; Pan, Y.; Li, X.; Xu, Q.; Qiao, L. Thermosonication enhanced the bioactive, antioxidant, and flavor attributes of freshly squeezed tomato juice. Ultras. Sonochem. 2025, 115, 107299. [Google Scholar] [CrossRef] [PubMed]
Figure 1. Response surface plots of total phenolic content (TPC) as a function of (a) sonication time and temperature, (b) banana peel powder concentration and sonication temperature, (c) banana peel powder concentration and sonication time of pumpkin puree fortified with different banana peel powder concentrations (g/100 g) and thermosonicated at different times (min) and temperatures (°C).
Beverages 11 00106 g001
Figure 2. Response surface plots of antioxidant activity (DPPH) as a function of (a) sonication time and temperature, (b) banana peel powder concentration and sonication temperature, (c) banana peel powder concentration and sonication time of pumpkin puree fortified with different banana peel powder concentrations (g/100 g) and thermosonicated at different time (min) and temperatures (°C).
Beverages 11 00106 g002
Figure 3. Response surface plots of pH (left) and acidity in g/100 g (right) as a function of (a,d) sonication time and temperature, (b,e) banana peel powder concentration and sonication temperature, (c,f) banana peel powder concentration and sonication time of pumpkin puree fortified with different banana peel powder concentrations (g/100 g) and thermosonicated at different time (min) and temperatures (°C).
Beverages 11 00106 g003
Figure 4. Response surface plots of color change (ΔE) as a function of (a) sonication time and temperature, (b) banana peel powder concentration and sonication temperature, (c) banana peel powder concentration and sonication time of pumpkin puree fortified with different banana peel powder concentrations (g/100 g) and thermosonicated at different time (min) and temperatures (°C).
Beverages 11 00106 g004
Table 1. Effects of thermosonication temperature, time variations, and banana peel powder concentration (BPP) on responses using response surface method (RSM).
RunIndependent VariablesResponses
X1X2X312345
Sonication TemperatureSonication Time (min)BPP (g/100 g)TPC (mg/100 mL)DPPH%pHAcidity
(g/100 g)
Color
14052209.8372.905.800.403.76
2407.51182.3167.585.850.383.82
3507.52199.4983.596.010.294.54
44052210.9874.055.780.393.76
540101172.1971.525.820.384.02
66051175.8564.2966.100.285.16
7607.51170.5567.186.170.265.34
850101.5183.2975.456.020.284.76
960102182.3474.716.250.225.73
106052185.2278.356.070.295.18
1160102180.3474.416.170.235.74
12507.51175.0268.885.990.304.43
1340102198.8083.395.800.313.97
145051178.5266.175.940.334.19
1540102199.7183.695.800.333.98
1650101167.5268.596.020.304.87
1750101.5180.8972.055.990.315.02
186052184.4277.256.080.285.20
194051181.8064.665.740.423.63
20407.51.5197.4575.115.810.413.83
Table 2. Regression coefficients of process independent variables and product responses.
FactorsTPCDPPHpHAcidityΔE
Intercept
β0189.964 ****75.324 ****5.996 ****0.321 ****4.559 ****
Linear
X1 (β1) −7.521 ****−1.555 **0.177 ****−0.057 ****0.805 ****
X2 (β2)−4.945 ****1.318 *0.042 ***−0.026 ****0.241 ****
X3 (β3)10.521 ****6.236 ****−0.001−0.011 **0.013
Interaction
X1X2 (β12)1.164−3.062 ****0.023 *0.0020.079 **
X1X3 (β13)−3.353 ***0.363−0.0040.007−0.007
X2X3 (β23)0.8020.358−0.006−0.009 *0.050 *
Quadratic
X12 (β11)−0.026−2.217 *−0.0050.019 *0.099 *
X22 (β22)−3.420 **−2.670 **−0.032 *0.0050.075
X32 (β33)−2.8540.8230.011−0.026 **−0.075
Model F-value91.1135.2872.7157.90185.25
p-value<0.0001<0.0001<0.0001<0.0001<0.0001
Mean185.8273.195.960.3204.55
C.V.%1.031.990.3423.391.63
Adeq. precision31.12219.95823.9824.54840.427
R20.9880.9700.9850.9810.981
Adjusted R20.9770.9420.9710.9640.989
Predicted R20.9340.8680.9410.9260.978
Std. Dev.1.9101.4500.0260.0110.074
F-value (Lack of Fit)4.8101.9600.0920.8780.670
p-value (Lack of Fit)0.0550.2390.5440.5550.665
* p < 0.05, ** p < 0.01, *** p < 0.001, **** p < 0.0001.
Disclaimer/Publisher’s Note: The statements, opinions and data contained in all publications are solely those of the individual author(s) and contributor(s) and not of MDPI and/or the editor(s). MDPI and/or the editor(s) disclaim responsibility for any injury to people or property resulting from any ideas, methods, instructions or products referred to in the content.

