Article

Preliminary Study for Raicilla Authentication by PCA and Cluster on Some Physicochemical Properties

by
Alejandra Carreon-Alvarez
1,*,
Florentina Zurita
2,
Clara Carreon-Alvarez
1,
Marciano Sanchez-Tizapa
1,
Héctor Huerta
3,
Nancy Tepale
4 and
Juan Pablo Morán-Lázaro
3
1
Departamento de Ciencias Naturales y Exactas, Centro Universitario de los Valles, Universidad de Guadalajara, Ameca 46600, Jalisco, Mexico
2
Environmental Quality Research Center, Centro Universitario de la Cienega, University of Guadalajara, Ocotlan 47820, Jalisco, Mexico
3
Departamento de Ciencias Computacionales e Ingenierías, Centro Universitario de los Valles, Universidad de Guadalajara, Ameca 46600, Jalisco, Mexico
4
Facultad de Ingeniería Química, Benemérita Universidad Autónoma de Puebla, Puebla 72570, Puebla, Mexico
*
Author to whom correspondence should be addressed.
Beverages 2025, 11(4), 107; https://doi.org/10.3390/beverages11040107
Submission received: 17 April 2025 / Revised: 12 June 2025 / Accepted: 17 July 2025 / Published: 24 July 2025

Abstract

Raicilla is a distinctive Mexican beverage produced in two central regions of Jalisco. This study aimed to analyze the physicochemical parameters of 25 raicilla alcoholic drinks originating from the Coast and Sierra regions. Each of the 25 raicilla brands underwent measurements of pH, conductivity, alcohol content, total solids, viscosity, sound velocity, density, and refractive index. Notably, these measurements are cost-effective and their analysis is straightforward. The results were analyzed using principal component analysis (PCA) and cluster analysis. According to the PCA, two main components were identified, explaining 81.77% of the total variability of the physicochemical measurements of the distinct Coast and Sierra regions. Furthermore, applying Fisher’s LSD to the Sierra raicilla cluster allowed for the identification of variations. Specifically, samples from the Sierra zone groups were identified through cluster analysis, demonstrating similarities in physicochemical parameters; both statistical methods indicated no significant differences in the physicochemical parameters between a more acidic pH, higher conductivity, and greater density than those from the Coast zone. After the analysis was carried out, it was possible to find similarities and differences between the raicilla produced in the two regions, so it is possible to assume that using these results could facilitate the authentication of raicilla.

1. Introduction

Raicilla is an alcoholic Mexican beverage produced in the west of Jalisco and Nayarit. Some records show that this drink emerged in this region simultaneously with mining in the area in the century XVII. Since then, the techniques and secrets of its elaboration have been passed on from parents to children. Raicilla has a designation of origin, which means that only well-defined regions can produce it and its preparation must be as indicated on the designation [1].
The production of raicilla is concentrated in two distinct areas of Jalisco: the Coast and the mountainous Sierra region. Within these regions, the municipalities of Atenguillo, Mixtlan, Talpa de Allende, San Sebastian del Oeste, Mascota, Guachinango, Atengo, Ayutla, Cuautla, Cabo Corrientes, Chiquilistlán, Juchitlán, Puerto Vallarta, Tecolotlán, Tenamaxtlán, and Tomatlán in Jalisco, as well as Bahía de Banderas in Nayarit, are known for crafting this unique beverage.
Raicilla is produced from five species of agave: Rhodacantha and Angustifolia Haw in the Coast region, and Maximilana Baker, Ineaquidens Koch, and Valenciana in the Sierra region. At the same time, the agave of the Coast region is reproduced by pups, while in the Sierra region, it is propagated by seed. The agave growth period spans 8 to 10 years; after this stage, flowering commences, marked by the emergence of a vertical inflorescence or quiote. This indicates that the plant is nearing the end of its life, emphasizing the importance of harvesting it before this appearance. Only the center part of the plant, known as the pineapple, agave head, or maguey head, is used, as this section contains the highest amount of sugar.
The agave harvest marks the initial step in the raicilla production process. Following the harvest, the agave leaves are removed through a process known as jima, leaving the marrow unearthed from the ground, resulting in only the agave core or heart. The pineapples are then transported to the production site, where they are manually cut into two or four parts. The cut pineapples then undergo a cooking process that lasts from 6 to 72 h to hydrolyze the agave sugars. Since fructans are not directly fermentable, the choice of oven varies, with the bakery type being used in the Sierra region and the hole type in the Coastal region.
The process proceeds with grinding, during which the hydrolyzed sugars are extracted from the fiber. Wooden or stainless steel mills are utilized in this procedure, resulting in the extraction of agave juice. This juice serves as the foundational liquid for the mash required for fermentation. Once prepared, it must undergo a crucial step of inoculation with a microbial culture, specifically a native strain carefully stored by producers. The quality of the final inoculum plays a crucial role as a significant part of the final product’s quality depends on it. The inoculation process may result in a microbial population ratio different from the ideal one, potentially leading to an undesirable product. Following this preparation, the fermentation process occurs openly in stainless steel vats or tanks with volumes ranging from 12 L to 150 L. The fermentation process unfolds at a temperature of between 32 °C and 38 °C and the duration can vary from 72 h to one week to achieve the desired alcohol content [2,3].
A critical moment in the production of raicilla is the distillation process. For this process, in the Sierra region, a Philippine-style tank made of stainless steel or wood (equipped with a coil made of copper alloy and other metals) is used. Meanwhile, in the Coast area, their unique method involves using a hollow tree trunk called a ‘Bonnet’. This setup includes a large ladle below, where the fermented must is deposited. Below this ladle, the heat source is positioned, causing the fermented must to evaporate. Above it, another teaspoon carries cold water, allowing the steam to rise, collide with the cold water, and condense. The resulting liquid then falls through a cane attached to the upper ladle. This distillation operation is critical in shaping the final product’s characteristics, as it separates ethanol and other volatile compounds from the fermented must.
Each stage in raicilla production entails crucial steps, such as the cooking time, fermentation duration, inoculum effectiveness, and the materials used. Despite the relevance of various factors at each stage, their comprehensive impact on the process remains unclear. Only by measuring the physicochemical parameters of the raicilla can the variability in the production process and the quality of the final product be controlled. Furthermore, within the designation of origin, there are three distinct categories: raicilla, artisanal raicilla, and traditional ancestral raicilla. Below is a summary of the main characteristics that distinguish each category [4]:
  • Raicilla: The cooking of the heads is performed in shaft furnaces, masonry, or autoclave, while the grinding is performed in tahona, Egyptian, or Chilean mill, ripper trapiche, or mill train. Fermentation is performed in wooden containers, masonry pools, or stainless steel tanks. The distillation is carried out in alembics or continuous or discontinuous distillers of copper or stainless steel.
  • Artisanal raicilla: In this case, the cooking of the heads is carried out in shaft furnaces or elevated masonry heated with gas or firewood. The grinding is performed with a mallet, bakery, Chilean or Egyptian mill, trapiche, or tearing machine. Fermentation is performed in stone, soil, or trunk masonry pools, wooden or clay containers, and animal skins, utilizing a process that includes the use of maguey fiber (bagasse). Distillation is performed with direct fire in copper alembics or clay pots and with a montera made of clay, wood, copper, or stainless steel capable of holding up to 500 L. In this process, the fiber of the maguey bagasse can be included.
  • Ancestral tradition raicilla: The agave heads or maguey heads are cooked in shaft furnaces or masonry ovens. The grinding is performed with mallets on a tahona, a traditional Chilean or Egyptian mill, or a wooden mortar, such as a wooden pool, like a canoe. The fermentation, in this case, is carried out in the same way as in the case of the artisanal raicilla. The distillation is performed with a direct fire produced with firewood in a clay pot and a clay or wooden montera. The maguey fiber (bagasse) must be included in this process.
Additionally, within each category of raicilla, distinct treatments are employed to craft the following varieties: young white or silver (characterized by its colorless and translucent nature, which does not require any subsequent processing); aged or matured in glass (stabilized in a glass container for a duration exceeding 12 months, either underground or in a controlled environment with minimal fluctuations in light, temperature, and humidity); rested or gold (rested for a period ranging from 2 to 12 months within wooden containers under conditions of minimal exposure to light, temperature, and humidity); aged (matured within wooden containers for a period surpassing 12 months in an environment with controlled levels of light, temperature, and humidity); Abocado (ingredients are added directly to infuse distinct flavors into the spirit); and distilled (artisanal or traditional raicilla that undergoes an additional distillation process incorporating specific ingredients to enhance and impart unique flavors).
Regarding the authentication of raicilla, a limited number of related studies have been reported. A study conducted in 2008 reported results on the characterization of volatile compounds through chromatography in Mexican alcoholic beverages made with agave, including raicilla. The findings were analyzed using a clustering statistical method, highlighting the significance of minor compounds in providing better fingerprinting [2,5]. Another study focused on evaluating the production of volatile compounds formed by different yeast strains in raicilla and tequila, revealing the presence of 16 terpenoid compounds in both beverages, with an additional 15 unique to raicilla [4]. Additionally, a study examined the presence of metals, such as Cd, Zn, and Cr, in raicilla. These metals were determined through polarography and further assessed by measuring their quality using physicochemical parameters [5,6]. Therefore, an important unresolved issue related to raicilla is research into its authentication. This subject remains largely unexplored in the literature. The authentication of an alcoholic beverage is important to verify that it has not been adulterated. If raicilla or any other drink is found to be free of adulteration, it will meet quality control standards and ensure consumer safety, making it suitable for global marketing. Research on the adulteration of beverages provides essential examples of this process, such as for tequila [7], wine [8,9], cachaça, whisky [10], and Chinese drinks [11], etc., where adulteration can result in headaches, vomiting, and liver damage, as well as loss of sight and life. Therefore, initiating research on this subject is imperative to identify the physicochemical parameters, metals, and organic compounds that define the final characteristics of raicilla, thereby enabling authentication. Although the literature reports that some authentication methods are applied to tequila, similar research has not been conducted for raicilla.
Recent studies have investigated various physicochemical and microbiological properties of alcoholic beverages to enhance traditional values, promote health, acquire knowledge, innovate, or protect the environment. Below are examples of alcoholic beverages that have been the subject of such studies:
  • Mistletoe Ethanol: the aromatic profile was examined, revealing that the sensory properties of citrus, earth, wood, and mint are attributed to terpenes and terpene alcohols [12].
  • Local Alcoholic Beverages in the Regional State of Southern Nations, Nationalities, and Southern Towns (Ethiopia): this study focused on the physicochemical characterization of beverages, including pH, total dissolved solids, total suspended solids, total acidity, and alcohol content. The findings, based on physicochemical characterization, allowed for the identification of the most acidic beverage, as well as the one with the highest alcohol content, resulting in the final recommendation of their consumption levels for health protection [13].
  • Alcoholic Beverages (Bangladesh, India, and Nepal): 10 alcoholic beverages, particularly beers and wines, were analyzed physicochemically and microbiologically. The analysis included pH, acidity, total solids, proteins, ash, humidity, alcohol content, and sensory evaluation. The author found that coliform concentrations ranged from 0.03/mL to 2.4/mL. Furthermore, the Nepalese beverage was the best product in terms of sensory analysis [14].
  • Beer with Added Cashew Pepuncle and Orange Peel: this study aimed to innovate and improve the nutritional value of beer by adding cashew pepuncle and orange peel. Factors such as pH, total acidity, total sugar, total soluble solids, and humidity were analyzed. The study concluded that adding these ingredients offers new possibilities for innovation in the brewing sector and benefits the environment as the ingredients used are waste products that cause environmental issues [15].
Noting that various alcoholic beverages are characterized and authenticated through physicochemical analysis, the need for similar research on raicilla has been identified. Consequently, this study aims to conduct a physicochemical analysis on 25 raicilla samples from two areas (North and Coast) and authenticate the samples using principal component analysis (PCA) and cluster analysis to analyze and simplify complex data, identify key patterns, and uncover hidden groupings. The proposed parameters, which are economical and easy to measure, include pH, conductivity, alcohol content, viscosity, density, speed of sound, refractive index, and total solids.

2. Materials and Methods

With the support of the Consejo Mexicano Promotor de la Raicilla, 25 raicilla producers from different categories (white, abocado, and rested) and various regions (Coast and Sierra) provided us with samples of their product. The 25 brands of raicilla will be randomly labeled sequentially from 1 to 25.
Based on the Official Mexican Standard for Tequila NOM-006-SCFI-2012, NOM-070-SCFI-1994, NOM-142-SSA1-2014, NMX-V-013-NORMEX-2019, and PROY-NOM-257-SE-2021 [16,17,18], it was considered necessary to carry out the analysis of the samples at a temperature of 20 °C in a dark place in well-sealed bottles to comply with the standards. This ensures that the data can be compared with other alcoholic beverages. Furthermore, during the analysis, care was taken to minimize exposure to air when opening the bottles. As for atmospheric pressure, the experiment was conducted under ambient conditions. All reagents used are of reagent grade.

2.1. pH Analysis

The pH measurements were made using an Orion model 410A pH meter, was manufactured by Thermo Scientific Orion, from Saint Saint Paul, MN, USA. The calibration procedure was performed according to the instructions indicated in the equipment manual. After the operation, the readings were taken by introducing the electrode into a container with the sample. This operation was performed three times per sample. The measurement was made at 20 °C ± 2 °C; to verify this condition, a thermometer was used [19,20].

2.2. Conductivity Measurement

Measurements were made with the Thermo Orion 4 Star, was manufactured by Thermo Scientific Orion, from Saint Paul, MN, USA. The device was first calibrated using three standard solutions 12.9 ms/cm, 100 µs/cm, and 1413 s/cm, as specified in the equipment manual. Subsequently, the electrode was inserted into the raicilla samples to perform the measurements. Three measurements were taken for each raicilla sample [21].

2.3. Alcoholic Strength

Measurements were made with Gay-Lussac Alcoholmeter 20 °C TDM ROBSAN No. CAT010020, was manufactured by Laboratorio de México, from México, México, maintaining the temperature of the raicilla samples at 20 °C ± 2 °C. Two to three 100 mL clean and dry test tubes were used. Three measurements were taken for each sample [22].

2.4. Refractive Index

The measurements were made using an Abbe Thermo Spectronic Refractometer, model 33416, was manufactured by Bausch & Lomb from Rochester, New York, NY, USA. The procedure consisted of passing the cotton through the surface of the prism without touching it directly with the fingers and then drying it with dry cotton. At the end of the cleaning, readings were taken, the light source was turned on, and the visual field was adjusted to illuminate the upper half with the lower half in darkness. The reading was taken in ethyl alcohol (Aldrich 459844, ≥99.5%) by placing a drop on the prism and turning off the light source to verify this condition. The reading should be 1.36. After confirming that the reading was correct, the prism was cleaned, and the readings of the raicilla samples were taken in triplicate [23].

2.5. Viscosity

The viscosity measurement was performed on the Anton Par AMVn Automated Micro Viscometer was manufactured by Anton Paar, from Graz, Austria. The equipment’s measurements provided an average of ten measurements, the standard deviation, and the coefficient of variation, which is recommended to be less than 0.1% [21].

2.6. Density and Sound Velocity Measurements

The density and velocity of sound were measured on a DSA5000, was manufactured by Anton Paar, from Graz, Austria. After cleaning, the equipment was programmed to take readings at 20 °C. To verify the calibration of the equipment, a reading was taken with distilled water to confirm a value close to 0.998203 g/cm3. Once this condition was verified, the measurements of the raicilla samples could be taken. The results were directly transferred to an electronic Excel file through a computer connected to the equipment. Three measurements were taken for each sample [21].

2.7. Total Solids

The determination of total solids was segmented into multiple stages. The first step involved preparing the porcelain capsule, which was then immersed in 15% HNO3 for 24 h. Then, it was rinsed with bidistilled water and placed in the oven at 100 °C for 30 min. Then, it was placed in the dryer for an additional 30 min until the material reached room temperature and achieved a constant weight. The second stage consisted of placing the raicilla sample in the porcelain capsule without touching it. This was accomplished with the assistance of tweezers and an asbestos grid. Next, 25 mL of the raicilla sample was deposited with a volumetric pipette. Then, it was placed in the oven at a temperature of 70 °C and dried for 24 h, enough time to complete the evaporation of the raicilla sample. At the end of the time, the residue was presented as a dark-colored stain with a caramel appearance and a particular odor. The capsule was removed with the help of tweezers and an asbestos grid and was then placed in a desiccator for 30 min. Finally, the weight of the capsule was registered. The measurements before and after placing the raicilla sample were made on the same balance to avoid variations. Three measurements were taken for each sample. The calculations were made using Equation (1) [13]:
T o t a l   s o l i d s = ( w f w 0 ) g 25   m L × 1000   m g g × 1000   m L L
where:
  • w 0 = initial weight;
  • w f = final weight.

2.8. Data Statistical Treatment

The physicochemical parameters, including pH, conductivity, refractive index, alcohol content, sound velocity, density, and total solids, were analyzed using the commercial Statgraphics Centurion XVI software package, version XVI. The t-Student test for independent variables was calculated for each parameter, considering the Coast and Sierra zones. PCA and cluster analysis were also applied to evaluate the patterns between the physicochemical parameters. The t-Student test was calculated to determine whether there were significant differences for each parameter in the two areas, with a confidence value of 95%. PCA was conducted using the average values of at least three replicates for each sample and was performed using a correlation matrix to investigate the most representative physicochemical parameters of the raicilla, which can be determined from the measurements that contribute most to the variance. The components were selected considering that the Eigenvalues were greater than one; this value is obtained from the table showing the variance contribution of principal components. The objective of the cluster analysis was to group the 24 brands of raicilla samples based on the physicochemical parameters. To determine the presence of significant differences (p ≤ 0.05) and to identify differences between the groups, one-way analysis of variance (ANOVA) was performed on the cluster analysis results, with the physicochemical parameters serving as the dependent variable [21].

3. Results and Discussion

3.1. Analysis of Raicilla

The measurements and standard deviations of pH, conductivity, alcohol content, total solids, viscosity, sound velocity, density, and refractive index for 25 raicilla samples are presented in Table 1, along with their respective varieties and production areas. The first column corresponds to the number of the raicilla considered for the statistical analysis with the commercial Statgraphics software, the second corresponds to the variety (white, rested, and abocado), and the third corresponds to the area where the raicilla was produced. The following columns correspond to the average of the physicochemical values obtained from at least three replicates, except for the viscosity measurements in which an average of 10 measurements was taken.

3.2. Analysis of Physicochemical Measurements in Raicilla

The average pH in the 25 raicillas was 3.77 (±0.20) and the values obtained for the raicillas produced on the Coast and Sierra were 3.77 (±0.18) and 3.76 (±0.22), respectively. The p-value > 0.05; therefore, there are no significant differences in pH between the two areas. In general, all raicillas had a pH of between 3.5 and 4.0. Only 1 raicilla of the 25 was found in 3.3, and 8 in 4.4. Furthermore, it was found that the most acidic or lowest pH values corresponded to the Sierra zone. These pH values are characteristic of alcoholic beverages made from raw agave material; for example, tequila, mezcal, and sotol have values similar to raicilla [5,21]. An acid’s pH could be related to the presence of organic compounds, such as organic acids, for example, carboxylic acids, glycerol esters, or higher alcohols [4,24]. This pH could be developed during raicilla fermentation due to the microbial culture added during the fermentation process [25]. An essential characteristic of alcoholic beverages is their pH level, which is closely related to flavor and quality. This is possible because pH affects several chemical reactions and enzymatic activities that contribute to the characteristics of these products. For example, a study on alcoholic beverages found that the pH values of spirits and saliva can differ significantly, which affects enzyme activity in the mouth and alters flavor perception. This study found a high amount of α-amylase in certain beverages, which may suggest a possible association between pH, enzymatic activity, and flavor perception [26]. Another study found that applying a de-acidification treatment to wines made from pear and kiwi, in which the pH was adjusted, improved the flavor quality by reducing excessive acidity and promoting the accumulation of aromatic compounds, which improved the flavor, aroma, and, in general, consumer acceptability [27]. On the other hand, it is also an indicator of the precipitation of some metals [28].
The average conductivity in 24 raicillas was 45.48 µS/cm (±18.50). The conductivity values for all raicillas were between 28.06 and 85.37 µS/cm. The p-value > 0.05; therefore, there are no significant differences in conductivity between the two areas. This value is close to tequila (10 to 60 μS/cm) [6]. Raicilla 21 had a value of 1909.67 µS/cm; it was an abocado raicilla, which contains cuastecomate. This higher value may be due to the addition of sugars to the drink. The raicillas with numbers 5, 13, 14, and 25, produced in the Sierra zone, had a higher conductivity, possibly given by the production process in that zone; furthermore, the pH found in these raicillas was the most acidic, possibly due to a higher concentration of H+, which can increase the conductivity. However, the variation in conductivity in all samples depends on the differences in the concentration of ionic species in the solution and the chemical balance as determined by speciation as a function of pH [29,30]. Additionally, the changes in conductivity may be attributed to the loss of water, resulting in an increase in the concentration of salts, solids, or metals present in the samples. By analyzing the results of the Coast and Sierra zones, it was found that the conductivity was higher in the Sierra zone, probably due to differences in the production process, such as distillation or aging [31]. The conductivity is directly related to the pH and the alcoholic content. During fermentation, protons (H+) are formed, affecting the measurement parameters. There is a current through the sample and, therefore, the resistivity is reciprocal to the conductivity of the solution [32]. The lower the pH, the higher the H+ concentration and the conductivity [33]. On the other hand, each variety of raicilla exhibited a distinct conductivity due to the raw material and the production method employed [34].
The average alcohol content in the 25 samples was 41.44% (±5.59), with a range of 28.00% to 50.66%. The p-value > 0.05; therefore, there are no significant differences in the alcohol content in the two areas. Raicilla 25 presented the lowest value in this parameter: 28%. In the case of raicilla 21, this measurement could not be obtained with the alcoholmeter because it contained thecuastecomate, making it difficult to measure in this type of raicilla, which can have a large number of sugars and solids. In the case of raicilla, the alcohol content was higher than tequila (38°GL) [6] due to the fact that raicilla producers prefer to be artisanal. The average alcohol content in the Coast and Sierra zones was 42.43% ± 4.42 and 40.74% ± 6.36, respectively, and there was no large difference between the two zones. Samples with higher conductivity often exhibited higher alcohol content, suggesting a possible trend [32].
The average density found in the 25 samples was 0.95130 g/cm3 (±0.02). The p-value > 0.05; therefore, there are no significant differences in density in the two areas. In the case of raicilla 21, which was an abocado raicilla and contained cuastecomate, a density of 1.05085 g/cm3 was obtained, a value greater than the average of the 25 raicilla samples, possibly due to the large number of solids, such as the pulp of the fruit and the sugar contained in the sample. In the case of density in the Coast zone, the values ranged from 0.936501 to 0.95652 g/cm3, with raicilla 9 and 6 presenting the highest and lowest values, respectively. For the case of the density of the Sierra zone, the value ranged from 0.934485 to 1.05085 g/cm3. Raicillas 14 and 7 presented the highest and lowest values, respectively. The Sierra zone had the highest value. The difference in density between the raicillas could be attributed to different factors, such as sugar, dyes, salts, or some additives [35]. On the other hand, the density value obtained for tequila is comparable with raicilla of between 0.94 and 0.96 g/cm3 [21]. Furthermore, the density of raicilla was lower than the density of bidistilled water, which was 0.99 g/cm3, and higher than ethanol, 0.79 g/cm3, which was reasonable because of the colligative properties of a mixture of ethanol and water, considering that ethanol could be one of its main constituents [36].
The average sound velocity determination in the 25 raicillas was 1592.09 m/s (±23.1958 m/s). The p-value > 0.05; therefore, this indicates no significant differences in sound velocity in the two areas. Raicilla 9 had the lowest parameter, 1549.96 m/s, while raicilla 15 had the highest, 1624.26 m/s, given by the presence of a large molecule, for example, some types of additives, such as sugars or colorants [6]. In the Sierra area, the sound velocity was higher (1596.04 m/s) than in the Coast area (1586 ± 23.38 m/s), possibly due to the difference in the raicilla production process. However, the results were consistent with the expected density since both parameters were related.
The average of the refractive index determination in the 25 raicillas was 1.35575 (±0.0026). The p-value > 0.05; therefore, there were no significant differences in refractive index in the two areas. The refractive index of raicilla 15 was 1.35167, a value below the average, perhaps due to a higher amount of water than the average, or it could be related to viscosity [36]. Raicilla 21 had a higher refractive index compared to the average with a value of 1.36283, suggesting a higher sugar content likely from the cuastecomate or sugars added to give its color [23,37]. On the other hand, the refractive index in the raicillas of the Sierra zone was 1.35565 (±0.0029), while for the raicillas of the Coast zone, it was 1.3559 (±0.00022), and the values in both areas were very similar.
The average viscosity in the 25 raicilla samples was 2.64 mPa × s (±0.16), ranging from 2.16 to 2.81 mPa. According to the p-value > 0.05, there is no significant difference in viscosity between the two areas. Raicilla 15 had the lowest viscosity of 2.16 mPa × s. In the case of raicilla produced in the Sierra, the average value is 2.61 (±0.19) mPa × s, and that made in the Coast region had an average value of 2.70 (±0.0.10) mPa × s. The differences in viscosity can be attributed to the content of sugar, colorants, and other additives used during the production process. In general, a trend was observed in which alcohol content appeared to influence viscosity, similar to trends reported in other alcoholic beverages, such as vodka [38]. Viscosity is relevant since it determines food’s acceptability, quality, and handling [39]. The viscosity is closely related to the concentration of sugars and ethanol in spirits. High viscosity in raicillas would be related to a high concentration of sugars and the content of alcohol. Also, the viscosity depends on the molecular weight, molecular structure, and hydrogen bonds in alcohol and water [40].
The concentration of total solids depended on the brand of raicilla, since there was variation in the results. The p-value > 0.05, therefore indicating no significant differences in total solids between the two areas. The value of the total solids for all the samples varied from 21.33 to 2060 ppm, without considering the abocado raicilla, number 21, which had an amount of 166,984 ppm. The raicilla with the lowest concentration was raicilla 24 with a value of 21.33 ppm. In contrast, for raicilla 21, a value of 166,984 ppm was obtained, likely due to the high concentration of solids and sugar in the beverage. Furthermore, this sample was composed of a type of crushed fruit. On the other hand, the Coast zone showed a lower amount of total solids (21.33 to 698.67 ppm) than the Sierra zone (58.67 to 2060 ppm), which could be due to the manufacturing process, especially in cooking and distillation, because the manufacturing processes in these two production areas differ, although it may also be due to the different species of agave.

3.3. PCA in Raicilla

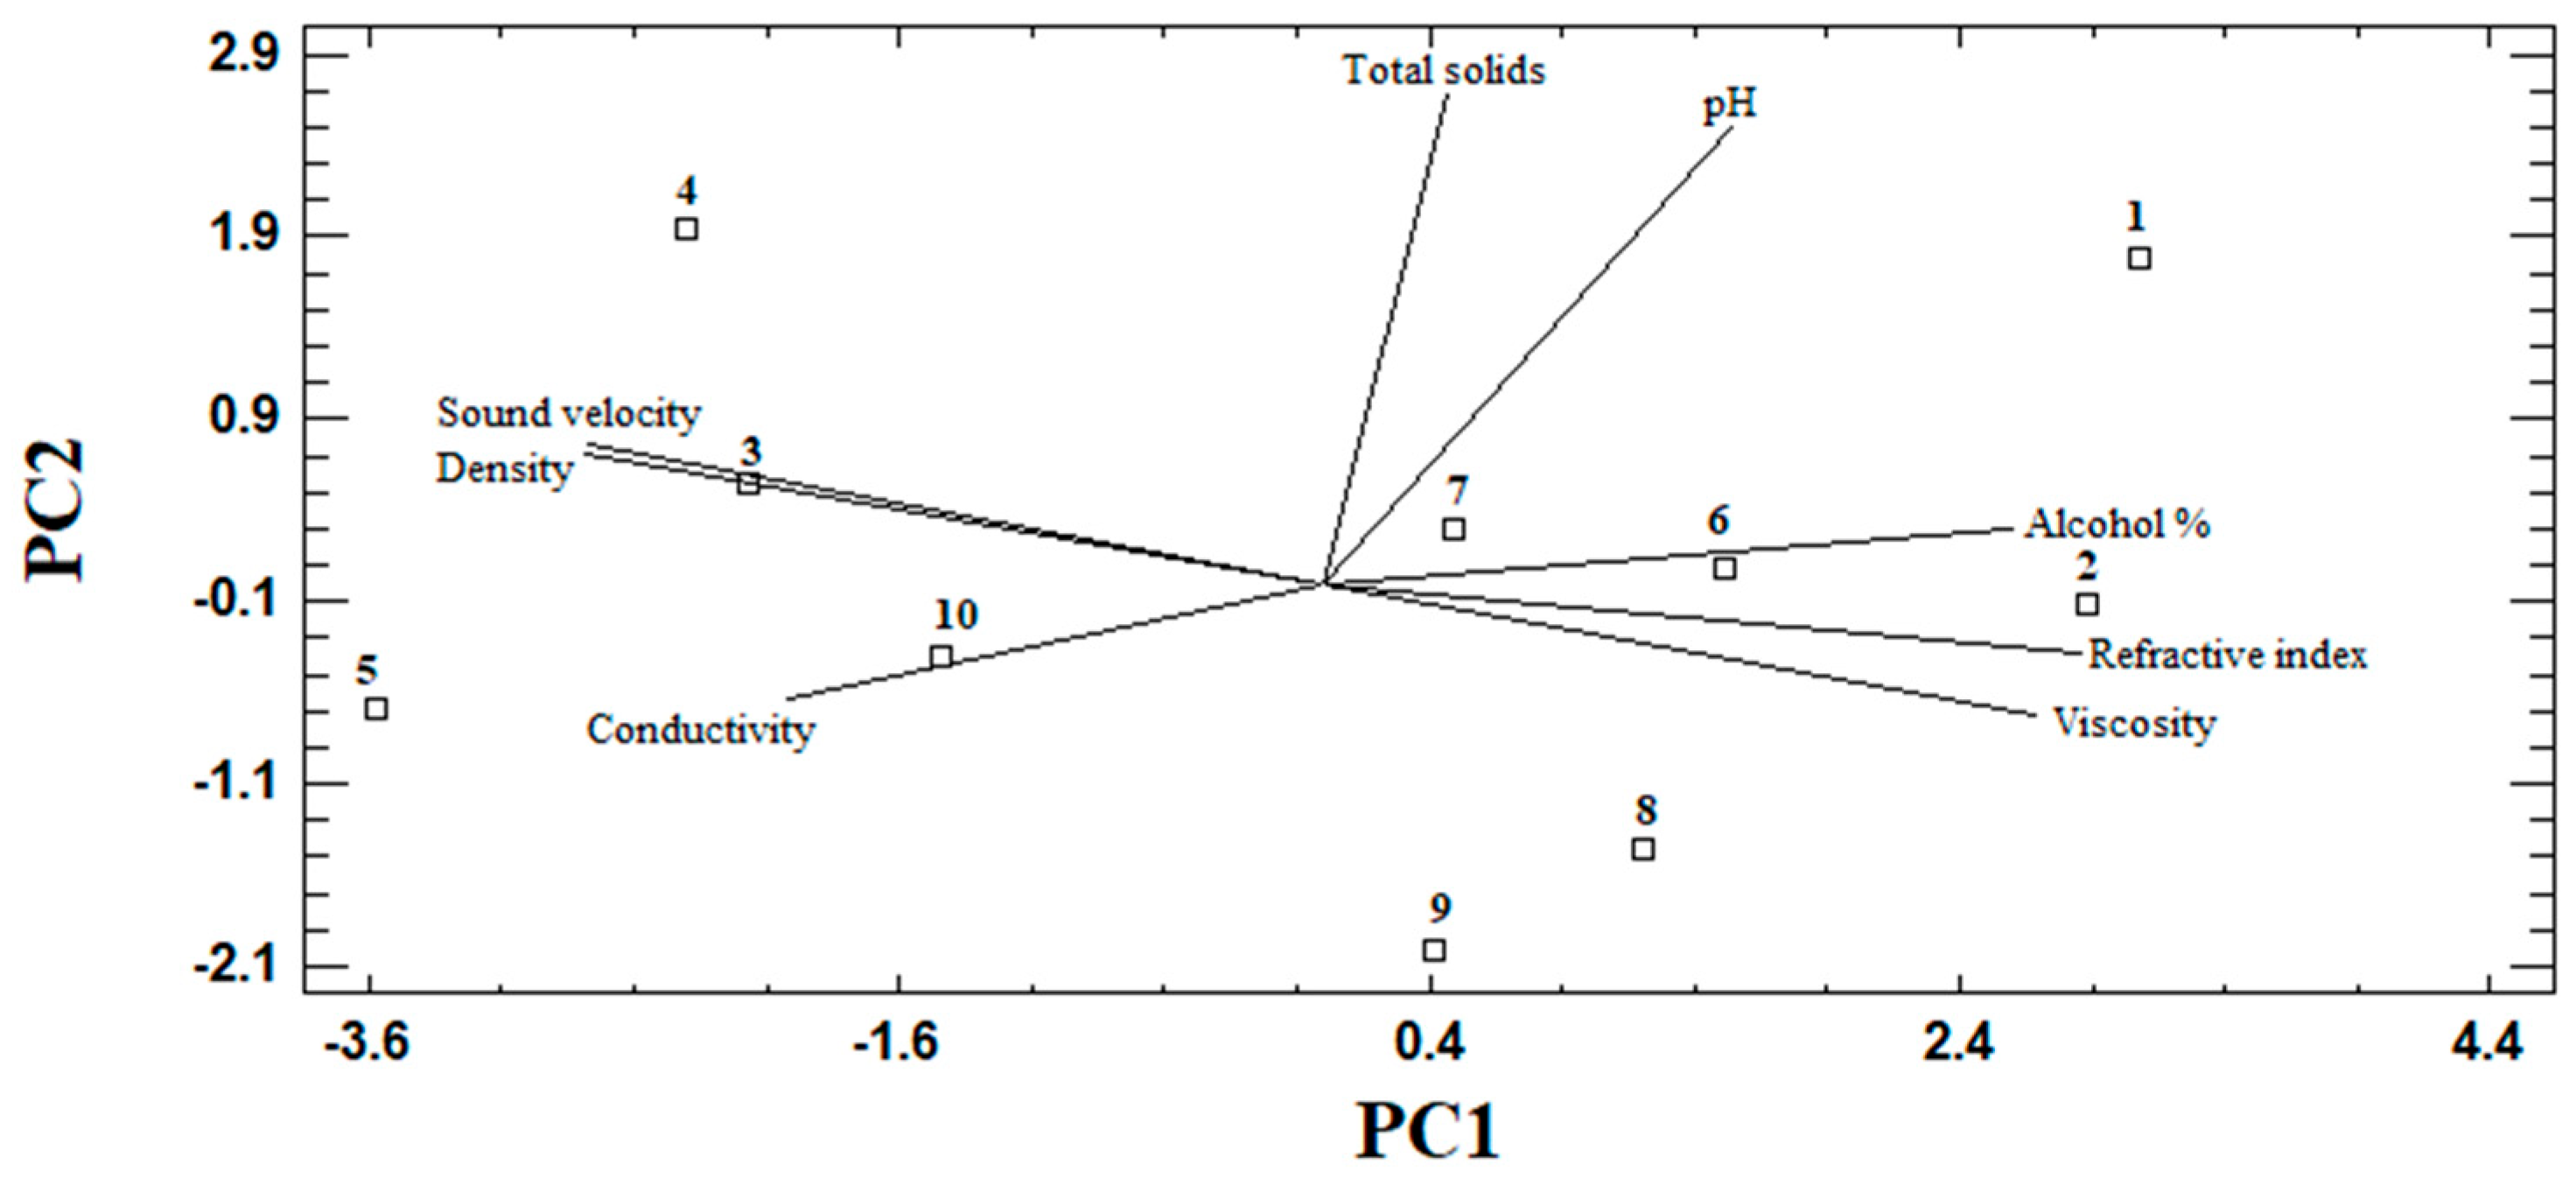
Table 2 and Table 3 were obtained by applying PCA to the 24 raicillas. Table 2 corresponds to the contribution of the variance to the main components in 24 raicillas; the 21 abocado raicilla was not considered in this analysis because the values found were outside the range of all beverages. Two main components were observed, which explained 81.77% of the total variability of the physicochemical measurements. Component one explained 67.38% and component two explained 14.39% of the variance. In Table 3, the weights of the main components for the 24 raicilla samples are presented, where the physicochemical parameters that contributed the most to each component were identified, selecting the weights with the highest values. Therefore, the main component, which includes the most relevant physicochemical parameters, revealed contrasting tendencies among certain raicilla samples regarding pH, alcohol content, viscosity, refractive index, conductivity, sound velocity, and density. The second main component showed that the second most relevant physicochemical parameters are conductivity and density and established that some raicillas presented an opposite pattern between these physicochemical parameters. Figure 1 shows the distribution of the physicochemical parameters of the raicilla in the plane of the first two principal components. As can be seen, principal component one was positively related to total solids, viscosity, refractive index, alcohol content, and pH and negatively correlated to density, conductivity, and sound velocity; some of these physicochemical parameters were also found in the case of tequila [21]. However, it was not possible to identify each zone clearly because both zones are intermingled.
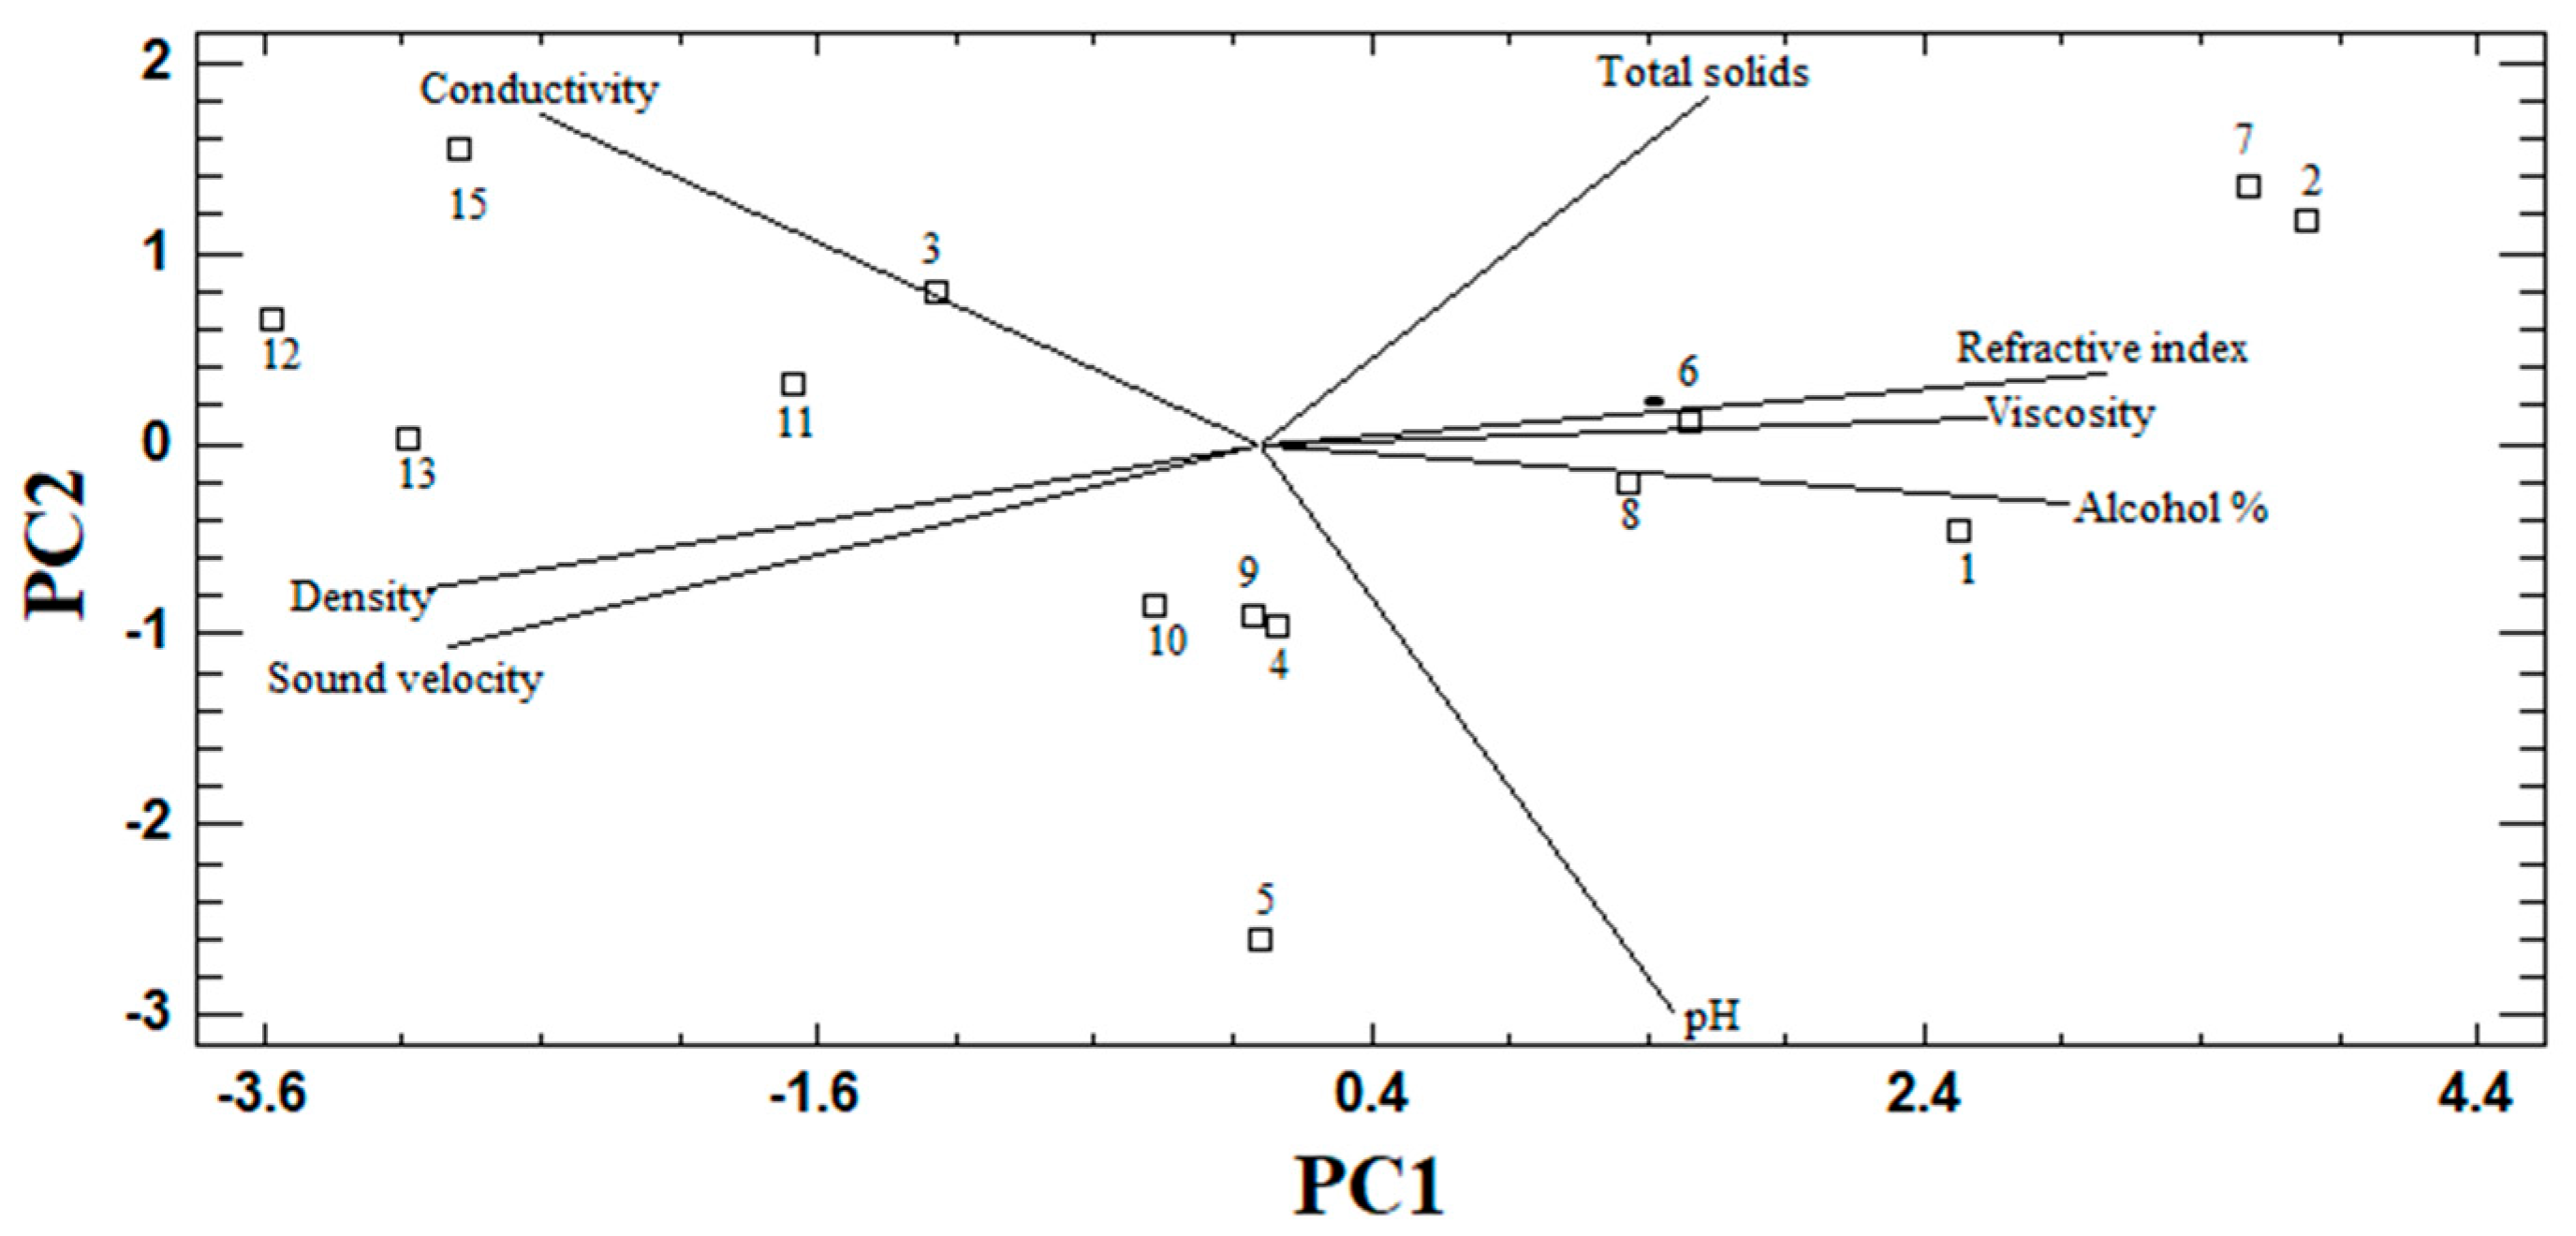
Table 4 and Table 5 were obtained from the PCA of 10 raicillas from the Coast area. Table 4 corresponds to the contribution of the variance of the main components, where two main components exist. These explained 85.37% of the total variability in the physicochemical measurements of the raicilla beverages. Component one explained 65.62% of the variance, and component two explained 19.75%. Table 5 presents the weights of the main components of the 10 raicillas, identifying the physicochemical parameters that contribute most to each component. The weights with the highest values must be selected. Principal component one, reflecting the most relevant physicochemical parameters, suggested contrasting patterns in some raicillas involving pH, conductivity, alcohol content, viscosity, sound velocity, density, and refractive index. The second main component showed that the pH and the total solids were the second most relevant physicochemical parameters. Figure 2 shows the distribution of the physicochemical parameters of the Coast raicillas in the plain of the first two principal components. As can be seen, the first principal component was positively correlated with refractive index, viscosity, alcohol content, pH, and total solids, and negatively correlated with density, sound velocity, and conductivity; some of these physicochemical parameters were also found in the case of tequila [21].
Table 6 and Table 7 were obtained from the PCA of 14 raicillas from the Sierra area. The 21 raicilla was not considered in this analysis because the values found were outside the range of all beverages. Table 6 corresponds to the contribution of the variance of the main components, with two main components identified that explained 85.35% of the total variability of the physicochemical measurements found in Sierra raicillas. Component one explained 69.81% and component two explained 15.55%. Table 7 presents the weights of the main components of the 14 raicilla alcoholic beverages, where the physicochemical parameters that most contributed to each component were identified, and the weights with the highest values must be selected. Principal component one, associated with the most relevant physicochemical parameters, revealed inverse tendencies in some raicillas with respect to total solids, refractive index, viscosity, alcohol content, and conductivity, as well as density and sound velocity. The second main component presented the second most relevant physicochemical parameters and showed that some raicillas exhibited an opposite pattern between conductivity, total solids, and sound velocity, as well as pH. Figure 3 shows the distribution of the physicochemical parameters of the Sierra raicillas in the plain of the first two principal components. As can be seen, principal component one was positively correlated with refractive index, viscosity, alcohol content, total solids, and pH, and negatively related to density, sound velocity, and conductivity. Some of these physicochemical parameters were also found in the case of tequila [21].

3.4. Analysis by Cluster in Raicilla

Figure 4 shows the dendrogram analysis of raicilla, performed to identify the groups of raicilla with similar physicochemical parameters. The study in Figure 4a corresponds to the cluster graph of all the raicillas, in which the two zones are found: Coast and Sierra. This graph found four clusters: I, II, III, and IV. Group I included the 1, 2, 3, 4, and 9 raicilla brands. Cluster II included the 5, 13, 18, 16, 17, 25, 14, and 15 raicilla brands. Set III contained the 6, 11, 12, 24, and 7 raicilla brands. Cluster IV formed the 8, 19, 10, 20, 22, and 23 raicilla brands. Raicilla 21 was not considered in this analysis because the values found were outside the range of all the beverages. It was observed that raicillas from the Coast and Sierra were present in each cluster. No distinction was observed between these two zones, as discussed with the PCA. Generally, the physicochemical parameters of each group were similar. Figure 4b corresponds to the analysis of the Coast raicilla dendrogram, in which four dendrograms were observed: group I was formed by raicillas 1 and 3, group II was formed by raicillas 16, 17, 18, and 24, group III was formed by raicillas 19 and 20, and group IV was formed by raicillas 22 and 23. Figure 4c corresponds to the analysis of the dendrogram of Sierra’s raicillas, where three dendrograms were obtained: group I was formed by raicillas 2, 8, 10, 4, and 9, group II was formed by raicillas 5, 13, 25, 14, and 15, and group III was formed by raicillas 6, 11, 12, and 7.
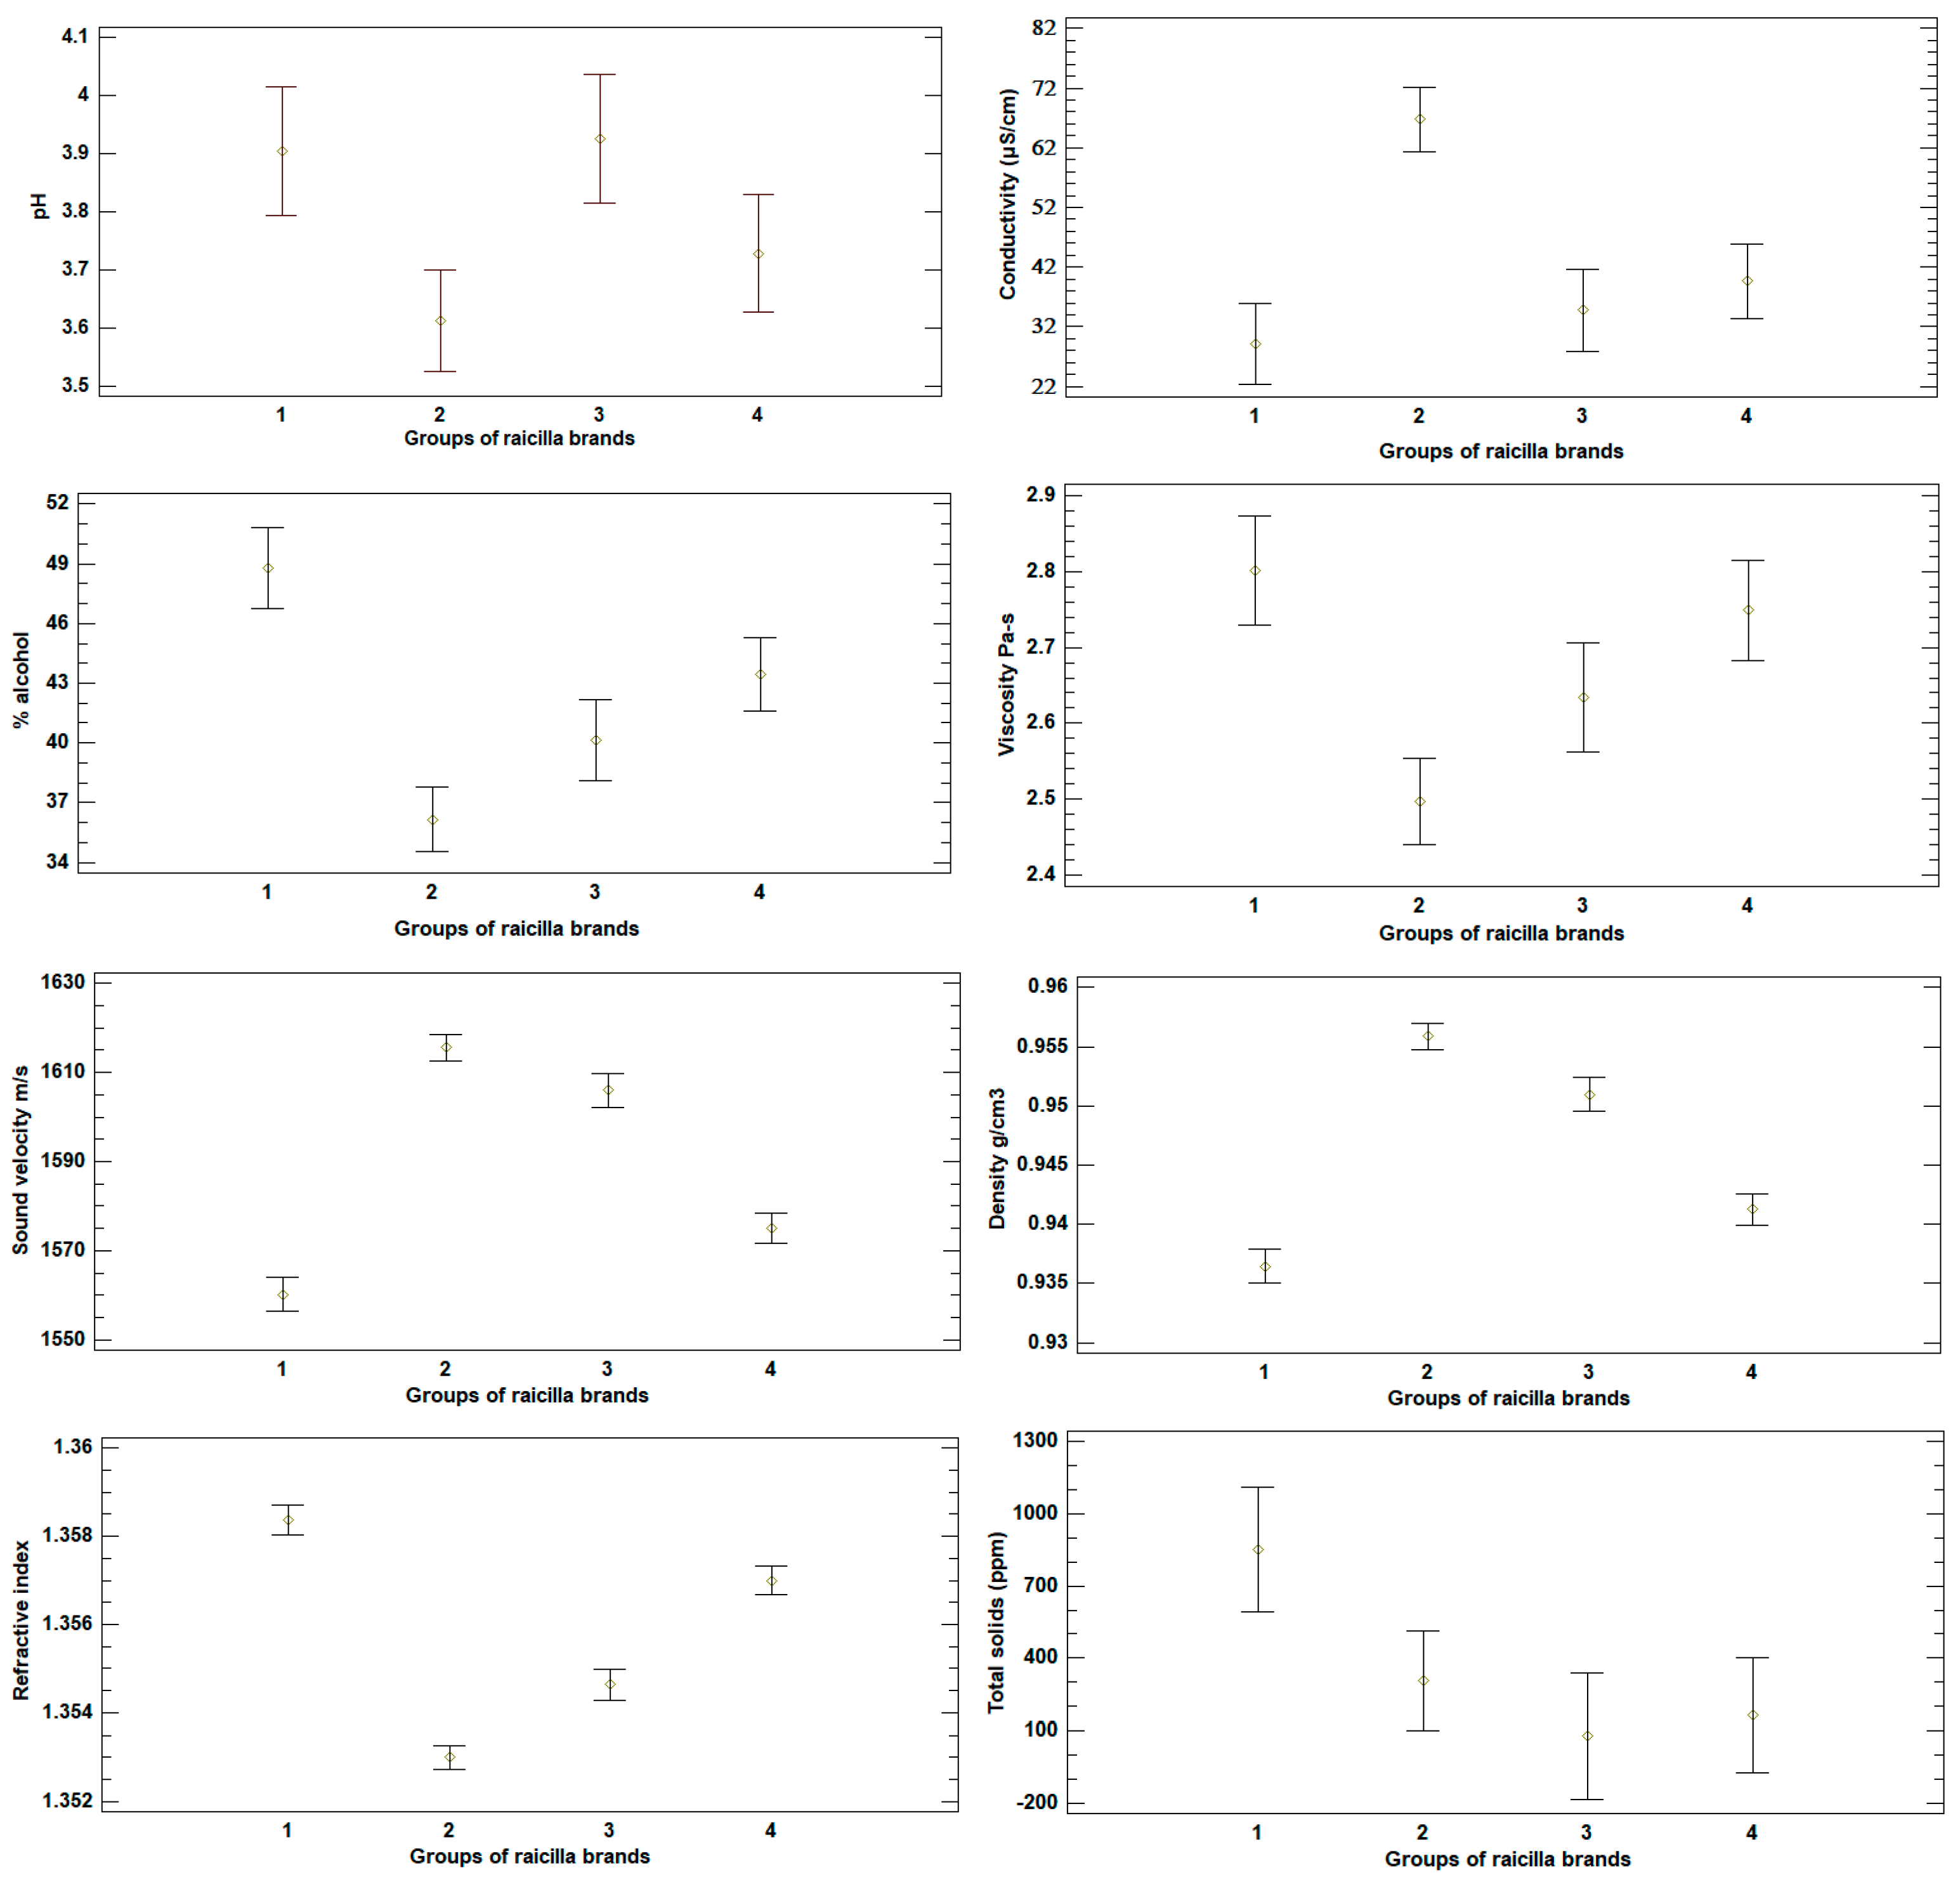
From the cluster analysis, ANOVA was performed in each group (I, II, III, IV) for all physicochemical parameters in all raicillas. It was found that the clusters obtained were significantly different in terms of the physicochemical parameters taken as variables (p-value < 0.005). Figure 5 corresponds to the mean graph obtained by the Fishers LSD method. It shows that group I contained the highest alcohol content, viscosity, refractive index, and total solids. Group II had the highest conductivity, sound velocity, and density, while groups I and III contained the most elevated pH. In these groups, some raicillas belonged to the Sierra and Coast zones.
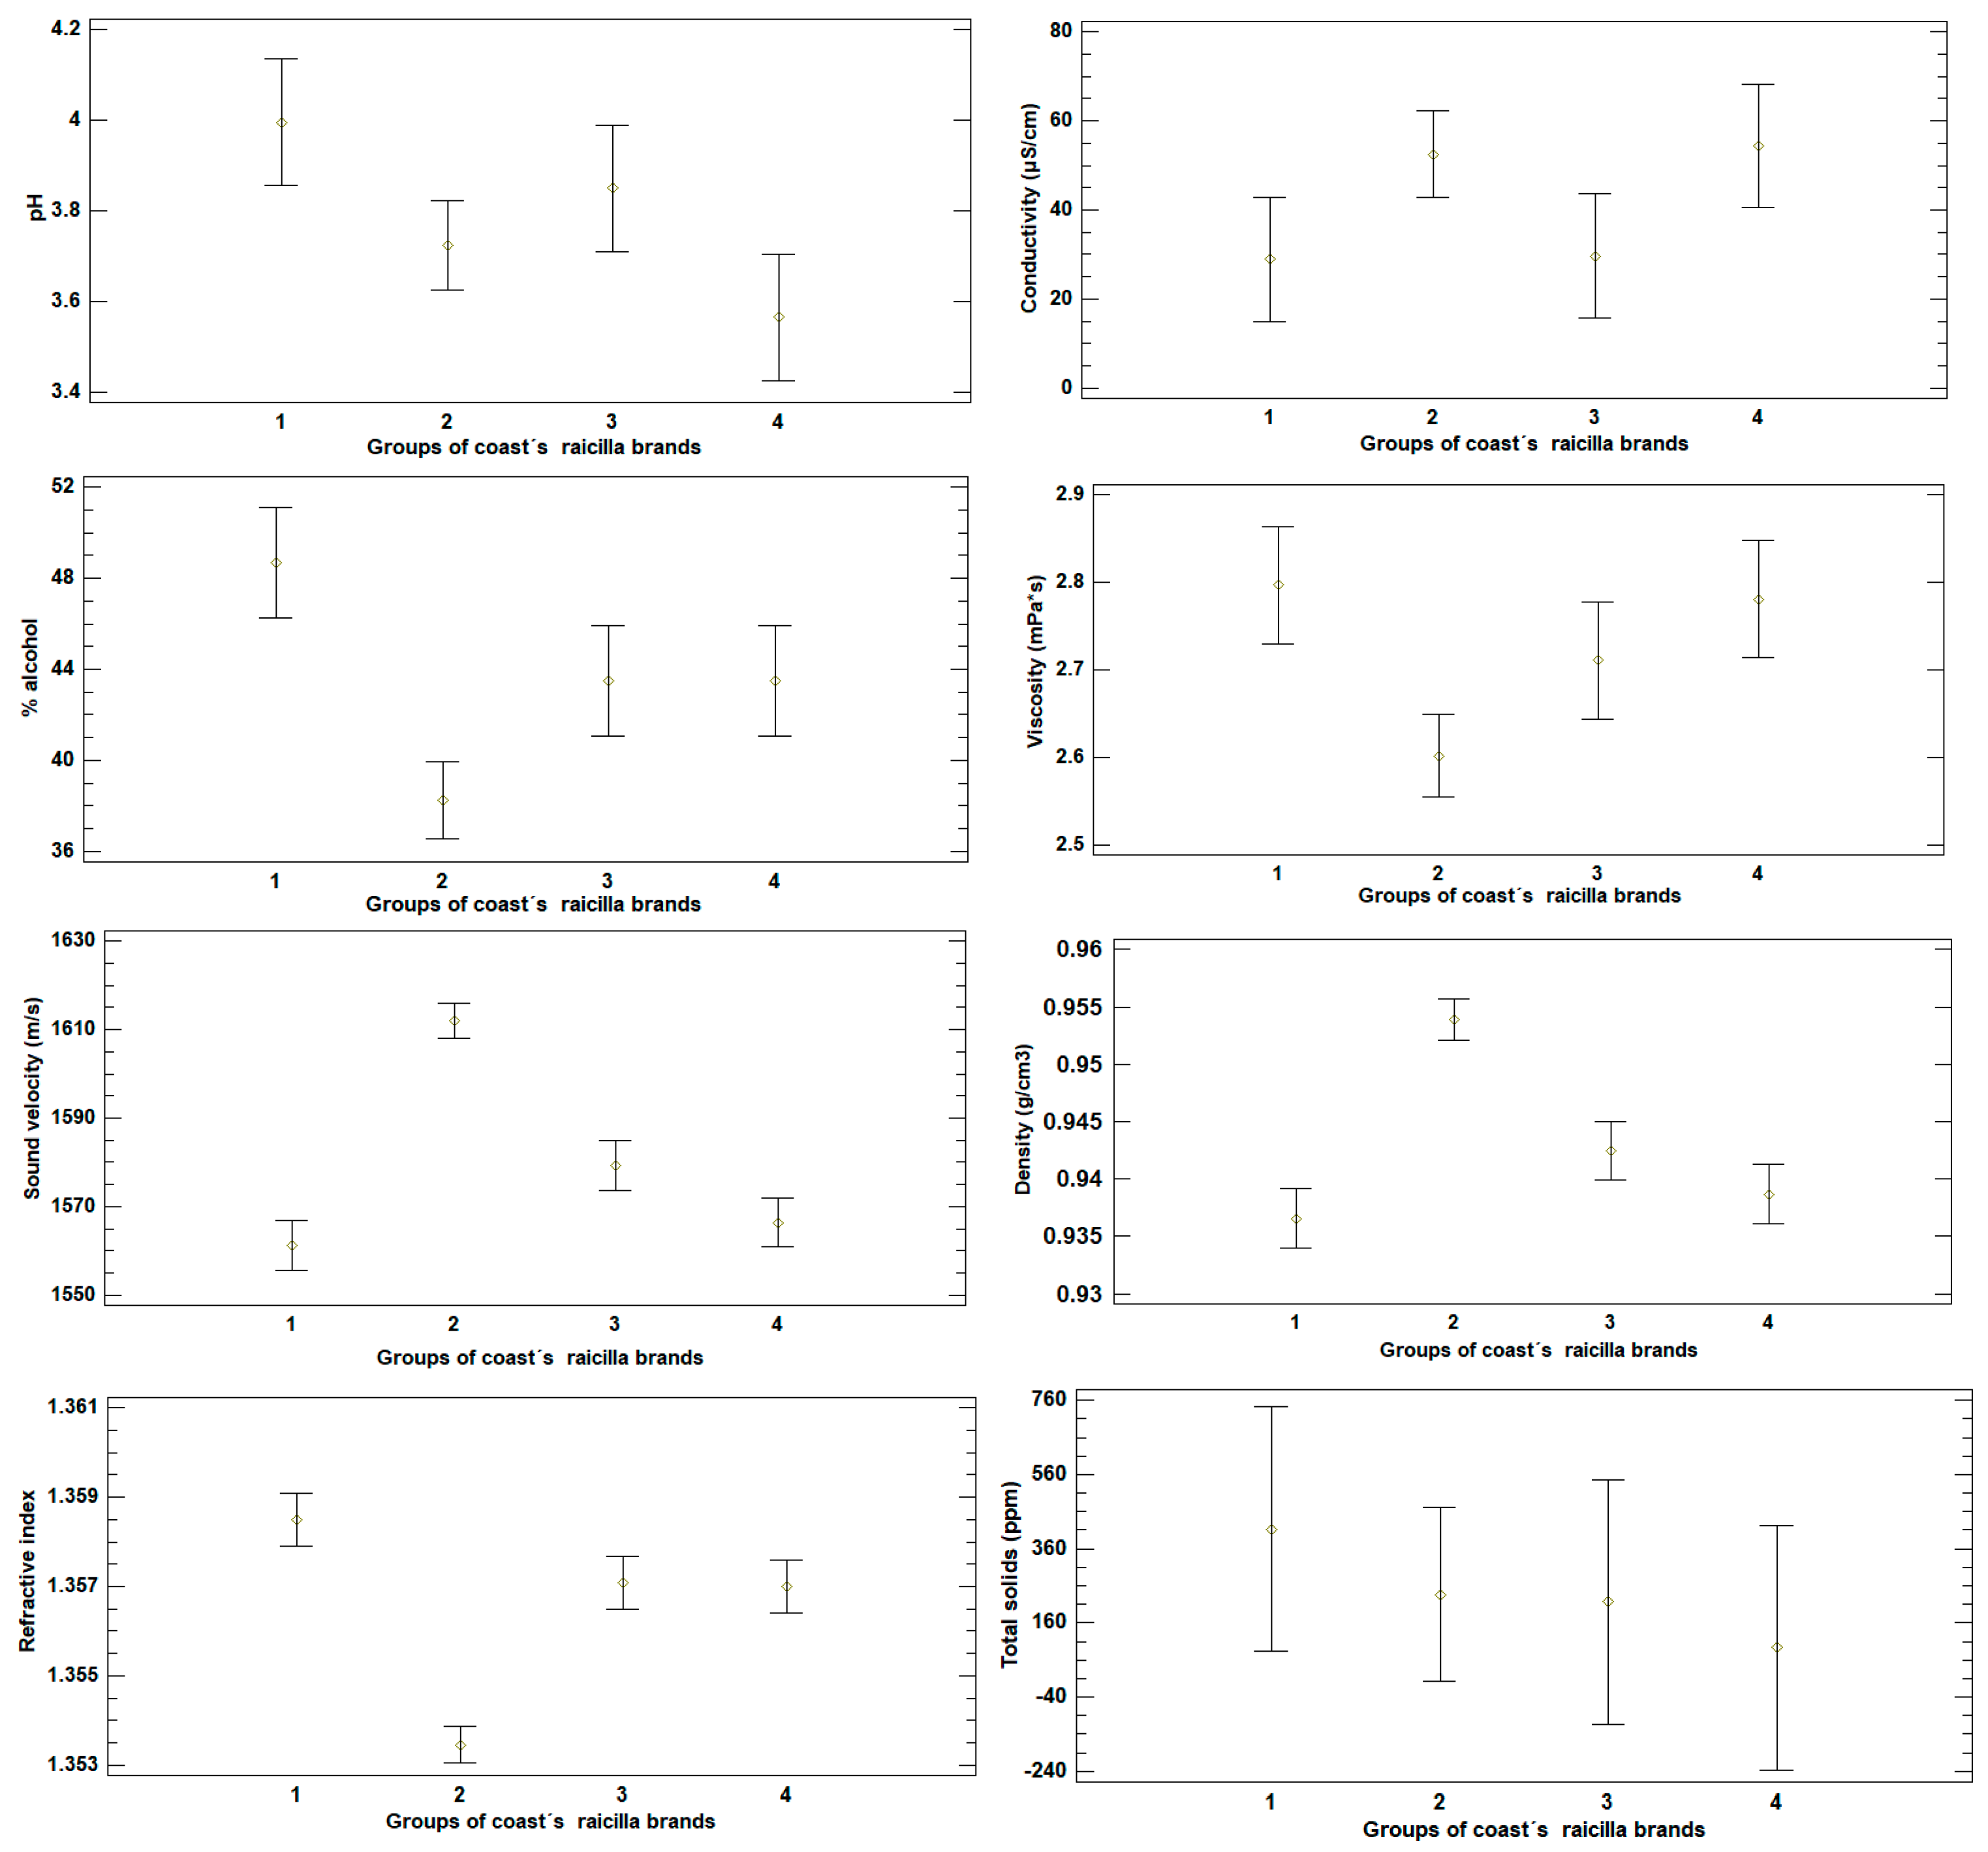
The ANOVA was performed on the cluster analysis results for each group (I, II, III, IV) across all physicochemical parameters in all raicillas along the Coast. It was found that the clusters obtained were significantly different in terms of the physicochemical parameters considered as variables (p-value < 0.005), except for conductivity and total solids. Figure 6 corresponds to the mean graph obtained by the Fishers LSD method. It shows that group I contained the highest alcohol content, viscosity, refractive index, and total solids, while group II included the sound velocity and density. In contrast, groups I and III had the highest pH, while groups II and IV had the highest conductivity. It was noted that some of these groups had raicillas that belonged to the Sierra and Coast zones.
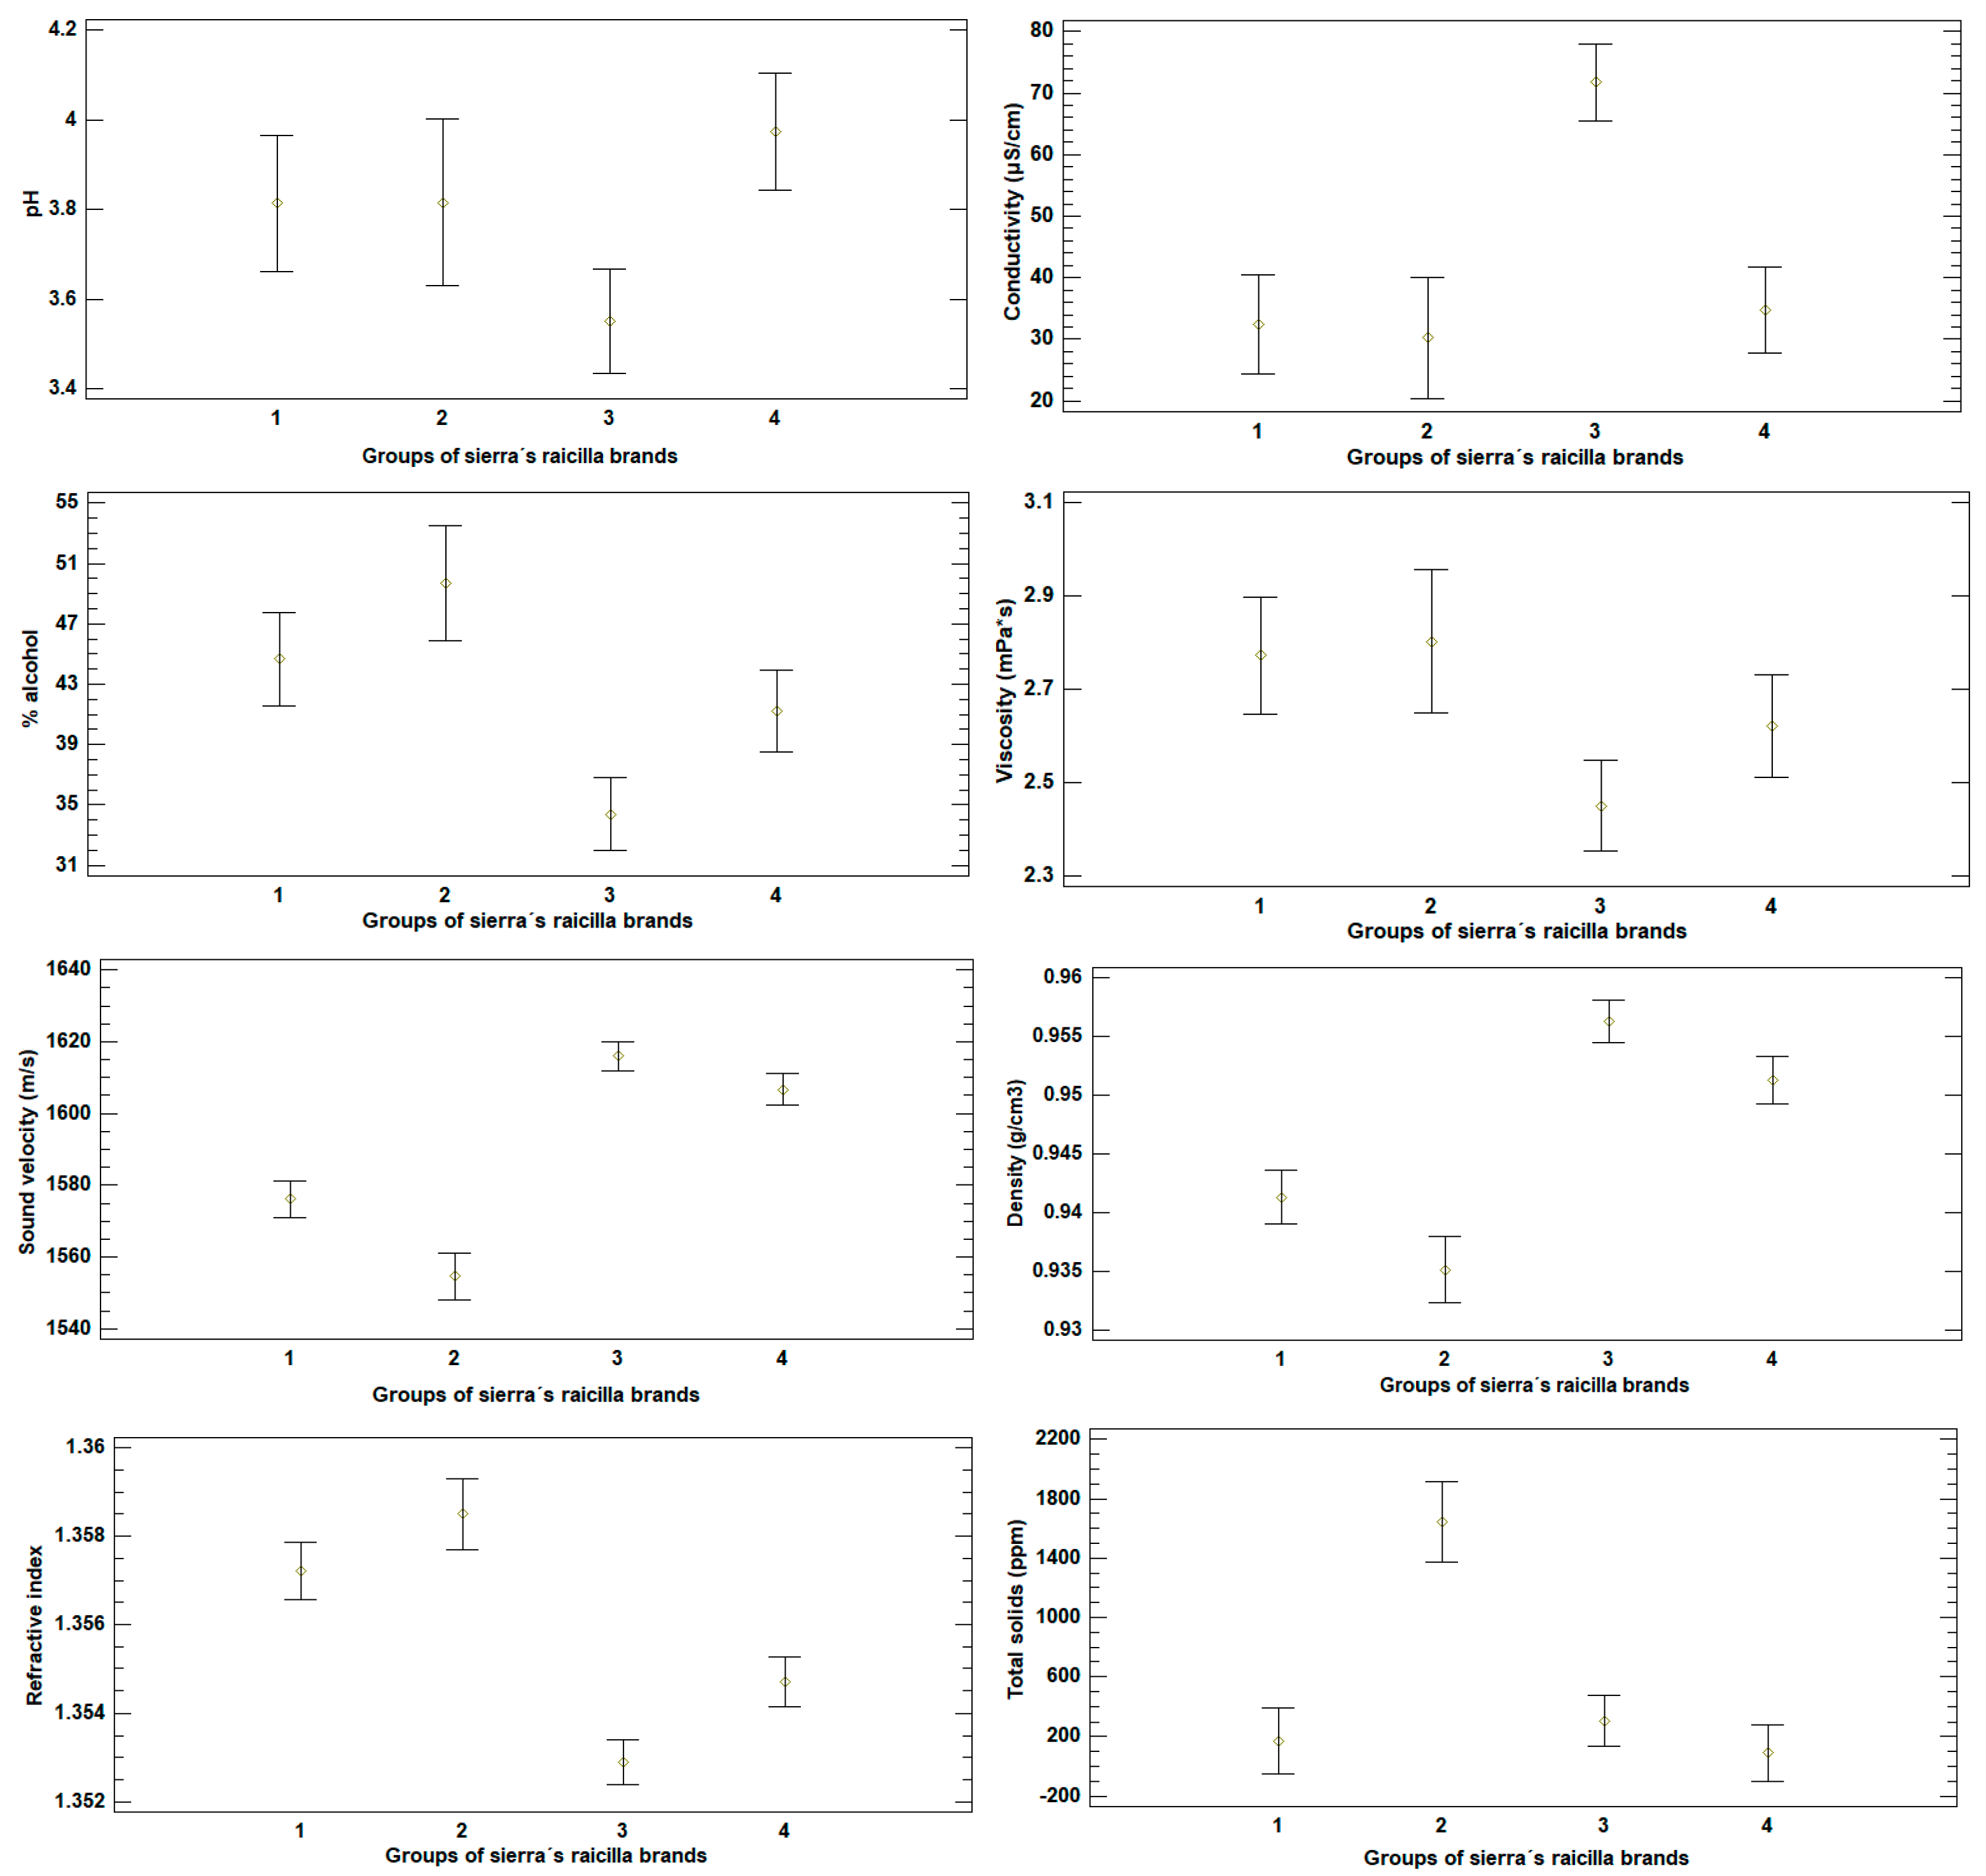
The ANOVA was performed on the cluster analysis results for each group (I, II, III, IV) across all physicochemical parameters in Sierra raicillas. It was found that the clusters obtained were significantly different for the physicochemical parameters taken as variables (p-value < 0.005). Figure 7 corresponds to the mean graph obtained using Fisher’s LSD method. In this case, group IV contained the highest pH. Group III had the highest conductivity, sound velocity, and density. In the case of conductivity, it corresponded to the mean of conductivity in all raicillas, where the Sierra zone showed a higher value than the Coast zone. Group II contained the highest values in alcohol content, viscosity, refractive index, and total solids.

4. Conclusions

This study analyzed the raicilla production process and conducted preliminary physicochemical and statistical analyses (PCA and cluster) on 25 alcoholic beverages from the Sierra and Coast regions. The parameters measured included pH, conductivity, alcohol %, viscosity, sound velocity, density, and refractive index, with mean values of 3.77 (±0.20), 45.48 S/cm (±18.50), 41.44 (±5.59), 2.64 mPa × s (±0.16), 1592.09 m/s (±23.1958 m/s), 0.9513 g/cm3 (±0.02), and 1.35575 (±0.0026), respectively. Total solids ranged widely from 21.33 to 2060 ppm, with the fruity raicilla sample showing 166.98 ppm.
Principal component analysis (PCA) revealed that total solids, viscosity, refractive index (RI), alcohol %, density, and sound velocity were the most influential variables. Cluster analysis identified four distinct groups; however, no clear separation was observed between the Sierra and Coast samples. Although no statistically significant differences were found, raicillas from the Sierra region tended to show a more acidic pH, higher conductivity, and greater density, which may be related to production differences.
These preliminary results contribute to the characterization and potential authentication of raicilla. Future studies should include a larger sample size and replicate-level analysis to establish robust reference ranges for each physicochemical parameter.

Author Contributions

A.C.-A.: investigation, writing—original draft, writing—review and editing, supervision, project administration. F.Z.: investigation, writing—original draft. C.C.-A.: investigation, methodology, writing—original draft. M.S.-T.: investigation, methodology, writing—review and editing. H.H.: investigation, writing—review and editing. N.T.: writing—review and editing. J.P.M.-L.: writing—review and editing. All authors have read and agreed to the published version of the manuscript.

Funding

This work was supported by Ciencia Básica SEP-CONACYT, México [279937], 2017.

Data Availability Statement

Data are contained within the article.

Acknowledgments

The authors are thankful to the Consejo Nacional de Ciencia y Tecnología (CONACyT) for the Infraestructura Científica y Tecnológica México [279937]. The authors sincerely thank the Consejo Promotor de la Raicilla (CRP) for all the information about the raicilla and their generous donation of raicilla brands.

Conflicts of Interest

The authors declare no conflicts of interest.

References

  1. PROYECTO de Norma Oficial Mexicana PROY-NOM-257-SE-2021, B. Alcohólicas-R.-D. Especificaciones, Información Comercial y Métodos de Prueba. DOF—Diario Oficial de La Federación. Available online: https://www.dof.gob.mx/nota_detalle.php?codigo=5650295&fecha=27/04/2022#gsc.tab=0 (accessed on 6 January 2025).
  2. Arrizón, J.; Arizaga, J.J.; Hernandez, R.E.; Estarrón, M.; Gschaedler, A. Production of Volatile Compounds in Tequila and Raicilla Musts by Different Yeasts Isolated from Mexican Agave Beverages. ACS Symp. Ser. 2007, 946, 167–177. [Google Scholar] [CrossRef]
  3. Franco Gordo, M.; Goyas Mejía, R.; Navarro Ochoa, A.; Nuño Gutiérrez, M.R.; Tulet, J.-C.; Carreón Álvarez, M.A.; Sánchez Huerta, A.I.; Trujillo Orozco, A.G.; Zamudio Ojeda, A.; Zurita Martínez, F. La Raicilla. Herencia y Patrimonio Cultural de Jalisco; Editorial Universidad de Guadalajara: Guadalajara, Spain, 2015. [Google Scholar] [CrossRef]
  4. De León-Rodríguez, A.; Escalante-Minakata, P.; Jiménez-García, M.I.; Ordoñez-Acevedo, L.G.; Flores Flores, J.L.; Barba de la Rosa, A.P. Characterization of Volatile Compounds from Ethnic Agave Alcoholic Beverages by Gas Chromatography-Mass Spectrometry. Available online: https://www.ftb.com.hr/?view=article&id=256:characterization-of-volatile-compounds-from-ethnic-agave-alcoholic-beverages-by-gas-chromatography-mass-spectrometry&catid=67&highlight=WyJjaGFyYWN0ZXJpemF0aW9uIiwib2YiLCJ2b2xhdGlsZSIsImNvbXBvdW5kcyIsImZyb20iLCJldGhuaWMiLCJhZ2F2ZSIsImFsY29ob2xpYyIsImJldmVyYWdlcyIsImJ5IiwiZ2FzIiwiY2hyb21hdG9ncmFwaHktbWFzcyIsInNwZWN0cm9tZXRyeSJd (accessed on 25 December 2024).
  5. Trujillo-Orozco, A.; Gómez-Salazar, S.; Bárcena-Soto, M.; Carreon-Alvarez, A.; Estrada-Vargas, A.; Prado-Ramírez, R.; Casillas, N. Detection of Cu, Pb, Cd and Zn in Mexican Spirituous Beverages by Differential Pulse Polarography (DPP). ECS Trans. 2011, 36, 363–372. [Google Scholar] [CrossRef]
  6. Carreón Álvarez, M.A.; Sánchez Huerta, A.I.; Trujillo Orozco, A.G.; Zamudio Ojeda, A.; Zurita Martínez, F. Estudio de Parámetros Fisicoquímicos de La Raicilla En Diferentes Zonas Del Estado de Jalisco. In Herencia y Patrimonio Cultural de Jalisco; Editorial Universidad de Guadalajara: Guadalajara, Spain, 2015; pp. 142–162. [Google Scholar]
  7. Contreras-Loera, U.; Barbosa-García, O.; Ramos-Ortíz, G.; Pichardo-Molina, J.L.; Meneses-Nava, M.A.; Maldonado, J.L. Identificación y Discriminación de Tequilas Reposados in Situ Para La Protección de Marca. Nova Sci. 2009, 1, 22–32. [Google Scholar] [CrossRef]
  8. Martelo-Vidal, M.J.; Vázquez, M. Determination of Polyphenolic Compounds of Red Wines by UV–VIS–NIR Spectroscopy and Chemometrics Tools. Food Chem. 2014, 158, 28–34. [Google Scholar] [CrossRef] [PubMed]
  9. Martelo-Vidal, M.J.; Vázquez, M. Evaluation of Ultraviolet, Visible, and near Infrared Spectroscopy for the Analysis of Wine Compounds. Czech J. Food Sci. 2014, 32, 37–47. [Google Scholar] [CrossRef]
  10. Pontes, M.J.C.; Santos, S.R.B.; Araújo, M.C.U.; Almeida, L.F.; Lima, R.A.C.; Gaião, E.N.; Souto, U.T.C.P. Classification of Distilled Alcoholic Beverages and Verification of Adulteration by near Infrared Spectrometry. Food Res. Int. 2006, 39, 182–189. [Google Scholar] [CrossRef]
  11. Wu, J.; Liu, J.; Fu, M.; Li, G.; Lou, Z. Classification of Chinese Yellow Wines by ChemometricAnalysis of Cyclic Voltammogram of Copper Electrodes. Sensors 2005, 5, 529–536. [Google Scholar] [CrossRef]
  12. Hanousek Čiča, K.; Lukin, P.; Derewiaka, D.; Mrvčić, J.; Stanzer, D. Chemical Composition, Physical Properties, and Aroma Profile of Ethanol Macerates of Mistletoe (Viscum album). Beverages 2022, 8, 46. [Google Scholar] [CrossRef]
  13. Alemayehu, H.G. Physico-Chemical Characterization of Commercial Local Alcohol Beverages Available in South Nations, Nationalities and People’s Regional State, Ethiopia. Int. J. Chemtech Res. 2018, 11, 227–231. [Google Scholar] [CrossRef]
  14. Ahmad, I.; Ahmed, S.; Yadav, B.; Sah, P.; Ara, R.; Alam, M.; Zzaman, W. Microbial, Physicochemical and Sensory Characteristics Analysis of Selected Alcoholic Beverages of from Bangladesh, India and Nepal. J Biosci. 2018, 23, 67–75. [Google Scholar] [CrossRef]
  15. Pereira, I.M.C.; Matos Neto, J.D.; Figueiredo, R.W.; Carvalho, J.D.G.; de Figueiredo, E.A.T.; de Menezes, N.V.S.; Gaban, S.V.F. Physicochemical Characterization, Antioxidant Activity, and Sensory Analysis of Beers Brewed with Cashew Peduncle (Anacardium occidentale) and Orange Peel (Citrus sinensis). Food Sci. Technol. 2020, 40, 749–755. [Google Scholar] [CrossRef]
  16. NOM-142-SSA1/SCFI-2014; Bebidas Alcohólicas. Especificaciones Sanitarias. Etiquetado Sanitario y Comercial. DOF—Diario Oficial de La Federación: Mexico City, Mexico, 2015. Available online: https://www.dof.gob.mx/nota_detalle.php?codigo=5386313&fecha=23/03/2015#gsc.tab=0 (accessed on 5 January 2025).
  17. NOM-070-SCFI-2016; B. Alcohólicas-M.-Especificaciones. DOF—Diario Oficial de La Federación: Mexico City, Mexico, 2016.
  18. NOM-006-SCFI-2012; B. alcohólicas-T.-Especificaciones. DOF—Diario Oficial de La Federación: Mexico City, Mexico, 2012. Available online: https://www.dof.gob.mx/nota_detalle.php?codigo=5282165&fecha=13/12/2012#gsc.tab=0 (accessed on 5 January 2025).
  19. Fernandes, W.J.; das Graças Cardoso, M.; Vilela, F.J.; de Morais, A.R.; de Fátima Silva, V.; Nelson, D.L. Physicochemical Quality of a Blend of Domestic Cachaças from the South of Minas Gerais. J. Food Compos. Anal. 2007, 20, 257–261. [Google Scholar] [CrossRef]
  20. Adeleke, R.O.; Abiodun, O.A. Physico-Chemical Properties of Commercial Local Beverages in Osun State, Nigeria. Pak. J. Nutr. 2010, 9, 853–855. [Google Scholar] [CrossRef]
  21. Carreon-Alvarez, A.; Suárez-Gómez, A.; Zurita, F.; Gómez-Salazar, S.; Soltero, J.F.A.; Barcena-Soto, M.; Casillas, N.; Porfirio-Gutierrez; Moreno-Medrano, E.D. Assessment of Physicochemical Properties of Tequila Brands: Authentication and Quality. J. Chem. 2016, 2016, 6254942. [Google Scholar] [CrossRef]
  22. NMX-V-013-NORMEX-2019; DECLARATORIA de Vigencia de la Norma Mexicana. DOF—Diario Oficial de La Federación: Mexico City, Mexico, 2019. Available online: https://dof.gob.mx/nota_detalle.php?codigo=5594809&fecha=11/06/2020#gsc.tab=0 (accessed on 6 January 2025).
  23. Belay, A.; Assefa, G. Concentration, Wavelength and Temperature Dependent Refractive Index of Sugar Solutions and Methods of Determination Contents of Sugar in Soft Drink Beverages Using Laser Lights. J. Lasers Opt. Photonics 2018, 5, 1000187. [Google Scholar] [CrossRef]
  24. Gasinski, A.; Kawa-Rygielska, J.; Szumny, A.; Czubaszek, A.; Gasior, J.; Pietrzak, W. Volatile Compounds Content, Physicochemical Parameters, and Antioxidant Activity of Beers with Addition of Mango Fruit (Mangifera indica). Molecules 2020, 25, 3033. [Google Scholar] [CrossRef] [PubMed]
  25. Adebayo, G.B.; Otunola, G.A.; Ajao, T.A. Physicochemical, Microbiological and Sensory Characteristics of Kunu Prepared from Millet, Maize and Guinea Corn and Stored at Selected Temperatures. Adv. J. Food Sci. Technol. 2010, 2, 41–46. [Google Scholar]
  26. Santos, M.J.; Correia, E.; Vilela, A. Exploring the Impact of α-Amylase Enzyme Activity and PH on Flavor Perception of Alcoholic Drinks. Foods 2023, 12, 1018. [Google Scholar] [CrossRef] [PubMed]
  27. Yang, X.; Song, X.; Yang, L.; Zhao, J.; Zhu, X. Effect of Deacidification Treatment on the Flavor Quality of Zaosu Pear–Kiwifruit Wine. Foods 2022, 11, 2007. [Google Scholar] [CrossRef] [PubMed]
  28. Liebmann, A.J.; Rosenblatt, M. PH in Distilled Alcoholic Beverages. J. AOAC Int. 1942, 25, 163–168. [Google Scholar] [CrossRef]
  29. Cardoso, D.R.; Andrade-Sobrinho Luis, G.; Leite-Neto, A.F.; Reche, R.V.; Isique, W.D.; Ferreira, M.M.C.; Lima-Neto, B.S.; Franco, D.W. Comparison between Cachaça and Rum Using Pattern Recognition Methods-PubMed. J. Agric. Food Chem. 2004, 52, 3429–3433. [Google Scholar] [CrossRef] [PubMed]
  30. Moutsatsou, A.; Chalarakis, E.; Zarangas, G. Influence of Raw Materials and Distillation Equipment on the Heavy Metal Content of Waste from an Alcoholic Anis-Type Beverage. J. Hazard. Mater. 2003, 96, 53–64. [Google Scholar] [CrossRef] [PubMed]
  31. Ibanez, J.G.; Carreon-Alvarez, A.; Barcena-Soto, M.; Casillas, N. Metals in Alcoholic Beverages: A Review of Sources, Effects, Concentrations, Removal, Speciation, and Analysis. J. Food Compos. Anal. 2008, 21, 672–683. [Google Scholar] [CrossRef]
  32. Li, C.; Wang, Y.; Sha, S.; Yin, H.; Zhang, H.; Wang, Y.; Zhao, B.; Song, F. Analysis of the Tendency for the Electronic Conductivity to Change during Alcoholic Fermentation. Sci. Rep. 2019, 9, 5512. [Google Scholar] [CrossRef] [PubMed]
  33. Leveling, T. The Relationship Between PH and Conductivity in a Lithium Contaminated, De-Ionized Water System; Fermi National Accelerator Laboratory (FNAL): Batavia, IL, USA, 2002. [Google Scholar]
  34. Wiśniewska, P.; Śliwińska, M.; Dymerski, T.; Wardencki, W.; Namieśnik, J. The Analysis of Vodka: A Review Paper. Food Anal. Methods 2015, 8, 2000–2010. [Google Scholar] [CrossRef]
  35. Resende Oliveira, É.; Caliari, M.; Soares Soares, M., Jr.; Ribeiro Oliveira, A.; Cristina Marques Duarte, R.; Valério de Barros Vilas Boas, E. Assessment of Chemical and Sensory Quality of Sugarcane Alcoholic Fermented Beverage. J. Food Sci. Technol. 2018, 55, 72–81. [Google Scholar] [CrossRef] [PubMed]
  36. Castellan Gilbert, W. Fisicoquimica Segunda Edición; Addison Wesley Longman: Boston, MA, USA, 1987; Volume 2, ISBN 9789684443167. [Google Scholar]
  37. Jordão, A.M.; Vilela, A.; Cosme, F. From Sugar of Grape to Alcohol of Wine: Sensorial Impact of Alcohol in Wine. Beverages 2015, 1, 292–310. [Google Scholar] [CrossRef]
  38. Spillman, P.J.; Pollnitz, A.P.; Liacopoulos, D.; Skouroumounis, G.K.; Sefton, M.A. Accumulation of Vanillin during Barrel-Aging of White, Red, and Model Wines. J. Agric. Food Chem. 1997, 45, 2584–2589. [Google Scholar] [CrossRef]
  39. Öztürk, I.; Karaman, S.; Törnük, F.; Saǧdiç, O. Physicochemical and Rheological Characteristics of Alcohol Free Probiotic Boza Produced Using Lactobacillus Casei Shirota: Estimation of Apparent Viscosity of Boza Using Non-Linear Modeling Techniques. Turk. J. Agric. For. 2013, 37, 475–487. [Google Scholar] [CrossRef]
  40. Bouchard, A.; Hofland, G.W.; Witkamp, G.J. Properties of Sugar, Polyol, and Polysaccharide Water−Ethanol Solutions. J. Chem. Eng. Data 2007, 52, 1838–1842. [Google Scholar] [CrossRef]
Figure 1. Distribution of the physicochemical parameters of the raicilla in the plane of the first two principal components. Samples are displayed as points with their respective number and zones (S: Sierra, C: Coast). Variables are shown as vectors on the biplot.
Beverages 11 00107 g001
Figure 2. Distribution of physicochemical properties of Coast’s raicilla in the plane of the first two PCs. Samples are displayed as points with their respective numbers, while variables are shown as vectors on the biplot.
Beverages 11 00107 g002
Figure 3. Distribution of the Sierra raicillas’ physicochemical parameters in the plane of the first two principal components. Samples are shown as points with their respective numbers, while variables are displayed as vectors on the biplot.
Beverages 11 00107 g003
Figure 4. Raicilla cluster. (a) Raicilla cluster of both zones. (b) Coast raicilla cluster. (c) Sierra raicilla cluster.
Beverages 11 00107 g004
Figure 5. Means graphs obtained by the method Fisher’s LSD from raicilla cluster analysis.
Beverages 11 00107 g005
Figure 6. Means graphs obtained by the Fisher’s LSD method from Coast raicilla cluster analysis.
Beverages 11 00107 g006
Figure 7. Means graphs obtained by the Fisher’s LSD method from Sierra raicilla cluster analysis.
Beverages 11 00107 g007
Table 1. Measurements of pH, conductivity, alcohol content, total solids, viscosity, sound velocity, density, and refractive index with their respective standard deviation of the 25 brands of raicilla.
NumberVarietyZonepHConductivity
(µS/cm)
Alcohol Content
(%)
Total Solids (ppm)
1WhiteCoast4.05 ± 0.0029.67 ± 0.1149.00 ± 0.00680.00 ± 118.39
2WhiteSierra3.90 ± 0.0127.28 ± 0.1447.33 ± 0.58142.67 ± 15.14
3WhiteCoast3.94 ± 0.0228.06 ± 0.1348.33 ± 0.58145.33 ± 18.04
4WhiteSierra3.89 ± 0.0124.69 ± 0.1348.66 ± 0.582060.00 ± 42.14
5RestedSierra3.56 ± 0.0169.57 ± 0.4039.33 ± 0.58302.67 ± 82.00
6WhiteSierra3.84 ± 0.0030.30 ± 0.1041.00 ± 0.0058.67 ± 15.14
7WhiteSierra4.36 ± 0.0234.47 ± 0.3540.00 ± 0.00112.00 ± 49.15
8WhiteSierra3.74 ± 0.0137.33 ± 0.1545.66 ± 0.58217.33 ± 28.38
9WhiteSierra3.74 ± 0.0135.73 ± 0.1550.66 ± 0.581233.33 ± 44.96
10WhiteSierra3.80 ± 0.0132.60 ± 0.3041.00 ± 0.00156.00 ± 8.00
11WhiteSierra3.85 ± 0.0134.63 ± 0.1541.33 ± 0.5870.67 ± 10.07
12WhiteSierra3.84 ± 0.0139.57 ± 0.5142.66 ± 0.58121.33 ± 28.38
13WhiteSierra3.59 ± 0.0161.60 ± 1.2538.33 ± 0.58216.00 ± 39.39
14WhiteSierra3.57 ± 0.0184.30 ± 1.1331.33 ± 0.58224.00 ± 21.17
15WhiteSierra3.67 ± 0.0157.93 ± 0.2535.00 ± 0.00716.00 ± 47.16
16WhiteCoast3.80 ± 0.0145.40 ± 0.7239.66 ± 0.58153.33 ± 65.16
17RestedCoast3.84 ± 0.0266.10 ± 1.0039.00 ± 0.00698.67 ± 114.29
18WhiteCoast3.51 ± 0.0263.80 ± 0.6138.66 ± 0.5873.33 ± 8.33
19WhiteCoast3.83 ± 0.0028.03 ± 0.1746.00 ± 0.00222.67 ± 19.73
20RestedCoast3.87 ± 0.0131.33 ± 0.6441.00 ± 0.00209.33 ± 46.36
21AbocadoSierra3.72 ± 0.021909.67 ± 18.04-------------166,984.0 ± 5988.99
22WhiteCoast3.62 ± 0.0247.47 ± 0.0744.33 ± 0.58106.67 ± 20.53
23WhiteCoast3.51 ± 0.0161.37 ± 0.3242.66 ± 0.5878.67 ± 12.22
24WhiteCoast3.74 ± 0.0134.90 ± 0.035.66 ± 0.5821.33 ± 6.11
25WhiteSierra3.36 ± 0.0185.37 ± 0.1528.00 ± 0.0058.67 ± 8.33
NumberVarietyZoneViscosity (mPa × s)Sound velocity (m/s)Density (g/cm3)Refractive Index
1WhiteCoast2.79 ± 4.0 × 10−51561.69 ± 0.050.93665 ± 0.061.35833 ± 7.6 × 10⁻⁴
2WhiteSierra2.80 ± 5.0 × 10−41569.39 ± 0.060.93879 ± 0.061.35783 ± 2.8 × 10⁻⁴
3WhiteCoast2.80 ± 5.0 × 10−51560.79 ± 0.050.93650 ± 0.061.35867 ± 2.8 × 10⁻⁴
4WhiteSierra2.80 ± 1.0 × 10−51559.11 ± 0.050.93580 ± 0.061.35833 ± 2.8 × 10⁻⁴
5RestedSierra2.65 ± 2.3 × 10−41608.26 ± 0.080.95223 ± 0.051.35433 ± 7.6 × 10⁻⁴
6WhiteSierra2.67 ± 8.9 × 10−41604.23 ± 0.080.95047 ± 0.051.35500 ± 5.0 × 10⁻⁴
7WhiteSierra2.62 ± 7.1 × 10−41611.09 ± 0.090.95270 ± 0.051.35450 ± 0
8WhiteSierra2.75 ± 6.2 × 10−41577.53 ± 0.060.94274 ± 0.061.35700 ± 5.0 × 10⁻⁴
9WhiteSierra2.81 ± 5.8 × 10−41549.96 ± 0.040.93449 ± 0.061.35867 ± 2.8 × 10⁻⁴
10WhiteSierra2.77 ± 2.4 × 10−41581.37 ± 0.070.94244 ± 0.061.35683 ± 2.8 × 10⁻⁴
11WhiteSierra2.66 ± 3.0 × 10−41604.35 ± 0.080.95031 ± 0.051.35483 ± 2.8 × 10⁻⁴
12WhiteSierra2.55 ± 5.4 × 10−41607.22 ± 0.080.95153 ± 0.051.35450 ± 0
13WhiteSierra2.55 ± 6.9 × 10−41613.96 ± 0.090.95490 ± 0.041.35333 ± 2.8 × 10⁻⁴
14WhiteSierra2.29 ± 2.3 × 10−41621.57 ± 0.090.95922 ± 0.041.35217 ± 1.04 × 10⁻³
15WhiteSierra2.16 ± 1.4 × 10−31624.26 ± 0.090.96078 ± 0.041.35167 ± 2.8 × 10⁻⁴
16WhiteCoast2.60 ± 3.0 × 10−41613.38 ± 0.090.95469 ± 0.041.35333 ± 2.8 × 10⁻⁴
17RestedCoast2.60 ± 4.0× 10−51613.60 ± 0.090.95450 ± 0.041.35333 ± 5.7 × 10⁻⁴
18WhiteCoast2.53 ± 1.60 × 10−41617.69 ± 0.090.95652 ± 0.041.35283 ± 2.8 × 10⁻⁴
19WhiteCoast2.76 ± 1.12 × 10−31577.61 ± 0.060.94249 ± 0.061.35733 ± 2.8 × 10⁻⁴
20RestedCoast2.66 ± 6.70 × 10−41580.87 ± 0.060.94242 ± 0.061.35683 ± 2.8 × 10⁻⁴
21AbocadoSierra2.44 ± 5.61 × 10−31596.50 ± 0.081.05085 ± 0.051.36283 ± 1.04 × 10⁻³
22WhiteCoast2.79 ± 1.80 × 10−41564.53 ± 0.050.93760 ± 0.061.35700 ± 0
23WhiteCoast2.78 ± 3.00 × 10−41568.15 ± 0.060.93977 ± 0.061.35700 ± 0
24WhiteCoast2.68 ± 4.20 × 10−41603.35 ± 0.080.94983 ± 0.051.35433 ± 2.8 × 10⁻⁴
25WhiteSierra2.60 ± 1.60 × 10−41611.77 ± 0.090.95420 ± 0.041.35300 ± 0
Table 2. Table of variance contribution for the principal components of 24 raicillas.
Component NumberEigenvaluePercentage of VarianceAccumulated Percentage
15.390567.38167.381
21.151314.39181.772
30.946111.82693.598
40.20602.57496.173
50.15591.94998.121
60.13881.73599.856
70.00990.12499.980
80.00160.020100.00
Table 3. Table of weights of the main components of 24 raicillas.
Component 1Component 2
pH0.215809−0.769737
Conductivity (µS/cm)−0.3457170.459528
Alcohol content (%)0.399783−0.056169
Viscosity (mPa × s)0.3691870.172723
Sound velocity (m/s)−0.40408−0.280002
Density (g/cm3)−0.412441−0.231211
Refractive index0.4211310.132307
Total solids (ppm)0.1644430.118264
Table 4. Table of variance contribution for the principal components of 10 raicillas from Coast region.
Component NumberEigenvaluePercentage of VarianceAccumulated Percentage
15.249665.61965.619
21.579919.74885.368
30.852710.65996.027
40.19532.44198.468
50.07740.96899.436
60.03450.43299.868
Table 5. Table of weights of the main components from Coast.
Component 1Component 2
pH0.23100.6326
Conductivity (µS/cm)−0.3048−0.1591
Alcohol content (%)0.39150.0756
Viscosity (mPa × s)0.4037−0.1815
Sound velocity (m/s)−0.41630.1945
Density (g/cm3)−0.41840.1792
Refractive index0.4293−0.0981
Total solids (ppm)0.06990.6755
Table 6. Table of variance contribution for the principal components of 14 raicillas from the Sierra area.
Component NumberEigenvaluePercentage of VarianceAccumulated Percentage
15.584569.80769.807
21.243815.54785.354
30.79709.96295.316
40.19872.48497.800
50.09211.15198.952
60.07990.99999.951
70.00290.03799.988
80.00090.012100.00
Table 7. Table of weights of the main components from Sierra.
Component 1Component 2
pH0.2034−0.7191
Conductivity (µS/cm)−0.35350.4183
Alcohol content (%)0.3970−0.0776
Viscosity (mPa × s)0.35770.03475
Sound velocity (m/s)−0.3992−0.2592
Density (g/cm3)−0.4093−0.1846
Refractive index0.41620.0899
Total solids (ppm)0.21950.4375
Disclaimer/Publisher’s Note: The statements, opinions and data contained in all publications are solely those of the individual author(s) and contributor(s) and not of MDPI and/or the editor(s). MDPI and/or the editor(s) disclaim responsibility for any injury to people or property resulting from any ideas, methods, instructions or products referred to in the content.