
Impact of Underwater Aging on the Volatile and Phenolic Compounds of Campania Wine-Based Liqueurs “Elixir Falernum”

 ,
,  , ,
, , 
Highlights
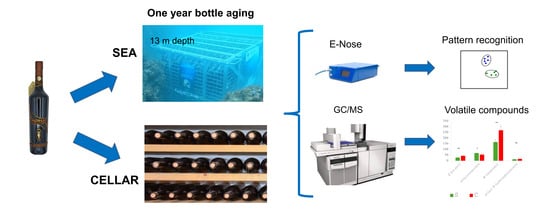
- Underwater aging for 12 months preserved anthocyanins and colour stability.
- Blue–green light and sea vibrations contributed to aroma complexity.
- Underwater conditions increased furanone and pyranone levels, enhancing caramel notes.
- An electronic nose classified samples with 96% accuracy for authentication.
Abstract
1. Introduction
2. Materials and Methods
2.1. Liquor Samples
2.2. Electronic Nose Analysis
2.3. Chemical Analyises
2.4. Determination of Total Polyphenol, Anthocyanin, and α-Amino Nitrogen and Protein Content
2.5. Colour Analysis
2.6. Extraction and Analysis of Volatile Organic Compounds by SPME-GC/MS
2.7. Statistical Analysis
3. Results and Discussion
3.1. Electronic Nose Analysis of Individual Bottles
3.2. Chemical and Colour Properties
3.3. Total Polyphenol, Anthocyanin, and α-Amino Nitrogen and Protein Content
3.4. Volatile Organic Compounds
4. Conclusions
Author Contributions
Funding
Institutional Review Board Statement
Informed Consent Statement
Data Availability Statement
Conflicts of Interest
Abbreviations
| E-nose | Electronic nose |
| MOS | Metal oxide semiconductor |
| SPME | Solid phase microextraction |
| GC/MS | Gas chromatography mass spectrometry |
| VOCs | Volatile organic compounds |
| LDA | Linear discriminant analysis |
| PCA | Principal component analysis |
| S | Sea underwater aged |
| C | Cellar aged |
References
- Ugliano, M. Oxygen contribution to wine aroma evolution during bottle aging. J. Agric. Food Chem. 2013, 61, 6125–6136. [Google Scholar] [CrossRef]
- Echave, J.; Barral, M.; Fraga-Corral, M.; Prieto, M.A.; Simal-Gandara, J. Bottle aging and storage of wines: A review. Molecules 2021, 26, 713. [Google Scholar] [CrossRef] [PubMed]
- Silva, M.A.; Julien, M.; Jourdes, M.; Teissedre, P.-L. Impact of closures on wine post-bottling development: A review. Eur. Food Res. Technol. 2011, 233, 905–914. [Google Scholar] [CrossRef]
- Liu, D.; Xing, R.-R.; Li, Z.; Yang, D.-M.; Pan, Q.-H. Evolution of volatile compounds, aroma attributes, and sensory perception in bottle-aged red wines and their correlation. Eur. Food Res. Technol. 2016, 242, 1937–1948. [Google Scholar] [CrossRef]
- Lopes, P.; Silva, M.A.; Pons, A.; Tominaga, T.; Lavigne, V.r.; Saucier, C.; Darriet, P.; Teissedre, P.-L.; Dubourdieu, D. Impact of oxygen dissolved at bottling and transmitted through closures on the composition and sensory properties of a Sauvignon blanc wine during bottle storage. J. Agric. Food Chem. 2009, 57, 10261–10270. [Google Scholar] [CrossRef]
- Coetzee, C.; Van Wyngaard, E.; Suklje, K.; Silva Ferreira, A.C.; Du Toit, W.J. Chemical and sensory study on the evolution of aromatic and nonaromatic compounds during the progressive oxidative storage of a Sauvignon blanc wine. J. Agric. Food Chem. 2016, 64, 7979–7993. [Google Scholar] [CrossRef] [PubMed]
- Ferreira, V.; Bueno, M.; Franco-Luesma, E.; Cullere, L.; Fernandez-Zurbano, P. Key changes in wine aroma active compounds during bottle storage of Spanish red wines under different oxygen levels. J. Agric. Food Chem. 2014, 62, 10015–10027. [Google Scholar] [CrossRef] [PubMed]
- Wirth, J.; Morel-Salmi, C.; Souquet, J.M.; Dieval, J.; Aagaard, O.; Vidal, S.; Fulcrand, H.; Cheynier, V. The impact of oxygen exposure before and after bottling on the polyphenolic composition of red wines. Food Chem. 2010, 123, 107–116. [Google Scholar] [CrossRef]
- Gambuti, A.; Siani, T.; Picariello, L.; Rinaldi, A.; Lisanti, M.T.; Ugliano, M.; Dieval, J.; Moio, L. Oxygen exposure of tannins-rich red wines during bottle aging. Influence on phenolics and color, astringency markers and sensory attributes. Eur. Food Res. Technol. 2017, 243, 669–680. [Google Scholar] [CrossRef]
- Escribano-Bailón, T.; Álvarez-García, M.; Rivas-Gonzalo, J.C.; Heredia, F.J.; Santos-Buelga, C. Color and stability of pigments derived from the acetaldehyde-mediated condensation between malvidin 3-O-glucoside and (+)-catechin. J. Agric. Food Chem. 2001, 49, 1213–1217. [Google Scholar] [CrossRef]
- Ugliano, M.; Dieval, J.-B.; Siebert, T.E.; Kwiatkowski, M.; Aagaard, O.; Vidal, S.; Waters, E.J. Oxygen consumption and development of volatile sulfur compounds during bottle aging of two Shiraz wines. Influence of pre- and post bottling controlled oxygen exposure. J. Agric. Food Chem. 2012, 60, 8561–8570. [Google Scholar] [CrossRef]
- Xu, M.; Yu, Y.; Ramaswamy, H.; Zhu, S. Characterization of Chinese liquor aroma components during aging process and liquor age discrimination using gas chromatography combined with multivariable statistics. Sci. Rep. 2017, 7, 39671. [Google Scholar] [CrossRef]
- Qian, X.; Jia, F.; Cai, J.; Shi, Y.; Duan, C.; Lan, Y. Characterization and Evolution of Volatile Compounds of Cabernet Sauvignon Wines from Two Different Clones during Oak Barrel Aging. Foods 2022, 11, 74. [Google Scholar] [CrossRef]
- Ziegler, M.; Wegmann-Herr, P.; Schmarr, H.-G.; Gök, R.; Winterhalter, P.; Fischer, U. Impact of rootstock, clonal selection, and berry size of Vitis vinifera sp. Riesling on the formation of TDN, Vitispiranes, and other volatile compounds. J. Agric. Food Chem. 2020, 68, 3834–3849. [Google Scholar] [CrossRef] [PubMed]
- Bartowsky, E.J.; Henschke, P.A. Acetic acid bacteria spoilage of bottled red wine—A review. Int. J. Food Microbiol. 2008, 125, 60–70. [Google Scholar]
- Mercanti, N.; Pieracci, Y.; Macaluso, M.; Fedel, M.; Brazzarola, F.; Palla, F.; Verdini, P.G.; Zinnai, A. Exploring Red Wine Aging: Comparative Analysis of Cellar and Sea Underwater Aging on Chemical Composition and Quality. Foods 2024, 13, 1812. [Google Scholar] [CrossRef]
- Birkić, N.; Ožbolt, E.; Reynolds, C.A.; Pavlešić, T.; Lučin, I.; Andabaka, Ž.; Saftić Martinović, L. Maturation of wine in underwater springs as a novel wine production process. Eur. Food Res. Technol. 2024, 250, 615–622. [Google Scholar] [CrossRef]
- Maioli, F.; Picchi, M.; Bandinelli, A.; Colavolpe, G.; Kottakhs, E.; Canuti, V. Effect of underwater aging treatment on wine quality: A preliminary study. Eur. Food Res. Technol. 2024, 251, 391–404. [Google Scholar] [CrossRef]
- Wei, Y.J.; Yang, L.L.; Liang, Y.P.; Li, J.M. Application of electronic nose for detection of wine-aging methods. Adv. Mater. Res. 2014, 875, 2206–2213. [Google Scholar] [CrossRef]
- Ziółkowska, A.; Wąsowicz, E.; Jeleń, H.H. Differentiation of wines according to grape variety and geographical origin based on volatiles profiling using SPME-MS and SPME-GC/MS methods. Food Chem. 2016, 213, 714–720. [Google Scholar] [CrossRef]
- Genovese, A.; Moio, L.; Sacchi, R.; Piombino, P. Sip volume affects oral release of wine volatiles. Food Res. Int. 2015, 77, 426–431. [Google Scholar] [CrossRef]
- Falchero, L.; Sala, G.; Gorlier, A.; Lombardi, G.; Lonati, M.; Masoero, G. Electronic Nose analysis of milk from cows grazing on two different Alpine vegetation types. J. Dairy Res. 2009, 76, 365–371. [Google Scholar] [CrossRef] [PubMed]
- Lozano, J.; Arroyo, T.; Santos, J.; Cabellos, J.; Horrillo, M. Electronic nose for wine ageing detection. Sens. Actuators B Chem. 2008, 133, 180–186. [Google Scholar] [CrossRef]
- García, M.; Aleixandre, M.; Gutiérrez, J.; Horrillo, M. Electronic nose for wine discrimination. Sens. Actuators B Chem. 2006, 113, 911–916. [Google Scholar] [CrossRef]
- Stevan, S., Jr. Measurement of quality indicators of wine: From bottle to aging. Anal. Chim. Acta 2018, 1040, 62–68. [Google Scholar] [CrossRef]
- Muñoz-Castells, R.; Modesti, M.; Moreno-García, J.; Rodríguez-Moreno, M.; Catini, A.; Capuano, R.; Di Natale, C.; Bellincontro, A.; Moreno, J. Differentiation through E-nose and GC-FID data modeling of rosé sparkling wines elaborated via traditional and Charmat methods. J. Sci. Food Agric. 2024, 105, 1439–1447. [Google Scholar] [CrossRef]
- Balivo, A.; Sacchi, R.; Di Francia, A.; Masucci, F.; Genovese, A. E-nose analysis of milk to detect the inclusion of hydroponic barley forage in the buffalo diet. J. Food Comp. Anal. 2024, 131, 106230. [Google Scholar] [CrossRef]
- James, G.; Witten, D.; Hastie, T.; Tibshirani, R.; Taylor, J. Linear regression. In An Introduction to Statistical Learning: With Applications in Python, 2023; Springer International Publishing: Cham, Switzerland, 2023; pp. 69–134. [Google Scholar]
- Visioli, F.; Panaite, S.-A.; Tomé-Carneiro, J. Wine’s Phenolic Compounds and Health: A Pythagorean View. Molecules 2020, 25, 4105. [Google Scholar] [CrossRef]
- Jakobek, L.; Seruga, M.; Medvidovic-Kosanovic, M.; Novak, I. Anthocyanin content and antioxidant activity of various red fruit juices. Deut. Lebensm. Rundsch. 2007, 103, 58. [Google Scholar]
- Enaru, B.; Drețcanu, G.; Pop, T.D.; Stǎnilǎ, A.; Diaconeasa, Z. Anthocyanins: Factors Affecting Their Stability and Degradation. Antioxidants 2021, 10, 1967. [Google Scholar] [CrossRef]
- He, F.; Liang, N.-N.; Mu, L.; Pan, Q.-H.; Wang, J.; Reeves, M.J.; Duan, C.-Q. Anthocyanins and Their Variation in Red Wines I. Monomeric Anthocyanins and Their Color Expression. Molecules 2012, 17, 1571–1601. [Google Scholar] [CrossRef] [PubMed]
- Gutiérrez-Escobar, R.; Aliaño-González, M.J.; Cantos-Villar, E. Wine Polyphenol Content and Its Influence on Wine Quality and Properties: A Review. Molecules 2021, 26, 718. [Google Scholar] [CrossRef]
- Sęczyk, Ł.; Świeca, M.; Kapusta, I.; Gawlik-Dziki, U. Protein–Phenolic Interactions as a Factor Affecting the Physicochemical Properties of White Bean Proteins. Molecules 2019, 24, 408. [Google Scholar] [CrossRef] [PubMed]
- Bittner, S. When quinones meet amino acids: Chemical, physical and biological consequences. Amino Acids 2006, 30, 205–224. [Google Scholar] [CrossRef]
- Smith, M.R.; Penner, M.H.; Bennett, S.E.; Bakalinsky, A.T. Quantitative colorimetric assay for total protein applied to the red wine pinot noir. J. Agric. Food Chem. 2011, 59, 6871–6876. [Google Scholar] [CrossRef] [PubMed]
- Fukui, M.; Yokotsuka, K. Content and origin of protein in white and red wines: Changes during fermentation and maturation. Am. J. Enol. Vitic. 2003, 54, 178–188. [Google Scholar] [CrossRef]
- Crowell, E.; Ough, C.; Bakalinsky, A. Determination of alpha amino nitrogen in musts and wines by TNBS method. Am. J. Enol. Vitic. 1985, 36, 175–177. [Google Scholar] [CrossRef]
- Sánchez-Gómez, R.; del Alamo-Sanza, M.; Martínez-Gil, A.M.; Nevares, I. Red Wine Aging by Different Micro-Oxygenation Systems and Oak Wood—Effects on Anthocyanins, Copigmentation and Color Evolution. Processes 2020, 8, 1250. [Google Scholar] [CrossRef]
- Cao, W.; Shu, N.; Wen, J.; Yang, Y.; Jin, Y.; Lu, W. Characterization of the Key Aroma Volatile Compounds in Nine Different Grape Varieties Wine by Headspace Gas Chromatography–Ion Mobility Spectrometry (HS-GC-IMS), Odor Activity Values (OAV) and Sensory Analysis. Foods 2022, 11, 2767. [Google Scholar] [CrossRef]
- Genovese, A.; Dimaggio, R.; Lisanti, M.T.; Piombino, P.; Moio, L. Aroma Composition of Red Wines by Different Extraction Methods and Gas Chromatography-SIM/Mass Spectrometry Analysis. Ann. Di Chim. J. Anal. Environ. Cult. Herit. Chem. 2005, 95, 383–394. [Google Scholar] [CrossRef]
- Zhao, P.; Qian, Y.; He, F.; Li, H.; Qian, M. Comparative Characterization of Aroma Compounds in Merlot Wine by Lichrolut-EN-Based Aroma Extract Dilution Analysis and Odor Activity Value. Chemosens. Percept. 2017, 10, 149–160. [Google Scholar]
- Yang, Y.; Ai, L.; Mu, Z.; Liu, H.; Yan, X.; Ni, L.; Xia, Y. Flavor Compounds with High Odor Activity Values (OAV > 1) Dominate the Aroma of Aged Chinese Rice Wine (Huangjiu) by Molecular Association. Food Chem. 2022, 383, 132370. [Google Scholar] [CrossRef]
- Lan, Y.B.; Xiang, X.F.; Qian, X.; Wang, J.M.; Ling, M.Q.; Zhu, B.Q.; Duan, C.Q. Characterization and Differentiation of Key Odor-Active Compounds of ‘Beibinghong’ Icewine and Dry Wine by Gas Chromatography-Olfactometry and Aroma Reconstitution. Food Chem. 2019, 287, 186–196. [Google Scholar] [CrossRef] [PubMed]
- Cutzach, I.; Chatonnet, P.; Dubourdieu, D. Study of the formation mechanisms of some volatile compounds during the aging of sweet fortified wines. J. Agric. Food Chem. 1999, 47, 2837–2846. [Google Scholar] [CrossRef] [PubMed]
- Cerdán, T.G.; Goñi, D.T.; Azpilicueta, C.A. Accumulation of volatile compounds during ageing of two red wines with different composition. J. Food Eng. 2004, 65, 349–356. [Google Scholar] [CrossRef]
- Câmara, J.S.; Marques, J.C.; Alves, M.A.; Silva Ferreira, A.C. 3-Hydroxy-4, 5-dimethyl-2 (5 H)-furanone levels in fortified Madeira wines: Relationship to sugar content. J. Agric. Food Chem. 2004, 52, 6765–6769. [Google Scholar] [CrossRef]
- Williams, A.A.; Lewis, M.J.; May, H.V. The volatile flavour components of commercial port wines. J. Sci. Food Agric. 1983, 34, 311–319. [Google Scholar] [CrossRef]
- Zhang, D.; Wei, Z.; Han, Y.; Duan, Y.; Shi, B.; Ma, W. A Review on Wine Flavour Profiles Altered by Bottle Aging. Molecules 2023, 28, 6522. [Google Scholar] [CrossRef]
- Pati, S.; Crupi, P.; Savastano, M.L.; Benucci, I.; Esti, M. Evolution of phenolic and volatile compounds during bottle storage of a white wine without added sulfite. J. Sci. Food Agric. 2020, 100, 775–784. [Google Scholar] [CrossRef]
- Antoine, D.; Babin, M.; Berthon, J.-F.; Bricaud, A.; Gentili, B.; Loisel, H.; Maritorena, S.; Stramski, D. Shedding light on the sea: André Morel’s legacy to optical oceanography. Annu. Rev. Mar. Sci. 2014, 6, 1–21. [Google Scholar] [CrossRef][Green Version]
- Zhang, J.; Li, W.; Zhang, P.; Zhang, X.; Wang, J.; Wang, L.; Chen, K.; Fang, Y.; Zhang, K. Effect of Supplementary Light with Different Wavelengths on Anthocyanin Composition, Sugar Accumulation and Volatile Compound Profiles of Grapes. Foods 2023, 12, 4165. [Google Scholar] [CrossRef]
- Clark, B., Jr.; Chamblee, T. Acid-catalyzed reactions of citrus oils and other terpene-containing flavors. In Developments in Food Science; Elsevier: Amsterdam, The Netherlands, 1992; Volume 28, pp. 229–285. [Google Scholar]
- Marais, J.; Van Wyk, C.J.; Rapp, A. Effect of Storage Time, Temperature and Region on the Levels of 1,1,6-Trimethyl-1,2-dihydronaphthalene and Other Volatiles, and on Quality of Weisser Riesling Wines. S. Afr. J. Enol. Vitic. 1992, 13, 33–44. [Google Scholar] [CrossRef][Green Version]
- Lytra, G.; Cameleyre, M.; Tempere, S.; Barbe, J.-C. Distribution and organoleptic impact of ethyl 3-hydroxybutanoate enantiomers in wine. J. Agric. Food Chem. 2015, 63, 10484–10491. [Google Scholar] [CrossRef]
- de Esteban, M.L.G.; Ubeda, C.; Heredia, F.J.; Catania, A.A.; Assof, M.V.; Fanzone, M.L.; Jofre, V.P. Impact of closure type and storage temperature on chemical and sensory composition of Malbec wines (Mendoza, Argentina) during aging in bottle. Food Res. Int. 2019, 125, 108553. [Google Scholar] [CrossRef]


| Array No. | Sensor | Specificity | Reference/Sensitivity |
|---|---|---|---|
| S1 | W1C | Aromatic | Toluene, 10 mg/kg |
| S2 | W5S | Broad range, nitrogen oxides | NO2, 1 mg/kg |
| S3 | W3C | Aromatic compounds | Benzene, 10 mg/kg |
| S4 | W6S | Hydrogen | H2, 0.1 mg/kg |
| S5 | W5C | Arom-aliph, alkenes | Propane, 1 mg/kg |
| S6 | W1S | Broad range, methane | CH3, 100 mg/kg |
| S7 | W1W | Sulphur-organic | H2S, 1 mg/kg |
| S8 | W2S | Broad range, alcohols | CO, 100 mg/kg |
| S9 | W2W | Sulph-chlor | H2S, 1 mg/kg |
| S10 | W3S | Methane-aliph | CH3, 100 mg/kg |
| Confusion Matrix for the Training Samples | ||||
| from\to | Cellar | Sea | Total | % correct response |
| Cellar | 34 | 0 | 34 | 100% |
| Sea | 2 | 32 | 34 | 94% |
| Total | 36 | 32 | 68 | 97% |
| Confusion Matrix for the Cross-Validation Results | ||||
| from\to | Cellar | Sea | Total | % correct response |
| Cellar | 33 | 1 | 34 | 97% |
| Sea | 2 | 32 | 34 | 94% |
| Total | 35 | 33 | 68 | 96% |
| S | C | |
|---|---|---|
| Ethanol (% v/v) | 26.27 ± 0.12 a | 26.10 ± 0.10 a |
| Total acidity (g/L) | 3.23 ± 0.14 a | 3.21 ± 0.15 a |
| Volatile acidity (g/L) | 0.21 ± 0.01 a | 0.215 ± 0.01 a |
| pH | 3.66 ± 0.01 a | 3.66 ± 0.02 a |
| L* | 26.16 ± 0.15 a | 25.57 ± 0.74 a |
| a* | −2.61 ± 0.51 a | −3.51 ± 1.52 a |
| b* | 4.59 ± 0.59 b | 5.97 ± 1.19 a |
| Compound | S | C | Odour Descriptor |
|---|---|---|---|
| Alcohols | |||
| 2-butanol | 27.56 ± 4.49 b | 42.90 ± 7.23 a | |
| 1-propanol | 135.67 ± 7.83 a | 144.70 ± 27.88 a | musty |
| isobutanol | 1054.93 ± 57.68 a | 1126.95 ± 196.66 a | solvent |
| 1-butanol | 37.56 ± 5.39 a | 37.11 ± 5.81 a | grass |
| isoamyl alcohol | 10,742.29 ± 505.37 a | 11,258.87 ± 1265.26 a | grass |
| acetol | 306.81 ± 30.39 a | 275.92 ± 23.92 a | caramel |
| 1-hexanol | 136.29 ± 12.58 a | 142.52 ± 14.59 a | green grass, herbaceous |
| 1-octanol | 28.63 ± 1.72 a | 29.86 ± 4.89 a | waxy |
| 1,2-propanediol | 1122.51 ± 71.08 a | 938.79 ± 172.56 a | |
| (S)-2,3-butanediol | 22.37 ± 3.18 | 28.80 ± 5.56 a | butter, creamy |
| Ʃ | 13,614.61 ± 557.03 a | 14,026.42 ± 1600.96 a | |
| Esters | |||
| ethyl butanoate | 90.73 ± 7.45 a | 97.19 ± 11.96 a | kiwi |
| ethyl 2-methylbutanoate | 27.15 ± 3.35 a | 29.31 ± 4.37 a | red fruits |
| ethyl 3-methylbutanoate | 50.51 ± 4.55 a | 52.15 ± 6.85 a | exotic fruits, apple |
| ethyl pentanoate | 16.37 ± 0.90 a | 16.66 ± 0.86 a | apple, pineapple |
| ethyl hexanoate | 593.32 ± 21.82 a | 629.17 ± 54.36 a | apple |
| ethyl heptanoate | 35.34 ± 3.00 a | 38.70 ± 5.21 a | berry |
| ethyl lactate | 870.80 ± 141.95 a | 908.45 ± 105.25 a | creamy |
| ethyl octanoate | 3497.06 ± 253.41 a | 3788.18 ± 240.31 a | pineapple |
| ethyl nonanoate | 67.33 ± 2.32 a | 53.69 ± 9.19 a | winey, rose, waxy |
| ethyl decanoate | 5540.53 ± 523.35 a | 5773.04 ± 488.70 a | flower, fruity, brandy |
| diethyl succinate | 2759.65 ± 451.36 a | 2972.92 ± 321.93 a | winey |
| ethyl 3-hydroxybutanoate | 12.03 ± 1.42 b | 16.09 ± 0.93 a | grape |
| ethyl dodecanoate | 1472.44 ± 138.31 a | 1344.32 ± 103.17 a | waxy |
| diethyl malate | 181.68 ± 14.94 a | 193.91 ± 28.38 a | brown sugar |
| ethyl tetradecanoate | 826.00 ± 128.93 a | 770.88 ± 71.03 a | |
| ethyl hexadecanoate | 797.42 ± 127.94 a | 905.93 ± 48.28 a | |
| Ʃ | 16,838.38 ± 722.01 a | 17,590.59 ± 842.84 a | |
| Acetates | |||
| ethyl acetate | 6023.61 ± 377.97 a | 6388.64 ± 914.32 a | apple |
| isoamyl acetate | 813.62 ± 26.25 a | 867.54 ± 88.46 a | banana |
| phenylacetate | 22.43 ± 0.71 a | 22.74 ± 0.20 a | pear, fruity |
| Ʃ | 6859.65 ± 404.00 a | 7278.93 ± 1002.29 a | |
| Ketones and lactones | |||
| acetoin | 56.13 ± 6.76 a | 52.58 ± 9.52 a | buttery, butterscotch |
| γ-butyrolactone | 107.59 ± 14.48 a | 84.07 ± 10.77 a | musty |
| 2-hydroxy-γ-butyrolactone | 144.16 ± 14.58 a | 121.61 ± 17.74 a | |
| γ-nonalactone | 197.80 ± 23.99 a | 214.94 ± 13.61 a | coconut, peach |
| Ʃ | 505.68 ± 18.15 a | 473.20 ± 37.99 a | |
| Terpenes | |||
| D-limonene | 210.34 ± 22.80 a | 225.67 ± 4.64 a | lemon |
| o-cymol | 84.40 ± 11.95 a | 87.17 ± 7.48 a | |
| 4-terpineol | 164.86 ± 24.69 b | 268.79 ± 43.83 a | earthy, woody |
| α-terpineol | 86.19 ± 11.65 a | 90.51 ± 9.85 a | minty |
| Ʃ | 545.79 ± 47.80 a | 672.15 ± 64.33 a | |
| Norisoprenoids | |||
| TDN | 15.82 ± 2.58 a | 12.60 ± 2.19 a | kerosene |
| α-ionone | 88.23 ± 4.71 a | 98.47 ± 8.51 a | floral, iris, violet |
| Ʃ | 104.05 ± 6.93 a | 111.07 ± 9.48 a | |
| Volatile acids | |||
| acetic acid | 2152.90 ± 228.52 a | 2011.60 ± 179.67 a | |
| hexanoic acid | 55.01 ± 4.84 a | 56.09 ± 4.05 a | cheesy |
| octanoic acid | 245.44 ± 22.13 a | 292.91 ± 46.69 a | cheese |
| decanoic acid | 904.78 ± 99.82 a | 826.26 ± 128.59 a | dusty |
| dodecanoic acid | 245.71 ± 12.09 a | 242.72 ± 23.22 a | |
| Ʃ | 4021.43 ± 440.09 a | 3770.83 ± 415.33 a | |
| Furans | |||
| furfural | 5092.93 ± 521.56 a | 4771.09 ± 605.35 a | woody |
| 2-acetylfuran | 56.19 ± 8.17 a | 48.11 ± 8.10 a | caramel |
| 5-methylfurfural | 426.11 ± 68.60 a | 394.99 ± 70.87 a | caramel-like |
| 2-furanmethanol | 1790.75 ± 95.56 a | 1558.41 ± 171.04 a | bready |
| 2,5-furandicarboxaldehyde | 816.47 ± 79.99 a | 893.80 ± 161.82 a | oak, wood, toasted |
| 5-acetoxymethyl-2-furaldehyde | 155.38 ± 24.38 a | 158.41 ± 33.21 a | bready |
| 5-hydroxymethylfurfural | 26,666.73 ± 848.54 a | 21,509.12 ± 2823.61 b | caramel |
| Ʃ | 35,004.56 ± 1111.89 a | 29,333.94 ± 3524.24 a | |
| Aromatics | |||
| benzaldehyde | 148,693.62 ± 9690.30 a | 156,181.48 ±187,15.58 a | almond |
| 2-etoxy-2-phenyl acetophenone | 764.69 ± 79.84 a | 891.78 ± 77.47 a | |
| o-tolualdehyde | 56.94 ± 9.38 a | 55.49 ± 1.96 a | cherry |
| p-tolualdehyde | 95.76 ± 13.66 a | 99.61 ± 2.93 a | fruity |
| acetophenone | 57.84 ± 7.17 a | 53.08 ± 6.43 a | acacia honey |
| ethyl benzoate | 54.90 ± 1.81 a | 59.93 ± 3.76 a | |
| ethylphenylacetate | 72.82 ± 7.31 a | 81.66 ± 8.18 a | floral |
| 4,5-dimethyl-2-phenyl-1,3-dioxolan | 789.34 ± 72.40 a | 840.39 ± 77.89 a | |
| anethol | 119.58 ± 21.96 a | 87.73 ± 4.37 b | liquorice |
| benzyl alcohol | 118.27 ± 3.65 a | 132.53 ± 24.50 a | floral |
| 2-phenylethanol | 2706.61 ± 449.13 a | 2897.50 ± 348.67 a | rose |
| [E]-cinnamaldehyde | 56.97 ± 7.44 a | 73.77 ± 10.30 a | cinnamon |
| eugenol | 5746.40 ± 695.15 a | 6129.99 ± 945.37 a | clove |
| 4-ethylphenol | 41.20 ± 4.99 a | 36.17 ± 4.00 a | smoky |
| isoeugenol | 164.75 ± 19.75 a | 184.33 ± 24.06 a | clove |
| benzoic acid | 489.38 ± 81.38 a | 402.95 ± 69.75 a | faint, urine |
| Ʃ | 160,029.06 ± 107,35.22 a | 168,208.39 ± 20,090.59 a | |
| Furanones and pyranones | |||
| 2-hydroxy-ciclopenten-1-one | 273.58 ± 46.15 a | 236.24 ± 34.85 a | maple, caramel-like |
| furaneol | 117.63 ± 10.47 a | 104.65 ± 15.79 a | strawberry |
| maltol | 292.45 ± 23.10 a | 251.28 ± 33.25 a | caramel |
| 2H-pyran-2,6-(5H)-dione | 179.35 ± 7.98 a | 161.65 ± 24.60 a | |
| homofuraneol | 145.25 ± 11.57 a | 136.97 ± 25.40 a | caramel |
| 3,5-dihydroxy-6-methyl-2,3-dihydro-4H-pyran-4-one | 2139.81 ± 50.71 a | 1714.47 ± 132.73 b | |
| hydroxymaltol | 208.38 ± 34.54 a | 207.07 ± 32.02 a | |
| 4-hydroxydihydro-2-(3H)-furanone | 542.62 ± 18.41 a | 459.65 ± 28.88 b | |
| Ʃ | 3899.05 ± 126.58 a | 3271.99 ± 228.05 b | |
| Others | |||
| acetaldehyde | 133.97 ± 18.10 a | 143.04 ± 28.57 a | fruity |
| 3-methylthio-1-propanol | 10.69 ± 0.74 a | 11.20 ± 1.99 a | potato, garlic |
| safrene | 67.75 ± 7.45 a | 69.01 ± 10.98 a | |
| Ʃ | 212.41 ± 18.34 a | 223.26 ± 39.49 a |
Disclaimer/Publisher’s Note: The statements, opinions and data contained in all publications are solely those of the individual author(s) and contributor(s) and not of MDPI and/or the editor(s). MDPI and/or the editor(s) disclaim responsibility for any injury to people or property resulting from any ideas, methods, instructions or products referred to in the content. |
© 2025 by the authors. Licensee MDPI, Basel, Switzerland. This article is an open access article distributed under the terms and conditions of the Creative Commons Attribution (CC BY) license (https://creativecommons.org/licenses/by/4.0/).
Share and Cite
Balivo, A.; D’Auria, G.; Ferranti, P.; Cepollaro, A.; Velotto, S.; Sacchi, R.; Genovese, A. Impact of Underwater Aging on the Volatile and Phenolic Compounds of Campania Wine-Based Liqueurs “Elixir Falernum”. Beverages 2025, 11, 43. https://doi.org/10.3390/beverages11020043
Balivo A, D’Auria G, Ferranti P, Cepollaro A, Velotto S, Sacchi R, Genovese A. Impact of Underwater Aging on the Volatile and Phenolic Compounds of Campania Wine-Based Liqueurs “Elixir Falernum”. Beverages. 2025; 11(2):43. https://doi.org/10.3390/beverages11020043
Chicago/Turabian StyleBalivo, Andrea, Giovanni D’Auria, Pasquale Ferranti, Alessia Cepollaro, Salvatore Velotto, Raffaele Sacchi, and Alessandro Genovese. 2025. "Impact of Underwater Aging on the Volatile and Phenolic Compounds of Campania Wine-Based Liqueurs “Elixir Falernum”" Beverages 11, no. 2: 43. https://doi.org/10.3390/beverages11020043
APA StyleBalivo, A., D’Auria, G., Ferranti, P., Cepollaro, A., Velotto, S., Sacchi, R., & Genovese, A. (2025). Impact of Underwater Aging on the Volatile and Phenolic Compounds of Campania Wine-Based Liqueurs “Elixir Falernum”. Beverages, 11(2), 43. https://doi.org/10.3390/beverages11020043