Article

Discrimination of Romanian Wines Based on Phenolic Composition and Identification of Potential Phenolic Biomarkers for Wine Authenticity and Traceability

by
Corina-Teodora Ciucure
,
Marius Gheorghe Miricioiu
and
Elisabeta-Irina Geana
*
National R&D Institute for Cryogenics and Isotopic Technologies—ICSI Ramnicu Valcea, 4th Uzinei Street, 240050 Ramnicu Valcea, Romania
*
Author to whom correspondence should be addressed.
Beverages 2025, 11(2), 44; https://doi.org/10.3390/beverages11020044
Submission received: 9 December 2024 / Revised: 22 February 2025 / Accepted: 6 March 2025 / Published: 25 March 2025

Abstract

:
Demonstrating the authenticity and traceability of quality wines based on parameters that reflect their composition and provenance contributes to protecting wine authenticity and to increasing consumer confidence in moderate wine consumption, which is associated with numerous health-promoting properties. A wine’s phenolic fingerprint is increasingly used to assess its authenticity, even though wine phenolic composition is influenced by genetic and environmental factors, as well as vineyard management and enological practices, and storage conditions. This study presents a comprehensive analysis of the bioactive characteristics (total polyphenols—TPs, total flavonoids—TFs, antioxidant activity—AA, and total anthocyanins—TAs) by spectrophotometric analysis and phenolic compound profile (by UHPLC-HRMS analysis) of 19 white and 21 red wines with a Protected Designation of Origin (PDO) from four vineyards located in the wine-growing region of Oltenia, Romania. Multivariate statistical analysis, specifically principal component analysis and heat map analysis, applied to analytical data, enables the discrimination of wines based on grape variety and terroir, and across four consecutive vintages (2019–2022). The phenolic profiles of the wines obtained under standardized winemaking conditions depend on the climatic data specific to each harvest year (temperature, precipitation, duration of sun exposure during grape berry phenological stages, and ripening). The phenolic biomarkers of red wines, such as epicatechin, catechin, gallic, caffeic, t-ferulic acids, t-resveratrol and hesperidin, represent specific biomarkers of warmer and sunnier harvest years with lower precipitation, as observed in the 2021 harvest year. Additionally, our results contribute to the identification of specific phenolic biomarkers for geographical and varietal discrimination, as well as to the promotion of high-quality wines produced in a renowned wine-growing region of Romania.

1. Introduction

According to legal definitions worldwide, including European Union legislation (Reg. EU 1308/2013) and the International Organization of Vine and Wine (OIV) regulations, wine is defined as a “beverage obtained exclusively from the total or partial alcoholic fermentation of fresh grapes, whether crushed or not, or of grape must”. Wine, renowned as one of the oldest and most consumed alcoholic beverages in the world, exhibits a complex composition and aroma influenced by the “terroir” (climate and soil characteristics), grape varieties, and the management of vineyards and wineries [1,2], all of which contribute to its distinctive qualities and economic value. Thus, the geographic characteristics play a significant role in defining the wine appellation system adopted in the EU and other winemaking regions, which classifies wines into three main categories: (i) wines without a designation of origin, (ii) wines with a protected geographical indication (PGI), and (iii) wines with a protected designation of origin (PDO) [3,4].
Compared to other alcoholic beverages, such as spirits, wine has a complex chemical composition. In addition to water and ethanol, it contains numerous primary and secondary metabolites, including organic acids, sugars, phenolic compounds, aromatic compounds, minerals, and enzymes [5]. Polyphenols are the most important phytochemicals in grapes and wines [6], being responsible for numerous biological activities and health benefits [7,8] due to their antioxidant properties and capacity to neutralize free radicals [9,10]. Additionally, polyphenols play a pivotal role in determining the sensory properties of wine, contributing to its flavor, astringency, bitterness, overall taste, and color [5]. The phenolic composition of grapes and their corresponding wines is influenced by factors such as the species (Vitis vinifera, Vitis labrusca, and Vitis rotundifolia), grape variety [11,12], environmental factors (soil, climate), and agricultural practices. Moreover, in the case of wine, it also depends on the winemaking technology (maceration, fermentation) and wine aging conditions [13].
Among polyphenols, phenolic acids (hydroxybenzoic acids and hydroxycinnamic acids), flavan-3-ols, flavonols, anthocyanins, and stilbenes are the main representatives in wines. They originate in grapes or result from chemical and biochemical reactions during fermentation and aging [2,14]. In red wine vinification, the must is fermented together with the grape skins, seeds, and pulp, whereas white wine is produced by fermenting only the grape juice without the grape skins [12,15]. Consequently, tannins and anthocyanins are the predominant polyphenols in red wines, while phenolic acids are more abundant in white wines [12,16].
The quantification and characterization of polyphenols in wine are important for understanding their impact on wine color, organoleptic properties, aging potential, and health benefits. Polyphenol detection, characterization, and quantification in wine can be performed by chromatographic techniques coupled with various detection methods (diode array, mass spectrometry, chemiluminescence, fluorescence, or electrochemical) and spectroscopic techniques such as ultraviolet–visible spectroscopy (UV–Vis), Fourier transform infrared spectroscopy (FTIR), nuclear magnetic resonance (NMR), and Raman spectroscopy [17].
As wine is a high-value product consumed worldwide, it often targeted by fraudulent practices, including false declarations of geographical origin, grape variety, or production year, as well as the addition of undeclared constituents and/or dilution with water in the production process [3,4]. Beyond economic losses, wine adulteration compromises its antioxidant potential and may pose health risks to consumers [18]. Consequently, ensuring the authenticity and traceability of wine is a major concern for the wine industry, consumers, and also for public authorities. To combat fraud in the wine industry, it is imperative to implement reliable methodologies to ensure the authenticity of wine—necessary to demonstrate wine quality and safety for consumers—and also traceability, which establishes the wine’s origin and composition through specific documents [19,20]. These methodologies involve the integration of analytical techniques with advanced multivariate analysis (MVA) [3,21].
Traditional analytical methods used to assess wine quality and authenticity involve multidisciplinary approaches, based on the official methods published in the OIV Compendium of International Methods of Analysis of Wines and Musts [22]. These methods are considered in cases of verification and dispute resolution. They focus on the investigation of wine composition in terms of alcoholic strength; total and volatile acidity; total and free sulfur dioxide; reducing sugars; volatile compounds; organic acids; minerals; ethanol origin by isotope ratio mass spectrometry (IRMS) and ethanol deuterium distribution by NMR; the presence of artificial sweeteners; colorants and preservatives [20,22]. Regarding the use of polyphenols for wine authenticity assessment, the OIV recommends determining the Folin–Ciocalteu index, analyzing nine major anthocyanins in red and rosé wines, as well as the identification of the presence of malvidin diglycoside, which is characteristic of hybrid varieties [22].
Polyphenols have been proposed as chemical markers to establish wine authenticity in terms of geographical origin [2,23], grape variety [24,25,26], winemaking techniques [23,27], vintage year and aging [1]. Nowadays, emerging platforms, including mass spectrometry (MS) and nuclear magnetic resonance (NMR) metabolomics, are considered current trends in wine authenticity studies [23,28]. Metabolomic studies applied in wine authentication can be categorized into two main approaches: (i) a targeted approach which focuses on the detection, identification, and quantification of a single marker or a small set of markers, to confirm wine authenticity or detect adulteration and (ii) a non-targeted or untargeted approach based on a chemical ‘fingerprint’ of wines, with similarities and differences being used for wine classification through various chemometric methods [29,30].
The most popular method used as unsupervised data analysis is principal component analysis (PCA) [30,31]. However, when the focus is on supervised models, partial least squares discriminant analysis (PLS-DA) emerges as the most extensively explored tool [2,3].
The classification of Romanian wines according to the geographical origin, grape variety, production year, and quality was performed based on the analytical data related to the elemental profile [32,33], isotopic fingerprints [34], various classes of organic compounds, including phenolic compounds [33], anthocyanins, organic acids, amino acids and sugars [34,35]. Spectroscopic [36,37,38,39] and electrochemical [40,41] fingerprints were coupled with multivariate statistical analysis (PCA, LDA, ANOVA, AHC) to interpret the analytical data.
The objective of this work was to expand upon our previous research onto the use of metabolic profiles and stable isotope signatures to discriminate red and white wines obtained in different wineries located in four neighboring localities with similar agro-climatic conditions [34], with additional information on the phenolic composition and the bioactive characteristics of the wines. Furthermore, the study aimed to develop strategies to discriminate white and red wines from Drăgășani and Sâmburești vineyards from the Oltenia and Muntenia Hills wine-growing region, in the southwestern region of Romania. The datasets related to the wine bioactive characteristics and phenolic compounds were statistically processed using principal component analysis (PCA) and heat map analysis in order to discriminate the white and red wines by geographic origin, grape variety and harvest year. Additionally, we performed the differentiation of wines originating from the Oltenia region from the wines from other Romanian wine-growing regions, followed by the discrimination of the Romanian wines from wines originating from Southeastern European countries in order to highlight the particularities of Romanian wines.

2. Materials and Methods

2.1. Study Area and Wine Samples

The wines investigated in this paper are dry and semi-dry wines with protected designation of origin obtained in five wineries located in the southwestern region of Romania, specifically Dragasani and Samburesti vineyards from the Oltenia and Muntenia Hills wine-growing region. The wineries were located in four neighboring localities (Drăgășani—D, Sâmburești—S, Spârleni—Sp and Dobrușa—Do) (Figure 1). The investigated white wine varieties were Sauvignon Blanc (SB) (VIVC number 10790), Crâmpoșie Selecționată (CSe) (VIVC number 3238), Chardonnay (CH) (VIVC number 9272) and Fetească Regală (FR) (VIVC number 4121), while the varieties of red wines included Merlot (M) (VIVC number 7657), Cabernet Sauvignon (CS) (VIVC number 12520), Fetească Neagră (FN) (VIVC number 4120) and Negru de Drăgășani (ND) (VIVC number 23178). All wine samples were produced on a medium scale (batches of 5000–10,000 kg) from fully matured grapes. The wines (19 white and 21 red wines) were obtained under standardized winemaking conditions (harvesting, crushing and pressing, juice separation (only for white wines), fermentation, clarification, aging and bottling), in four successive years, 2019, 2020, 2021 and 2022. Saccharomyces yeasts such as Saccharomyces ellipsoideus, Saccharomyces oviformis, Saccharomyces bayanus were used in the fermentation process. The supervision and management of the fermentation was achieved through permanent temperature control. In the case of white wines, the clarified must was fermented at 18 °C, for a period of 20 days, while for red wines, the maceration and alcoholic fermentation were conducted at 28 °C for a period of 14 days. For the red wines, the malolactic fermentation was performed in stainless steel containers for a period of 6 months. Clarification was performed using substances for enological use such as bentonite, to eliminate protein substances, ferric and colloidal precipitations. At the end of fermentation, the wines were bottled and labeled. A detailed description of the investigated wines is presented in Table 1. The wines were transported to the laboratory, sampled in 15 mL tubes and stored at 4 °C in a refrigerator until the analysis.

2.2. Chemicals

All the reagents used for the determination of the wine bioactive characteristics by quantitative UV–Vis methods (anhydrous sodium carbonate, aluminum chloride, sodium acetate, sodium acetate trihydrate, hydrochloric acid, methanol, ethanol 96%) were of analytical grade and were obtained from Merck (Darmstadt, Germany). Folin–Ciocalteu reagent, 2-2-diphenyl-1-picryl-hydrazyl (DPPH), trolox ((±)-6-hydroxy-2, 5, 7, 8-tetramethylchroman-2-carboxylic acid), gallic acid and quercetin were purchased from Sigma-Aldrich Corp (Steinheim, Germany). Ultrapure water produced by a Milli-Q Millipore system (Bedford, MA, USA) was used to prepare aqueous solutions.
For the analysis of individual phenolic compounds, several reference materials were purchased from Sigma-Aldrich (Steinheim, Germany). These compounds belong to different classes, including phenolic acids (gallic, tannic, caffeic, 3,4-dihydroxybenzoic, chlorogenic, p-hydroxybenzoic, ellagic, p-coumaric, abscisic and t-ferulic), flavonoids (hesperidin, (+)-catechin, (−)-epicatechin, rutin, quercetin, isorhamnetin, myricetin, kaempferol, naringin) and stilbenes (t-resveratrol). Methanol was used to prepare the multielement stock solutions. The calibration curves were established based on the working standards obtained by successively diluting the stock solutions in a mixture of 80:20 (v/v) water and methanol. Both the working standards and the stock solution were stored at 4 °C until injection into the analytical equipment.

2.3. Analytical Determination

2.3.1. Wine Bioactive Characteristics by UV–Vis Spectrophotometric Determinations

The spectrophotometric measurements of the wines (total polyphenols—TPs, total flavonoids—TFs, antioxidant activity—AA and total anthocyanins—TAs) were performed using a UV–Vis spectrophotometer Specord 250 Plus (Analytic Jena, Jena, Germany), equipped with 1 cm quartz cells. All analyses were carried out in duplicate and the average was reported.
Total polyphenols (TPs) were quantified using the Folin–Ciocalteu method based on a previously optimized protocol presented by Geana et al. [42]. For this, 100 µL of wine, 5 mL of water and 100 µL of Folin–Ciocalteau reagent were added in a test tube, shaken vigorously and left in the dark at room temperature for 5 min. In order to stop the reaction, 300 µL of 20% sodium carbonate was added in order to promote the development of the specific blue color. The test tubes were left in the dark for 2 h and then the absorbance was read at a wavelength of 756 nm. For the control sample, ultrapure water was used. Quantification was performed using a calibration curve prepared with gallic acid (0–1250 mg/L) as a reference material. The final results were expressed as mg gallic acid equivalent (GAE) per liter (mg GAE/L).
Total flavonoids (TFs) in the wines were analyzed by the AlCl3 protocol presented by Geana et al. [42]. This method involves mixing 0.5 mL of wine in a test tube with 0.4 mL of 25 g/L AlCl3 solution and 0.5 mL of CH3COONa solution (100 g/L), followed by the addition of 4 mL of distilled water. The reaction was allowed to complete for 15 min in the dark, then the absorbance of the reaction mixture was read at a wavelength of 430 nm. Total flavonoid (TF) content was expressed as mg quercetin equivalent per liter of wine (mg QE/L) based on a calibration curve ranging from 0 to 125 mg/L.
Antioxidant activity (AA). The DPPH free radical scavenging test was employed to assess the antioxidant activity of the wine samples following the protocol described by Geana et al. [42]. The absorbance of the radical is inversely proportional to the activity and concentration of the sample. Absorbance measurements were converted to antioxidant activity using Trolox as a standard. Experimentally, 6 mL of DPPH solution, 0.09 mg/mL in methanol were mixed with 0.25 mL aliquots of the wine sample, shaken and left in the dark at room temperature for 20 min, after which the absorbance was measured at 517 nm compared to methanol as a control. The calibration curve was made on the basis of Trolox as a standard in the measurement range of 0–2000 µmol/L, and the antioxidant activity was expressed as mmol Trolox equivalents/L.
Total anthocyanins (TAs) were quantified using the differential pH spectrophotometric method described by Lee et al. [43]. Wines were separately diluted with buffer solutions of pH 1.0 (0.025 M, potassium chloride) and pH 4.5 (0.4 M, sodium acetate), and the absorbance was measured with a spectrophotometer at two wavelengths, 510 and 700 nm. The total anthocyanin content was calculated using the following formula:
Total anthocyanins (mg MGE/L) = (A × MW × DF × 1000)/(ɛ × l)
where A = (A510 nm–A700 nm) pH 1.0; (A510 nm–A700 nm) pH 4.5; MW (molecular weight) = 493.5 g/mL for maldivin 3-O-glucoside; DF = dilution factor of the samples; (molar absorbtivity of maldivin 3-O-glucoside) = 28,000 L/(mol/cm); l = pathlength in cm. The results were expressed as milligrams of maldivin 3-O-glucoside equivalents per liter of wine (mg MGE/L).

2.3.2. Phenolic Profile by UHPLC–ESI/HRMS

Ultra-high-performance liquid chromatography combined with high resolution mass spectrometry (UHPLC-HRMS) was used for the quantitative analysis of the phenolic profile for individual bioactive compounds (phenolic acids, flavonoids, and stilbenes) using an UltiMate 3000 UHPLC system (Thermo Fisher Scientific, Bremen, Germany) coupled with a Q ExactiveTM Focus Hybrid Quadrupole—OrbiTrap mass spectrometer, equipped with HESI ionization source. For the separation of phenolic compounds, a Kinetex C18 chromatographic column (100 mm × 2.1 mm, 1.7 µm particle diameter) was used and maintained at 30 °C. Gradient elution was performed using two mobile phases, A (water with formic acid 0.1%) and B (methanol with formic acid 0.1%), at a flow rate between 0.3 and 0.4 mL/min, according to previous work [44]. The data were acquired in full negative scan mode within the m/z range of m/z 75–1000 with a power of resolution of 70,000 at m/z 200. Different isolation windows (m/z 75–205, m/z 195–305, m/z 295–405, m/z 395–505, and m/z 495–1000) were used in variable data-independent analysis MS2 (vDIA) at a resolution of 35,000. The ionization parameters were as follows: 11 and 48 arbitrary units for collision and auxiliary nitrogen, 2.5 kV applied voltage, a capillary temperature of 320 °C, and 30 eV collision energy. Data processing was performed with the Xcalibur software package (Version 4.1) (Thermo Fisher Scientific, Bremen, Germany). The phenolic compounds were identified by comparing mass spectra and retention times with those of authentic standards. Quantitative data were calculated based on the external standards method and expressed in mg/L. To ensure greater accuracy of the results, the analyses were performed in duplicate.

2.4. Statistical Analysis

To highlight the statistical differences in the bioactive composition of the selected white and red wines, the obtained data were subjected to multivariate statistical analysis, including principal component analysis (PCA) and heat map analysis using Microsoft Excel and XLSTAT 15.5.03.3707 (Addinsoft, Paris, France). The analytical data were statistically processed using analysis of variance (ANOVA), used to evaluate significant differences among wine-producing regions, grape variety and harvest year with regard to each phenolic biomarker analyzed in this study. The Duncan test was used to discriminate the wine category (p ≤ 0.05). Principal component analysis (PCA) was performed as an unsupervised statistical method to differentiate the wines by grape variety, as well as to identify the similarities and differences between datasets corresponding to different cultivation areas, thereby highlighting the specific phenolic biomarkers for each type of classification. Heat map analysis was conducted using the mean concentration values of individual phenolic compounds for white and red wines, in order to highlight potential biomarkers for differentiating the wines. Undetectable target phenolic compounds were assigned a value of zero.

3. Results and Discussion

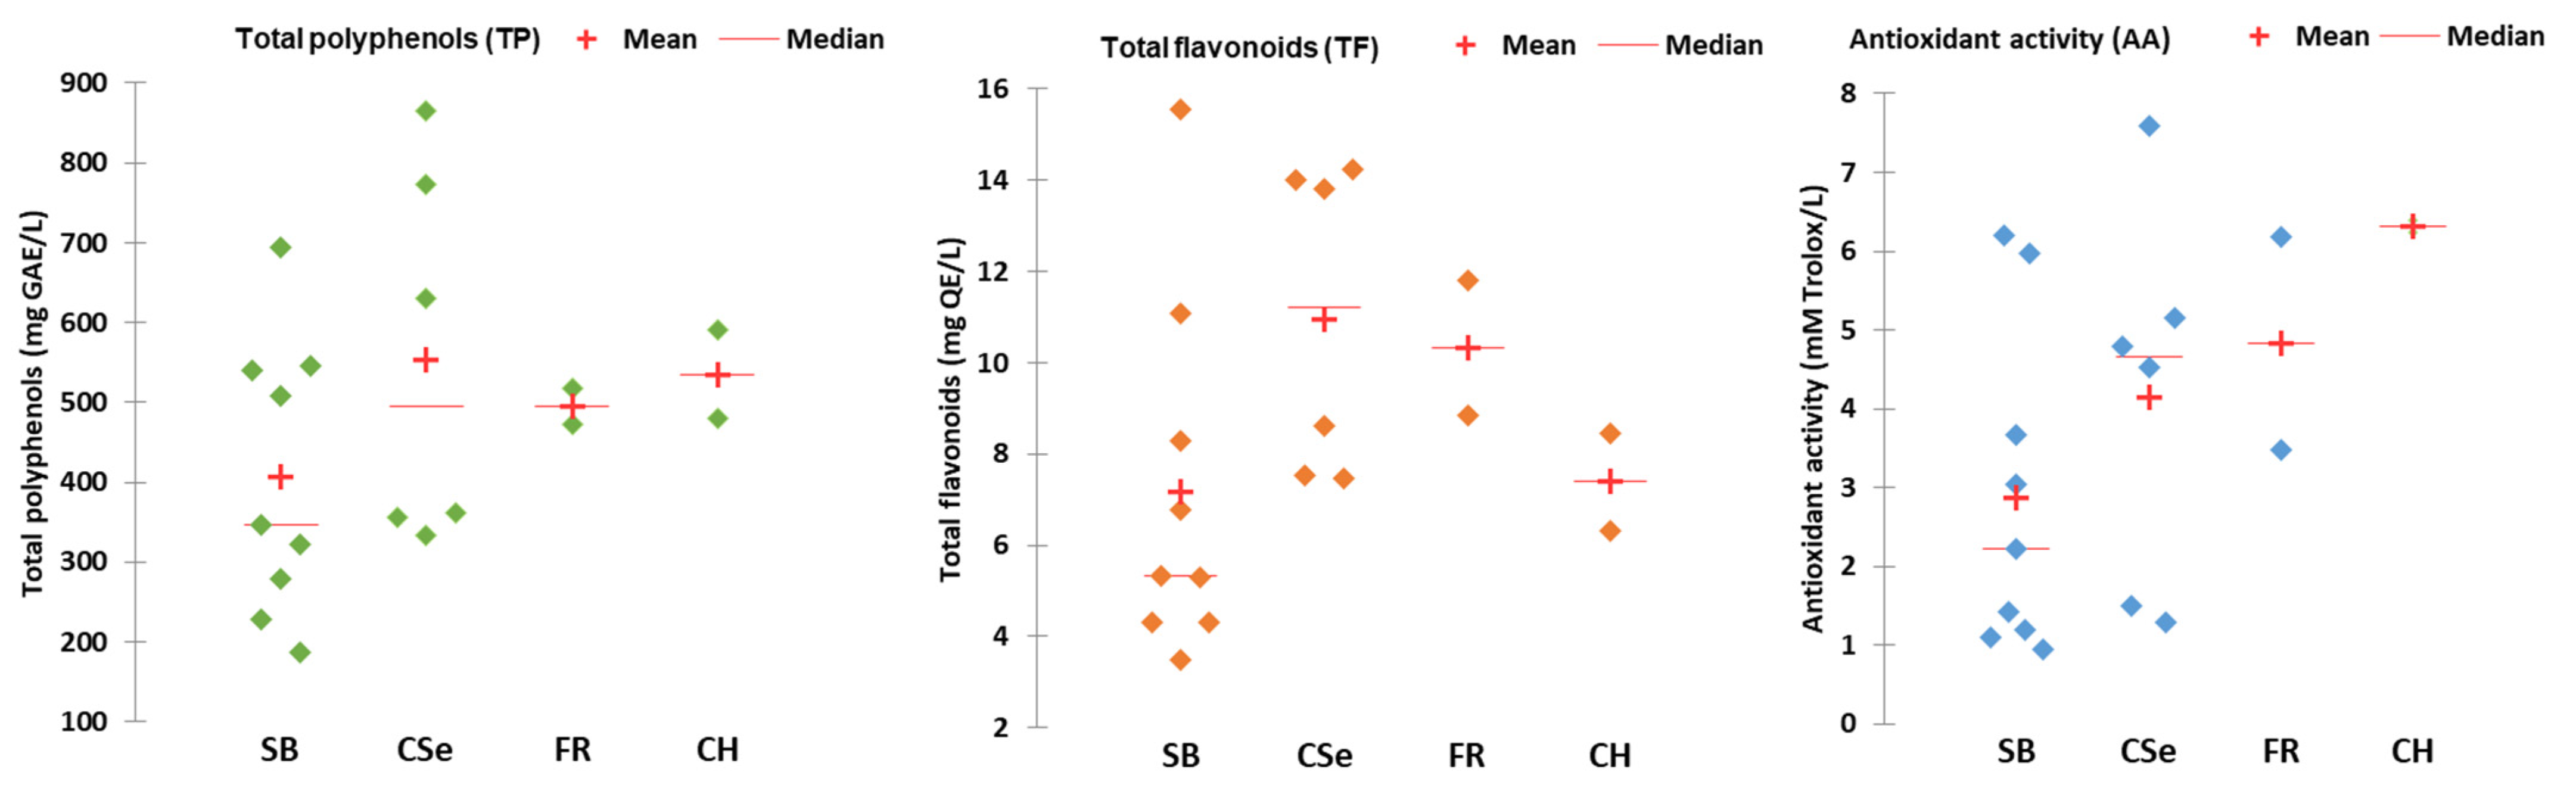
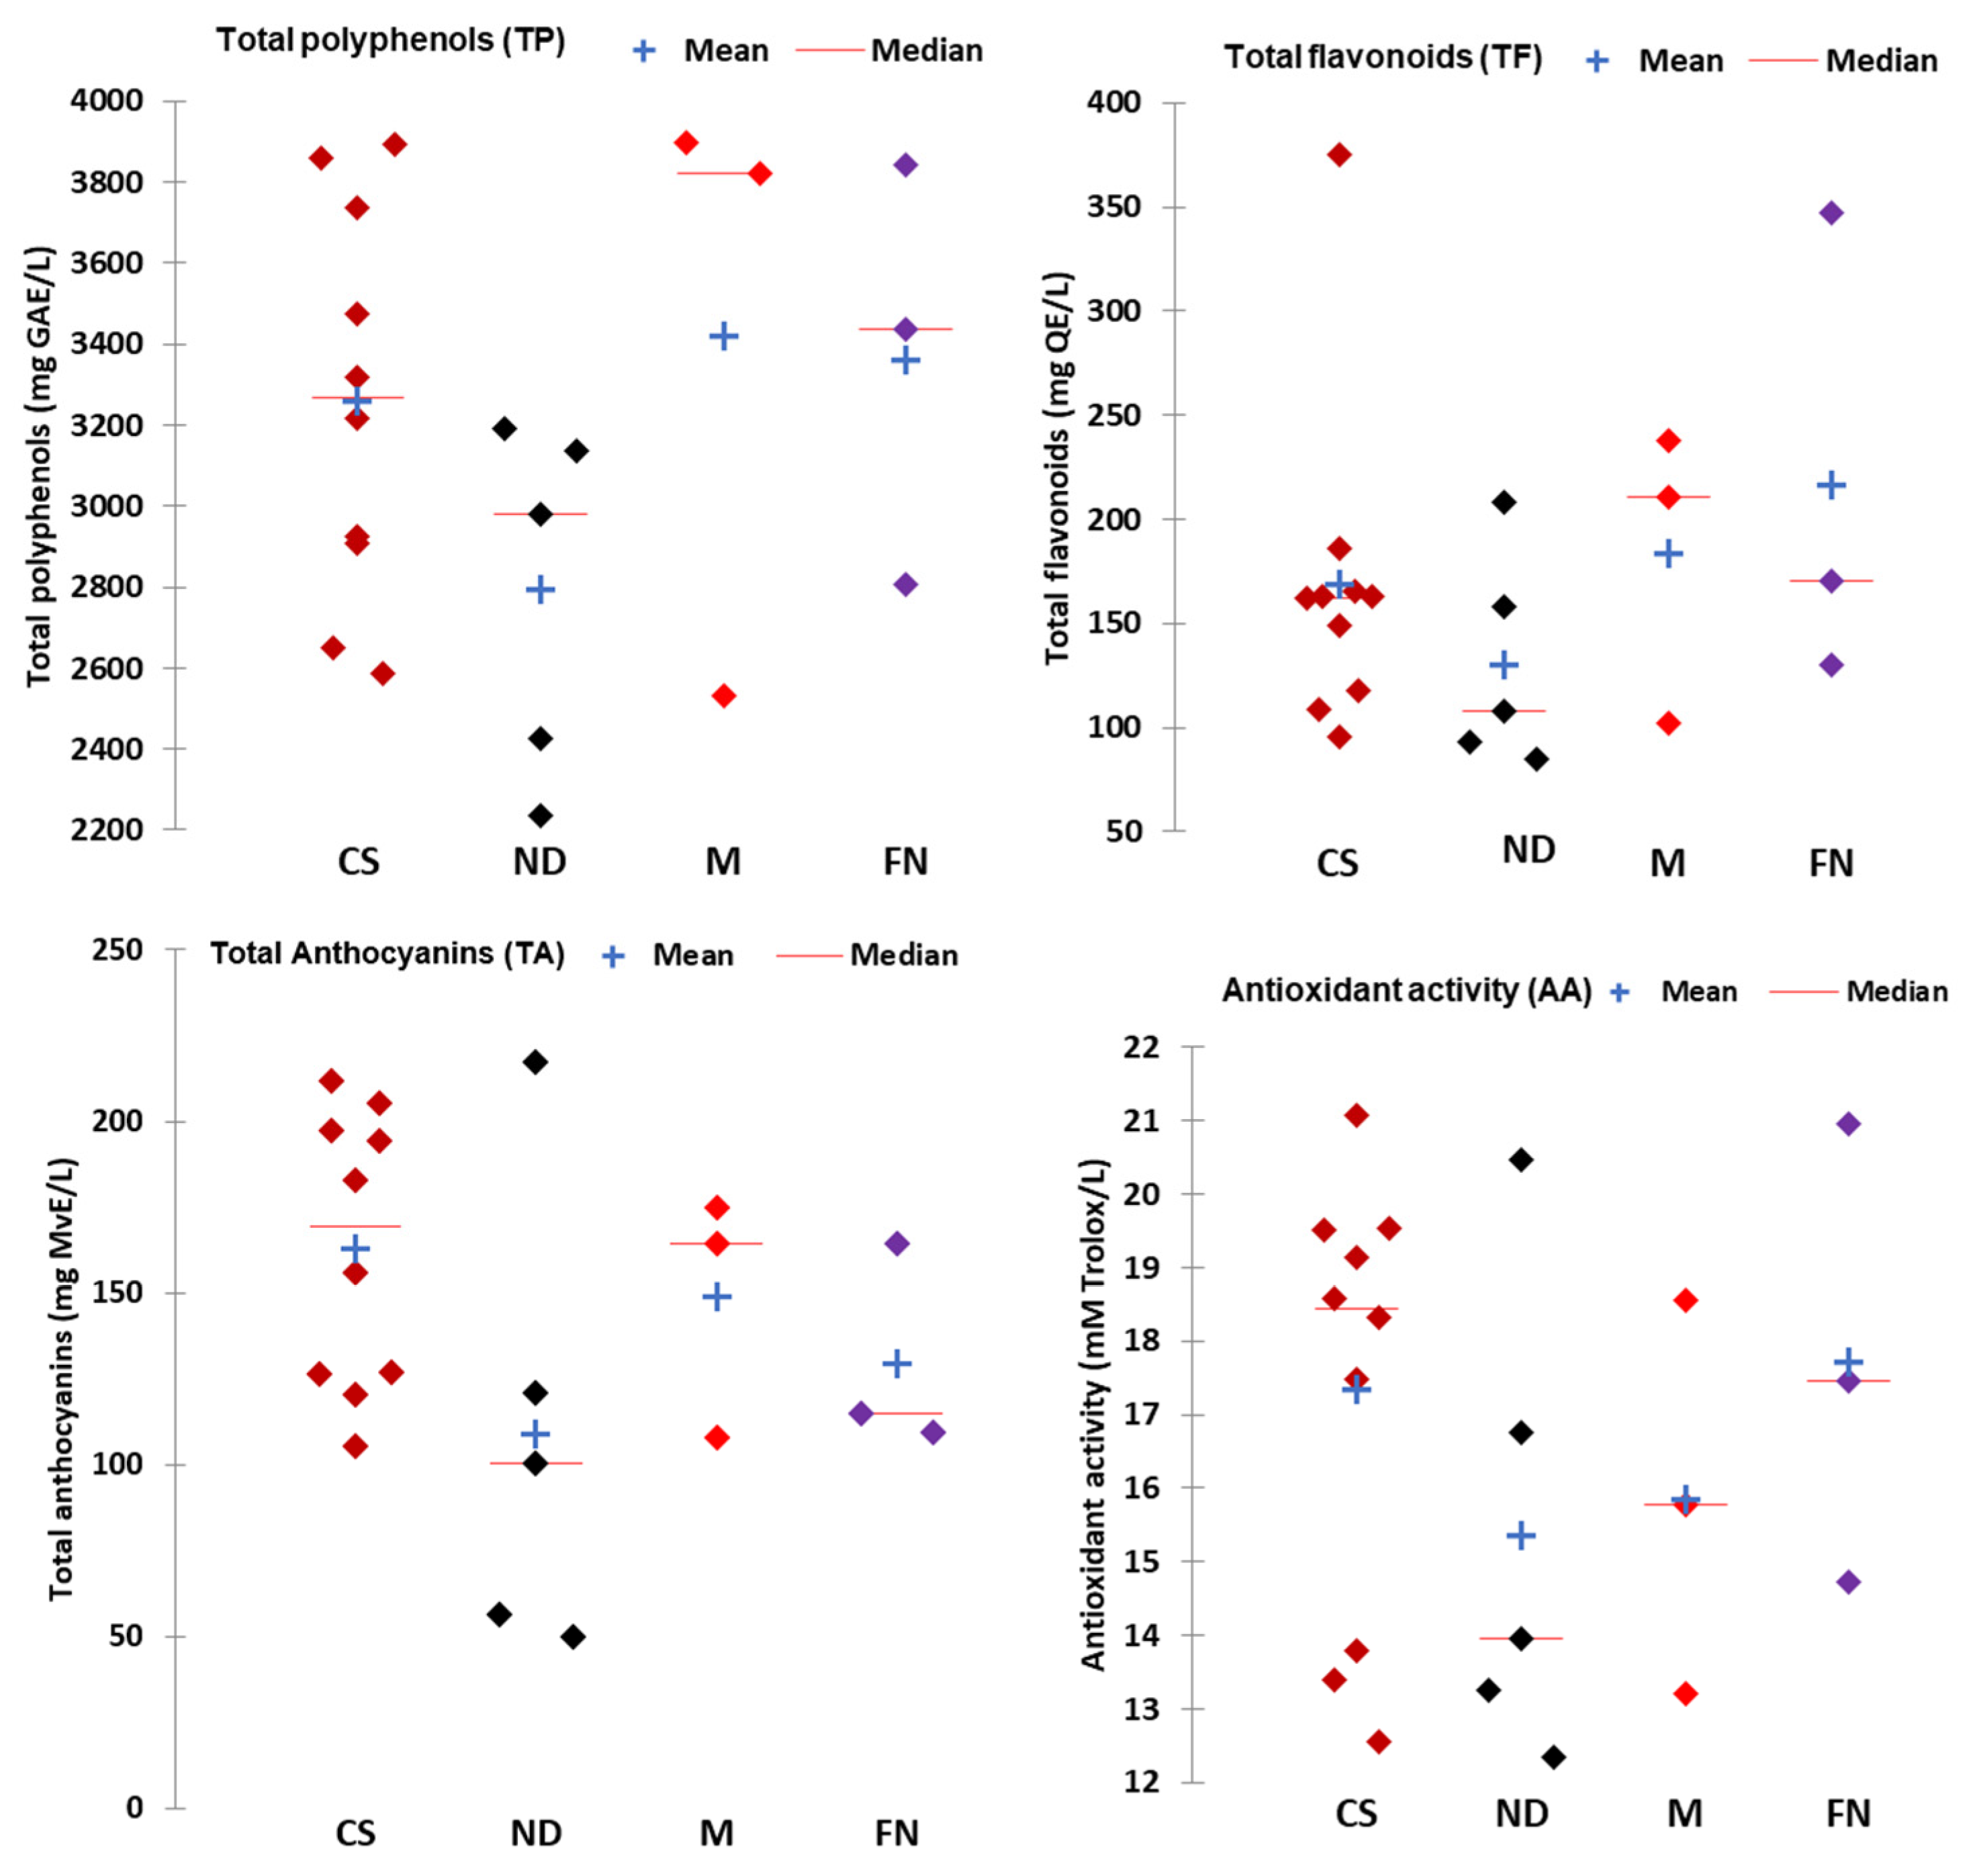
3.1. Bioactive Characteristics of White and Red Wines

Considering the heterogeneity of the investigated white and red wines, in terms of variety, region of origin and year of production, the experimental values obtained for the bioactive characteristics exhibit a wide range of variance. The variation in bioactive characteristics (TP, TF and AA) for each investigated variety is shown in Figure 2 for white wines and in Figure 3 for red wines. The total content of polyphenols (TP) in the investigated white wines ranged from 187.65 to 864.73 mg/L GAE in the case of white wines and from 2235.81 to 3898.52 mg GAE/L for red wines. Among the investigated white wine varieties, Crâmpoșia Selecționată, Chardonnay and Fetească Regală showed higher TP content compared to the Sauvignon Blanc variety, with average values of 552.93 mg GAE/L for Crâmpoșia Selecționată, 535.17 mg GAE/L for Chardonnay, 494.88 mg GAE/L for Fetească Regală and 406,06 mg GAE/L for Sauvignon Blank (Figure 2). The total flavonoids (TFs) ranged from 3.48 to 15.56 mg QE/L in white wines and from 95.85 to 347.27 mg QE/L in red wines. The Romanian wine varieties Crâmpoșia Selecționată and Fetească Regală showed higher flavonoid content compared with Sauvignon Blanc and Chardonnay wines, with average values of 10.94 mg QE/L for Crâmpoșia Selecționată, 10.32 mg QE/L for Fetească Regală, 7.39 mg QE/L for Chardonnay and 7.15 mg QE/L for Sauvignon Blanc wines. Antioxidant activity (AA) ranged from 0.94 to 7.60 mM TE in white wines and from 12.35 to 20.97 mM TE in red wines. Chardonnay wines exhibited the highest antioxidant activity with an average value of 6.39 mM TE/L, followed by Fetească Regală with 4.83 mM TE and Crâmpoșia Selecționată with 4.14 mM TE, while the Sauvignon Blanc variety had the lowest average value.
Most phenolic compounds in wines come from the skin and seeds of the grapes; therefore, red wines contain higher concentrations of phenolic compounds. The significant differences in phenolic compound content in white and red wines indicate that anthocyanins (absent in white wines), and other flavonoids except the anthocyanins, represent the most important fraction of phenolic compounds in red wines. The total anthocyanin content in red wines ranged from 49.72 to 217.03 mg MvE/L, with higher values observed in Cabernet Sauvingon and Negru de Drăgășani varieties (Figure 3).
Among the investigated red wines, Cabernet Sauvignon, Fetească Neagră and Merlot showed higher TP content compared to the Negru de Drăgășani variety (Figure 3), with average values of 3418.33 mg GAE/L for Merlot, 3362.01 mg GAE/L for Fetească Neagră, 3256.82 mg GAE/L for Cabernet Sauvignon and 2794.16 mg GAE/L for Negru de Drăgășani. Similarly, Fetaescă Neagră, Merlot and Cabernet Sauvignon wines shows higher flavonoid content compared to the Romanian variety Negru de Drăgășani, with average values of 216.02 mg QE/L for Fetească Neagră, 183.53 mg QE/L for Merlot, 168.64 mg QE/L for Cabernet Sauvignon and 130.3 mg QE/L for Negru de Drăgășani. Fetească Neagră and Cabernet Sauvignon displayed similar average value of the antioxidant activity, with 17.71 mM TE for Fetească Neagră and 17.34 mM TE for Cabernet Sauvignon, while Merlot and Negru de Drăgășani showed comparable AA values, with average values of 15.85 and 15.35 mM TE, respectively.
TP is an important parameter widely used to assess the bioactive composition of wines and other foods. Wines with higher TP are generally considered to be of superior quality. In our study, the red wines with the highest TP values were Merlot, Fetească Neagră and Cabernet Sauvignon, while for white wines, Crâmpoșie Selecționată, Fetească Regală and Chardonnay exhibited the highest TP content. Wines with higher TP levels tend to display higher antioxidant activity, suggesting that TP is responsible for the wine’s antioxidant activity. Antioxidant activity is a highly relevant parameter for evaluating both wine quality and its bioactive potential. For the analyzed wines, the antioxidant activity of red wines (expressed in mM/L Trolox) followed the descending order: Fetească Neagră > Cabernet Sauvignon > Merlot > Negru de Drăgășani, while for white wines, it decreases in the following order: Crâmpoșie Selecționată > Fetească Regală > Chardonnay > Sauvignon Blanc.
A summary of the bioactive characteristics of white and red wines investigated in this study is provided in Table S1. The obtained values for the bioactive characteristics of white and red wines from Drăgășani and Sâmburești vineyards were comparable with literature data for Romanian wines from other wine-growing regions, such as Banat, Crișana [45], Oltenia, Muntenia [46,47], Dobrogea [42], Moldova [48,49] (Table S2) and wines from southeast European countries like Serbia [50,51], Bulgaria [52,53], Croatia [54] (Table S3). Thus, the TP values of the investigated Fetească Regală wines were similar to those for Fetească Regală wines from Oltenia [47], but higher than those reported for Fetească Regală wines from other Romanian wine-growing regions like Moldova, Muntenia, Transilvania and Banat, with values ranging from 244.0 to 296.0 mg GAE/L [48,55] (Table S2). For Sauvignon Blanc wines, the TP values of the investigated wines were comparable with those reported for other wines from Romania, with values ranging from 174.8 to 343.29 mg GAE/L [48,56], and wines from Serbia, which range from 327.0 to 803.0 mg GAE/L [51]. Similarly, the TP of the investigated Chardonnay wines was comparable with values reported for wines from Serbia [51] and Croatia [54] (Table S3). The TP of Fetească Neagră red wines was comparable with Romanian wines from the Moldova region [49], but higher than values reported for Fetească Neagră wines from the Dobrogea Romanian wine-growing region [57] (Table S2). For Cabernet Sauvignon and Merlot wines, the TP values of the investigated wines were comparable with those reported for Romanian wines [46,49], but higher than values reported for wines from Serbia and Croatia, whose values vary between 486.54–1520.0 mg GAE/L for Cabernet Sauvignon wines and 794.46–1692.0 mg GAE/L for Merlot wines [50,53,58].
The TF of the investigated Cabernet Sauvignon wines was comparable with those reported for Romanian wines from Oltenia and Muntenia regions, with values ranging from 12.1 to 287.8 mg RE/L [46], and wines from Serbia (146.2 mg CE/L) [58], but was lower compared with wines from Bulgaria (6709.18 mg CE/L) [52], assuming that the values expressed in quercetin equivalents (QE) are comparable with values expressed in rutin equivalents (RE) and catechin equivalents (CE). For Merlot wines, the TF of the investigated wines was similar to values obtained for wines from the Oltenia Romanian region (177.5–291.3 mg RE/L) [46] and wines from Serbia (13,480 mg CE/L) [58], but higher than wines from the Banat Romanian wine-growing region (41.0–94.6 mg RE/L) [46]. The obtained values for the TF of the analyzed Fetească Neagră wines were higher compared with wines from the Dobrogea Romanian wine-growing region (75.2–96.8 mg RE/L) [57] (Tables S2 and S3).
The AA values for the analyzed wines were slightly higher than those reported by Banc et al. (0.82–0.93 mm TE/L) [55] and Geana et al. (0.54–0.81 mm TE/L) [42]. The TA of the investigated wines was comparable with values reported for Romanian wines from Oltenia and Muntenia regions (86.6–213.0 mg MvE/L) [46], but lower than wines from Banat, Crisana and Moldova regions (216.72–479.3 mg MvE/L) [49].

3.2. Profile of Phenolic Compounds in White and Red Wines

UHPLC-HRMS analysis was used for the identification and quantification of phenolic compounds by the external standard method. An example of a total ion current (TIC) chromatogram is shown in Figure S1 for Cabernet Sauvignon red wine. Retention time, compound name, formula, m/z values of adduct ions and MS/MS fragments in negative ESI mode, mass error and exact molecular mass are given in Table 2.
The quantitative results of individual phenolic compounds in different varieties of white and red wines are presented in Table 3 for white wines and Table 4 for red wines. It is evident that in red wines, individual phenolic compounds were quantified in higher amounts compared to white wines. Among the phenolic compounds identified in white wines, gallic and caffeic acids, catechin and epicatechin were quantified in larger quantities, especially in Sauvignon Blanc, Crâmpoșie Selecționată and Chardonnay wines (Table 3). Higher amounts of gallic, caffeic, p-coumaric acids were quantified in Chardonnay wines, followed by Crâmpoșie Selecționată and Sauvignon Blanc wines, while Fetească Regală shows lower amounts of gallic acid. Catechin and epicatechin were quantified in higher amounts in Chardonnay and Fetească Regală wines, followed by Crâmpoșie Selecționată and Sauvignon Blanc wines. t-Resveratrol was quantified in higher amounts in Crâmpoșie Selecționată wines, followed by Chardonnay, Sauvignon Blanc and Fetească Regală wines. Additionally, comparable values of phenolic compounds in white wines were reported for Sauvignon Blanc and Chardonnay Romanian wines [33,47,59] (Table S4).
In the case of red wines, the content of phenolic compounds is about ten times higher compared to white wines. Among them, significant amounts correspond to gallic, tannic, ellagic and caffeic acids, as well as catechin, epicatechin, myricetin, quercetin, naringin and t-resveratrol. Thus, Fetească Regală red wines contain higher amounts of caffeic, tannic and ellagic acids, myricetin, quercetin and isorhamnetin, while higher amounts of gallic and caffeic acids, catechin, epicatechin and t-resveratrol were quantified in Merlot red wines. The red wine variety Negru de Drăgășani, specific for the Drăgășani vineyard, contains higher amounts of gallic acid, catechin, epicatechin and naringin (Table 4. Cabernet Sauvignon red wines exhibited lower amounts of phenolic compounds compared with the other red varieties investigated in this study. Additionally, the quantitative data obtained for the individual phenolic compounds in Fetească Neagră, Cabernet Sauvignon and Merlot red wines from Drăgășani and Sâmburești vienyard were comparable to values from the literature data for Romanian wines from other wine-growing regions, such as Dobrogea [57], Moldova, Muntenia [9,60], Oltenia [47], Crisana [61]) (Table S4) and wines from Austria and Montenegro [62], Macedonia [63], Serbia [12,51], Croatia [64,65] (Table S5).

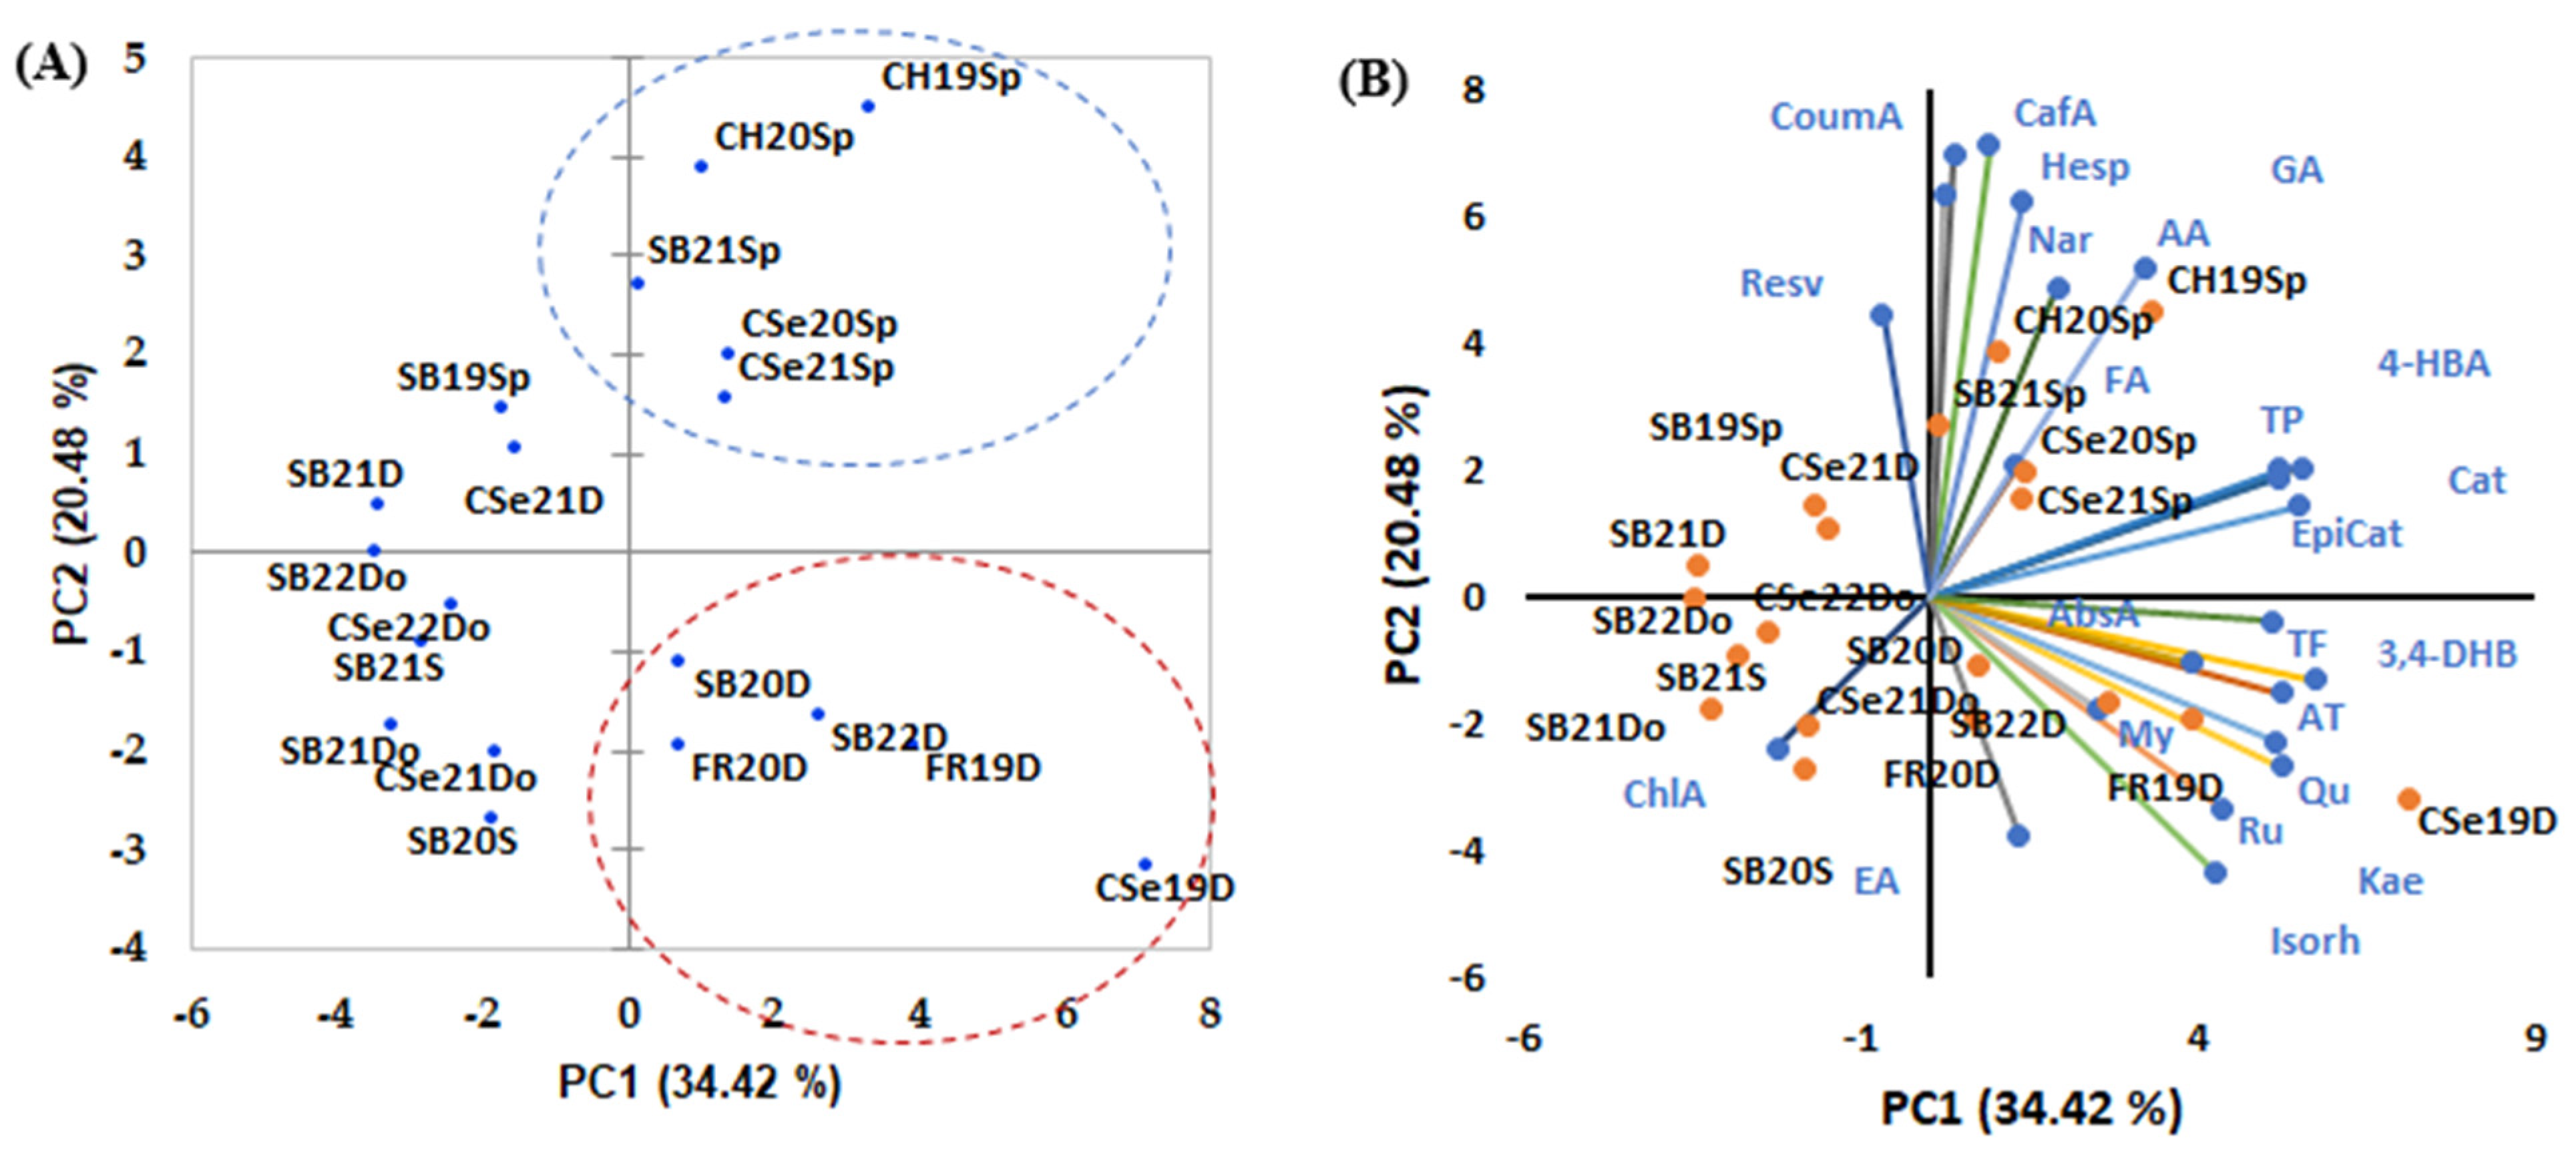
3.3. Discrimination of White Wines

To differentiate white and red wines based on phenolic composition and identify potential markers for establishing geographical and varietal origins and harvest year, the obtained analytical data were processed using multivariate statistical analysis. First, the Duncan test was used to discriminate the white wine by wine producing regions, variety and harvest year (p ≤ 0.05). The result of ANOVA by means of Duncan test, applied to the phenolic biomarkers quantified in the white wines, indicated p-values ranging from 0.004 to 0.966 for harvest year discrimination, with significant values of p (p ≤ 0.05) for quercetin, isorhamnetin and tannic acid. Regarding wine producing regions, the results of the ANOVA test indicate p-values ranging from 0.001 to 0.615, with significant differences (p ≤ 0.05) for gallic, 3,4-dyhydroxybenzoic, 4-hydroxybenzoic, caffeic, chlorogenic, p-coumaric and abscisic acids, rutin, t-resveratrol, TP and AA. When considering the wine variety, the results of the ANOVA test indicate p-values ranging from <0.0001 to 0.814, with significant differences (p ≤ 0.05) for 3,4-dyhydroxybenzoic, 4-hydroxybenzoic, t-ferulic, tannic and abscisic acids, epicatechin, naringin, hesperidin, rutin, quercetin, kaempferol, isorhamnetin and TF content (Table S7).
Subsequently, principal component analysis was performed as an exploratory tool to assess the bioactive composition and content of individual phenolic compounds quantified by HRMS. The distribution of the investigated white wines in the PC1-PC2 plot is shown in Figure 4. The first two components of the PCA model accounted for 54.9% of the variance, with a larger contribution from PC1 than PC2.
As can be seen in Figure 4, three distinct groups were identified corresponding to the white wines from the wineries located in Spârleni (Sp), Drăgășani (D) and Dobrușa (Do) localities (Figure 4A). The analyzed phenolic markers were primarily associated with the wines from the Spârleni and Drăgășani wineries (Figure 4B). A possible differentiation of white wines based on variety and harvest year could not be identified.
Phenolic compounds such as gallic acid (GA), t-ferulic (FA), p-coumaric acid (p-CoumA), caffeic acid (CA), hesperidin (Hesp), naringin (Nar), t-resveratrol (Resv) were identified as specific biomarkers for white wines from Spârleni winery. In contrast, ellagic acid (EA), isorhamnetin (Isorh), rutin (Ru), kaempferol (Kae), quercetin (Qu), tannic acid (TA) have been found to characterize the white wines from Drăgășani vineyard.
To maximize the extraction of information from the obtained analytical data, a heat map analysis was also carried out. A heat map is a two-dimensional data visualization technique that represents the magnitude of individual values in a dataset, using color variations, either in shade or intensity.
The heat map profiles developed on the basis of the targeted phenolic compound data of the investigated white wines (Figure 5) revealed that the white wines were grouped into two main clusters: C1, which corresponds to the wines from the Drăgășani vineyard, and C2, which groups the wines from the Spârleni, Dobrușa and Sâmburești vineyards. Additionally, the variables are grouped into three clusters, one corresponding to gallic acid, the second grouping phenolic compounds quantified in small amounts in white wines (4-hydroxybenzoic, abscisic, chlorogenic, p-coumaric, t-ferulic and ellagic acids, naringin, quercetin, rutin, hesperidin, myricetin, kaempferol, isorhamnetin), and the third grouping the phenolic compounds responsible for the differences between the investigated wines.

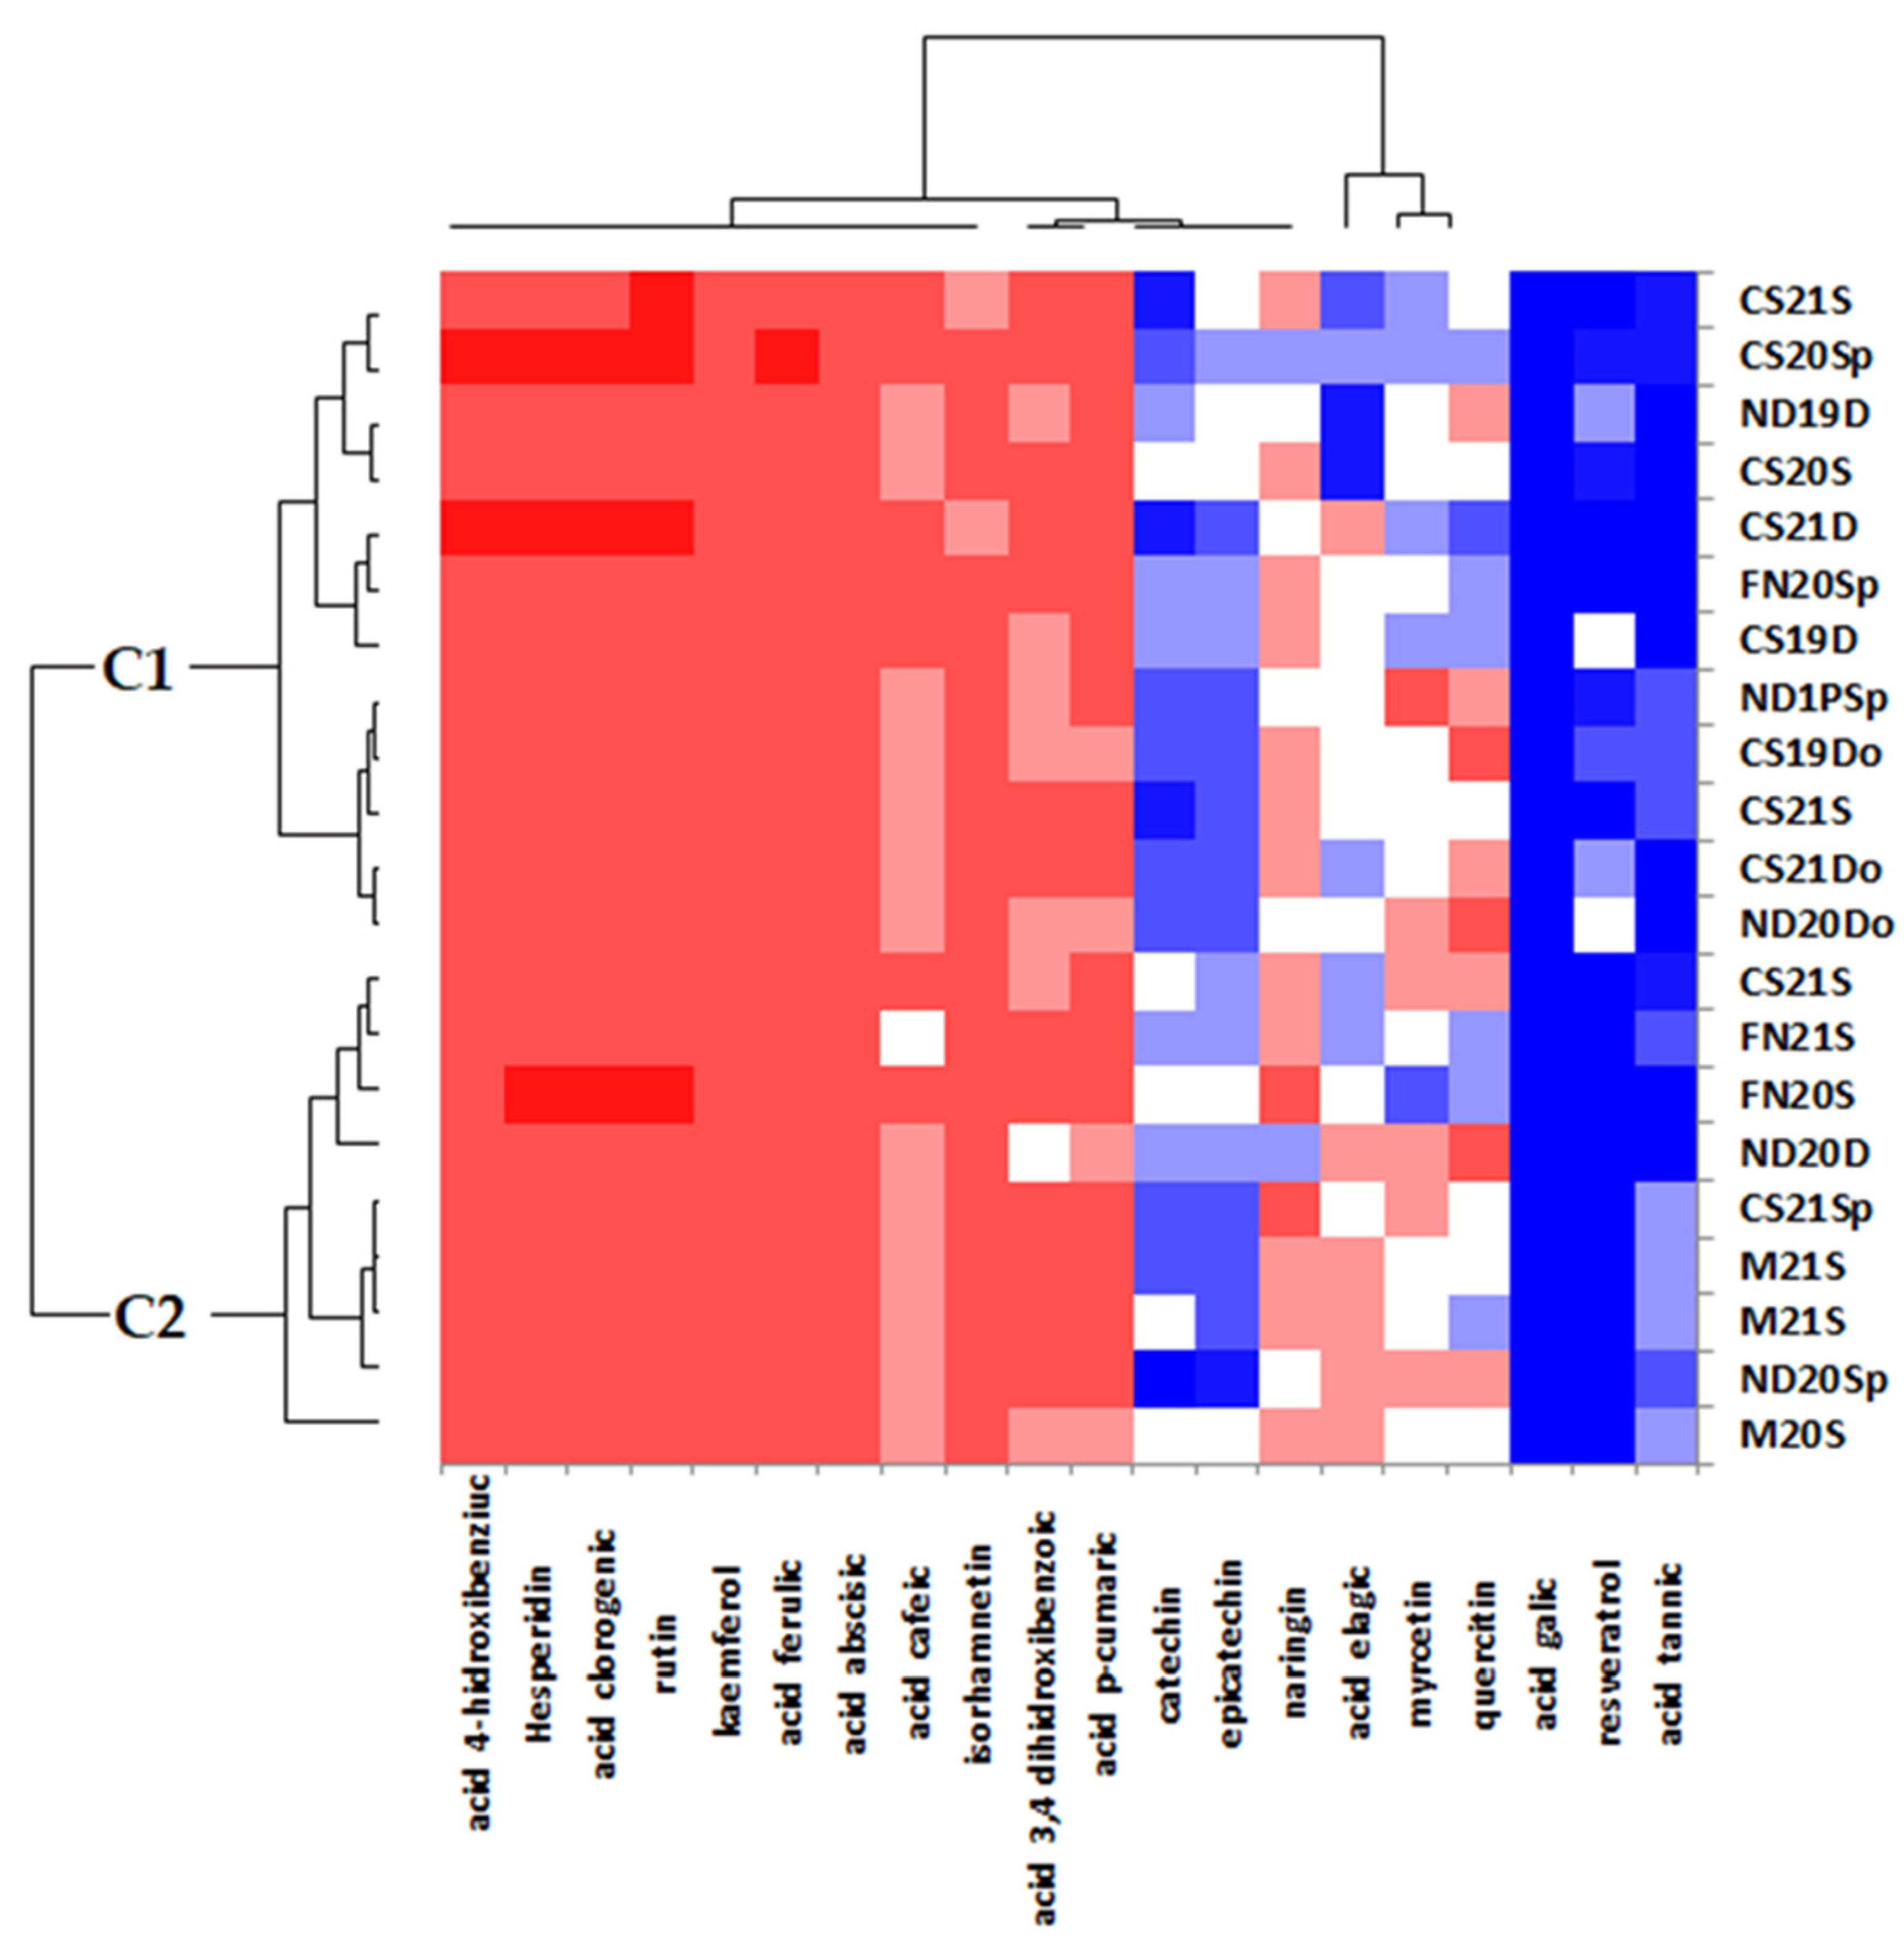
3.4. Discrimination of Red Wines

The Duncan test was used to discriminate the red wines based on wine-producing regions, variety and harvest year (p ≤ 0.05). The result of ANOVA by means of Duncan test, applied to the phenolic biomarkers quantified in the red wines, indicated p-values ranging from 0.002 to 0.990 for harvest year discrimination, with significant values of p (p ≤ 0.05) for t-ferulic acid and TA. Regarding wine producing regions, the results of the ANOVA test indicate p-values ranging from 0.004 to 0.840, with p ≤ 0.05 for gallic acid and t-resveratrol. When considering the wine variety, the results of the ANOVA test indicate p-values ranged from 0.006 to 0.851, with statistically significant differences (p ≤ 0.05) for 4-hydroxybenzoic, chlorogenic and tannic acids, myricetin, quercetin, t-resveratrol and TF content (Table S8).
The distribution of investigated red wines in the PC1-PC2 plot is presented in Figure 6. The first two components of the PCA model accounted for 46.5% of the variance, with a greater contribution from PC1 than PC2. No clear differentiation of red wines was observed. However, wines from the Sâmburești vineyard produced in the 2021 harvest year (M21S, FN21S, CS21S) were grouped in the upper right quadrant of the PCA space (Figure 7A). The specific climatic conditions of the 2021 production year during the ripening differed from 2019, 2020 and 2022, being warmer and having more sunshine, with less precipitation (Table S6). This may be a possible explanation for the differentiation of red wines depending on the year of production. The 2021 harvest year favored the accumulation of specific phenolic biomarkers in the grapes and the corresponding wines, such as epicatechin (EpiCat), catechin (Cat), gallic acid (GA), caffeic acid (CA), t-ferulic acid (FA), t-resveratrol (Resv), hesperidin (Hesp) (Figure 7B). Red wines belonging to the Negru de Drăgășani variety were grouped on the left side of the PC1 axis, a region characterized by phenolic markers such as 4-hydroxybenzoic acid (4-HBA), 3,4-dihydroxybenzoic acid (3,4-DHB) and p-coumaric acid (p-CoumA) (Figure 7B).
The heat map corresponding to the differentiation of red wines based on the quantified phenolic compounds (Figure 6) revealed the clustering of the investigated red wines into two main clusters: C1, which includes the majority of red wines from the Spârleni, Dobrușa and Drăgășani wineries, and C2, which groups the majority of wines from the Sâmburești winery. Among the quantified phenolic compounds, catechin, epicatechin, naringin, ellagic acid, myricetin, quercetin, t-resveratrol and gallic and tannic acids are potential biomarkers for differentiating red wines.

3.5. Discrimination of Wines in Romanian Context and Other Surrounding Countries

It is well known that the concentration and composition of phenolic compounds in grapes and corresponding wines depend on multiple factors, including the grape variety, wine region, geological and soil conditions, regional climate and weather conditions during the harvest period, vintage, vineyard management and winemaking process [24,66]. The phenolic fingerprint of wines is closely related to the specific terroir. Therefore, this study aims to differentiate white and red wines from the Oltenia region from the other wine-growing regions in Romania (Moldova—Mo, Muntenia—Mu, Banat—B, Crișana—C, Transilvania—T, Dobrogea—Do) and subsequently distinguish wines from Romania from wines from other countries in Southeastern Europe (Serbia—S, Croatia—C, Macedonia—MC, Montenegro—MU), based on data from the literature. Data were collected for the total polyphenols (TPs, expressed as mg GAE/L), total anthocyanins (TAs, expressed as mg MvE/L), antioxidant activity (AA, expressed in μM Trolox/L), total flavonoids (TFs, expressed as mg QE or RE/L) in wines from Romania (Table S2) and from countries in Southeast Europe (Table S3). Additionally, individual phenolic compounds in white and red wines from Romania (Table S4) and countries from Southeast Europe were analyzed (Table S5). For white wines, the differentiation was based only on a few phenolic compounds that were consistently analyzed across all wines (gallic acid, catechin, epicatechin and t-resveratrol). In contrast, the differentiation of red wines was based on a broader range of phenolic compounds, such as t-ferulic, ellagic, p-coumaric, gallic acids, rutin, catechin, epicatechin, t-resveratrol, myricetin, quercetin, isorhamnetin, kaempferol. PCA analysis was used as an unsupervised statistical method for the discrimination of white and red wines in the Romanian and European context.
For white wines, PCA revealed the differentiation of Romanian variety Fetească Regală from the other white varieties, as well as the distinction between wines from the Transilvania (T) and Banat (B) regions and the majority of the wines from the Oltenia region (O) (Figure 8a). Based on the common analyzed phenolic biomarkers, the Romanian wines were distinguished from the wines from Serbia, being characterized by gallic acid, epicatechin and t-resveratrol, as specific biomarkers (Figure 8b).
For red wines, a clear discrimination was observed between wines from the Oltenia region and wines from the Muntenia, Moldova and Dobrogea regions in terms of t-Resveratrol, myricetin, t-ferulic, gallic and p-coumaric acids, which were identified as the representative biomarkers of wines from the Oltenia region (Figure 8c). This result is consistent with our previous paper, highlighting the differentiation of wines from Drăgășani vineyard, Oltenia region from wines from Recaș vineyard, Banat Region, based on the same specific phenolic biomarkers [33]. In the European context, some Romanian red wines were discriminated from red wines from Montenegro, Macedonia, Serbia, being grouped in the bottom space of the PCA graph (Figure 8d).
These findings demonstrate that wines from the Oltenia wine-growing region in Romania have distinct phenolic signatures influenced by environmental conditions related to local climatic and soil characteristics. This highlights the unique terroir of the Oltenia region in contrast to the other wine-growing regions in Romania. Additionally, the Romanian wines exhibit a distinct phenolic profile compared to wines from Southeastern European countries, likely due to the continental climate with Eastern European influences, combined with the characteristics of the soils in the hilly regions where most vineyards in Romania are located.

4. Conclusions

In conclusion, this study presents a detailed targeted phenolic approach for the characterization and differentiation of white and red wines derived from international, but also autochthonous Romanian grape varieties, harvested in the most famous vineyards from Oltenia wine-growing regions of Romania, namely the Drăgășani and Sâmburești vineyards. Analytical data regarding the wine bioactive characteristics and phenolic profiles were statistically processed in order to discriminate the investigated wines according to the geographical localization, grape variety and harvest year.
Specific Romanian wine varieties Crâmpoșie Selecționată and Negru de Drăgășani obtained in the Oltenia wine-growing region demonstrated higher bioactive characteristics compared with the other wines. For white wines, phenolic biomarkers facilitated the discrimination of the wines according to the geographic origin, thus delimitating the terroir specific to Spârleni, Dobrușa and Drăgășani wineries. Therefore, phenolic biomarkers such as gallic, t-ferulic, p-coumaric and caffeic acids, hesperidin, naringin and t-resveratrol represent specific biomarkers of white wines from Spârleni winery, while ellagic and tannic acids, isorhamnetin, rutin, keampferol and quercetin characterized the white wines from Drăgășani.
Epicatechin and catechin, gallic, caffeic and t-ferulic acids, t-resveratrol and hesperidin were identified as specific phenolic biomarkers for the discrimination of red wines depending on the year of production. Negru de Drăgășani red wines were characterized by phenolic markers such as 4-hydroxybenzoic, 3,4-dihydroxybenzoic and p-coumaric acids.
By placing the investigated wines in the broader Romanian context, the unique terroir of the Oltenia region was highlighted, as compared with the other wine-growing regions in Romania, based on the phenolic composition of the wines. Furthermore, through a comparative analysis of the phenolic composition of white and red wines from some Southeastern European countries, it was possible to differentiate Romanian wines from the wines from Serbia, Macedonia, Croatia and Montenegro.

Supplementary Materials

The following supporting information can be downloaded at: https://www.mdpi.com/article/10.3390/beverages11020044/s1, Figure S1: Geographical distribution of the wineries in southwestern region of Romania; Table S1. Quantitative values of bioactive properties of white and red wines: mean value (range); Table S2: Total polyphenols (TP, expressed as mg GAE/L), total anthocyanins (TA, expressed as mg MvE/L), antioxidant activity (AA, expressed in μM Trolox/L), total flavonoids (TF, expressed as mg QE or RE/L) in wines from Romania; Table S3. Total polyphenols (TP, expressed as mg GAE/L), total anthocyanins (TA, expressed as mg MvE/L), antioxidant activity (AA, expressed in μM Trolox/L), total flavonoids (TF, expressed as mg QE or RE/L) in wines from Southeast Europe; Table S4. Individual phenolic compounds in Romanian white and red wines; Table S5. Individual phenolic compounds in white and red wines from countries in Southeast Europe; Table S6. Climatic conditions in Oltenia wine-growing region during 2019, 2020, 2021 and 2022 harvest years; Table S7. Significant differences among wine producing regions, variety and harvest year with regard to the phenolic biomarkers of white wines; Table S8. Significant differences among wine producing regions, variety and harvest year with regard to the phenolic biomarkers of red wines.

Author Contributions

Conceptualization, E.-I.G. and C.-T.C.; methodology, E.-I.G. and C.-T.C.; software, E.-I.G. and C.-T.C.; validation, E.-I.G.; formal analysis, E.-I.G. and C.-T.C.; investigation, E.-I.G. and C.-T.C.; resources, M.G.M.; data curation, E.-I.G. and C.-T.C.; writing—original draft preparation, E.-I.G., C.-T.C. and M.G.M.; writing—review and editing, E.-I.G.; visualization, E.-I.G.; supervision, E.-I.G.; project administration, M.G.M.; funding acquisition, M.G.M. All authors have read and agreed to the published version of the manuscript.

Funding

This research was funded by the Romanian Ministry of Research, Innovation and Digitization through NUCLEU Program, Contract no. 20N/05.01.2023, Project PN 23 15 03 01: “Implementation of integrated isotopic-chemical-nuclear analytical methodologies for the authentication of traditional Romanian food products” and by the Sectorial Plan-ADER 2026, Project ADER 6.5.2 “Evaluation of the agro-biological characteristics and oenological capacity of varieties with high nutraceutical value in order to increase the added value of viticultural products and by-products” financed by the Ministry of Agriculture and Rural Development—Romania.

Data Availability Statement

Data are contained within the article.

Acknowledgments

The authors gratefully acknowledge the Romanian Ministry of Research, Innovation and Digitization through NUCLEU Program, Contract no. 20N/05.01.2023, Project PN 23 15 03 01 and to the Ministry of Agriculture and Rural Development—Romania, the Sectorial Plan-ADER 2026, Project ADER 6.5.2.

Conflicts of Interest

The authors declare no conflicts of interest.

References

  1. Roullier-Gall, C.; Lucio, M.; Noret, L.; Schmitt-Kopplin, P.; Gougeon, R.D. How Subtle Is the “Terroir” Effect? Chemistry-Related Signatures of Two “Climats de Bourgogne”. PLoS ONE 2014, 9, e97615. [Google Scholar] [CrossRef]
  2. Urvieta, R.; Jones, G.; Buscema, F.; Bottini, R.; Fontana, A. Terroir and Vintage Discrimination of Malbec Wines Based on Phenolic Composition across Multiple Sites in Mendoza, Argentina. Sci. Rep. 2021, 11, 2863. [Google Scholar] [CrossRef]
  3. Koljančić, N.; Furdíková, K.; de Araújo Gomes, A.; Špánik, I. Wine Authentication: Current Progress and State of the Art. Trends Food Sci. Technol. 2024, 150, 104598. [Google Scholar] [CrossRef]
  4. Popîrdă, A.; Luchian, C.E.; Cotea, V.V.; Colibaba, L.C.; Scutarașu, E.C.; Toader, A.M. A Review of Representative Methods Used in Wine Authentication. Agriculture 2021, 11, 225. [Google Scholar] [CrossRef]
  5. Gutiérrez-Escobar, R.; Aliaño-González, M.J.; Cantos-Villar, E. Wine Polyphenol Content and Its Influence on Wine Quality and Properties: A Review. Molecules 2021, 26, 718. [Google Scholar] [CrossRef]
  6. Pajovic Scepanovic, R.; Wendelin, S.; Forneck, A.; Eder, R. Varietal Differentiation of Grapes Cv. ‘Vranac’, ‘Kratosija’ and ‘Cabernet Sauvignon’ from Montenegro According to Their Polyphenolic Composition. Mitteilungen Klosterneubg. 2014, 64, 9–19. [Google Scholar]
  7. Xia, E.-Q.; Deng, G.-F.; Guo, Y.-J.; Li, H.-B. Biological Activities of Polyphenols from Grapes. Int. J. Mol. Sci. 2010, 11, 622–646. [Google Scholar] [CrossRef]
  8. Zhou, D.-D.; Li, J.; Xiong, R.-G.; Saimaiti, A.; Huang, S.-Y.; Wu, S.-X.; Yang, Z.-J.; Shang, A.; Zhao, C.-N.; Gan, R.-Y.; et al. Bioactive Compounds, Health Benefits and Food Applications of Grape. Foods 2022, 11, 2755. [Google Scholar] [CrossRef]
  9. Banc, R.; Popa, D.-S.; Cozma-Petruţ, A.; Filip, L.; Kiss, B.; Fărcaş, A.; Nagy, A.; Miere, D.; Loghin, F. Protective Effects of Wine Polyphenols on Oxidative Stress and Hepatotoxicity Induced by Acrylamide in Rats. Antioxidants 2022, 11, 1347. [Google Scholar] [CrossRef]
  10. Manzoor, M.F.; Arif, Z.; Kabir, A.; Mehmood, I.; Munir, D.; Razzaq, A.; Ali, A.; Goksen, G.; Coşier, V.; Ahmad, N.; et al. Oxidative Stress and Metabolic Diseases: Relevance and Therapeutic Strategies. Front. Nutr. 2022, 9, 994309. [Google Scholar] [CrossRef]
  11. Burin, V.M.; Ferreira-Lima, N.E.; Panceri, C.P.; Bordignon-Luiz, M.T. Bioactive Compounds and Antioxidant Activity of Vitis Vinifera and Vitis Labrusca Grapes: Evaluation of Different Extraction Methods. Microchem. J. 2014, 114, 155–163. [Google Scholar] [CrossRef]
  12. Beara, I.N.; Torović, L.D.; Pintać, D.Đ.; Majkić, T.M.; Orčić, D.Z.; Mimica-Dukić, N.M.; Lesjak, M.M. Polyphenolic Profile, Antioxidant and Neuroprotective Potency of Grape Juices and Wines from Fruška Gora Region (Serbia). Int. J. Food Prop. 2017, 20, S2552–S2568. [Google Scholar] [CrossRef]
  13. Ćorković, I.; Pichler, A.; Šimunović, J.; Kopjar, M. A Comprehensive Review on Polyphenols of White Wine: Impact on Wine Quality and Potential Health Benefits. Molecules 2024, 29, 5074. [Google Scholar] [CrossRef] [PubMed]
  14. Hornedo-Ortega, R.; Reyes González-Centeno, M.; Chira, K.; Jourdes, M.; Teissedre, P.-L. Phenolic Compounds of Grapes and Wines: Key Compounds and Implications in Sensory Perception. In Chemistry and Biochemistry of Winemaking, Wine Stabilization and Aging; Cosme, F., Nunes, F.M., Filipe-Ribeiro, L., Eds.; IntechOpen: London, UK, 2021; ISBN 978-1-83962-575-6. [Google Scholar]
  15. Urcan, D.E.; Lung, M.-L.; Giacosa, S.; Torchio, F.; Ferrandino, A.; Vincenzi, S.; Río Segade, S.; Pop, N.; Rolle, L. Phenolic Substances, Flavor Compounds, and Textural Properties of Three Native Romanian Wine Grape Varieties. Int. J. Food Prop. 2016, 19, 76–98. [Google Scholar] [CrossRef]
  16. Nel, A.P. Tannins and Anthocyanins: From Their Origin to Wine Analysis—A Review. S. Afr. J. Enol. Vitic. 2018, 39, 1–20. [Google Scholar] [CrossRef]
  17. Temerdashev, A.; Atapattu, S.N.; Pamunuwa, G.K. Determination and Identification of Polyphenols in Wine Using Mass Spectrometry Techniques. J. Chromatogr. Open 2024, 6, 100175. [Google Scholar] [CrossRef]
  18. Mac, H.X.; Pham, T.T.; Ha, N.T.T.; Nguyen, L.L.P.; Baranyai, L.; Friedrich, L. Current Techniques for Fruit Juice and Wine Adulterant Detection and Authentication. Beverages 2023, 9, 84. [Google Scholar] [CrossRef]
  19. Pasvanka, K.; Tzachristas, A.; Proestos, C. 9—Quality Tools in Wine Traceability and Authenticity. In Quality Control in the Beverage Industry; Grumezescu, A.M., Holban, A.M., Eds.; Academic Press: Cambridge, MA, USA, 2019; pp. 289–334. ISBN 978-0-12-816681-9. [Google Scholar]
  20. Sun, X.; Zhang, F.; Gutiérrez-Gamboa, G.; Ge, Q.; Xu, P.; Zhang, Q.; Fang, Y.; Ma, T. Real Wine or Not? Protecting Wine with Traceability and Authenticity for Consumers: Chemical and Technical Basis, Technique Applications, Challenge, and Perspectives. Crit. Rev. Food Sci. Nutr. 2022, 62, 6783–6808. [Google Scholar] [CrossRef]
  21. Arduini, S.; Chinnici, F. Advancements in Analytical Strategies for Authentication and Quality Control of Grappa and Wine Brandy with Geographical Indications. Appl. Sci. 2024, 14, 8092. [Google Scholar] [CrossRef]
  22. Compendium of International Methods of Wine and Must Analysis|OIV. Available online: https://www.oiv.int/standards/compendium-of-international-methods-of-wine-and-must-analysis (accessed on 7 December 2024).
  23. Tzachristas, A.; Pasvanka, K.; Calokerinos, A.; Proestos, C. Polyphenols: Natural Antioxidants to Be Used as a Quality Tool in Wine Authenticity. Appl. Sci. 2020, 10, 5908. [Google Scholar] [CrossRef]
  24. Costa, E.; Cosme, F.; Rivero-Pérez, M.D.; Jordão, A.M.; González-SanJosé, M.L. Influence of Wine Region Provenance on Phenolic Composition, Antioxidant Capacity and Radical Scavenger Activity of Traditional Portuguese Red Grape Varieties. Eur. Food Res. Technol. 2015, 241, 61–73. [Google Scholar] [CrossRef]
  25. Merkyte, V.; Longo, E.; Windisch, G.; Boselli, E. Phenolic Compounds as Markers of Wine Quality and Authenticity. Foods 2020, 9, 1785. [Google Scholar] [CrossRef] [PubMed]
  26. Stój, A.; Kapusta, I.; Domagała, D. Classification of Red Wines Produced from Zweigelt and Rondo Grape Varieties Based on the Analysis of Phenolic Compounds by UPLC-PDA-MS/MS. Molecules 2020, 25, 1342. [Google Scholar] [CrossRef]
  27. Ge, Y.-L.; Xia, N.-Y.; Wang, Y.-C.; Zhang, H.-L.; Yang, W.-M.; Duan, C.-Q.; Pan, Q.-H. Evolution of Aroma Profiles in Vitis vinifera L. Marselan and Merlot from Grapes to Wines and Difference between Varieties. Molecules 2024, 29, 3250. [Google Scholar] [CrossRef]
  28. Medina, S.; Pereira, J.A.; Silva, P.; Perestrelo, R.; Câmara, J.S. Food Fingerprints—A Valuable Tool to Monitor Food Authenticity and Safety. Food Chem. 2019, 278, 144–162. [Google Scholar] [CrossRef] [PubMed]
  29. Ranaweera, R.K.R.; Capone, D.L.; Bastian, S.E.P.; Cozzolino, D.; Jeffery, D.W. A Review of Wine Authentication Using Spectroscopic Approaches in Combination with Chemometrics. Molecules 2021, 26, 4334. [Google Scholar] [CrossRef]
  30. Uttl, L.; Bechynska, K.; Ehlers, M.; Kadlec, V.; Navratilova, K.; Dzuman, Z.; Fauhl-Hassek, C.; Hajslova, J. Critical Assessment of Chemometric Models Employed for Varietal Authentication of Wine Based on UHPLC-HRMS Data. Food Control 2023, 143, 109336. [Google Scholar] [CrossRef]
  31. Izquierdo-Llopart, A.; Saurina, J. Characterization of Sparkling Wines According to Polyphenolic Profiles Obtained by HPLC-UV/Vis and Principal Component Analysis. Foods 2019, 8, 22. [Google Scholar] [CrossRef]
  32. Geană, E.-I.; Sandru, C.; Stanciu, V.; Ionete, R.E. Elemental Profile and 87Sr/86Sr Isotope Ratio as Fingerprints for Geographical Traceability of Wines: An Approach on Romanian Wines. Food Anal. Methods 2017, 10, 63–73. [Google Scholar] [CrossRef]
  33. Geana, E.I.; Marinescu, A.; Iordache, A.M.; Sandru, C.; Ionete, R.E.; Bala, C. Differentiation of Romanian Wines on Geographical Origin and Wine Variety by Elemental Composition and Phenolic Components. Food Anal. Methods 2014, 7, 2064–2074. [Google Scholar] [CrossRef]
  34. Miricioiu, M.G.; Ionete, R.E.; Costinel, D.; Simova, S.; Gerginova, D.; Botoran, O.R. Metabolic Profiling and Stable Isotope Analysis of Wines: Pilot Study for Cross-Border Authentication. Foods 2024, 13, 3372. [Google Scholar] [CrossRef] [PubMed]
  35. Geana, E.I.; Popescu, R.; Costinel, D.; Dinca, O.R.; Ionete, R.E.; Stefanescu, I.; Artem, V.; Bala, C. Classification of Red Wines Using Suitable Markers Coupled with Multivariate Statistic Analysis. Food Chem. 2016, 192, 1015–1024. [Google Scholar] [CrossRef]
  36. BANC, R.; LOGHIN, F.; MIERE, D.; FETEA, F.; SOCACIU, C. Romanian Wines Quality and Authenticity Using FT-MIR Spectroscopy Coupled with Multivariate Data Analysis. Not. Bot. Horti Agrobot. Cluj-Napoca 2014, 42, 556–564. [Google Scholar] [CrossRef]
  37. Geana, E.I.; Ciucure, C.T.; Apetrei, C.; Artem, V. Application of Spectroscopic UV-Vis and FT-IR Screening Techniques Coupled with Multivariate Statistical Analysis for Red Wine Authentication: Varietal and Vintage Year Discrimination. Molecules 2019, 24, 4166. [Google Scholar] [CrossRef] [PubMed]
  38. Magdas, D.A.; Cinta Pinzaru, S.; Guyon, F.; Feher, I.; Cozar, B.I. Application of SERS Technique in White Wines Discrimination. Food Control 2018, 92, 30–36. [Google Scholar] [CrossRef]
  39. Magdas, D.A.; Guyon, F.; Feher, I.; Pinzaru, S.C. Wine Discrimination Based on Chemometric Analysis of Untargeted Markers Using FT-Raman Spectroscopy. Food Control 2018, 85, 385–391. [Google Scholar] [CrossRef]
  40. Geană, E.I.; Ciucure, C.T.; Artem, V.; Apetrei, C. Wine Varietal Discrimination and Classification Using a Voltammetric Sensor Array Based on Modified Screen-Printed Electrodes in Conjunction with Chemometric Analysis. Microchem. J. 2020, 159, 105451. [Google Scholar] [CrossRef]
  41. Geană, E.-I.; Artem, V.; Apetrei, C. Discrimination and Classification of Wines Based on Polypyrrole Modified Screen-Printed Carbon Electrodes Coupled with Multivariate Data Analysis. J. Food Compos. Anal. 2021, 96, 103704. [Google Scholar] [CrossRef]
  42. Geana, E.I.; Ciucure, C.T.; Artem, V.; Apetrei, C. Characterization and Classification of Wines Based on Spectrophotometric Determination of Wine Bioactive Properties. Cient Period. 2019, 3, 1–12. [Google Scholar]
  43. Lee, J.; Durst, R.W.; Wrolstad, R.E. Collaborators: Determination of Total Monomeric Anthocyanin Pigment Content of Fruit Juices, Beverages, Natural Colorants, and Wines by the pH Differential Method: Collaborative Study. J. AOAC Int. 2005, 88, 1269–1278. [Google Scholar] [CrossRef]
  44. Onache, P.A.; Geana, E.I.; Ciucure, C.T.; Florea, A.; Sumedrea, D.I.; Ionete, R.E.; Tița, O. Bioactive Phytochemical Composi-tion of Grape Pomace Resulted from Different White and Red Grape Cultivars. Separations 2022, 9, 395. [Google Scholar] [CrossRef]
  45. Nistor, E.; Dobrei, A. Anthocyanins and Phenolics in Cabernet Sauvignon and Pinot Noir Wines. J. Hortic. For.Biotechnol. 2015, 19, 226–229. [Google Scholar]
  46. Hosu, A.; Cristea, V.M.; Cimpoiu, C. Analysis of Total Phenolic, Flavonoids, Anthocyanins and Tannins Content in Romanian Red Wines: Prediction of Antioxidant Activities and Classification of Wines Using Artificial Neural Networks. Food Chem. 2014, 150, 113–118. [Google Scholar] [CrossRef]
  47. Onache, P.A.; Florea, A.; Geana, E.-I.; Ciucure, C.T.; Ionete, R.E.; Sumedrea, D.I.; Tița, O. Assessment of Bioactive Phenolic Compounds in Musts and the Corresponding Wines of White and Red Grape Varieties. Appl. Sci. 2023, 13, 5722. [Google Scholar] [CrossRef]
  48. Giosanu, D.; Bărbuceanu, M.; Anghel, M.; Vîjan, L. The determination of the content of phenolic compounds from different romanian wines using folin-ciocîlteu method. Curr. Trends Nat. Sci. 2018, 7, 155–159. [Google Scholar]
  49. Dumitru, B.F.; Bunea, C.I.; Călugăr, A.; Donici, A. Phenolic, anthocyanin composition and color measurement at red wines from dealu bujorului vineyard. Agricultura 2019, 109, 14–28. [Google Scholar]
  50. Lisov, N.; Čakar, U.; Milenković, D.; Čebela, M.; Vuković, G.; Despotović, S.; Petrović, A. The Influence of Cabernet Sauvignon Ripeness, Healthy State and Maceration Time on Wine and Fermented Pomace Phenolic Profile. Fermentation 2023, 9, 695. [Google Scholar] [CrossRef]
  51. Beara, I.; Majkić, T.; Milovanović, L.; Svirčev, E.; Torović, L. Polyphenolic Profile and in Vitro Biological Activity of Serbian Orange (Skin Fermented White) Wines. Food Chem. 2024, 447, 138933. [Google Scholar] [CrossRef]
  52. Dimitrov, D.; Yoncheva, T.; Iliev, A. Study on the content of phenolic compounds, anthocyanins and antioxidant activity of red grapes and wines from central northern Bulgaria. Agric. For. 2023, 69, 21–34. [Google Scholar] [CrossRef]
  53. Tzanova, M.; Atanassova, S.; Atanasov, V.; Grozeva, N. Content of Polyphenolic Compounds and Antioxidant Potential of Some Bulgarian Red Grape Varieties and Red Wines, Determined by HPLC, UV, and NIR Spectroscopy. Agriculture 2020, 10, 193. [Google Scholar] [CrossRef]
  54. Vrček, I.V.; Bojić, M.; Žuntar, I.; Mendaš, G.; Medić-Šarić, M. Phenol Content, Antioxidant Activity and Metal Composition of Croatian Wines Deriving from Organically and Conventionally Grown Grapes. Food Chem. 2011, 124, 354–361. [Google Scholar] [CrossRef]
  55. Banc, R.; Loghin, F.; Miere, D.; Ranga, F.; Socaciu, C. Phenolic Composition and Antioxidant Activity of Red, Rosé and White Wines Originating from Romanian Grape Cultivars. Not. Bot. Horti Agrobot. Cluj-Napoca 2020, 48, 716–734. [Google Scholar] [CrossRef]
  56. Hosu, A.; Floare-Avram, V.; Magdas, D.A.; Feher, I.; Inceu, M.; Cimpoiu, C. The Influence of the Variety, Vineyard, and Vintage on the Romanian White Wines Quality. J. Anal. Methods Chem. 2016, 2016, 1–10. [Google Scholar] [CrossRef]
  57. Artem, V.; Antoce, A.O.; Geana, E.-I.; Ionete, R.E. Study of the Impact of Vine Cultivation Technology on the Feteasca Neagra Wine Phenolic Composition and Antioxidant Properties. J. Food Sci. Technol. 2022, 59, 1715–1726. [Google Scholar] [CrossRef]
  58. Mitić, M.N.; Souquet, J.M.; Obradović, M.V.; Mitić, S.S. Phytochemical Profiles and Antioxidant Activities of Serbian Table and Wine Grapes. Food Sci. Biotechnol. 2012, 21, 1619–1626. [Google Scholar] [CrossRef]
  59. Luchian, C.E.; Colibaba, C.L.; Codreanu, M.; Tudose-Sandu-Ville, Ş.; Niculaua, M.; Cotea, V.V. Assay of Antioxidant Capacity and Phenolic Compounds in Some Romanian and Cypriot Wine. Not. Bot. Horti Agrobot. Cluj-Napoca 2018, 46, 240–246. [Google Scholar] [CrossRef]
  60. Alecu, A.; Albu, C.; Litescu, S.C.; Eremia, S.A.V.; Radu, G.L. Phenolic and Anthocyanin Profile of Valea Calugareasca Red Wines by HPLC-PDA-MS and MALDI-TOF Analysis. Food Anal. Methods 2016, 9, 300–310. [Google Scholar] [CrossRef]
  61. Hodișan, B.F.; Ranga, F.; Biriș-Dorhoi, E.-S.; Fărcaș, A.-C.; Tofană, M. Comparative Assessment of Phenolic Compounds from Authentic Wine Varieties from North-Western Romania from the 2021-2022 Harvest. BUASVMCN-FST 2023, 80, 60–67. [Google Scholar] [CrossRef]
  62. Eder, R.; Šćepanović, R.P.; Raičević, D.; Popović, T.; Korntheuer, K.; Wendelin, S.; Forneck, A.; Philipp, C. Study of the Effects of Climatic Conditions on the Phenolic Content and Antioxidant Activity of Austrian and Montenegrin Red Wines. OENO One 2023, 57, 69–85. [Google Scholar] [CrossRef]
  63. Ivanova-Petropulos, V.; Hermosín-Gutiérrez, I.; Boros, B.; Stefova, M.; Stafilov, T.; Vojnoski, B.; Dörnyei, Á.; Kilár, F. Phenolic Compounds and Antioxidant Activity of Macedonian Red Wines. J. Food Compos. Anal. 2015, 41, 1–14. [Google Scholar] [CrossRef]
  64. Lukić, I.; Radeka, S.; Budić-Leto, I.; Bubola, M.; Vrhovsek, U. Targeted UPLC-QqQ-MS/MS Profiling of Phenolic Compounds for Differentiation of Monovarietal Wines and Corroboration of Particular Varietal Typicity Concepts. Food Chem. 2019, 300, 125251. [Google Scholar] [CrossRef] [PubMed]
  65. Radovanovic, A.; Jovancicevic, B.; Arsic, B.; Radovanovic, B.; Bukarica, L.G. Application of Non-Supervised Pattern Recognition Techniques to Classify Cabernet Sauvignon Wines from the Balkan Region Based on Individual Phenolic Compounds. J. Food Compos. Anal. 2016, 49, 42–48. [Google Scholar] [CrossRef]
  66. Lu, H.-C.; Tian, M.-B.; Han, X.; Shi, N.; Li, H.-Q.; Cheng, C.-F.; Chen, W.; Li, S.-D.; He, F.; Duan, C.-Q.; et al. The Key Role of Vineyard Parcel in Shaping Flavonoid Profiles and Color Characteristics of Cabernet Sauvignon Wines Combined with the Influence of Harvest Ripeness, Vintage and Bottle Aging. Food Chem. X 2023, 19, 100772. [Google Scholar] [CrossRef] [PubMed]
Figure 1. Geographical distribution of the wineries in southwestern region of Romania.
Beverages 11 00044 g001
Figure 2. Bioactive characteristics of white wines (SB—Sauvignon Blank, CSe—Crâmpoșie Selecționată, FR—Fetească Regală, CH—Chardonnay): total polyphenols (TPs), total flavonoids (TFs) and antioxidant activity (AA). Each dot represents a wine sample.
Beverages 11 00044 g002
Figure 3. Bioactive characteristics of red wines (CS—Cabernet Sauvignon, ND—Negru de Drăgășani, M—Merlot, FN—Fetească Neagră): total polyphenols (TPs), total flavonoids (TFs) and antioxidant activity (AA) and total anthocyanins (TAs). Each dot represents a wine sample.
Beverages 11 00044 g003
Figure 4. PCA analysis for differentiating white wines based on phenolic composition: (A) differentiation of white wines and (B) variable distribution depending on the analyzed white wines.
Beverages 11 00044 g004
Figure 5. Heat map corresponding to the differentiation of white wines based on phenolic compounds (red and blue cells correspond to low and high levels of phenolic compounds, respectively).
Beverages 11 00044 g005
Figure 6. Heat map corresponding to the differentiation of red wines based on phenolic compounds (red and blue cells correspond to low and high levels of phenolic compounds, respectively).
Beverages 11 00044 g006
Figure 7. PCA analysis for differentiating red wines based on phenolic composition: (A) differentiation of red wines and (B) variable distribution depending on the analyzed red wines.
Beverages 11 00044 g007
Figure 8. Discrimination of white (a,b) and red (c,d) wines in Romanian (a,c) and Southeast European (b,d) context.
Beverages 11 00044 g008
Table 1. Description of white and red wines (region of origin, variety, year of production and code).
White WinesRed Wines
VarietyAreaYearCodeVarietyAreaYearCode
Sauvignon BlancSâmburești2020SB20SMerlotSâmburești 2020M20S
Sauvignon BlancSâmburești2021SB21SMerlot Sâmburești2021M21S
Sauvignon BlancDobrușa2021SB21DoMerlotSâmburești2021M21S
Crampoșie SelecționatăDobrușa2021CSe21DoFetească NeagrăSâmburești2020FN20S
Sauvignon BlancDobrușa2022SB22DoCabernet SauvignonSâmburești2020CS20S
Crampoșie SelecționatăDobrușa2022CSe22DoCabernet SauvignonSâmburești2021CS21S
Sauvignon BlancSpârleni2019SB19SpCabernet SauvignonSâmburești2021CS21S
ChardonnaySpârleni2019CH19SpCabernet SauvignonSâmburești2021CS21S
Crampoșie SelecționatăSpârleni2020CSe20SpFetească NeagrăSâmburești2021FN21S
ChardonnaySpârleni2020CH20SpCabernet SauvignonDobrușa2019CS19Do
Crampoșie SelecționatăSpârleni2021CSe21SpNegru de DrăgașaniDobrușa2020ND20Do
Sauvignon BlancSpârleni2021SB21SpCabernet SauvignonDobrușa2021CS21Do
Crampoșie SelecționatăDrăgășani2019CSe19DNegru de DrăgășaniSpârleni2019ND1PSp
Fetească RegalăDrăgășani2019FR19DNegru de DrăgașaniSpârleni2020ND20Sp
Fetească Regală Drăgășani2020FR20DCabernet SauvignonSpârleni2020CS20Sp
Sauvignon BlancDrăgășani2020SB20DFetească NeagrăSpârleni2020FN20Sp
Crampoșie SelecționatăDrăgășani2021CSe21DCabernet SauvignonSpârleni2021CS21Sp
Sauvignon BlancDrăgășani2021SB21DNegru de DrăgașaniDrăgășani2020ND20D
Sauvignon BlancDrăgășani2022SB22DNegru de DrăgașaniDrăgășani2019ND19D
Cabernet SauvignonDrăgășani2019CS19D
Cabernet SauvignonDrăgășani2021CS21D
Table 2. Identification of phenolic compounds in wines by UHPLC–ESI/HRMS with structures confirmed by comparison with reference standards.
NoCompoundRetention Time
(min)
FormulaExact MassAccurate Mass
(M-H)
Experimental Adduct Ion (m/z)Mass Fragments
Phenolic acids
1Gallic acid1.94C7H6O5170.0215169.0142169.0133125.0231
23,4-Dihydroxybenzoic acid4.25C7H6O4154.0266153.0193153.0184109.0281
34-Hydroxybenzoic acid6.96C7H6O3138.0316137.0243137.0233118.9650, 96.9588, 71.0124
4Caffeic acid7.98C9H8O4180.0422179.0349179.0343135.044
5Chlorogenic acid7.90C16H18O9354.0950353.0877353.0880191.0553
6t-Ferulic acid8.89C10H10O4194.0579193.0506193.0499178.0262, 134.0361
7p-Coumaric acid8.69C9H8O3164.0473163.0400163.0389119.0489
Derivatives of phenolic acids
8Tannic acid7.30C76H52O46183.0290182.0217182.0217140.0104, 111.0075, 59.0124
9Ellagic acid9.71C14H6O8302.0062300.9989300.9993300.9990
10Abscisic acid9.99C15H20O4264.1361263.1289263.1289179.9803, 191.9454
Flavonoids
11Catechin7.53C15H14O6290.0790289.0717289.0716109.0282, 123.0349, 125.0232, 137.0232, 151.0390, 203.0708
12Epi-catechin8.12C15H14O6290.0790289.0717
13Naringin 9.24C27H32O14580.1791579.1722579.1722363.0722
14Hesperidin 9.32C28H34O15610.1897609.1824609.1828377.0876
15Rutin 9.41C27H30O16610.1533609.1465609.1465345.0616
16Myricetin 8.12C15H10O8318.0375317.0310317.0310178.9986, 164.9263, 151.0036, 137.0244, 107.0125
17Quercetin10.68C15H10O7302.2357301.0354301.0351151.0226, 178.9977, 121.0282, 107.0125
18Kaempferol11.60C15H10O6286.0477285.0404285.0403151.0389, 117.0180
19Isorhamnetin11.79C16H12O7316.0582315.0509315.0510300.0277
Stilbens
20t-Resveratrol9.97C14H12O3228.0786227.0713227.0708185.0813, 143.0337
Table 3. Quantitative values of phenolic compounds in white wines: mean value (range).
Phenolic Compounds
(mg/L)
Sauvignon Blanc (SB) (n = 9)Crâmpoșie Selecționată (CSe) (n = 6)Fetească Regală (FR) (n = 2)Chardonnay (CH) (n = 2)
Phenolic acids
Gallic acid7.81 (0.67–21.05)9.11 (1.96–18.97)2.34 (1.40–3.28)15.41 (14.58–16.23)
3,4-Dihydroxybenzoic acid0.74 (0.27–2.15)0.99 (0.43–2.08)1.38 (1.09–1.67)0.97 (0.96–0.99)
4-Hydroxybenzoic acid0.13 (0.04–0.38)0.17 (0.06–0.32)0.23 (0.19–0.27)0.30 (0.28–0.33)
Caffeic acid3.34 (1.44–6.51)3.53 (0.92–7.88)1.36 (1.32–1.40)8.01 (7.99–8.03)
Chlorogenic acid0.03 (0.02–0.05)0.02 (0.01–0.03)0.02 (0.02–0.03)0.02 (0.02–0.02)
t-Ferulic acid0.46 (0.11–0.73)1.54 (0.94–2.52)0.58 (0.52–0.64)0.63 (0.63–0.63)
p-Coumaric acid1.26 (0.31–3.00)1.29 (0.19–3.38)0.38 (0.36–0.40)2.96 (2.74–3.18)
Derivatives of phenolic acids
Tannic acid0.89 (0.45–1.41)1.50 (1.02–2.83)2.13 (1.92–2.33)1.59 (1.42–1.77)
Ellagic acid0.39 (0.17–0.78)0.74 (0.15–1.22)0.42 (0.34–0.50)0.31 (0.30–0.32)
Abscisic acid0.21 (0.13–0.29)0.19 (0.13–0.35)0.32 (0.29–0.34)0.31 (0.24–0.39)
Flavonoids
Catechin 1.22 (0.32–3.03)1.45 (0.33–3.41)1.72 (1.18–2.25)2.86 (1.76–3.96)
Epicatechin 1.10 (0.31–2.94)1.39 (0.32–2.59)2.75 (2.19–3.31)2.78 (1.71–3.85)
Naringin 0.02 (<LD–0.13)<LD–0.01<LD0.91 (0.24–1.57)
Hesperidin <LD–0.010.01 (<LD–0.02)<LD0.04 (0.03–0.05)
Rutin 0.02 (<LD–0.11)0.03 (0.01–0.07)0.05 (0.04–0.06)<LD
Myricetin 0.01 (<LD–0.02)0.01 (<LD–0.01)0.01 (0.01–0.01)0.01 (0.01–0.01)
Quercetin 0.01 (<LD–0.05)0.06 (<LD–0.28)0.10 (0.05–0.15)0.04 (0.01–0.07)
Kaempferol <LD–0.010.01 (<LD–0.02)0.01 (<LD–0.02)0.01 (0.01–0.01)
Isorhamnetin 0.01 (<LD–0.01)0.01 (<LD–0.03)0.01 (0.01–0.01)0.01 (<LD–0.01)
Stilbene
t-Resveratrol 1.34 (0.33–3.56)2.12 (0.42–5.77)0.27 (0.26–0.29)2.04 (1.45–2.63)
<LD: values below the detection limit.
Table 4. Quantitative values of phenolic compounds in red wines: mean value (range).
Phenolic Compounds
(mg/L)
Cabernet Sauvignon (CS) (n = 10)Negru de Drăgășani (ND) (n = 5)Merlot (M)
(n = 3)
Fetească Neagră (FN) (n = 3)
Phenolic acids
Gallic acid54.51 (33.11–69.54)59.06 (43.17–68.62)63.02 (45.34–72.25)56.32 (42.37–64.07)
3,4-Dihydroxybenzoic acid2.74 (1.51–6.78)4.10 (2.90–6.94)1.87 (1.65–2.29)2.25 (1.50–3.29)
4-Hydroxybenzoic acid0.53 (0.33–0.93)0.85 (0.661.21)0.35 (0.31–0.38)0.42 (0.33–0.57)
Caffeic acid3.37 (2.01–5.14)3.60 (2.874.53)6.16 (3.45–7.84)5.87 (3.17–11.25)
Chlorogenic acid0.10 (0.06–0.16)0.09 (0.070.10)0.08 (0.08–0.09)0.22 (0.15–0.35)
t-Ferulic acid0.97 (0.34–1.58)0.74 (0.580.92)1.05 (0.50–1.35)0.91 (0.64–1.33)
p-Coumaric acid2.07 (0.98–3.87)2.27 (1.193.05)2.44 (2.37–2.55)2.64 (1.85–3.06)
Derivatives of phenolic acids
Tannic acid22.54 (11.18–28.50)22.33 (18.03–25.35)16.12 (15.61–16.41)31.42 (24.65–40.34)
Ellagic acid11.39 (4.54–19.41)8.53 (2.92–16.31)5.82 (4.99–6.55)13.44 (10.22–18.07)
Abscisic acid1.28 (1.04–1.41)1.17 (1.08–1.28)1.19 (1.18–1.20)1.09 (1.00–1.14)
Flavonoids
Catechin 15.98 (7.26–23.12)16.63 (8.86–30.15)15.80 (9.25–24.67)14.71 (10.79–16.88)
Epicatechin 14.57 (7.05–21.34)16.14 (8.60–29.26)18.45 (8.98–23.94)14.27 (10.47–16.38)
Naringin 5.60 (1.72–13.47)8.14 (6.58–9.68)4.16 (3.99–4.33)5.60 (3.72–7.93)
Hesperidin 0.17 (0.10–0.24)0.19 (0.13–0.25)0.22 (0.21–0.24)0.22 (0.19–0.24)
Rutin 0.08 (0.05–0.11)0.07 (0.05–0.12)0.07 (0.06–0.08)0.11 (0.08–0.14)
Myricetin9.52 (6.01–13.67)4.91 (1.77–7.78)9.55 (9.38–9.68)13.28 (9.45–15.64)
Quercetin8.67 (0.97–13.62)3.18 (0.04–6.56)12.32 (9.03–14.24)14.15 (12.75–15.42)
Kaempferol0.73 (0.06–1.57)0.15 (0.03–0.50)1.07 (0.31–1.47)1.29 (0.84–1.64)
Isorhamnetin2.67 (0.31–4.44)0.87 (0.04–1.75)2.50 (1.98–3.02)2.73 (2.43–3.23)
Stilbene
t-Resveratrol23.51 (7.94–51.33)22.49 (10.51–41.92)55.70 (44.90–72.84)38.08 (27.89–50.67)
Disclaimer/Publisher’s Note: The statements, opinions and data contained in all publications are solely those of the individual author(s) and contributor(s) and not of MDPI and/or the editor(s). MDPI and/or the editor(s) disclaim responsibility for any injury to people or property resulting from any ideas, methods, instructions or products referred to in the content.

