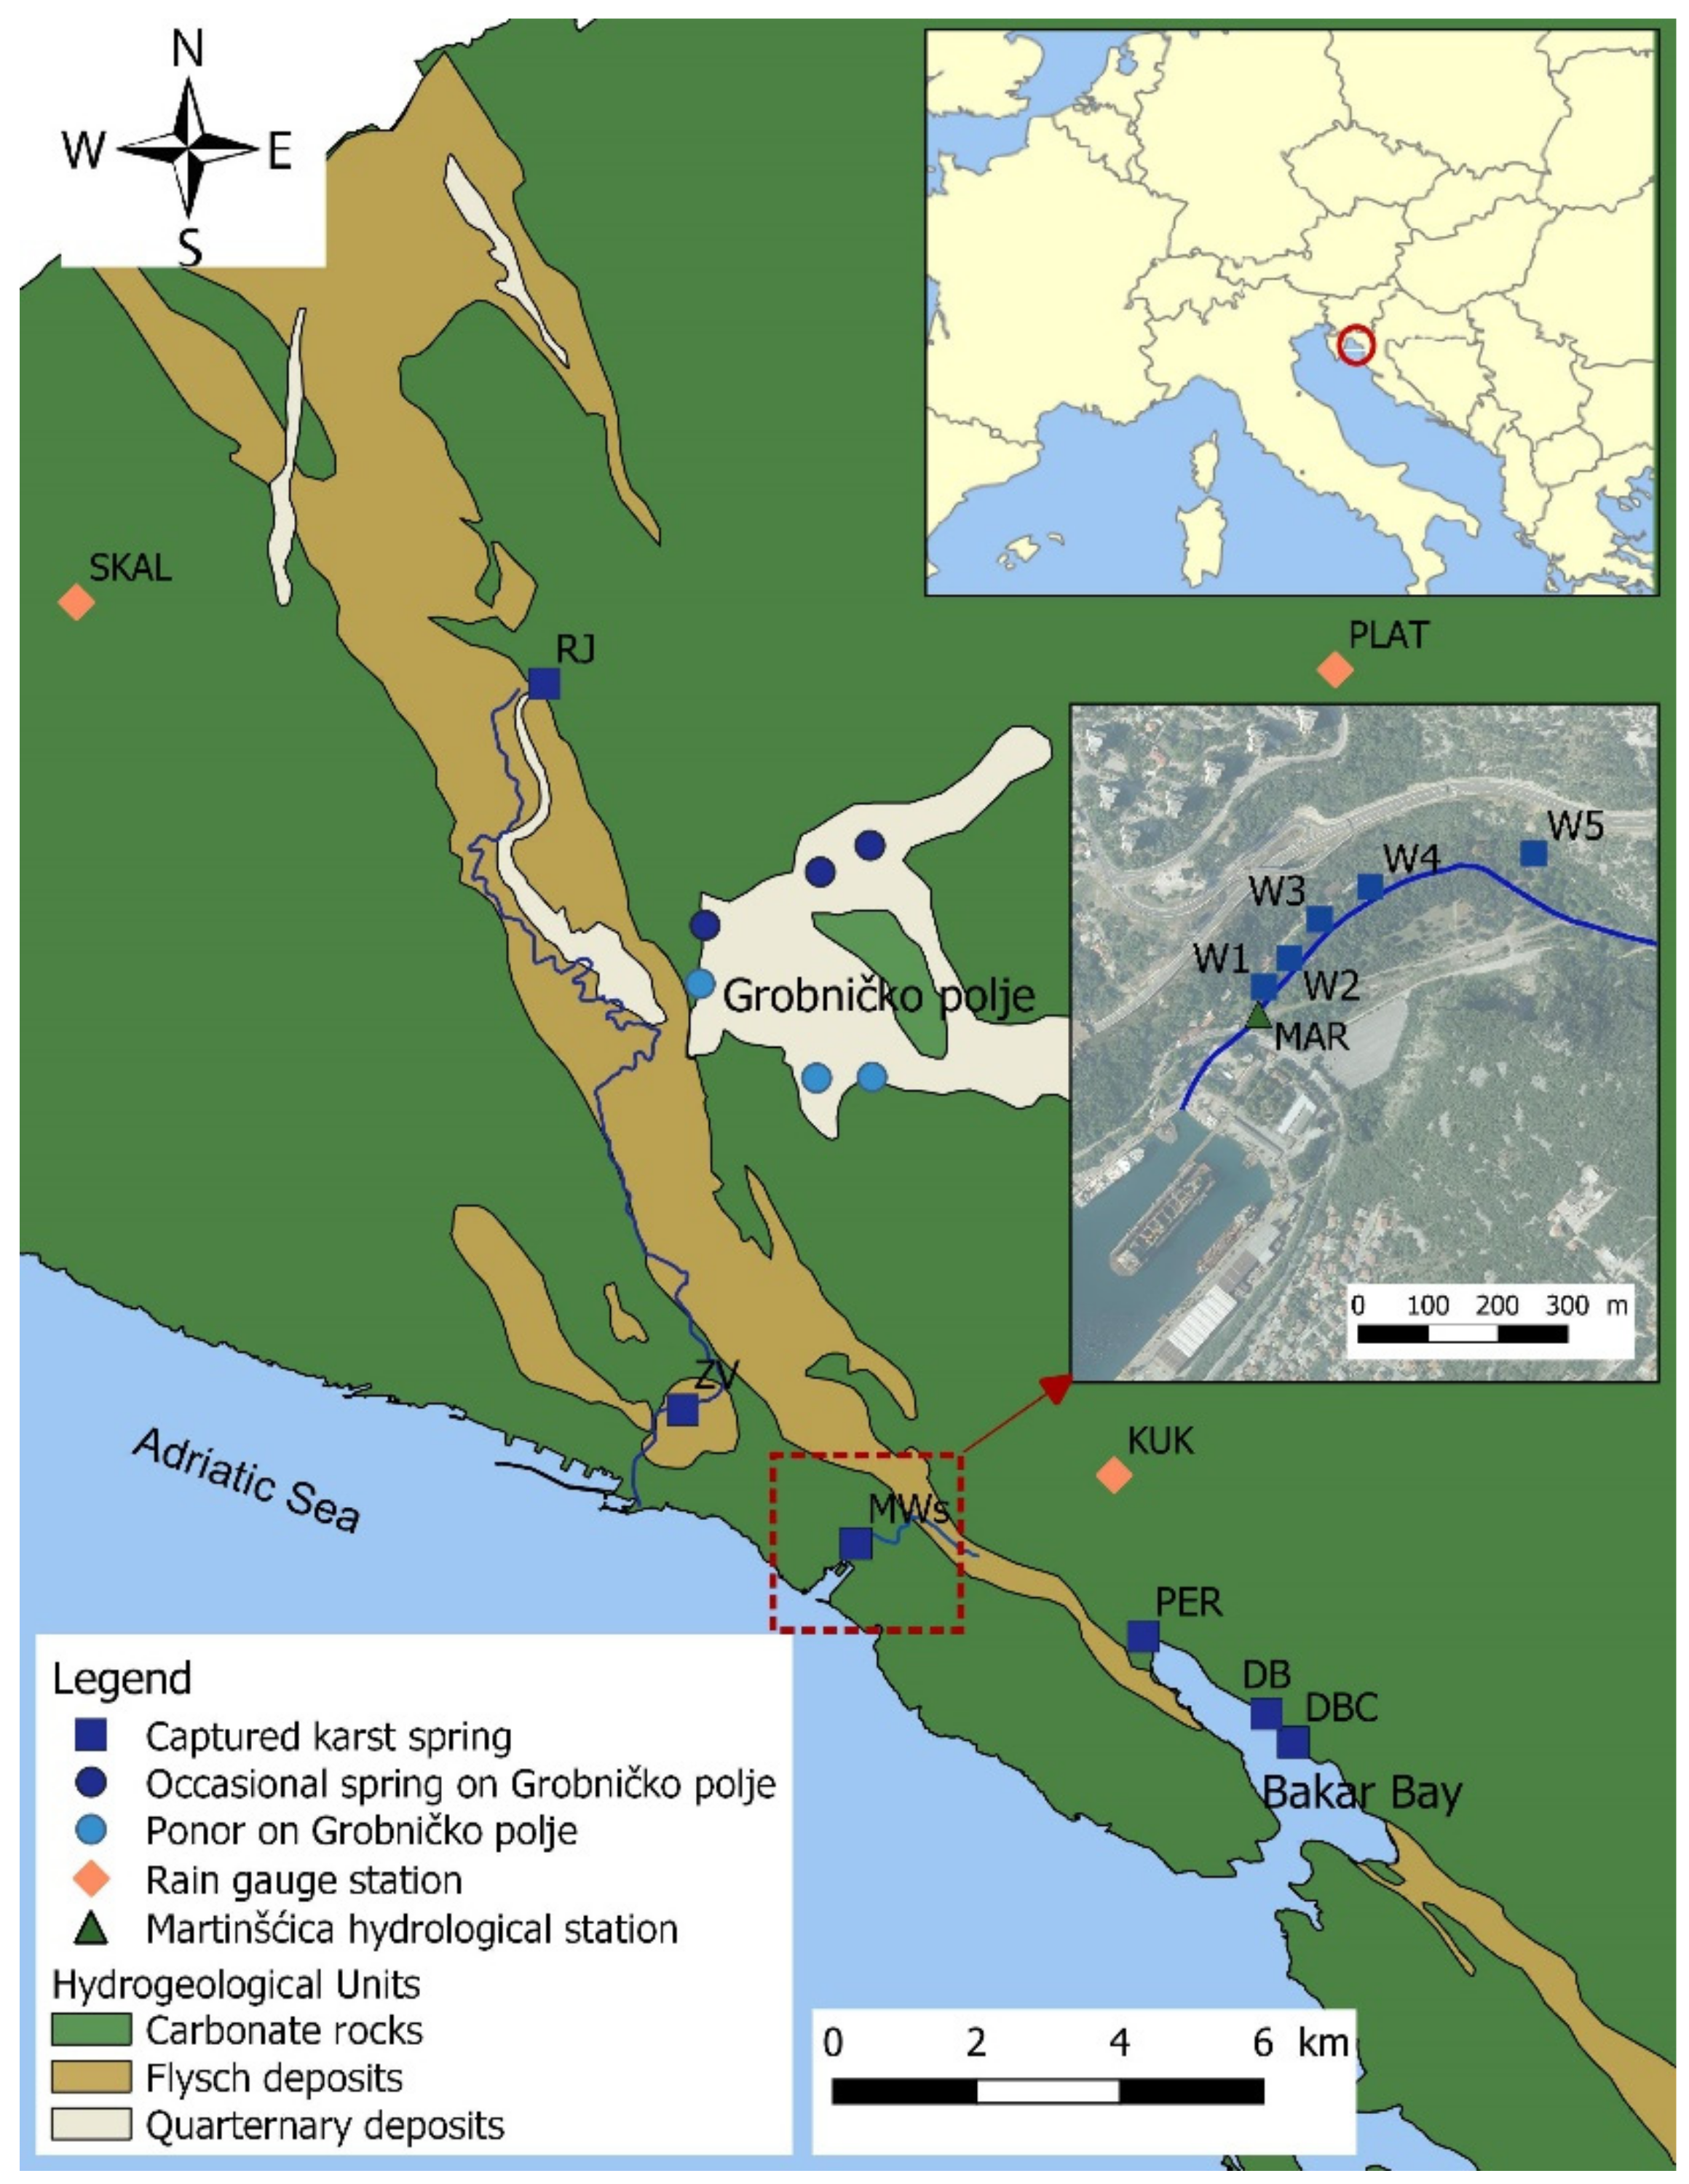
Figure 1.
Upper right corner: position of the study area. The main map: hydrogeological map of the analyzed area showing the main karst springs (RJ—Rječina Spring, ZV–Zvir, MWs—Martišćica wells, PER–Perilo, DB—Dobra, DBC—Dobrica), Rječina River (blue line at the main map), occasional springs and ponors at Grobničko polje and rain gauge stations for sampling cumulative monthly precipitation (KUK—Kukuljanovo, SKAL—Škalnica, PLAT—Platak). The red dashed line square and map positioned right: position of Martinšćica wells W1–W5; blue line—the Javor stream, MAR—Martinšćica hydrological station. Based on [
20].
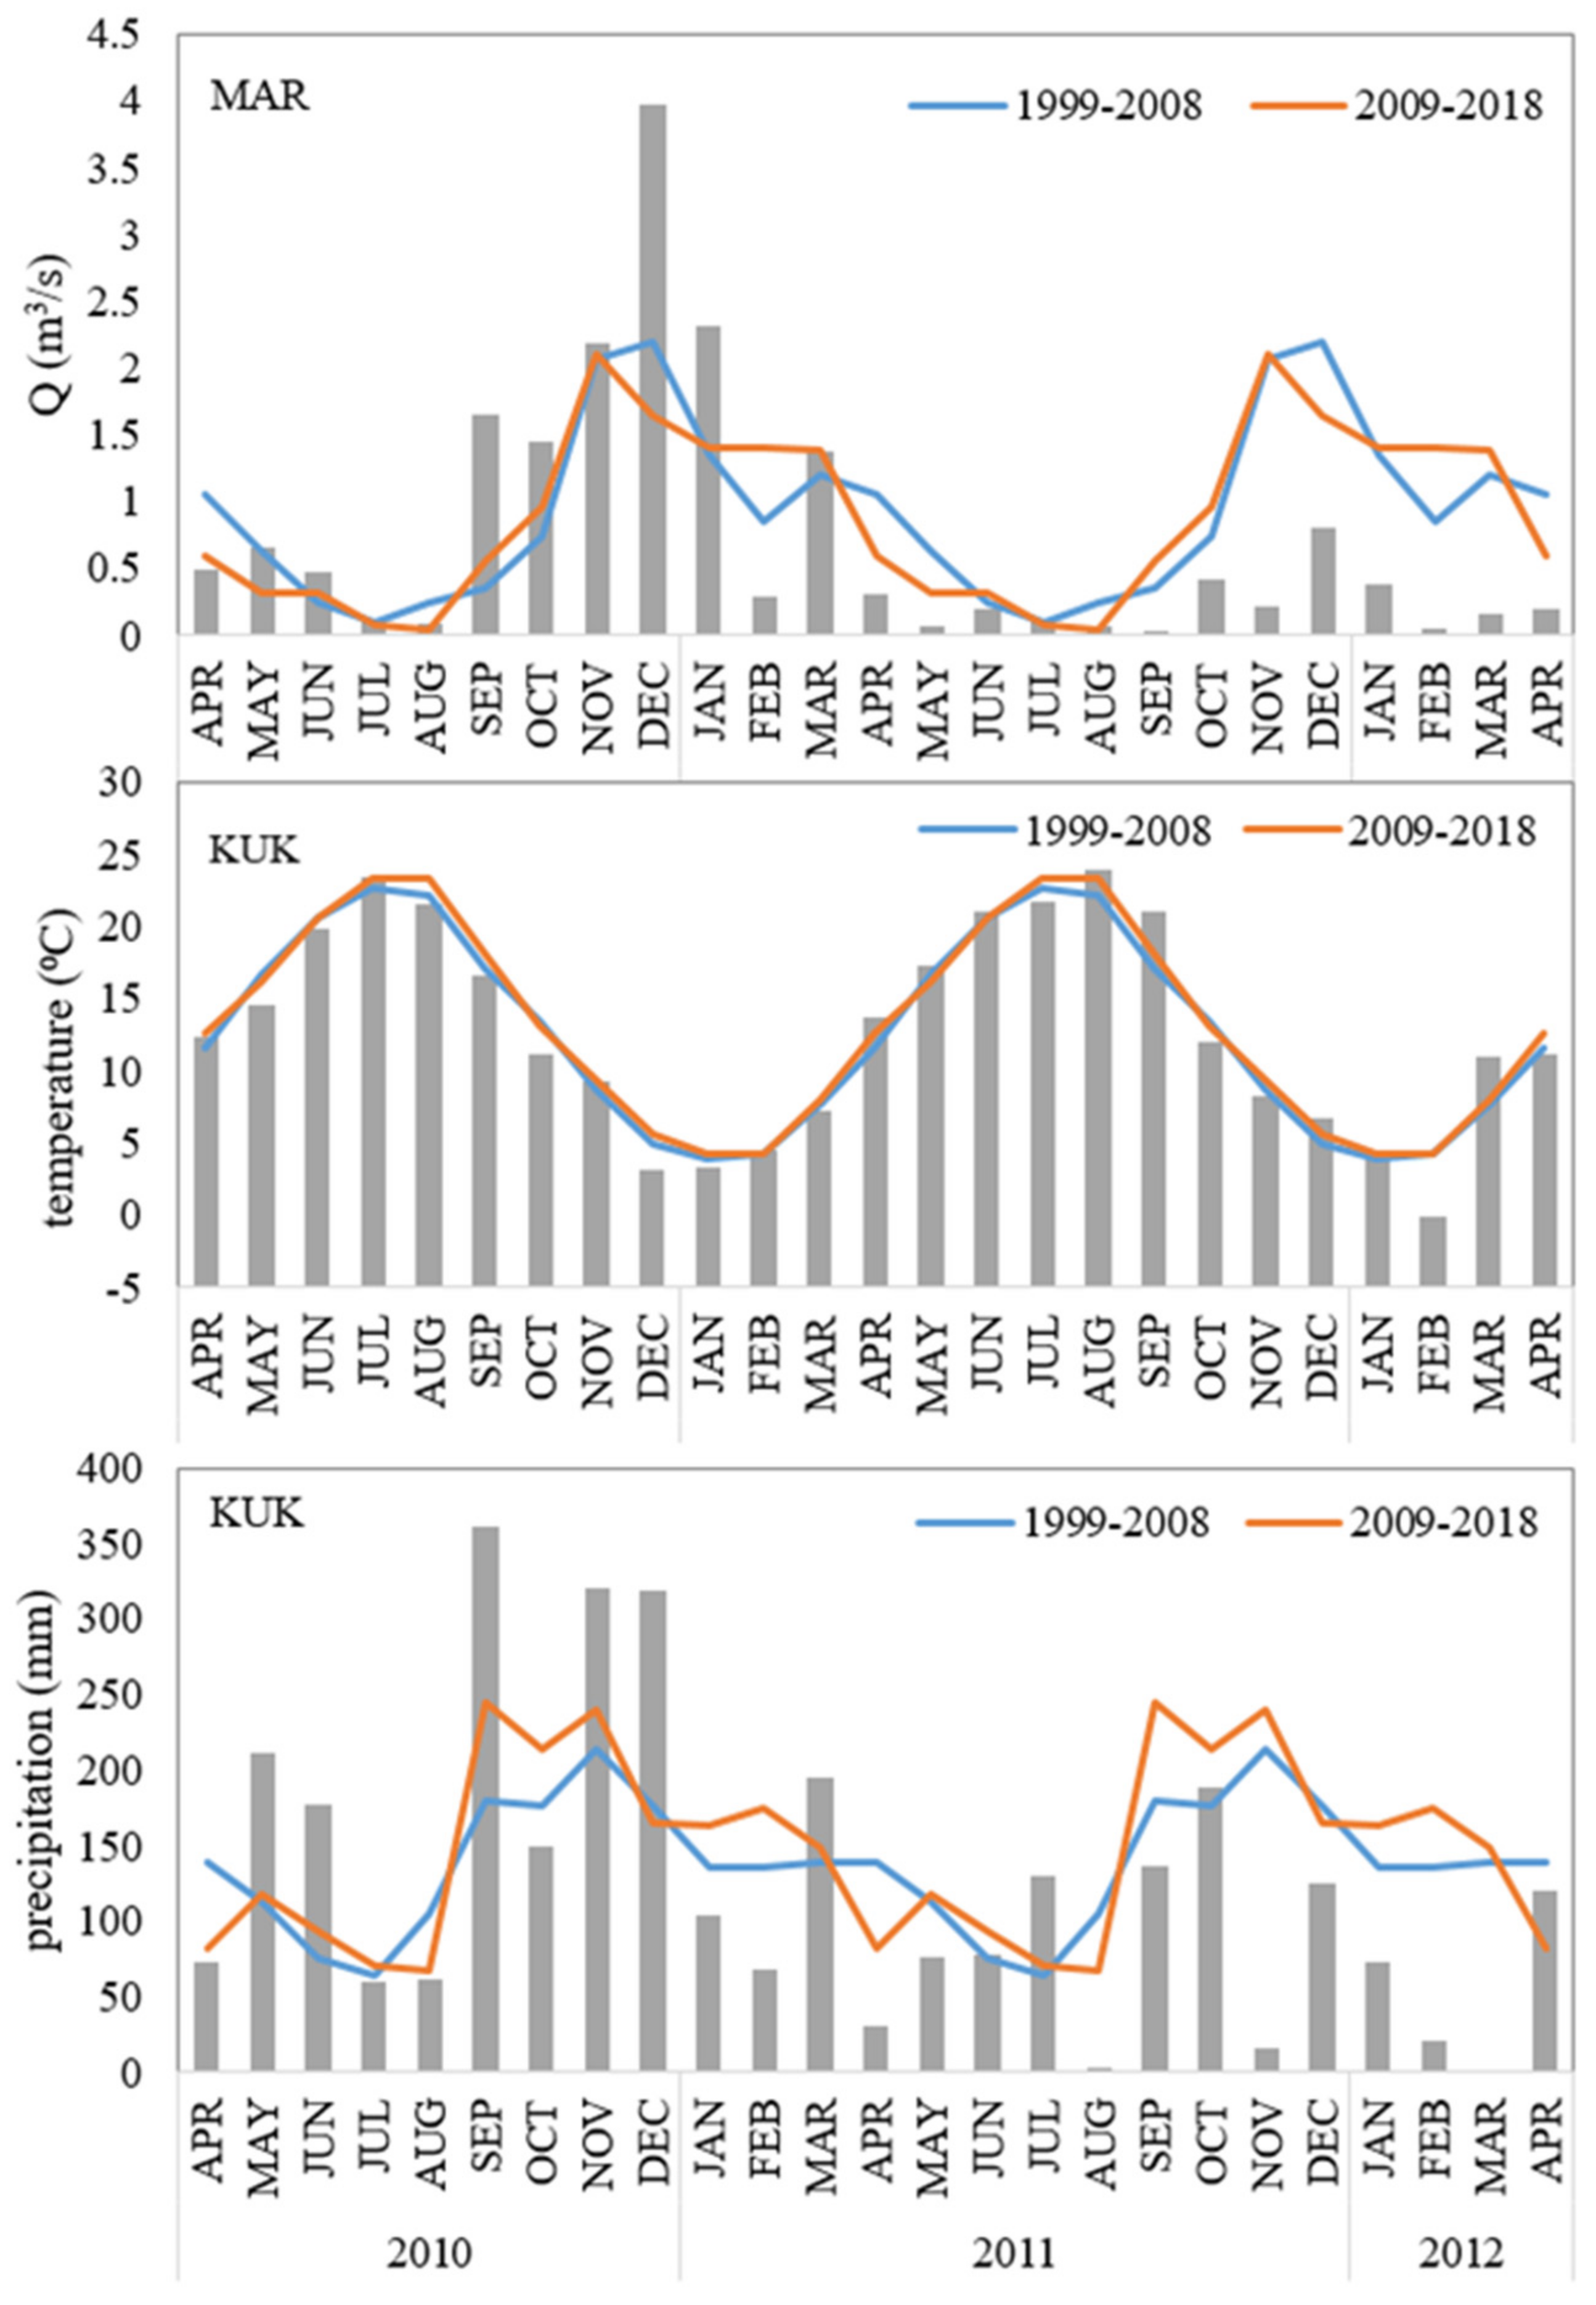
Figure 2.
The bar graphs show the average monthly discharge at the Martinšćica hydrological station (MAR, upper graph), average monthly air temperatures (middle graph), and total monthly precipitation (bottom graph) from April 2010 to April 2012. Meteorological data are from the Kukuljanovo CMHS meteorological station (KUK). The graphs also show the monthly averages for each variable for the ten-year periods 1999–2008 (blue lines) and 2009–2018 (orange lines).
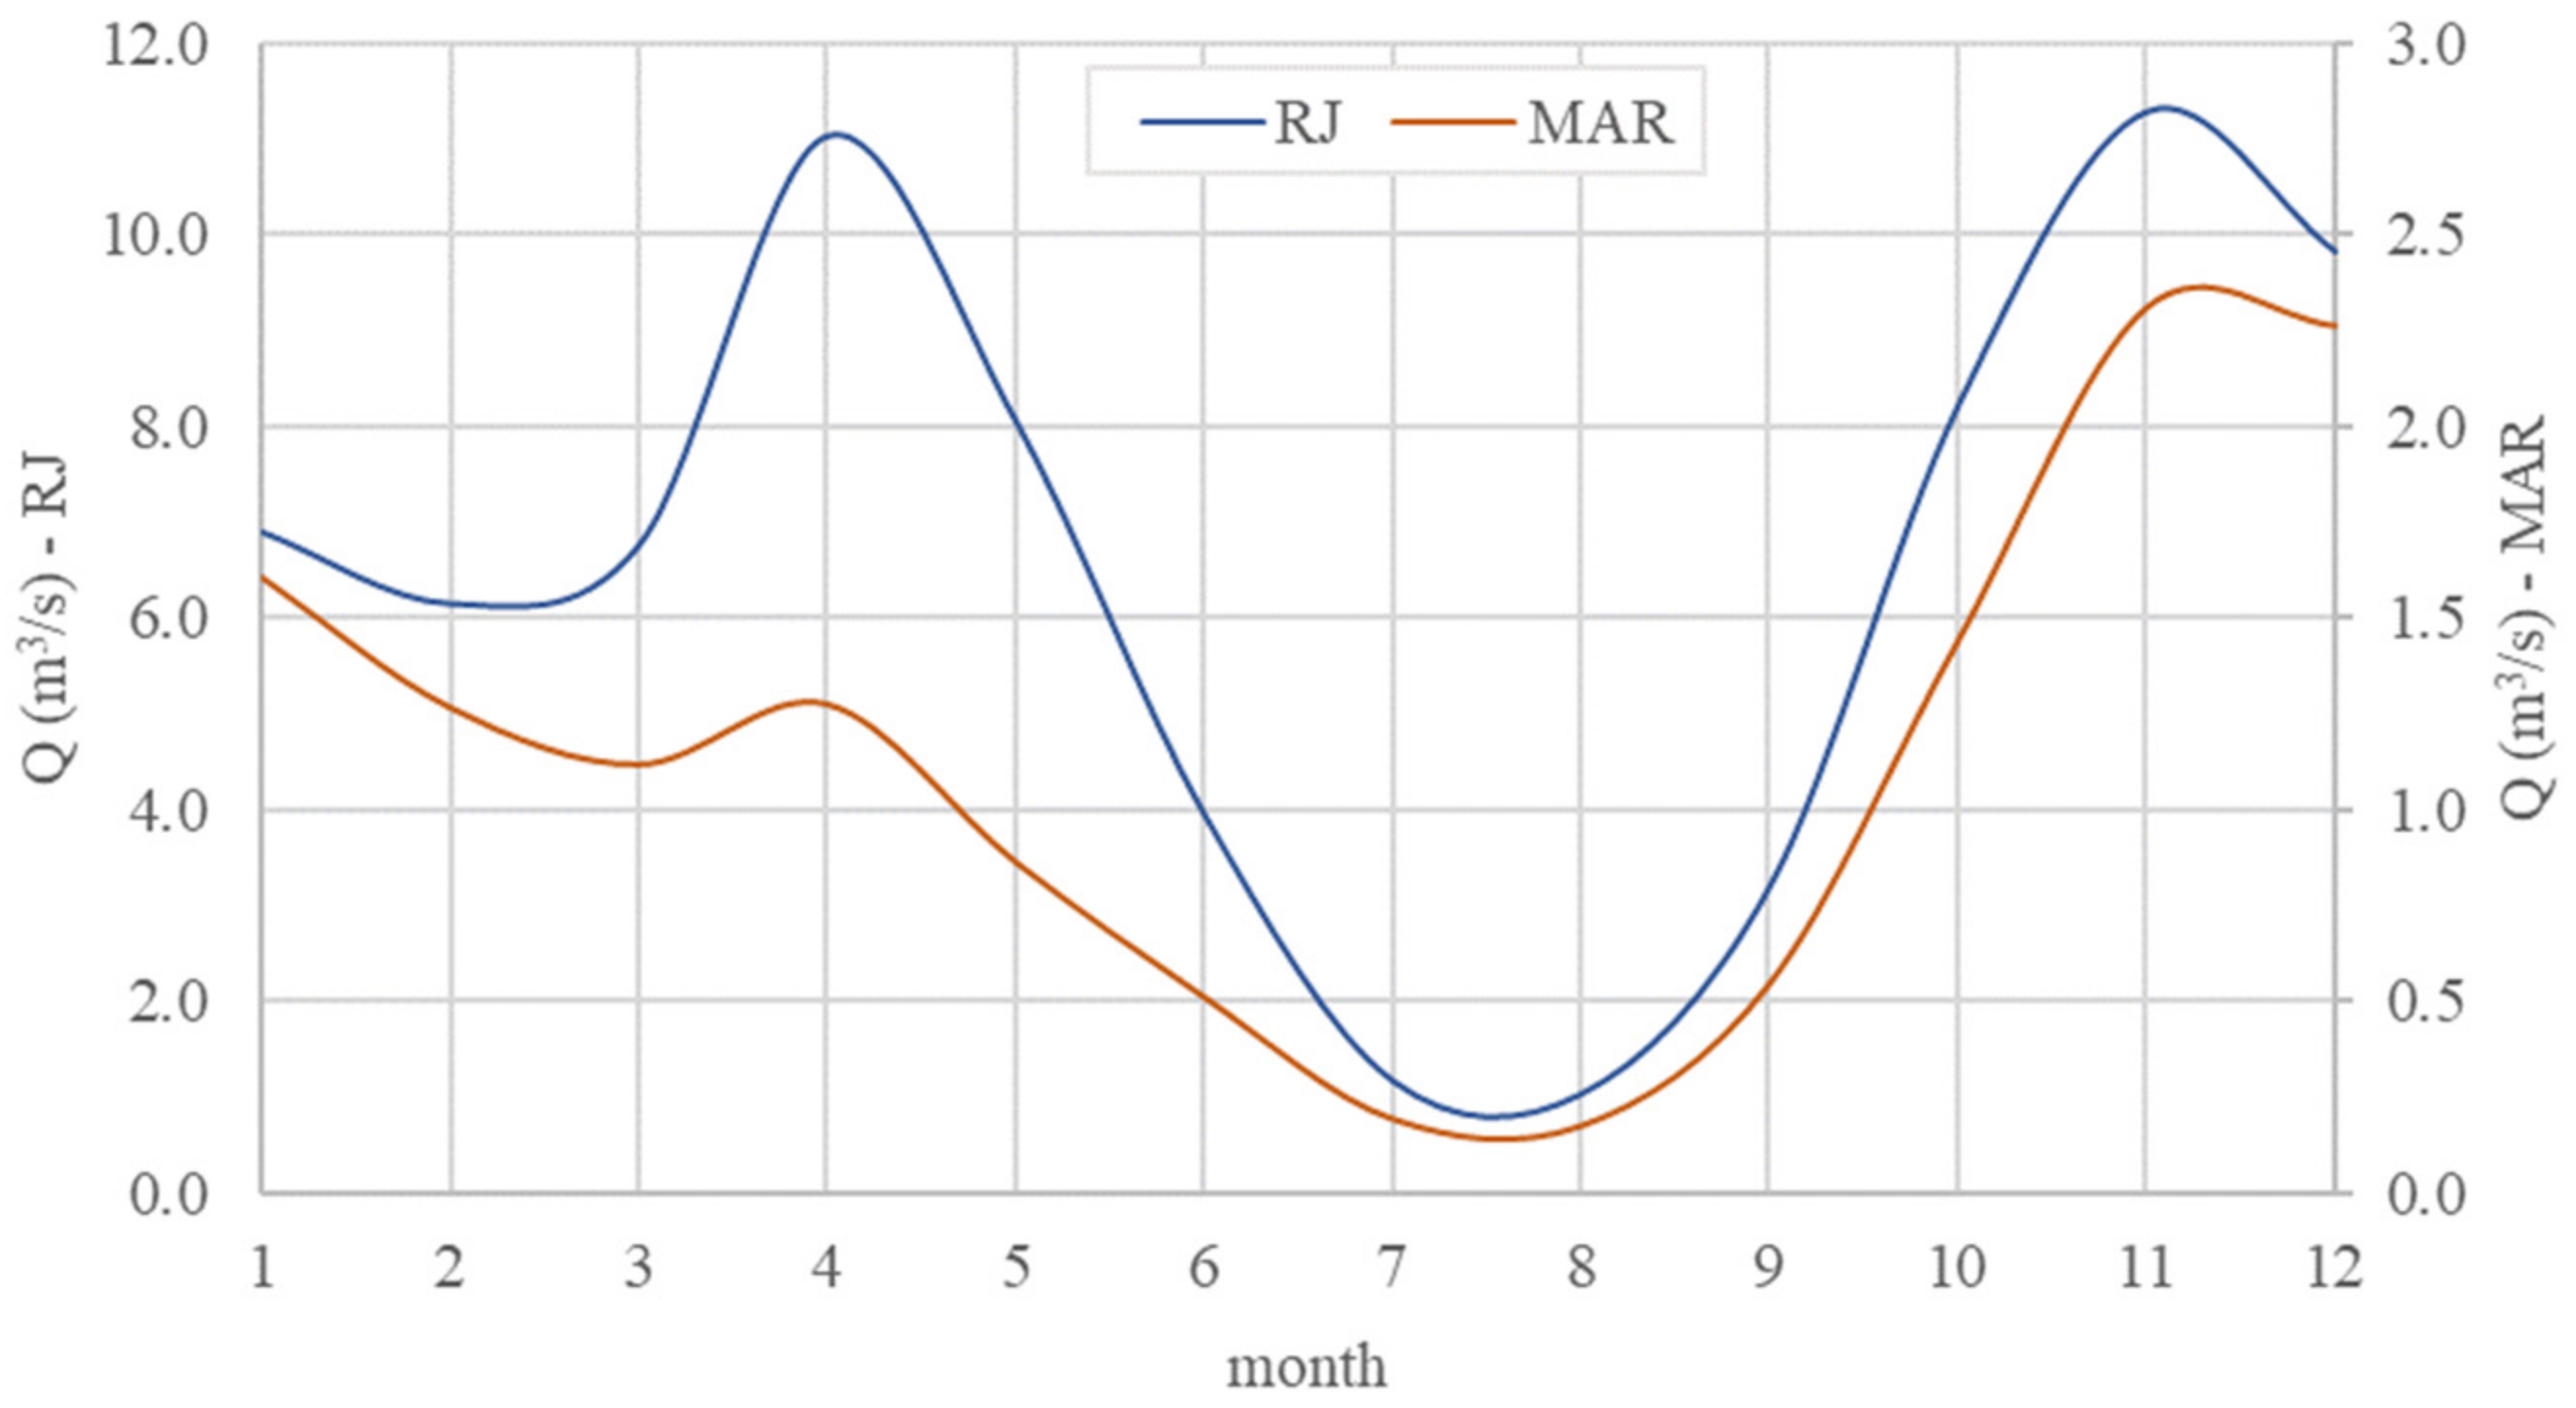
Figure 3.
Monthly discharges for Rječina Spring (RJ) and Martinšćica hydrological station (MAR) from 1975 to 2016. Due to a lack of data, the years 2001, 2007, and 2008 are not included in the analysis. The months of the year are represented by the numbers 1–12, beginning with January and ending with December.
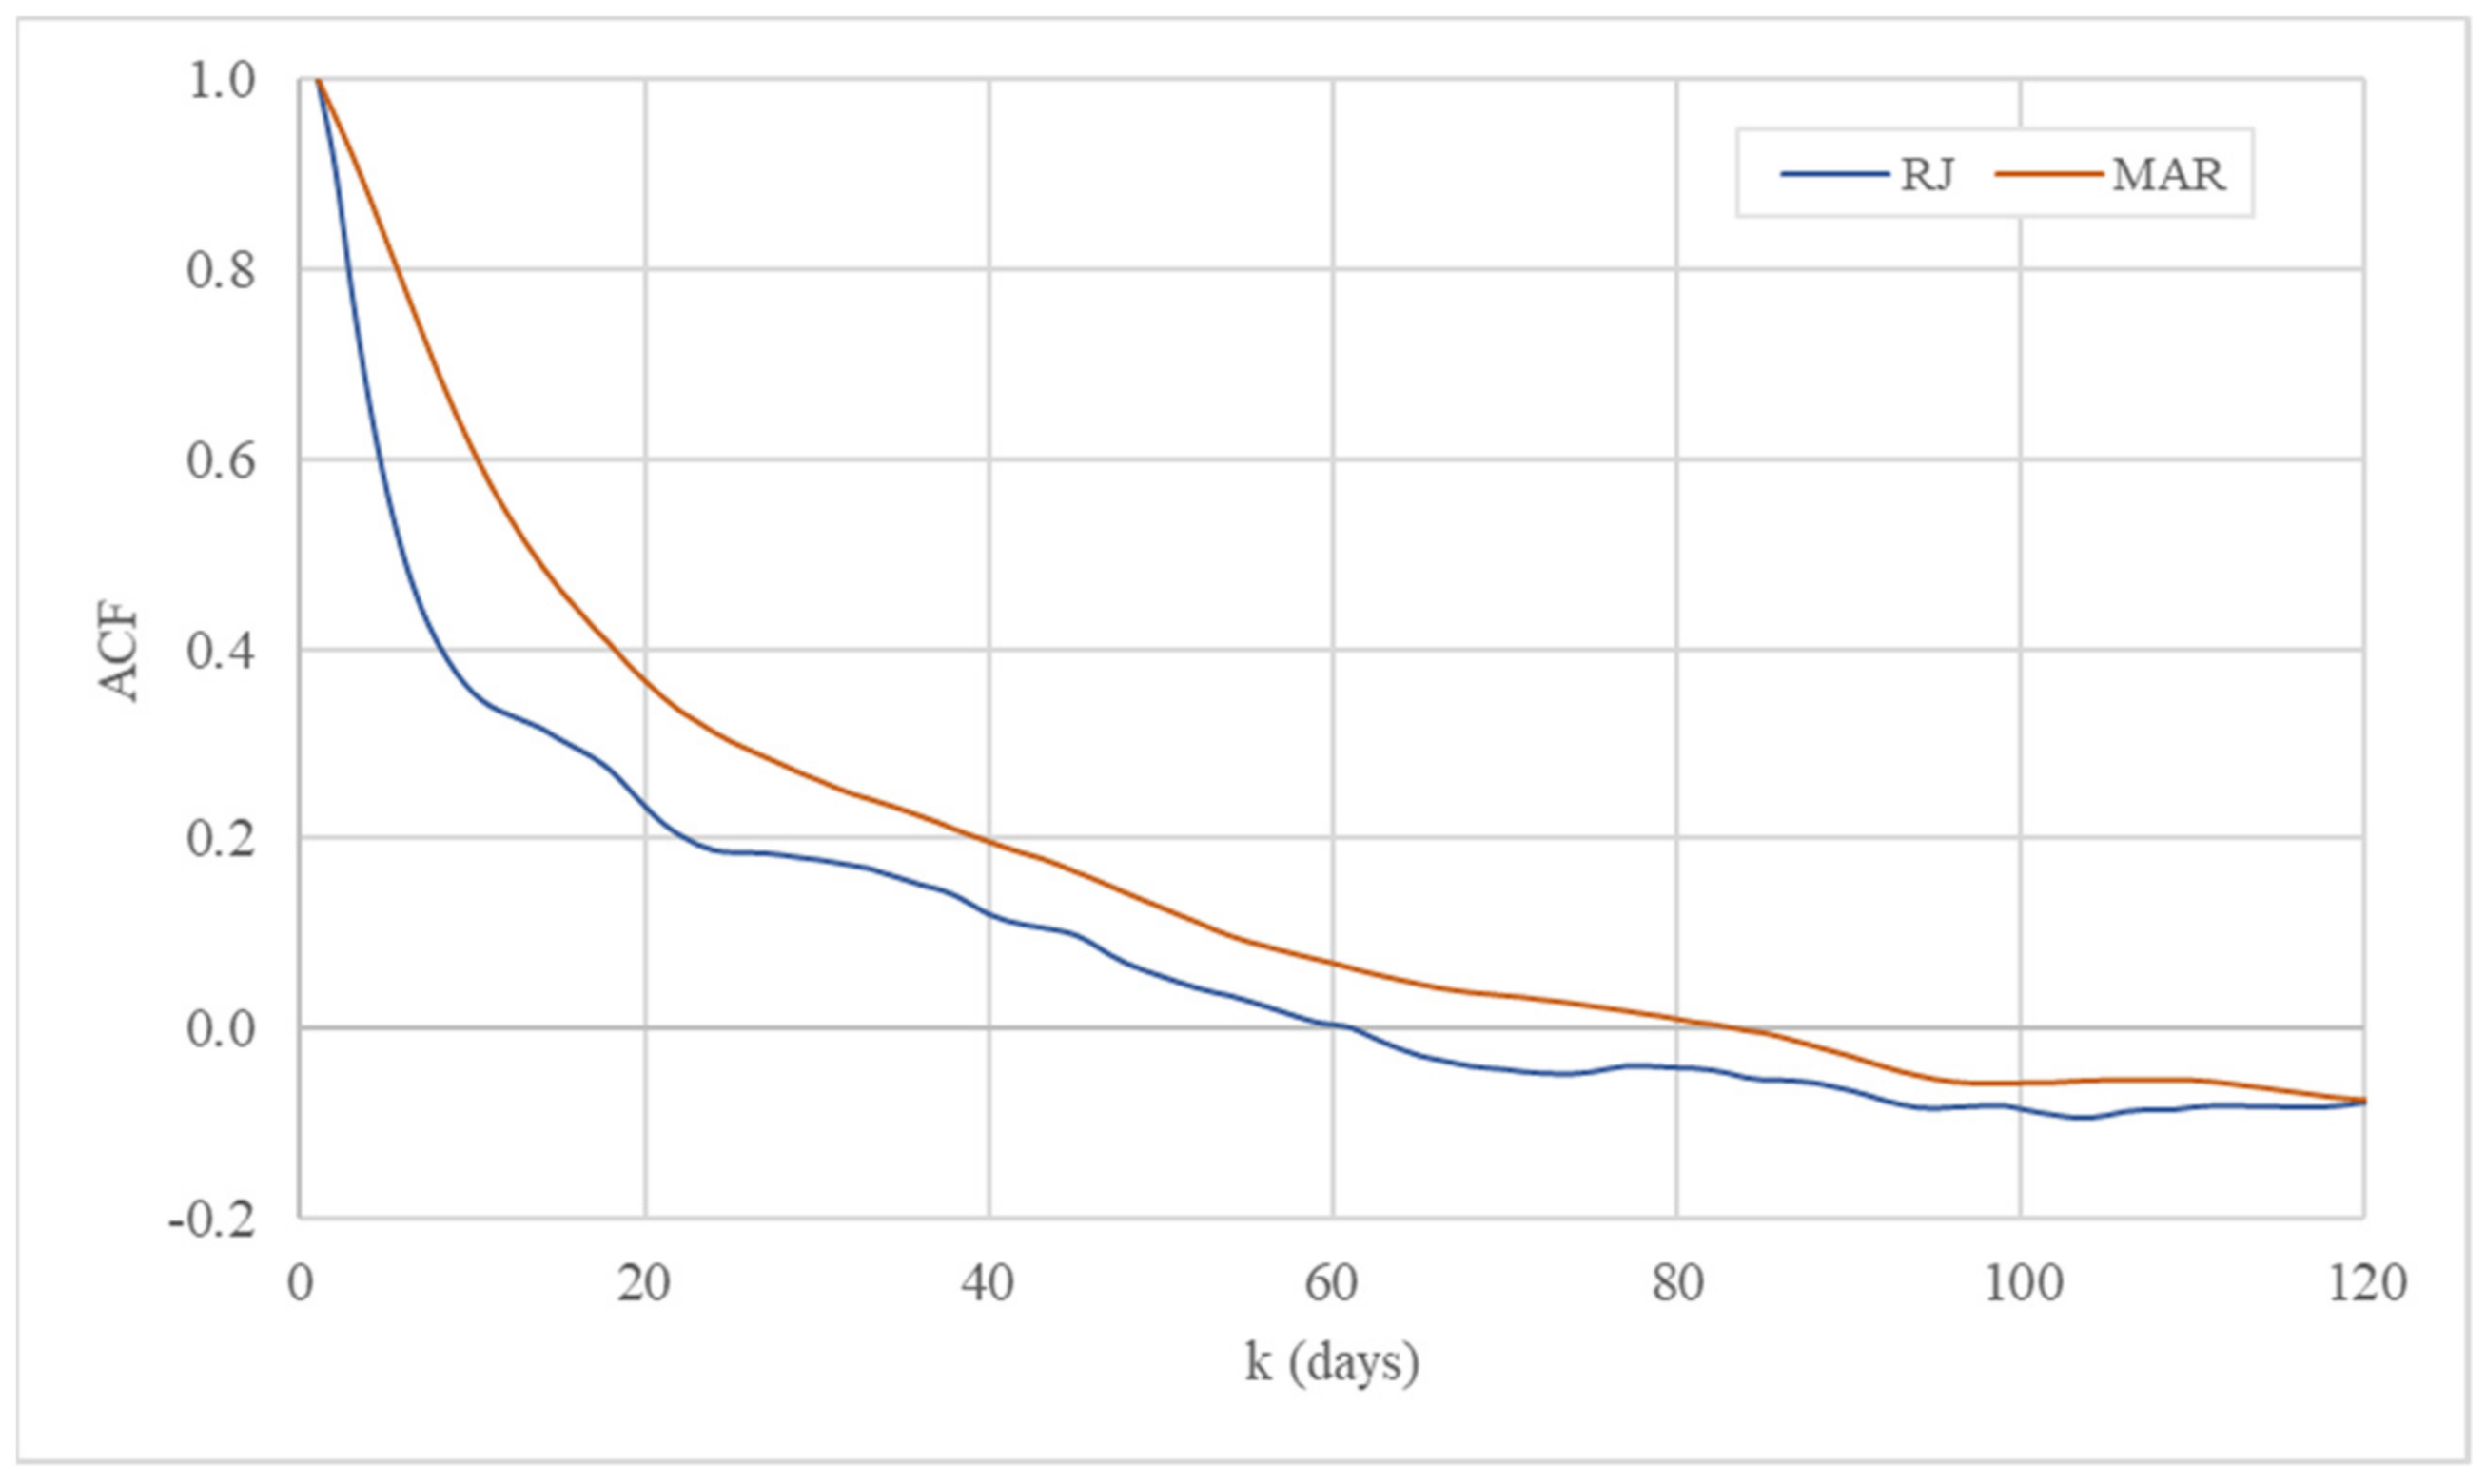
Figure 4.
Auto-correlation functions (ACF) of daily discharge series at Rječina Spring (RJ) and Martinšćica hydrological station (MAR).
Figure 4.
Auto-correlation functions (ACF) of daily discharge series at Rječina Spring (RJ) and Martinšćica hydrological station (MAR).
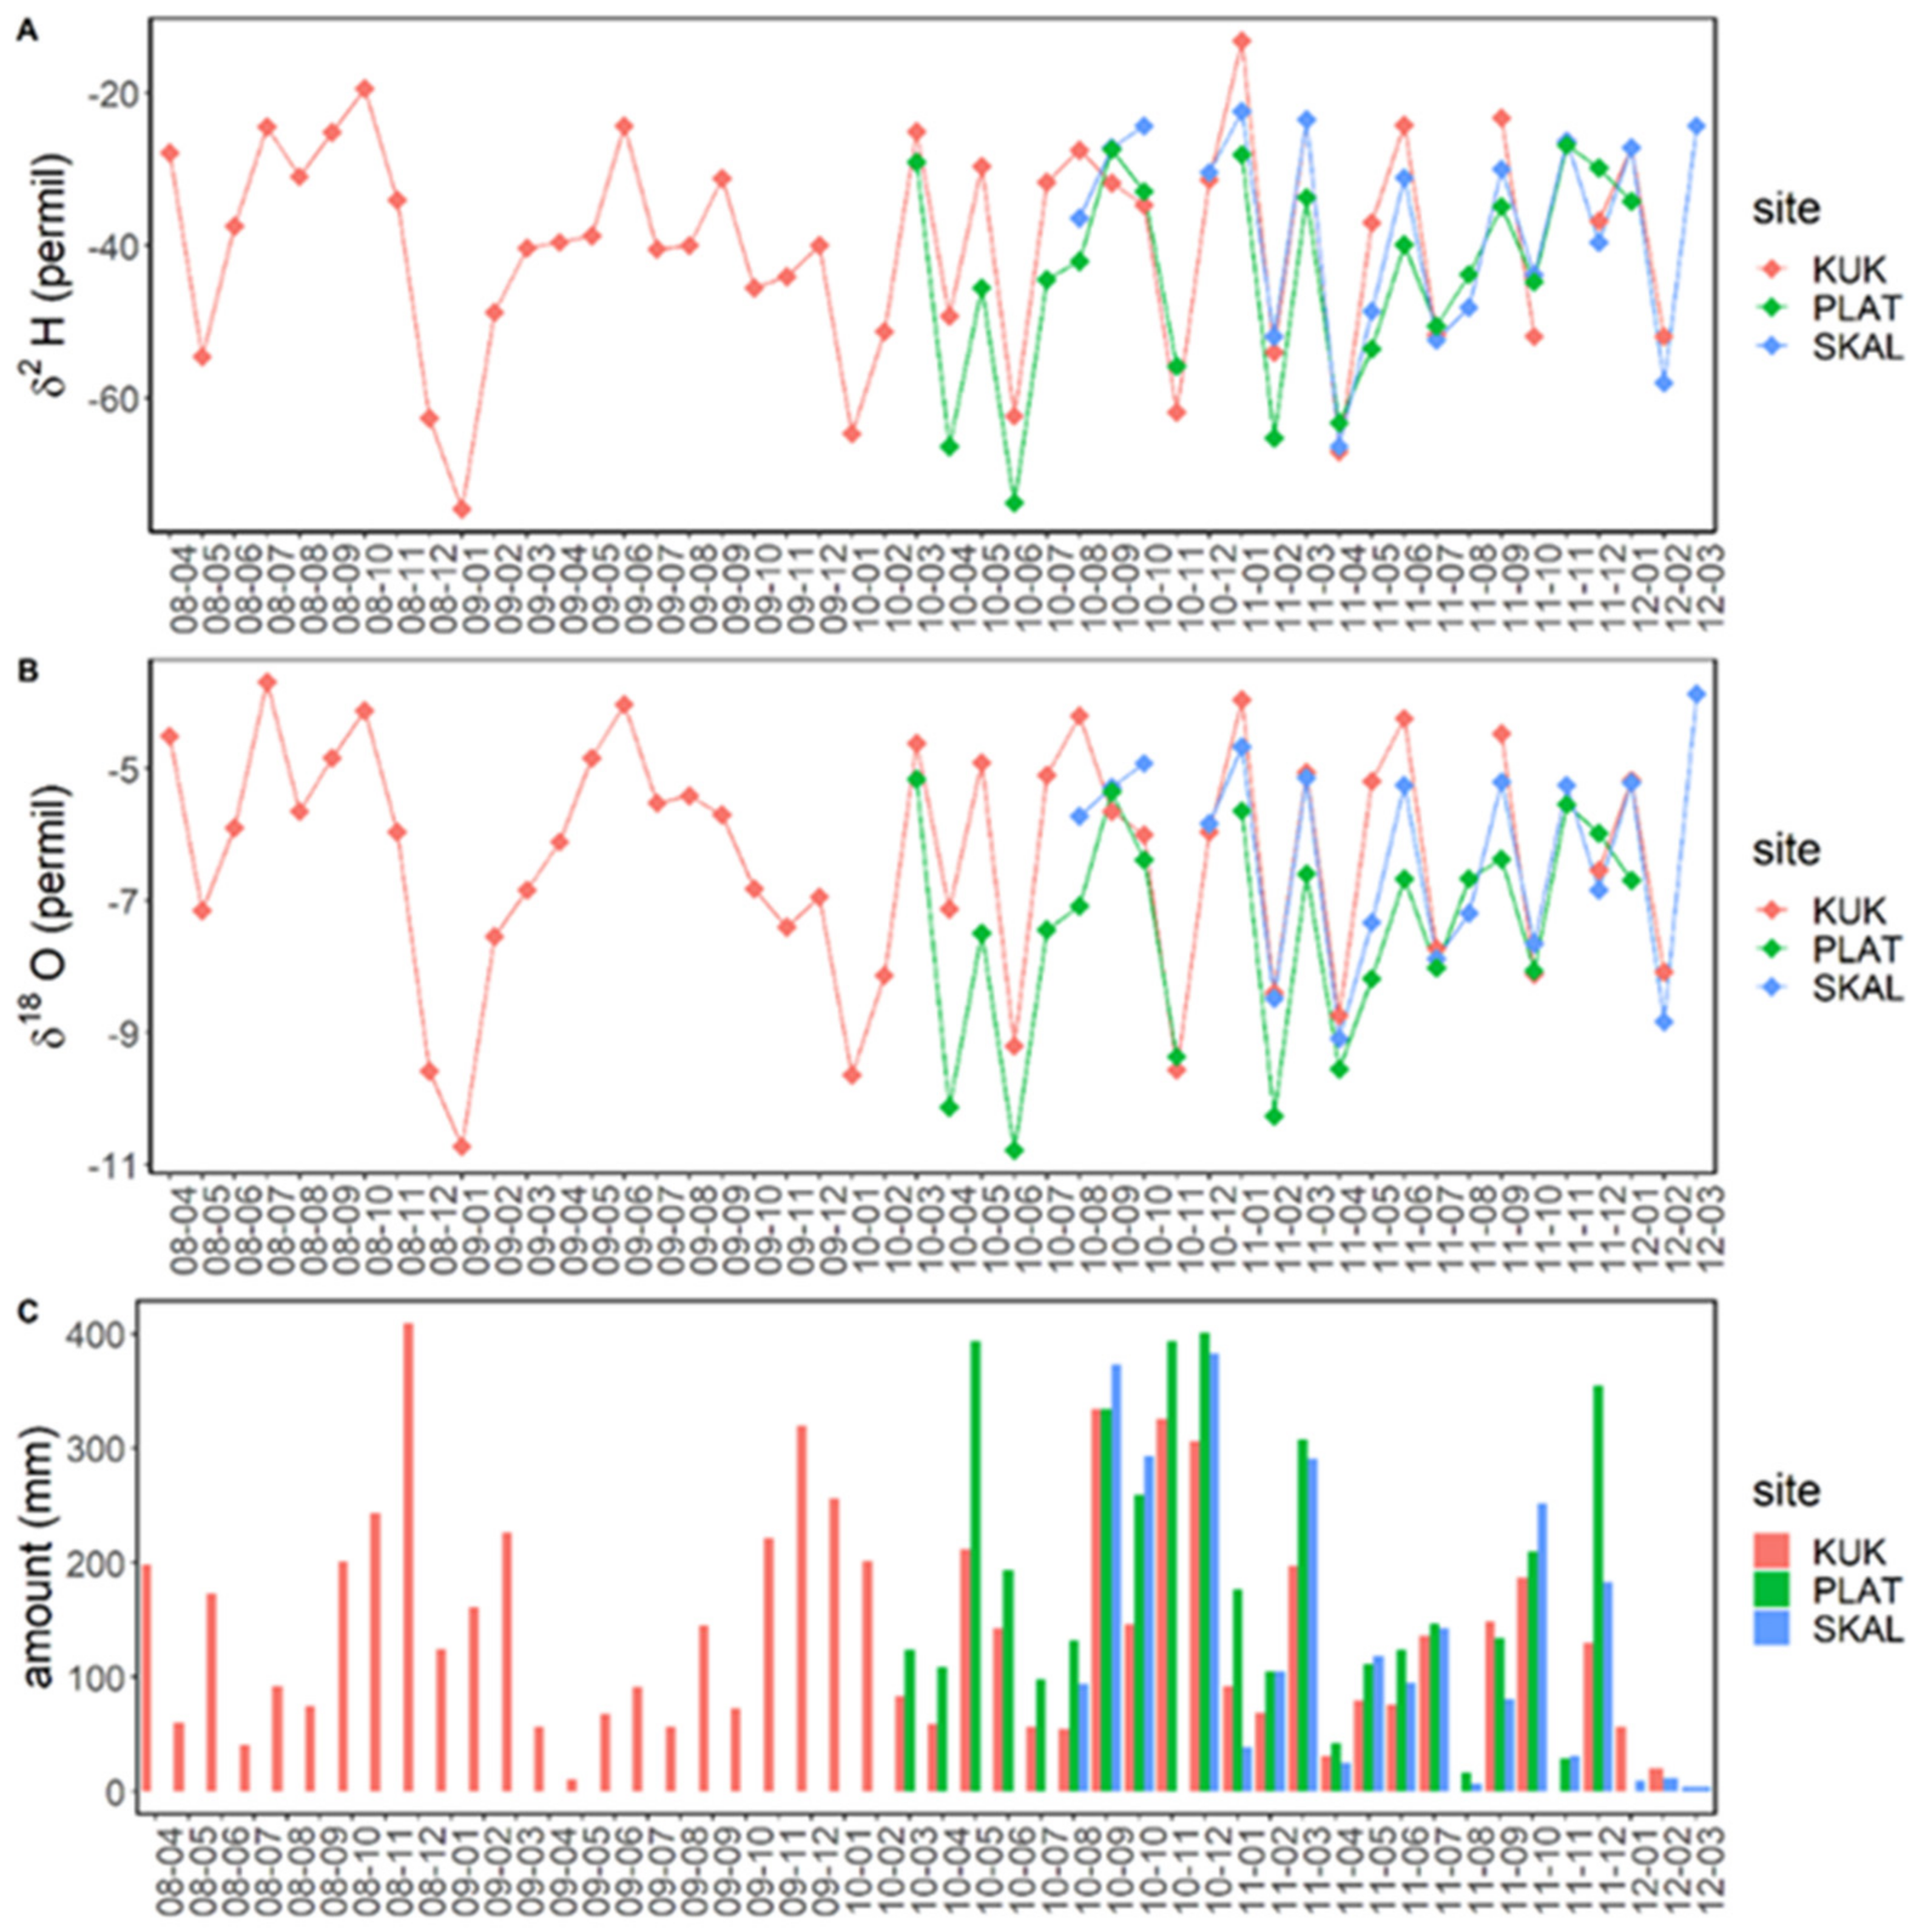
Figure 5.
(A) δ2H values, (B) δ18O values, and (C) amount of monthly precipitation of cumulative monthly precipitation samples at Kukuljanovo (KUK), Platak (PLAT) and Škalnica (SKAL) rain gauging stations.
Figure 5.
(A) δ2H values, (B) δ18O values, and (C) amount of monthly precipitation of cumulative monthly precipitation samples at Kukuljanovo (KUK), Platak (PLAT) and Škalnica (SKAL) rain gauging stations.
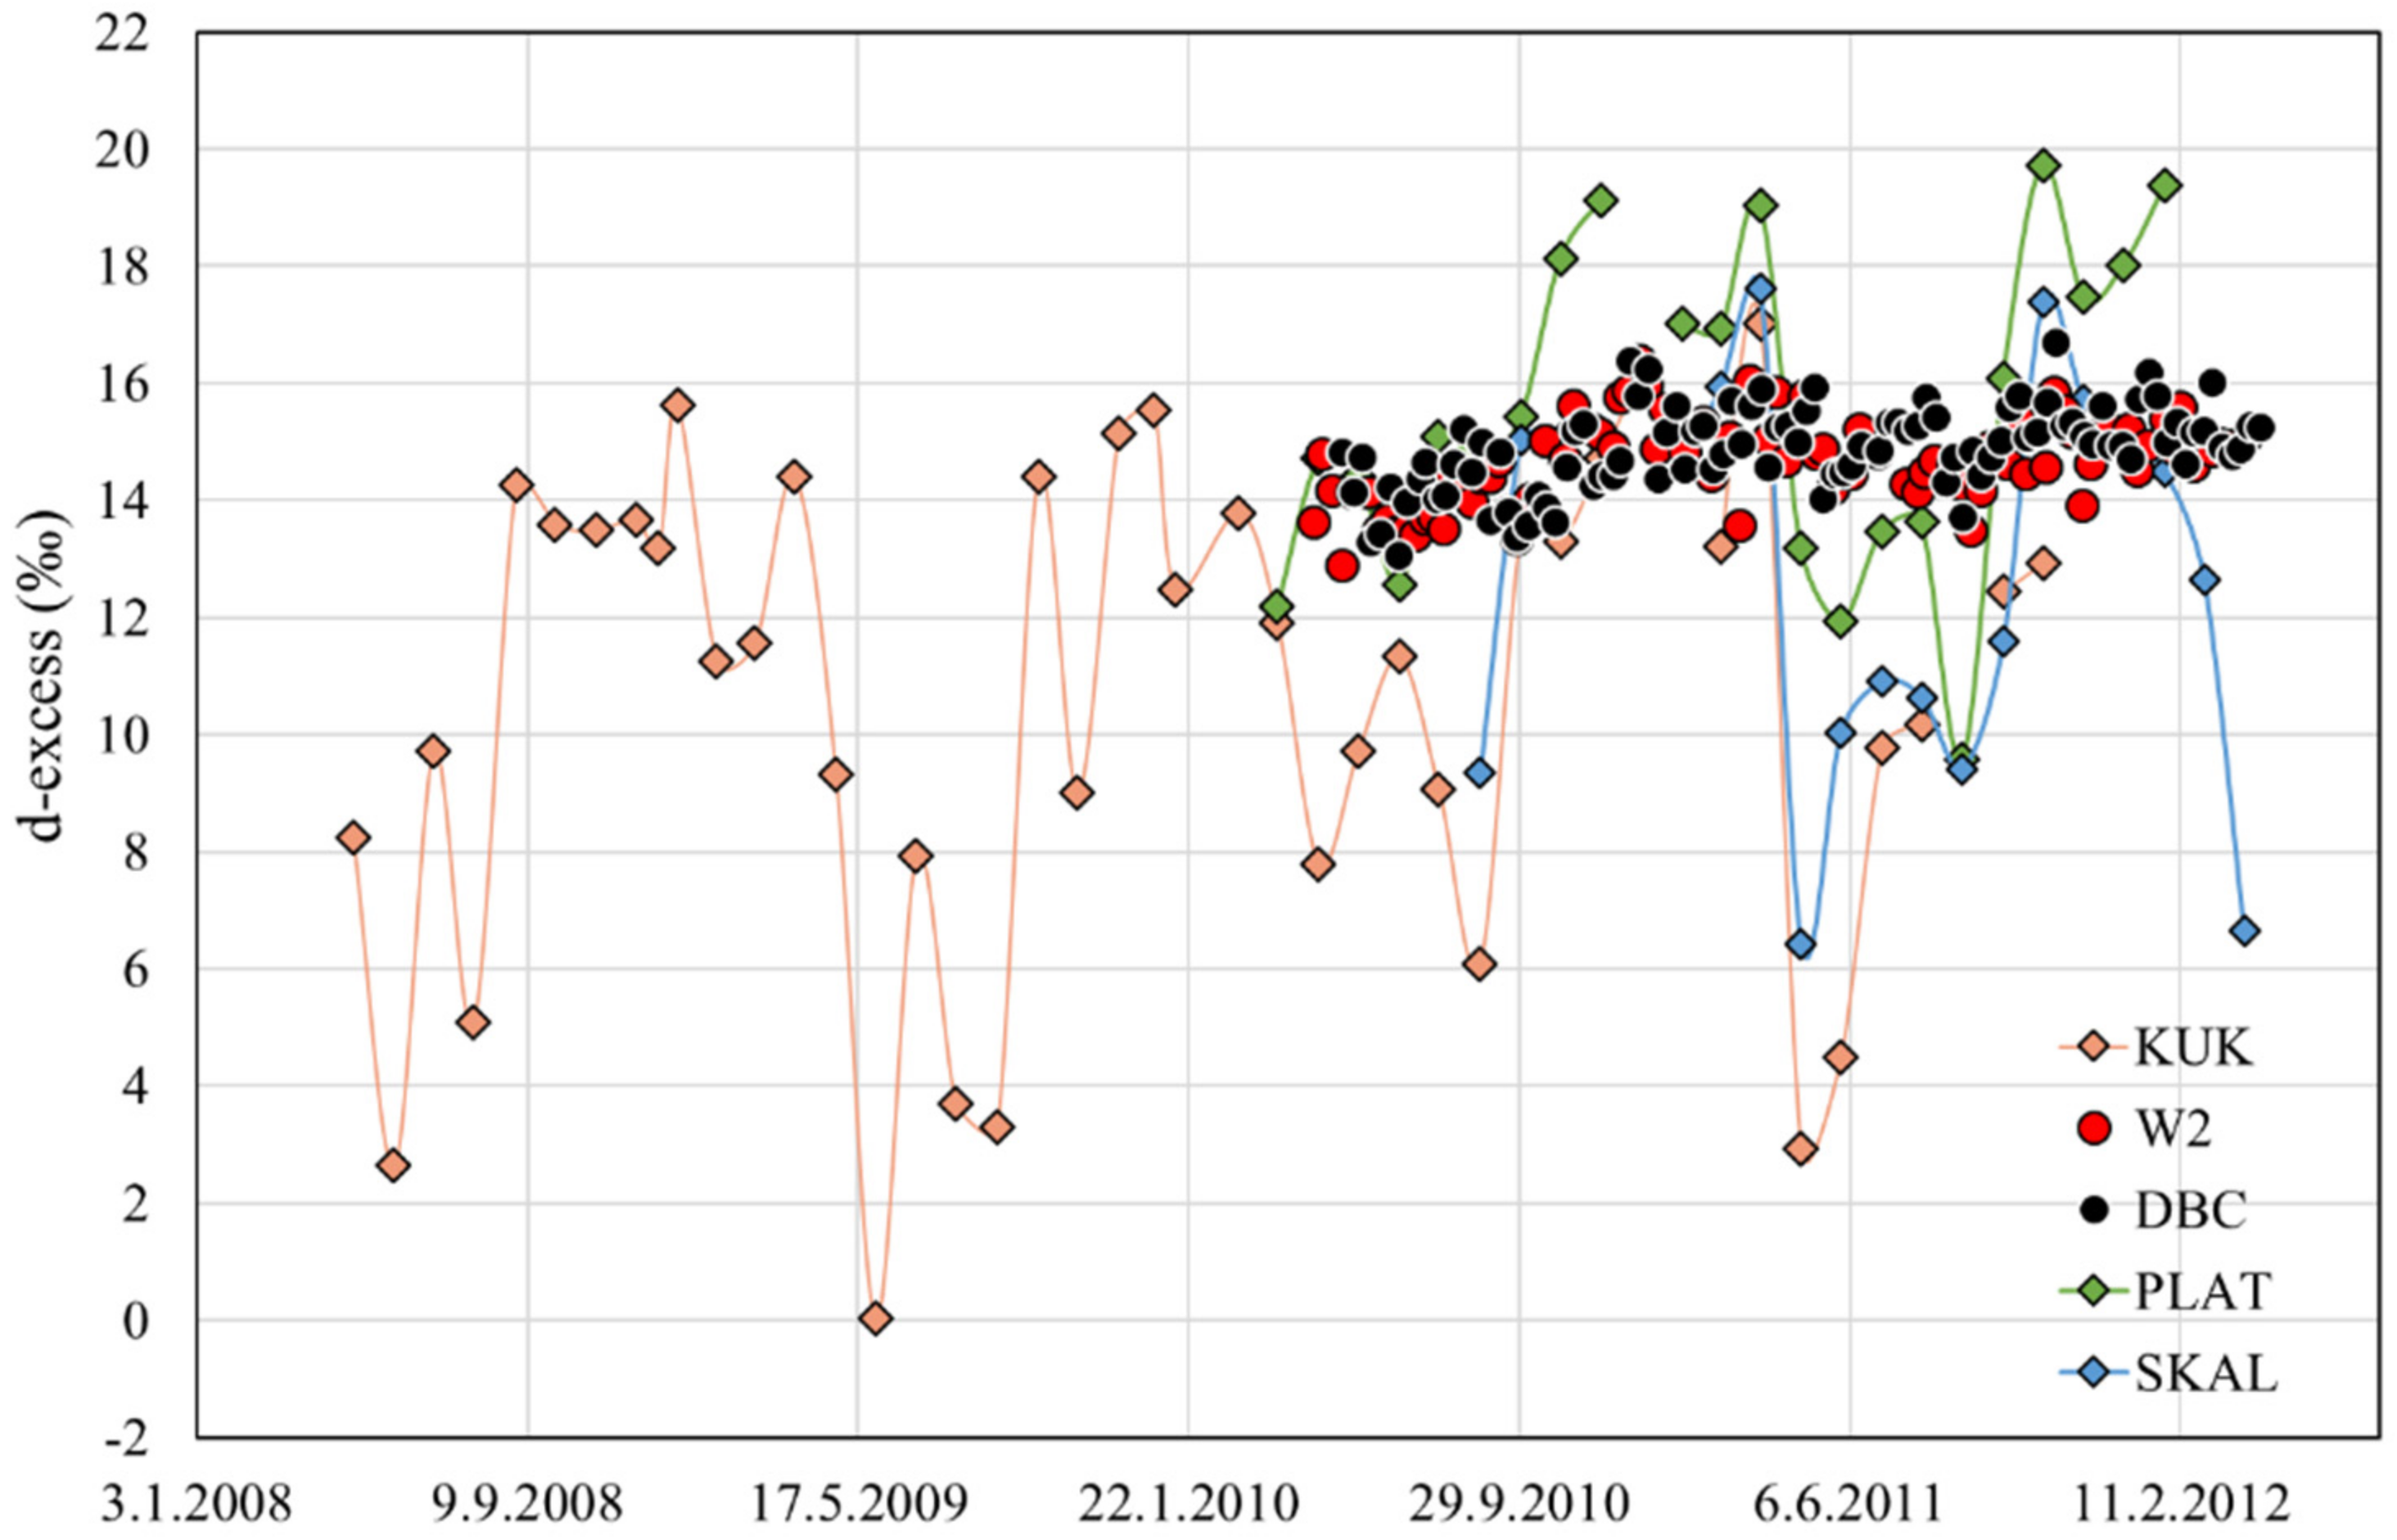
Figure 6.
D-excess values for precipitation collected at the stations Kukuljanovo (KUK), Škalnica (SKAL) and Platak (PLAT) and groundwater from Martinšćica well 2 (W2) and Dobrica (DBC) spring.
Figure 6.
D-excess values for precipitation collected at the stations Kukuljanovo (KUK), Škalnica (SKAL) and Platak (PLAT) and groundwater from Martinšćica well 2 (W2) and Dobrica (DBC) spring.
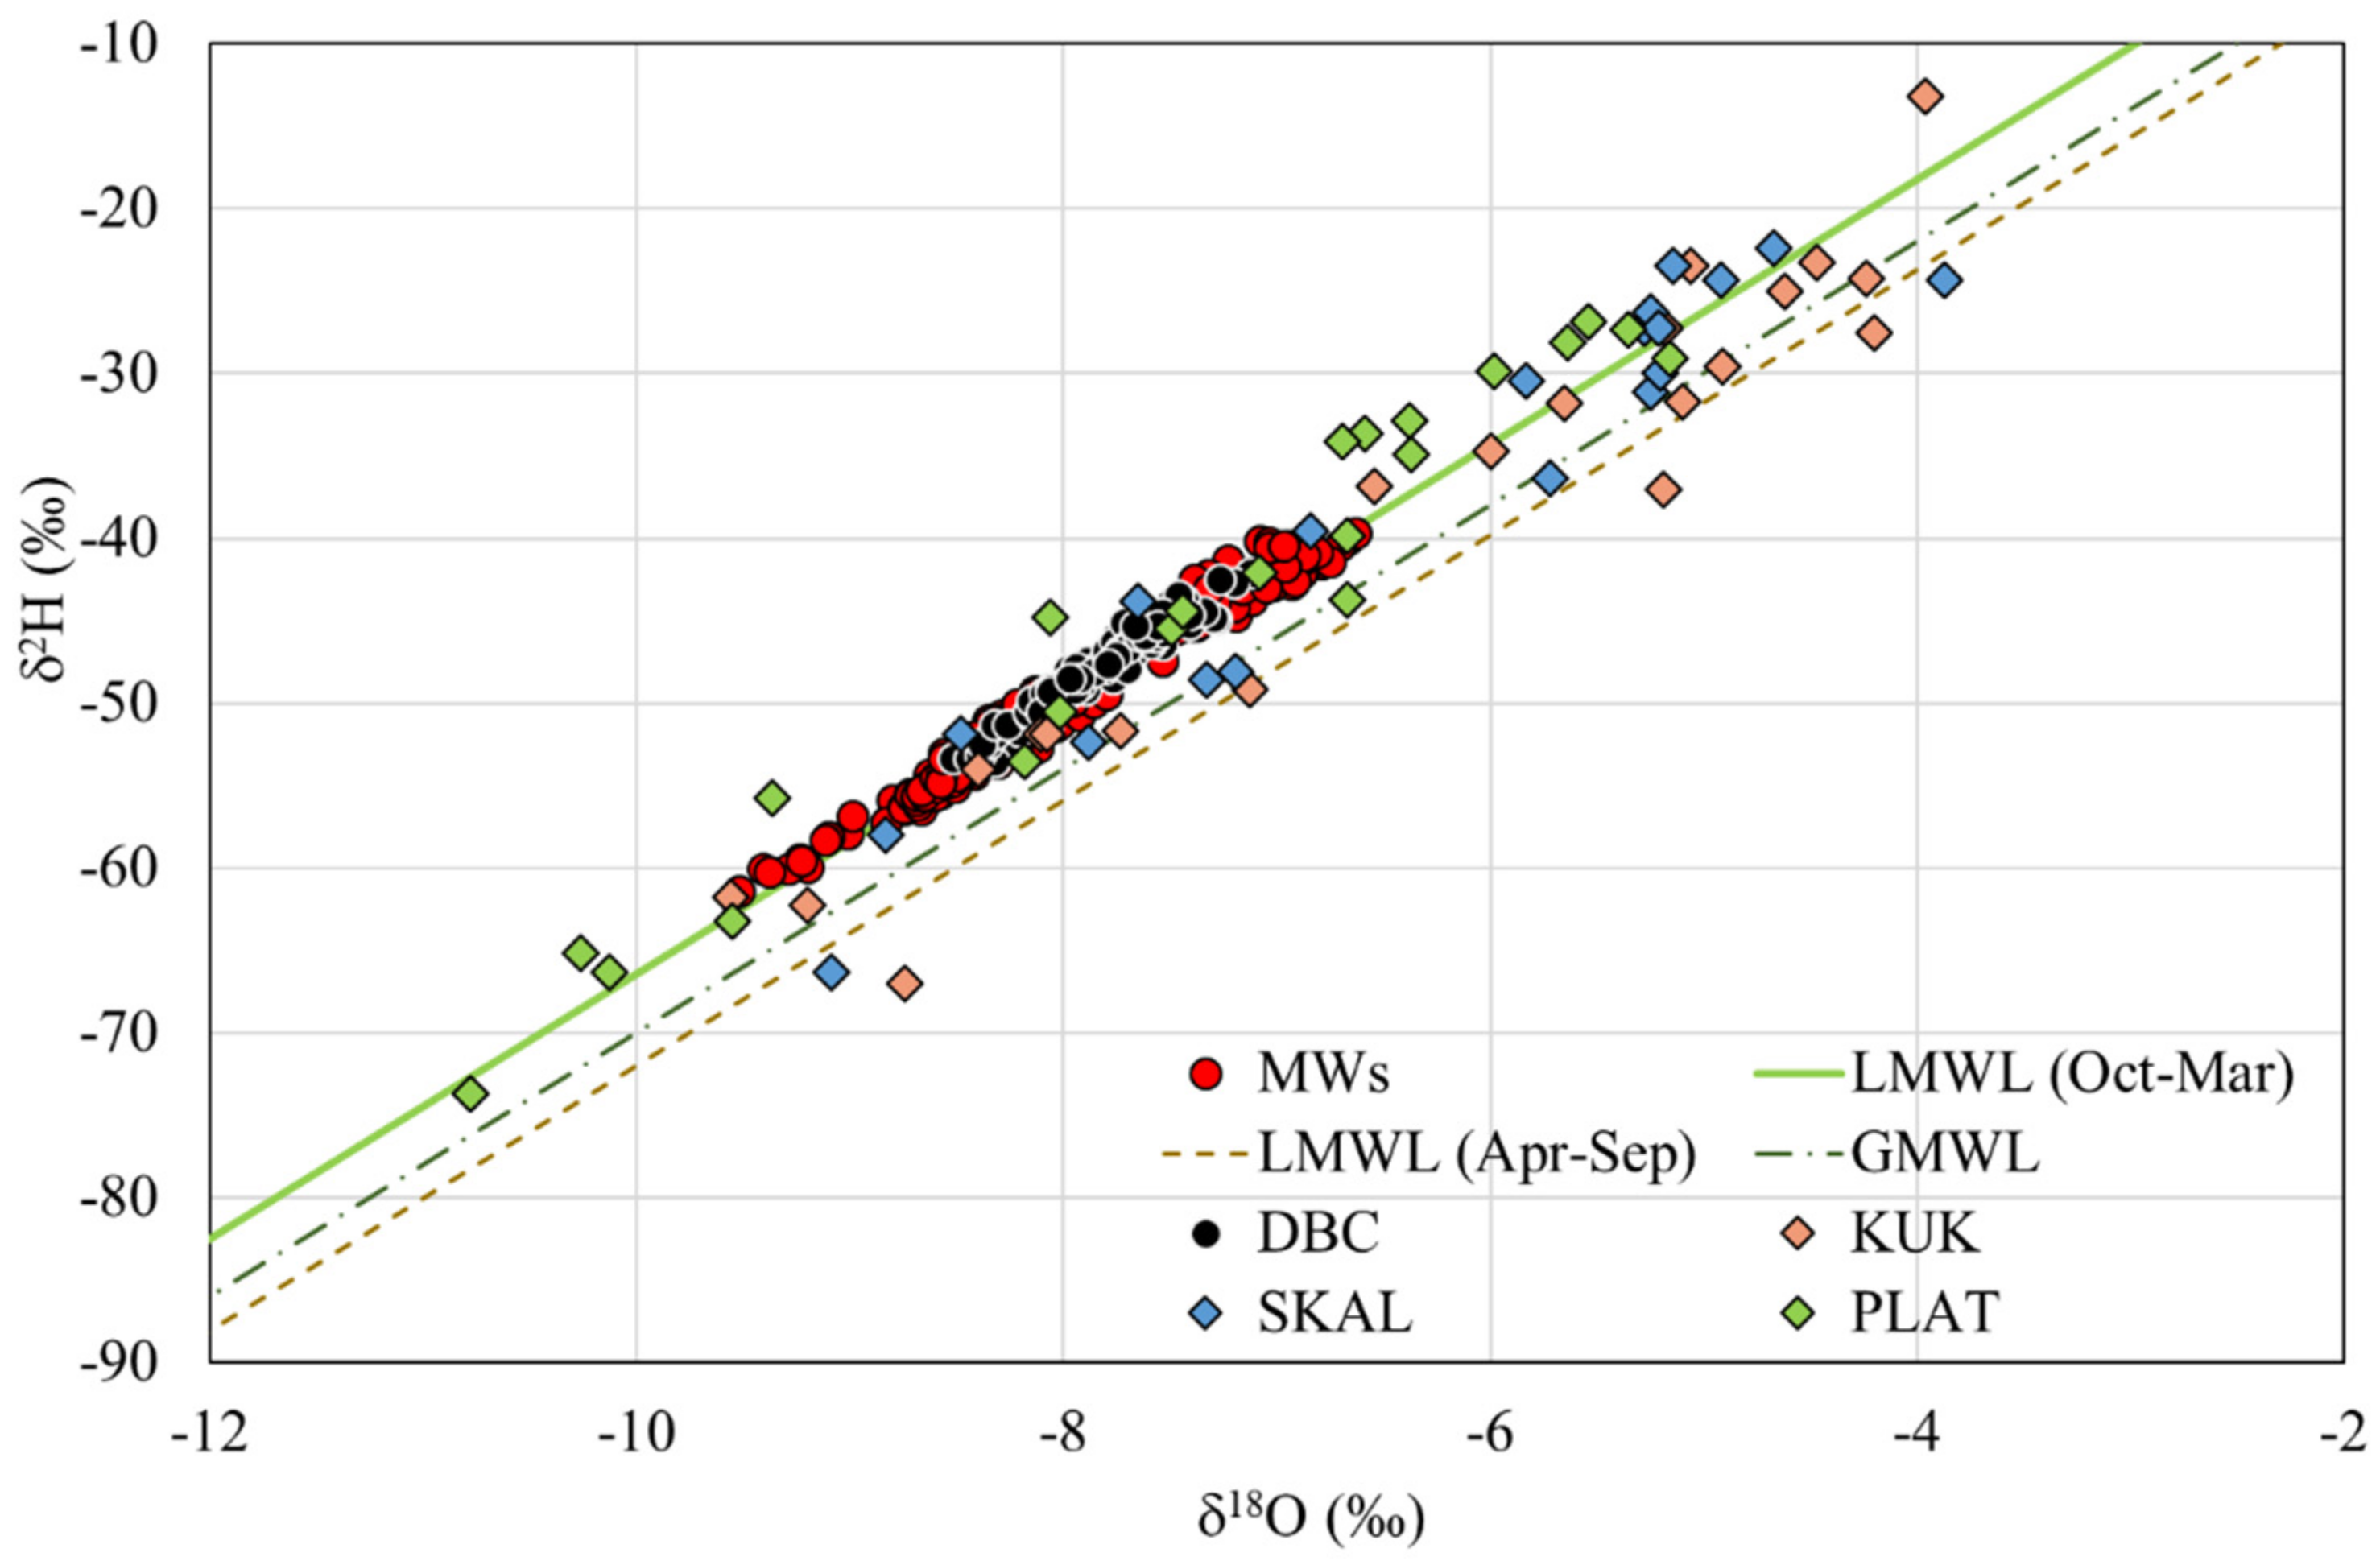
Figure 7.
Correlation diagram of δ2H and δ18O values for precipitation collected at Kukuljanovo (KUK), Škalnica (SKAL), and Platak (PLAT) stations, and for groundwater from Martinšćica wells (MWs) and Dobrica spring (DBC). Local meteoric water lines (LMWLs) for precipitation corresponding to warm and cold parts of the hydrological year. Global meteoric water line (GMWL) is also given.
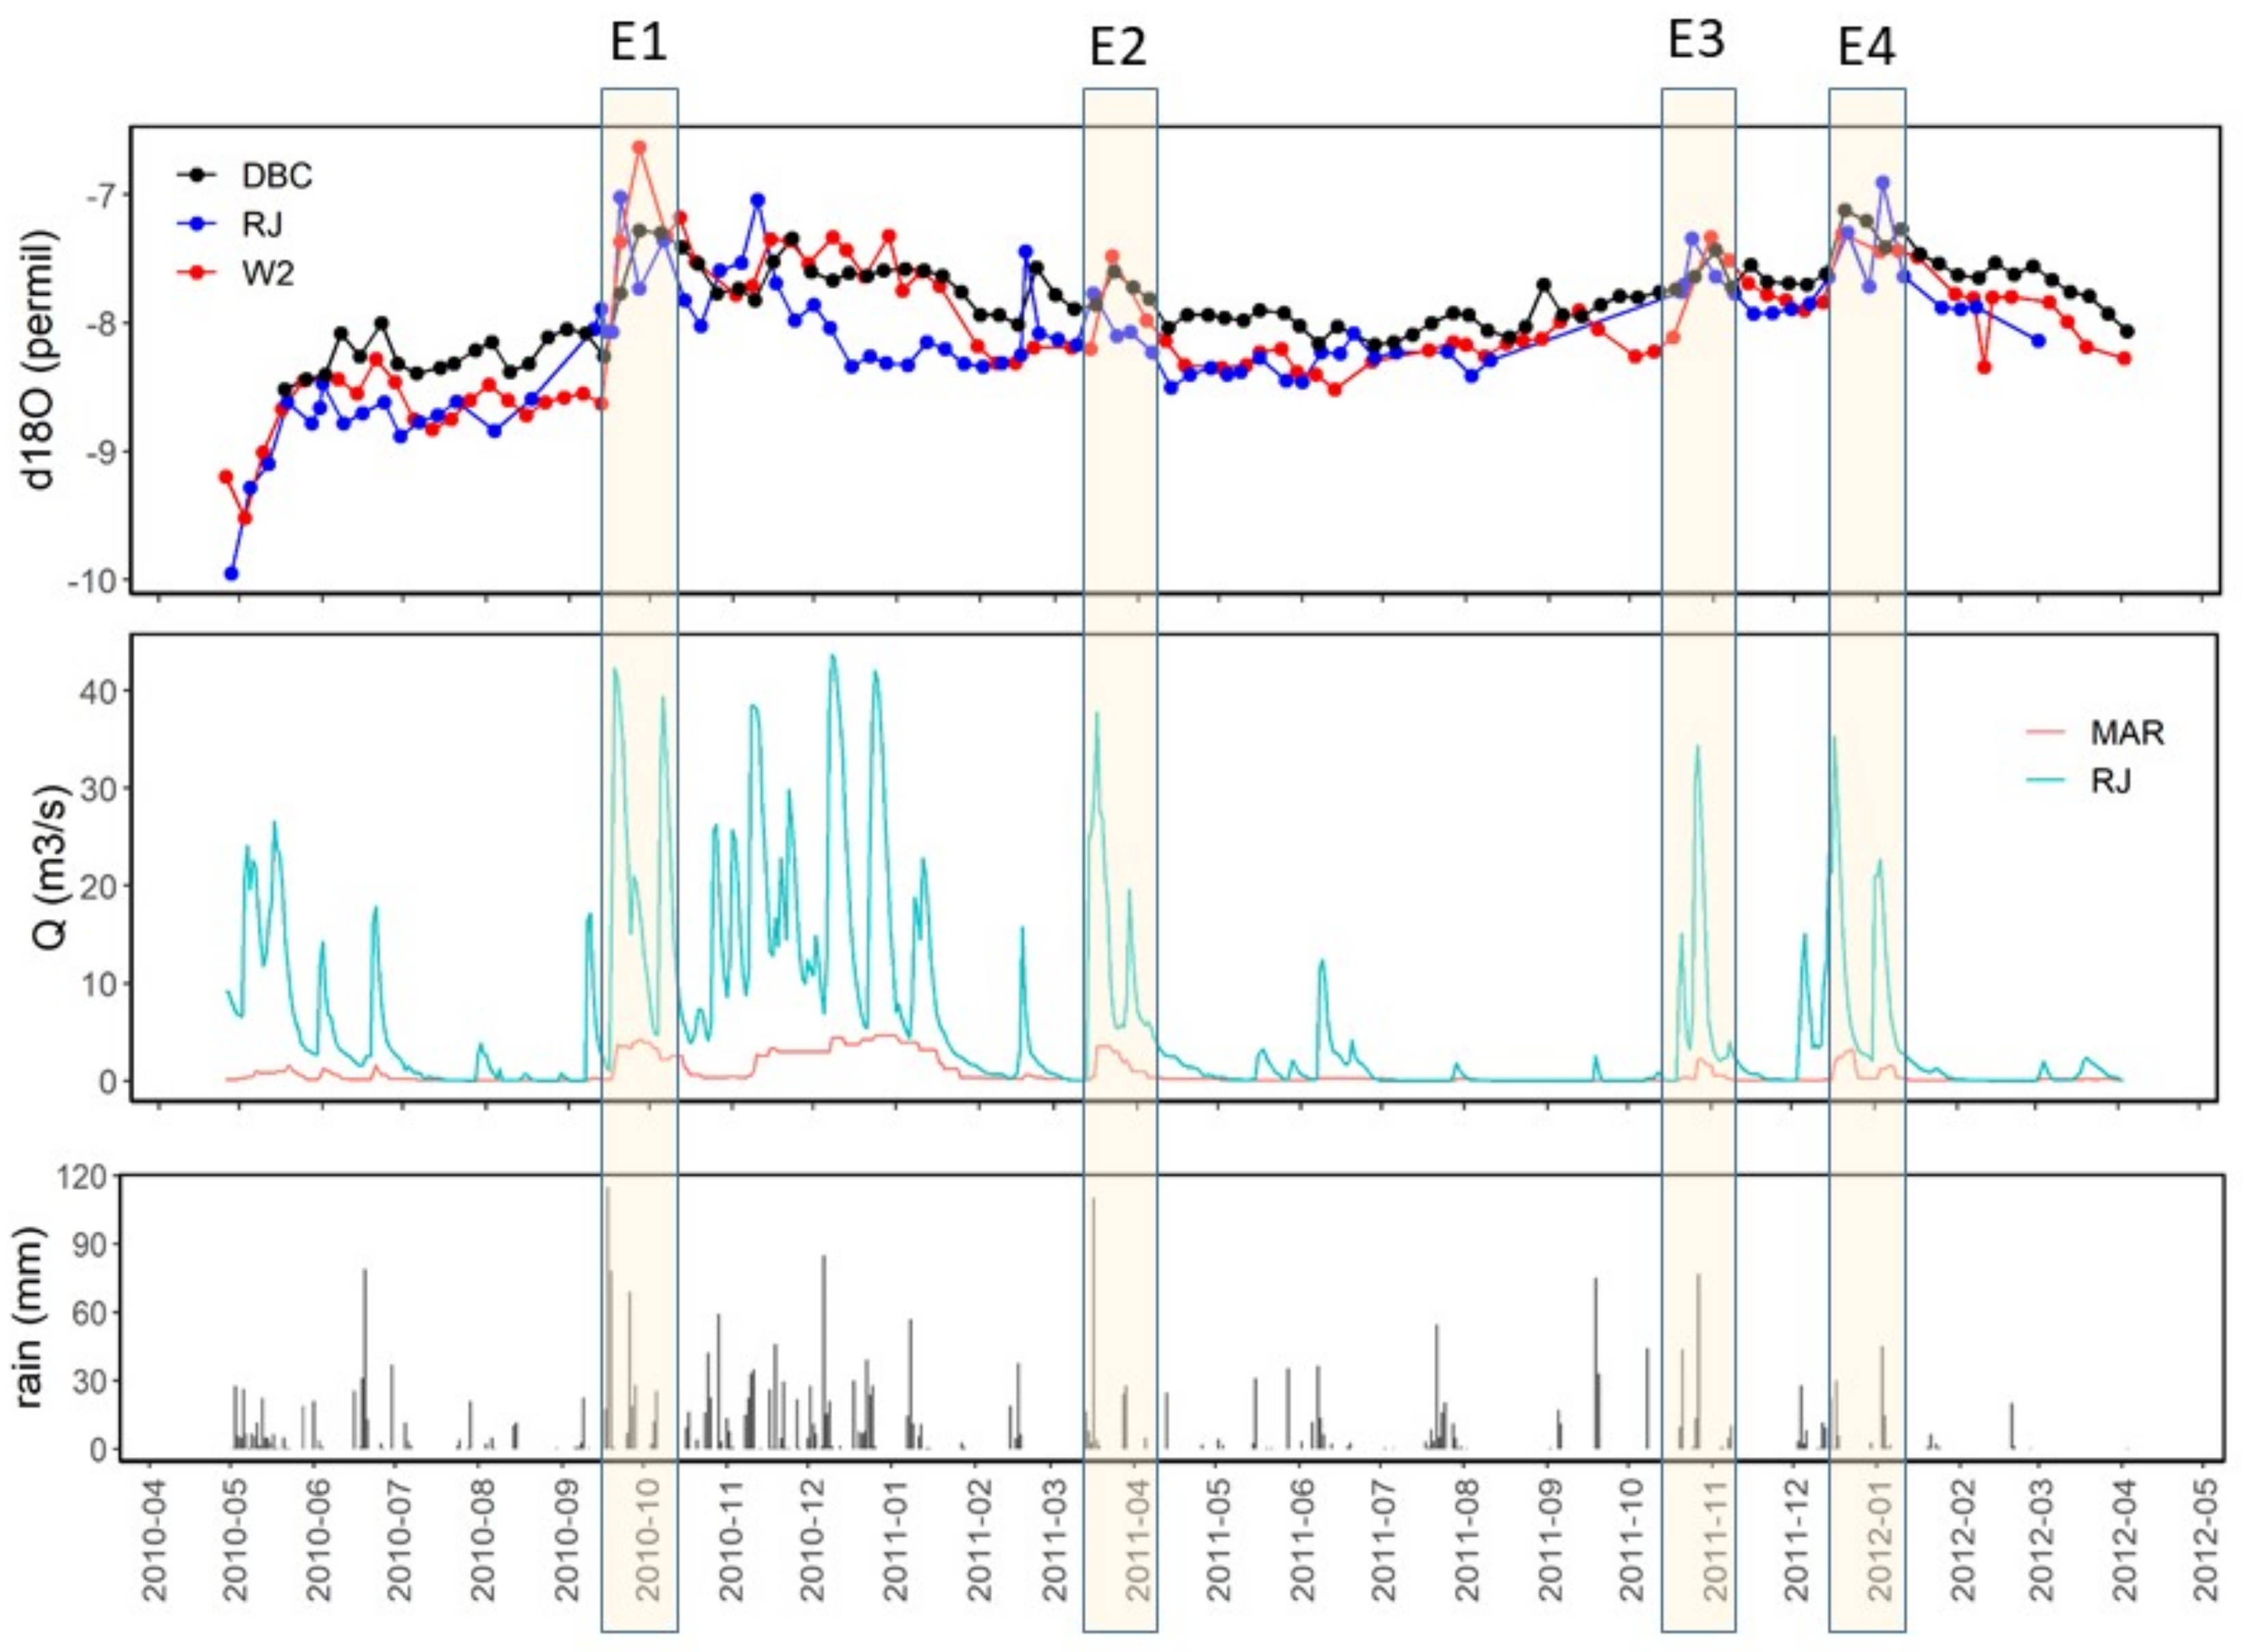
Figure 8.
δ18O-time series of Rječina Spring (RJ), Martinšćica well 2 (W2) and Dobrica (DBC), discharges for RJ and Martinšćica discharge zone (MAR) and daily rainfall at CMHS meteorological station Kukuljanovo. E1–E4—isolated events in which the presence of newly infiltrated precipitation in the system was recognized.
Figure 9.
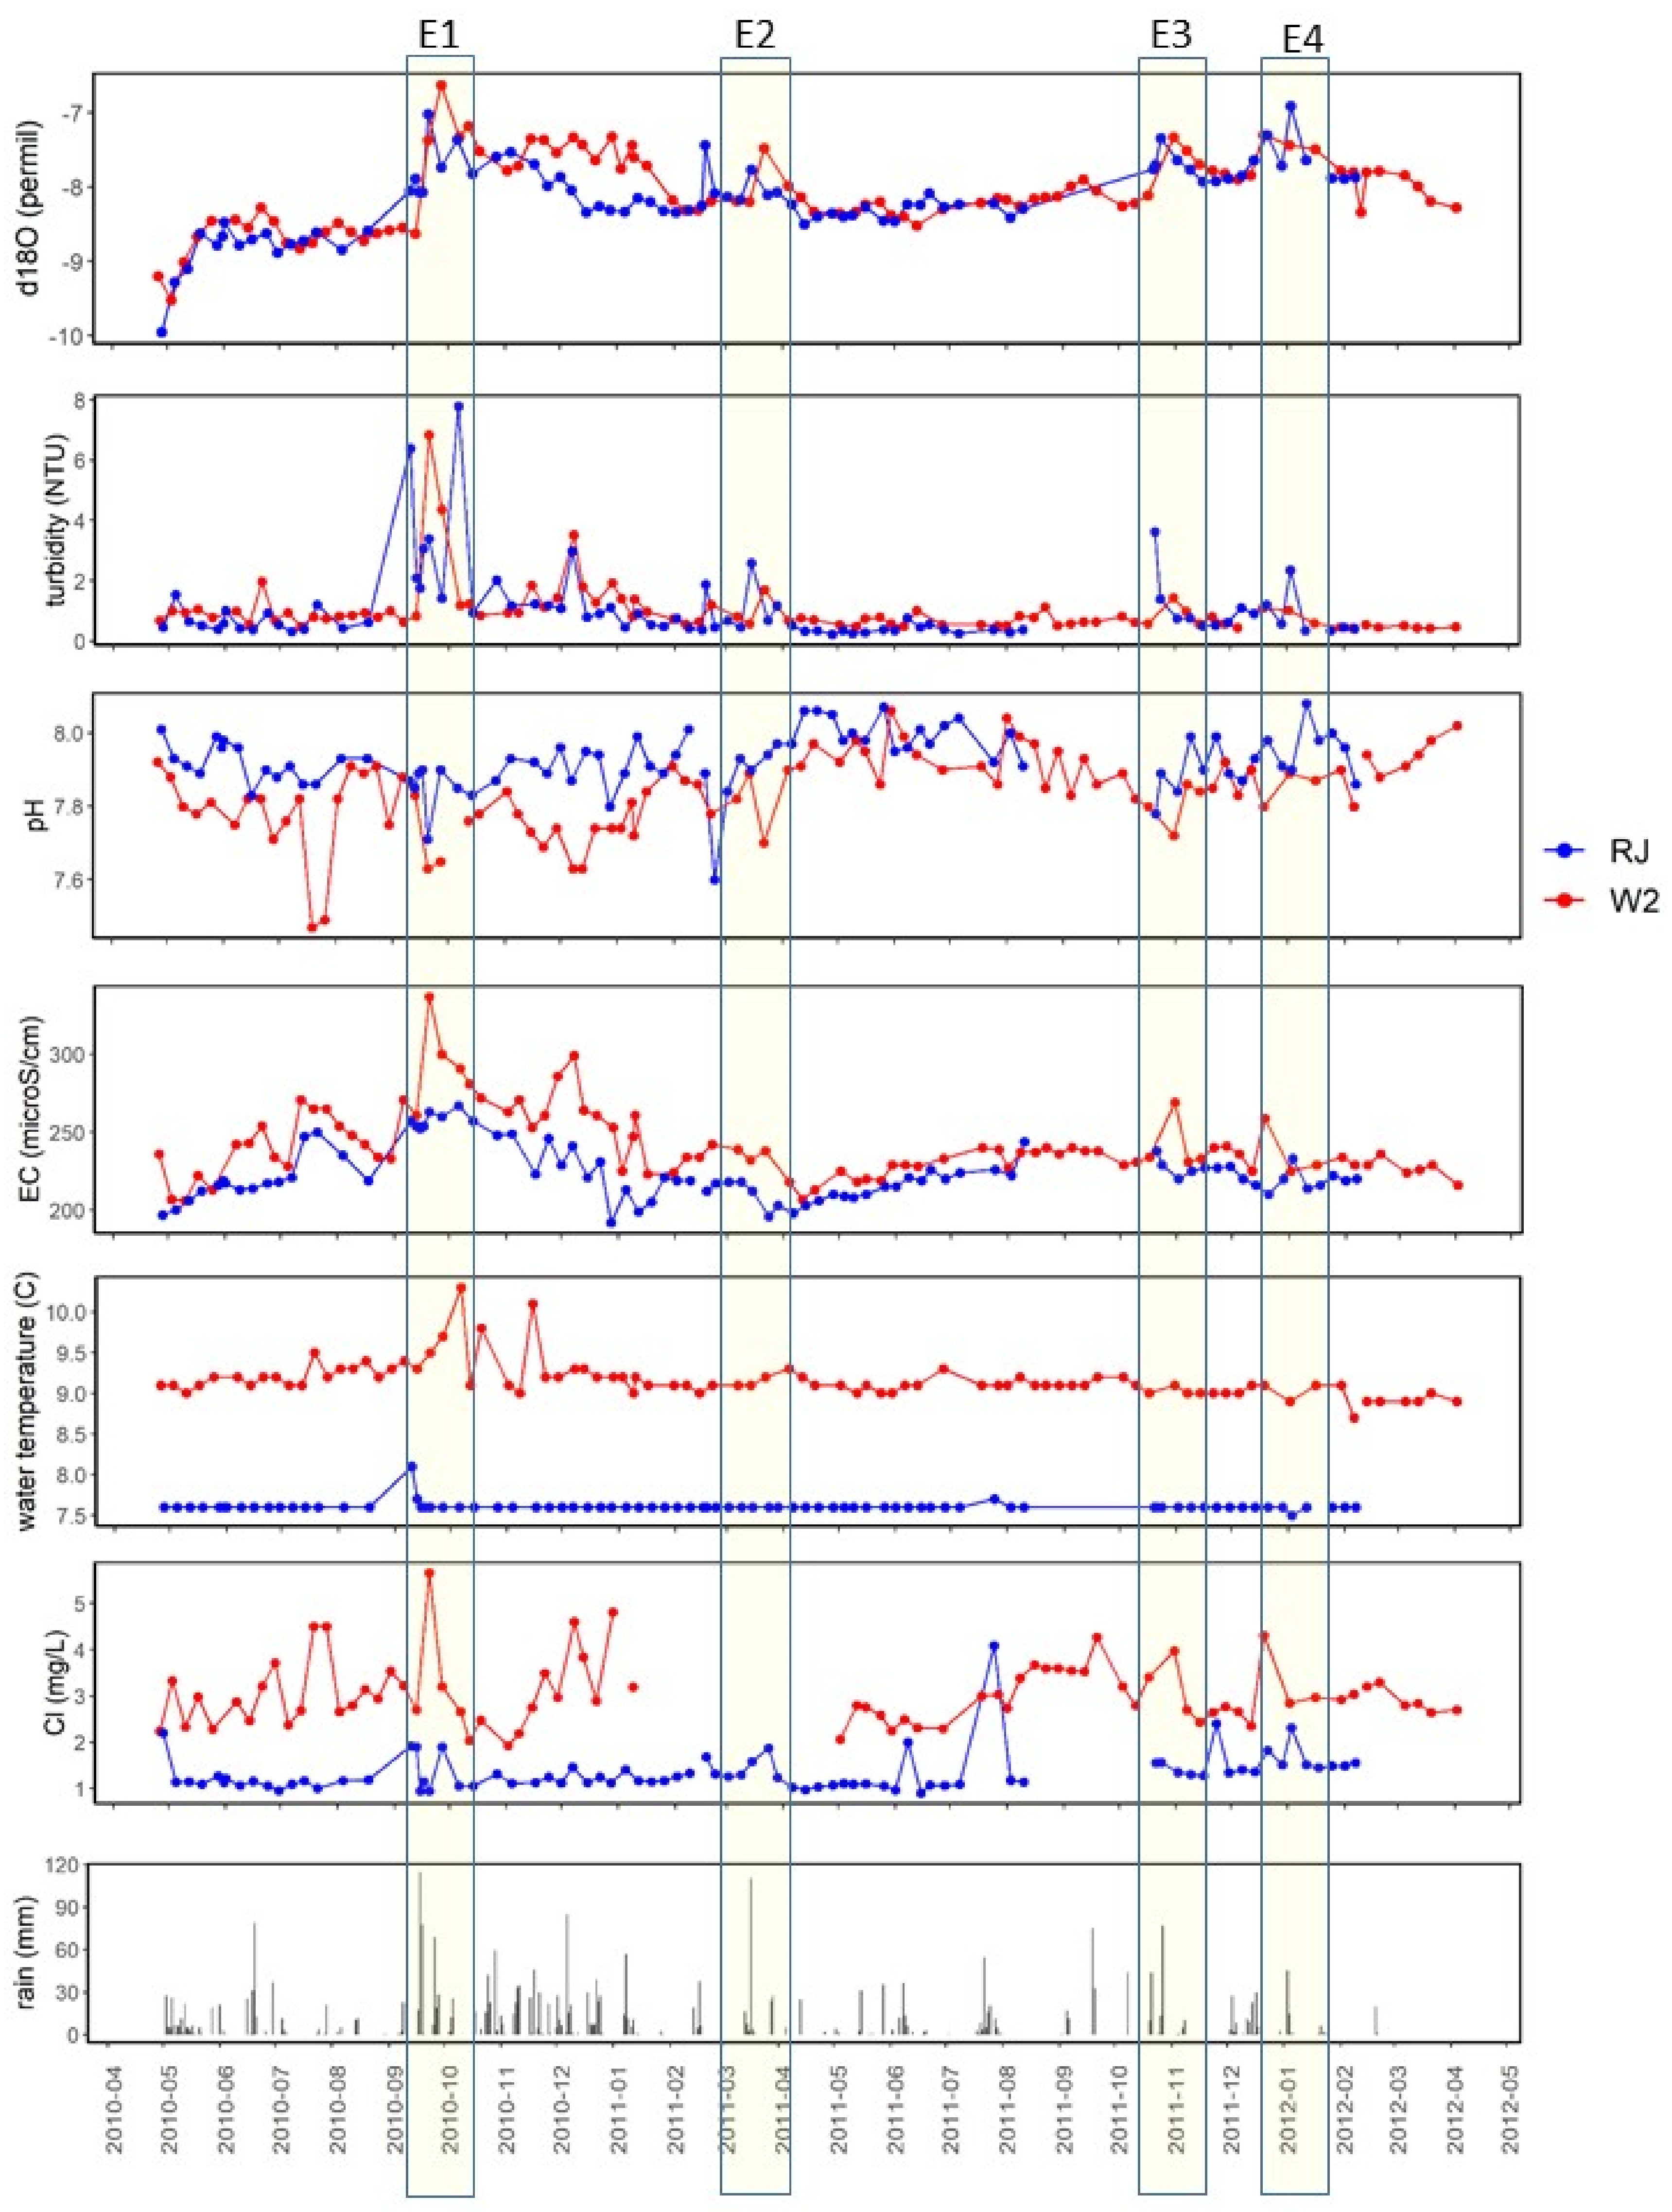
Time series of δ18O, turbidity, pH, electrical conductivity, temperature, and Cl content of Martinšćica well 2 (W2) and Rječina Spring (RJ) against daily rain quantities at CMHS meteorological station Kukuljanovo. E1–E4—isolated events in which the presence of newly infiltrated precipitation in the system was recognized.
Figure 9.
Time series of δ18O, turbidity, pH, electrical conductivity, temperature, and Cl content of Martinšćica well 2 (W2) and Rječina Spring (RJ) against daily rain quantities at CMHS meteorological station Kukuljanovo. E1–E4—isolated events in which the presence of newly infiltrated precipitation in the system was recognized.
Figure 10.
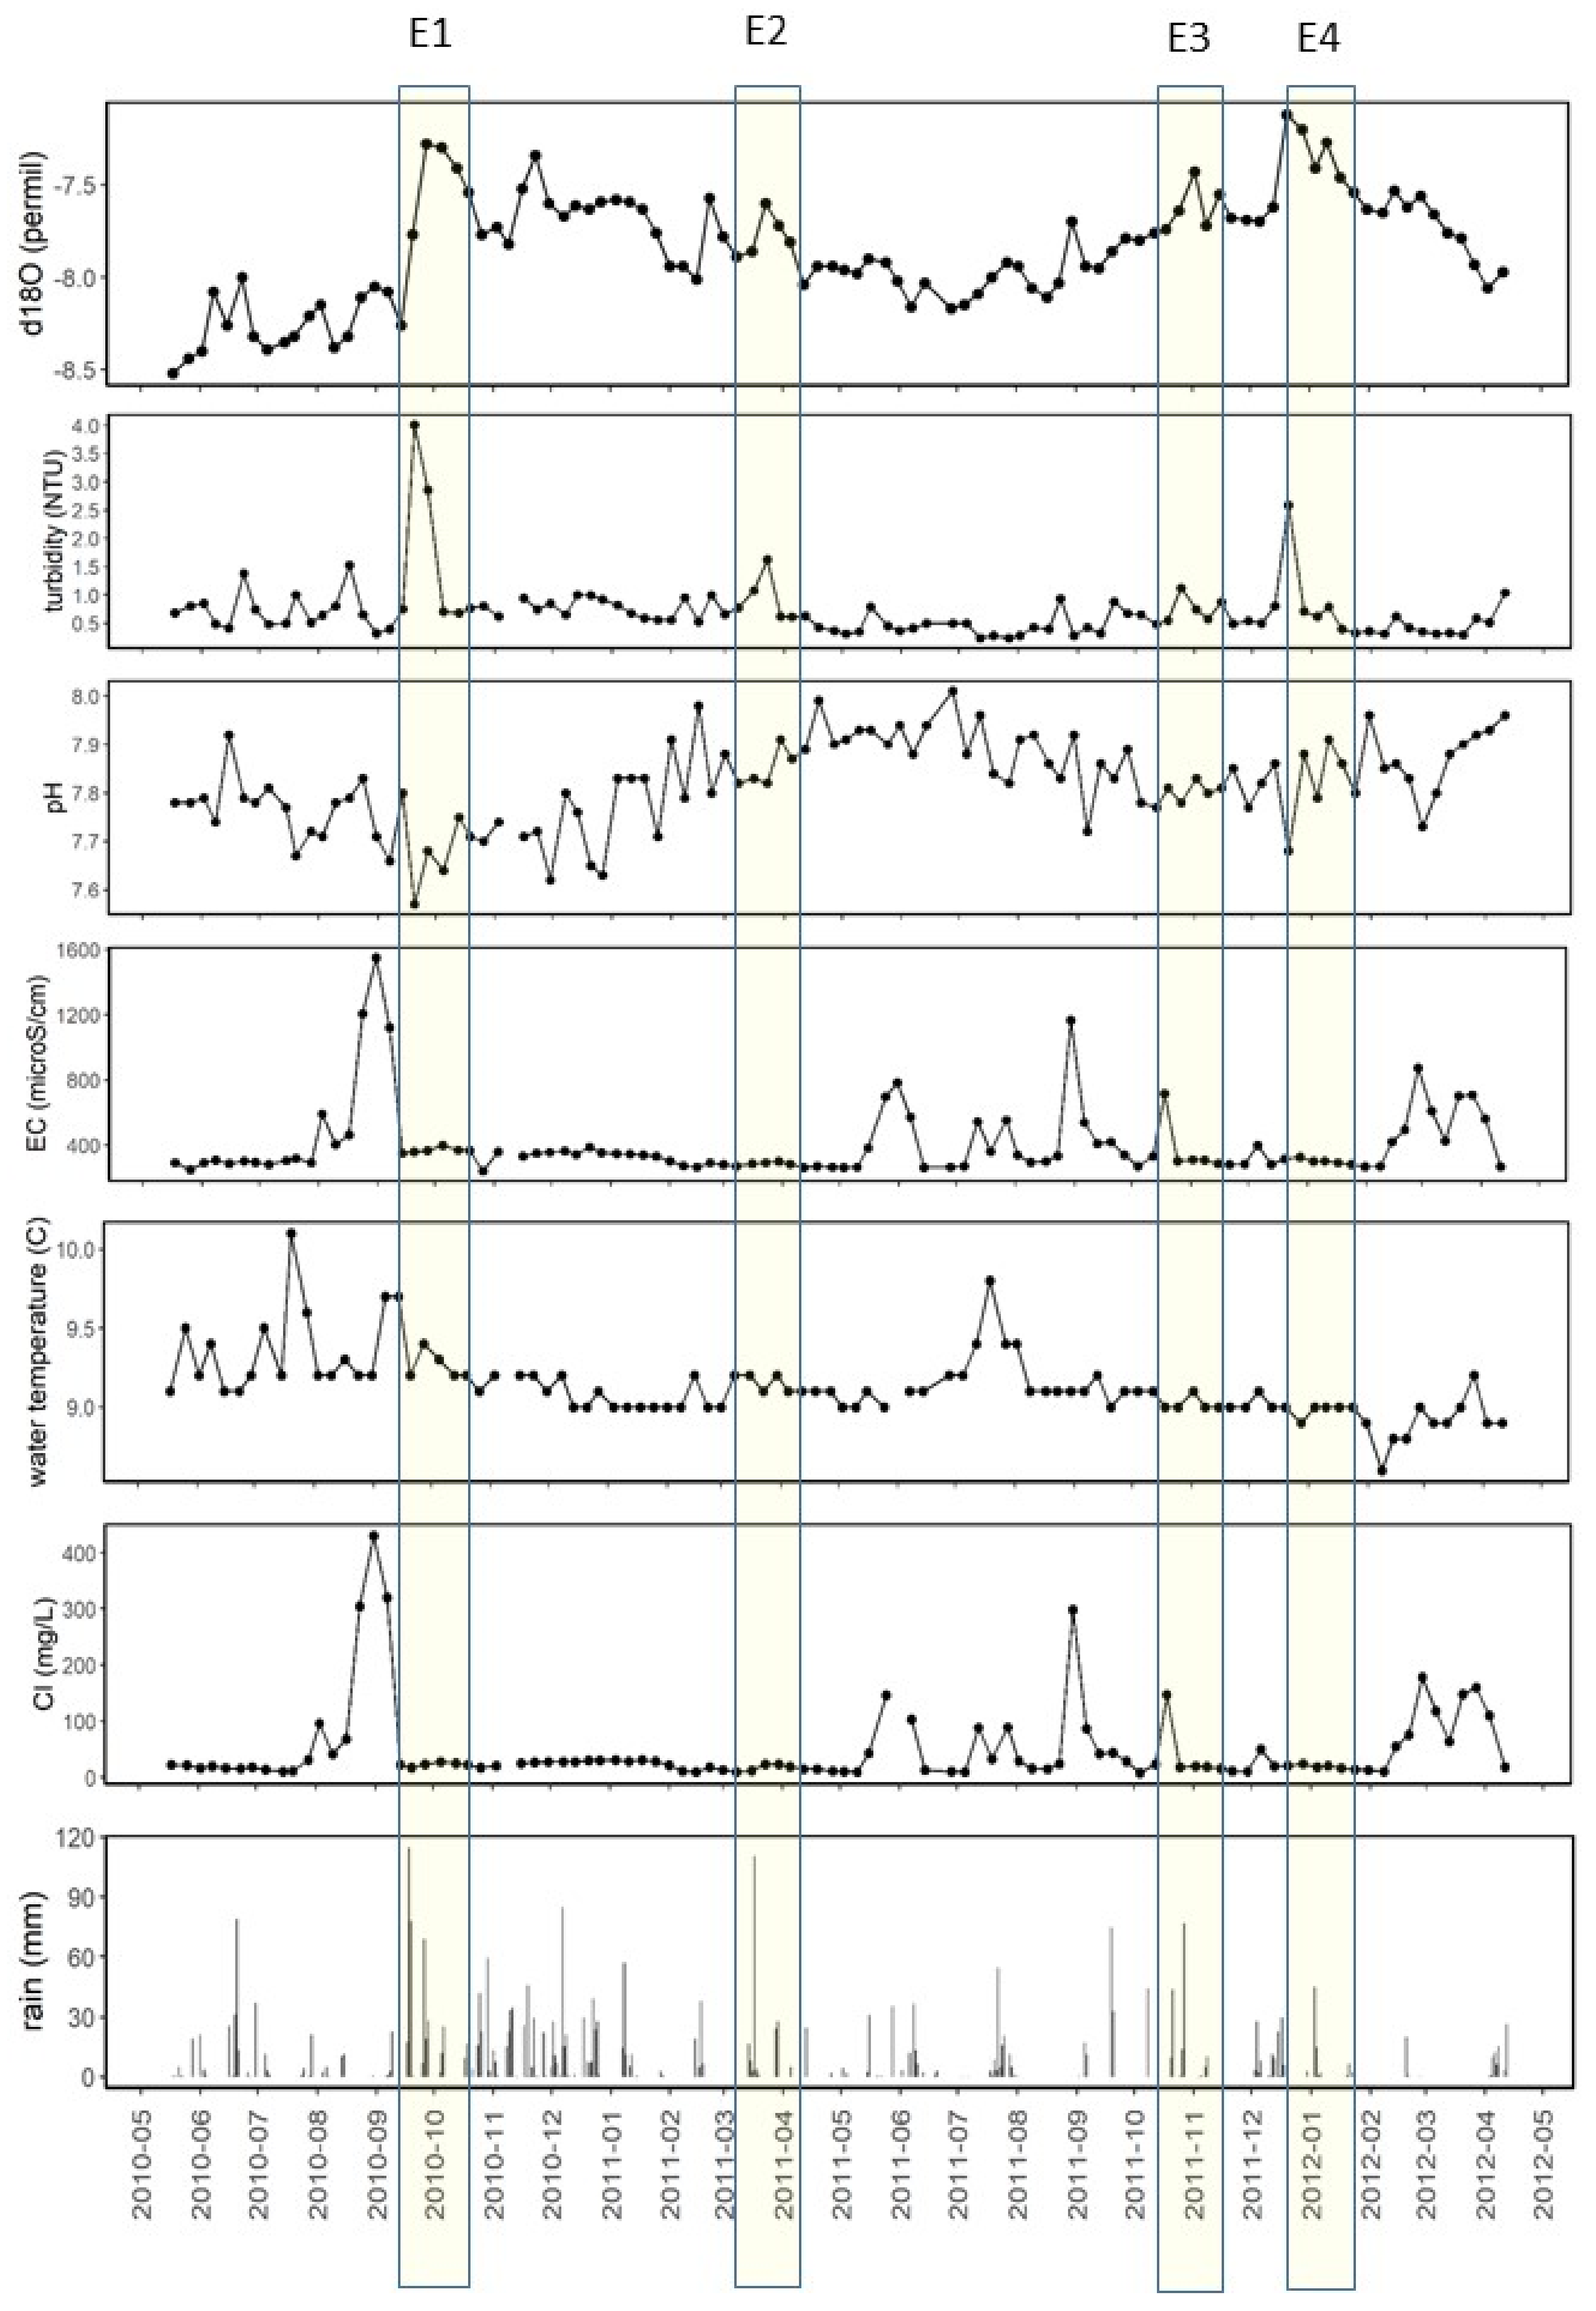
Time series of δ18O, turbidity, pH, electrical conductivity, temperature, and Cl content of Dobrica spring (DBC) against daily rain quantities at CMHS meteorological station Kukuljanovo. E1–E4—isolated events in which the presence of newly infiltrated precipitation in the system was recognized.
Figure 10.
Time series of δ18O, turbidity, pH, electrical conductivity, temperature, and Cl content of Dobrica spring (DBC) against daily rain quantities at CMHS meteorological station Kukuljanovo. E1–E4—isolated events in which the presence of newly infiltrated precipitation in the system was recognized.
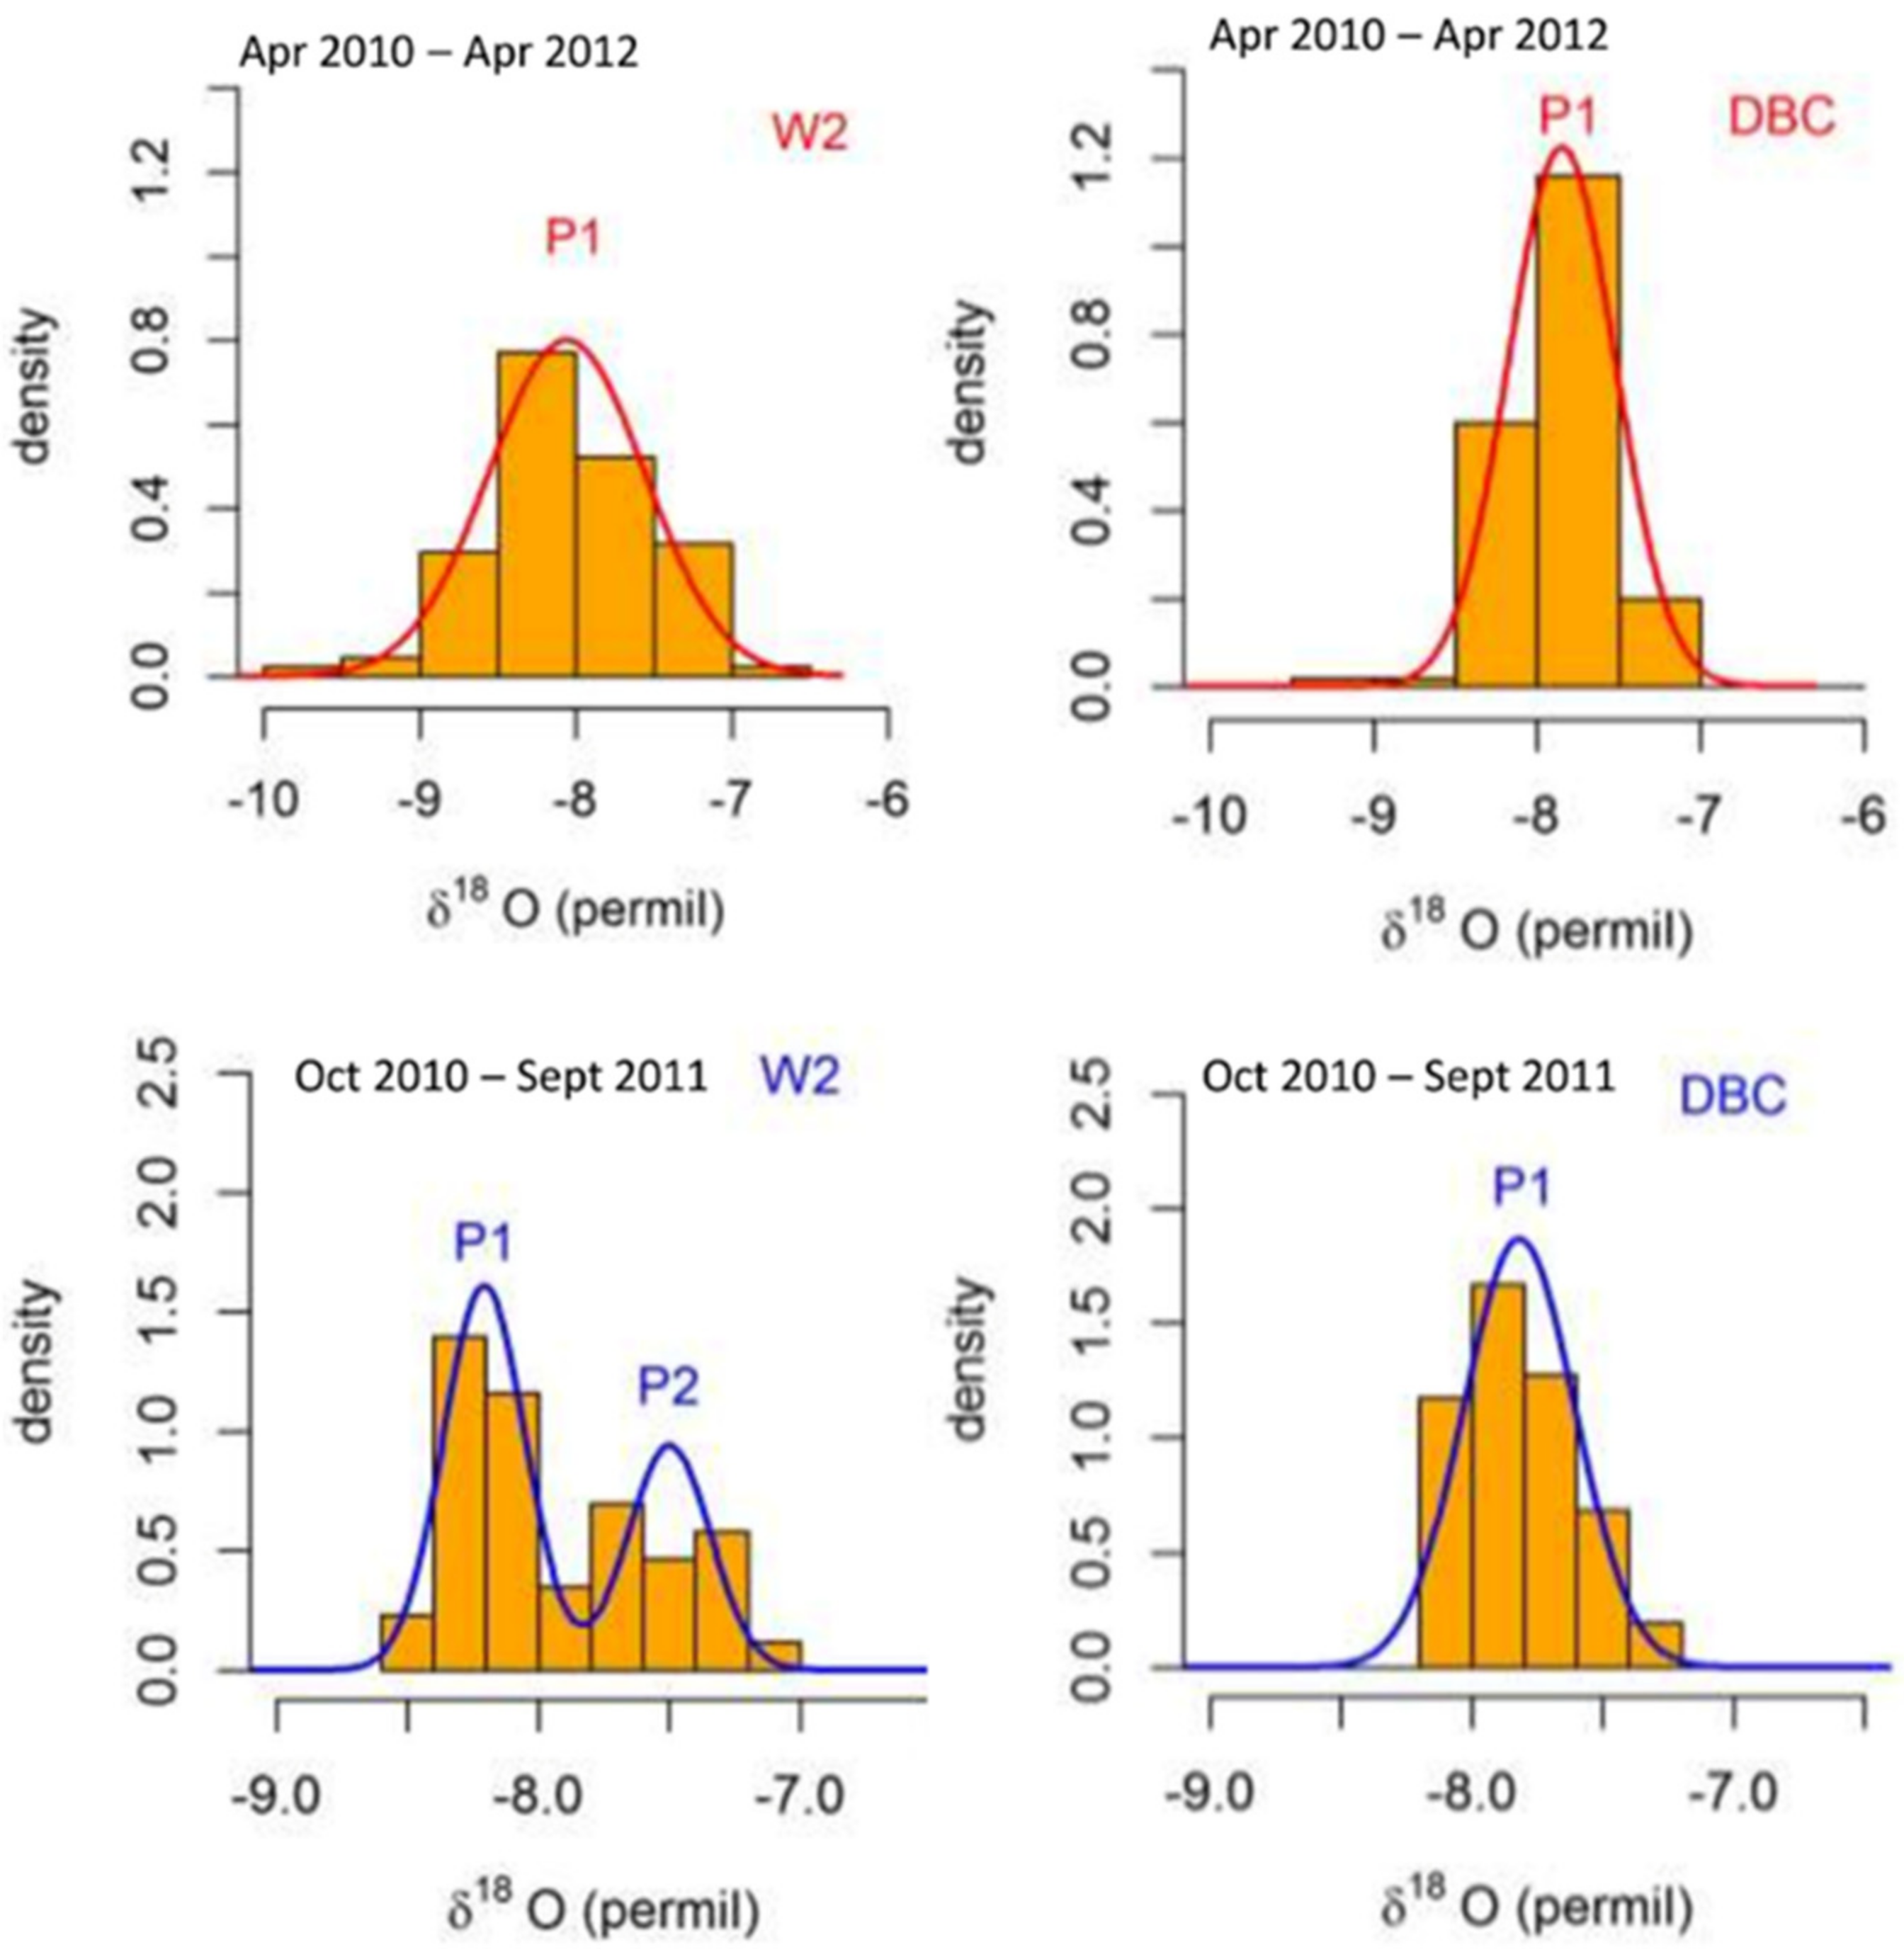
Figure 11.
Density estimates of groundwater δ18O series for the entire study period (upper part, red lines) and for the water year 2011 (lower part, blue lines). P1 and P2 correspond to individual peaks of a density estimate. W2—Martinšćica well 2; DBC—Dobrica spring.
Figure 11.
Density estimates of groundwater δ18O series for the entire study period (upper part, red lines) and for the water year 2011 (lower part, blue lines). P1 and P2 correspond to individual peaks of a density estimate. W2—Martinšćica well 2; DBC—Dobrica spring.
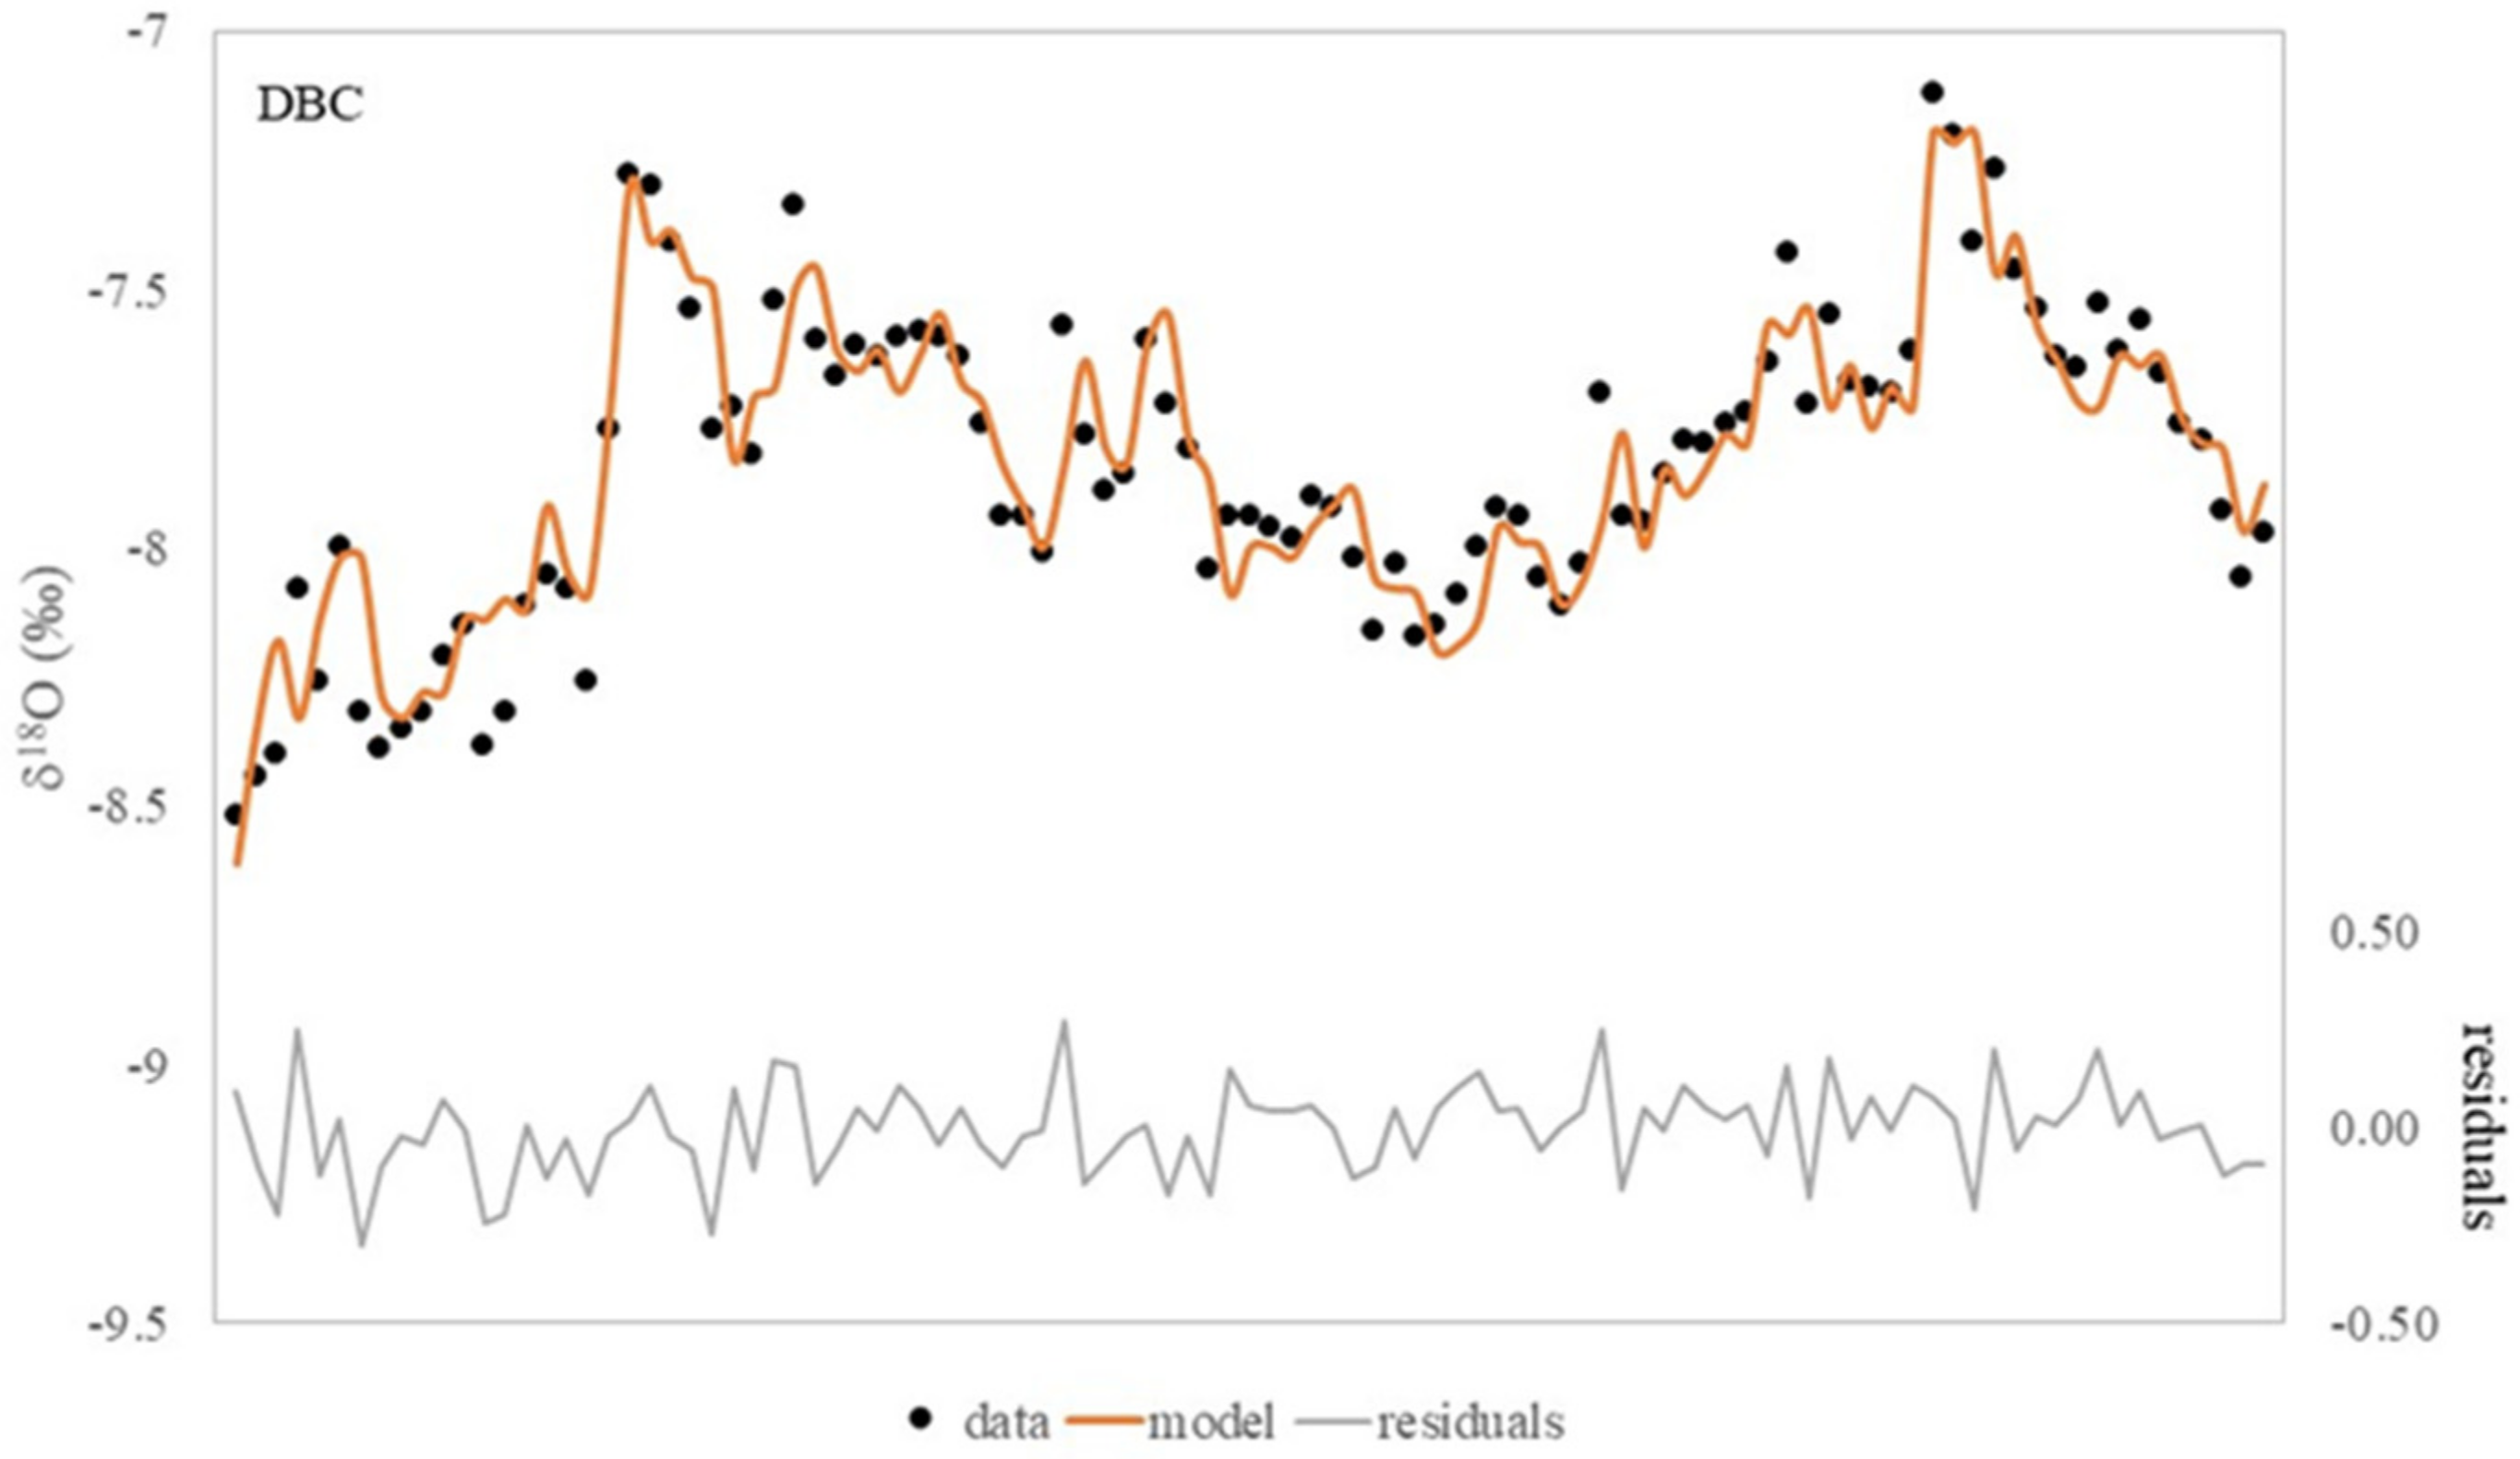
Figure 12.
The agreement diagram between the observed DBC δ18O data and the data predicted by the MARS model.
Figure 12.
The agreement diagram between the observed DBC δ18O data and the data predicted by the MARS model.
Table 1.
Basic information about sampling locations.
Table 1.
Basic information about sampling locations.
| Sampling Location | Coordinates | Altitude (m a.s.l.) | Sampling Period |
|---|
| Kukuljanovo (KUK) | N: 45°15′12.3″ E: 14°15′34″ | 281 | Apr 2008–Feb 2012 |
| Škalnica (SKAL) | N: 45°26′3.7″ E: 14°20′21.8″ | 526 | Aug 2010–Mar 2012 |
| Platak (PLAT) | N: 45°25′26.5″ E: 14°34′1.4″ | 1135 | Mar 2010–Jan 2012 |
| Dobrica (DBC) | N: 45°17′43″ E: 14°33′46.3″ | 1 | April 2010–April 2012 |
| Martinšćica well 2 (MW2) | N: 45°19′5.6″ E: 14°29′0″ | 1 | April 2010–April 2012 |
Table 2.
Basic statistics of isotopic composition of cumulative monthly precipitation in the period April 2010–April 2012. The weighted mean was calculated using the amount of precipitation as the weight.
Table 2.
Basic statistics of isotopic composition of cumulative monthly precipitation in the period April 2010–April 2012. The weighted mean was calculated using the amount of precipitation as the weight.
| | KUK | SKAL | PLAT |
|---|
| | δ18O (‰) | δ2H (‰) | δ18O (‰) | δ2H (‰) | δ18O (‰) | δ2H (‰) |
|---|
| Min | −9.56 | −67.0 | −9.09 | −66.3 | −10.78 | −73.7 |
| Mean | −6.27 | −38.5 | −6.30 | −37.5 | −7.46 | −44.4 |
| Max | −3.96 | −13.2 | −3.87 | −22.4 | −5.16 | −26.9 |
| St.Dev. | 1.79 | 15.1 | 1.55 | 13.4 | 1.71 | 14.2 |
| Weigh.mean | −6.41 | −38.4 | −6.09 | −34.0 | −6.66 | −38.6 |
Table 3.
Basic statistics of isotopic composition of groundwater. W2—Martinšćica wells, RJ—Rječina Spring, DBC—Dobrica.
Table 3.
Basic statistics of isotopic composition of groundwater. W2—Martinšćica wells, RJ—Rječina Spring, DBC—Dobrica.
| | W2 | RJ | DBC | W2 | RJ | DBC |
|---|
| | δ18O (‰) | δ2H (‰) |
|---|
| Min | −9.5 | −10.0 | −9.2 | −61.4 | −65.8 | −53.5 |
| Mean | −8.1 | −8.1 | −7.8 | −49.5 | −49.1 | −47.7 |
| Max | −6.6 | −6.9 | −7.1 | −39.7 | −40.3 | −42.0 |
| St.Dev. | 0.5 | 0.4 | 0.3 | 3.8 | 3.5 | 2.4 |
Table 4.
Statistical data on the content of stable isotopes in precipitation collected at the Kukuljanovo rain gauge station in 2008–2012. The weighted mean was calculated using the amount of precipitation as a scale. Water Year Cold represents October to March period, and Water Year Warm period from April to September.
| | Water Year Cold | Water Year Warm |
|---|
| | δ18O (‰) | δ2H (‰) | δ18O (‰) | δ2H (‰) |
|---|
| Min | −12.51 | −84.4 | −9.20 | −67.0 |
| Mean | −7.46 | −44.3 | −5.65 | −36.9 |
| Max | −4.12 | −13.2 | −3.69 | −23.3 |
| St.Dev. | 2.11 | 18.1 | 1.43 | 12.2 |
| Weighted mean | −7.44 | −44.7 | −5.67 | −35.5 |
Table 5.
Matrix of linear correlation coefficients between groundwater parameters of Martinšćica well 2 (W2). Only statistically significant coefficients are given. tw—water temperature, EC—electrical conductivity, NTU—turbidity; Cl—chloride ion concentration; ta—average air temperature between two consecutive samplings; mm—total rainfall between two consecutive samplings.
| | δ2H | δ18O | tw | EC | pH | NTU | Cl | ta | mm |
|---|
| δ2H | | | | | | | | | |
| δ18O | 0.99 | | | | | | | | |
| tw | | | | | | | | | |
| EC | 0.44 | 0.49 | 0.52 | | | | | | |
| pH | | | −0.43 | −0.61 | | | | | |
| NTU | 0.35 | 0.4 | 0.47 | 0.71 | −0.49 | | | | |
| Cl | | | | 0.38 | −0.49 | 0.52 | | | |
| ta | −0.6 | −0.56 | 0.27 | | | | | | |
| mm | 0.31 | 0.33 | 0.33 | 0.51 | −0.35 | 0.76 | 0.47 | | |
Table 6.
Matrix of linear correlation coefficients between groundwater parameters of Dobrica spring (DBC). Only statistically significant coefficients are given. tw—water temperature, EC—electrical conductivity, NTU—turbidity; Cl—chloride ion concentration; ta—average air temperature between two consecutive samplings; mm—total rainfall between two consecutive samplings.
| | δ2H | δ18O | tw | EC | pH | NTU | Cl | ta | mm |
|---|
| δ2H | | | | | | | | | |
| δ18O | 0.97 | | | | | | | | |
| tw | −0.44 | −0.4 | | | | | | | |
| EC | | | | | | | | | |
| pH | | −0.22 | −0.29 | | | | | | |
| NTU | | 0.21 | | | −0.46 | | | | |
| Cl | | | | 0.84 | | −0.21 | | | |
| ta | −0.62 | −0.59 | 0.59 | | | | 0.23 | | |
| mm | | 0.22 | | | −0.41 | 0.59 | | | |
Table 7.
Parameter estimates of the groundwater δ18O values obtained by Gaussian mixture modelling for the entire study period (April 2010–April 2012) and the water year 2011. P1 and P2 correspond to individual peaks of a density estimate. W2—Martinšćica well 2, DBC—Dobrica spring.
Table 7.
Parameter estimates of the groundwater δ18O values obtained by Gaussian mixture modelling for the entire study period (April 2010–April 2012) and the water year 2011. P1 and P2 correspond to individual peaks of a density estimate. W2—Martinšćica well 2, DBC—Dobrica spring.
| | | δ18O (‰) |
|---|
| | Peak | Mean | St.Dev. | Weight Factor |
|---|
| Apr 2010–Apr 2012 | | | | |
| W2 | P1 | −8.06 | 0.5 | - |
| DBC | P1 | −7.85 | 0.32 | - |
| Water year 2011 (Oct 2010–Sep 2011) | | |
| W2 | P1 | −8.21 | 0.16 | 0.63 |
| P2 | −7.5 | 0.16 | 0.37 |
| DBC | P1 | −7.82 | 0.21 | - |
Table 8.
The contributions of various independent variables in the MARS model.
Table 8.
The contributions of various independent variables in the MARS model.
| Variable | Nsubsets | GCV | RSS |
|---|
| δ18O(−1) | 7 | 100 | 100 |
| turbidity | 6 | 38.8 | 43.5 |
| precipitation | 4 | 9.9 | 20.8 |
| Cl | 2 | 8.3 | 14.9 |


