1. Introduction
It is well known that reservoir management is not an easy task. One can take decisions based on the control variables, such as the stored reservoir volume or the reservoir level, but the fact that exact future inflows are not known in advance always leaves a good deal of uncertainty on the most appropriate amounts of water to be released. Moreover, unmanned management of reservoirs, based on techniques such as Artificial Intelligence, cannot be applied due to the legal and economic responsibility vested in the reservoir managers, who are held responsible for the potential consequences of wrong decisions. Therefore, reservoir managers are required to take their decisions under the uncertainty of future outcomes, and hence they need decision-supporting tools aimed at reducing this uncertainty.
In the planning phase, the stochasticity of inflows is generally accounted for by using the transition probabilities of the state variables from one time step to the next estimated over the historical record [
1]. On the contrary, in an operational setting it is quite common to encounter reservoirs operated on the basis of deterministic forecasts without considering the effects of the unavoidable predictive uncertainty [
2,
3,
4,
5] on decisions.
In the past, several authors have tried to overcome this problem; Bras et al. [
6] proposed a real-time adaptive closed loop control of reservoirs that featured the Stochastic Dynamic Programming (SDP) approach introduced in [
1], to continuously update the streamflow transition probabilities from one time step to the next. Other SDP related reservoir control schemes were described in [
7,
8]. A different way to cope with uncertainty was then outlined in [
9,
10]. It was called the “set control approach” which still assumed future inflows to be unknown, but bounded. The estimation of the bounds was left to the system operator. Successively, the Extended Linear Quadratic Gaussian (ELQG) method was introduced in [
11,
12]. Several applications of ELQG have appeared up to the present time, together with optimization approaches based on probabilistic and ensemble predictions
Other approaches have used forecasts of state variables and their uncertainty expressed in terms of probability densities [
13,
14] or of ensembles [
2] in combination with stochastic optimization. The use of forecasts in an SDP model of reservoirs operation was illustrated in [
15,
16], and of streamflow and uncertainty forecasts in combination with Bayesian decision theory in [
17,
18], while the use of Bayesian SDP models was explored in [
19,
20,
21,
22,
23]. The inclusion of forecasting uncertainty was improved using Sampling SDP (SSDP) [
24,
25,
26,
27,
28].
In recent years, a variety of optimization techniques such as Evolutionary Algorithms (EAs), Genetic Algorithms and Genetic Programming, and Particle Swarm Optimization [
29] complemented the traditional ones (a detailed description can be found in [
30]) by providing better focus on multi-objective optimization. However, most of these approaches tend to concentrate on the optimization schemes more than on the ways of incorporating predictive uncertainty into the decision process. De facto, the number of real-world applications explicitly incorporating the information on the predictive uncertainty of future outcomes into operational decisions is rather small even if compared to the number of published papers on reservoir operation.
As pointed out by Labadie [
31] several years ago, and still true, a gap exists between theoretical developments and real-world implementations, because:
“… (1) many reservoir system operators are skeptical about models purporting to replace their judgment and prescribe solution strategies and feel more comfortable with use of existing simulation models; (2) computer hardware and software limitations in the past have required simplifications and approximations that operators are unwilling to accept; (3) optimization models are generally more mathematically complex than simulation models, and therefore more difficult to comprehend; (4) many optimization models are not conducive to incorporating risk and uncertainty; (5) the enormous range and varieties of optimization methods create confusion as to which to select for a particular application; (6) some optimization methods, such as dynamic programming, often require customized program development; and (7) many optimization methods can only produce optimal period-of-record solutions rather than more useful conditional operating rules.”
The lack of confidence of water managers in adopting probabilistic approaches is also amplified by misunderstandings between managers and scientists, with the latter usually unaware of the real-world decision problems the former have to solve, amplified by the frequent misuse of information on uncertainty. For example, meteorological ensemble forecasts, which only represent the epistemic uncertainty, are commonly assumed to describe the aleatoric uncertainty of future events, inevitably leading to incorrect predictive probability distributions [
2,
3,
4,
5], thus increasing the risk of wrong decisions.
On the contrary, this paper aims to describe the particularly successful case of the operational water management system of Lake Como, where scientists and managers succeeded at mutually clarifying their aims and objectives, leading to a fruitful cooperation. It is a single reservoir problem where water is predominantly used for irrigation and energy production and where there has been a rather limited operational range of level and storage volume, which causes frequent flooding of the main square in the city of Como.
In 1997, the client “Consorzio dell’Adda” (Consortium of River Adda), the authority operating Lake Como, decided to set up a decision support tool that would simultaneously reduce the probability of flooding in the city of Como while increasing the availability of water for irrigation and hydropower production. The development of the new system took over one year of close collaboration between the authority, which provided all the required information on the problem setting and the desired results to scientists who cooperated in elaborating suitable cost functions. These cost functions model the decision-makers’ economic/environmental objectives while reflecting their habitual risk aversion and are combined with the predicted probability functions using a Bayesan decision scheme. After testing the system for six consecutive months, the authority learned to appreciate the benefits arising from its daily use. The said system, which has undergone a series of upgrades in response to requests by the client, is still in use today, to the great satisfaction of end users.
Therefore, more than the system developed for Lake Como, this paper describes how the effective collaboration with the lake manager was achieved, thus registering an emblematic success case in Water Resources Management.
2. The Case
2.1. The Lake Como Reservoir
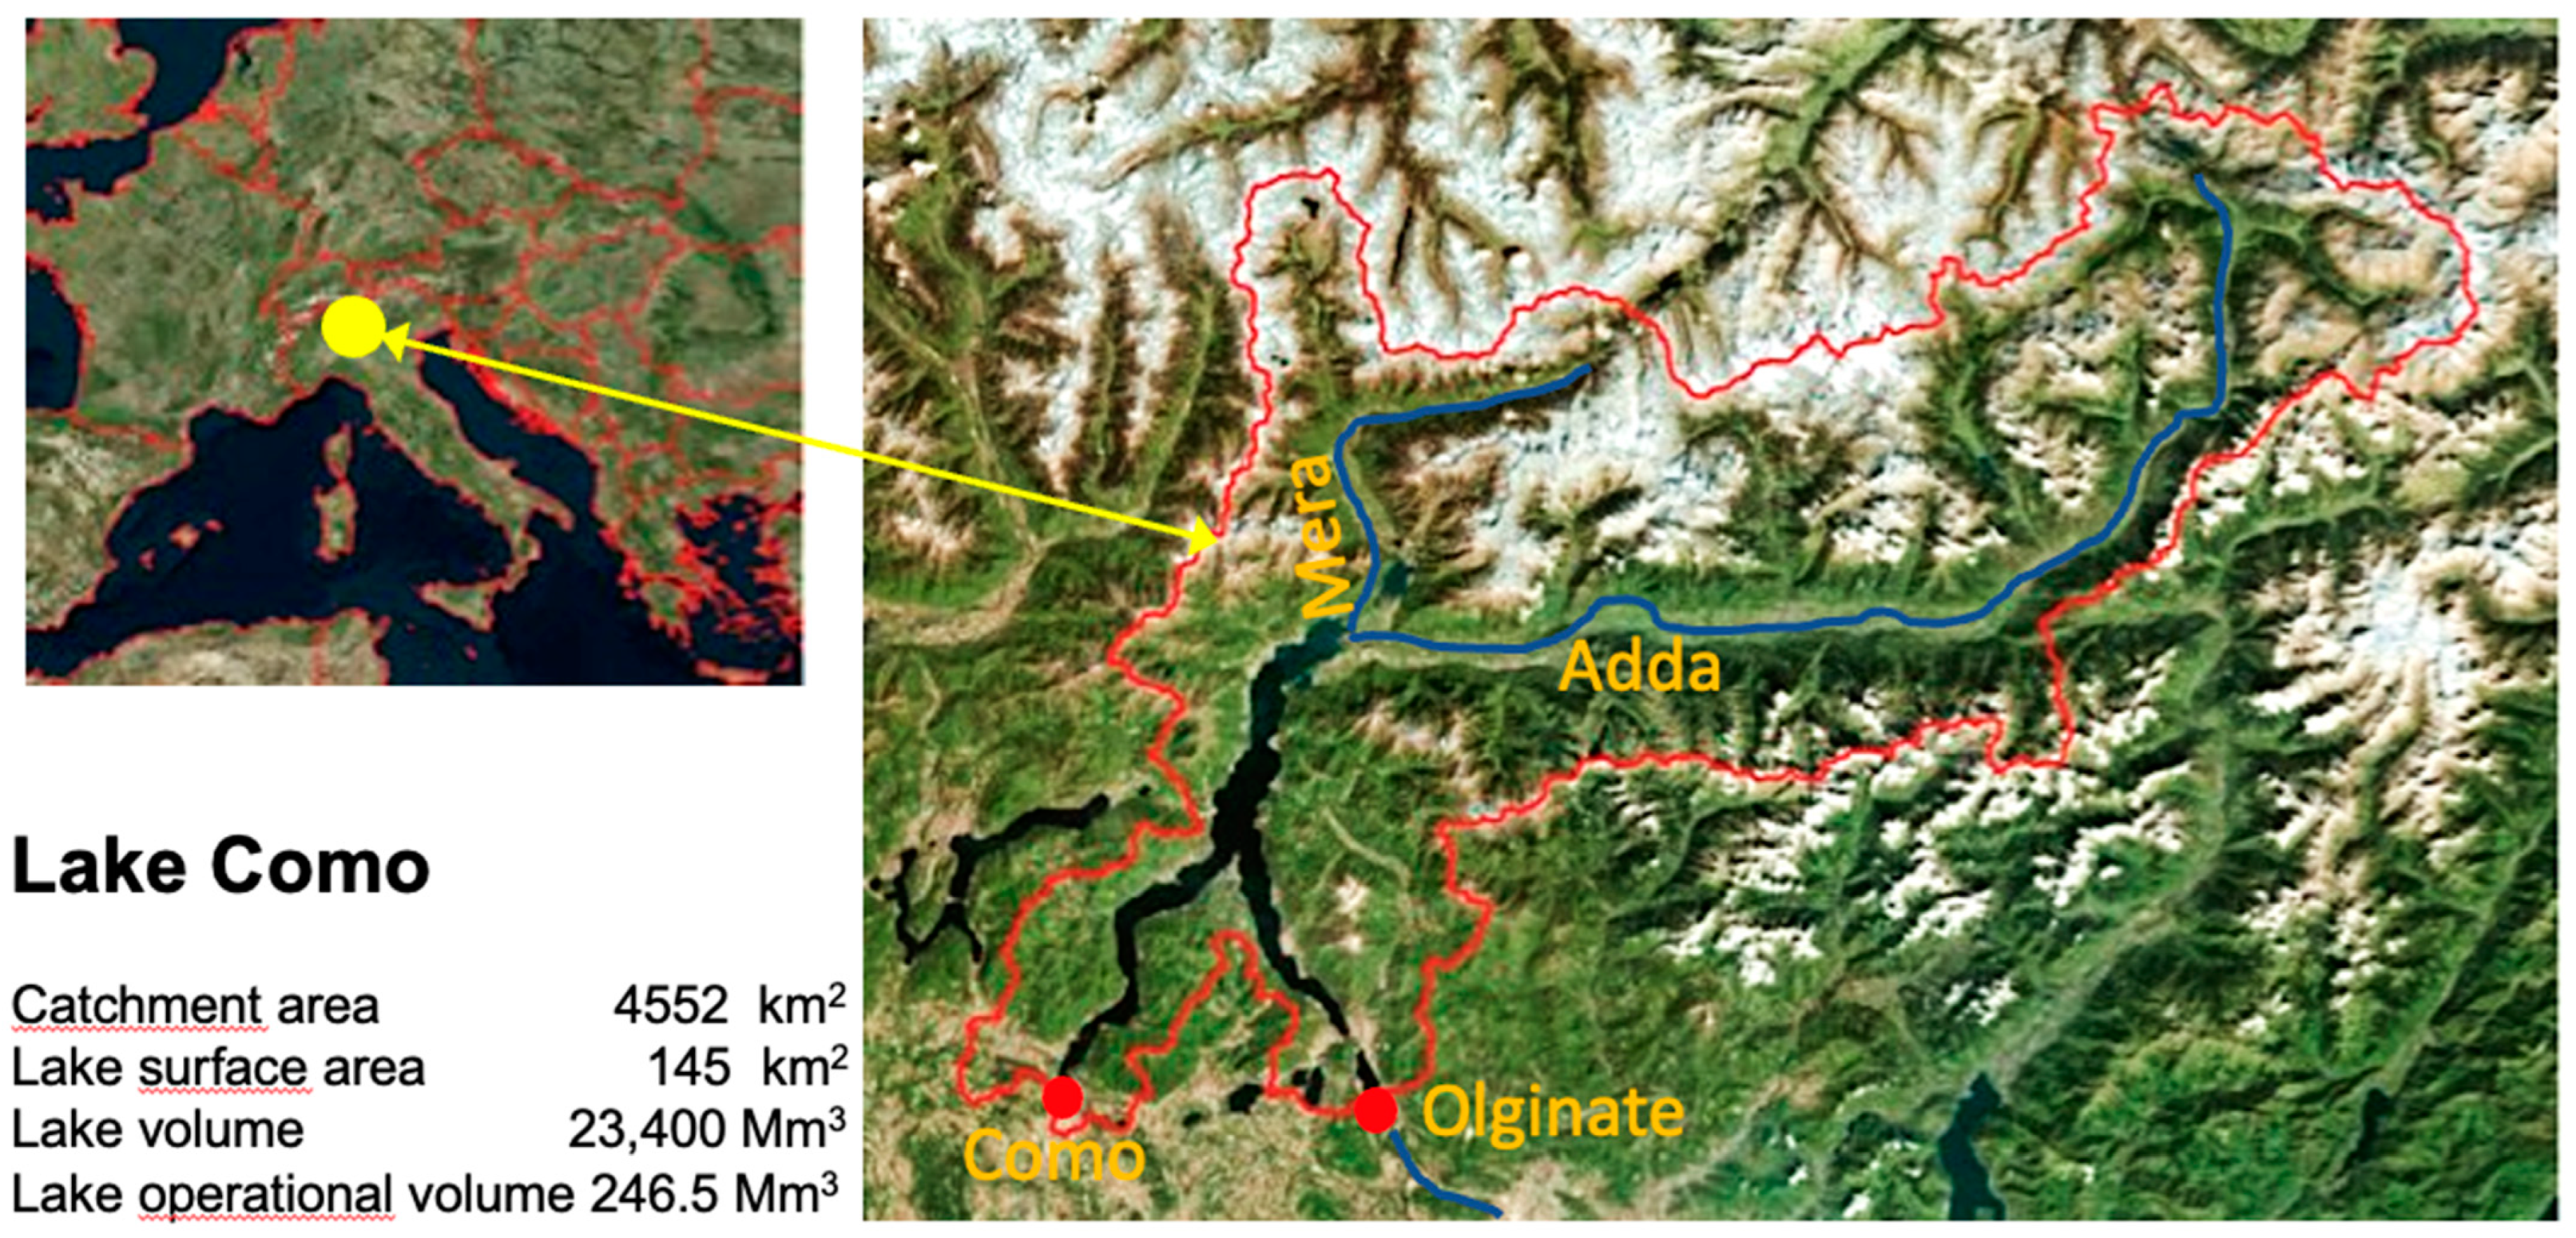
Lake Como in the Lombardy region is the third-largest lake in Italy (
Figure 1). It has a total volume of 23,400 Mm
3 of which only 246.5 Mm
3 can be regulated. The lake is mainly fed by the Adda and Mera rivers, with a total contributing catchment area of 4552 km
2. The hydrology is characterized by the Southern Alps’ mixed snow-rain dominated regime and has a mean annual flow of 156 m
3/s (approximately 4900 Mm
3/year). A fraction of the snowmelt runoff, which would naturally reach the lake, is captured upstream by several artificial hydropower reservoirs located in the upper catchment portion. Their cumulative storage capacity adds up to 515 Mm
3, a volume which exceeds the active capacity of lake Como by a factor of 2. Since 1946, the lake outflow has been controlled by Consorzio dell’Adda through a dam on the Adda river at Olginate with the goal of guaranteeing water supply to downstream users for irrigation and hydropower generation.
The flow of the river Adda was historically used to irrigate large rural areas downstream of Lake Como. With the advent of commercial electricity production at the end of the 19th century, several hydroelectric power plants were built downstream of the lake along the main river channel and the irrigation canals. Moreover, in recent decades, thermoelectric plants and a plentitude of mini-hydro plants have also been installed along the irrigation canals. Rarely has water availability been a major limiting factor for downstream users. Only in recent decades has the impact of climate change, manifested by an increasing intensity and frequency of droughts combined with reduced winter snowfalls, started to seriously challenge the operation of the Lake Como system.
Projects to increase the water volume stored in Lake Como and to use the extra volume for downstream needs were initiated already in the early 19th century. The main goal was to store water during the rainy seasons while releasing it downstream in low flow periods, when water demand exceeds natural flow. The construction of the Olginate storage/retention dam occurred between 1939 and 1945, while the Consorzio dell’Adda, the institution responsible for construction, maintenance, and management of the dam was established in 1938.
The construction of the lake Como regulation works, mainly the Olginate dam (1939–1945), immediately raised concerns among the riparian population that the rise of the lake water levels would cause flooding. Lake Como has in fact been historically characterized by floods that happen especially during intense rainfall events, when inflows largely exceed the outflow capacity, which has been considerably reduced by the construction of the dam, partly compensated by a 50% increase of the width of the dam’s section.
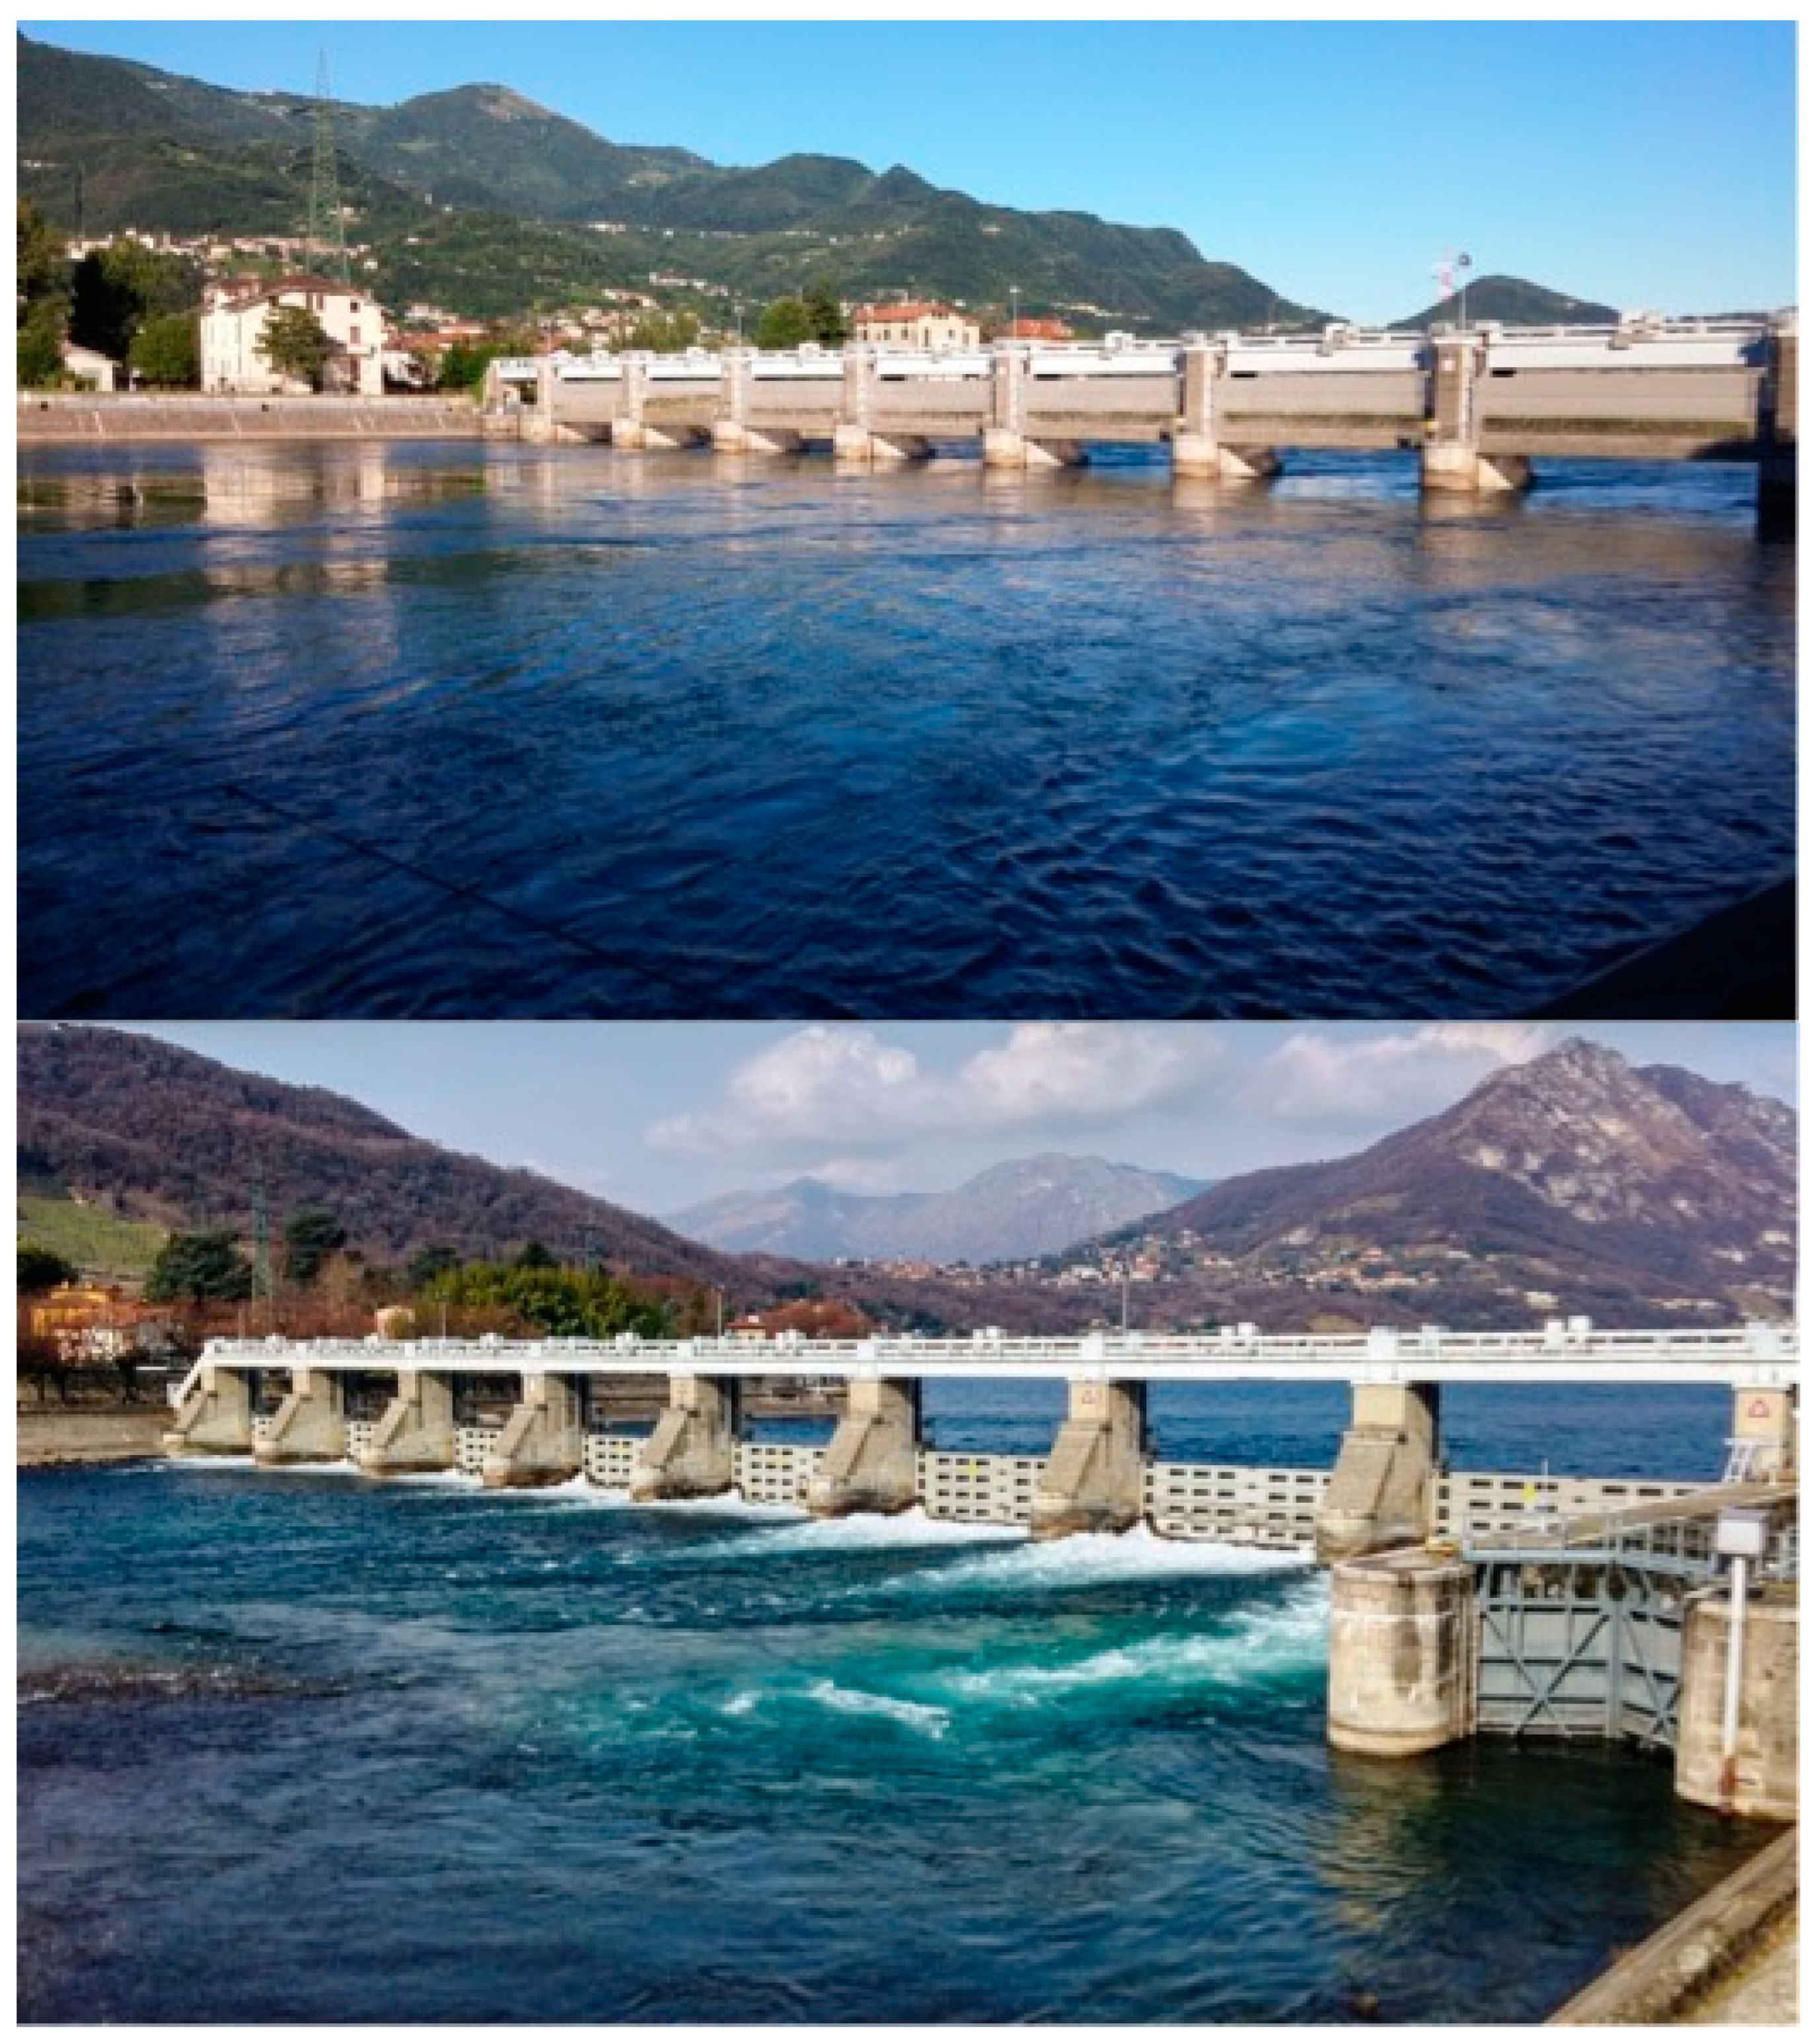
The Olginate dam (
Figure 2) is about 150 m wide and composed of 8 spans,14 m each, which can be shut by 4 m high flat sluice roller gates operated both electrically and manually. On the right side facing upstream, there is a navigation pond which is occasionally used to facilitate fish migration into the lake.
The operating range of the lake levels was fixed by law at 170 cm with an operational storage range of 246.5 Mm3. When water levels reach their allowed maximum, the sluice gates are fully lifted to allow free flow. This defines the Lake Como reservoir.
2.2. The Data Collection and Observation System
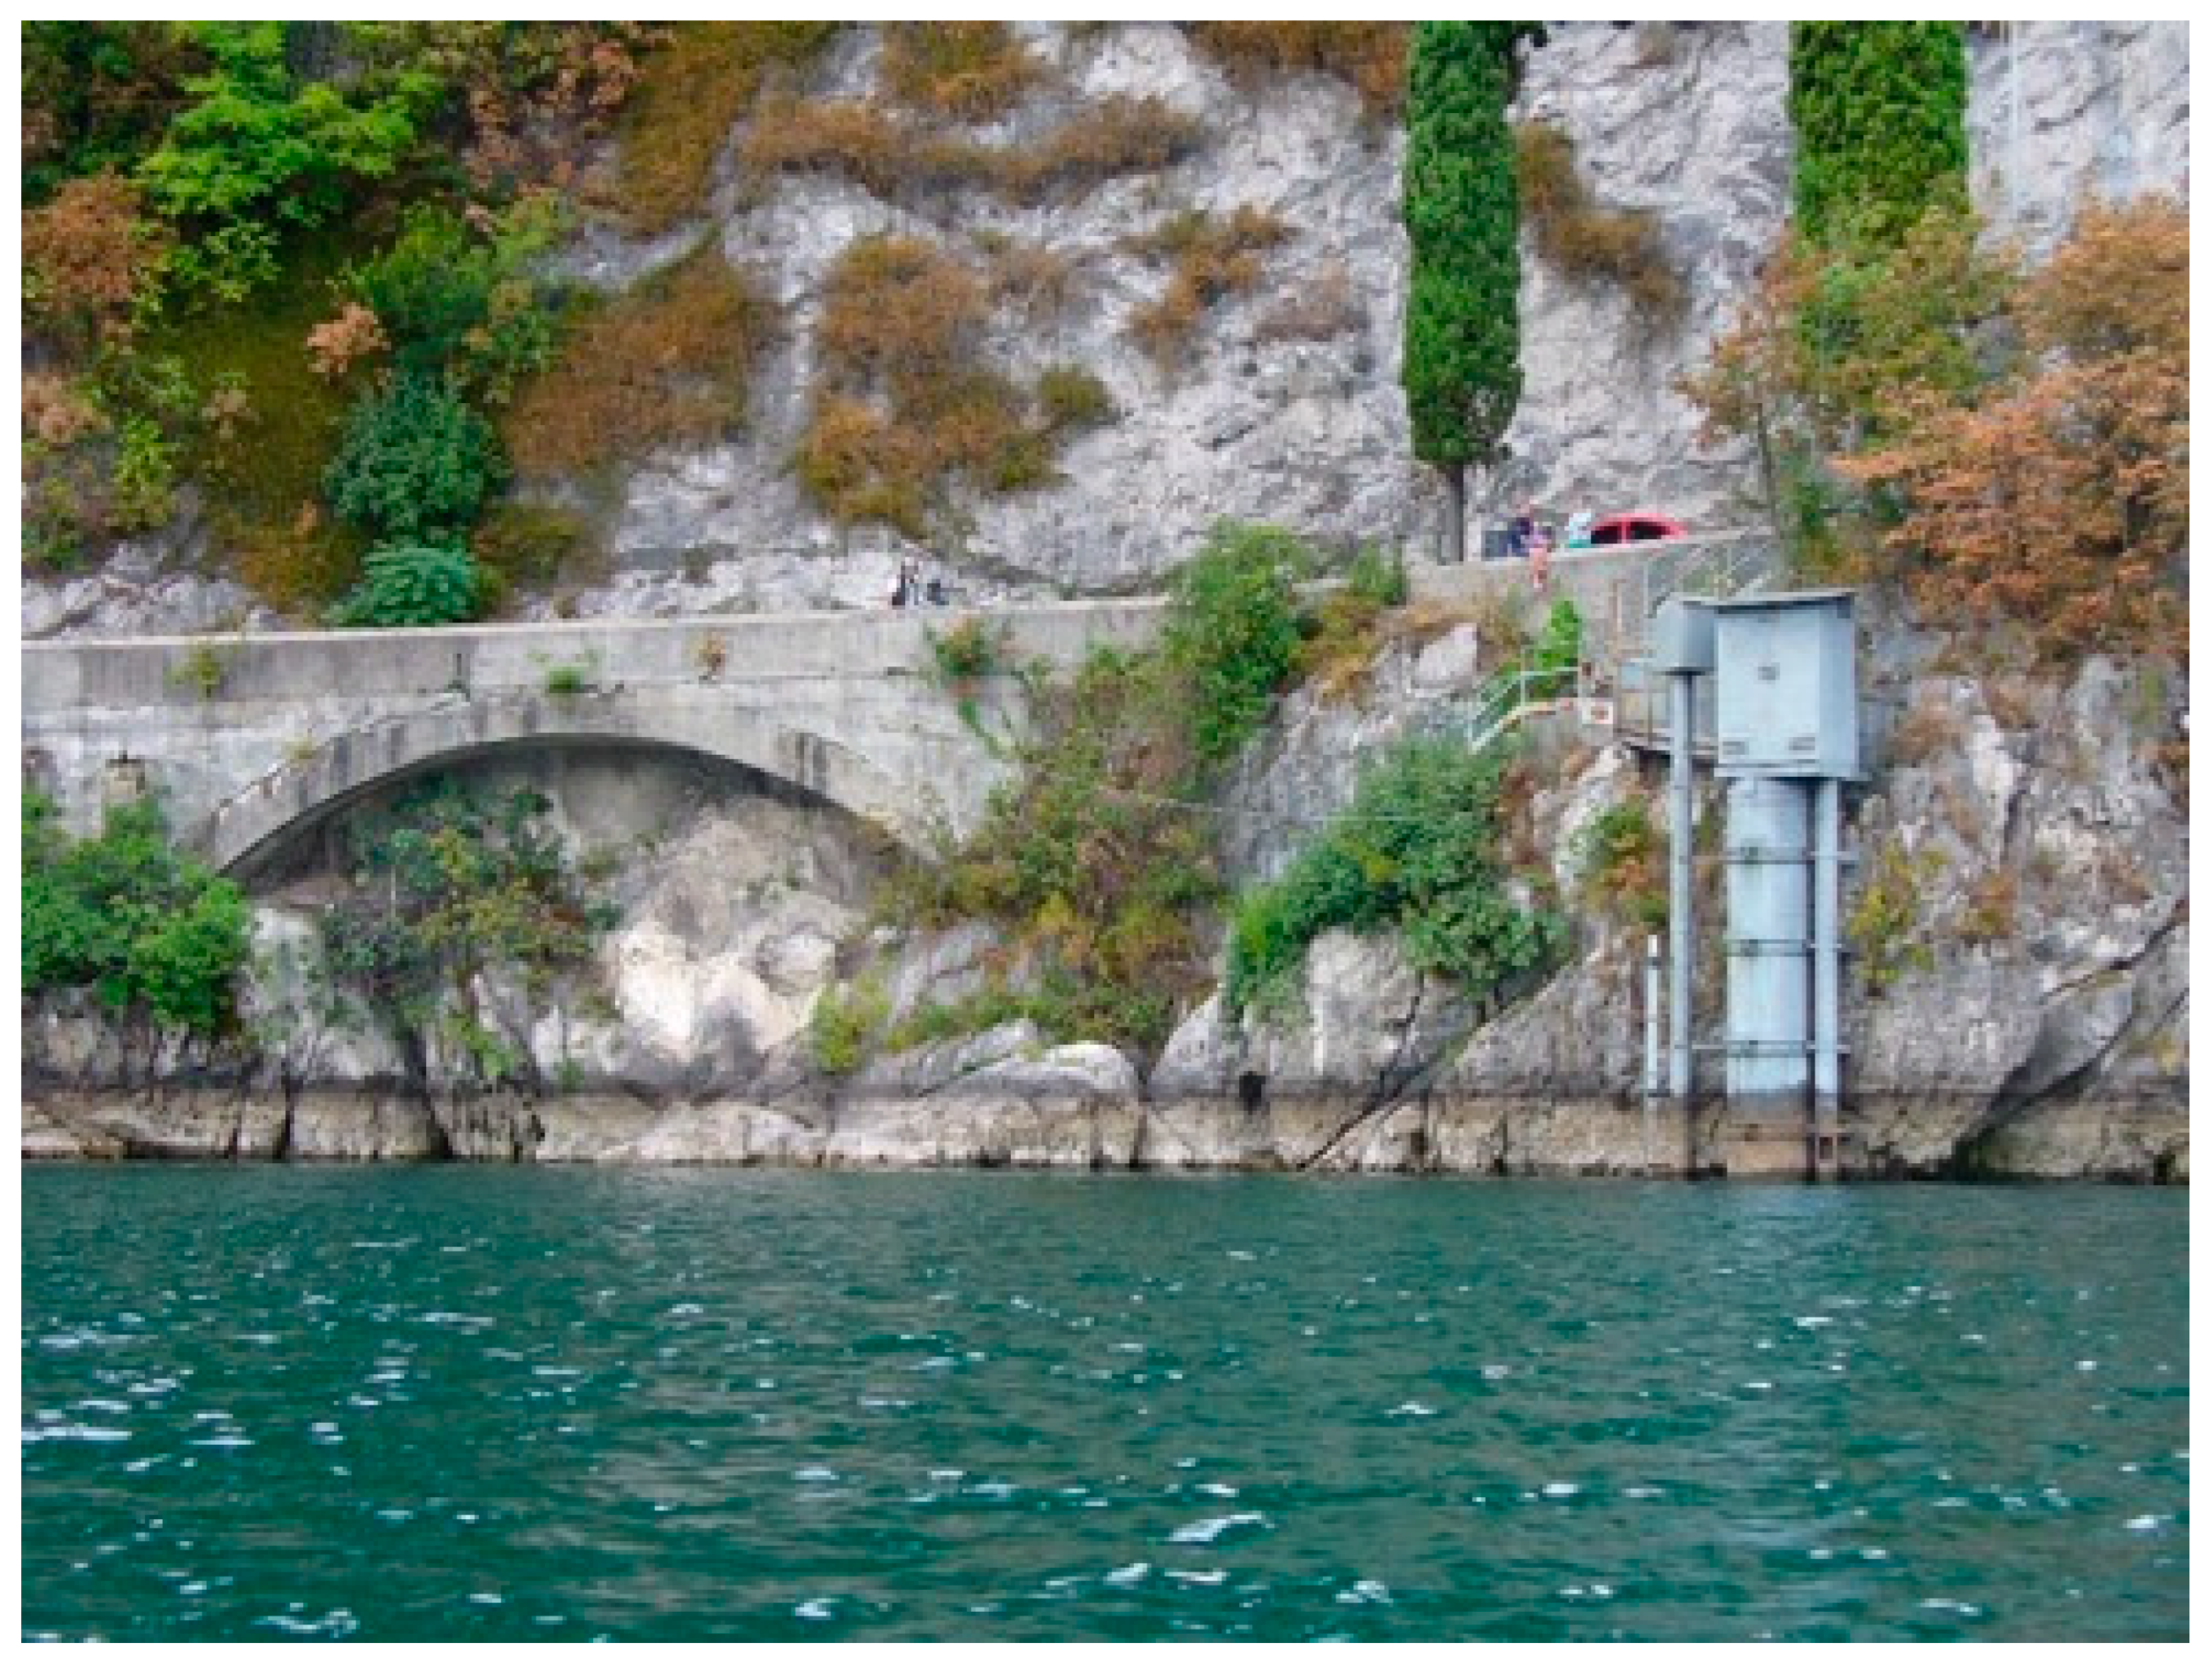
A network of precipitation and water level monitoring stations is available on the Adda catchment since the early twenties of the last century. In addition, two hydrometric stations were also installed in 1946 at Malgrate (7 km upstream of the dam) (
Figure 3), and Lavello (2 km downstream the dam) to support the new dam operations.
In the early days, the monitoring stations were reached daily by motorbike and read off-line. In 1953, a telephone data communication link was implemented, allowing for weekly readings, or more frequently during flood events. The water level gauges were finally substituted with electromechanical equipment and radio communications links and during the 1980s additional electromechanical hydro-meteorological stations were installed.
In the 1990s, four level gauges were directly equipped with telecommunications tools allowing real-time gauge readings. Three of the gauges were in the upstream part of the Adda river basin and the last one was installed in the Mera watershed. Considering that the stage-discharge curves for the four gauges were not accurate due to the riverbed instability, led to the additional installation of hydrometric stations.
By 1997, the available gauges were providing real-time measurements of water levels (4 upstream water level gauges) and precipitation (4 rain gauges), but no hydrological models providing water levels forecasts were available and the public service flood forecasts remained just qualitative. Moreover, the quality of remote sensing images of precipitation was poor as they were black and white and had very coarse spatial resolution. Hence, they could just provide qualitative information on approaching storms.
Therefore, the Consorzio dell’Adda in 1997 decided to start an upgrade program, with several actions to be set in place in the following years, such as: (1) improving the quality and the quantity of the data provided by the hydrometeorological data acquisition system; (2) adopting a rainfall-runoff model to forecast floods up to 24 h in advance; (3) implementing a Decision Support System (DSS) to improve lake management, (4) acquiring weather maps to anticipate the possibility of incoming storms, and (5) acquiring quantitative rainfall forecasts to extend the forecasting lead time.
2.3. The Historical Operating Rule
Starting from the early years after the dam construction, which was completed in 1946, the operation of the lake was based on the Lake Como water levels that could be measured directly by the operators in Olginate as well as daily readings of the three historical hydrometric stations at Lavello, Malgrate, and Fortilizio (5 km upstream the dam).
The management of the Lake Como reservoir was based on the application of the classical reservoir continuity equation:
with
[
] representing the changes in the reservoir water storage;
[
] the lake surface area;
[
] the changes in water level during the considered time interval
[
];
[
] the inflow net of losses;
[
] the outflow. The validity of this equation is guaranteed by the practical invariance of the water surface area within the operating range.
The management operating rules were:
- 1
Fulfill the downstream water needs as much as possible;
- 2
Store the large amount of water associated to the spring and autumn floods;
- 3
Fully open the dam gates when the lake level approaches the upper-level limit.
3. The Challenge: Informed Management of Lake Como
Over the years, many natural and anthropogenetic transformations have changed both the lacustrine and upstream catchment area. For example, due to subsidence the level of Piazza Cavour in Como was lowered by more than 50 cm in the years 1950 to 1980; several artificial reservoirs for hydroelectric power generation were constructed in the upstream catchment area from 1950 to 1960; population growth and the dramatic increment of tourism led to increased pollution due to the expansion of the sewage systems discharging wastewater into the lake; the variety of fish species declined; irrigated crops changed; an environmental flow constraint was introduced for downstream withdrawals, etc.
All these changes had an impact on the water availability in the lake and affected its hydrologic regime. For that reason, many events which occurred since 1946 were interpreted by the population as a direct consequence of the Lake management practices.
Finally, new emerging challenges such as the preservation of the ecological/environmental conditions of the lake and of the river (ecological flow) emerged in more recent years, together with the need for adapting the lake management to the ongoing climate change impacts, manifested for instance by the dramatic reduction of winter snowfall, which is affecting the snowpack depth needed for spring and early summer irrigation water supply.
3.1. The Problems to Be Addressed
(1) Lake Como has an operating volume of 246.5 Mm3 (which was reduced over the years to 232 Mm3 to avoid flooding of Como’s Piazza Cavour which had been lowered by subsidence), a modest volume if compared to the volumes of the incoming flood waves;
(2) to avoid jeopardizing the downstream river sections, the maximum releasable discharges were designed to be around 900 m3/s with the lake at its maximum level, not exceeding the natural outflow. This causes the fast filling of the lake operational volume (2–3 days) being rather small when compared to the lake inflows which can exceed 1800 m3/s;
(3) due to the problems posed in points 1 and 2, the lake can fill up in about three days from its minimum allowed level of cm at a level gauge placed upstream of the dam in Malgrate to the maximum level of cm allowed by law, now lowered down to cm to avoid flooding in Piazza Cavour;
(4) if the lake level exceeds cm at Malgrate the water invades Piazza Cavour, the main square of the city of Como with increasing damages depending on the maximum level reached and the duration of the inundation;
(5) if the lake level is lower than cm in Malgrate many areas, where the spawning of fish takes place, become dry with serious ecological-environmental damages;
(6) the concentration time of the Adda basin upstream of Lake Como is less than 24 h and it is therefore not feasible to make forecasts up to three days in advance using a catchment hydrological model unless a reliable quantitative precipitation forecast is available, which unfortunately was not the case back in 1997.
3.2. The Availability of Data
To develop the Lake Como Decision Support System (DSS), the available data were a long series of lake inflows measured daily at Malgrate starting from 1946 onwards. As suggested by the lake manager, observations from 1946 to 1960 were discarded because in that period many reservoirs were being built in the mountain part of the Adda river, the tributary of Lake Como, which albeit not yet fully operational, would have substantially changed the pattern of the lake inflow.
Seepage and percolation losses are negligible; in Lake Como, only evaporation losses are relevant. Average daily temperatures were thus collected and used to estimate evaporation from the lake, to be subtracted from the measured inflows to calculate the inflow net of losses, to be used in the continuity of mass equation.
Consorzio dell’Adda reconstructed the irrigation demand data as well as the hydropower production ones. However, hydro power production was not included among the objectives to be maximized, because the hydroelectric plants are installed along the downstream river and the irrigation canals and remain unaffected by the water depth in the lake. They benefit from increased releases from the dam, which are already included in the fulfillment of the irrigation demand.
3.3. The Requests from the Lake Como Manager
The main purpose of the Lake Como management is the fulfillment of the yearly irrigation demand, usually higher than the average yearly available water volume.
Nonetheless, the management of Lake Como expressed a major concern. The Consorzio dell’Adda, is vested with the responsibility for any damage resulting from incorrect decisions in line with the established protocols. On many occasions in the past, it was brought to trial for damages resulting from floods. Therefore, not being able of avoiding major floods of multi-day duration due to the very nature of the problem and the volumes involved, the main request from the decision maker was that of a lake management allowing for a substantial reduction of the frequency, duration, and extent of Como floods, with particular attention to the small and frequent ones, that cause traffic disruption in the city of Como.
Management also requested maximizing the availability of water resources for irrigation purposes which, as previously stated, is the main objective of their activity.
Finally, management asked to possibly avoid ecological/environmental damage when the minimum lake levels fall below cm in Malgrate.
4. The Implemented System
4.1. The Implemented Reservoir Optimization Approach
To meet the Lake Como decision maker’s requests, it was agreed that the operating rule would be structured in two steps. In addition to the typical optimization of irrigation systems based on ten-day time steps, it was decided to carry out a short-term optimization based on daily time steps using day-to-day updated statistical forecasts of inflows from one to ten days in advance.
The reasons for this are due to the lower risk propensity expressed by the decision-maker during transient events, such as large flood waves potentially causing floodings in the city of Como. The first stochastic optimization, here referred to as “long-term”, based on transition matrices from a ten-day period to the next, seeks to maximize the expected benefits in terms of irrigation demand satisfaction. The second optimization, here referred to as “short-term”, uses forecast ensembles to assess the probability distributions of the following 1, 2, …, 10 days inflow volumes conditioned to the latest observations with the final objective of minimizing the expected flood and ecological/environmental damages.
Given that the dynamic operational volume of Lake Como is basically less than the overall demand, in accordance with the end user, the long-term objective function was essentially developed to minimize the total expected losses due to the lack of available water to be released.
The long-term optimal solution was then found by using a classical SDP algorithm originally developed for the Aswan reservoir optimization [
1]. In this case, it was not deemed necessary to use multi-objective optimization techniques, as the Lake Como objectives aim at satisfying irrigation demand, hydroelectric power production, and environmental flow, all of which only depended on releases. Hydroelectric power production only depends on released flow and not on the lake water elevation because power stations are all located downstream from the lake along the river and the irrigation canals.
The SDP approach was based on a discretized formulation and optimal releases for the current periods were obtained as a function of one of the eight classes pertaining to the inflow, which was observed in the previous time-period and one of the 97 possible ranges of water levels in the lake at the beginning of the current period.
The short-term optimization was based on an original approach which independently minimizes the estimated expected damages, conditional to the latest day inflow and to the current lake level.
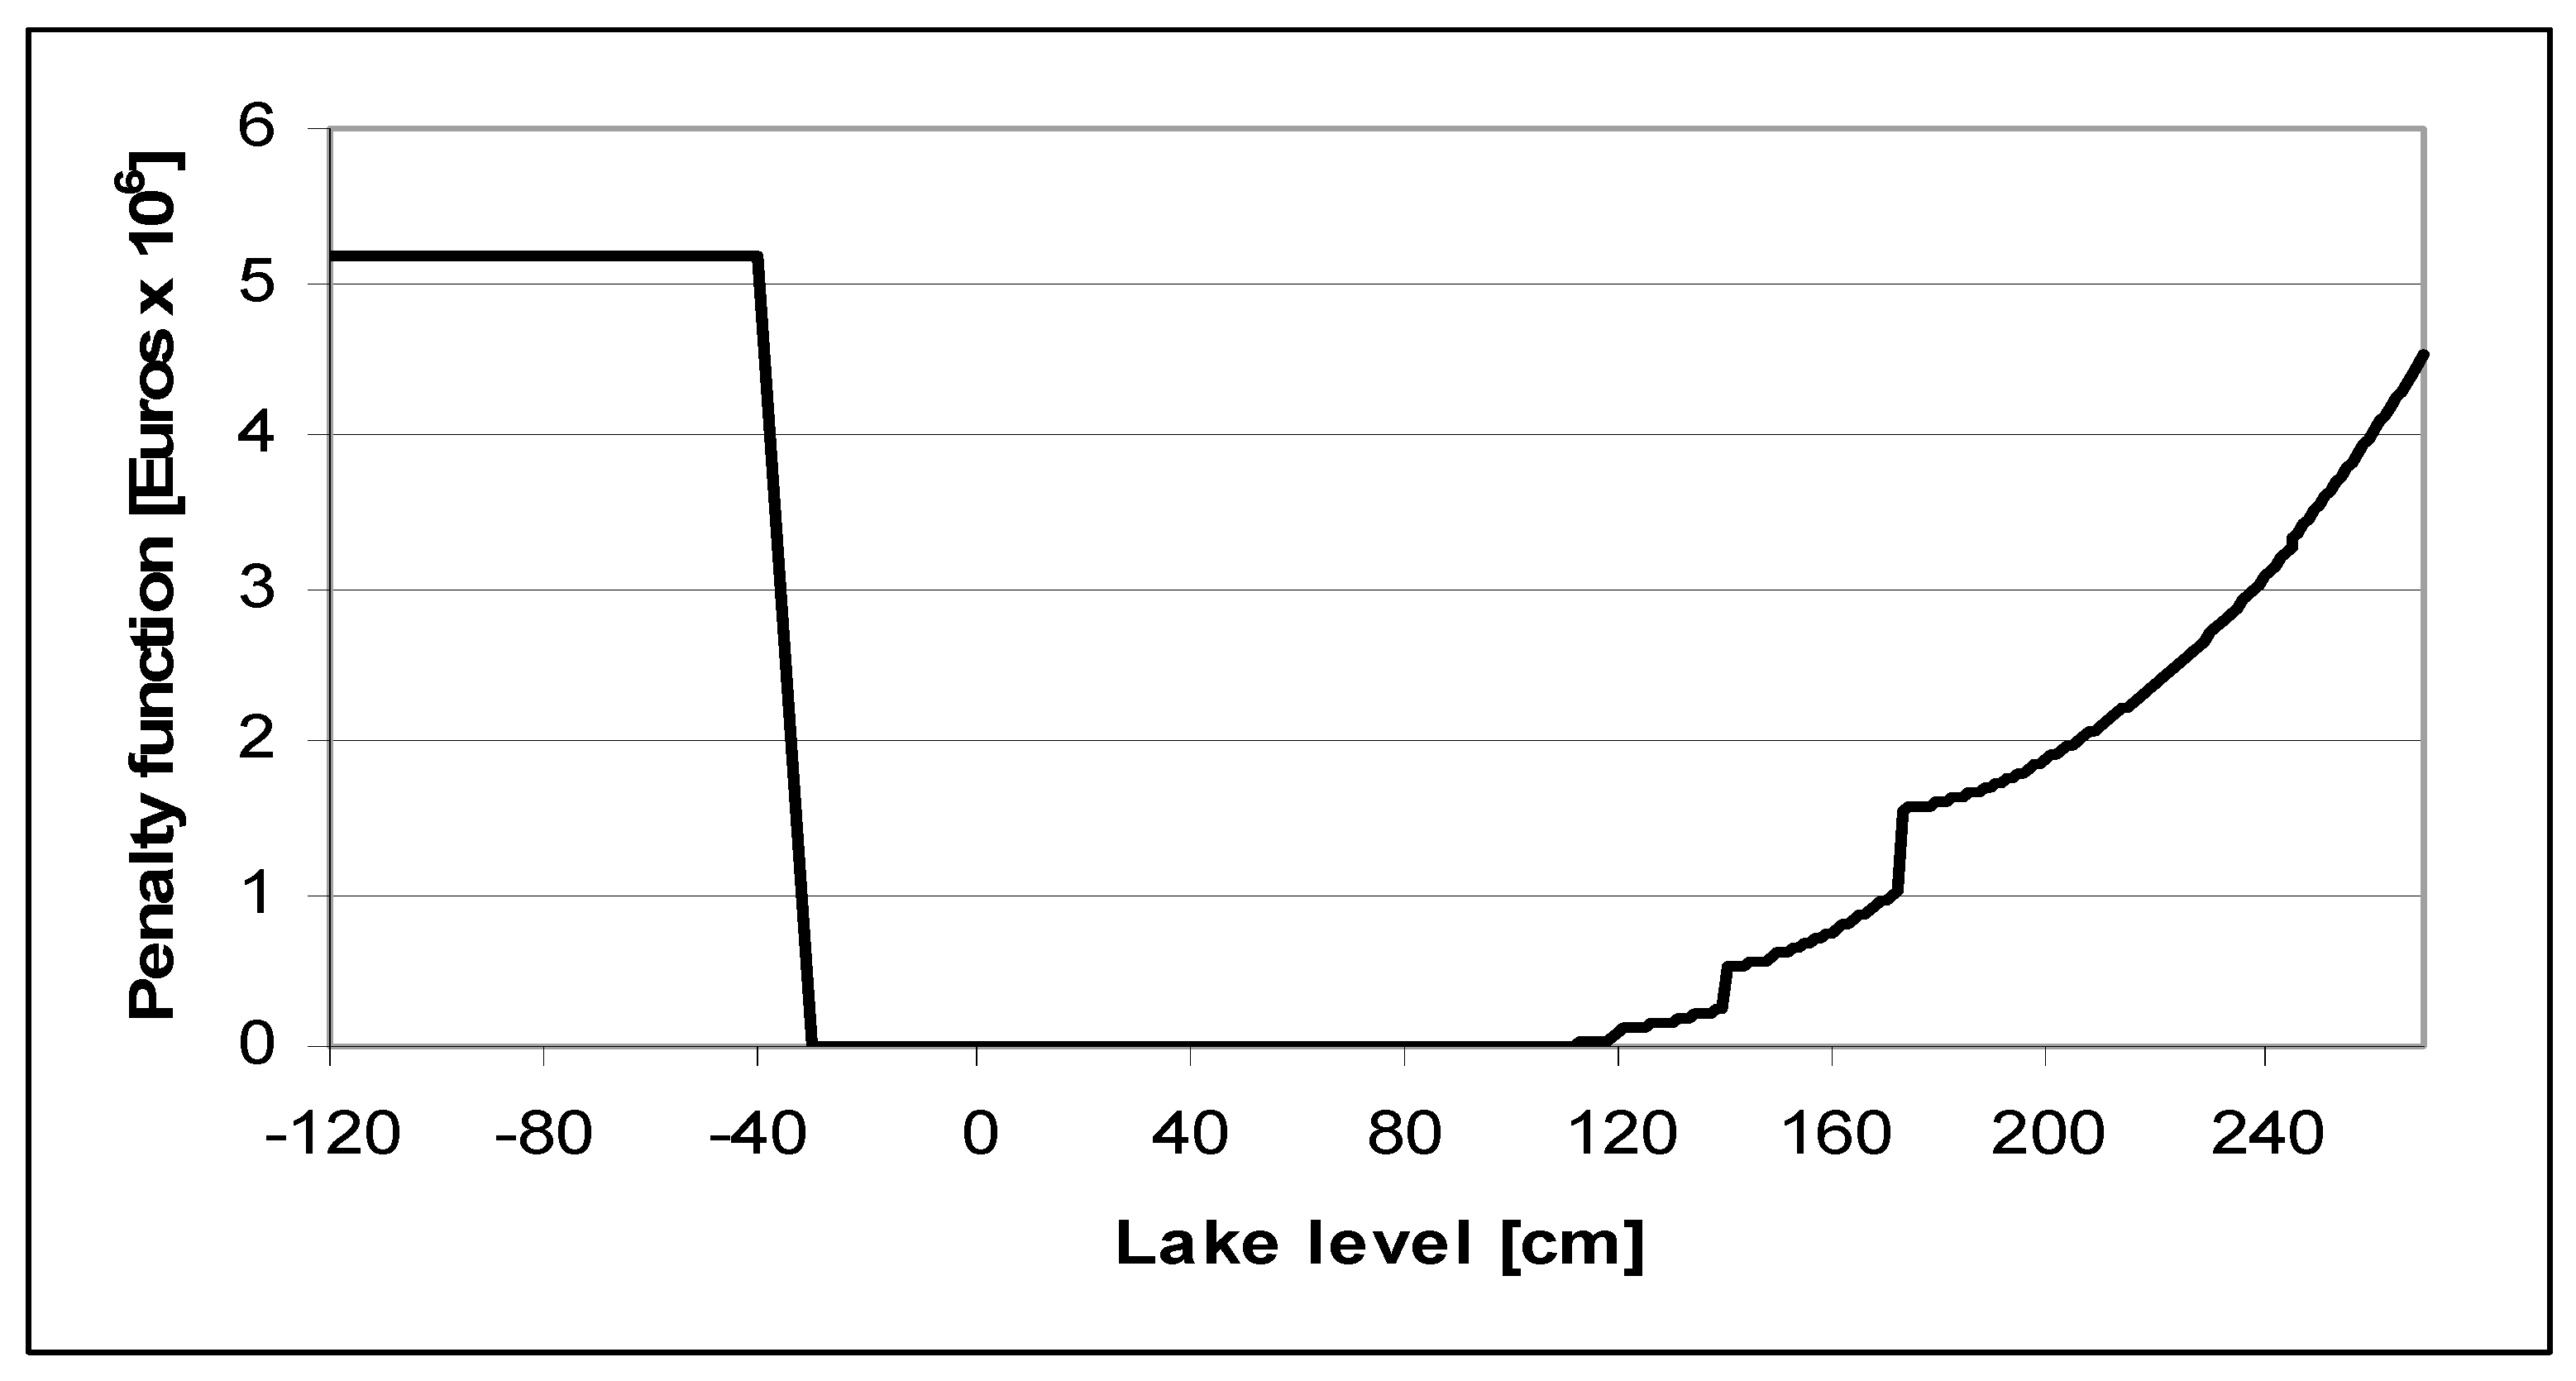
The selected objective function (
Figure 4) was similar to the classical ones found in the literature with a wide indifference reservoir volume sided on the edges by monotonously increasing cost functions [
20]. The ecological/environmental objectives such as the environmental flow and the minimum lake level were introduced in the lower end of the objective function by highly penalizing levels below
cm, while flood damages were introduced with stepwise shape on the upper edge sharply increasing if the lake level overtops respectively
cm at Malgrate (water starts flooding Piazza Cavour),
cm (traffic is stopped) and
cm (Normal flood level). These steps were defined in agreement with the lake management to accommodate its concern and risk aversity with respect to the incidence of their occurrence.
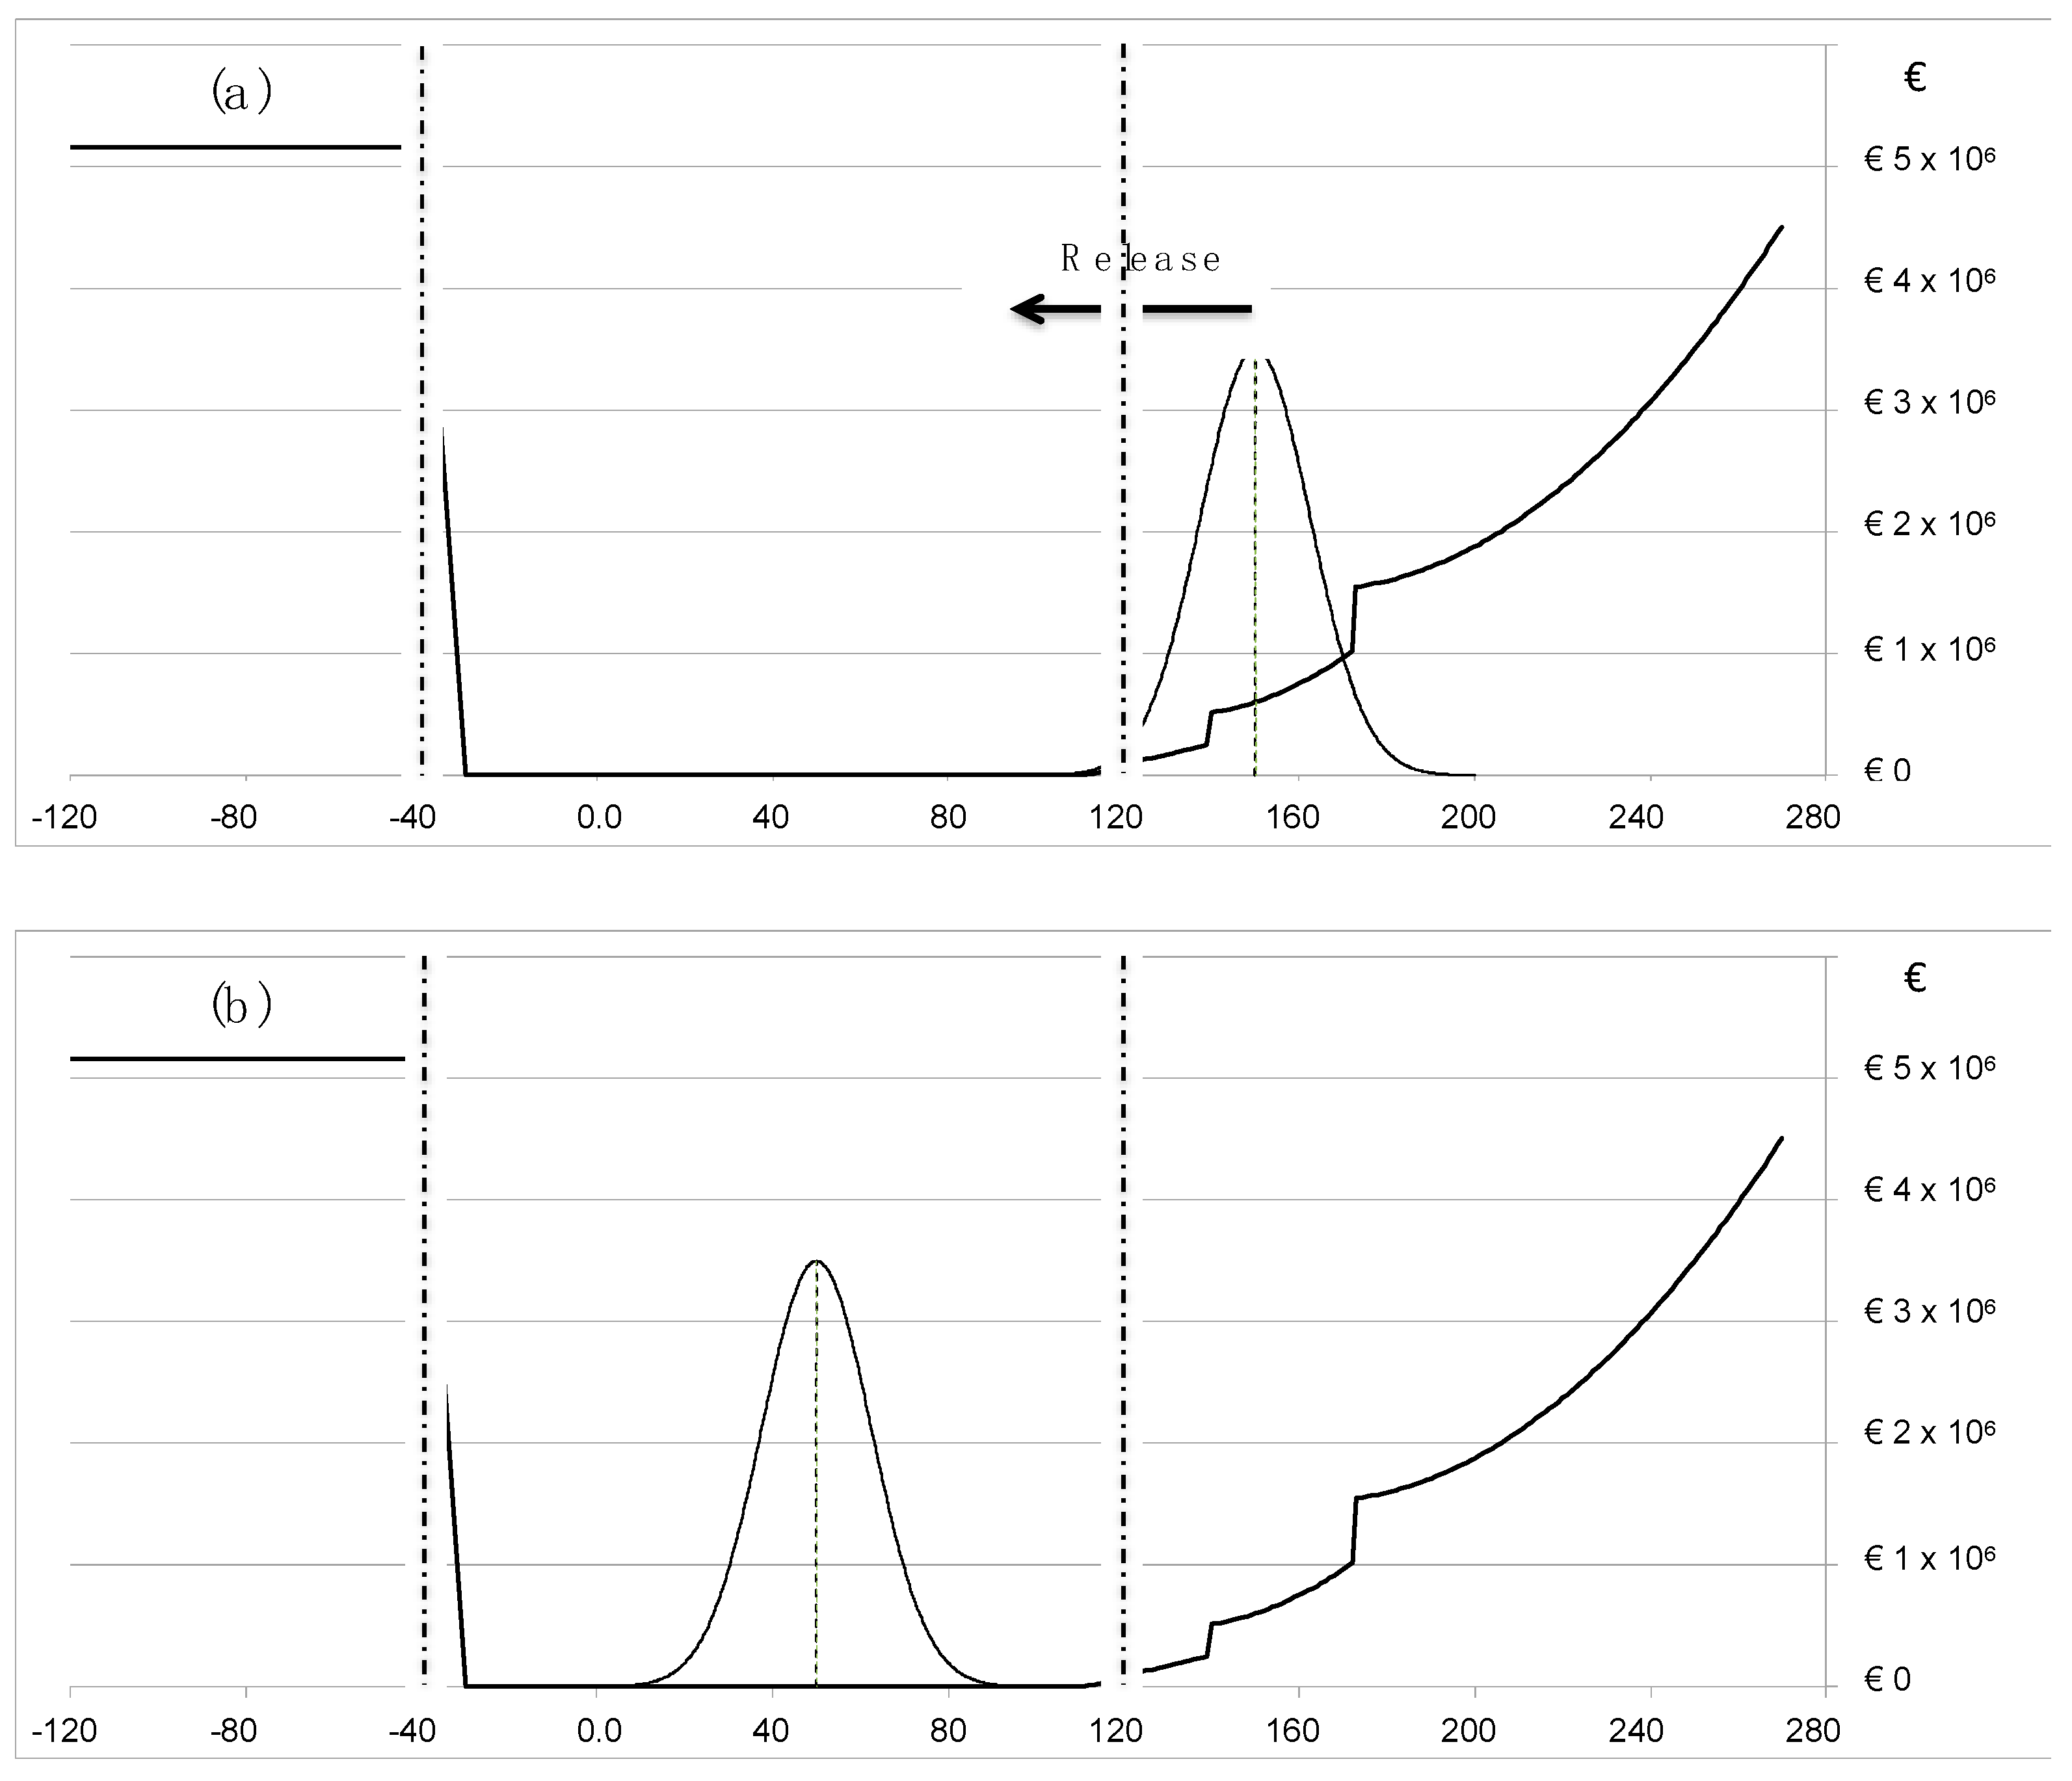
Figure 5 explains the rationale of the approach. The bell-shaped curve in
Figure 5 pane (a), represents the predictive probability density of the reservoir cumulated volume at the end of the optimization horizon (note: in Lake Como, the volume can also be expressed in terms of elevation because the lake area remains sensibly constant in the operational range). The objective function’s value is the sum of the integral of the product of the predictive density times the utility function and the costs arising from not meeting the optimal release derived from the long-term optimization. In practice, by releasing water from the reservoir, one shifts the mean of the probability density downwards without modifying its shape, which only depends on the predictive probability density function. The new integral of the product between density and objective function will vary accordingly and by varying the entity of the release, one searches to find the optimal position of the density to minimize the objective function (
Figure 5 pane (b)).
The predictive probability densities were obtained as Gaussian densities, with mean and variance estimated on an ensemble of 50 Nearest Neighbors (NN) [
32,
33] projections of future total inflow volumes for time horizons between one and ten days in advance. The ensemble members were selected by comparing the observations of the latest ten days with similar sequences observed in the past and choosing the ones with the highest correlation. The series of inflow volumes observed in the ten days following each of the chosen past sequences were then considered as a member of the predictive ensemble. Given that both the expected value of costs [
14] and the Jacobian can be analytically computed for various shapes assumed for the predictive density (Normal, Log-Normal, Gamma, Truncated Normal) a rapidly converging minimization is reached by searching the zero of the Jacobian with a dichotomic approach (DA), starting with an initial interval between zero release and an exceedingly high value to be halved at each iteration. The DA allows for avoiding potential instabilities of the Newton-Raphson approach when the first order derivative is not fully continuous in the search interval and rapidly reduces the search interval to
of its initial value after
iterations. This allows for the obtaining of the optimal expected reservoir volumes at the beginning of day
, namely
as a function of the total released volume. The daily rule is then found by backward subtraction of the resulting optimal volumes to give:
where
is the optimal release volume for day
. Since releases from the lake are caused by gravity, whenever
cannot be released from the outlet due to insufficient lake elevation, a sub-optimal solution
, satisfying the fully open gates rating curve is then proposed to the decision maker.
This approach of accounting for predictive uncertainty was originally developed on behalf of FAO to quantify the benefits deriving from an improved flood forecasting system in the case of Lake Nasser in Egypt [
34], in a simplified way. The computational speed is very high and, if the cost coefficients in the objective function do not vary within the ten days horizon, which is a fair assumption for such a short period, the results correspond to those obtainable using a formal SDP approach.
4.2. The Decision Support System
The Decision Support System, installed in 1997, aimed at hiding the complex optimization from the decision-maker, thereby limiting the interaction through an extremely simple interactive interface. The only information requirements to be provided by the decision-maker were the lake water level at the beginning of the current day as well as the measured inflow the previous day, to be added to the long series of past observations.
In response, the DSS would provide information to the decision maker in the form of the expected future inflow, and future lake levels when using the estimated optimal release or an alternative one proposed by the manager according to his opinion and checking the resulting effects on the final lake levels.
It is quite interesting how the system was accepted by the end-user. At the end of 1997, the system was installed operationally, and the Director of the Consorzio dell’Adda, in charge of lake management, was invited to look at it, but not to use it until he had confidence in its effectiveness. After six months of operation, the Director admitted that he had often been beaten. Every time he took a decision, which was different from the one suggested by the DSS, he was wrong. Ever since, the system has been in operation and used successfully; it has produced not only a reduction in the number, frequency, and magnitude of Como flooding events, but also a small increase in energy production and a significantly large volume of additional water for agriculture.
4.3. Further Improvements to the DSS
During the following years the DSS was often subjected to revisions and improvements.
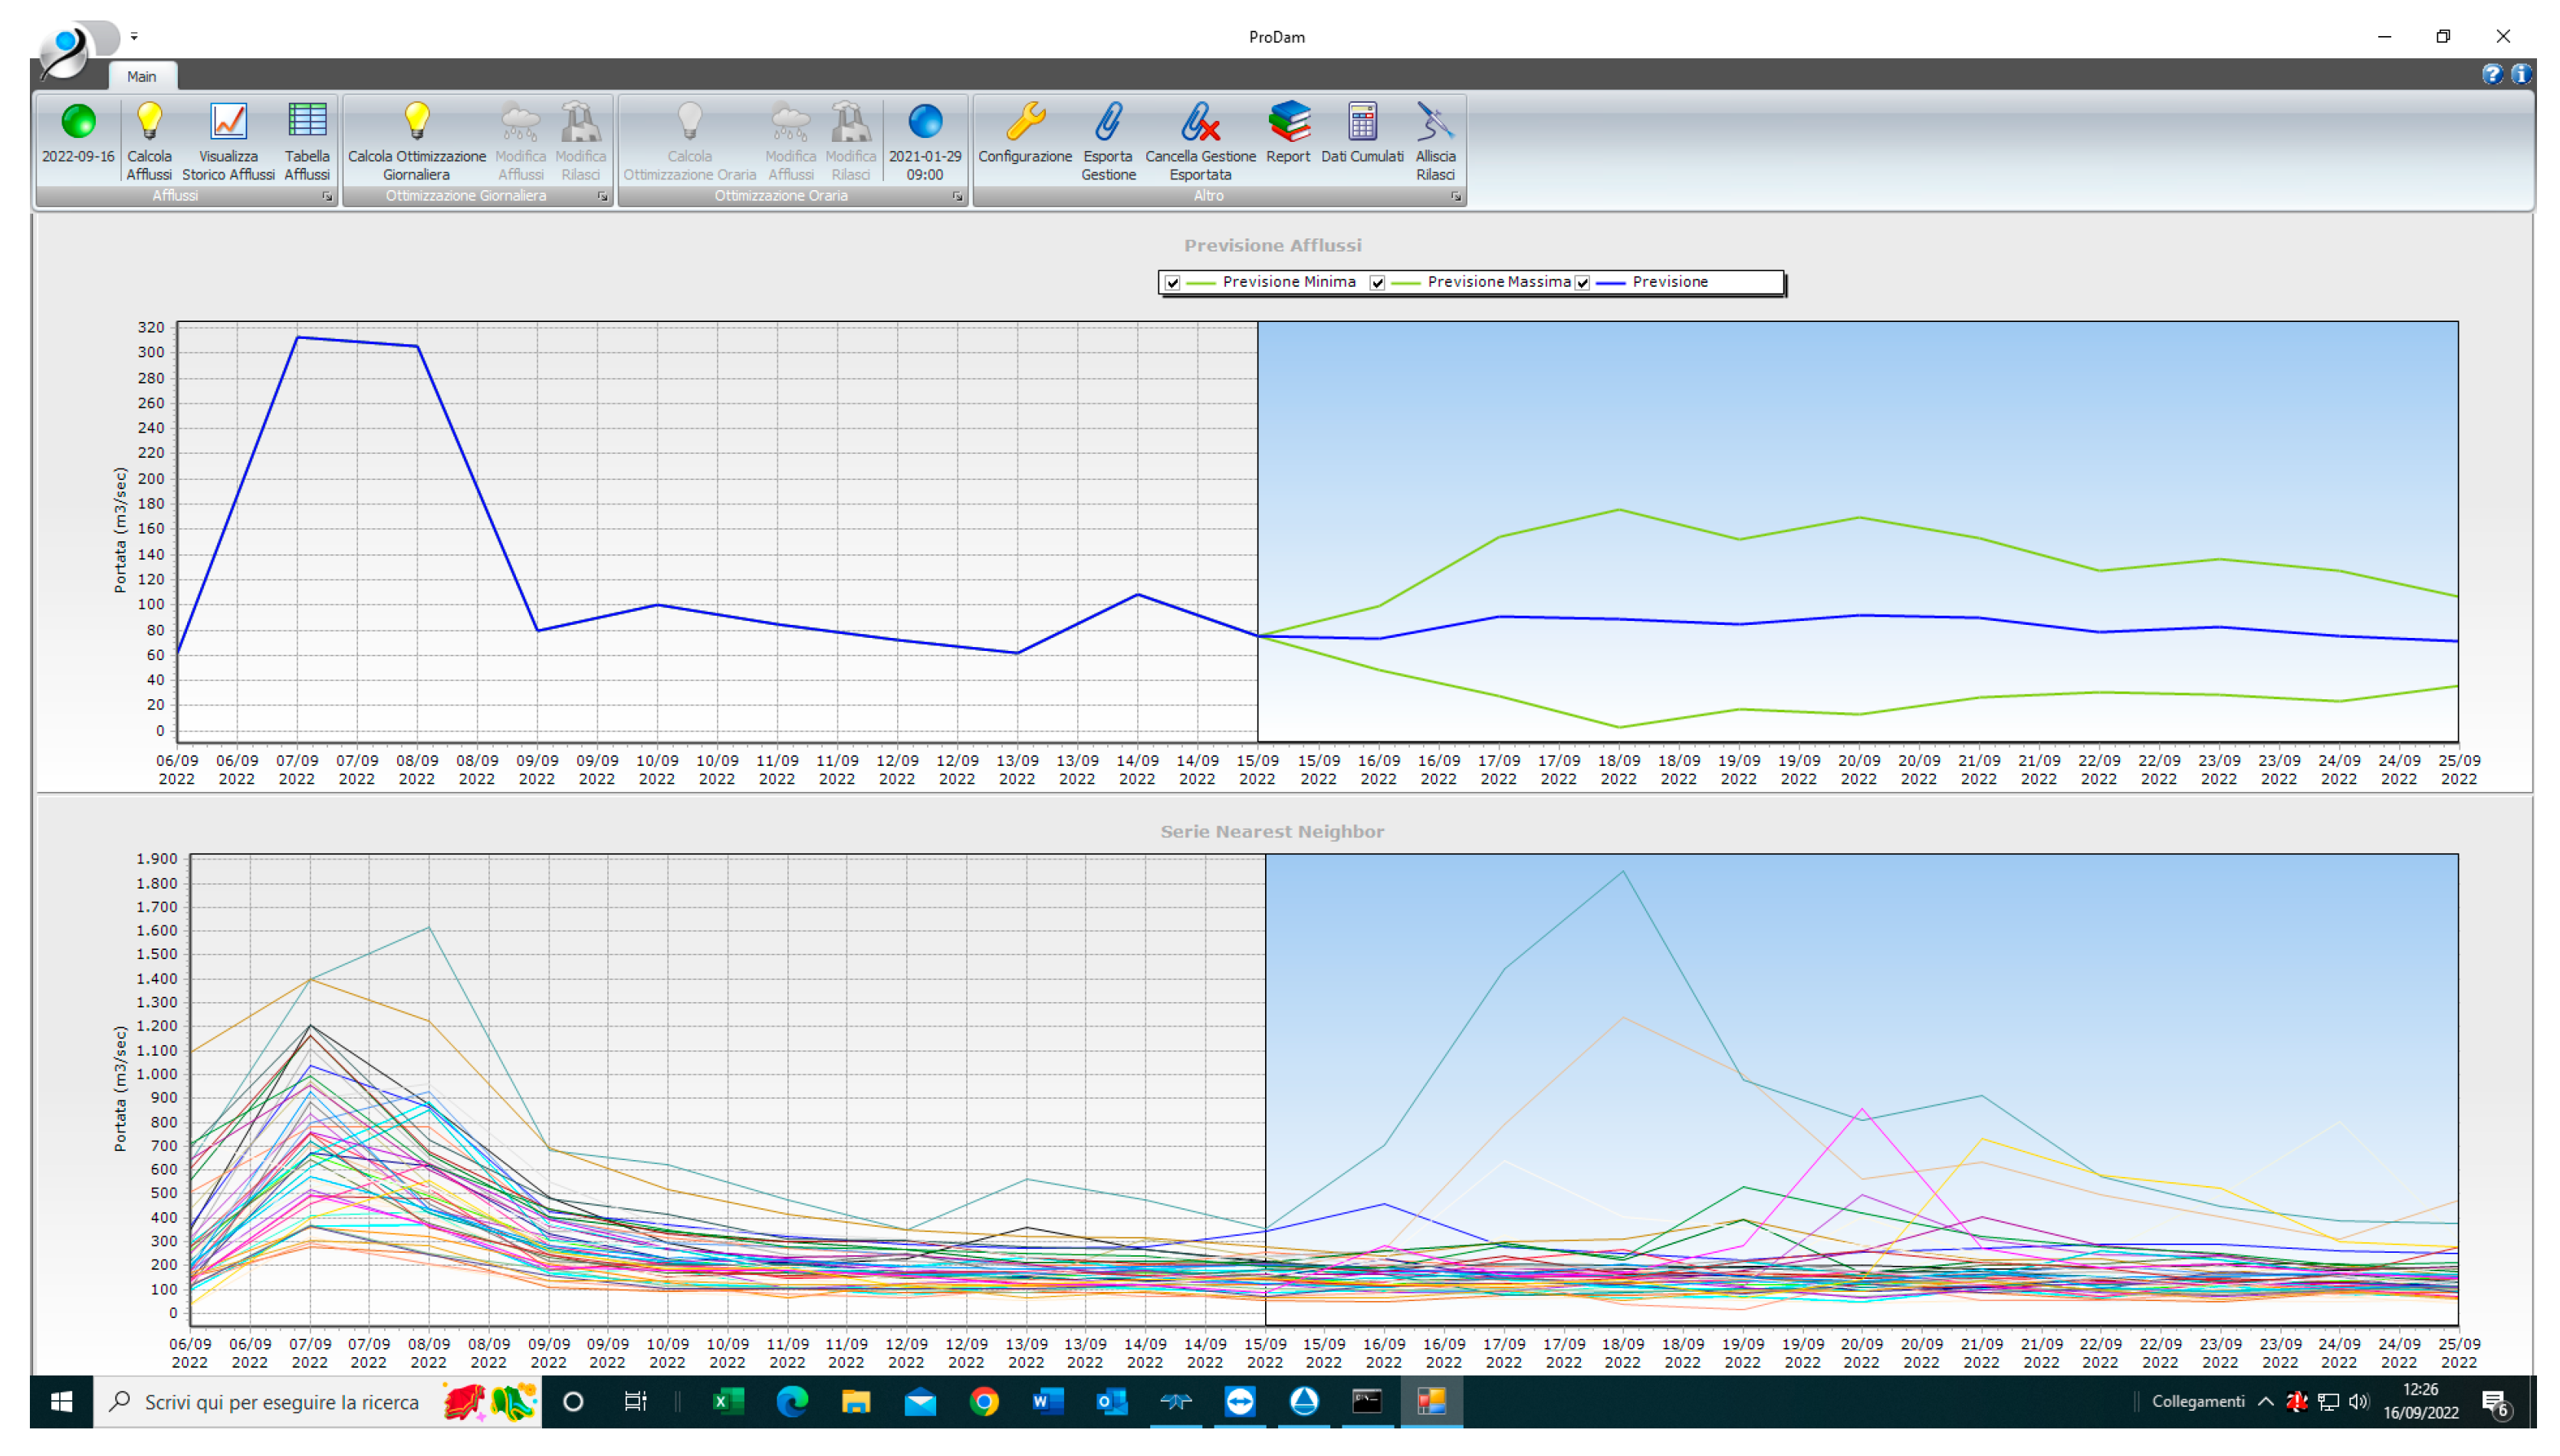
Figure 6 is a display from the latest version of the DSS showing the predictive mean and
limits in the upper pane and the NN ensemble members in the lower pane.
One of the earlier requests made by the decision maker was to be allowed to “reorientate” the forecasted ensemble members towards an optimistic or a pessimistic view. Given the availability of additional information, not specifically included in the DSS, such as weather maps or satellite images, he wanted to adjust the forecasts to take this additional information into consideration. In other words, if a large incoming flood wave was forecasted by the ensemble members, but neither the weather maps nor the satellite images showed approaching weather systems, he would have liked to take an optimistic view of the future. Similarly, when no floods were predicted by the NN approach, but both the weather maps and the satellite images showed heavy rainfall approaching, he would have liked to take a pessimistic view.
This problem was successfully solved by modifying the weighting in the estimation of the mean and variance of the ensemble of NN forecasts.
In the estimation of mean and variance, we commonly use to weight observations, with being the number of the ensemble members to weight observations. Instead, for the optimistic case after ordering the members of the ensemble in ascending order, the weights will be higher on the lower valued forecasts if using the following weights: where ranges from 1 to from the lowest to the largest forecasted member value. Similarly, for the pessimistic case after ordering the members of the ensemble in ascending order the weights will be lower on the lower valued forecasts using the following weights: where ranges from 1 to from the lowest to the largest forecasted member value.
The Lake Como Director also requested the development of a real time flood forecasting model based on a rainfall-runoff model of the Adda river catchment.
Based on the technology available for the lake management in the 1990s, which allowed for the lake reservoir to be managed within short timespans in response to hydrological events in the catchment area (about 24 h for the Adda river basin), a semi-distributed conceptual rainfall-runoff model was implemented and used to provide short-term forecasts ( h). The new forecasts were used in the assessment of the predictive uncertainty to optimize the expected utility function from 1 to 24 h.
At the beginning of the new millennium, the accuracy of weather forecasting models reached 72 h ahead, and so the rainfall-runoff model was integrated with quantitative precipitation forecasts (QPF) provided by the Agenzia Regionale Prevenzione, Ambiente e Energia (ARPAE) (Regional Agency for Prevention, Environment and Energy) of Emilia Romagna.
More recently, following the further requests of the Consorzio dell’Adda, the rainfall-runoff model of the DSS tool was substantially improved. The physically-based fully distributed approach, the TOPKAPI model [
35], was implemented and integrated with the real-time data acquisition system as well as with continuously updated QPFs while the monitoring network was further extended and the stage-discharge curves recalibrated. The Consorzio dell’Adda also integrated stations from other networks such as Agenzia Regionale Prevenzione e Ambiente (ARPA) of Lombardia in Italy and Federal Office of the Environment (UFAM) and University of Applied Sciences and Arts of Southern Switzerland (SUPSI) from Switzerland to cover the Swiss part of the catchment, with its proprietary hydro-meteorological real-time monitoring network. The quality of the stage-discharge curves was also improved by adopting ADCP (Acoustic Doppler Current Profiler) technology for the water velocity measures used in calibration.
The enhancements of the DSS also include improvements in the physiographic description of Lake Como catchment using a new digital elevation model, the adoption of a snow accumulation and melting model formulated in terms of snow-water equivalent, and the use of improved quantitative rainfall forecasts ensembles provided by the limited-area model COSMO-LAMI (
www.cosmo-model.org accessed on 20 October 2022;
www.arpae.it accessed on 20 October 2022).
5. Evaluation of System Performances
5.1. Initial Assessment over the Period 1981–1995
Daily inflow to the lake measurements over 35 years (1961–1995) were used to develop the forecasting model based on Nearest Neighbors approach presented above, with up to 10 days forecasting horizon and using an ensemble of 20 nearest neighbors, that were augmented to 50 in the later versions, by assuming a Gaussian forecasting error distribution. Several alternative probability distributions, such as Log-Normal, Gamma and Truncated Normal were also tested, but the most reliable results were always obtained using the Gaussian model.
The first 20 years were used as a priori knowledge, whereas the additional 15 years served as a test set to analyze the quality of the forecasting mechanism.
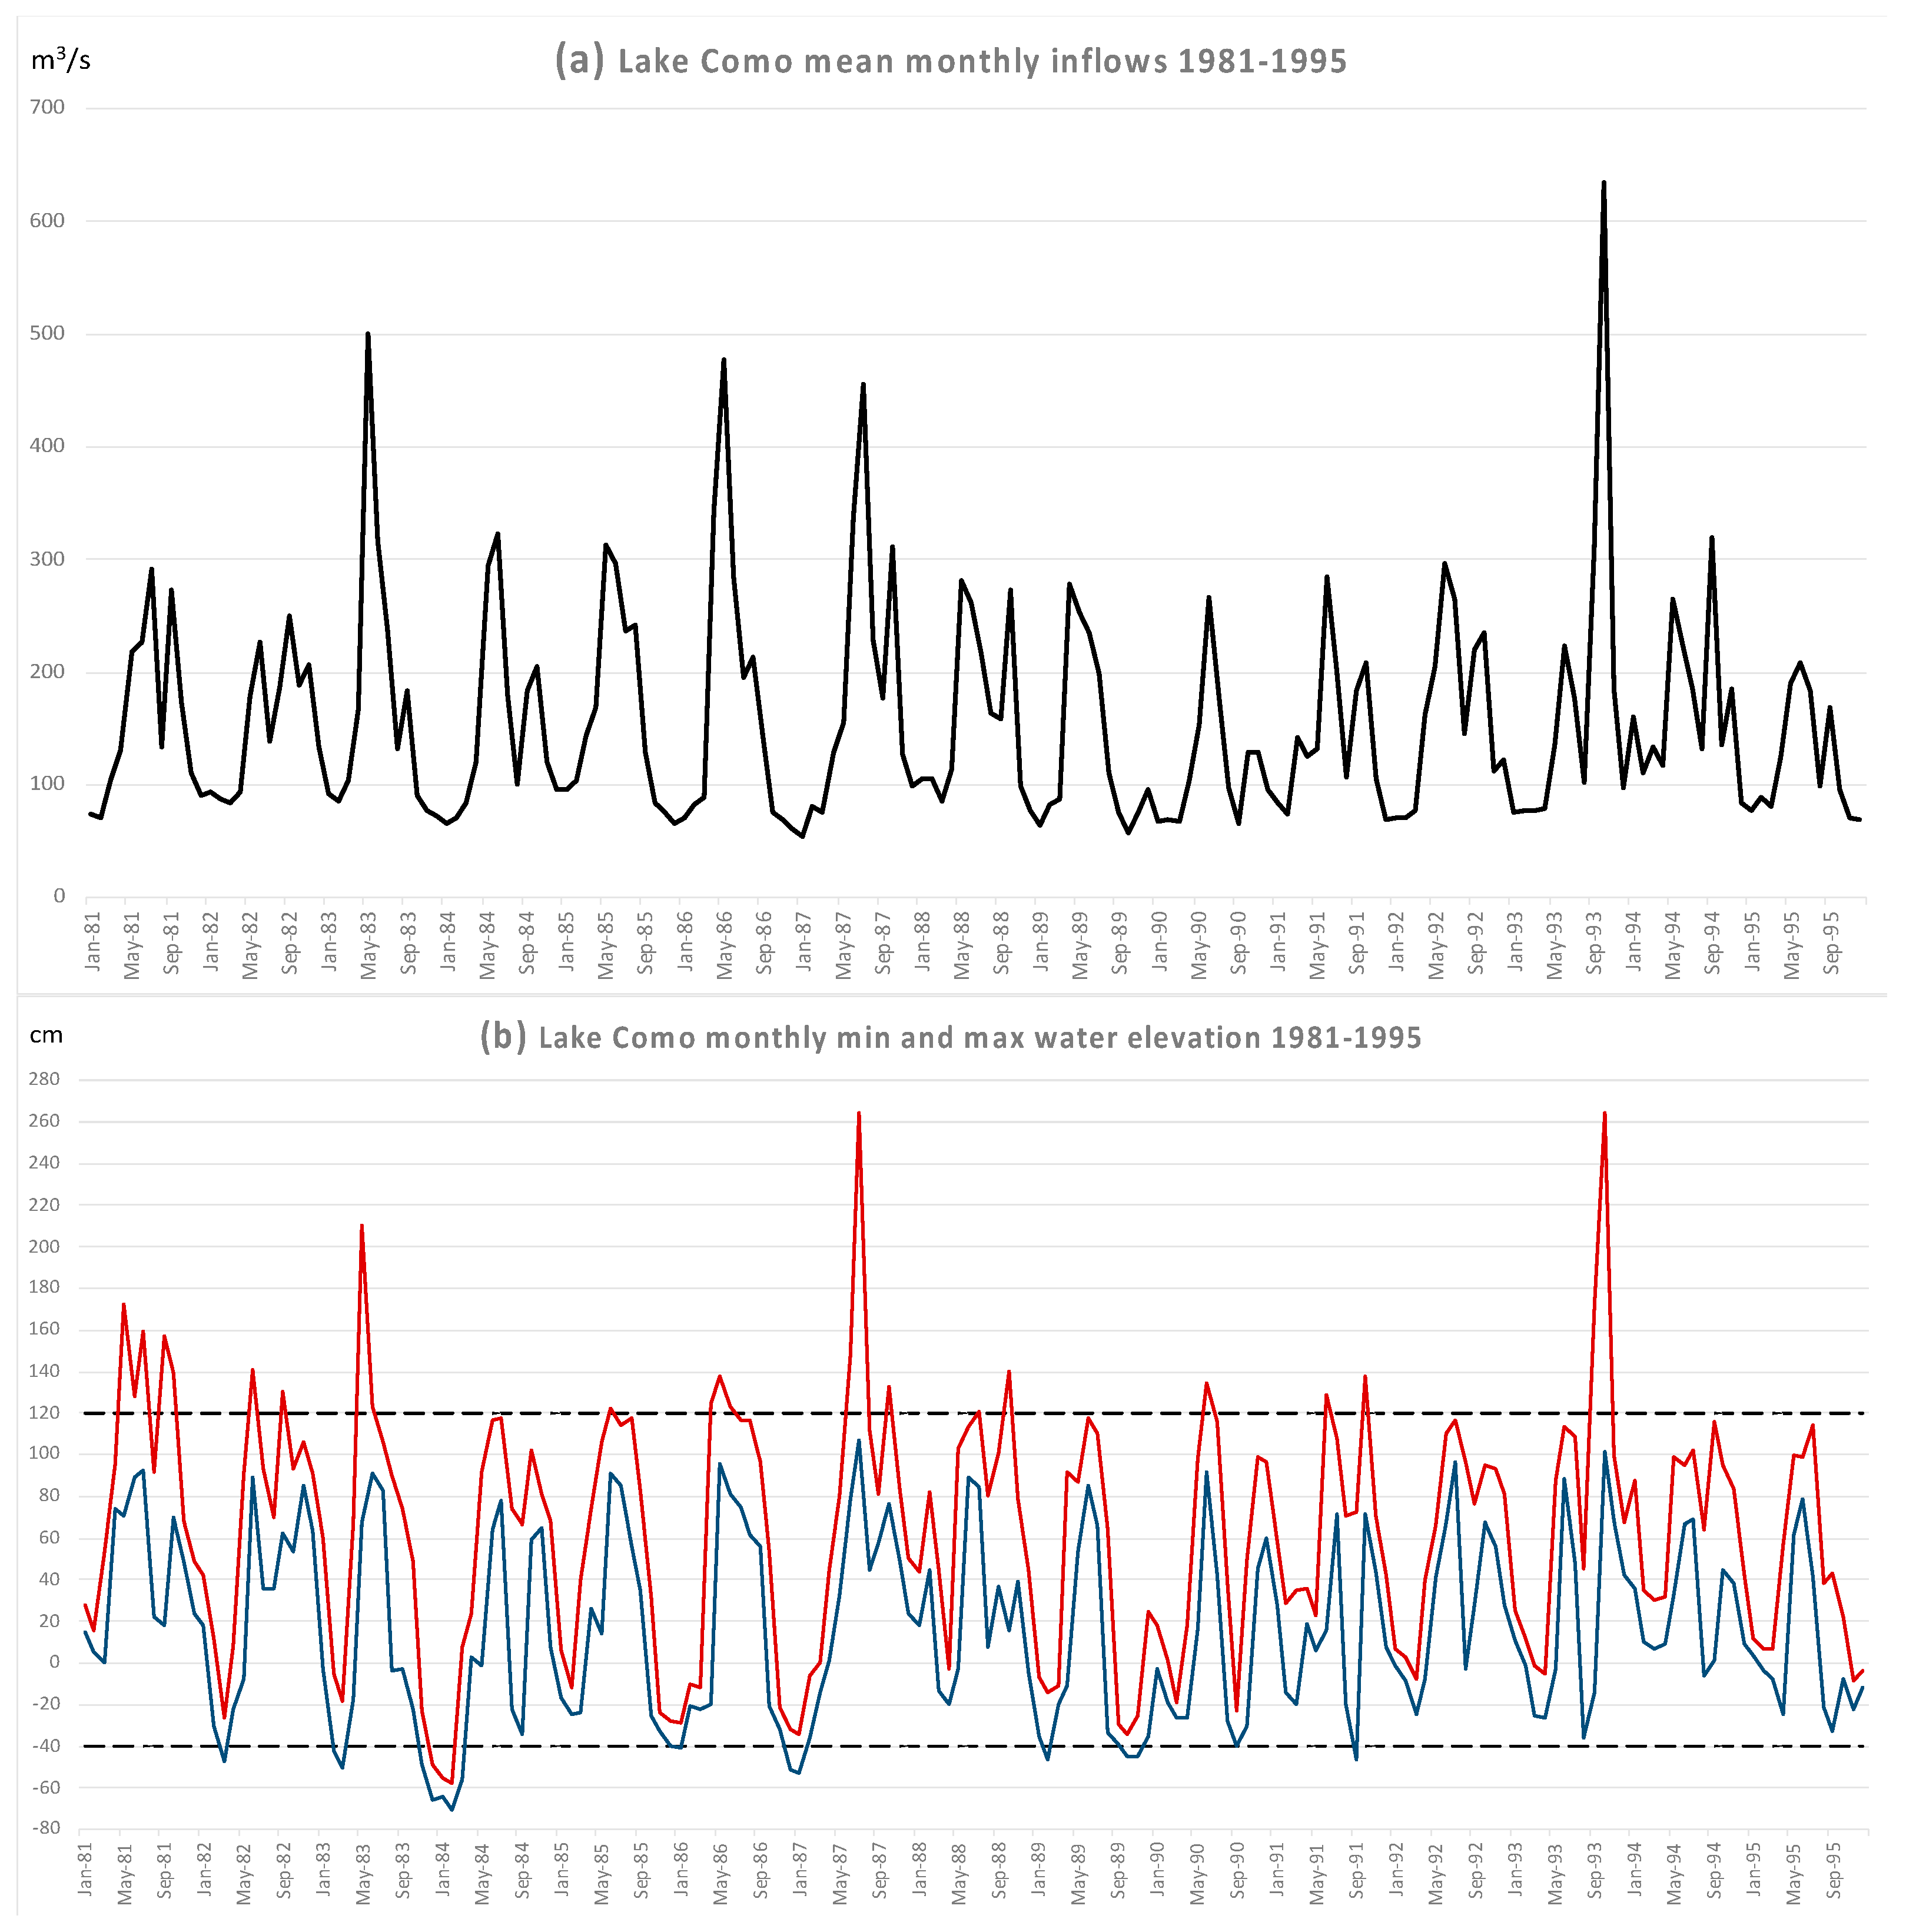
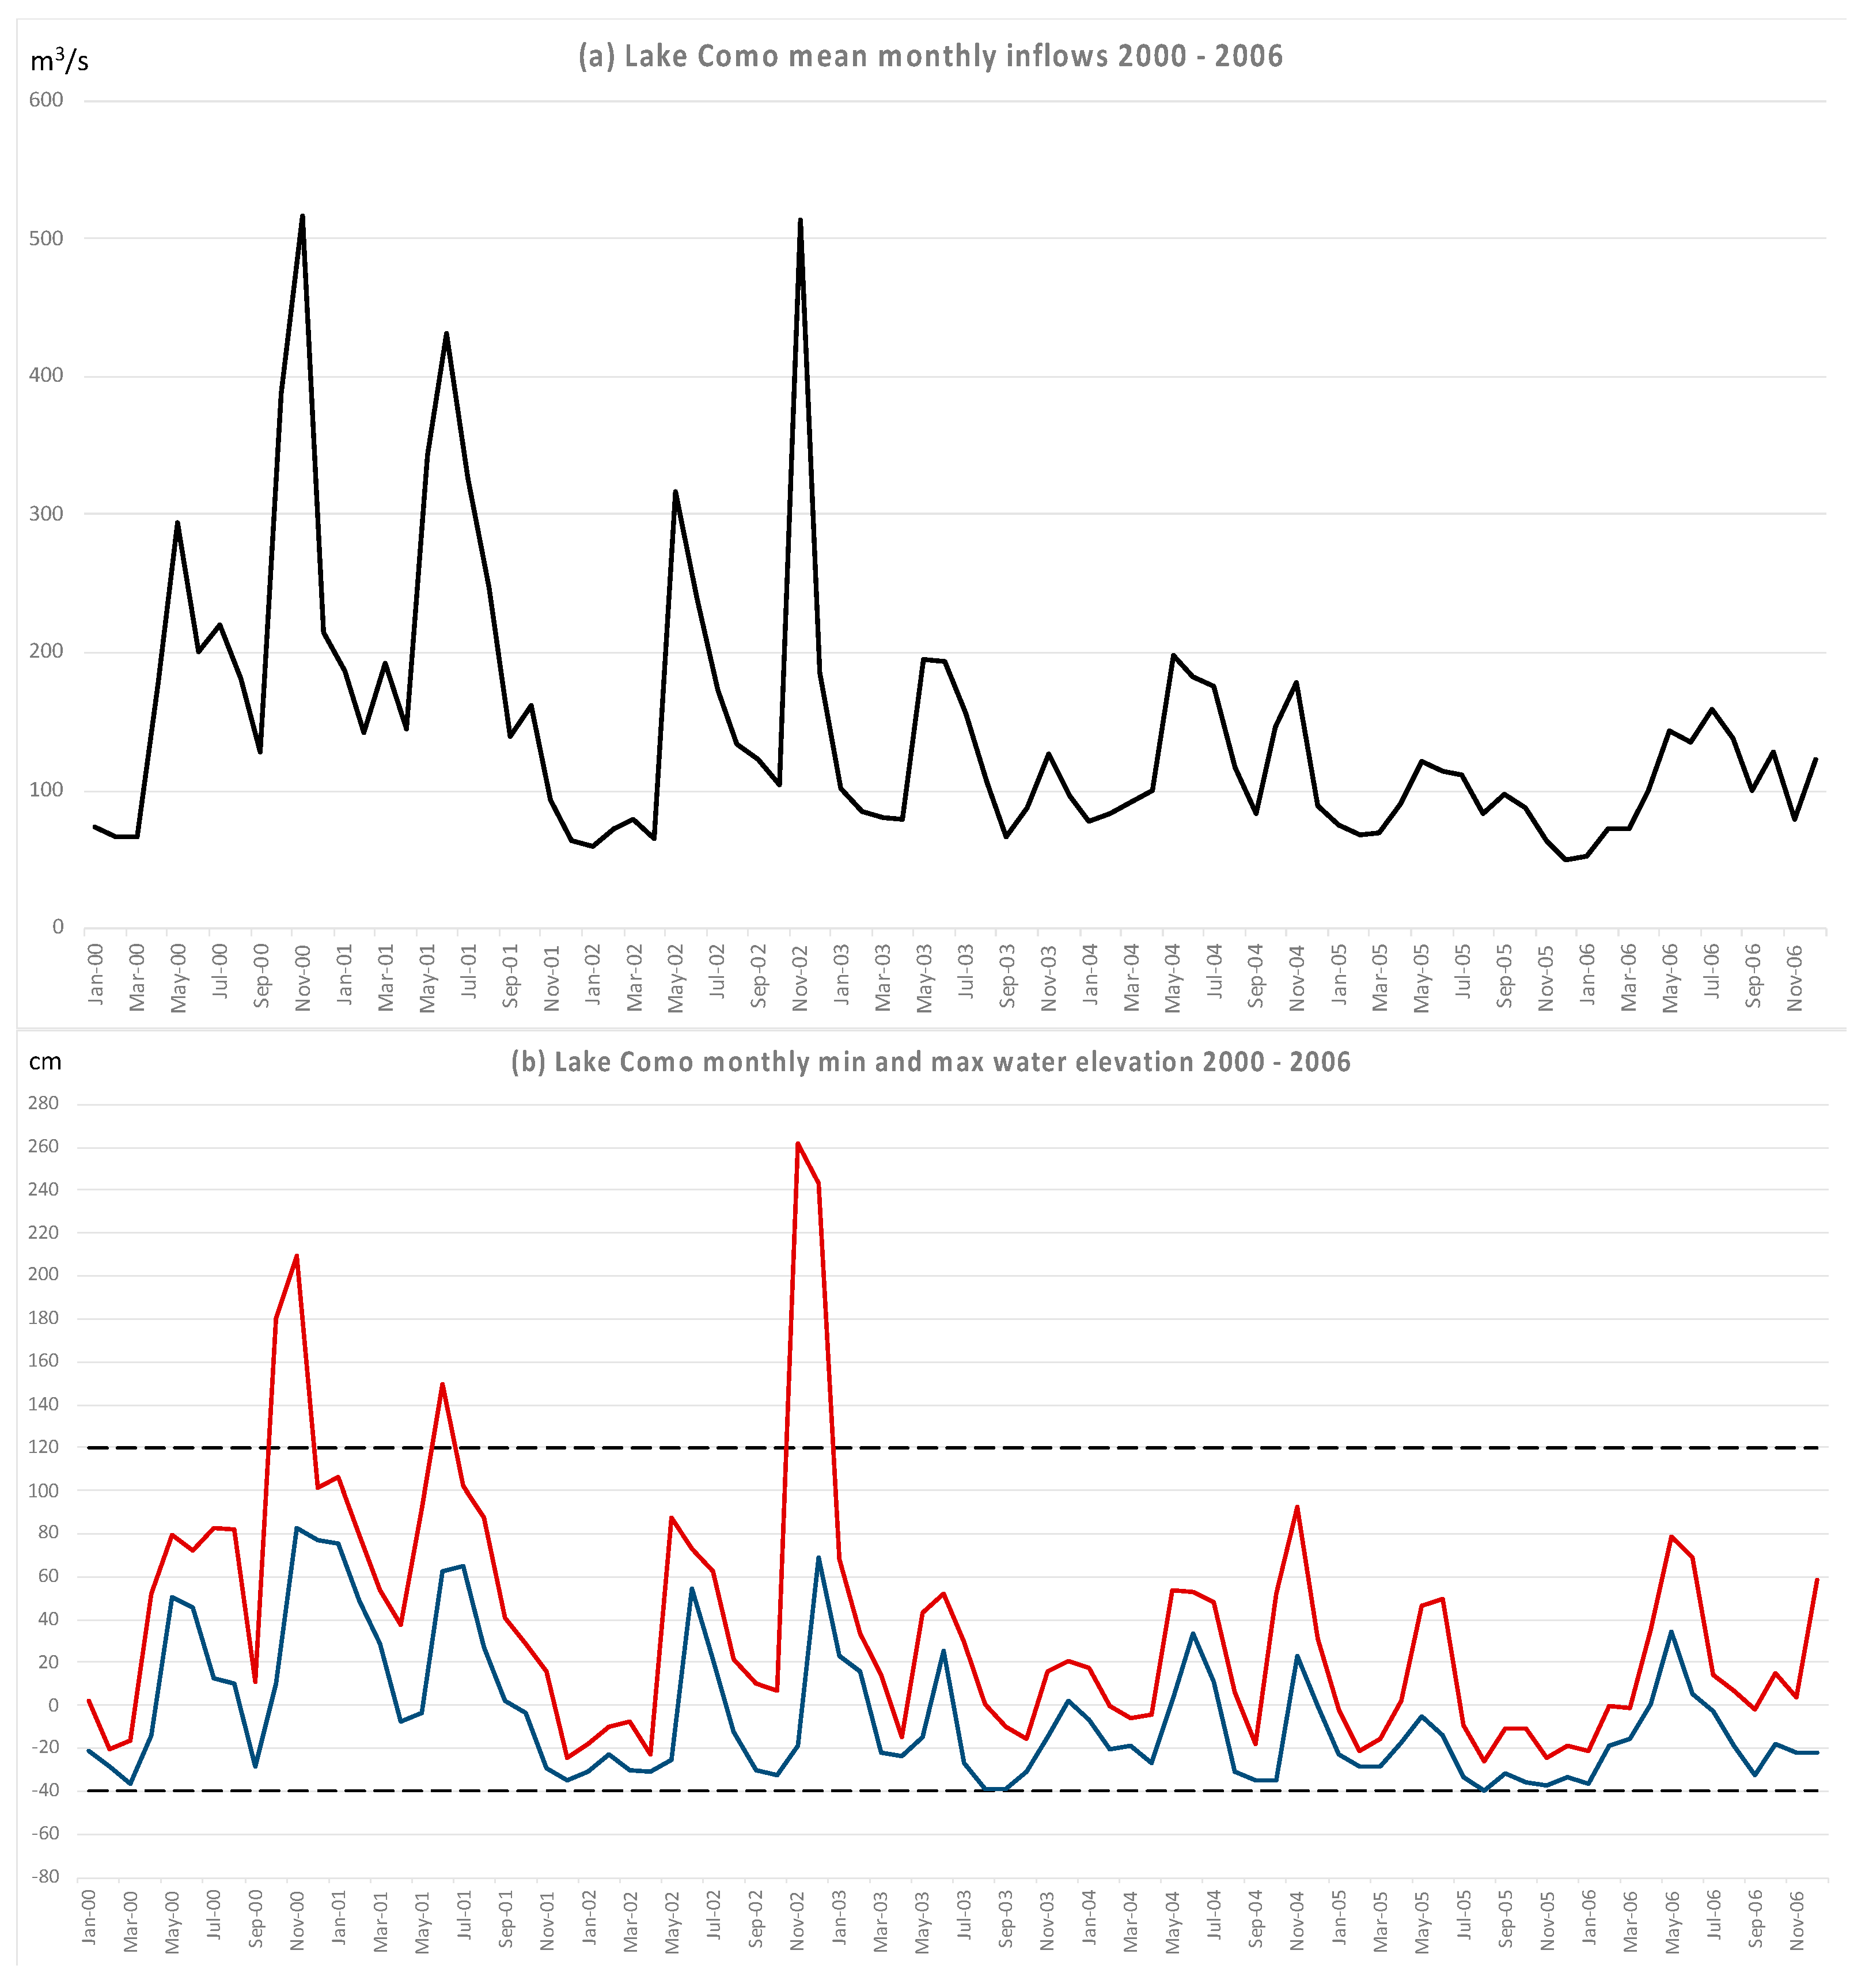
Figure 8 shows the inflows to the lake and the historical behavior of the lake levels. We note the high frequency of small exceedances of the upper threshold of
cm at Malgrate, as well as the number of times the lake was below the
cm threshold.
The system performance was assessed on the basis of a hindcast simulation for the 15-year period from 1 January 1981 to 31 December 1995, with results presented in
Table 1, for the historical operating rule, and the “optimized rule”, with best results highlighted in red. To assess the performance of the DSS using past observations, the “optimized rule” simulation package mimicked the decision maker by using the optimal suggested release whenever feasible, or the closest feasible alternative. When simulating the management based on this optimized rule, the lake hardly falls below the lower acceptable limit of
cm in Malgrate, while historically it fell below several times. In terms of Como flooding, over the 15 years, the lake level was historically recorded to be above the lower flood limit of
cm on 133 days, whereas the optimized rule reduced it to 90 days. A considerable reduction also appears at higher lake levels: at
cm, when the traffic must stop in the main square of Como, the reduction is from 71 to 61 days while on the high floods side, at
cm, no improvement is shown (from 35 to 36 days). At the same time, the irrigation water deficit decreases by an average of more than 110 Mm
3 per year, and by the interesting value of 43 Mm
3 during the irrigation period. This result may be considered exceptional, because meeting irrigation demand implies keeping lake levels higher which is conflicting with the need for reducing the frequency of flooding occurrence.
5.2. Later Assessment of Performances 10 Years Later over the Period 2000–2006
After 10 years of operation and a long succession of dry years (2003–2006), a new hindcast simulation was performed in 2007, revealing (
Table 2) a very high degree of consistency and closeness between what was predicted by the simulation system (predicted) and what the reservoir manager achieved, having been supported by the optimized rule (occurred). Although very close to the predicted ones, the operational performances were even better with only the mean annual deficit being marginally worse than expected (best figures in red in
Table 2). This is because the operational manager was able to assimilate additional external information in his decisions, such as satellite images information and meteorological forecasts, which were made available in the meantime, together with his optimistic or pessimistic view, as already explained in
Section 4.3.
It is also interesting to notice the evolution of the lake water levels.
Figure 9 shows that, even in the case of a sequence of dry years, such as the period between 2003 and 2006, the lake level never fell below the lower environmental limit of
cm at Malgrate, while the two exceedances of the upper
cm flooding limit appearing in the record could not be avoided due to the large incoming flood volumes. Nonetheless, the optimized rule still allowed the frequency of the smaller flood events to be reduced.
5.3. System Performances in More Recent Years (2007–2021)
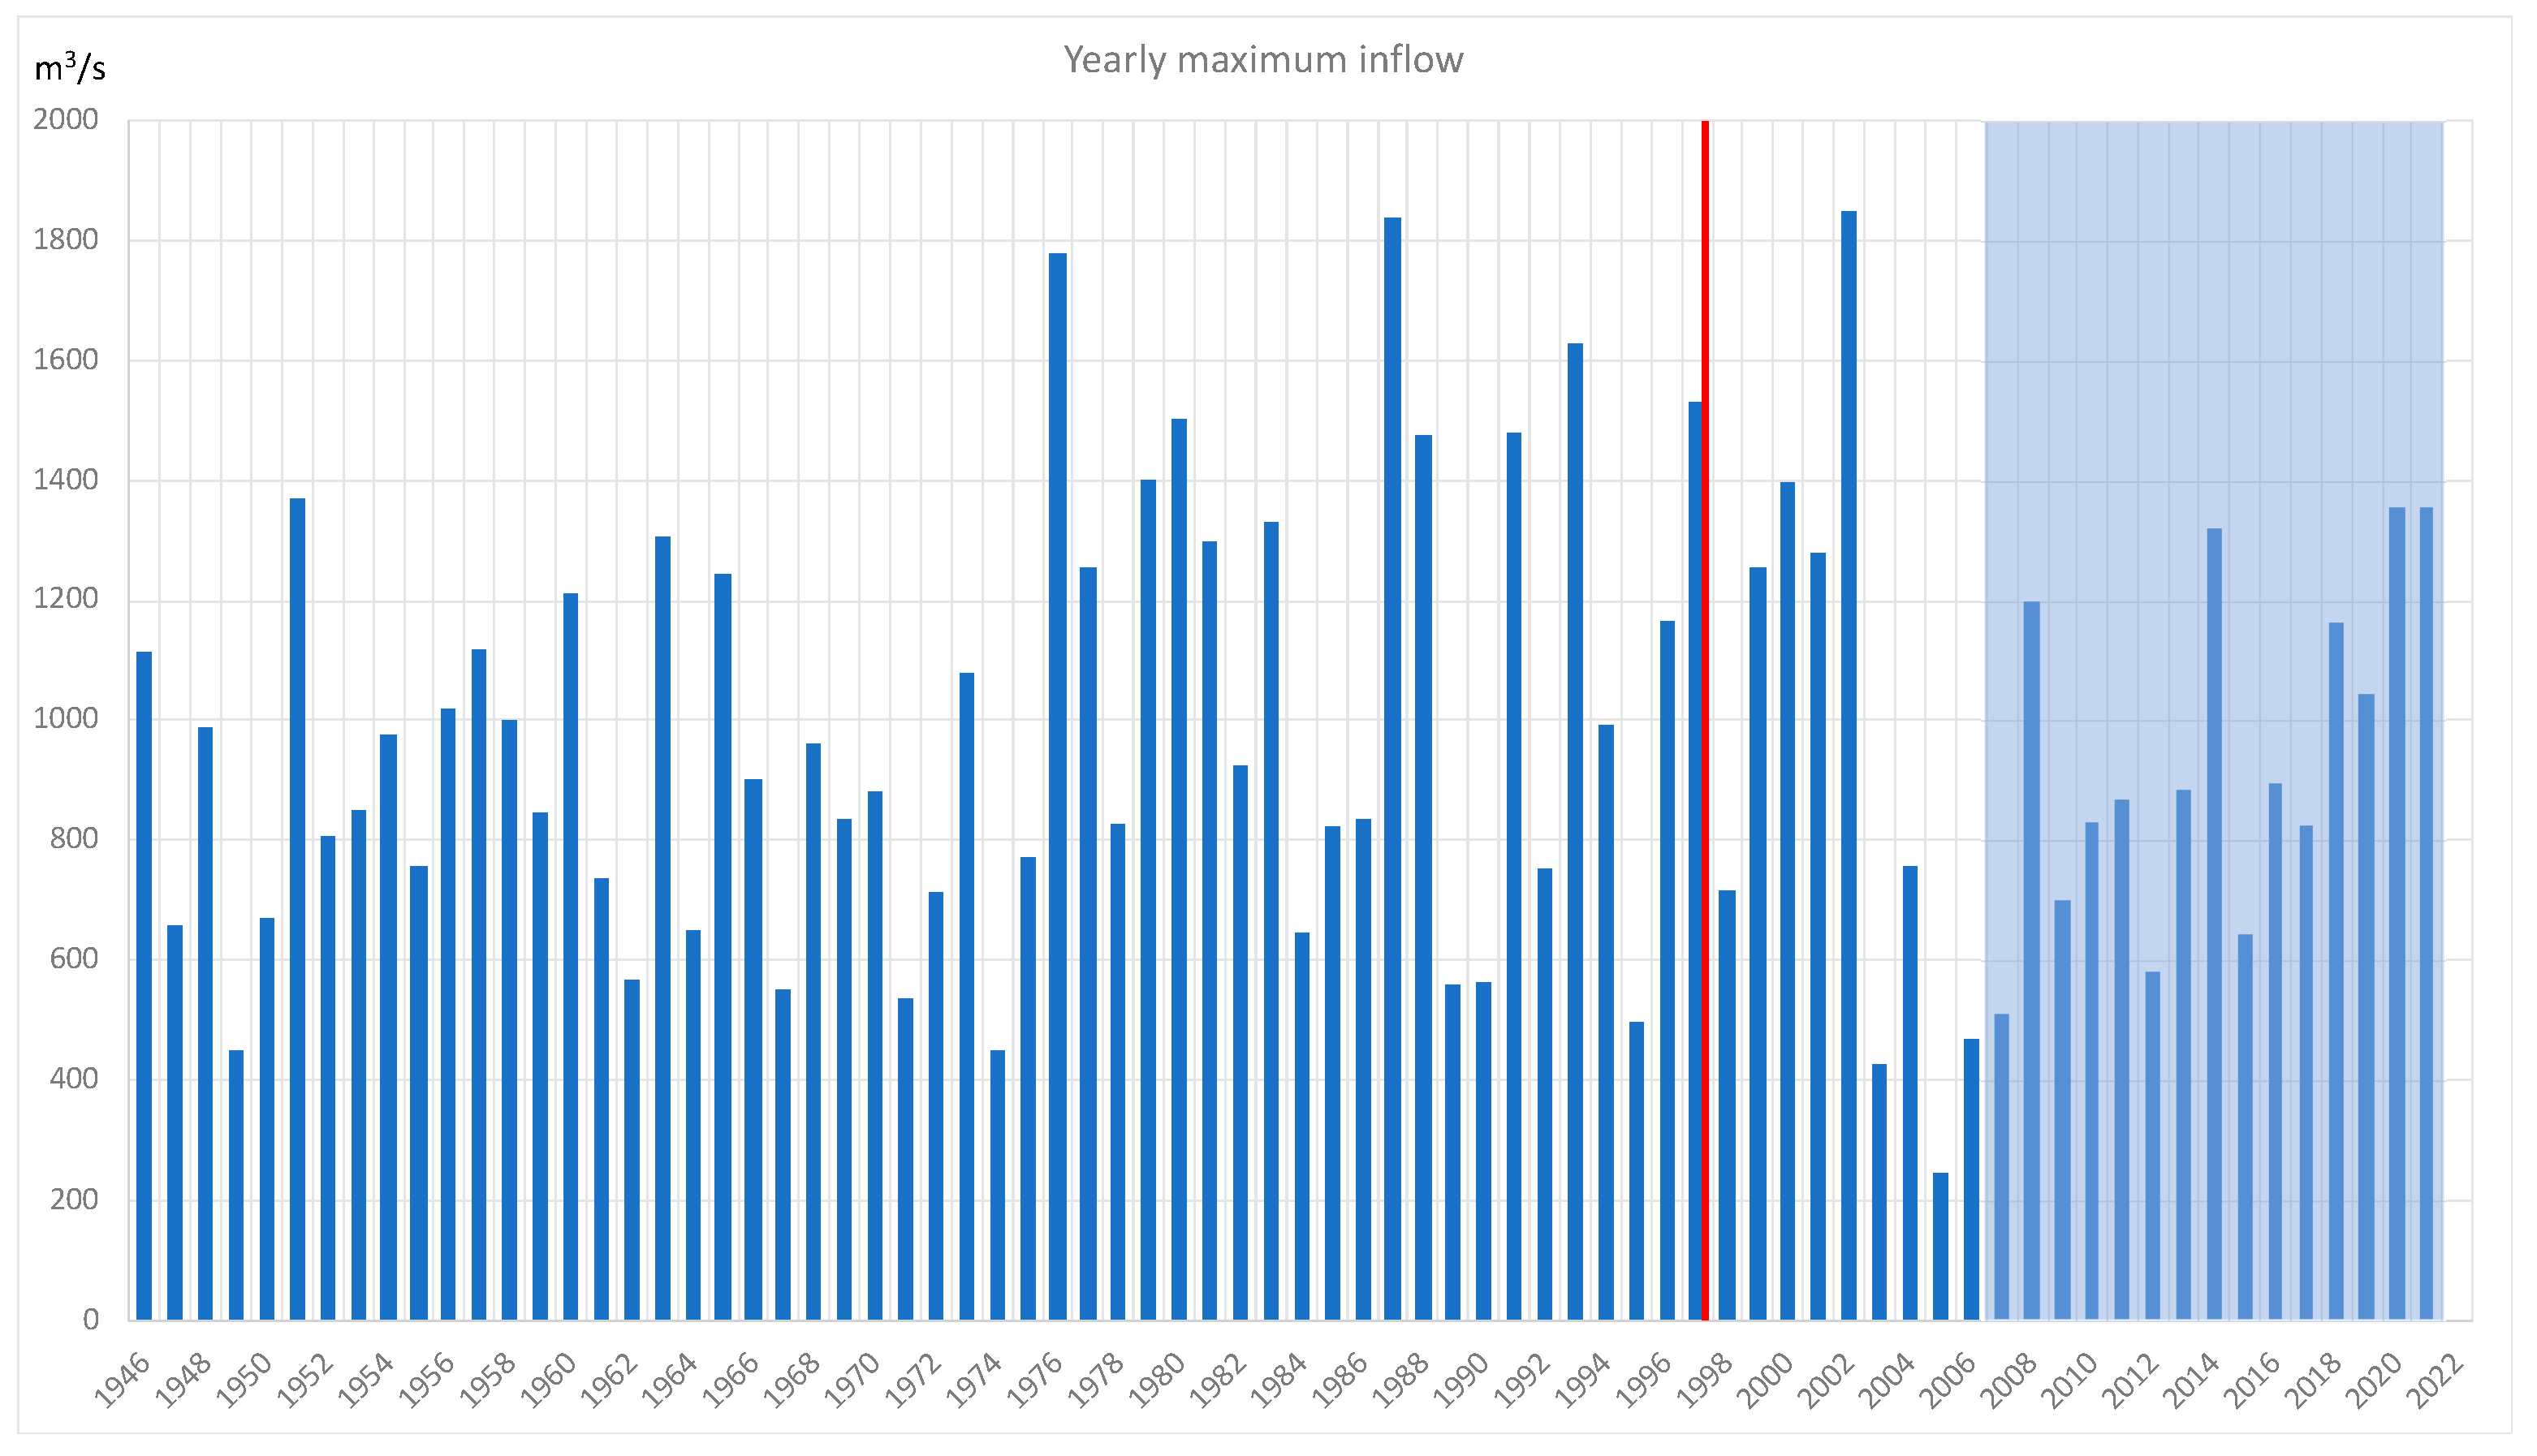
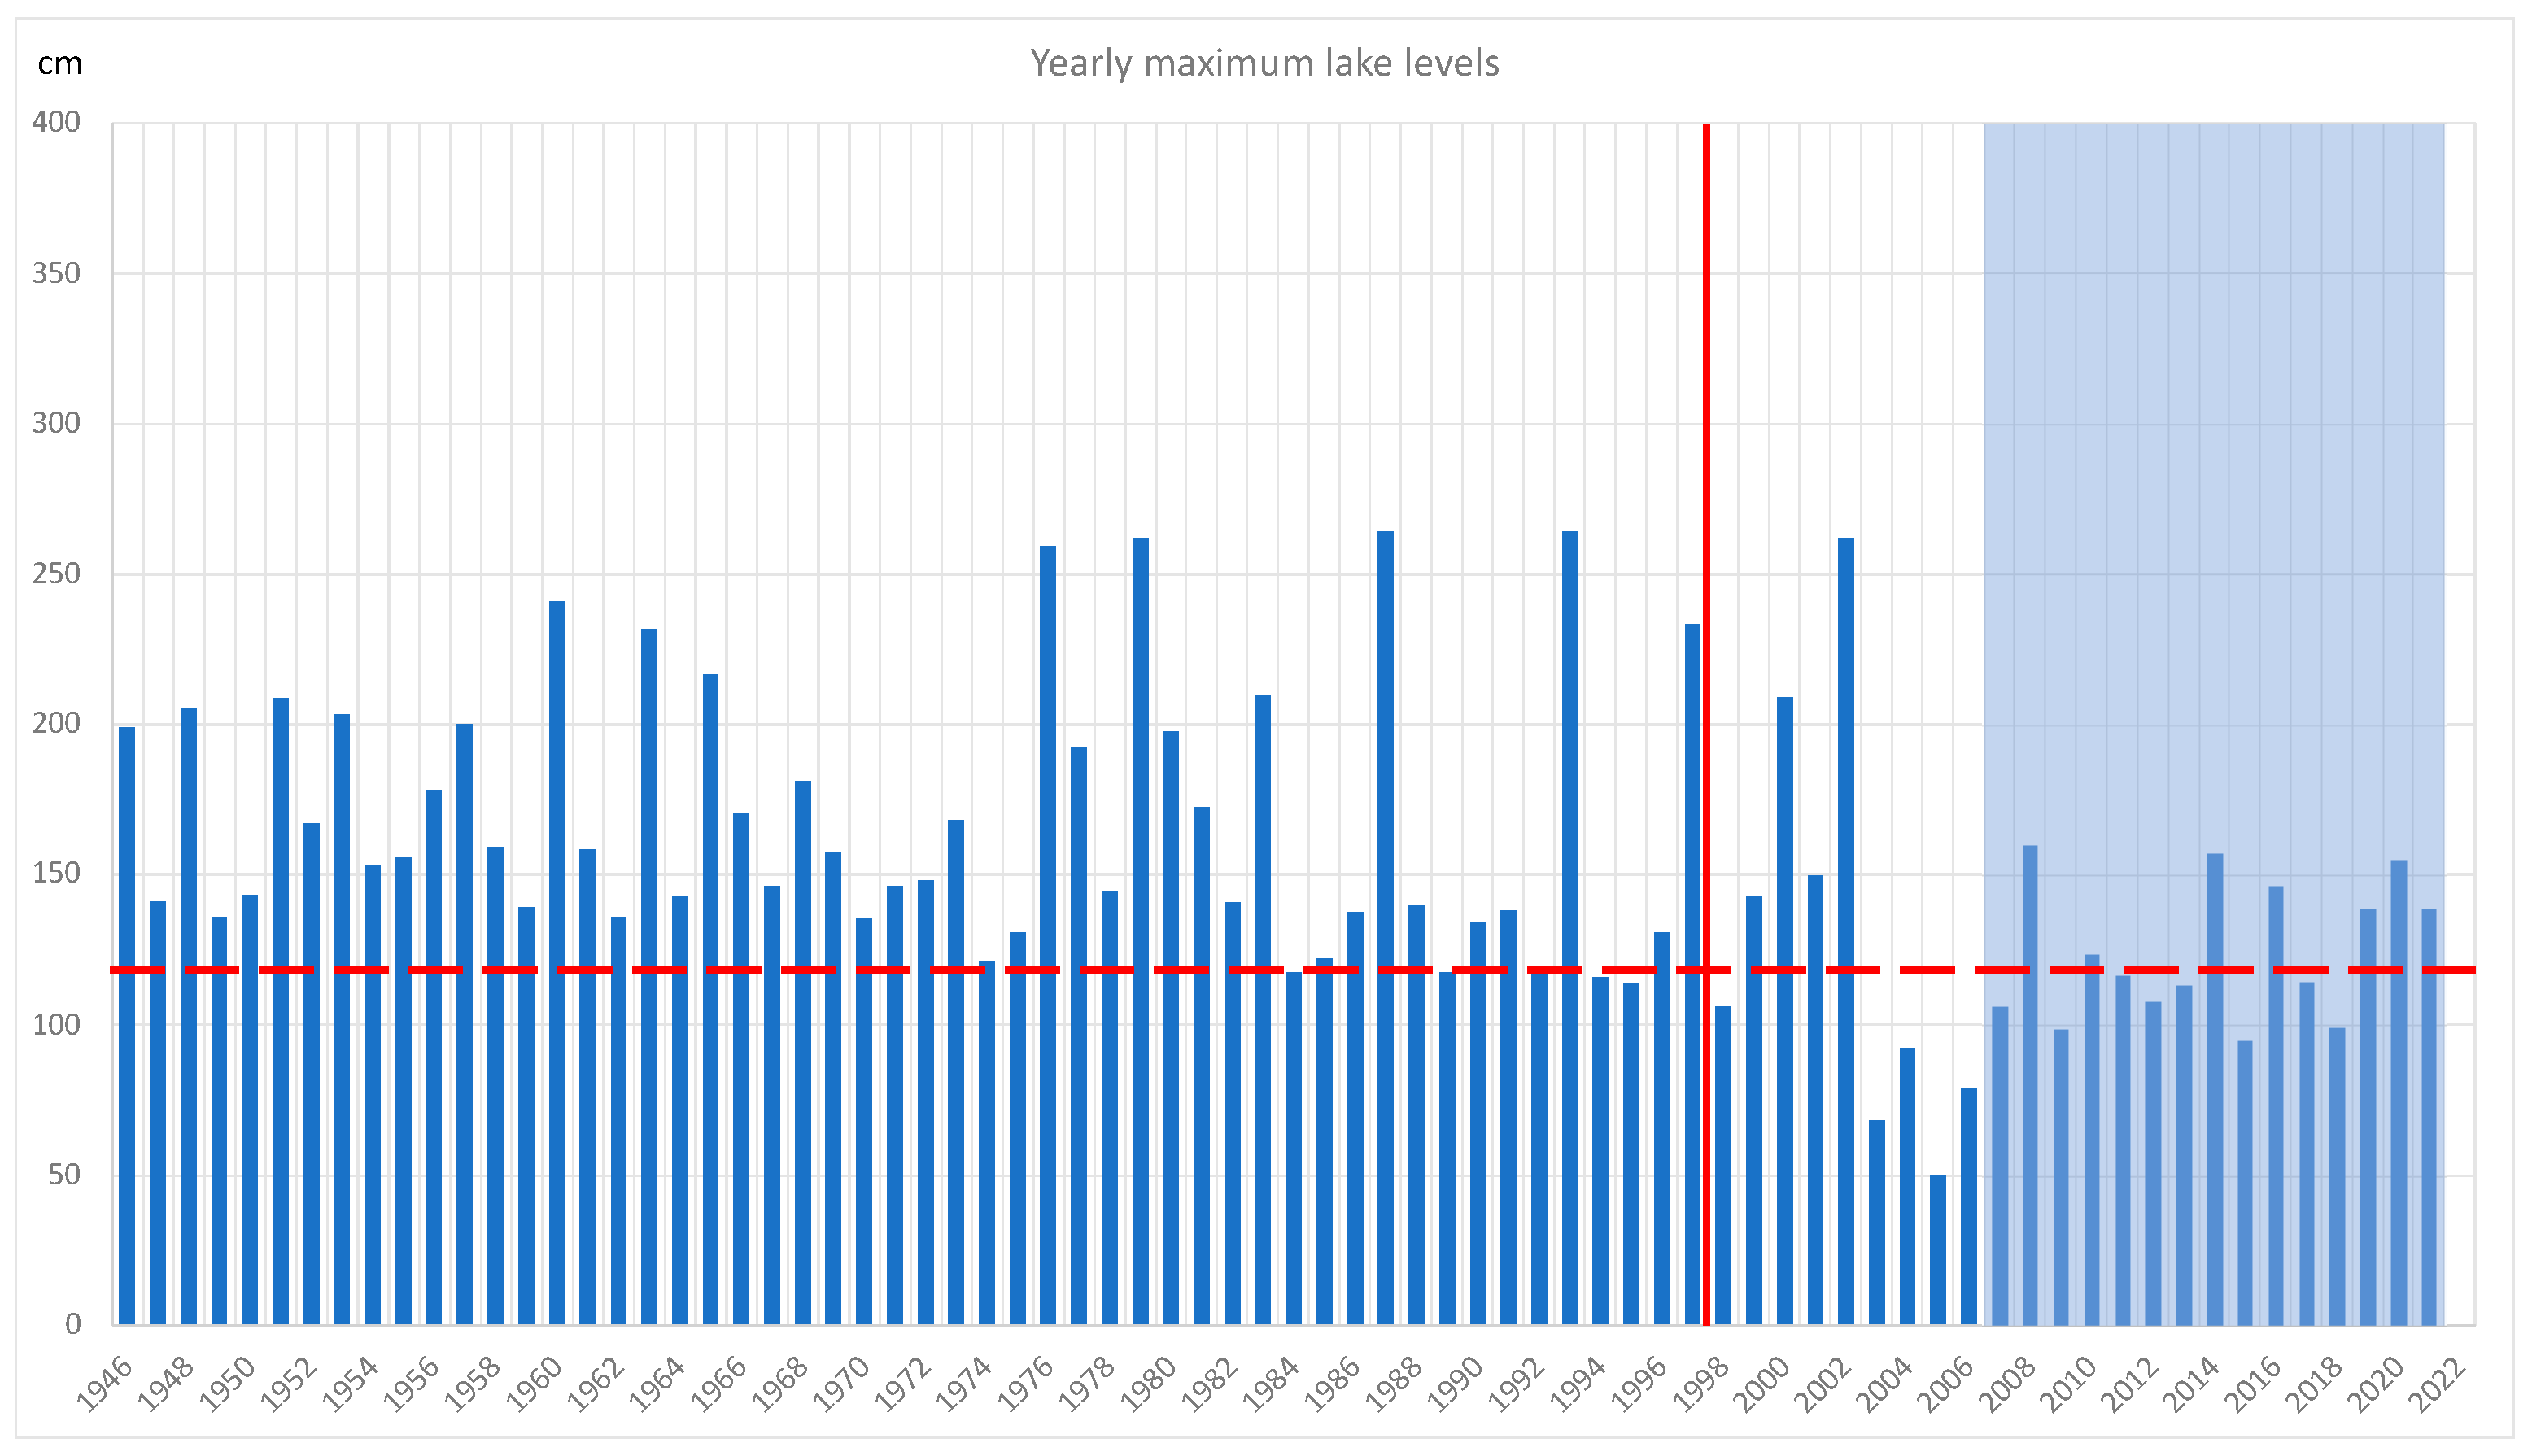
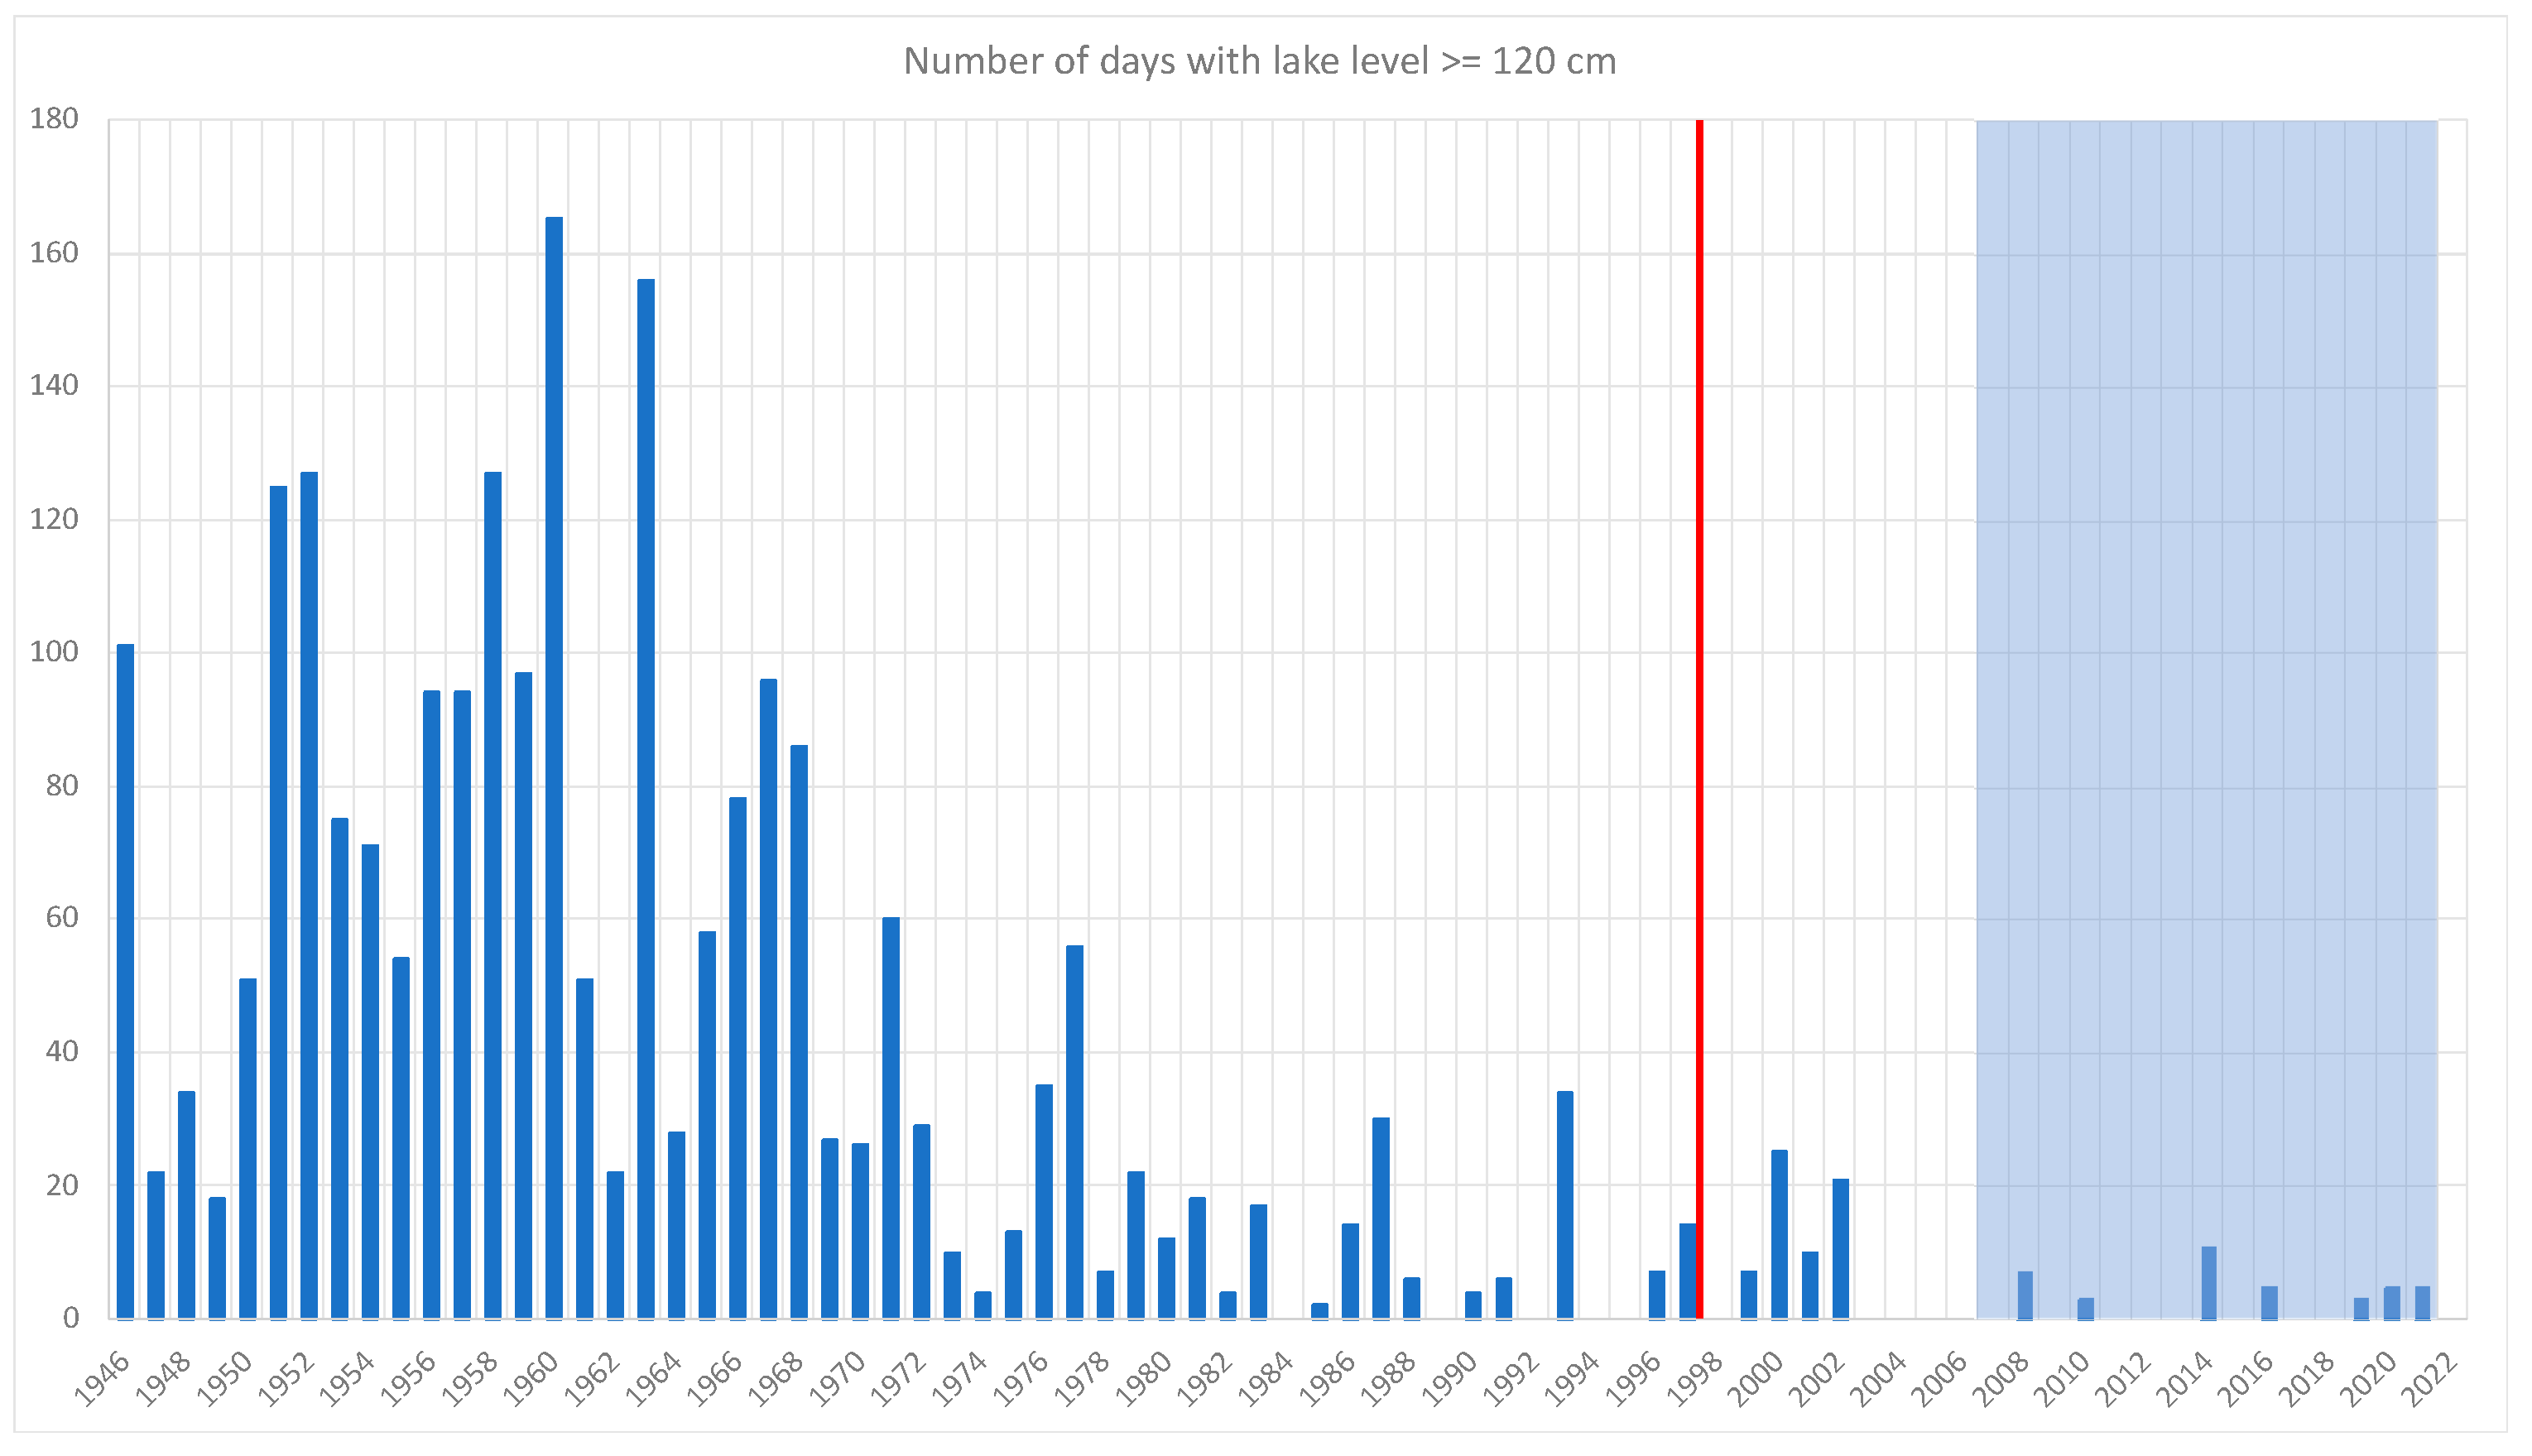
It may be interesting to analyze the performance of the system after a further 15 years of operation from the last assessment (2000–2006) with the aim of verifying if the DSS is still a useful tool for Lake Como management. As no additional simulation assessment had been performed since 2006, information on the amounts of water used for irrigation is not available. Nonetheless, it is still possible to qualitatively analyze the DSS performances in terms of flood risk reduction by comparing the maximum inflows to the lake during the recent years (
Figure 10) to the maximum water levels reached in Lake Como (
Figure 11) and the number of days the lake level exceeded the flooding threshold level of
cm at Malgrate (
Figure 12). In
Figure 10,
Figure 11 and
Figure 12 a light blue mask highlights the considered period (2007–2021). It can be clearly seen that while the incoming maximum inflows in recent years were on the higher side, both the maximum lake levels reached (
Figure 11) and the number of days above the threshold (
Figure 12) remained on the lower side. This indicates that the DSS is still performing satisfactorily and, as such, is of great support to the Lake Como decision maker.
6. Assessed Benefits and Concluding Remarks
After verifying the correctness of the decisions suggested by the DSS, the management of the Adda Consortium kept the system active and continued to implement updates (e.g., a rainfall-runoff model). The use of the updated DSS for a long period of time increased the confidence of the decision-maker in the simulated dynamics of the upstream catchment, thus enabling water managers to take better decisions on releases.
In the 25 years in which the DSS has been active, besides the day-to-day management of the lake, the results of the DSS were useful in justifying and demonstrating the timeliness of interventions in the event of the most important floods. For example, during several events, the local police called the Consorzio dell’Adda and forced them to fully open the gates to avoid flooding due to a forecasted incoming flood wave, and the manager was proud to announce that the gates had been already opened several days before.
In the meantime, the Lake Como management reached the conclusion that a scientific back-up is fundamental when taking decisions in a hydrologically complex system. One of the major benefits reported is that, by demonstrating the scientific basis of its decisions, this enabled it to face criticisms from other stakeholders with robust foundations and to sustain its decisions during public debates without exterior influence (frequently motivated by sensationalist mass media on purely polemic grounds).
The operational DSS, recalibrated and updated over the years, made it possible to disprove erroneous conclusions that considered only single-party interests, by neglecting the overall hydrological complexity as in the case of the hatching of fish eggs, difficulties of mooring recreational boats, bathing, etc., due to fluctuating lake levels, as reported by several stakeholders and incorrectly attributed to the management practices adopted by Consorzio dell’Adda.
The Lake Como case shows how a strict cooperation between decision-makers involved in operational water management and scientists can lead to a better choice of both the modelling and calibration approaches, when developing new models and management tools. The detailed knowledge of underlying management problems, acquired by the Consorzio dell’Adda due to its long-term experience in managing the lake, allowed scientists to set the scene clearly, by understanding all the facets of the decision-making process, prior to formulating them in mathematical terms and incorporating them into a decision support system. This allowed for a better choice of the scientific approach to be used, an improved calibration of the model, and finally resulted in a more robust DSS which produced reliable management decisions.
Moreover, the case highlights that, if appropriately briefed and involved, the end-users of tools and a DSS will quickly become aware of the benefits arising from the use of predictive uncertainty, provided they are not requested to interpret forecasting uncertainty in statistical terms or to perform the complex stochastic analyses and optimization, as frequently required in problems of this type. Nonetheless, by raising water managers’ awareness and understanding of the approaches used, this makes them more responsive to improving existing tools or to adopting new ones, leading to towards more reliable forecasts and decisions.
In summary, although the Lake Como case can be considered a success, considerable efforts are still required to make end-users aware of the improvements obtainable without exposing them to the computational complexity. In addition to involving decision makers in the development of the strategy and of the DSS itself, one of the most important recipes for a successful cooperation is to demonstrate, for instance through hindcast simulations that, regardless of the methodological complexity, which remains hidden from the user, the benefits will by far outperform those they could achieve previously.


