Article

Importance of Detailed Soil Information for Hydrological Modelling in an Urbanized Environment

1
Department of Soil, Crop and Climate Sciences, University of the Free State, Bloemfontein 9300, South Africa
2
Unit for Environmental Sciences and Management, North-West University, Potchefstroom 2520, South Africa
3
Institute of Soil Science and Site Ecology, Technische Universität Dresden, Pienner Str. 19, 01737 Tharandt, Germany
*
Author to whom correspondence should be addressed.
Hydrology 2020, 7(2), 34; https://doi.org/10.3390/hydrology7020034
Submission received: 6 May 2020 / Revised: 30 May 2020 / Accepted: 3 June 2020 / Published: 13 June 2020

Abstract

:
Soil information is critical in watershed-scale hydrological modelling; however, it is still debated which level of complexity the soil data should contain. In the present study, we have compared the effect of two levels of soil data on the hydrologic simulation of a mesoscale, urbanised watershed (630 km2) in central South Africa. The first level of soil data, land type (LT) data, is currently the best, readily available soil information that covers the whole of South Africa. In the LT database, the entire study area is covered by only two soil types. The second level of soil data (DSM) was created by means of digital soil mapping based on hydropedological principles. It resulted in six different soil types with different hydrological behaviour (e.g., interflow, recharge, responsive). The two levels of soil data were each included in the revised version of the Soil and Water Assessment Tool (SWAT+). To compare the effects of different complexity of soil information on the simulated water balance, the outputs of the uncalibrated models were compared to the three nested gauging stations of the watershed. For the LT scenario, the simulation efficiencies calculated with the Kling–Gupta efficiency (KGE) for the three nested gauging stations (640 km2, 550 km2, 54 km2) of 0, 0.33 and −0.23 were achieved, respectively. Under the DSM scenario, KGE increased to 0.28, 0.44 and 0.43 indicating an immediate improvement of the simulation by integrating soil data with detailed information on hydrological behaviour. In the LT scenario, actual evapotranspiration (aET) was clearly underestimated compared to MODIS-derived aET, while surface runoff was overestimated. The DSM scenario resulted in higher simulated aET compared to LT and lower surface runoff. The higher simulation efficiency of DSM in the smaller headwater catchments can be attributed to the inclusion of the interflow soil type, which covers the governing runoff generation process better than the LT scenario. Our results indicate that simulations benefit from more detailed soil information, especially in smaller areas where fewer runoff generation processes dominate.

1. Introduction

Soil is a dominant factor in controlling hydrological flowpaths through partitioning precipitation into different components of the water balance. This is due to the ability of soil to store and transmit water [1]. Soil information is therefore an important input into physically based hydrological models [2,3], but soil information is often not readily available in appropriate format for modellers to use [4]. Reasons for this are, firstly, that existing soil maps were not primarily produced with hydrological modelling purposes in mind [5], and, secondly, the costs and time involved in measuring important soil hydraulic properties (e.g., water retention characteristics and conductivity) and representing these properties spatially. The result is that the level of spatial detail of soil inputs is seldom comparable with other spatial inputs, such as remote-sensed land use and topography. Consequently, the models rely strongly on calibration against measured data, to optimise simulations and account for the lack of adequate representation of the heterogeneous landscape [6,7,8]. These models tend to be over-parameterised, with many combinations of the model structure or parameters leading to the same final result (i.e., equifinality [9,10]). This leads to uncertainty about whether the models are representing the hydrological processes dominating in a particular area. Often these models then ‘work’ in the specific area where they were calibrated, but for the wrong process reasons [11]. This limits their value to predicting the impact of climate and land-use change, as well as their extrapolation value to ‘ungauged’ areas.
The advances in digital soil mapping (DSM; [12]) have paved the way for providing detailed soil information in an adequate scale and format for hydrological modelling studies (e.g., [7,13,14,15,16,17]). But does this enhanced soil information translate into more efficient modelling? Several studies found that there is improved accuracy in modelling results when compared to measured streamflow or at least reduced parameter uncertainty during calibration [14,16,18,19,20]. For example, the inclusion of more detailed soil descriptions and representation in the Agriculture Catchments Research Unit (ACRU) model led to an increase in Nash–Sutcliffe efficiency (NSE) of between 9% and 52% in semi-arid catchments in South Africa [14]. DSM using the Soil Land Inference Model (SoLIM) yielded a more detailed soil map for a data-scarce area in Portugal [16]. When this map was used to parameterise the Soil and Water Assessment Tool (SWAT) model, it resulted in an increase in NSE of around 7% compared to legacy soil data. Romanowicz et al. [18], evaluated the contribution of ‘generic’ (1:500,000 scale) and ‘detailed’ (1:25,000 scale) soil maps to streamflow prediction accuracies. Using several model setups in SWAT, the detailed soil information outperformed the course soil information in predicting streamflow accurately. The sensitivity of the SWAT model to soil information, and contribution of detailed soil distribution to streamflow predictions, was further demonstrated in the improved simulation efficiency when detailed Soil and Terrain (SOTER) data was used instead of coarse SOTER data, in Benin [19]. Others maintain that the small improvements in modelling accuracy do not necessarily justify the cost and time to gather improved soil information [21]. In general, these studies agree that the physical-based distributed models on which the different levels of soil information were tested are very sensitive to the soil data. Most of these studies also relied on calibration of the models, and they focus therefore on the optimisation of the model using different levels of soil information.
In this study, the objective was to evaluate the impact of different levels of soil information on model performance. The hypothesis was that improved soil information, developed through DSM, will reflect hydrological processes more accurately, and this will translate into improved simulation efficiency. The focus was on the direct contribution of improved soil information to modelling efficiency and we did not try to optimize the model through extensive calibration, essentially treating the catchment as ungauged. We further explored the changes in simulated processes resulting from the different soil information sets and the impact thereof on water resource management.

2. Materials and Methods

2.1. Study Area

The study area is approximately 630 km2 and lies between Johannesburg (largest city in South Africa) and the capital city, Pretoria (Figure 1). The area lies in the Gauteng Province, which hosts a quarter of the country’s population (59 million) and is responsible for generating the majority of the gross domestic product. Due to the economic importance of the area, it is subjected to significant development pressure resulting from urbanisation.
The Jukskei River drains the catchment in a northerly direction. The geology of the study site is granite and gneiss of the Lanseria Gneiss of the Johannesburg Dome Granite [20,22] with Leptosols, Plinthosols, Cambisols, Stagnosols and Fluvisols being the dominant reference groups found [23]. The vegetation type is Egoli Granite Grassland, forming part of the Mesic Highveld Grassland Bioregion [24]. More than two-thirds of this vegetation unit has been transformed by urbanisation. The catchment lies between 1245 and 1709 m.a.s.l., on the Highveld of South Africa. The terrain is hilly, with the majority of hillslopes having an average slope of less than 5%. The climate is marked by convectional thunderstorms during summer months (October to April), with an average annual rainfall of around 700 mm. Days are hot during summer (average maximum temperature of around 25 °C) with cold nights during winter (average minimum temperature of approximately 4 °C).

2.2. The SWAT+ Model, Model Inputs and Setup

The hydrological model SWAT+ (v 1.2.3) was used for the modelling with QSWAT+ (v. 1.2.2) to set up the watershed. SWAT+ is a revised version of the well-known Soil and Water Assessment Tool (SWAT; [25]). SWAT is a process-based semi-distributed catchment scale model which is widely used to simulate water quality and quantity to predict and assess the impacts of land use, climate change, soil erosion and pollution. As one of the first steps, the model divides the catchment into hydrological response units (HRUs). An HRU is a homogenous area in terms of soils, land use and slope. The model calculates various components of the water balance, such as overland flow, infiltration, lateral flow, percolation, evapotranspiration and discharge to the stream from each HRU. In addition, the model is capable of simulating crop growth and nutrient/pollution fluxes through the landscape. For a more complete description of the SWAT model see [26], and for changes in the SWAT+ version see [27]. Only a few important inputs and processes in the model are discussed here. The model was run from January 2000 until December 2013. The first three years were used as a warm-up period, followed by 11 years of validation. Since the aim of the study was to evaluate the direct contribution of improved soil information to modelling efficiency, we did not include a calibration period.

2.2.1. Topography and Land Use

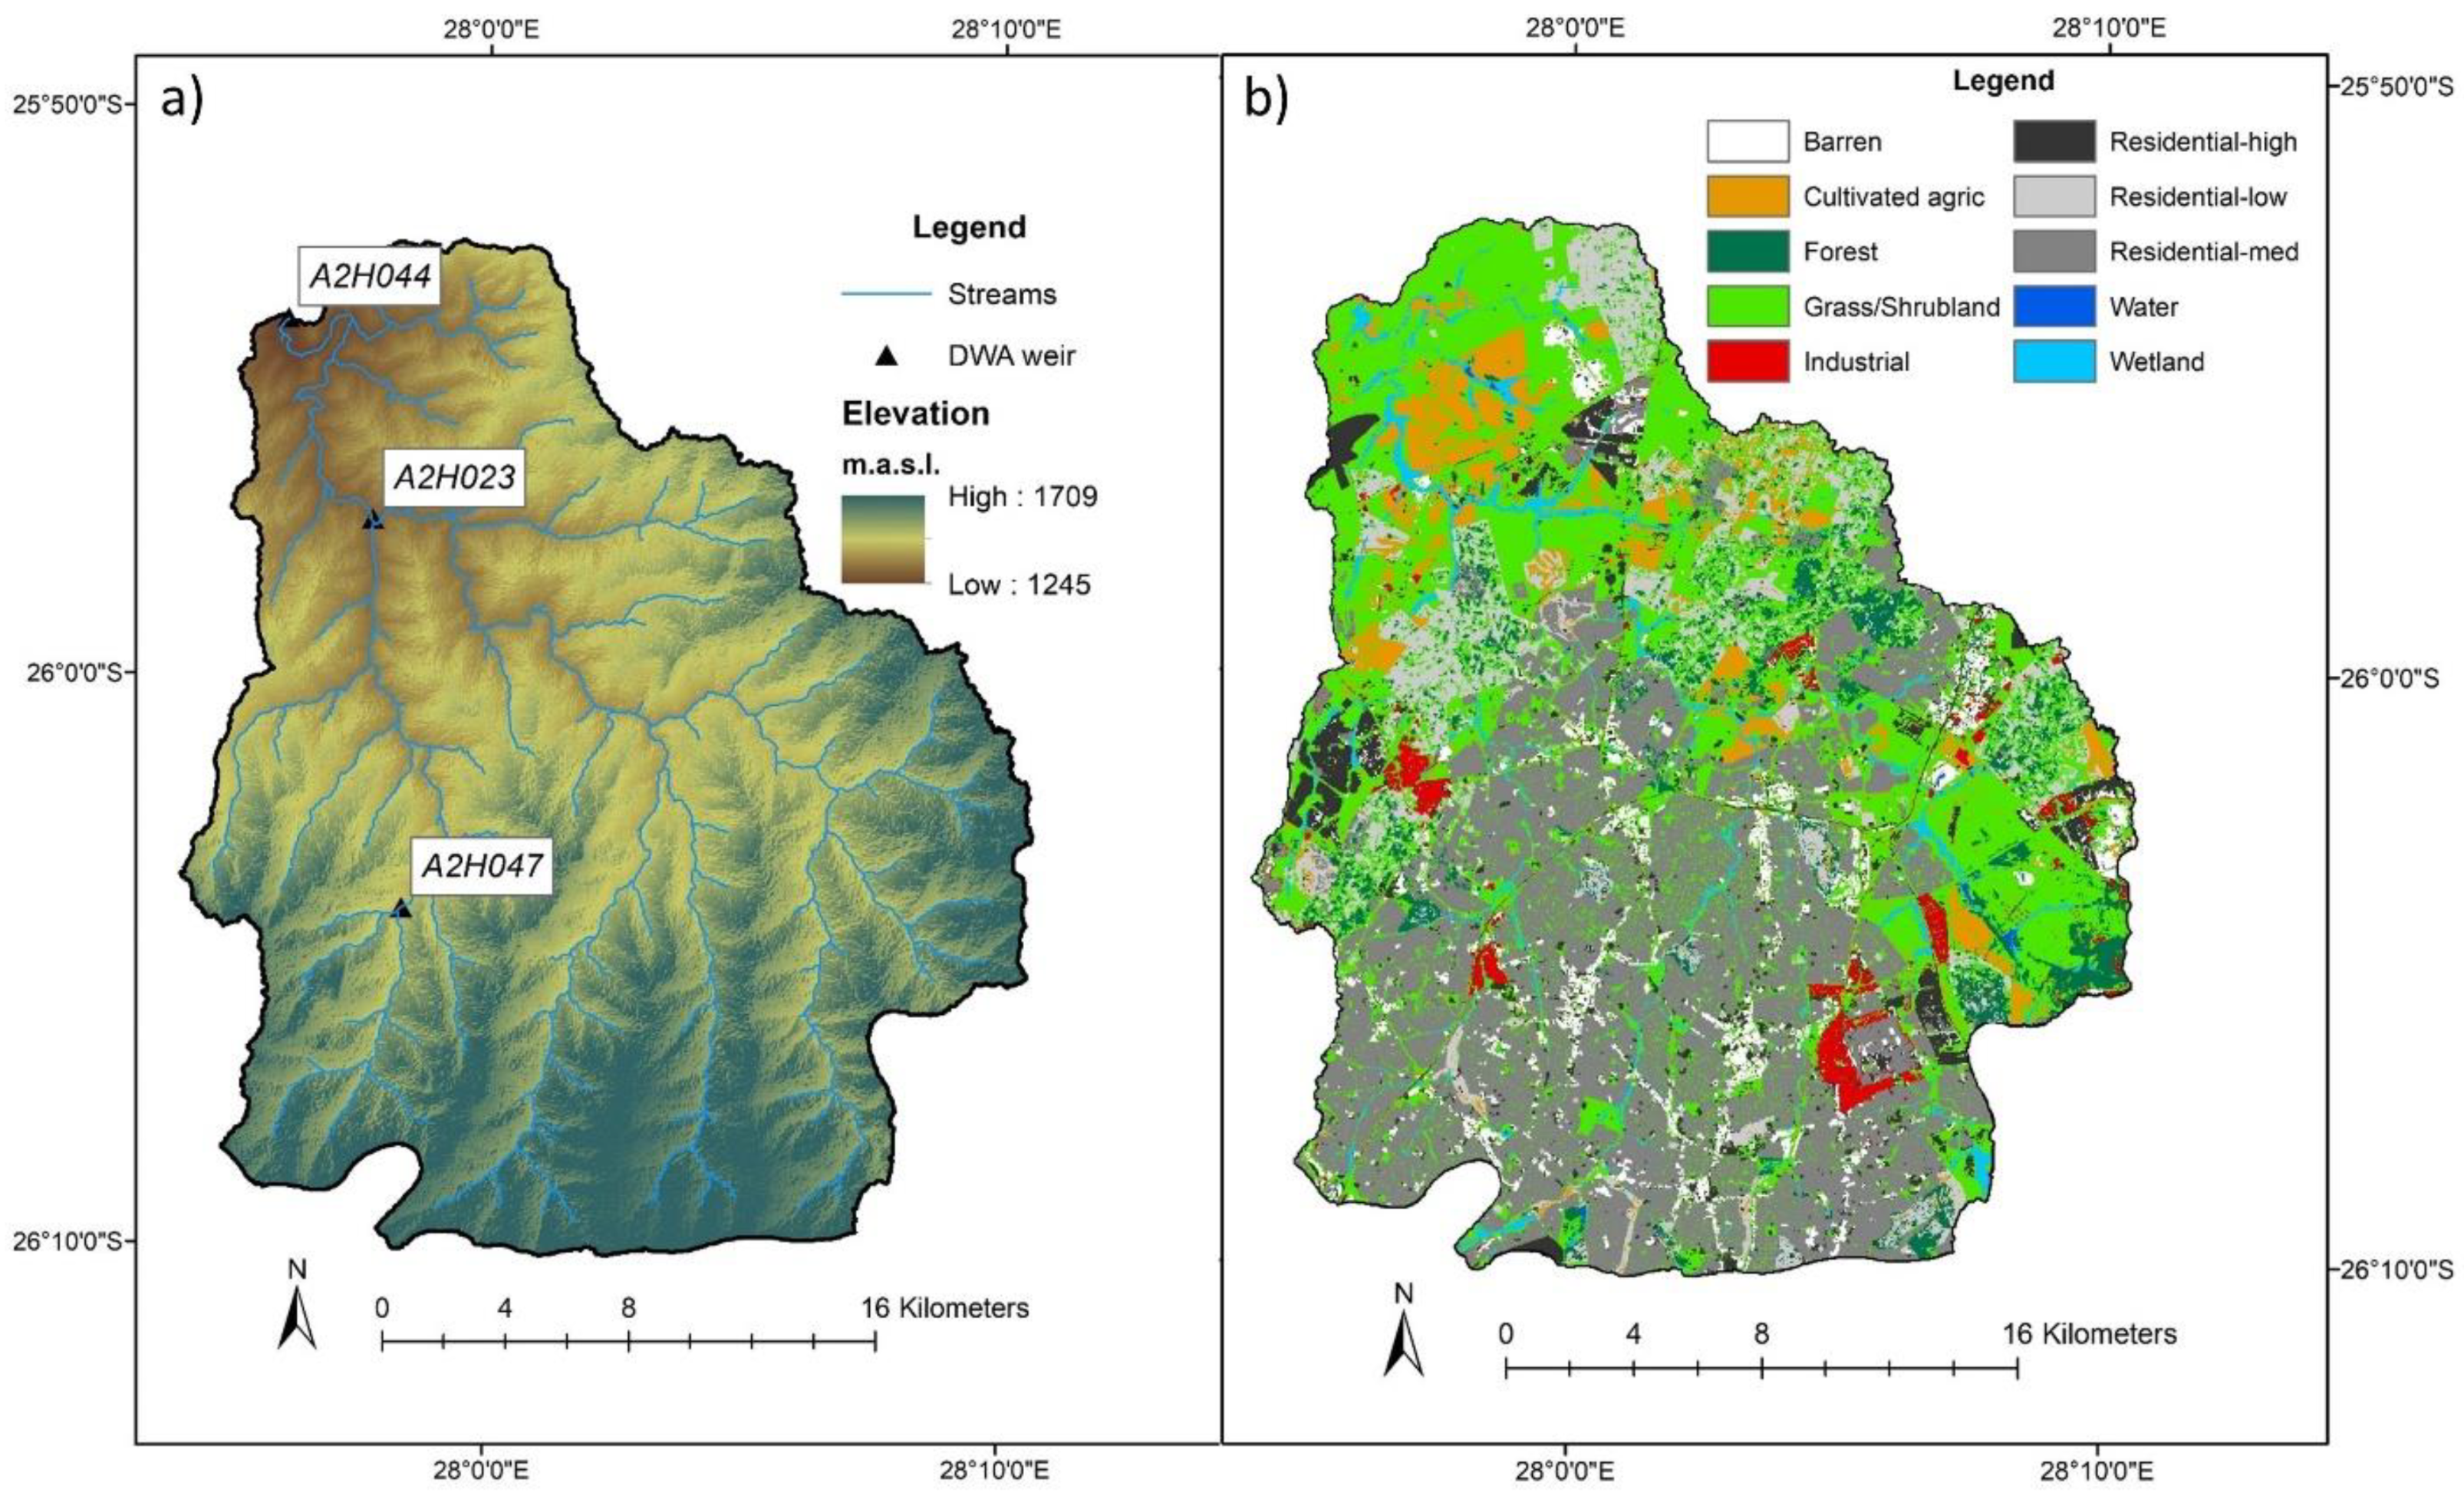
Elevation was obtained from a 30-m Shuttle Radar Topography Mission Digital Elevation Model (SRTM DEM) ([28]; Figure 2a). The current land use was obtained from the 2013–2014 SA National Land-Cover Map dataset [29]. The land-cover was re-grouped into SWAT land uses with pre-defined parameters for each use (Figure 2b).

2.2.2. Climate Information

Daily rainfall and minimum and maximum temperatures were obtained from two climate stations, namely, the Johannesburg Botanical Gardens (BOT) and OR Tambo Airport (INT) (Figure 1) of the South African Weather Service. Daily solar radiation, relative humidity and wind speed were obtained from the Climate Forecast System Reanalysis (CFSR) project [30], done by the National Center for Environmental Prediction (NCEP). This information was used to calculate daily potential evapotranspiration using the Penman–Monteith approach.

2.2.3. Soil Information

SWAT+ requires a soil dataset as a spatial layer. Details on soil horizons such as depth, particle size distribution, saturated hydraulic conductivity (Ks), bulk density (Db), carbon content and available water capacity (AWC) are required for each layer. The latter is synonymous with the more familiar ‘plant available water’.
Two levels of soil information were used in this study (Figure 3). The first was the land type (LT) database [31]. The LT database is the only soil dataset that covers the whole of South Africa at a 1:250,000 scale. A land type is an area with relatively homogenous soil forming factors (climate, geology and topography) resulting in relatively homogenous soil distribution patterns [32]. The LT database is currently the best readily available source of hydrological soil information available in South Africa. With the exception of Ks, all the SWAT+ required properties for the LT data are available from [33] and are summarized in Table 1. ROSSETTA [34] was used to derive the Ks for different horizons from the texture classes.
The second soil data set was developed through a digital soil mapping approach and is called DSM data for the remainder of this paper. The development of the soil map used in this study is discussed in detail in [17,35]. Here, we provide only key methodological steps that were followed to create the DSM dataset:
Environmental covariates (e.g., elevation, slope, topographic wetness index and NDVI) were obtained for the entire Halfway House Granite area (approximately 1050 km2).
The conditioned hypercube sampling method (cHLHS) was used to identify 30 hillslopes which are representative of the entire attribute space. Accessibility of the sites was an important consideration. Landowners are not always keen 1) to allow you on their property and 2) allow digging of profiles on their lawns. Large areas of the catchment are also urbanized (Figure 2b) and the surface sealed; this explains the concentration of observation locations in certain areas (Figure 3b).
A total of 273 soil observations were made with hand auger (Figure 3b). The soils were classified in accordance with the South African Soil Classification [36] and then regrouped into hydropedological soil types (Table 2; [37]).
The soil observation database was then divided into training (75%) and evaluation (25%) observations. The soil map was then created in R by running the multinomial logistic regression algorithm (MNLR; [38]) on the training data. The produced map (Figure 3b), had an evaluation point accuracy of 80% and a Kappa statistic value of 0.71 [17], which indicates a substantial agreement with reality, and was therefore deemed to be acceptable for use in the modelling exercise.
Hydraulic properties for representative profiles were obtained from two consultancy projects in the area [39,40]. Representative profiles (n = 24; Figure 3b) of different hydropedological types were opened. These profiles were typical ‘modal’ profiles representing the soil forms (Table 2).
Undisturbed core samples were collected from diagnostic horizons. The core samples were used to determine Db, particle size distribution, and the water retention characteristics using the hanging column method. The double ring infiltration method was used to determine the Ks of diagnostic soil horizons in situ. For more specific details on the sample strategy and measurement methodology, see [39].
Lastly, the hydraulic properties used as SWAT+ inputs for the different horizons of the hydropedological soil types were obtained by averaging these property values of the soil forms in the specific hydropedological soil type (Table 2). These values are summarised in Table 1.
Contrasting with the LT database, the DSM map shows higher variety of soils (two vs. six), and there is considerably more detail on the spatial distribution of the soils (Figure 3). The DSM dataset is dominated by the hydropedological classes ‘interflow (soil/bedrock)’ and ‘recharge (deep)’.

2.2.4. Validation Data and Statistical Comparison

Streamflow data was recorded at three weirs, managed by Department of Water Affairs (DWA), in the catchment, with long-term measurements (Figure 1). A2H044 drains the entire studied catchment (630 km2), whereas A2H043 and A2H047 drain approximately 550 km2 and 54 km2, respectively. Daily streamflow was converted to monthly average values for comparison purposes.
We also compared simulated actual evapotranspiration (S-aET) against aET derived from energy balance modelling using remote sensing data as input. We used data from MOD16 [41,42], which is also based on the Penman–Monteith approach. The 8-day aET was converted to monthly values and averaged for the entire basin using a ‘weighted average’ approach. This was done by (1) assigning a monthly aET value for each landscape unit (LSU), (2) multiplying this by the fraction of the basin covered by the specific LSU, and (3) adding the aET for all LSU to get a basin value. The monthly average basin value was compared to monthly S-aET at basin scale.
For statistical comparisons, we made use of three widely used statistical indices, namely coefficient of determination (R2), root-mean-square error (RMSE) and the Kling–Gupta efficiency (KGE). The latter is calculated using [43]:
K G E = 1 ( r 1 ) 2 + ( σ s i m σ o b s 1 ) 2 + ( μ s i m μ o b s 1 ) 2
where r represents the correlation coefficient, σsim and σsim the standard deviations in simulations and observations, respectively, and μsim and μobs the means of simulations and observations. KGE = 1 represents a perfect fit and values smaller than −0.41 imply that the means of the observations provide a better fit than the model [44]. In addition to these statistical indices, we assessed streamflow time series, yearly water balances and spatial aET visually to aid in the discussion of model output.

3. Results

The two model set-ups had identical numbers of sub-basins (19) and landscape units (230), because the same DEM was used to delineate these. The number of HRUs was, however, twice as high for the DSM simulation when compared to the LT simulation (i.e., 2034 and 1132, respectively). This is due to the higher level of detail in the DSM soil map compared to the LT soil map (Figure 3).
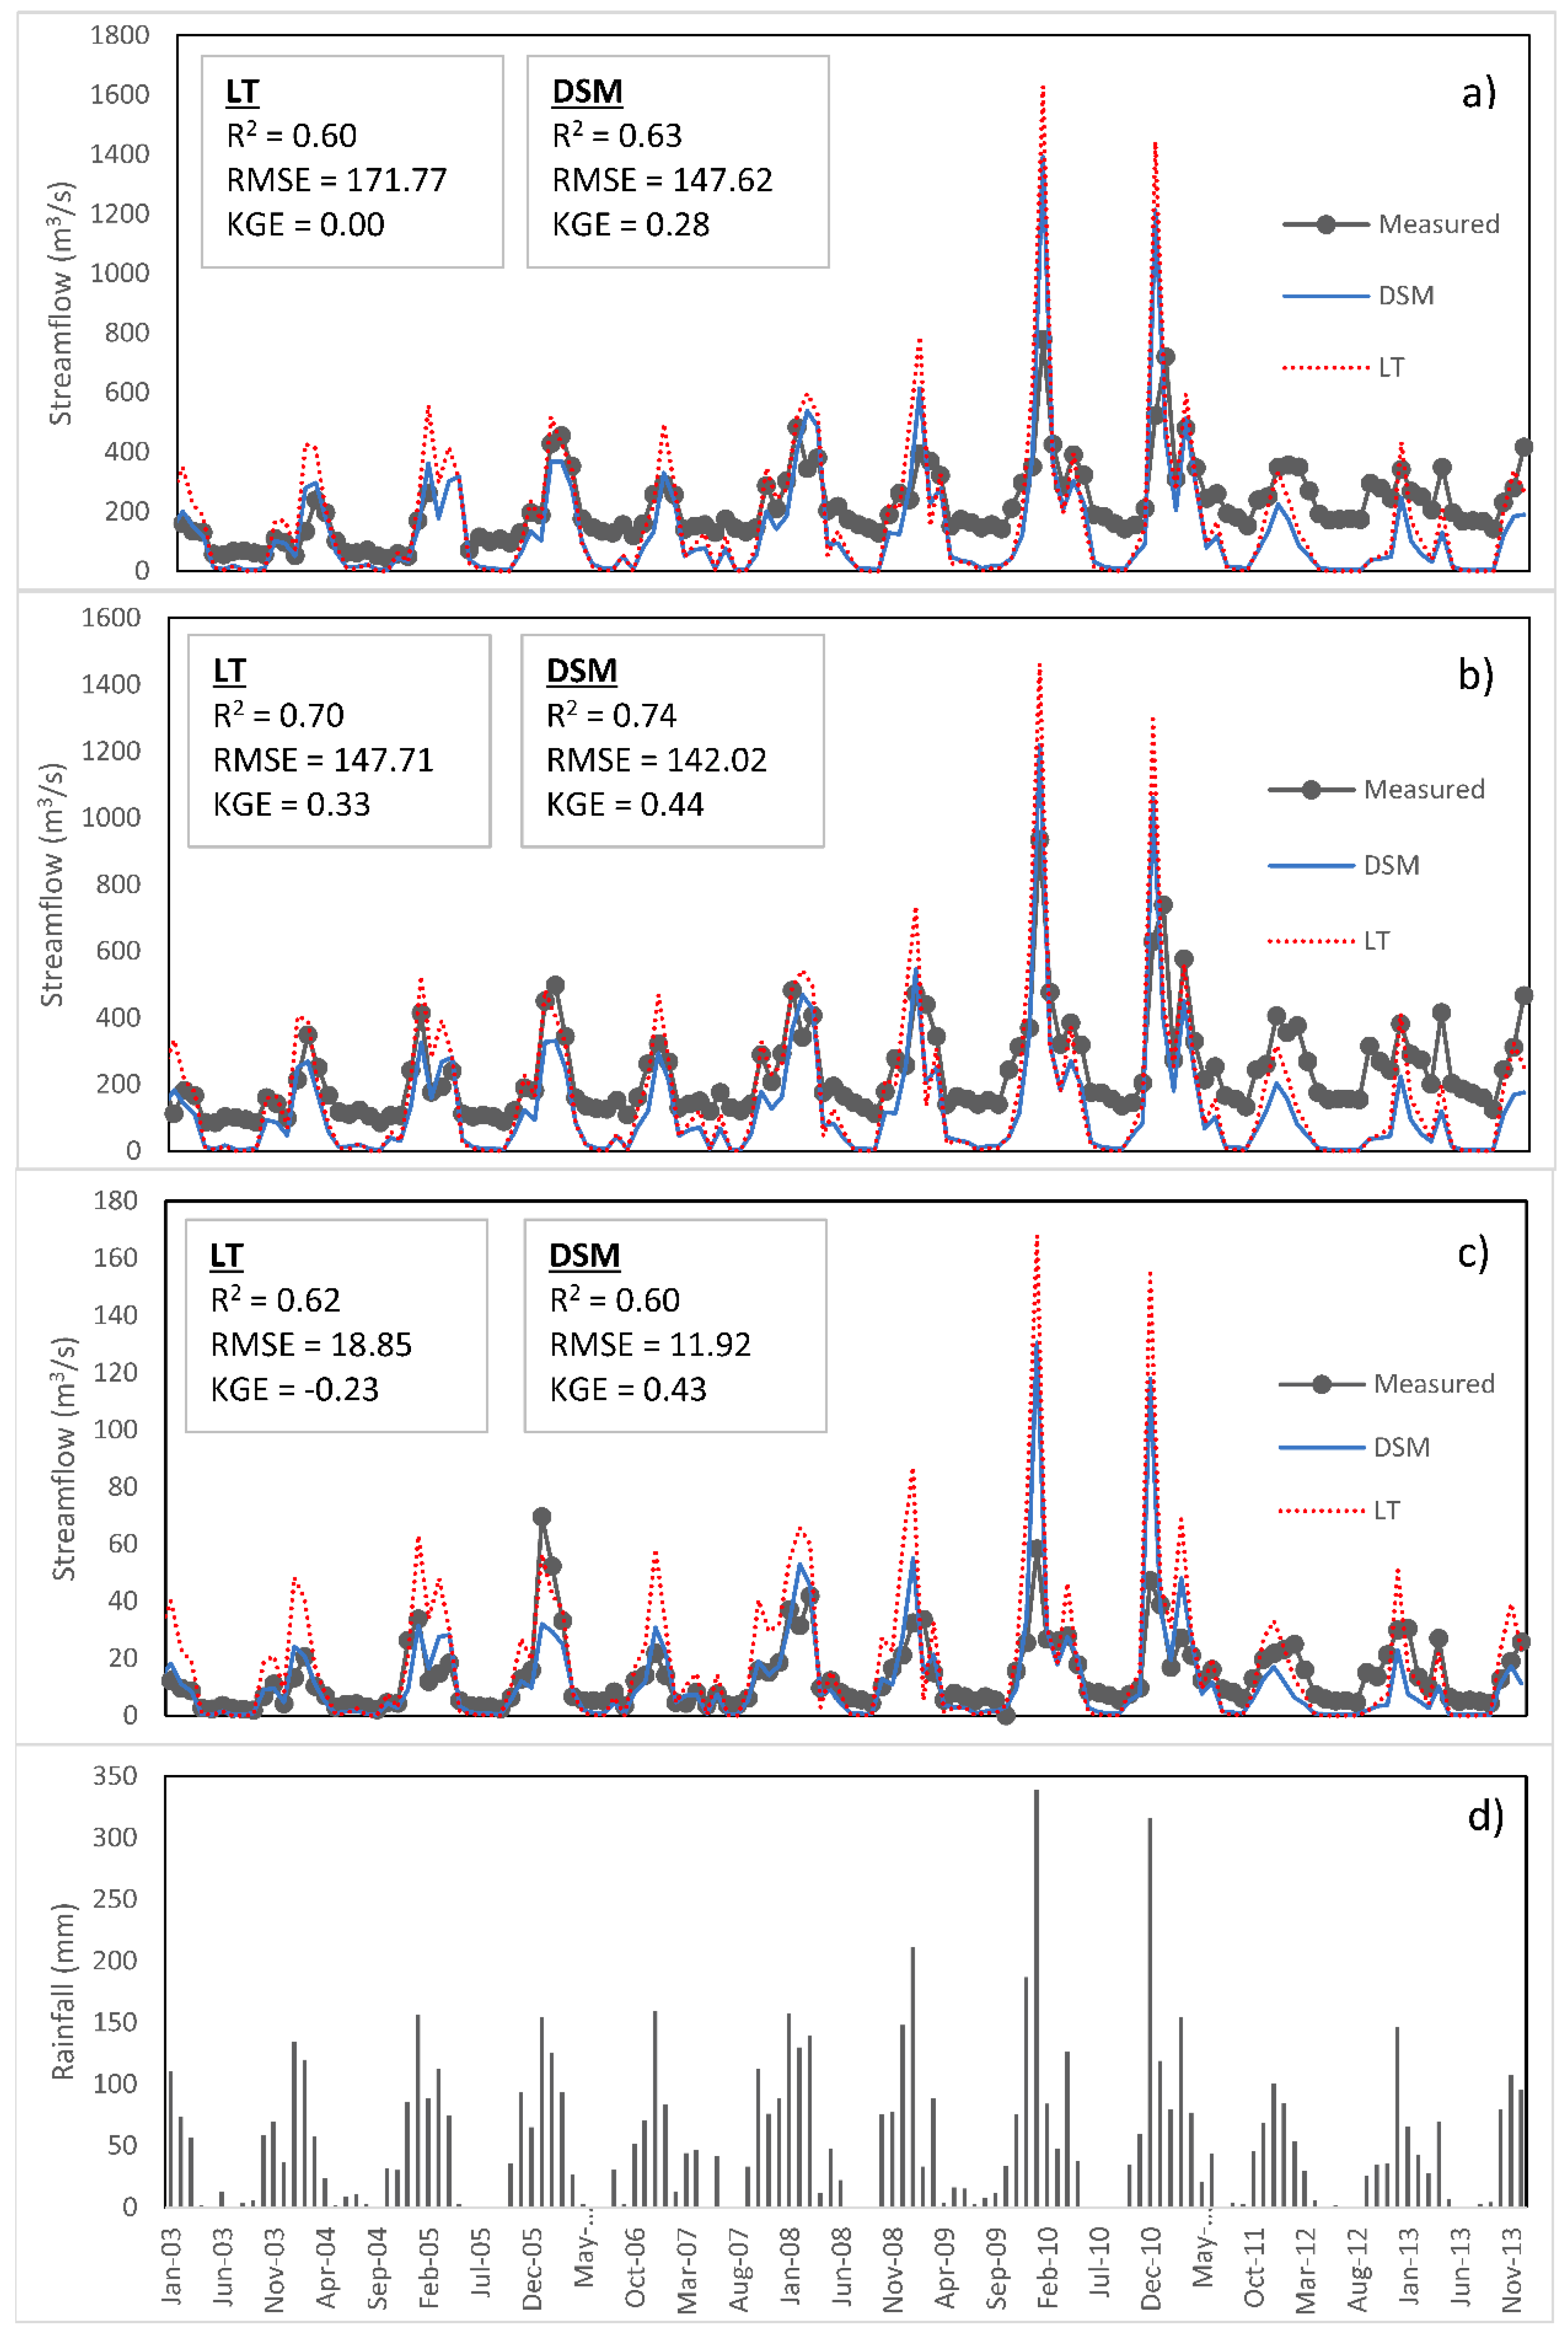
For both LT and DSM simulations, baseflow was substantially underestimated in the two larger catchments (Figure 4). The underestimation is more pronounced in the larger (>500 km2) catchment (Figure 4a,b) than in the smaller (54 km2) catchment (Figure 4c). Overestimation of peak flows is associated with both model runs, but more obvious with LT simulations than DSM simulations. Statistical indices indicate that there are moderate correlations with observed streamflow (R2 ≥ 0.6) at all scales for both simulations. The RMSE error, however, is high and the KGE relatively low. At all three scales, the DSM simulation performed better than the LT simulation when all three statistical indices were considered. The difference in the KGE was especially worth noting in the smaller catchment (Figure 4c) with 0.43 for the DSM simulation and −0.23 for the LT simulation.
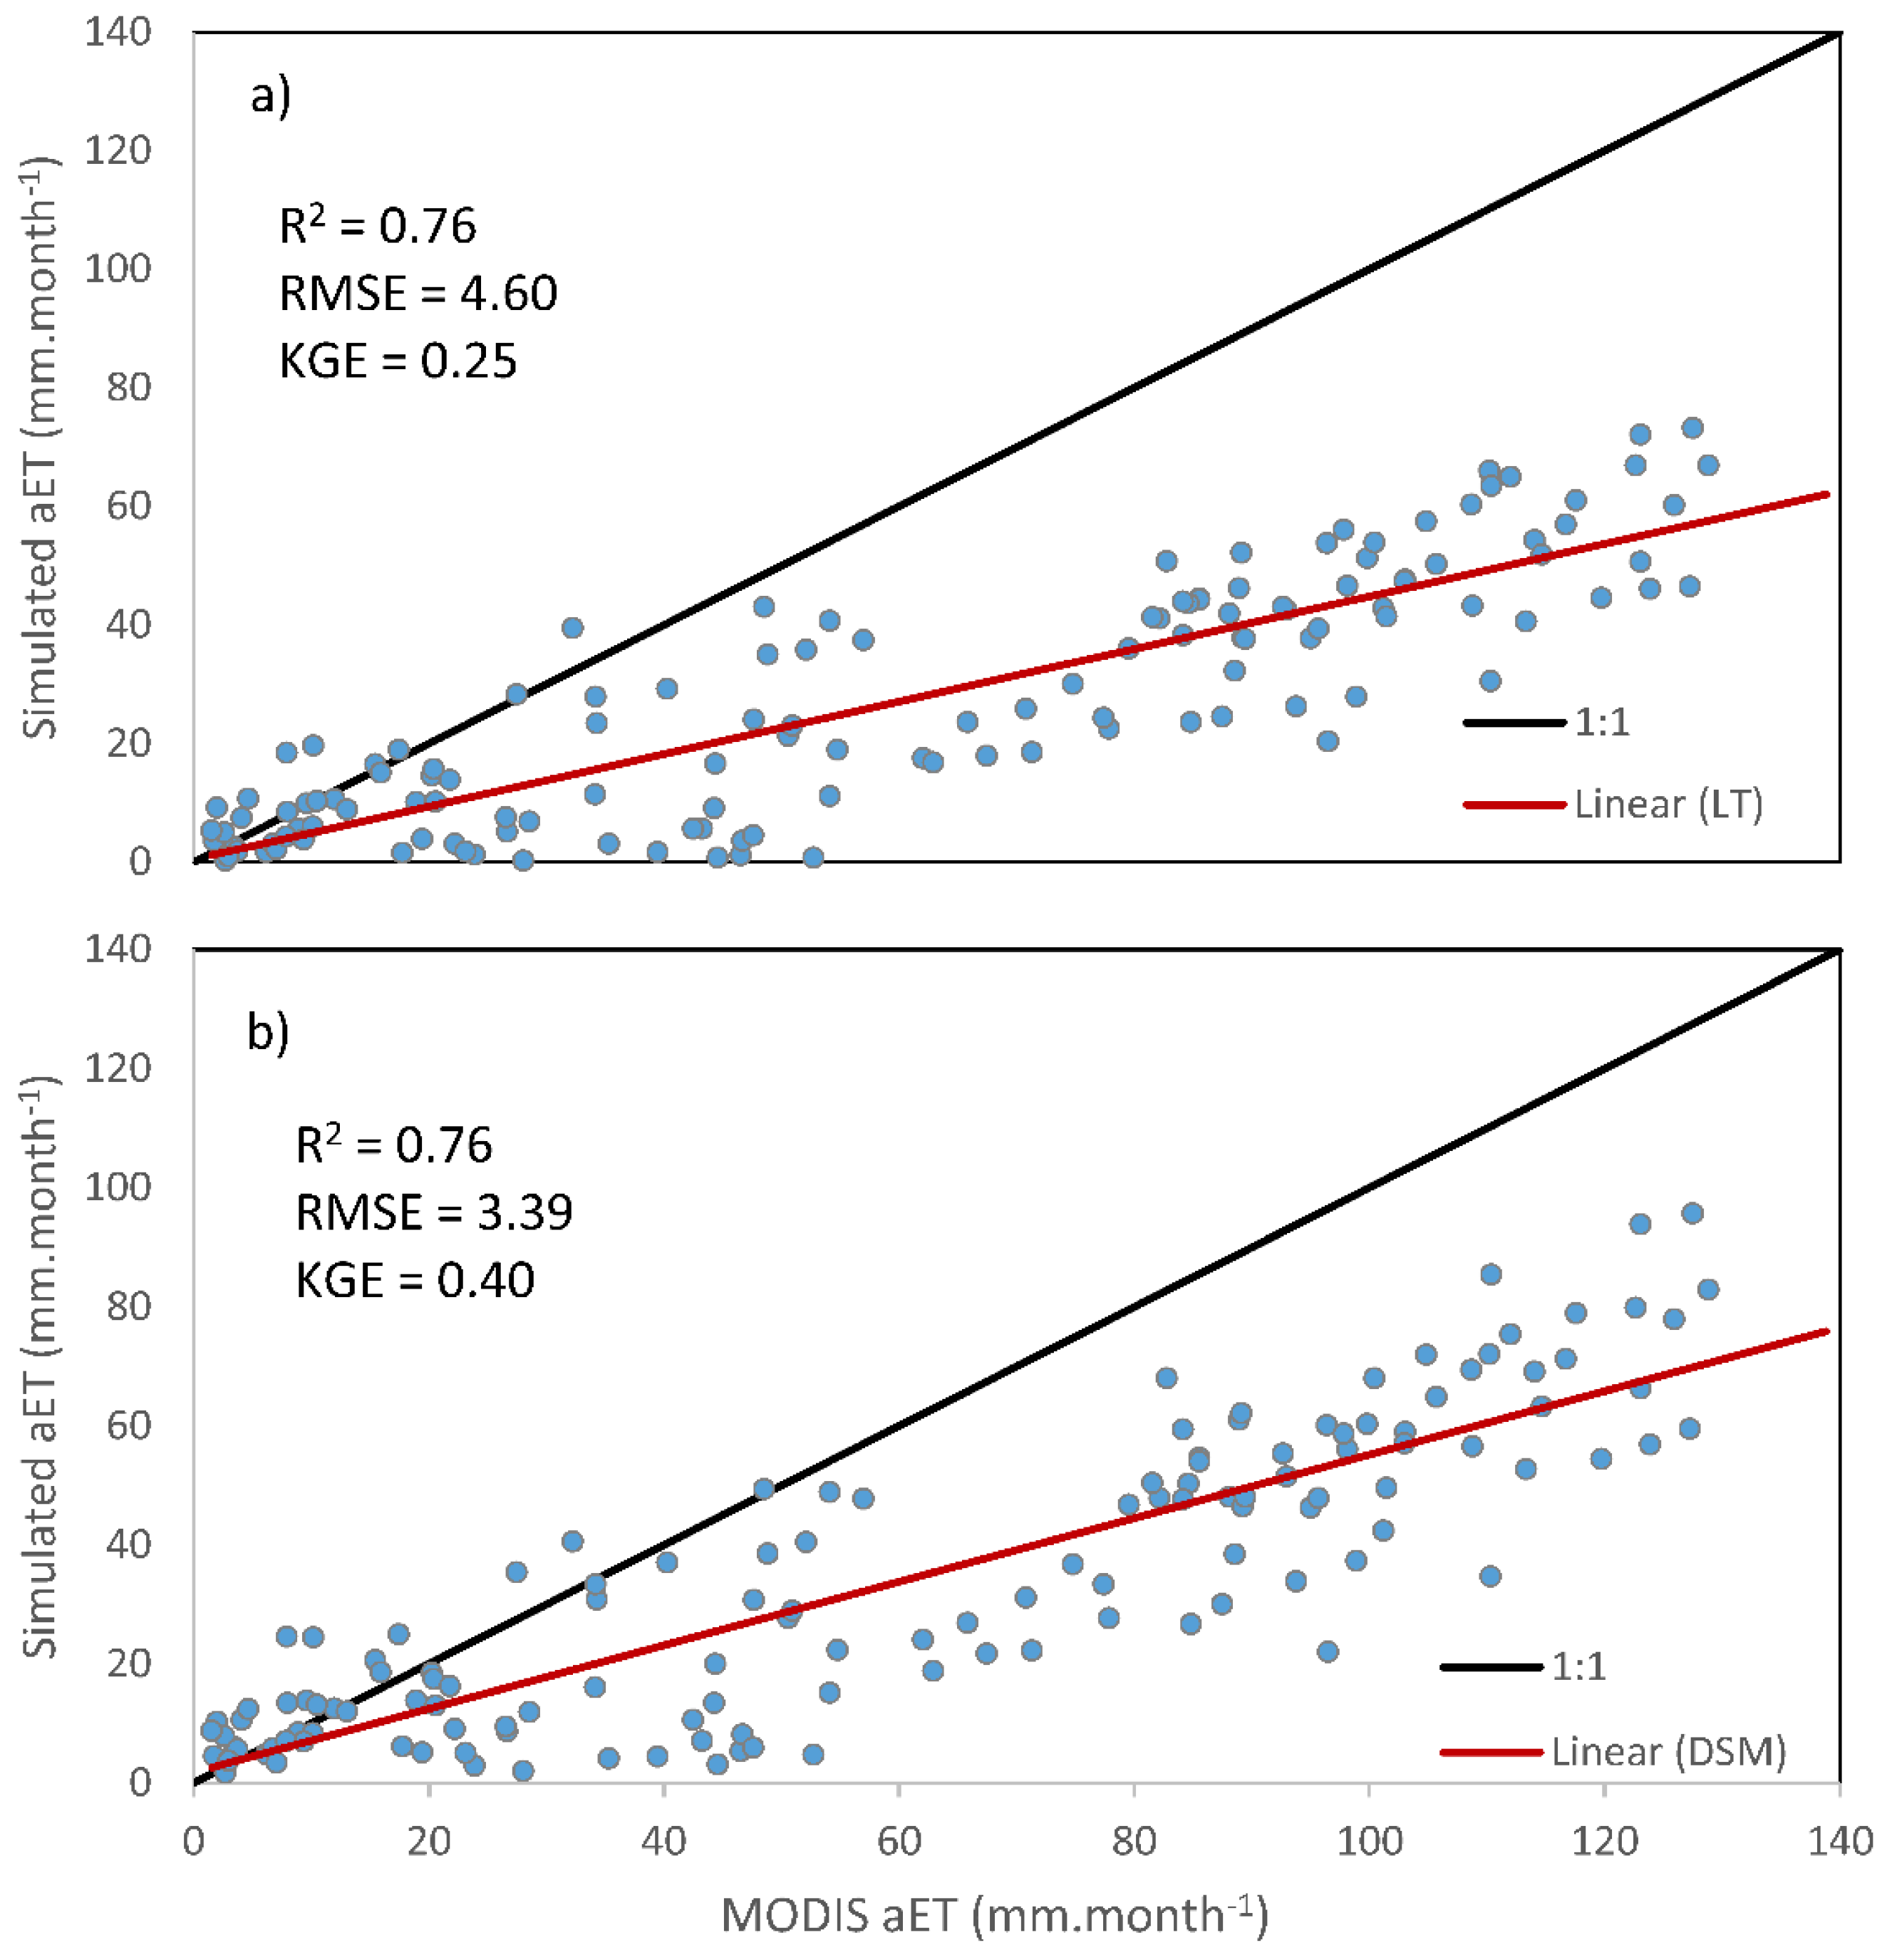
When compared to MOD16-derived actual evaporation (aET), both simulations underestimated aET considerably (see deviation from 1:1 line in Figure 5). The underestimation was larger with the LT soil dataset (Figure 5a) than with the DSM dataset (Figure 5b). These differences are also indicated in the RMSE values of 4.6 and 3.4 for the LT and DSM simulations, respectively. The KGE values were also notably lower with the LT simulation (0.25) when compared to the DSM (0.4) simulation.
The underestimation of S-aET and streamflow is also visible when yearly average water balance components are considered (Table 3). Total streamflow is underestimated by 17% for LT and 38% for DSM simulations for the entire basin (A2H044). This underestimation was more pronounced at weir A2H023, with 18% for LT and 41% for DSM. In the smaller catchment (A2H047), streamflow was overestimated by 30% with the LT simulation and underestimated by 18% under the DSM simulation.
For the LT simulation, streamflow to rainfall is approximately 46%, with 51% of the rainfall contributing to evapotranspiration in the entire catchment (A2H044). The streamflow:rainfall ratio is considerably smaller for the DSM simulation (34%), with a larger contribution to evaporation (64%) for this catchment. The total discharge for the LT simulation is considerably higher when compared to the DSM simulation at all scales, a difference of 76, 84 and 127 mm.year−1 for A2H044, A2H023 and A2H047, respectively. This increase is largely due to a 4-fold increase in the simulated overland flow under LT at all scales. The lateral flow component of the DSM simulation is, however, between four and six times higher than for the LT simulation.
Yearly average MOD16-derived aET is 723 mm, which is considerably higher than the rainfall. S-aET is approximately half of the MOD16-derived aET. Differences between S-aET of the different model runs are worth noting. At all scales, LT produced less S-aET than DSM; these differences amount to 24%, 28% and 48% with decreasing catchment size (Table 3).
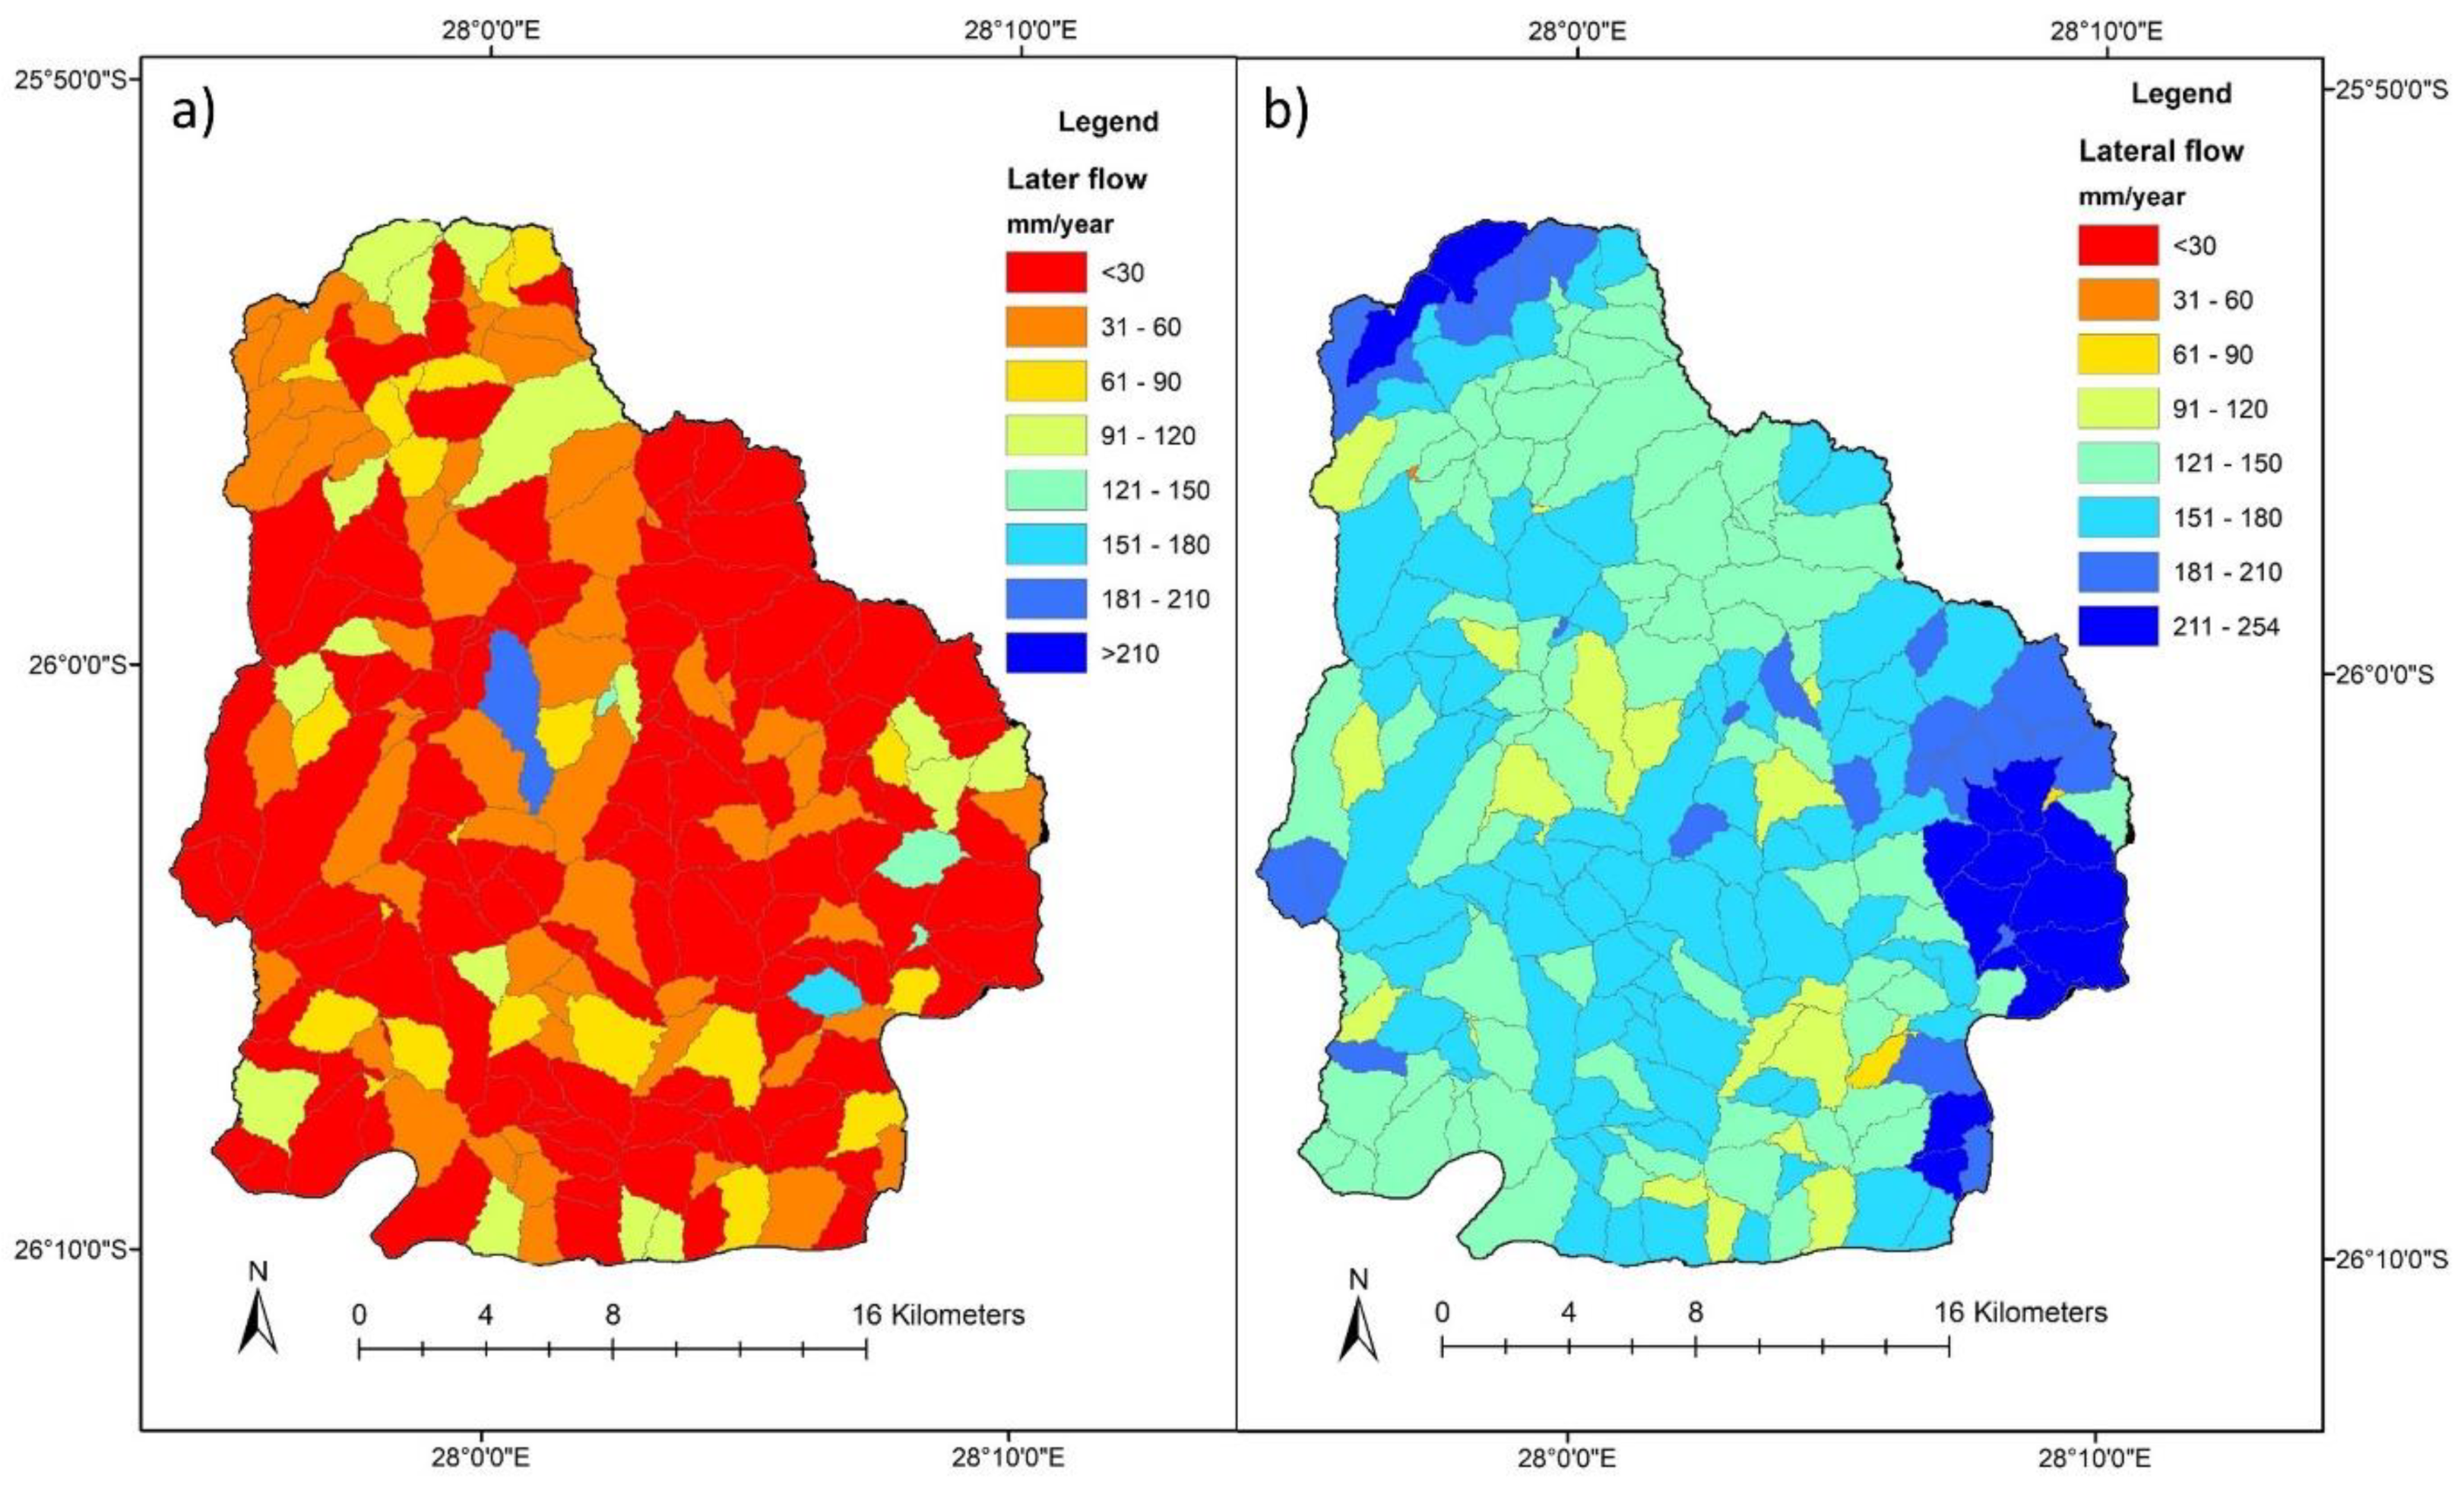
The variation in lateral flow simulation is remarkable (Figure 6). The majority of LSUs in the LT simulation produced less than 30 mm.year−1 (Figure 6a), whereas almost all of the LSUs in the DSM simulation produced more than 90 mm.year−1 (Figure 6b). It is also worth noting that there is limited visual correlation between the relatively low- and high-producing LSUs of the LT simulation and the relatively low- and high-producing LSUs of the DSM simulations.

4. Discussion

4.1. Streamflow Simulations

The streamflow predictions were surprisingly accurate (especially for weir A2H023), considering that the models were not calibrated against measured flow. Similar studies, for example, obtained R2 values of between 0.42 and 0.71 [19], 0.15 [20], and between 0.61 and 0.74 [21]. In terms of quantifying overall modelling efficiency, the KGE captures correlation and deviation between simulated and measured values. According to Knoben et al. [44], a KGE of greater than −0.41 implies that the model prediction is a better fit than the mean observed value. With this as benchmark, all the simulations produced ‘reasonable’ simulations.
There is, however, a clear underestimation of baseflow in the larger catchments (A2H044 and A2H023), which translates into an underestimation of total streamflow (Figure 4, Table 3). This underestimation could be corrected by adjusting groundwater parameters in the model. Decreasing the threshold depth for return flow to occur (GWQMN), decreasing the coefficient of re-evaporation from the groundwater (GW_REVAP) and increasing the threshold depth of the groundwater before re-evaporation occurs (REVAMPM) for different HRUs will likely increase baseflow contributions [45]. To optimise simulations and evaluate parameter uncertainty could be the objective of a future study (similar to [16]), but, here, we focused on the direct contribution of different soil inputs to the model performance.
From the simulations, it is clear that more detailed soil information provided better simulations, presumably because the governing runoff generation processes are better reflected. The higher R2 in the large catchments (Figure 4a,b), especially the higher KGE, indicates better modelling performance. Worth noting is that the improved statistical indices associated with the DSM dataset were observed despite greater underestimation of total discharge on the water balance of the larger catchments (Table 3). This is important, implying that a better representation of the overall water balance does not necessary translate to improved representation of streamflow generation processes. The improved performance can mostly be attributed to improved predictions of peak flows. Higher conductivity (Ks) of surface horizons and deeper soils (Table 1) of the DSM soil inputs will increase infiltration and water storage. Moreover, the textural discontinuity of the interflow soils leads to higher simulated subsurface lateral flows (Figure 3), which also has an effect on the simulated peak flows. The relatively low conductivity and comparatively shallower soils (Table 1) of the LT soil inputs will promote overland flow generation and a quick response to rainfall. This is supported by the summary of water balance in Table 3, where LT simulations generated four times more overland flow than DSM simulations.
The impact of more detailed soil information is more pronounced in the smaller catchment (Figure 4c, Table 3), with a marked decrease in RMSE and an increase in the KGE from the LT to DSM simulations. The increase in KGE is especially noteworthy. This statistical index improves from −0.23 to 0.43. For the 54-km2 catchment, the more detailed soil information improved the model predictions from relatively ‘poor’ to ‘acceptable’. In the 54-km2 catchment, the improvement in the simulations is also visible in the water balance. Total discharge is underestimated by 18% for the DSM simulation (compared to >38% for the same soil dataset in the lager catchments), whereas the LT simulations overestimate streamflow by 30%. From our simulations, it appears that detailed soil information becomes more important in smaller areas, where fewer runoff generation processes dominate, a notion supported by [14]. It is also important to recognize that land-use change, such as urbanisation or open-cast mining, is site-specific. Details of where, when and which hydrological processes dominate are therefore vital for planning in smaller catchments. The optimum scale of soil data for different-sized catchments is however still not known, and certainly worth exploring in future.

4.2. Groundwater Contributions

The underestimation of baseflow, especially in the larger catchments (Figure 4a,b), could be attributed to groundwater contributions from outside the catchment area. In general, the groundwater level is deeper than 10 m in the study site [22]. The contribution of groundwater (or fractured rock aquifers) is assumed to be significant, especially during low-rainfall months. Based on our simulations, groundwater contributes to between 62 and 134 mm of the Jukskei’s streamflow per year, i.e., between 18% and 38% of streamflow. It would be important to validate these findings through detailed measurements and dedicated modelling.
The external contribution of groundwater from outside the catchment area could also be linked to the underestimation of S-aET when compared to the MOD16 aET (Figure 5, Table 3). One must keep in mind that MOD16 (or other remote-sensed) aET values are also ‘modelled’ values. Direct comparisons with simulated values and interpretations in relation to hydrological processes should therefore be made with care. In this study, it appears that MOD16 overestimates aET when compared to rainfall. This is in contrast with another South African study, where MOD16 underestimated aET when compared to measured values [46]. Regardless, the considerably higher MOD16 aET (compared to S-aET) and the underestimation of baseflow (Figure 4), especially during dry months, suggest that streamflow and aET are supported with contributions of water not accounted for in the catchment water balance.
The relatively smaller underestimation of total discharge in the 54-km2 catchment with the DSM simulations and overestimation with the LT simulation could be an indication that groundwater only makes a considerable contribution to higher-order streams.

4.3. Implications for Management

In the study area, subsurface lateral flow has important implications for urbanisation. The term ‘wet basement syndrome’ (WBS, [39,47]) refers to accumulation of water when lateral flowpaths are intersected by foundations. WBS has implications for infrastructural development (e.g., dampness of walls) and graveyards as well as environmental consequences in the alteration in wetland water regimes. Where wetland waters are supplied through lateral flow, surface sealing or intersection of lateral flowpaths will change the water regimes and, ultimately, the ecosystem services provided by the wetland [48].
Representing the spatial distribution of dominant streamflow generation processes is vital for decision making (e.g., [9,16,19]). Here, we showed how different soil information datasets impact the spatial representation of lateral flow generation. In Figure 6, the relative contributions of lateral flow on 230 different landscape units (LSU) are presented and they differ not only in terms of the volume of flow generated but also in terms of the spatial distribution of the relatively high- and low-generating LSUs. For decision making purposes, the spatial representation could be refined to HRU scale (2034 units). Such information can help with the planning of development projects, such as the location of subsurface drains, graveyards and the type of foundation to consider in different areas. Without detailed soil information, the importance of lateral flow in this catchment would have been underestimated, and this highlights the role that spatially distributed models can play in the design and evaluation of water management plans [18].

5. Conclusions

This work presented results from hydrological simulations using two levels of soil inputs. More detailed soil information, developed through advanced digital soil mapping techniques, resulted in more accurate simulations of streamflow when compared to measured values. The improved simulation accuracy was obtained without calibration of the model. This is promising for hydrological modelling in ungauged areas, where long-term streamflow monitoring for calibration is absent. The underestimation of baseflow, especially in the larger catchments, and potential contribution of groundwater from beyond the catchment boundary are modelling aspects that need to be considered in future studies.
In our study, the impact of the improved soil information was more pronounced in the smaller catchment than in the larger ones. The ideal level of detail (or scale) of soil information for hydrological modelling of different sized catchments remains an important question. It is, however, clear that the SWAT+ model is sensitive to soil inputs, and we argued that the spatial representation of dominant hydrological processes is captured more accurately with more detailed soil information. Any reasonable effort should therefore be made to improve the soil information to realistically reflect hydrological processes in order to improve land use planning, especially in areas dedicated for urbanisation.

Author Contributions

Conceptualization, J.v.T and S.J.; methodology, J.v.T and G.v.Z.; formal analysis, J.v.T; investigation, J.v.T., G.v.Z. and S.J..; writing—original draft preparation, J.v.T.; writing—review and editing, G.v.Z. and S.J; visualization, J.v.T.; funding acquisition, G.v.Z. and J.v.T. All authors have read and agreed to the published version of the manuscript.

Funding

This research was partially funded by the National Research Foundation (NRF Grant: RDYR–116350).

Acknowledgments

The authors are grateful to the City of Joburg Municipality, the South African Weather Service and Digital Soils Africa for providing important soil and climate data.

Conflicts of Interest

The authors declare no conflict of interest.

References

  1. Park, S.J.; Mcsweeney, K.; Lowery, B. Identification of the spatial distribution of soils using a process-based terrain characterization. Geoderma 2001, 103, 249–272. [Google Scholar] [CrossRef]
  2. Beven, K. Surface water hydrology—Runoff generation and basin structure. Rev. Geophys. 1983, 21, 721–730. [Google Scholar] [CrossRef]
  3. Worqlul, A.W.; Ayana, E.K.; Yen, H.; Jeong, J.; MacAlister, C.; Taylor, R.; Gerik, T.J.; Steenhuis, T.S. Evaluating hydrologic responses to soil characteristics using SWAT model in a paired-watersheds in the Upper Blue Nile Basin. Catena 2018, 163, 332–341. [Google Scholar] [CrossRef]
  4. Lilly, A.; Boorman, D.; Hollis, J.D. The development of a hydrological classification of UK soils and the inherent scale changes. Nutr. Cycl. Agroecosyst. 1998, 50, 299–302. [Google Scholar] [CrossRef]
  5. Zhu, A.X.; Mackay, D.S. Effects of spatial detail of soil information on watershed modelling. J. Hydrol. 2001, 248, 54–77. [Google Scholar] [CrossRef] [Green Version]
  6. McDonnell, J.J.; Sivapalan, M.; Vaché, K.; Dunn, S.; Grant, G.; Haggerty, R.; Hinz, C.; Hooper, R.; Kirchner, J.; Roderick, M.L.; et al. Moving beyond heterogeneity and process complexity: A new vision for watershed hydrology. Water Resour. Res. 2007, 43, 1–6. [Google Scholar] [CrossRef] [Green Version]
  7. Julich, S.; Breuer, L.; Frede, H.-G. Integrating heterogeneous landscape characteristics into watershed scale modelling. Adv. Geosci. 2012, 31, 31–38. [Google Scholar] [CrossRef] [Green Version]
  8. Ayana, E.K.; Dile, Y.T.; Narasimhan, B.; Srinivasan, R. Dividends in flow prediction improvement using high-resolution soil database. J. Hydrol. Reg. Stud. 2019, 21, 159–175. [Google Scholar] [CrossRef]
  9. Beven, K.; Freer, J. Equifinality, data assimilation, and uncertainty estimation in mechanistic modelling of complex environmental systems using the GLUE methodology. J. Hydrol. 2001, 249, 11–29. [Google Scholar] [CrossRef]
  10. Beven, K. A manifesto for the equifinality thesis. J. Hydrol. 2006, 320, 18–36. [Google Scholar] [CrossRef] [Green Version]
  11. Seibert, J.; McDonnell, J.J. On the dialog between experimentalist and modeller in catchment hydrology: Use of soft data for multicriteria model calibration. Water Res. Res. 2002, 38, 1241–1252. [Google Scholar] [CrossRef]
  12. McBratney, A.B.; Mendoça Santos, M.L.; Minasny, B. On digital soil mapping. Geoderma 2003, 117, 3–52. [Google Scholar] [CrossRef]
  13. Thompson, J.A.; Roecker, S.; Gunwald, S.; Owens, P.R. Digital soil mapping: Interactions with and applications for hydropedology. In Hydropedology: Synergistic Integration of Soil Science and Hydrology; Lin, H.S., Ed.; Elsevier: Amsterdam, Netherlands, 2012; pp. 665–709. [Google Scholar]
  14. Van Tol, J.J.; van Zijl, G.M.; Riddell, E.S.; Fundisi, D. Application of hydropedological insights in hydrological modelling of the Stevenson Hamilton Research Supersite, Kruger National Park, South Africa. Water SA 2015, 41, 525–533. [Google Scholar] [CrossRef] [Green Version]
  15. Van Zijl, G.M.; van Tol, J.J.; Riddell, E.S. Digital mapping for hydrological modelling. In Digital Soil Mapping Across Paradigms, Scales and Boundaries; Zhang, G., Brus, D., Liu, F., Song, X., Lagacherie, P., Eds.; Springer: Singapore, 2016; pp. 115–129. [Google Scholar]
  16. Wahren, F.T.; Julich, S.; Nunes, J.P.; Gonzalez-Pelayo, O.; Hawtree, D.; Feger, K.H.; Keizer, J.J. Combining digital soil mapping and hydrological modelling data in a data scarce watershed in north-central Portugal. Geoderma 2016, 264, 350–362. [Google Scholar] [CrossRef]
  17. Van Zijl, G.M.; van Tol, J.J.; Bouwer, D.; Lorentz, S.A.; Le Roux, P.A.L. Combining Historical Remote Sensing, Digital Soil Mapping and Hydrological Modelling to Produce Solutions for Infrastructure Damage in Cosmo City, South Africa. Remote Sens. 2020, 12, 433. [Google Scholar] [CrossRef] [Green Version]
  18. Romanowicz, A.A.; Vancloostera, M.; Rounsevelb, M.; La Junesseb, I. Sensitivity of the SWAT model to the soil and land use data parametrisation: A case study in the Thyle catchment, Belgium. Ecol. Modell. 2005, 187, 27–39. [Google Scholar] [CrossRef]
  19. Bossa, A.Y.; Diekkrüger, B.; Igué, A.M.; Gaiser, T. Analyzing the effects of different soil databases on modelling of hydrological processes and sediment yield in Benin (West Africa). Geoderma 2012, 173, 61–74. [Google Scholar] [CrossRef]
  20. Diek, S.; Temme, A.J.A.M.; Teuling, A.J. The effect of spatial soil variation on the hydrology of a semi-arid Rocky Mountain catchment. Geoderma 2014, 235, 113–126. [Google Scholar] [CrossRef]
  21. Geza, M.; McCray, J.E. Effects of soil data resolution on SWAT model stream flow and water quality predictions. J. Environ. Manag. 2008, 88, 393–406. [Google Scholar] [CrossRef]
  22. Dippenaar, M.A.; Van Rooy, J.L. Review of engineering, hydrogeological and vadose 540 zone hydrological aspects of the Lanseria Gneiss, Goudplaats-Hout River Gneiss and 541 Nelspruit Suite Granite (South Africa). J. Afr. Earth Sci. 2014, 91, 12–31. [Google Scholar] [CrossRef] [Green Version]
  23. IUSS Working Group WRB. World Reference Base for Soil Resources 2014; Update 2015 International Soil Classification System for Naming Soils and Creating Legends for Soil Maps; World Soil Resources Reports No. 106; FAO: Rome, Italy, 2015. [Google Scholar]
  24. South African National Biodiversity Institute (SANBI). The Vegetation Map of South Africa, Lesotho and Swaziland. Mucina, L., Rutherford, M.C., Powrie, L.W., Eds.; Version. 2012. Available online: http://bgis.sanbi.org/SpatialDataset/Detail/18 (accessed on 14 September 2019).
  25. Arnold, J.G.; Srinivasan, R.; Muttiah, R.S.; Williams, J.R. Large area hydrologic modelling and assessment, part I: Model development. J. Am. Water Resour. Assoc. 1998, 34, 73–89. [Google Scholar] [CrossRef]
  26. Neitsch, S.L.; Williams, J.; Arnold, J.; Kiniry, J. Soil and Water Assessment Tool Theoretical Documentation Version 2009; Texas Water Resources Institute: College Station, TX, USA, 2011. [Google Scholar]
  27. Bieger, K.; Arnold, J.G.; Rathjens, H.; White, M.J.; Bosch, D.D.; Allen, P.M.; Srinivasan, R. Introduction to SWAT+, a completely restructured version of the soil and water assessment tool. J. Am. Water Resour. Assoc. 2017, 53, 115–130. [Google Scholar] [CrossRef]
  28. USGS (United States Geological Survey). Landsat Images. Available online: http://landsat.usgs.gov (accessed on 16 September 2019).
  29. Geoterraimage. 2013–2014 South African National Land-Cover Dataset; Report Created for Department of Environmental Sciences; DEA/CARDNO SCPF002: Implementation of Land Use Maps for South Africa; Department of Environmental Affairs: Pretoria, South Africa, 2015. [Google Scholar]
  30. Saha, S.; Moorthi, S.; Pan, H.L.; Wu, X.; Wang, J.; Nadiga, S.; Tripp, P.; Kistler, R.; Woollen, J.; Behringer, D.; et al. The NCEP Climate Forecast System Reanalysis. Bull. Am. Meteorol. Soc. 2015, 91, 1015–1057. [Google Scholar] [CrossRef]
  31. Land Type Survey Staff. Land Types of South Africa: Digital Map (1:250,000 Scale) and Soil Inventory Datasets; ARC-Institute for Soil, Climate and Water: Pretoria, South Africa, 1972–2002. [Google Scholar]
  32. Paterson, D.G.; Turner, D.P.; Wiese, L.D.; Van Zijl, G.; Clarke, C.E.; Van Tol, J.J. Spatial soil information in South Africa: Situational analysis, limitations and challenges. S. Afr. J. Sci. 2015, 111, 1–7. [Google Scholar] [CrossRef]
  33. Schulze, R.E. Soils: Agrohydrological Information Needs, Information Sources and Decision Support. In South African Atlas of Climatology and Agrohydrology; Schulze, R.E., Ed.; WRC Report 1489/1/06, Section 4.1; Water Research Commission: Pretoria, South Africa, 2007. [Google Scholar]
  34. Schaap, M.G.; Leij, F.J.; Van Genuchten, M.T. Rosetta, a computer program for estimating soil hydraulic parameters with hierarchical pedotransfer functions. J. Hydrol. 2001, 251, 163–176. [Google Scholar] [CrossRef]
  35. Van Zijl, G.M.; Van Tol, J.J.; Tinnefeld, M.; Le Roux, P.A.L. A hillslope based digital soil mapping approach, for hydropedological assessments. Geoderma 2019, 354, 113888. [Google Scholar] [CrossRef]
  36. Soil Classification Working Group. Soil Classification: A Taxonomic System for South Africa; Department of Agricultural Development: Pretoria, South Africa, 1991. [Google Scholar]
  37. Van Tol, J.J.; Le Roux, P.A.L. Hydropedological grouping of South African soil forms. S. Afr. J. Plant. Soil. 2019, 36, 233–235. [Google Scholar] [CrossRef]
  38. Kempen, B.; Brus, D.J.; Heuvelink, G.B.M.; Stoorvogel, J.J. Updating the 1: 50,000 Dutch soil map using legacy soil data: A multinomial logistic regression approach. Geoderma 2009, 151, 311–326. [Google Scholar] [CrossRef]
  39. Tinnefeld, M.; Le Roux, P.A.L.; Job, N.; Van Zijl, G.M.; Van Tol, J.J.; Lorentz, S.A. Research Report on the Hydropedology of Part of the Halfway House Granite Dome; Department of Infrastructure and Environment, City of Johannesburg Metropolitan Council: Johannesburg, South Africa; University of the Free State, Institute of Groundwater Studies: Bloemfontein, South Africa, 2017. [Google Scholar]
  40. DSA. Cosmo City Hydropedological Report; Report prepared for Johannesburg Roads Agency (JRA); Digital Soils Africa; DSA: Port Elizabeth, South Africa, 2019. [Google Scholar]
  41. ORNL; DAAC. MODIS and VIIRS Land Products Global Subsetting and Visualization Tool. ORNL DAAC, Oak Ridge, Tennessee, USA. Subset obtained for MOD16A2 Product at 25.9549S,27.9639E, Time Period: 2002-01-01 to 2010-12-27, and Subset Size: 60.5 × 60.5 km. Available online: https://doi.org/10.3334/ORNLDAAC/1379 (accessed on 2 April 2020).
  42. Running, Q.M. MOD16A2 MODIS/Terra Net Evapotranspiration 8-Day L4 Global 500m SIN Grid V006. NASA EOSDIS Land Processes DAAC. 2017. Available online: https://doi.org/10.5067/MODIS/MOD16A2.00 (accessed on 2 April 2020).
  43. Gupta, H.V.; Kling, H.; Yilmaz, K.K.; Martinez, G.F. Decomposition of the mean squared error and NSE performance criteria: Implications for improving hydrological modelling. J. Hydrol. 2009, 377, 80–91. [Google Scholar] [CrossRef] [Green Version]
  44. Knoben, W.J.M.; Freer, J.E.; Woods, R.A. Technical note: Inherent benchmark or not? Comparing Nash-Sutcliffe and Kling-Gupta efficiency scores. Hydrol. Earth Sys. Sci. 2019, 23, 4323–4331. [Google Scholar] [CrossRef] [Green Version]
  45. Abbaspour, K.C.; Rouholahnejad, E.; Vaghefi, S.; Srinivasan, R.; Yang, H.; Kløve, B. A continental-scale hydrology and water quality model for Europe: Calibration and uncertainty of a high-resolution large-scale SWAT model. J. Hydrol 2015, 524, 733–752. [Google Scholar] [CrossRef] [Green Version]
  46. Ramoelo, A.; Majozi, N.; Mathieu, R.; Jovanovic, N.; Nickless, A.; Dzikiti, S. Validation of global evapotranspiration product (MOD16) using flux tower data in the African Savanna, South Africa. Remote Sens. 2014, 6, 7406–7423. [Google Scholar] [CrossRef] [Green Version]
  47. Van der Waals, J.H. Hydropedology Wetland Impact Assessment and Management Report; Proposed Linksfield Development Site; Terrasoil: Gauteng Province, South Africa, 2014. [Google Scholar]
  48. Van Tol, J.J.; Lorentz, S.A.; van Zijl, G.M.; Le Roux, P.A.L. The contribution of hydropedological assessments to the availability and sustainable water, for all (SDG#6). In Soil and Sustainable Development Goals; Lal, R., Horn, R., Kosaki, T., Eds.; Catena-Schweizerbart: Stuttgart, Germany, 2018; pp. 102–117. [Google Scholar]
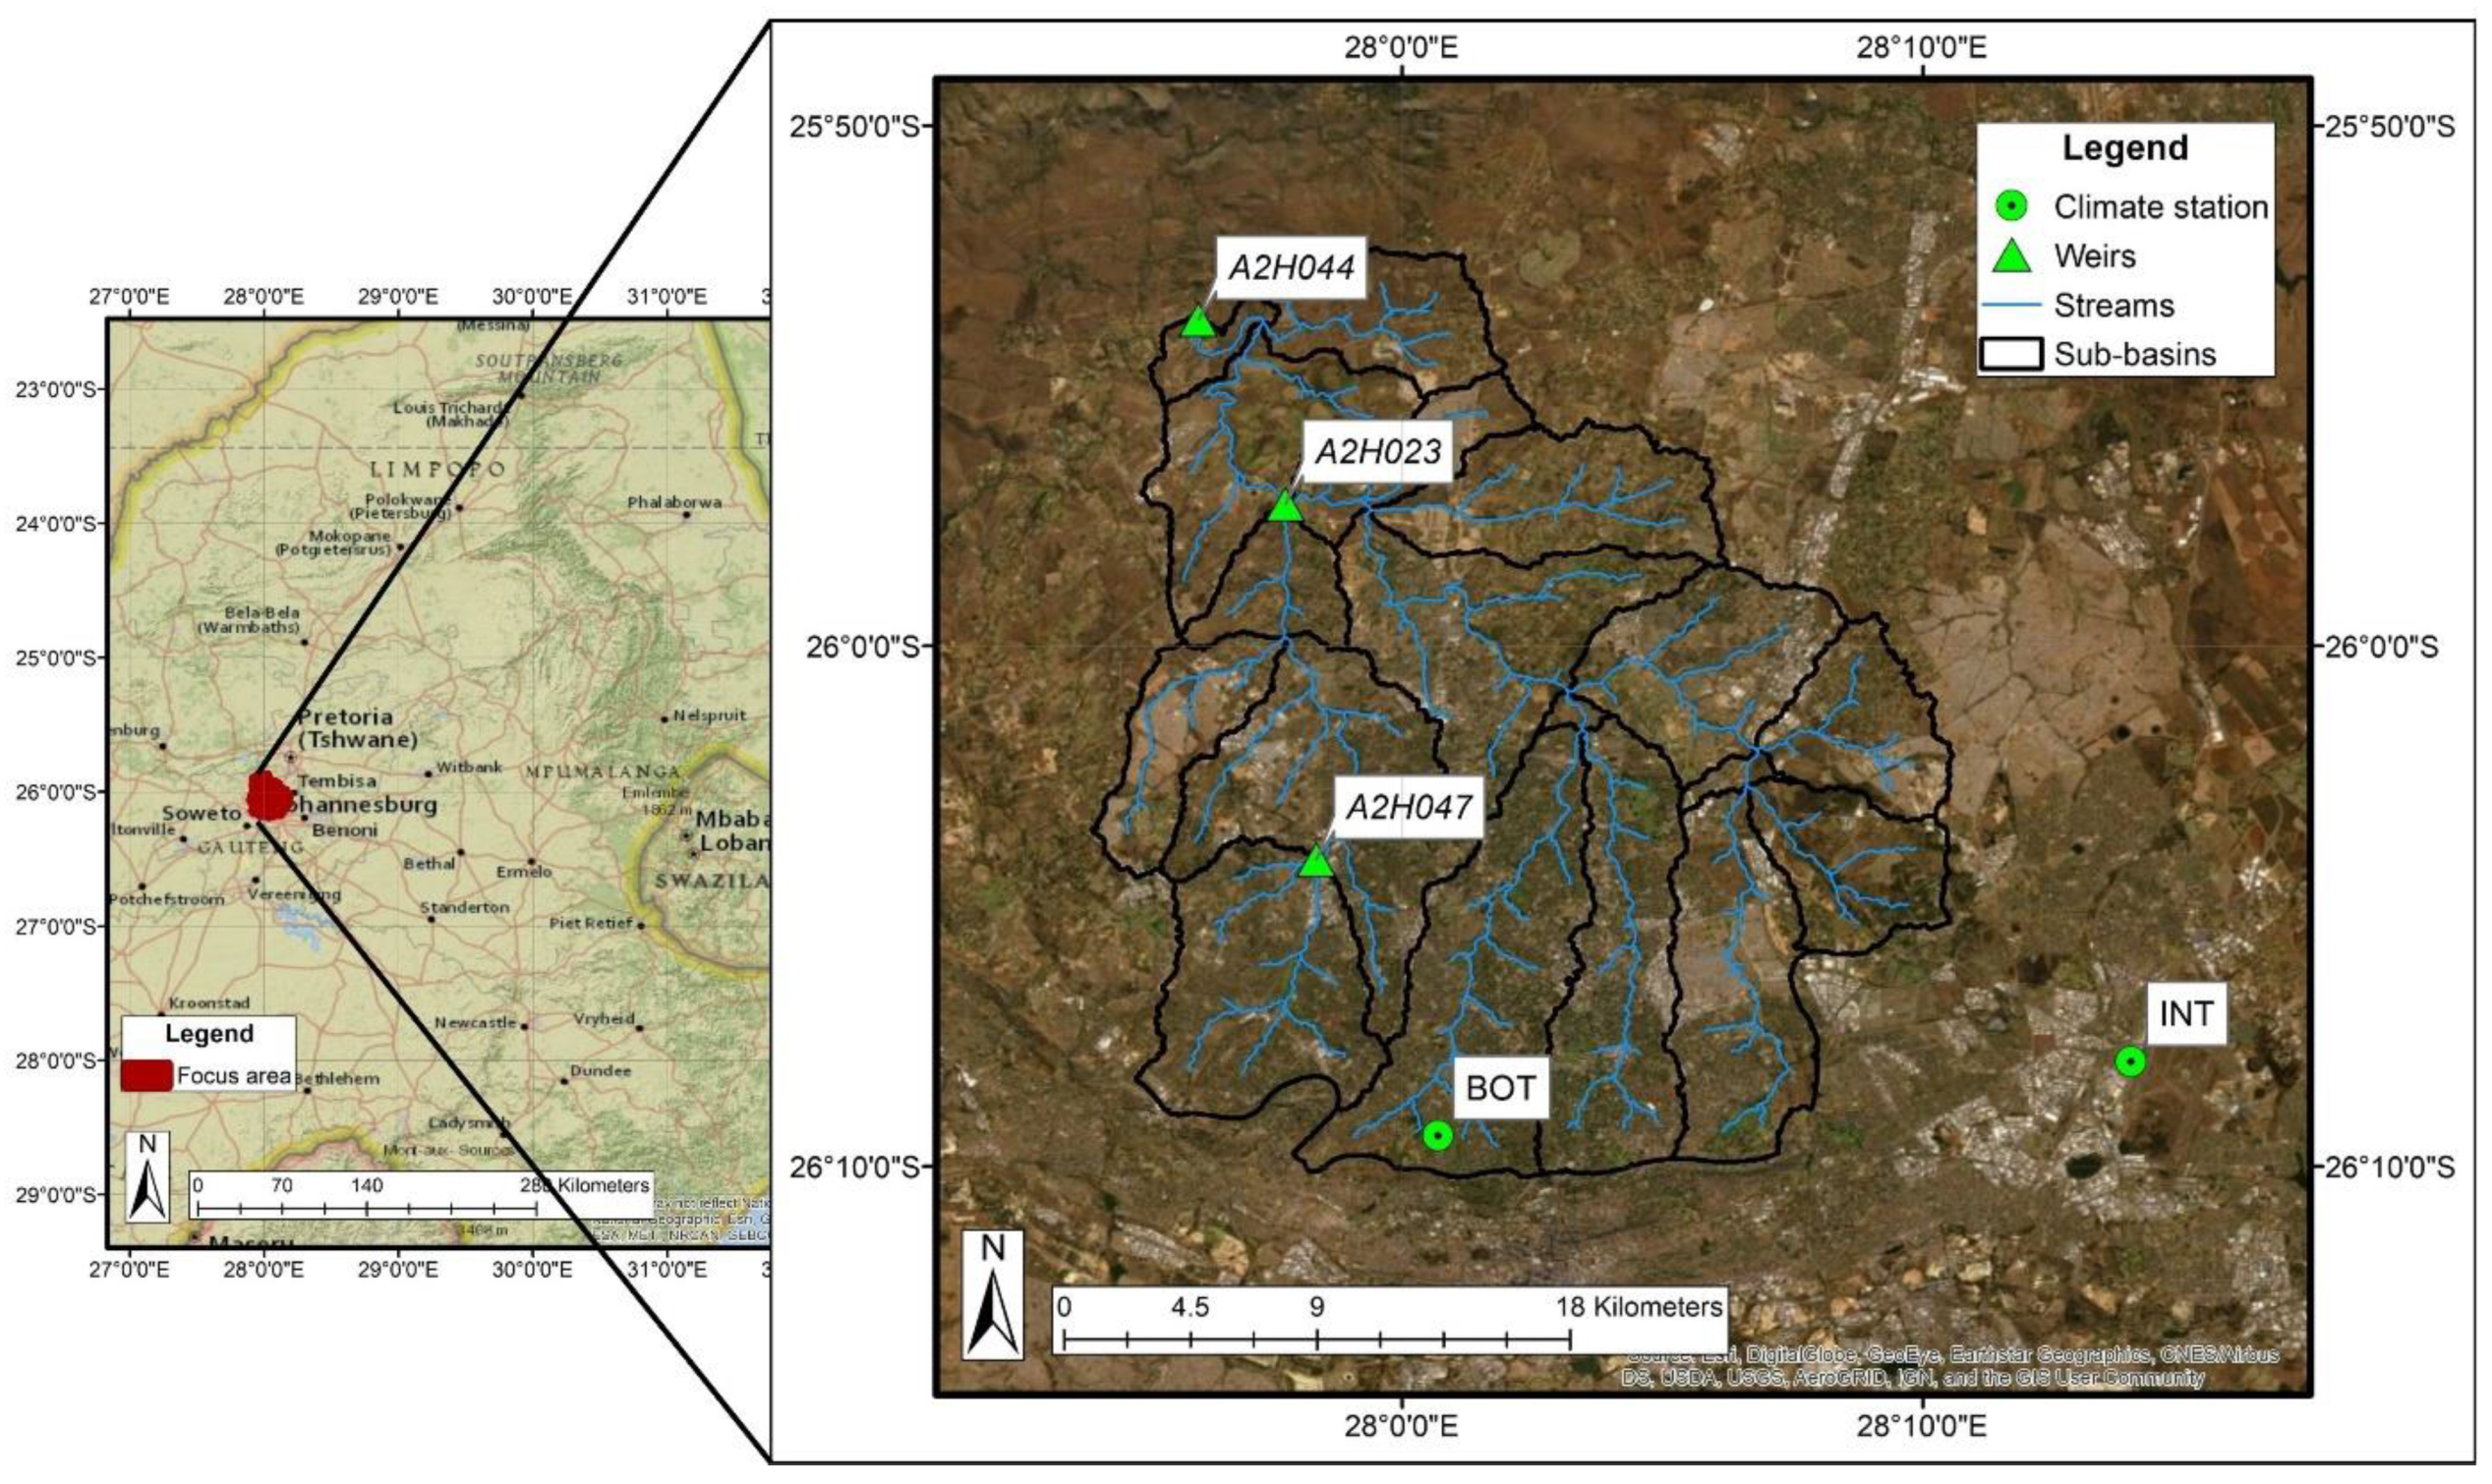
Figure 1. The study area with sub-basins, weirs and climate stations. The City of Johannesburg is located in the south with the capital city of South Africa, Pretoria, in the north.
Hydrology 07 00034 g001
Figure 2. (a) Elevation of the study catchment with streams and Department of Water Affairs (DWA) weirs; (b) dominant land-use in the study area as modified from the National Land Cover Map 2013–2014 [29].
Hydrology 07 00034 g002
Figure 3. Different levels of soil information used in the study: (a) land type information (LT) obtained from the [31] and (b) Digital Soil Map (DSM) data, produced by [17,35], together with locations of representative profiles used to derive hydraulic properties of the soil types.
Hydrology 07 00034 g003
Figure 4. Simulated streamflow for the LT and DSM model runs compared to observed streamflow at the (a) A2H044, (b) A2H023 and (c) A2H047 weirs, respectively, together with (d) the rainfall during the validation.
Hydrology 07 00034 g004
Figure 5. Monthly aET derived from MOD16 against simulated aET using (a) the LT soil dataset and (b) the DSM dataset for the entire basin.
Hydrology 07 00034 g005
Figure 6. Simulated lateral flow (mm.year−1) at landscape unit scale for the (a) LT and (b) DSM simulations.
Hydrology 07 00034 g006
Table 1. Selected hydraulic properties of the soil horizons in different soil information datasets.
LevelSoil GroupHydro-GroupHorizonDepthDb 1AWC 2Ks 3OC 4ClaySiltSand
mmg.cm−3mm.mm−1mm.h−1%
Land Type (LT)Bb1BA3001.40.0916.21.515.010.075.0
B6601.50.096.90.520.010.070.0
Bb2BA3001.50.8811.91.518.010.073.0
B7901.60.687.30.523.010.069.0
Digital soil mapping(DSM)Recharge (deep)AA3001.40.09218.51.221.611.167.6
B12001.30.09172.00.829.713.257.2
C15001.40.0856.90.427.115.757.6
Recharge (shallow)AA3001.40.12218.51.621.611.167.6
Interflow (A/B)CA3001.40.06112.51.821.611.167.6
E6001.30.0987.50.629.114.756.6
B12001.40.082.00.546.214.239.7
Interflow (soil/bedrock)BA3001.40.13218.51.821.611.167.6
B8001.30.07172.00.829.114.756.6
C10001.50.0615.00.446.214.239.7
R15001.80.060.10.046.214.239.7
Responsive (wet)DA3001.40.0610.22.121.611.167.6
G10001.20.075.00.952.819.627.6
G213001.60.060.10.452.819.627.6
Responsive (shallow)CA3001.40.1310.21.821.611.167.6
R5001.80.071.00.046.214.239.7
1 Db–bulk density; 2 AWC–Available Water Capacity; 3 Ks–saturated hydraulic conductivity; 4 OC–organic carbon.
Table 2. Hydropedological soil types used in the DSM data, their dominant characteristics and similar WRB, IUSS reference groups.
Hydropedological Soil Type [37]Soil Forms [36]Reference Groups [32]Defining Characteristic
Recharge (deep)Clovelly, Constantia, Griffen, Hutton, ShortlandsAcrisols, NitisolsSoil profiles showing no signs of wetness in the profile; fast vertical drainage through and out of the profile is dominant.
Recharge (shallow)Mispah, Glenrosa, MayoLeptosolsShallow soils with chromic colours in the topsoil; underlying bedrock is permeable and drainage out of profile dominant.
Interflow (A/B)Kroonstad, Longlands, Sterkspruit, WasbankStagnosols, Planosols, PlinthosolsHydromorphic properties between top and subsoil signify periodic saturation. These are typically duplex soils with textural discontinuity between top and subsoil, resulting in a perched water table at A/B horizon interface and interflow.
Interflow (soil/bedrock)Avalon, Bainsvlei, Bloemdal, Dresden, Fernwood, Glencoe, Pinedene, Tukulu, WestleighAcrisols, Stagnosols, Arenosols, Plinthosols, Stagnosols, Hydromorphic properties at the soil/bedrock interface indicate saturation due to relatively impermeable bedrock. Perched water table at the bedrock interface will result in interflow at soil/bedrock interface.
Responsive (wet)Katspruit, RensburgGleysolsGleyed subsoils indicate long periods of saturation, typical of wetland soils. Soils will respond quickly to rain events and promote overland flow due to saturation excess.
Responsive (shallow)Mispah, GlenrosaLeptosolsShallow soils with bleached colours in the topsoil indicate that underlying bedrock is slowly permeable. Small storage capacity of the soil will quickly be exceeded following rainstorms and promote overland flow generation.
Table 3. Average yearly major water balance components for different simulations for the three studied catchments.
WeirA2H044 (630 km2)A2H023 (547 km2)A2H047 (54 km2)
Annual Average Values (mm)ObservedDSMLTObservedDSMLTObservedDSMLT
Precipitation635635635 638638 616616
Total discharge350216292367218302262214341
Overland flow 59255 61265 72318
Lateral flow 15637 15637 14223
Percolation 1016 1015 1011
aET7231407326 409319 391263
pET 17961796 17961796 18001800
1 MOD16-derived aET for observed.