Article

Regional Climatological Drought: An Assessment Using High-Resolution Data

1
Department of Civil and Environmental Engineering, Southern Illinois University, 1230 Lincoln Drive, Carbondale, IL 62901-6603, USA
2
AECOM, 2380 McGee St Suite 200, Kansas City, MO 64108, USA
3
Department of Civil Engineering, California State Polytechnic University Pomona, 3801 W. Temple Ave., Pomona, CA 91768, USA
4
Louis Berger U.S. Inc., A WSP Company, 300 S. 4th Street, Suite 1200, Las Vegas, NV 89101, USA
*
Author to whom correspondence should be addressed.
Hydrology 2020, 7(2), 33; https://doi.org/10.3390/hydrology7020033
Submission received: 12 May 2020 / Revised: 4 June 2020 / Accepted: 10 June 2020 / Published: 12 June 2020

Abstract

:
Regional assessments of droughts are limited, and meticulous assessments over larger spatial scales are generally not substantial. Understanding drought variability on a regional scale is crucial for enhancing the resiliency and adaptive ability of water supply and distribution systems. Moreover, it can be essential for appraising the dynamics and projection of droughts based on regional climate across various spatial and temporal scales. This work focuses on drought analysis using a high-resolution dataset for three drought-prone regions of India between 1950 and 2016. This study also uses monthly values of the self-calibrating Palmer Drought Severity Index (scPDSI), incorporating Penman–Monteith approximation, which is physically based on potential evapotranspiration. Climate data are statistically downscaled and formulated to form a timeline for characterizing major drought events. The downscaled climate data hold a good statistical agreement with station data with correlation coefficients (R) ranging from 0.91 to 0.96. Drought analysis indicates and identifies several major incidences over the analysis time period considered in this work, which truly adheres to the droughts recorded in reports of various literatures for those regions.

1. Introduction

Drought is difficult to predict, yet frequently occurring, climatic hazard whose duration directly impacts food security, water availability, and other sectors related to water [1,2]. Droughts can induce the scarcity of both surface and subsurface water resources, resulting in problems related to water supply, water quality, agriculture, ecosystem, and economy [3]. Decreases in precipitation and increases in temperature cause a rise in atmospheric moisture demand that is often associated with drought. This connection is exacerbated by climate change and global warming in recent years [4,5]. Based on the Stocker et al. [6] report, there can be a 10–13% decrease in mean annual rainfall-runoff in the semi-arid areas below mid-latitudes in the future, further increasing the chances of drought. Similarly, drought characteristics such as intensity, severity, and duration are expected to increase in the future [7,8]. The number of drought events increased globally under recent climate changes, as documented in a plethora of regional studies across the world [9,10,11,12]. Increases in drought frequency and severity can be attributed to natural variability as well as the anthropogenic forcing, which is consistent with the predicted output of various models [13,14]. Moreover, the projections of Climate Model Intercomparsion Project Phase 3 (CMIP3) and CMIP5 models show an increase in worldwide aridity by the end of the 21st century due to the increase in greenhouse gases associated with a significant drop in precipitation in the tropics and subtropics [14,15,16].
The problems related to drought in India have been recurring for decades. Approximately 56% of the total land area of India was affected by drought in 2002, reducing the gross domestic product (GDP) by 3.1% [17]. Effects of short- and long-term droughts have been seen in the food and energy nexus [18]. Droughts in places such as Uttar Pradesh, Maharashtra, Rajasthan, Kolkata, Punjab have been occurring more frequently in recent years [19]. Mishra et al. and Nath et al. [20,21] both observed that the intensity of drought due to climate change is extreme in subtropical regions like India. Rainfall in India is seasonal, with 80% of the total annual rainfall occurring during summer monsoon months from June to September [22]. Drought in India is mostly due to lower monsoon rainfall depths along with the untimely onset of monsoon. The changing trend of precipitation over various monsoon-dominated regions in India is attributed to either regional environmental changes or global warming [23]. In most cases, the changes in precipitation are due to global warming [24]. Therefore, taking into account precipitation only is not fundamental to characterizing drought events; it is important to consider the profound role of surface temperature as well [25,26]. A study conducted by Fischer et al. [27] in Europe showed that the rise in extreme temperature caused excess evaporation, which led to water stress and crop production decline.
Quantification of water availability is important for the present and future [28,29,30,31]. Katiraje-Boroujerdy et al. [32] observed that drought monitoring is an important step to lessen the impacts of drought and formulate a standard practice of drought risk management. A few developed nations have advanced drought monitoring systems but most of the developing countries in South Asia do not have enough technical resources to own an advanced system [33]. All around the world, there exist various large-scale drought monitoring systems such as the Global Drought Portal, the Standardized Precipitation Evapotranspiration Index Global Drought Monitor, and the Global Integrated Drought Monitoring and Prediction System [34,35,36]. In North America, various high-resolution monthly datasets of temperature and precipitation exist. Examples include the Parameter-elevation Regressions on Independent Slopes Model (PRISM) [37] at a spatial resolution of 30-arcseconds and the Daymet dataset [38]. The highest resolution dataset for continents other than North America is 10-arcminutes.
Most of the regional drought monitoring systems and regional analysis depends upon the ground-based observations [39,40,41]. However, the major drawbacks of ground-based observations such as missing data, sparse stations, and irregular spatial distribution of the stations, make them an unreliable source of climate information, leading to the inhomogeneity of the datasets. Furthermore, the density of weather stations available in a region is often not enough for interpolations at higher resolutions. The use of high-resolution gridded climate datasets, that provide information for every grid of defined size across a landscape, is essential to study climate influenced processes [42]. In the case of India, an experimental drought monitoring system exists but with a low spatial resolution of 0.25° (https://sites.google.com/a/iitgn.ac.in/india_drought_monitor/home) [43]. Research conducted at small scales with low-resolution data failed to exhibit the local climate effects [44,45]. Climate data at high resolution serve the research of physical phenomena at the regional scale encompassing the local hydroclimatic behaviors. To achieve this, computationally efficient downscaling procedures assist in quantifying the regional impacts of climate phenomena [46]. Hence, the method of efficiently downscaling data to obtain a higher resolution data can support better drought prediction and management.
There are various methods available for downscaling the climate datasets to a favorable spatial resolution. Among them, the delta method of downscaling requires a considerably lower-resolution monthly climate input and a physically representative high-resolution climatology over a landscape as inputs [47]. The sole purpose of using this method of downscaling is to take into account the effects of topographic variability or possible orographic effects depending upon the study area. The delta method is a computationally efficient and less resource-intensive approach to downscaling data. Compared to other methods, such as the bias correction and spatial disaggregation approach (BCSD) and the bias-corrected constructed analogs (BCCA) [46,48], the delta method does not require lengthy climate data. The application of the bias-corrected constructed analogs method to downscale the data is often a more suitable and ideal option due to its easier statistical approach. However, the constructed analogs (CA) method required as a part of downscaling becomes tedious because of its requirement for high-resolution historical records. Moreover, the delta method requires only high-resolution climatology, unlike other methods that further enhance its efficiency. A skillful downscaling of temperature and precipitation at finer scales for regional analysis of drought is important for regional studies.
Studies concerning drought analysis in Indian regions generally have lacked hydroclimatic datasets at finer spatial scales. The pertinent spatial resolution of the datasets characterizing the underlying climatic phenomenon and resembling the exact topographical conditions determines the relevancy of the drought analysis. Currently, there have not been enough studies at a finer spatial resolution to characterize the spatial variations in drought linked to different topographical features. Naresh et al. [49] analyzed the drought variability in India at a scale of 1° × 1° and identified the trend of drought and its frequency. The author also contended that the study could have been more versatile if it had been carried out with the drought products of higher spatial resolution. A drought monitoring system was established by Aadhar and Mishra [50] for South Asia at the spatial resolution of 0.05° ≈ 5 km using agriculture-based drought indicators. Furthermore, past drought studies are mostly dependent on the changes in precipitation. Previous studies have used drought indices relevant to changes in precipitation at coarser resolution irrespective of changes in temperature to avoid computational complications [51,52,53]. Moreover, the drought studies undergone in India are based on precipitation data at coarser resolution and at larger scales, limiting the opportunity to study the onset of drought at a regional scale [49,54].
Due to climate change, drought has become more frequent in different regions of India, observed through untimely monsoons, declines in precipitation, and increases in temperature. However, the existing literatures do not put significant effort into evaluating fine resolution drought monitoring indices at regional scales. The current study features the use of delta downscaling method-based analysis of drought at a regional scale using a high resolution gridded climatic drought index, the self-calibrating Palmer Drought Severity Index (scPDSI). The high-resolution climate data are used to analyze the drought in three different regions in India. The necessity of understanding historic drought at regional scales has driven the current study to test the use of a downscaled climate-based drought indicator. This study adopts the delta downscaling method to downscale coarse resolution climate data to a target resolution of 1 km. The downscaling is carried out for the time range from 1950 to 2016 and the downscaled climate data are computed to generate time series and spatial distribution of scPDSI values. The downscaled climate data are compared with station values to assess the performance of the method. The key research questions answered by the current study are as follows:
(1)
Does the adopted downscaling method show satisfactory performance?
(2)
How well do the downscaled climatological data depict spatial variability on drought study?

2. Study Area

The proposed study adopted three areas within India which vary by geographical setting and climate. A short description of all the study areas is given below.

2.1. Araveli Region (AV)

Araveli region, which is a hilly region situated in Rajasthan, India, lies in the western half of the country, as shown in Figure 1a. It is characterized by mountain ranges that run northeast to southwest, approximately 700 km long, and covering around 40,000 km2 of the area. This region shows a dry climate mostly throughout the year except for the rainy season and shows a semi-arid climate. From June to September, the monsoon winds bring precipitation to the study area, but it is not regular and it has limited impact. The average annual precipitation is approximately 674 mm. The agriculture, availability of water resources, and vegetation is monsoon dominated. Due to varied elevational and geological constraints throughout the region, the aquifer situation and water resources vary greatly across the area. The main crop, which is also known as the monsoon crop, is cultivated from June to September. Mid-October and March are the times for sowing and harvesting the crops, respectively. Agriculture is highly dependent on the availability of irrigation water during the months of March until May, when summer crops are cultivated. Mining around the Araveli range provides vital minerals of Quartzite, Silica, sand, and other construction materials. Activities related to mining provide the opportunity to earn the livelihood in a place where a population of around 12.5 million resides, based on census 2011 issued by the government of India. The human development index (HDI) of the state in which the study area is located is 0.63.

2.2. Bundelkhand Region

The Bundelkhand (BK) region is composed of two bigger states of India, Madhya Pradesh and Uttar Pradesh. It lies between 23°08′ N and 26°30′ N latitude and 78°11′ E and 81°30′ E longitude, as shown in Figure 1b. The total area of the study area is 71,619 km2. The region experiences a drier humid climate, including the rainy season from June to September. The majority of the population (82%) out of 18.3 million relies on agriculture, which is mostly rain-fed. Several rivers flow through the study area, such as the Tons, Sindh, Bhetwa, Pahuj, and Chambal. Highly uneven land surface with rugged terrain governs the topography of the study area. The major agricultural products are wheat and soybeans, which are mostly cultivated during the monsoon and summer seasons. Cereals are the major product, while sugarcane and pulses also contribute to annual agricultural production. The average annual precipitation varies from 800 to 1000 mm. The region is known to be one of the backward regions of the country and the agricultural activities have a low capital base with poor application of technology due to economic limitations. The HDI of states in which the region is located averages 0.6.

2.3. Kansabati Region

The Kansabati (KSB) region is a part of a river basin that lies within the watershed of the dam outlet. Figure 1c shows the spatial location of the KSB region considered in this study. The study area lies in the extreme western part of West Bengal. It stretches between 72°16′ E and 74°28′ E longitudes and 73°19 N and 74°16′ N latitude. The area in consideration for this study is 6404 km2. During the months of May to June, which are summer months, the study area faces a temperature of up to 45 °C. Higher temperatures lead to increased evaporative demand, which directly influences the agriculture sector. The increased temperature also affects the water resources, leading to a passive struggle for water supply. Recent data place the average annual precipitation in the area at 1268 mm. Irrigation facilities are well placed due to the operation of the Kansabati dam constructed at the confluence of three rivers, namely the Kansai, Tongo, and Kumari. Major productions in this region are wheat, pulses, maize, and paddy. The overall state of West Bengal is well known for its touristic attractions, with most of the districts falling under urban regions. The population in Kansabati Region is 11.5 million, while HDI of the state of West Bengal is 0.641, which is among the average values throughout the country.

3. Data and Methodology

3.1. Data

Various climate products are used to obtain the downscaled high-resolution gridded drought dataset. Table 1 provides details of the datasets. Each gridded dataset with different spatial resolutions is abstracted from different global satellite-based products. The downscaled products are used to calculate the potential evapotranspiration (PET) and Self-calibrating Palmer Drought Severity Index (scPDSI), from downscaled temperature and precipitation. In order to calculate the PET, the statistically downscaled monthly averages of temperature for the period of 1950 to 2016 were used. The Berkeley Earth Surface Temperature (BEST) dataset, along with other temperature datasets such as Worldclim2 and India Meteorological Department (IMD) observations, were used to obtain the downscaled temperature and further validate the statistically downscaled product. Other required products such as wind speed and cloud cover data, each vital for the calculation of PET, were obtained from the National Centers for Environmental Prediction (NCEP) and National Center for Atmospheric Research (NCAR). The BEST data were utilized for downscaling temperature data and the reliance of which was justified by its availability of land weather stations in the selected study areas. Utilizing the BEST product is advantageous as the data are well maintained and incorporate robust methods to keep them updated. More advantages of the dataset can be found in Rohde et al. [55].
The monthly precipitation data were procured from the Global Precipitation Climatology Centre (GPCC) version 7. GPCC V7 is generated from 75,000 quality-maintained rain gauges spread across the world. Furthermore, the GPCC V7 dataset is updated regularly, compared with other datasets. Due to the consistency of scPDSI values obtained using GPCC data with metrics such as runoff and soil moisture, it is believed that GPCC data are a reliable precipitation dataset [56]. Along with it, Climate Hazards Group Infrared Precipitation with Station data (CHIRPS) were also procured. The statistical downscaling procedure for both the temperature and precipitation anomalies are similar in many ways but differ to some extent during bias correction, which is done using the appropriate dataset, varying according to the suitability of the dataset for the study area.

3.2. Methodology

3.2.1. Downscaling with Bias Correction

The climate datasets concerning the study areas were downscaled to a spatial scale of 1 km. The aim was to compute suitable drought datasets which could help to present the local drought situations at smaller spatial coverage rather than a grid cell covering a large portion of the whole study area. Therefore, a series of methods were applied to produce downscaled temperature and precipitation products for the entire study period. Downscaling was carried out because the variability in the physical conditions of the study areas makes it irrelevant to use the native scales of the datasets used in this work. Hence, giving due consideration to the physical and hydrometeorological conditions to best represent the drought events, statistical methods were used to downscale datasets to finer spatial resolutions.
At first, the bilinear interpolation technique was applied to BEST to produce a finer scale (1 km × 1 km) temperature dataset. Bilinear interpolation computes the values for individual grids depending on the arithmetic average of four neighboring grids. The weightage for each of the neighboring grids is applied based on the distance of the nearest grids, confirming smooth grids after interpolation. In order to avoid problems in replicating the physically varying climate in regional analysis after bilinear interpolation, the bias correction was necessary. This study used the approach followed by Leander and Buishand [57] to obtain the seasonal variation adjusted temperature values and to match the annual variability of Worldclim2 temperature. Temperature anomalies were calculated with respect to 1950–2000 climatology, similar to Worldclim2. After bias correcting the anomalies, according to Equation (1), the anomalies were converted into the absolute values before further proceedings. The conversion was carried out by adding the monthly average of temperature values from 1950–2000 to the anomalies. Equation (1) is based upon the correction of the uncorrected temperature using the standard deviation in monthly mean temperature relative to its annual mean.
T c o r r = T ¯ r a w + [ σ ( T o b s ) σ ( T r a w ) ] ( T T ¯ r a w )
T c o r r and T ¯ r a w represent corrected and annual average uncorrected BEST temperature, respectively. Similarly, σ ( T o b s ) is the standard deviation of Worldclim2 climatology, σ ( T r a w ) is the yearly standard deviation of the uncorrected BEST temperature, and T is the uncorrected BEST monthly temperature. Figure 2 shows the process followed in this approach.
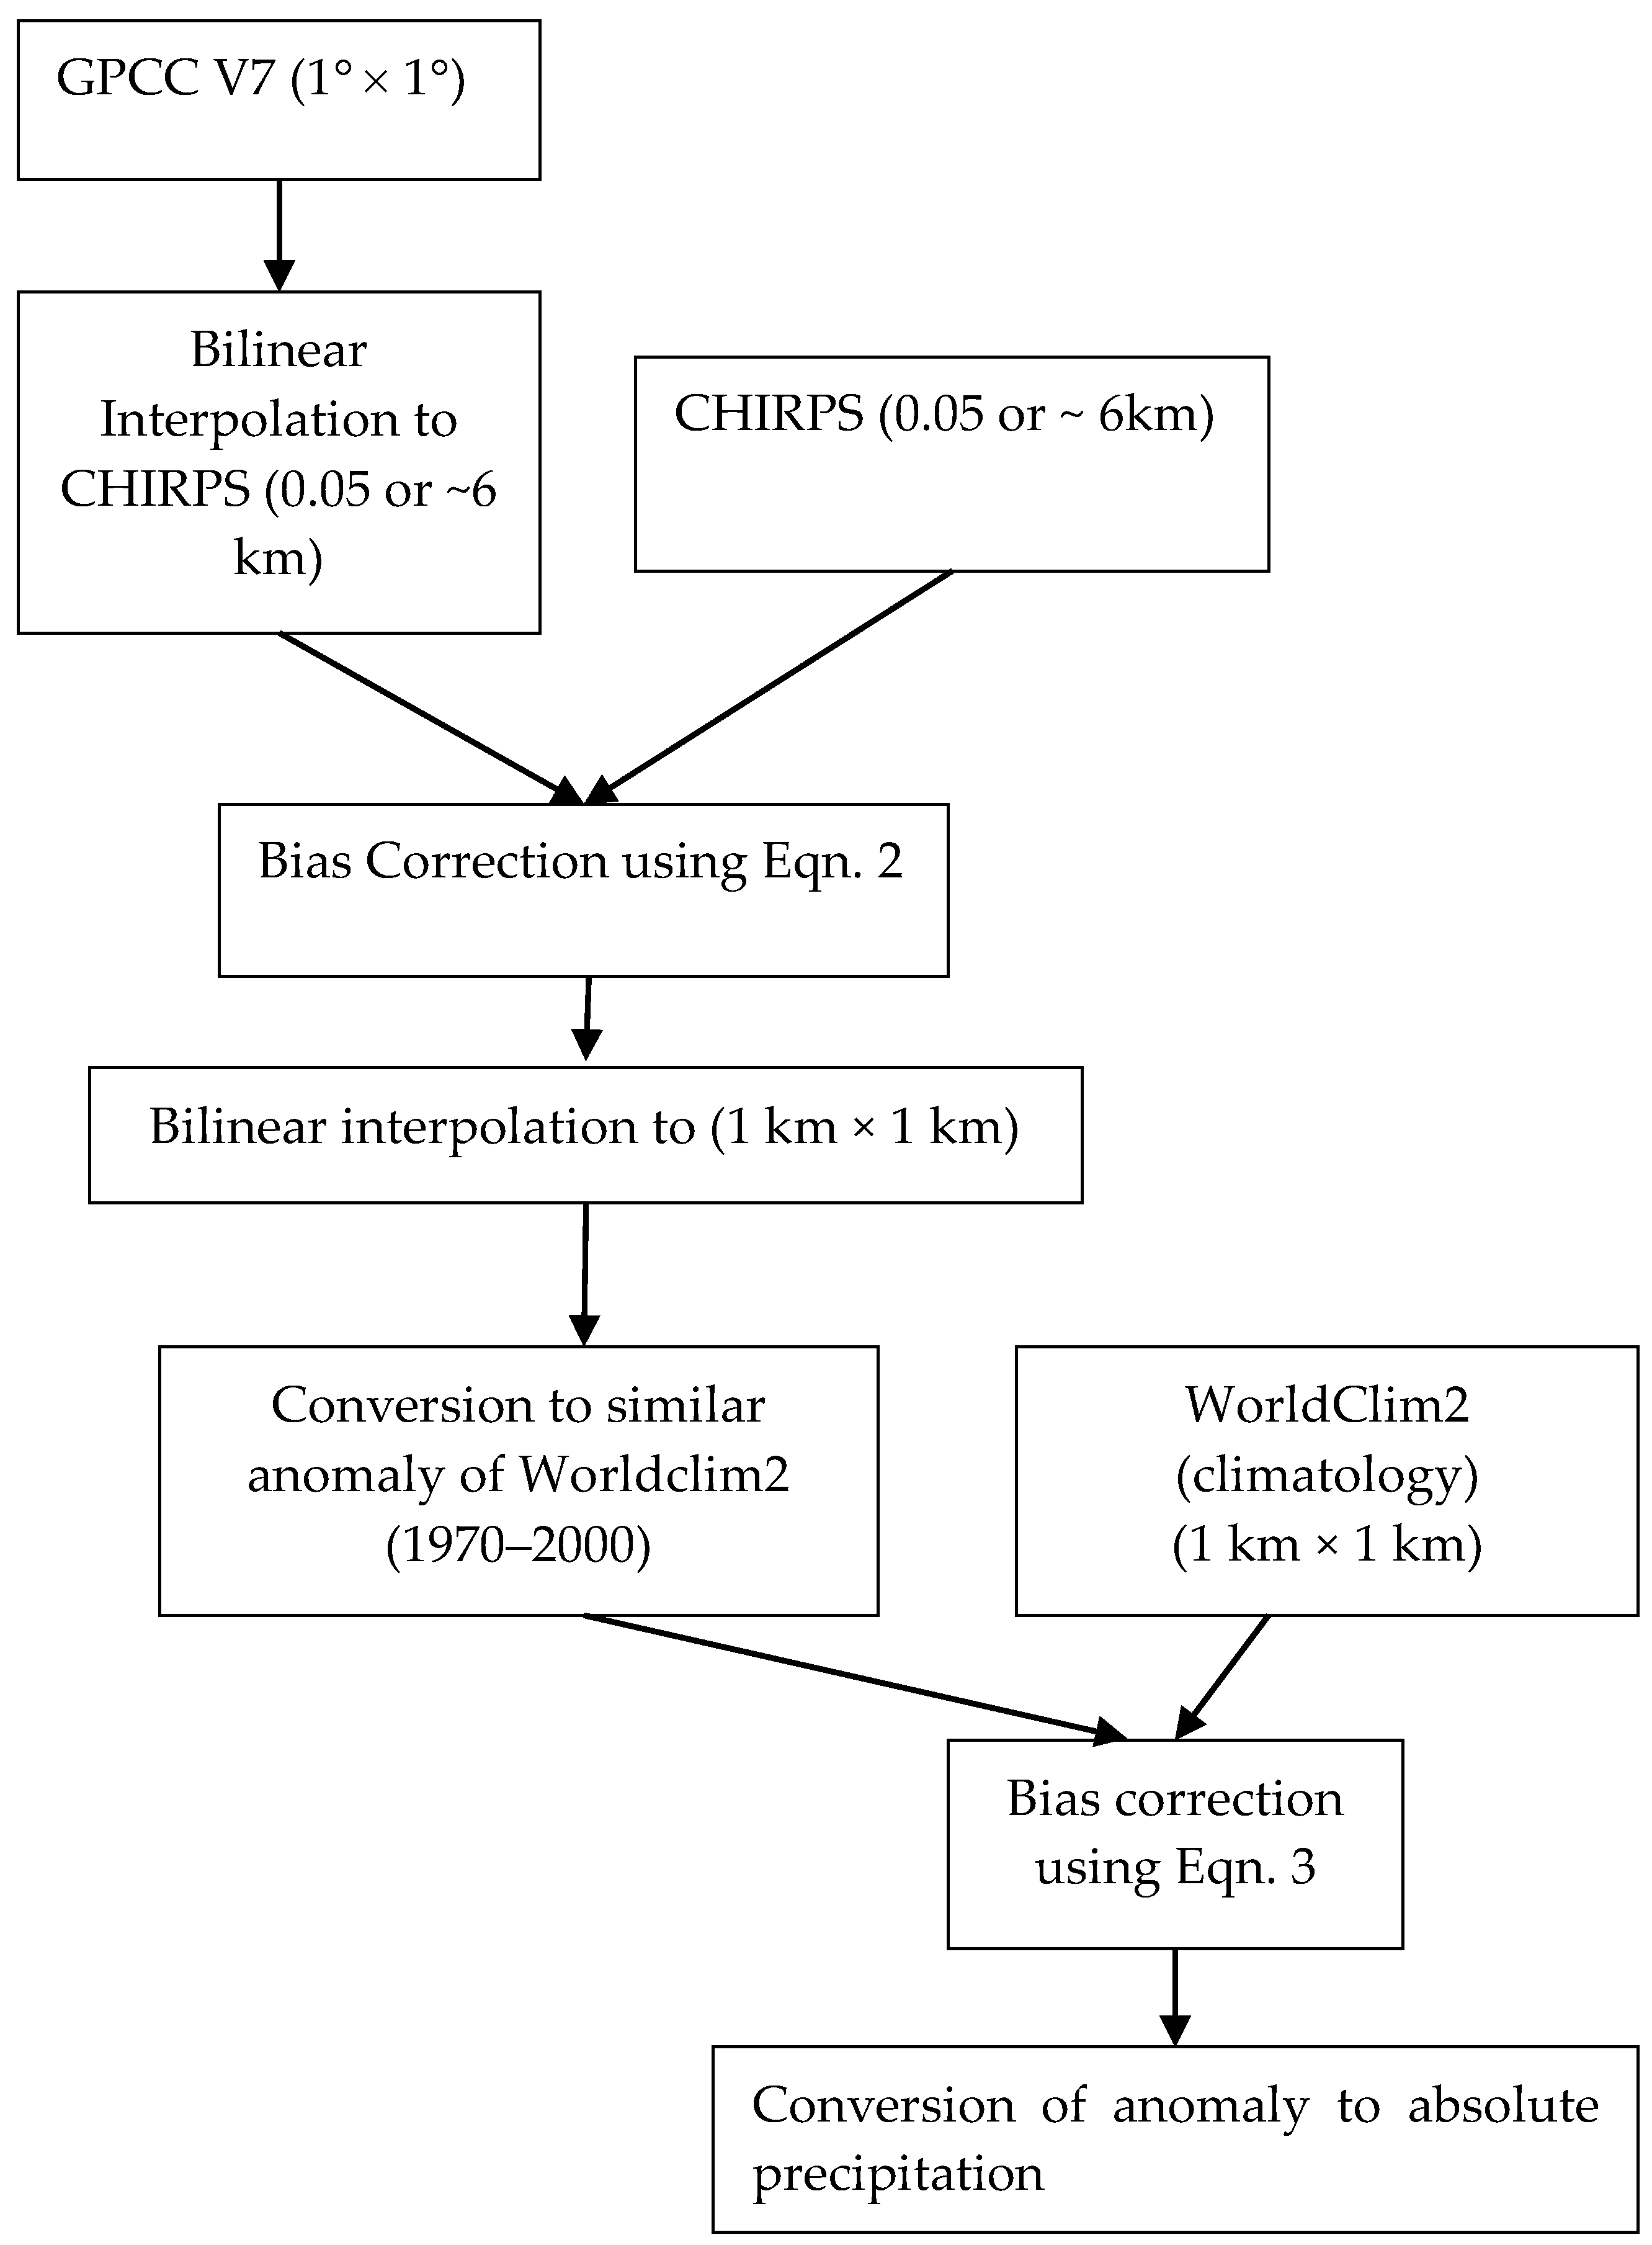
The yearly variation in the precipitation was found to be higher than that of temperature. Assuming the coefficient of variation remains the same throughout the study period would be an ill representation of scPDSI values, since the water balance would be compromised. Therefore, two steps of bias corrections were used for the precipitation. At first, GPCC v7 precipitation dataset was re-gridded to CHIRPS (0.05 or ~6 km) datasets with bilinear interpolation. Then, the quantile mapping approach was applied to match the statistics such as the mean and variances of both datasets. Figure 3 shows the process followed to downscale the precipitation data.
Panofsky and Brier [58] proposed a method known as quantile mapping and is expressed by Equation (2).
P c o r r , i = F o b s 1 [ F r a w ( P r a w , i ) ]
In Equation (2), i denotes each month, P c o r r , i is corrected precipitation, P r a w , i is uncorrected GPCC precipitation, F o b s 1 is the inverse cumulative distribution function (CDF) from CHIRPS dataset and F r a w is the CDF of the uncorrected precipitation.
After obtaining the corrected precipitation using Equation (2), a similar analysis was performed like that for the temperature data to generate 1 km × 1 km precipitation data. Equation (3) is the modified equation for precipitation.
P c o r r = P ¯ r a w + [ σ ( P o b s ) σ ( P r a w ) ] ( P P ¯ r a w )
In Equation (3), P c o r r is the corrected precipitation, P ¯ r a w is the annual average precipitation of uncorrected GPCC precipitation, σ ( P o b s ) is the standard deviation of Worldclim2 climatology, σ ( P r a w ) is the yearly standard deviation of the uncorrected precipitation, and P is uncorrected monthly precipitation. Figure 3 shows the process followed to downscale the precipitation data.

3.2.2. Evaluation and Validation

It is necessary to validate both the downscaled temperature and precipitation values using the station observation to establish the credibility of the applied methodology. The India Water Portal Meteorological data consisted of temperature (maximum, minimum) and precipitation values starting from 1901 through to 2002. The current study period starts in 1950 due to data collection limitations. Therefore, the validation was done from 1950 to 2002. The validation was done by correlating (Pearson) grid average time series with station average time series in the individual study region for each climate variable. To further evaluate the consistency of the downscaled product against the station observations, the root mean square errors were used to bolster the validity of the downscaled dataset. The statistical results are made easier to interpret in the form of scatter plots and Taylor diagrams.

3.2.3. Potential Evapotranspiration

Evapotranspiration is one of the most important variables governing the magnitude of the drought index. The Penman–Monteith (PM) method for calculating PET is simple and provides more physically realistic results than the Thornthwaite equation. The Thornthwaite equation calculates the PET values using available input data like monthly mean temperatures and latitude. The PM method uses various data, providing an improved estimate of the PET, which Van der Schrier et al. [59] demonstrated as a more physically robust formulation. The PM variant of the PET calculation does not require long-term climate data availability and can perform satisfactorily using fewer input climate fields. The best estimate of a reference crop evapotranspiration, with an accurate measure for PET, is the FAO-endorsed PM parameterization [60,61]. Moreover, using the Thornthwaite equation for warmer climates produces values of PET that are above normal [62]. Allen et al. [63] also implemented the PM formulation for PET. Based on all of the aforementioned advantages of the PM method, it was adopted in the current study for PET evaluation.
The expression for calculating the PET with the PM method is shown below in Equation (4).
P E T = 0.408 Δ   ( R n G ) + γ 900 T + 273.16 U 2 ( e s e a ) Δ + γ ( 1 + 0.34 U 2 )
In this equation, Rn represents the net radiation, T denotes the average temperature measured at 2 m height, G indicates the soil heat flux density, esea is the deficit in vapor pressure, ∆ denotes slope of the vapor pressure curve, U2 represents the wind speed taken at 2 m height, and γ represents the psychrometric constant. Additionally, wind coefficient for a reference crop is taken as 0.34 and the reference crop coefficient as 900 KJ−1kgKday1.
To compute the PET, monthly averages of five climate variables were used, including daily maximum, minimum and mean temperature, wind speed, and cloud cover. The temperature dataset was downscaled as well as bias-corrected, whereas the other variables were obtained after bilinear interpolation to the resolution of 1 km. The temperature values utilized were measured at 2 m height, where U2 represented the wind speed at 2 m height above the ground. The deficit in vapor pressure at 2 m height was obtained from the difference between actual (ea) and saturation (es) vapor pressure. The monthly arithmetic mean of saturated vapor pressure, es, was obtained from the vapor pressure formula presented in Equation (5).
e ( T ) = 0.6108 exp ( 17.27 T T + 237.3 )
In Equation (5), where T is the air temperature, there might be potential bias in saturation vapor pressure due to the nonlinear nature of the equation. The bias in the vapor pressure was controlled by comparing the vapor pressure obtained using the mean temperature and the averaged vapor pressure obtained using maximum and minimum temperatures for each month. The bias in the vapor pressure was ignored when the difference between the vapor pressure was negligible. The actual vapor pressure (ea) was also calculated using the minimum values of temperature due to the lack of reliable humidity data as well as dewpoint temperature, as in Allen et al. [63].

3.2.4. Climate Based Drought Index: Self-Calibrating Palmer Drought Severity Index (scPDSI)

To categorize drought conditions, various drought indices have been developed. The PDSI and its improved versions are among the most popular drought indices used to quantify drought variations. The method quantifies the long-term changes in droughts along with its spatial distribution at both global and regional scales. Developed by Palmer in 1965, the PDSI has some deficiencies including a lack of ability to consider climatic extremes within the calibration period [64]. To overcome these limitations, the self-calibrating Palmer Drought Severity Index was developed by [65] to ensure the climatic variability is comparable over different study areas by fitting the index to match the climatic conditions. The scPDSI makes the use of long-term temperature and precipitation datasets to estimate relative dryness. The index has the advantage of robust characterization of the drought in low and mid-latitudes. Also, scPDSI collectively uses the surface air temperature and water balance model to consider the effect of global warming through PET. Unlike the Standardized Precipitation Evapotranspiration Index (SPEI) and the Standardized Precipitation Index, scPDSI takes the conditions of prior months into consideration. scPDSI is also known to reflect the rapidly developing droughts at monthly scales, which SPEI is limited to. The index also allows quantitative and qualitative comparability across different regions.
The study period of 1950–2000 was used as the calibration period for the scPDSI. Calibration here serves the purpose of scaling the scPDSI values to fit approximately between −4 and +4 (scPDSI extremes). The objective of it is to accommodate the extreme climates within the limits of scPDSI values. The calibration time period was involved to account for the human effect on climate change and to make the drought index values consistent with the Worldclim2 dataset. Along with the calibration period, the soil moisture initial conditions were set to 100% of water content available because scPDSI takes in the properties of soil for the identification of drought. The values were achieved using the scPDSI package available in R.

3.2.5. Past Droughts Events

Major drought events were identified in all the study areas based on the duration and the severity of the drought as denoted by the drought index. This section describes the major droughts within each area considered in this study. The major drought events were identified based on the value of the drought index for an extended period of time. scPDSI values less than −1.5, which indicates the mild drought conditions, lasting 24 months or more were selected to make an in-depth study. The grid averaged scPDSI was used to determine the validity of drought events for in-depth study. The selected mild to severe drought events using the grid averaged scPDSI were further averaged throughout the length of drought event to visualize the average duration of drought situation in each of the study areas.

3.2.6. Drought Frequency and Severity

This study highlights drought events with scPDSI values ≤−1.5 for two consecutive years or more. Within these study areas, it is not feasible to present all of the drought events throughout the study areas from 1950–2016. Therefore, only the droughts having index values less than −1.5 leading to severe (scPDSI ≤−3.0) and extreme (scPDSI ≤ −4.0) drought index values were selected from the pool of events. The index values with their respective severity are summarized in Table 2. The term severity here refers to the seriousness of drought in terms of its long-term physical effects. Additionally, the term intensity, which is similar in manner to severity, is defined as the magnitude of drought in terms of length, the number of dry days, or any metrics that express the strength of drought.
While a longer duration of drought poses bigger problems, drought events lasting less than a year were still observed to be severe enough to disrupt normal conditions and could not be overlooked in this study. Hence, in order to exhibit the droughts of lesser duration and varying severity, the frequency of drought was used to show the recurrence and to give an idea about the susceptibility of a place in terms of its past record of drought. The analysis to select the droughts was carried out by computing the average number of months throughout the study period within a grid cell facing mild to extreme severity in each year. Computing the frequency of droughts in each grid gives the advantage to identify the areas more prone to drought.

4. Results

4.1. Validation of Downscaled Climate Variables

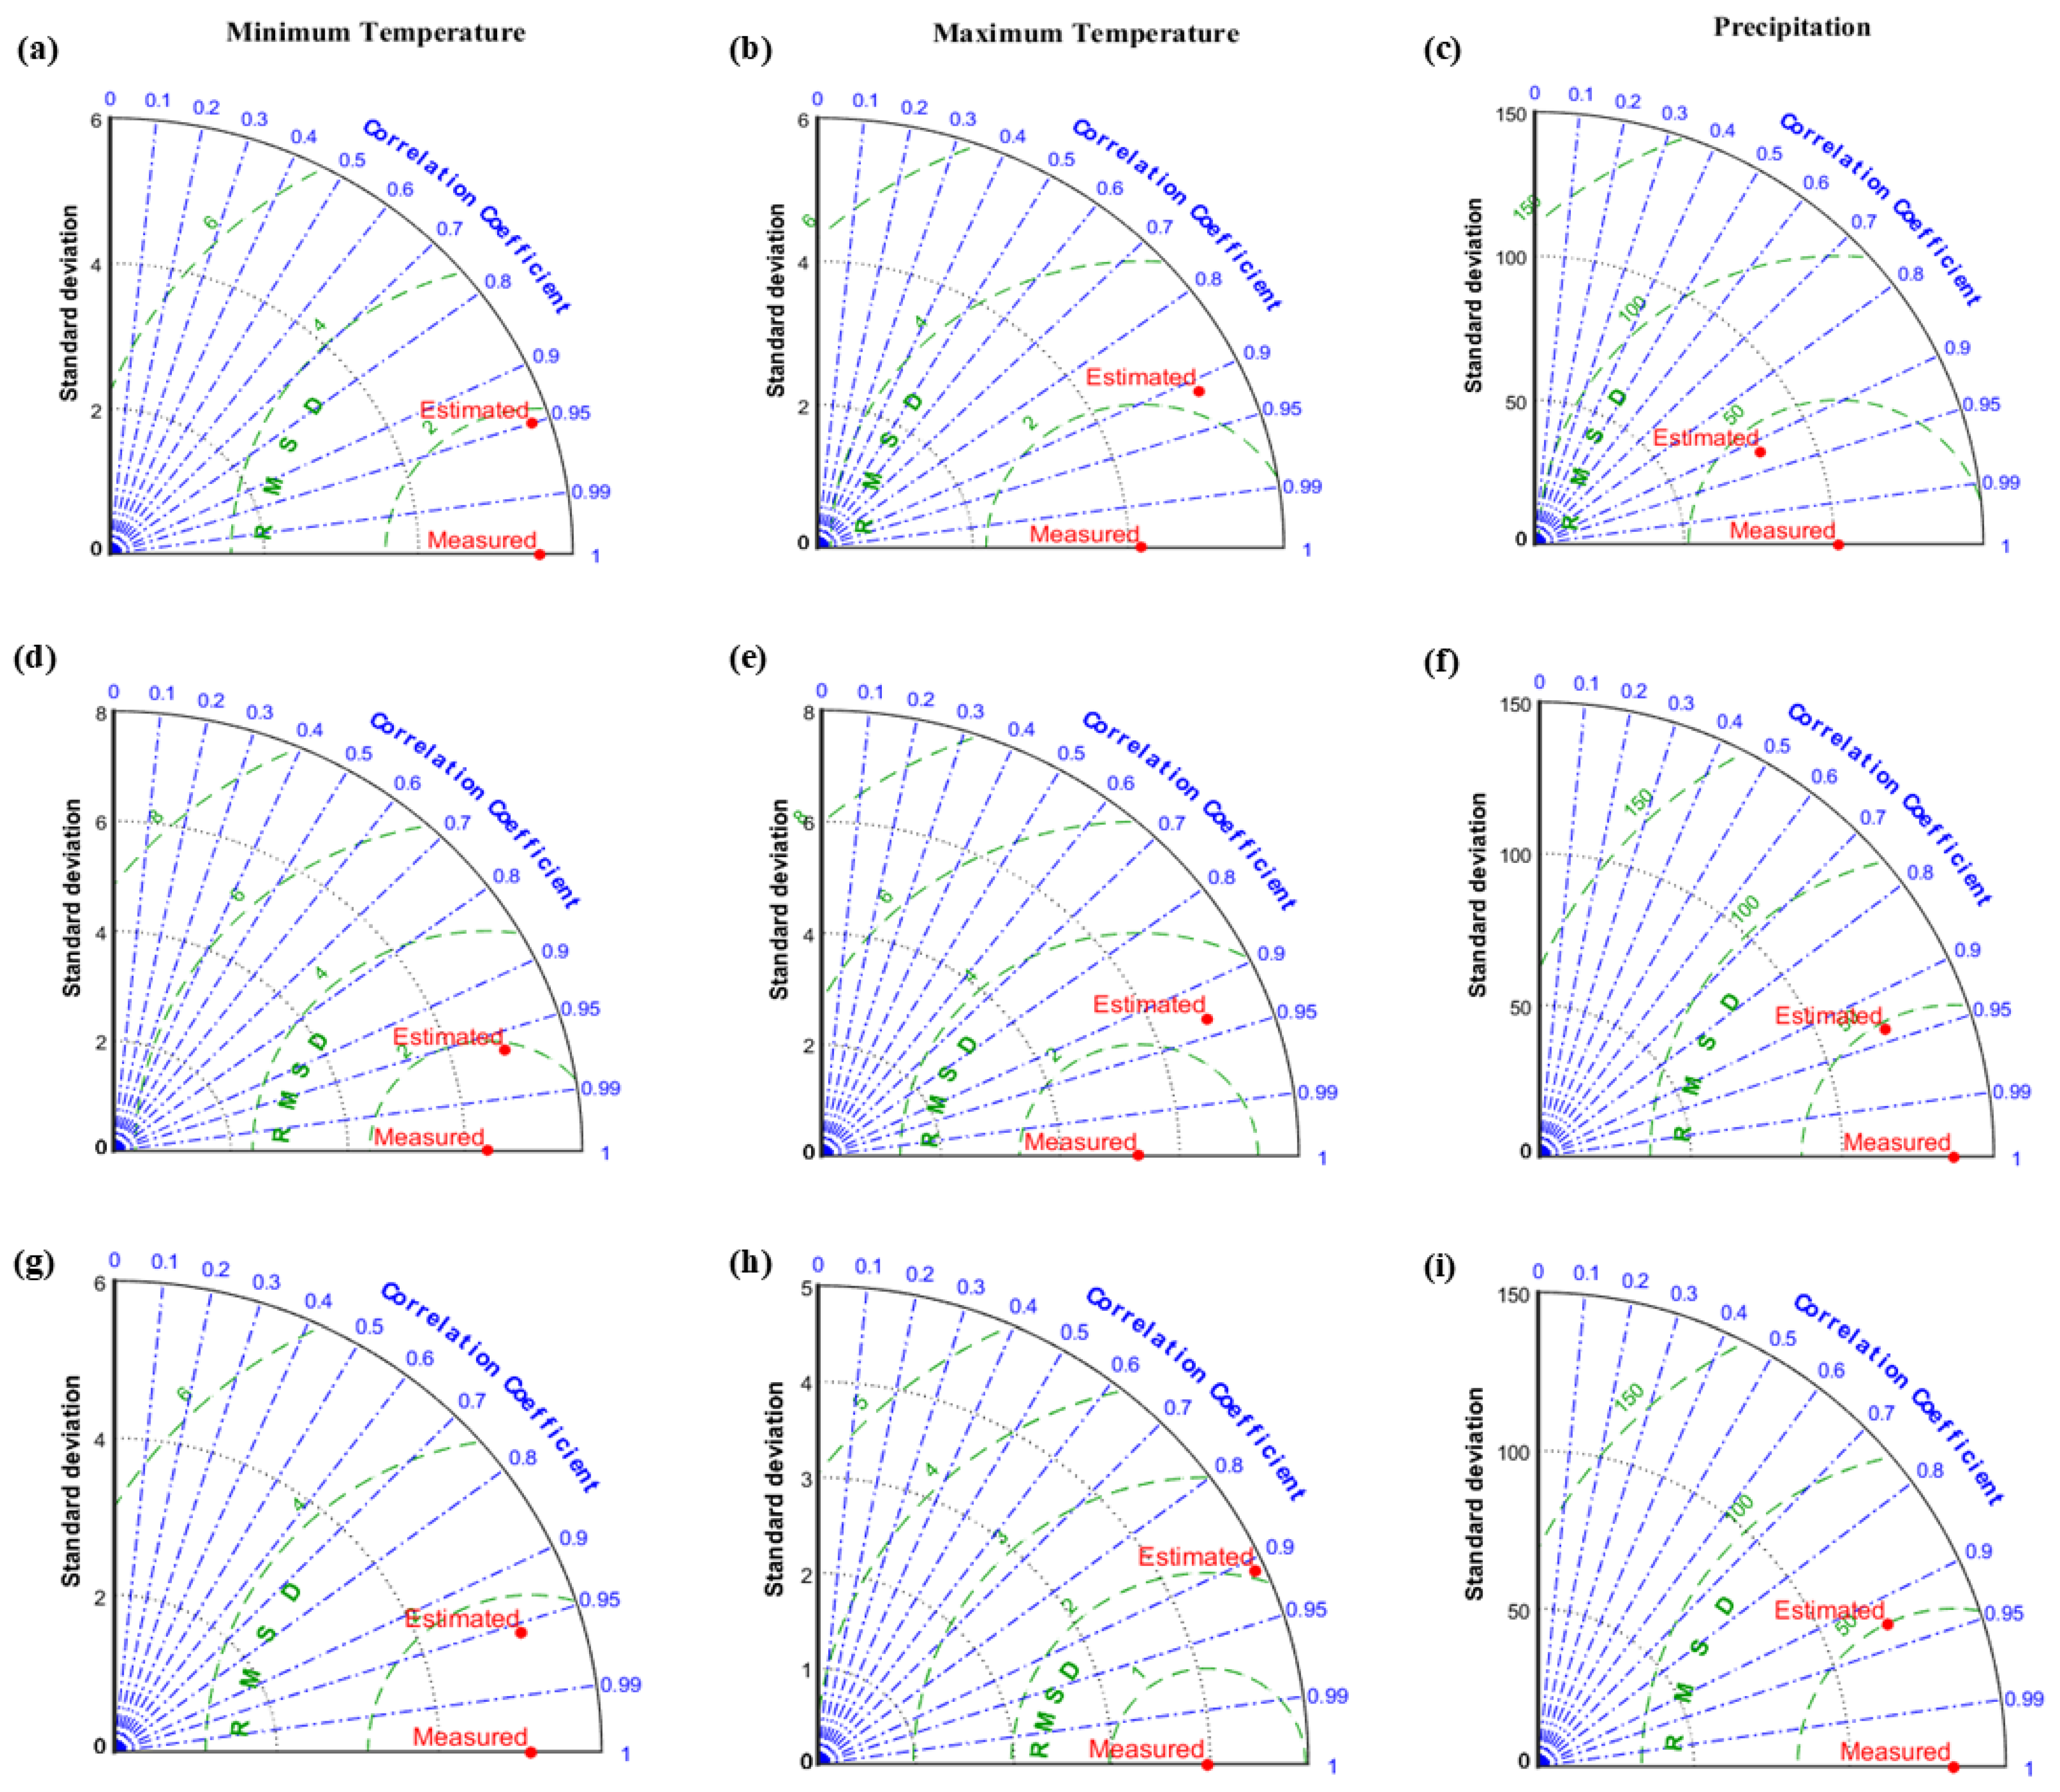
The available station observations in each study area correlated well with the downscaled temperature dataset, as shown in Figure 4. The coefficients of correlation for maximum temperature (Tmax) among the study areas varied between 0.91 and 0.93, whereas, the correlation values for minimum temperature (Tmin) varied between 0.91 and 0.96. The observed high values of correlations signify a good fit among the observed and downscaled temperatures. Root mean square error (RMSE) values observed for maximum temperature were also within the acceptable limits for all three study areas. The maximum RMSE ranged from 2.08 to 2.82 °C. The lowest RMSE values for maximum temperature was found in the KSB area (2.08 °C). The standard deviation was observed to be similar between downscaled and observed minimum temperature for KSB (Figure 5g). However, lower RMSE values were observed for minimum temperature as compared to that of maximum temperature. Meanwhile, the highest RMSE for minimum temperature was observed ranging from 1.52 °C for KSB to 2.18 °C for the BK area. The downscaled minimum temperatures were a lot closer to the observed value as compared to the downscaled maximum temperature. A relatively better association was found between the minimum temperature and observed values for BK (Figure 5d). All other statistical parameters obtained are tabulated in Table 3.
Lower bias was observed for minimum temperatures ranging from −0.53 to 0.14 °C whereas for maximum temperature the values of bias ranged from −0.18 to 1.5 °C. Figure 4 also shows some overestimation of maximum temperature in all areas and underestimation in minimum temperature by the downscaled product for AV. Due to the fact that locations of stations were not made available by the source of the dataset, the validation was carried out using an areal average of climate variables over the study areas which might have contributed to the discrepancies. The maximum temperature for AV was estimated well, with a negative bias of −0.18 °C. However, random biases were observed in AV for maximum and minimum temperatures, although the correlation values bode well between downscaled and station observation values. The coefficient of correlation between the station observations for recorded precipitation and downscaled precipitation for the three study areas varied between 0.92 to 0.94. Least standard deviation was observed in downscaled precipitation for AV along with better association with observed values (Figure 5c). Although the correlation values were very close to each other in each study area, the lower correlations were observed for AV, whereas for the study area BK the coefficients of correlation were found to be the highest. The RMSE values showed variability between 41.21 and 49.69 mm. Although the correlations were found to be lowest in AV, the RMSE was not higher in AV. This indicates a better fit for the study area. The values of downscaled precipitation were found to have negative biases of −0.98 and −3.141 mm for AV and KSB, respectively. Slightly overestimated values were observed for BK, with a positive bias of 5.03 mm for the whole basin area.

4.2. Droughts in the AV Region

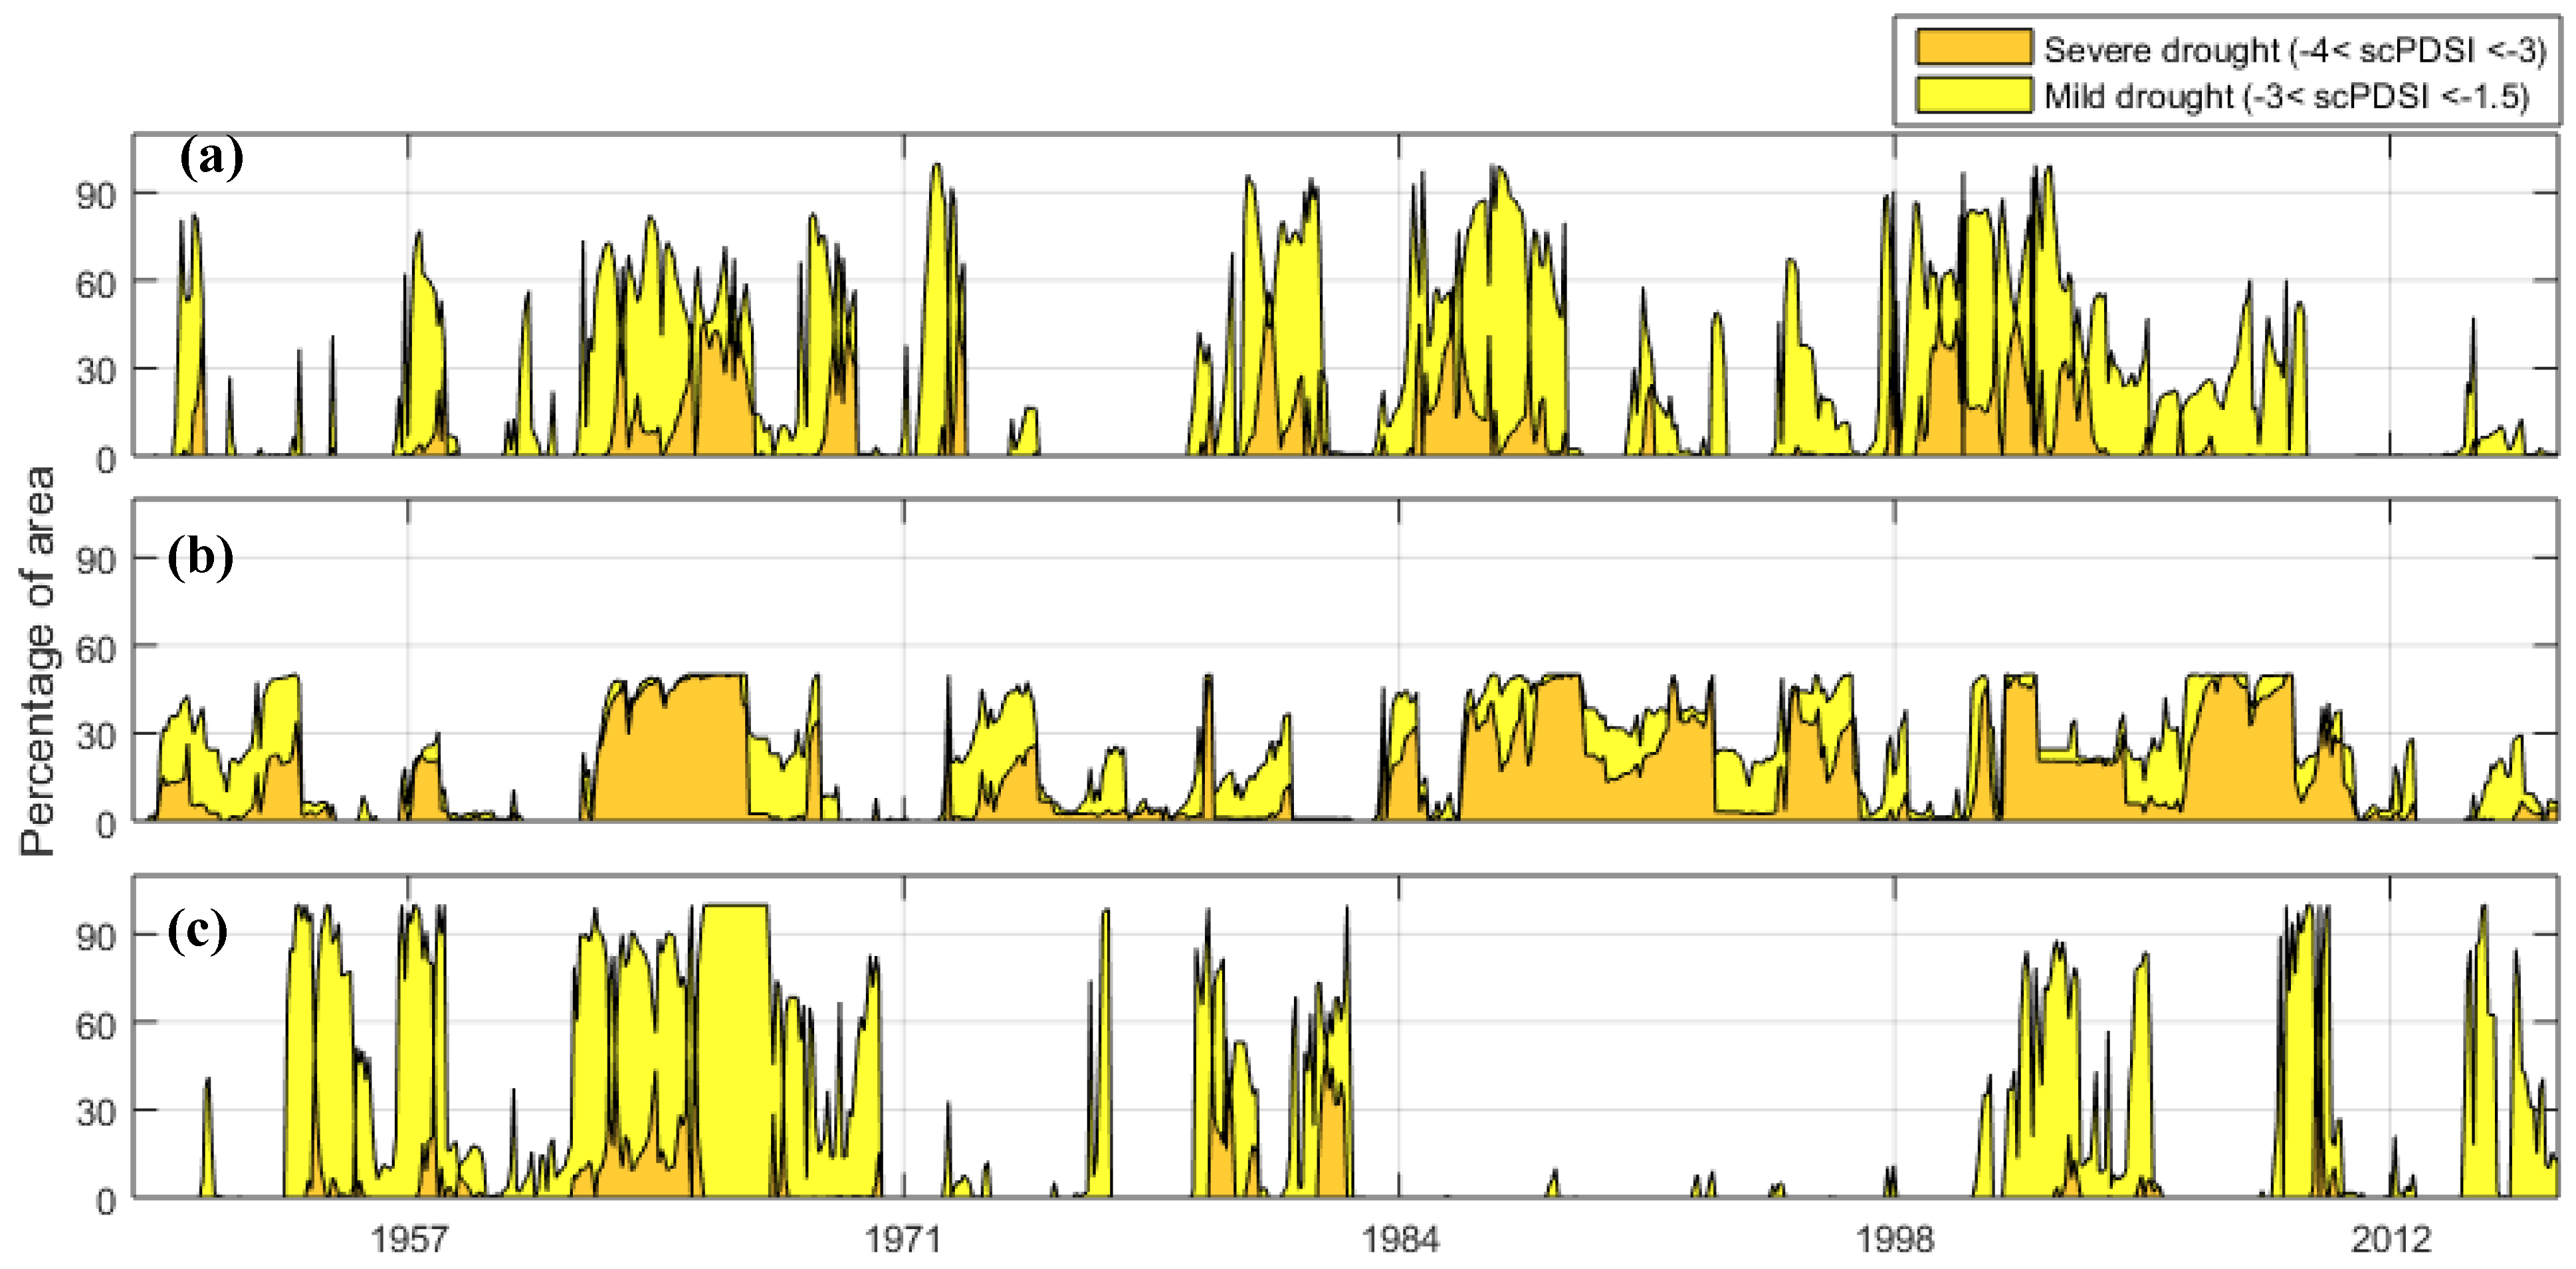
In the AV region, the first drought event recognized was from November 1985 to April 1989. The drought affected around 53% of the total area while the drought index indicated a severe drought condition (scPDSI ≤ −3) based upon the basin-averaged scPDSI values (Figure 6a). About 47% of the total area was affected by mild drought with scPDSI values ranging between −1.5 and −3, which can also be observed in Figure 9. The mild to severe drought conditions were identified in most of the areas within AV affecting larger areas with similar intensity of drought. The severe effects of the drought between 1985 and 1989 were observed around major sectors of northern AV along with the southwestern region of the study area. Due to sparse rainfall during 1985, seasonal droughts appeared in pockets of the northern and southwestern regions of the study area. During the latter half of 1986 through to 1988, extreme drought was identified throughout the study area. The succession of poor rainfall and extremely high values of temperature during 1986 and 1987 monsoon seasons hugely contributed to sustaining the drought which affected the AV region severely. The southeastern region of the AV showed mild drought conditions during the extreme dry period of 1986 until the monsoon season (May–June) of 1988. After 1988, the drought condition improved slowly with increased precipitation in the monsoon season and moderate temperature.
Another prolonged drought condition was recognized in the AV region between 1999 and 2004. Around 60% of the total area was affected by the mild drought and around 39% of the area was affected by the severe drought (Figure 6b). The drought was worsened by drier conditions in the basin. Although a satisfactory but irregular rainfall during the monsoon period for each year from 1999 to 2003 persisted, the rise in temperatures during these years created favorable conditions for the onset of drought. During the 1999 to 2004 period, the drought was significantly severe in the southeastern AV region. The severity of the drought lessened from central AV throughout the western half of the study area. The southwestern region showed a pocket of the least severe values during the 5 years of drought. However, due to increased rainfall and favorable temperature during the monsoon period of 2004, the drought condition lessened in terms of the severity. Dutta et al. [66] also identified a prolonged moderate to extreme drought during the monsoon of 2002 in the overall state of Rajasthan, within which AV lies. The most recent drought in the region was observed from 2008 to 2009, which remained a mild drought in terms of severity over the whole drought period.

4.3. Droughts in BK Region

Drought conditions within the BK region were more numerous over the study period compared to the AV region. The first significant drought for the BK was the drought of 1962–1966. During this drought, 39% of the area was affected by severe drought (scPDSI ≤ −3) and 60% of the area faced mild drought (Figure 7a and Figure 9). Severe droughts were observed around the north-central part of the BK region, as defined by the average scPDSI values. Belts of drought patterns were observed for the duration of the drought, except for a few pockets of drought around the central area of the BK. A very mild drought was observed around the extreme western edge of the BK. Along the eastern edge of the BK, milder drought was observed. The variability of drought within the BK shows extreme drought around the flat areas compared to the higher elevation areas, which may be attributed to higher temperatures in the flatlands. The extreme drought period started after a severely hot summer followed by a dry winter. The drought period started with a rather mild drought and the extreme drought around the end of 1966. Improved rainfall during the 1965 and 1966 monsoon seasons, along with mild temperature conditions during the summer of 1966, decreased the drought impact at the end of 1966. Out of all districts within BK, the Hamirpur and eastern Jalaun were hugely affected by the severity of drought throughout the 4 years of extreme drought.
Another lengthy period of drought was identified in the BK region starting from 1987 and lasting until 1993, with less severe drought over a few months in 1990. This drought event marked the longest spell of drought to have ever been recorded in the region. The severity of the drought increased after a mild onset in 1987. Usually, drought occurs for a time and slowly diminishes as the precipitation and temperature conditions improve. However, during this drought, the period from June 1990 till September 1991 showed an improvement in the drought situation in terms of severity, but it was immediately followed by another lengthy spell of drought.
From 1987 to 1993, about 75% of the area was affected by severe drought, while 24% of the area was under mild drought conditions (Figure 9). A major southeastern section of the BK region was under mild drought conditions from 1987 to 1990 along with smaller areas to the northeast and northwest (Figure 7b). Small pockets of extreme drought were seen throughout the central part of the BK region and portions of western and eastern BK. A large belt of severe drought was seen around the area of extreme drought. Contrary to the 1987–1990 drought, the post-1990 drought until 1993 saw the area of extreme drought increase to 11% of the total region. Almost the same area of severe drought was observed in the western half of BK, covering approximately 24% of the total area. Mild drought conditions were observed in 65% of the total area spread around the majority of the eastern half of the BK (Figure 7c). Compared to the initial phase of drought, the terminal phase of the drought saw an increase in an area unaffected by drought with scPDSI > −1, which can be interpreted as the onset of a favorable wet condition. The period between 1960 and 1990 was identified as a nationwide severe drought period by Preethi et al. [67], with higher drought frequency reported until 1979. The years 2002 and 2009 were the last known extreme drought years, during which Madhya Pradesh was heavily affected due to a significant reduction in rainfall [67].
The last known 24-month drought with scPDSI ≤ −1.5 affecting the BK region was the 2006–2009 period. This drought period was characterized by insufficient rainfall during the 2006 monsoon season. The drought period decreased due to excessive rainfall during the 2009 monsoon when the drought condition was extreme (scPDSI ≤ −4) based on the basin averaged scPDSI. Although the temperature throughout the drought period was almost similar compared to temperatures at the beginning of the drought, the effects of drought were alleviated drastically at the end of the 2009 monsoon, with the scPDSI index averaging around zero throughout the basin.
From 2006 to 2009, around 2% of the area was under extreme drought comprised of the central-western BK. Almost all of the central part stretching from east to west of the total study area was under a severe drought condition, or about 56% of BK. The major areas affected were the northern and southern regions of the BK region, excluding the central part affected by extreme drought conditions (Figure 7d). A mild drought condition was observed in small areas of around 40%, which was spread in the northern and southwestern extreme parts of the study area.

4.4. Droughts in KSB Region

The current study identified two drought events with considerable duration for the KSB region. Although various shorter duration droughts were identified during the course of the study period, the drought event of 1954–1956 and 1962–1968 was considered the major events in terms of duration and persistence.
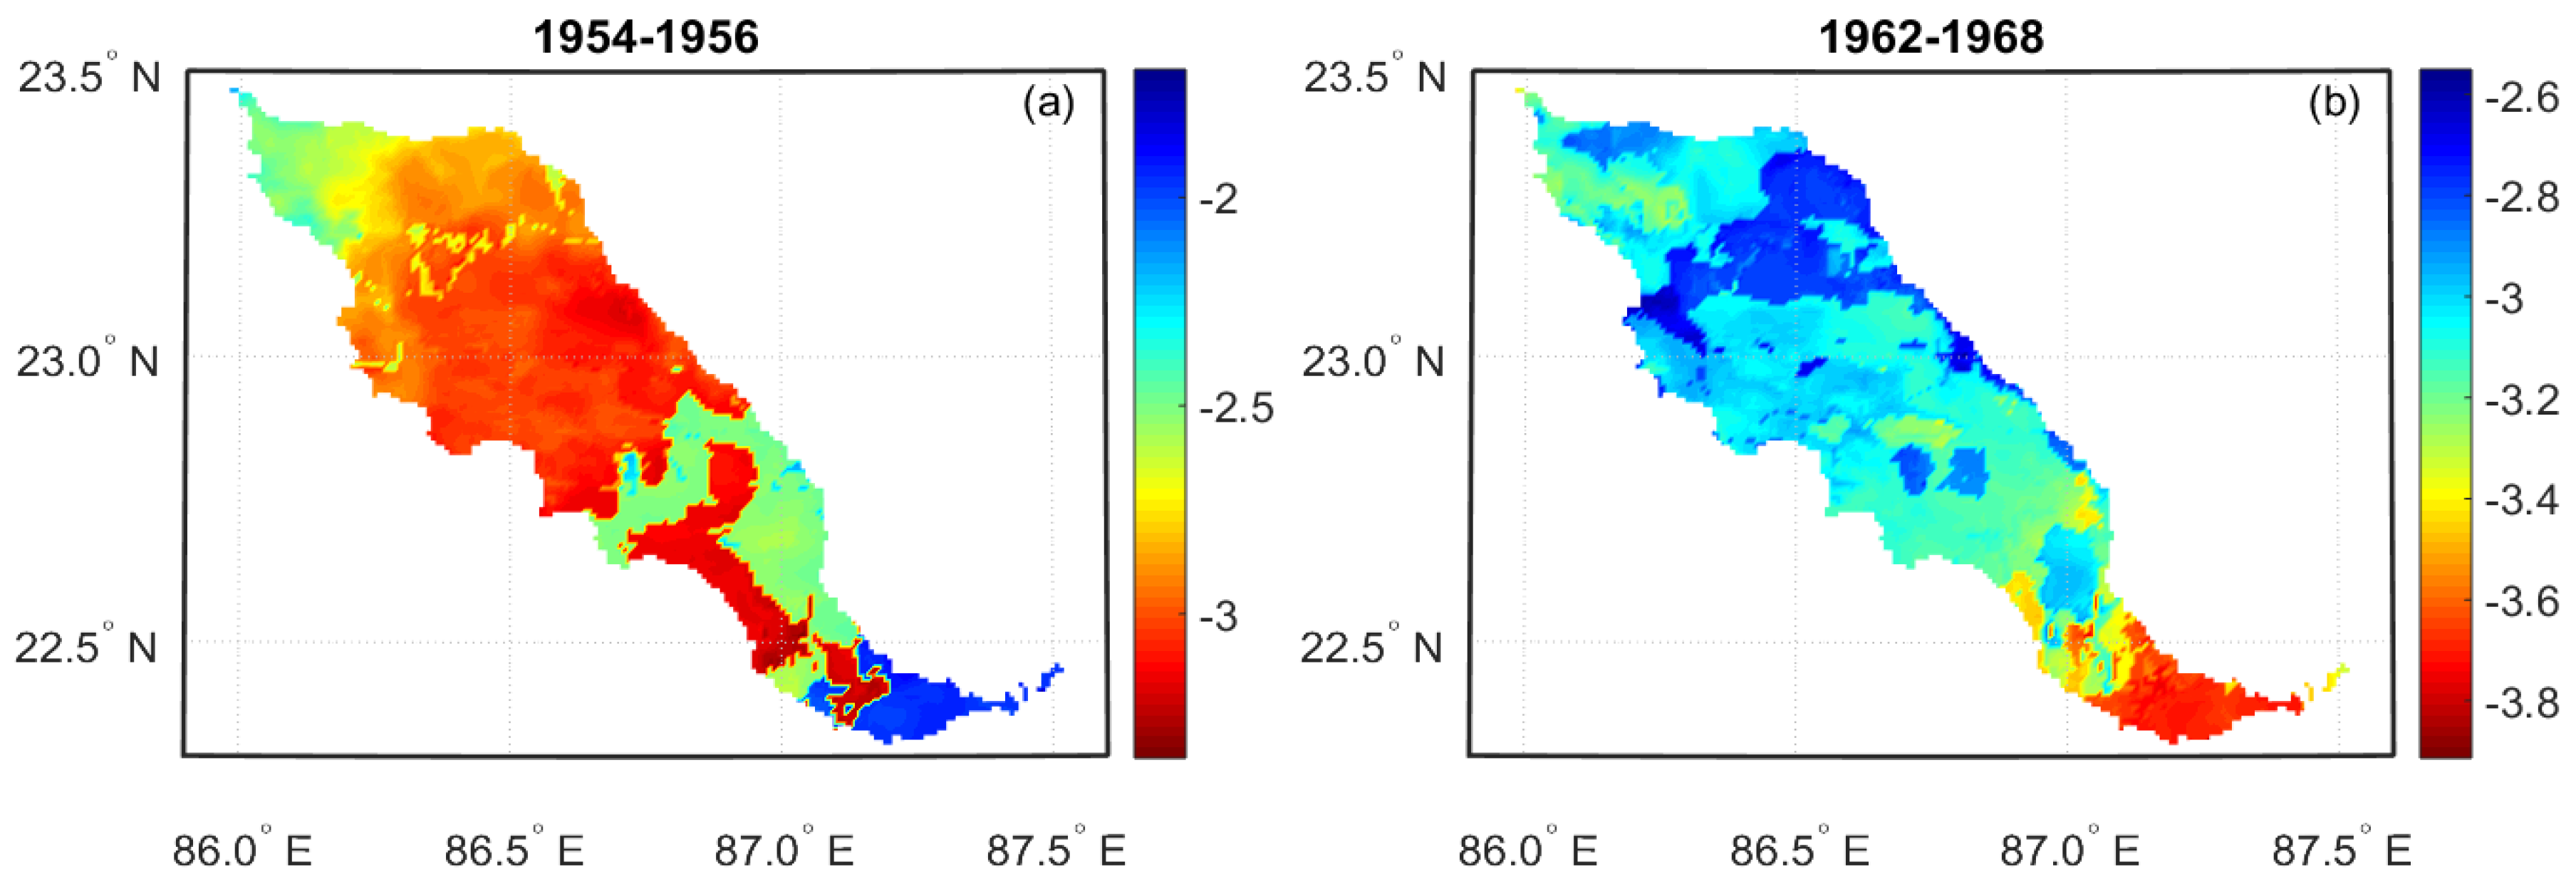
From 1954–1956, 57% of the area was affected by a mild drought condition. The severity of drought during this period was highly likely to escalate due to an unprecedented temperature rise in the summer of 1955. Although a considerable amount of rainfall was observed during the monsoon of 1954, the drought event did not improve because of a drier winter that same year. The situation of drought worsened in summer 1955, with the drought index showing severe conditions in about 43% of the total area and was observed in mostly the central third of KSB (Figure 8a). Likewise, the mild drought condition was observed in the western part of the region.
The second major drought started in early monsoon of 1962 and lasted for 6 years with severe to extreme droughts in between. Although the precipitation during the monsoon season of 1962 was moderate, the drought severity increased as the overall rainfall situation did not improve to resist the onset of drought. The less than normal rainfall during the years 1965 and 1966 caused the drought to last for two more years. The observed drought condition in terms of basin averaged scPDSI showed extreme and severe droughts. Approximately 33% of the total area was found to be affected by mild drought and the rest of the area (67%) was affected by severe drought (Figure 8b). The severe drought was dominant at the beginning of the drought period, which remained the same until the spring of 1965. The extreme drought events started to appear during the summer of the same year, with the basin averaged scPDSI values decreasing from −3.3 to −4.3 in the February of 1967 (Figure 9). Throughout the duration of drought, the severe drought events were observed in the entire study area except for the southern region, over which the extreme drought event was persistent.
The drought situation improved with reduced severity starting in February 1968, mainly because of continued rainfall during the post-monsoon period of 1967. The climatic condition of the study area is usually characterized by a dry winter, but during the 1967 winter, a wet condition helped to improve the climatic situation and prevented the drought from being exacerbated. In addition to the two lengthy droughts, other short-term droughts were observed in the 1980s with a duration of less than a year. Another drought event was seen in 2009 and 2010, with the severity ranging from severe to extreme, lasting almost a year. The most recent drought identified by the current study in the region was from March 2014, lasting until May 2014. During this period, the drought showed its incipient stage and reached near-severe conditions. It then slowly vanished shortly after with increased rainfall during the 2015 monsoon, returning the situation of drought to a normal wet condition. The drought events identified through this method are consistent with the findings of Ghosh et al. [68], in which major drought years were identified as 1966 and 1967 in West Bengal as a whole.

4.5. Frequency of Droughts

The long-term drought events identified by the method used in this work resulted in a few major dry events with varying severity in all three regions. Although long term droughts are devastating, short term droughts are also damaging when the level of severity is high and can equally impact the overall conditions. A considerably higher number of recurring droughts was identified within a year in some parts of the AV and BK regions at 6- and 10-months timescales, respectively. In particular, more frequent drought events were recorded in each of the AV and BK study areas in small pockets, as evident in Figure 10a,b. In the AV, the maximum number of droughts was concentrated in a region of Sirohi district, which lies on the western border of the AV. Similarly, a few places under Udaipur district, which lies in central AV, showed a higher frequency of drought, ranging from 3.5 to 5.5 months in a year on average. Due to highly variable annual total rainfall in the AV region, the rainfall is generally erratic, with dry spells occurring regularly. Other parts of the AV region showed fewer numbers of drought months per year, with a frequency of 2.83 months on average.
Some portions of the BK region showed a significant number of drought months per year. Districts such as Lalitpur, Chattarpur, and some parts of Tikamgarh showed a high number of droughts per year, ranging from 8 to 10 months in a year on average (Figure 10b). Some extreme to moderate drought events have taken place in these districts, such as in 2001, with the onset of extreme drought due to the declining level of water, from 2004, which continued until 2006, and 2007, which shows the vulnerability of recurring droughts in these regions. From 1998 to 2009, there was a persistent occurrence of droughts driven both by meteorological and hydrological processes in these regions. Likewise, the southern region of Chattarpur district showed the occurrence of a higher number of droughts. Unlike these regions, the rest of the BK showed fewer drought events occurring within a year, with values ranging around 2 to 5 months. This is comparatively similar to the extremely frequent drought-prone areas of the AV.
On the basis of two major drought events in the KSB region during the study period, and the frequency plot of the droughts (Figure 10c), it can be said that frequent mild drought events lasting 4–5 months occur each year on average. The droughts were observed mostly in the western part of the KSB region, which encompasses the Puruliya district of West Bengal (Figure 10c). The rest of the KSB region is seen to be affected by droughts of on average of 2 months in a year.

5. Discussion

This research work emphasizes the benefits of studying drought at a finer spatial resolution and obtained the drought dataset. High-resolution datasets not only exhibit the drought variabilities in regional scales but also overcome the limitations in studying the smallest of the subnational unit (localities, metropolis). For example, Chittaurgarh district in the AV, Gwalior district in BK, and Medinipur district in KSB, which are smaller districts in their respective regions, show varying scPDSI values within them. In the current drought datasets [36,43,59,69,70], smaller subnational units appear to have a single representative value of respective drought indices. The area of the subnational unit poses some limitation, since it is smaller than a grid cell. The drought dataset obtained from the current study considers a mathematically possible smallest area of 1 km2, which is smaller than most localities, villages, towns, or metropolises in the study areas. Furthermore, the robustness of the obtained drought dataset was assessed by two approaches. First off, statistical metrics were used to compare both the downscaled climate variables (temperature and precipitation) with station observed data prior to the computation of the drought index. The coefficients of correlation might not capture the true variation between two datasets; therefore, a more plausible comparison by including correlations along with RMSE was carried out. In both ways, the downscaled dataset appears to be consistent with station observed data, representing the variation as close as possible.
Based on all the correlation values in all the three study areas, downscaled climate variables follow a similar nature to that of observed values. Interestingly, a correlation of more than 0.8 was found in most parts of the country between a gridded temperature data set of 1° × 1° grid by IMD and by Asian Precipitation Highly Resolved Observational Data Integration Towards the Evaluation of Water Resources [71] high-resolution monthly data set. The same IMD gridded data were also developed from 522 quality-controlled stations [72]. The stations used for validation in this study are among those 395 stations. The correlation between downscaled temperature and station observation for all three study areas is over 0.8, which indicates greater relevance of downscaled climate data. Out of all three study areas, depending upon the correlation coefficient, AV shows the lowest value (0.85) for precipitation, but in terms of RMSE, AV shows less error (41.2 mm). Despite having the most erratic, highly variable rainfall, associated with occasional heavy downpours, the results shown as per statistical metrics are convincing for AV. KSB, which has flatter land, compared to other study areas showed lower RMSE values for both maximum and minimum temperature, which is less compared to the RMSE obtained for other areas. This corresponds with the results of Srivastava et al. 2009 which state that the errors are higher in hilly regions due to limitations posed by elevation and data scarcity. All in all, the delta method appears to have satisfactory performance in terms of correlation and RMSE values for downscaling the temperature.
The delta method of downscaling implemented in the current study is suitable to overcome the limitations posed by the unavailability of high-resolution gridded climate data. The major advantage of the current method is that it reduces tediousness in computation using adequate climatic data for its application [73]. Compared to more computationally extensive statistical methods such as BCCA or BCSD, delta downscaling appears to provide an effective alternative. It would be most preferable to downscale the climate data using BCCA, which is a hybrid of both BCSD and CA, but historical climate data at higher resolution are required in order to compute the CA. This difficulty discourages the implementation of such a method. Also, the results obtained from the BCCA method are dependent upon the size of the domain, which may result in inconsistent results among different study sizes [74]. The delta method requires only high-resolution climatology of the variables for downscaling, unlike other methods. Therefore, the method is important for Indian regions, considering long terms records are not easily available.
Regardless of the method used, the ultimate result would be the identification of droughts in the past. The drought events obtained through the dataset needs corroboration. A fair sense of validation of drought datasets can be established by confirming the events on the basis of older records of drought events in all the study areas. Drought assessments are made in India time and again, but it is wiser to refer to older reports of drought to validate the findings of the current study. Severe to extreme drought identified by the current dataset from 1985–1989 in AV was corroborated by a drought record during 1984–1987, as reported by Bhuiyan et al. [75]. It is reported that the drought of 1985–1989 led to a decline in water level during monsoon as well as non-monsoon months. The majority of AV, except for the western region, faced severe water stress during 1987 [75], which is also evident from Figure 6a. Another major drought incidence reported in the same literature states that it occurred around the 2000s, in which a bigger part of the region experienced extreme drought. The length of severe to extreme drought experienced by the AV region is roughly approximated as 36–48 months. This length of drought matches the drought length obtained by the current study. The overall effect of this drought took a serious toll on the groundwater level due to increased consumption [75]. Likewise, in the BK region, Thomas et al. [40] reported that the majority of districts in the study area have been experiencing severe as well as extreme droughts. The droughts during the 1960s are not well documented due to a lack of climate data. However, the districts such as Lalitpur, Tikamgarh, Chhattarpur, and Jhansi are reported to be historically drought prone and enough records exist to corroborate the drought occurrences in the late 1980s. Moreover, it is interesting to note that the drought durations decreased after the 1982 drought, but again started to increase from summer of 2002 and persisted with increasing severity till 2008. In addition, the major drought events in the BK region are also reported in the literature [40] during the 1990s and late 2000s. Mishra and Desai [76] pointed out the reason for the prolonged drought period during the 1960s in KSB. The reason behind such a long-term drought was the consecutive years of less than normal rainfall depth. The severity–area-frequency curves developed by Mishra and Desai [76] showed that the droughts during 1960 s were less frequent. The rainfall deficit during the 1960s, which led to roughly 6 years of drought, was observed in the current study. One of the reasons for the drought-free period in KSB during the mid-1980s until 2000 is down to improved climatic and hydrologic situations, such as rainfall, temperature, and streamflow during that period. Based on Mittal et al., [77] the streamflow data between 1985 and 2000 in KSB, even the minimum streamflow values, were higher compared to the streamflow recorded in the years ahead of the time period in concern. The streamflow data show a less favorable condition for the drought to occur. Similarly, the temperature, which is one of the parameters that dictates the chances of drought, shows the least favorable condition for drought between 1985 and 2000 in West Bengal based on Bhattacharya and Panda [78]. The literature shows no extreme temperature spike between 1985 and 2000, although a slight linear increase in the temperature was exhibited. This might be one potential reason for the minimal evaporative demand of the atmosphere, due to which the drought chances were minimal.
In this way, confirming the occurrences of droughts in the past gives validity to the current study, but there is a greater application of the current drought dataset. Following the obtained high-resolution drought dataset for corresponding areas, the onset and precedence of droughts can be quantified in any given point of interest for commensurate water resources management steps. As an advantage of the higher spatial resolution of the dataset, only the areas requiring attention can be identified and can be significantly focused on rather than the entire region. This advantage can reduce management costs and save time.
The current study manifests the identification of major drought events of the past at spatially relevant resolution, even for the smallest of the geographical units. The high-resolution dataset enables us to understand the drought occurrence and its severity, so that preparations can be done focusing on the climate constraints at any given place. For a developing country like India, with limited availability of technically advanced quality-controlled datasets, the application of the delta method of downscaling will suitably fill the gap. This can aid the drought impact assessment in India in the form of a real-time drought monitoring facility at national and subnational scales. The publicly available datasets acquired in this study leads to an economic solution and the robustness of the downscaled data bolsters the credibility of the acquired method of drought analysis. In an agriculturally prospective country like India [79], the availability of a drought analysis system obtained through this study can aid crop management, stabilizing the overall supply and demand for years to come.

6. Conclusions

This study used the delta downscaling method, a less resource-consuming statistical method, to generate a very fine-resolution drought product using coarser scale precipitation and temperature data. The drought datasets of high resolution are a necessity and more so for tropical regions like India, where the effects of climate change can be significant. The study utilized global scale satellite products available at various resolutions for a better understanding of droughts at regional scales. The performance of downscaled precipitation and temperature data was compared with station data available within the study areas. The findings of the current research may be summarized as follows:
  • The delta downscaling method successfully enhanced precipitation and temperature at various resolutions using the corresponding climatology to 1 km × 1 km spatial resolution.
  • The values of root-mean-square error and coefficients of correlation (R) values indicated that the downscaled climate products are robust in capturing the interannual drought variability.
  • The incorporation of the delta downscaling method to produce scPDSI based drought products showed the potential to assess higher resolution drought information within smaller spatial extents.
The results of this research reiterate the fact that a high-resolution drought product can be important for India to understand the drought conditions at local scales. Due to varying climatic conditions within India and different topographical features, the current study can help us to understand the past drought conditions, leading researchers, planners, and stakeholders to predict the drought situation for the future at a locally relevant spatial scale. This study will help the local community and stakeholders by providing retrospective knowledge about past drought conditions, and the consequent problems, to improve preparations for future drought resilience. Specifically, for India, where high-resolution data are not easily available, the use of a computationally efficient delta method can help dramatically because of its proven robustness. It is also advantageous to obtain a high-resolution dataset at a much lower cost than using technically and economically extensive methods to capture higher resolution data.
The current method of downscaling with bias correction satisfactorily captured the spatiotemporal variations of temperature and precipitation based on the computed statistical metrics. The major drought events captured by our downscaled methods are in good correspondence with previous works that identified droughts over a similar timeframe. Additional work can be done to demonstrate the impact of climate change on each study area by using similar methods used in this paper. The current method of downscaling can be transferred to other study areas as well due to its robustness. Droughts of mild severity were frequently evident in every study area; severe droughts were found to have occurred at least once in a decade. In recent times, according to the current study, drought events have not occurred, but one can never be certain about future droughts. The aftermath of this study provides an avenue to study future drought at higher spatial resolution. Similarly, the downscaled climate data obtained from this research can be used to compare and contrast the climatic situation with that of the future. Since the obtained climate data are well validated with the ground observations, they provide greater comfort to use the data for bias correctional purpose of model data as well. This will provide an option to other researchers for observational and correctional purposes for studies in data-scarce areas at higher spatial resolution. Furthermore, the onset and end of drought can be understood well with the use of a drought indicator such as scPDSI, which will be very useful for decision-makers to focus their efforts in drought-prone and potentially problematic areas in the future. An extension of the current study also can be to depict the droughts in the future, maintaining the same spatial resolution.

Author Contributions

Conceptualization, A.K.; Formal analysis, A.S. and M.M.R.; Investigation, A.S. and M.M.R.; Software, A.S. and M.M.R.; Supervision, A.K., and K.W.L.; Writing—original draft, A.S., and A.K.; Writing—review & editing, A.S.; M.M.R., A.K., B.T., K.W.L., and P.M. All authors have read and agreed to the published version of the manuscript.

Funding

This research received no external funding

Acknowledgments

The authors would like to thank the editor and four anonymous reviewers for constructive feedback. The authors would like to express their appreciation for the support provided by the Office of the Vice-Chancellor for Research at Southern Illinois University, Carbondale. The current study was carried out using various publicly available datasets.

Conflicts of Interest

The authors declare no conflict of interest.

References

  1. Wilhite, D.A.; Svoboda, M.D.; Hayes, M.J. Understanding the complex impacts of drought: A key to enhancing drought mitigation and preparedness. Water Resour. Manag. 2007, 21, 763–774. [Google Scholar] [CrossRef] [Green Version]
  2. Mishra, A.K.; Singh, V.P. A review of drought concepts. J. Hydrol. 2010, 391, 202–216. [Google Scholar] [CrossRef]
  3. Beguería, S.; Vicente-Serrano, S.M.; Angulo-Martínez, M. The SPEIbase: A new gridded product for the analysis of drought variability and drought impacts. Bull. Am. Meteorol. Soc. 2010, 91, 1351–1356. [Google Scholar] [CrossRef] [Green Version]
  4. Sheffield, J.; Wood, E.F. Projected changes in drought occurrence under future global warming from multi-model, multi-scenario, IPCC AR4 simulations. Clim. Dyn. 2007, 31, 79–105. [Google Scholar] [CrossRef]
  5. Dai, A. Increasing drought under global warming in observations and models. Nat. Clim. Chang. 2012, 3, 52–58. [Google Scholar] [CrossRef]
  6. Stocker, T.F.; Dahe, Q.; Plattner, G.K.; Alexander, L.V.; Allen, S.K.; Bindoff, N.L.; Xie, S.P. Technical summary. Climate change 2013: The physical science basis. In Contribution of Working Group I to the Fifth Assessment Report of the Intergovernmental Panel on Climate Change; Cambridge University Press: Cambridge, UK, 2013; pp. 33–115. [Google Scholar] [CrossRef]
  7. Trenberth, K.E.; Dai, A.; Van Der Schrier, G.; Jones, P.D.; Barichivich, J.; Briffa, K.R.; Sheffield, J. Global warming and changes in drought. Nat. Clim. Chang. 2014, 4, 17–22. [Google Scholar] [CrossRef]
  8. Bisht, D.S.; Sridhar, V.; Mishra, A.; Chatterjee, C.; Raghuwanshi, N.S. Drought characterization over India under projected climate scenario. Int. J. Climatol. 2019, 39, 1889–1911. [Google Scholar] [CrossRef] [Green Version]
  9. Nam, W.-H.; Hayes, M.J.; Svoboda, M.D.; Tadesse, T.; Wilhite, D.A. Drought hazard assessment in the context of climate change for South Korea. Agric. Water Manag. 2015, 160, 106–117. [Google Scholar] [CrossRef]
  10. Chen, H.; Sun, J. Characterizing present and future drought changes over eastern China. Int. J. Clim. 2017, 37, 138–156. [Google Scholar] [CrossRef]
  11. Thilakarathne, M.; Sridhar, V. Characterization of future drought conditions in the Lower Mekong River basin. Weather Clim. Extrem. 2017, 17, 47–58. [Google Scholar] [CrossRef]
  12. Lee, J.-H.; Park, S.-Y.; Kim, J.-S.; Sur, C.; Chen, J. Extreme drought hotspot analysis for adaptation to a changing climate: Assessment of applicability to the five major river basins of the Korean Peninsula. Int. J. Clim. 2018, 38, 4025–4032. [Google Scholar] [CrossRef]
  13. Scheff, J.; Frierson, D.M. Terrestrial aridity and its response to greenhouse warming across CMIP5 climate models. J. Clim. 2015, 28, 5583–5600. [Google Scholar] [CrossRef]
  14. Zhao, T.; Dai, A. The magnitude and causes of global drought changes in the twenty-first century under a low–moderate emissions scenario. J. Clim. 2015, 28, 4490–4512. [Google Scholar] [CrossRef]
  15. Ault, T.R.; Cole, J.E.; Overpeck, J.T.; Pederson, G.T.; Meko, D.M. Assessing the risk of persistent drought using climate model simulations and paleoclimate data. J. Clim. 2014, 27, 7529–7549. [Google Scholar] [CrossRef] [Green Version]
  16. Cook, B.I.; Smerdon, J.E.; Seager, R.; Coats, S. Global warming and 21st century drying. Clim. Dyn. 2014, 43, 2607–2627. [Google Scholar] [CrossRef] [Green Version]
  17. Samra, J.S. Review and Analysis of Drought Monitoring, Declaration and Management in India; IWMI: Colombo, Sri Lanka, 2004. [Google Scholar]
  18. Shrestha, A.; Rahaman, M.M.; Kalra, A.; Jogineedi, R.; Maheshwari, P. Climatological drought forecasting using bias corrected CMIP6 climate data: A case study for India. Forecasting 2020, 2, 59–84. [Google Scholar] [CrossRef]
  19. De, U.S.; Dube, R.K.; Rao, G.P. Extreme weather events over India in the last 100 years. J. Ind. Geophys. Union 2005, 9, 173–187. [Google Scholar]
  20. Mishra, V.; Shah, R.; Thrasher, B. Soil moisture droughts under the retrospective and projected climate in India. J. Hydrometeorol. 2014, 15, 2267–2292. [Google Scholar] [CrossRef]
  21. Nath, R.; Nath, D.; Li, Q.; Chen, W.; Cui, X. Impact of drought on agriculture in the Indo-Gangetic Plain, India. Adv. Atmos. Sci. 2017, 34, 335–346. [Google Scholar] [CrossRef]
  22. Pant, G.B.; Parthasarathy, S.B. Some aspects of an association between the southern oscillation and indian summer monsoon. Theor. Appl. Clim. 1981, 29, 245–252. [Google Scholar] [CrossRef]
  23. Mallya, G.; Mishra, V.; Niyogi, D.; Tripathi, S.; Govindaraju, R.S. Trends and variability of droughts over the Indian monsoon region. Weather Clim. Extrem. 2016, 12, 43–68. [Google Scholar] [CrossRef] [Green Version]
  24. Trenberth, K.E.; Dai, A.; Rasmussen, R.M.; Parsons, D.B. The changing character of precipitation. Bull. Am. Meteorol. Soc. 2003, 84, 1205–1218. [Google Scholar] [CrossRef]
  25. Dai, A. Drought under global warming: A review. Wiley Interdiscip. Rev. Clim. Chang. 2011, 2, 45–65. [Google Scholar] [CrossRef] [Green Version]
  26. Bhandari, R.; Kalra, A.; Kumar, S. Analyzing the effect of CMIP5 climate projections on streamflow within the Pajaro River Basin. Open Water J. 2020, 6, 5. [Google Scholar]
  27. Fischer, E.; Seneviratne, S.I.; Vidale, P.L.; Luthi, D.; Schär, C. Soil moisture–Atmosphere interactions during the 2003 European summer heat wave. J. Clim. 2007, 20, 5081–5099. [Google Scholar] [CrossRef]
  28. Rahaman, M.M.; Lamichhane, G.R.; Shrestha, A.; Thakur, B.; Kalra, A.; Ahmad, S. Using SWAT to Simulate Streamflow in Trinity River Basin, Texas, USA. In World Environmental and Water Resources Congress 2019: Watershed Management, Irrigation and Drainage, and Water Resources Planning and Management; American Society of Civil Engineers: Reston, VA, USA, 2019. [Google Scholar]
  29. Joshi, N.; Tamaddun, K.; Parajuli, R.; Kalra, A.; Maheshwari, P.; Mastino, L.; Velotta, M. Future changes in water supply and demand for Las Vegas Valley: A system dynamic approach based on CMIP3 and CMIP5 climate projections. Hydrology 2020, 7, 16. [Google Scholar] [CrossRef] [Green Version]
  30. Thakur, B.; Kalra, A.; Ahmad, S.; Lamb, K.W.; Lakshmi, V. Bringing statistical learning machines together for hydro-climatological predictions-case study for Sacramento San joaquin River Basin, California. J. Hydrol. Reg. Stud. 2020, 27, 100651. [Google Scholar] [CrossRef]
  31. Shrestha, A.; Bhattacharjee, L.; Baral, S.; Thakur, B.; Joshi, N.; Kalra, A.; Gupta, R. Understanding Suitability of MIKE 21 and HEC-RAS for 2D Floodplain Modeling. In Proceedings of the World Environmental Water Resources Congress 2020, Henderson, NV, USA, 17–21 May 2020; pp. 237–253. [Google Scholar] [CrossRef]
  32. Katiraie-Boroujerdy, P.-S.; Nasrollahi, N.; Hsu, K.-L.; Sorooshian, S. Quantifying the reliability of four global datasets for drought monitoring over a semiarid region. Theor. Appl. Clim. 2015, 123, 387–398. [Google Scholar] [CrossRef] [Green Version]
  33. Grasso, V.F.; Singh, A. Early Warning Systems: State-of-Art Analysis and Future Directions; Draft Report; UNEP: Nairobi, Kenya, 2011. [Google Scholar]
  34. Hao, Z.; AghaKouchak, A.; Nakhjiri, N.; Farahmand, A. Global integrated drought monitoring and prediction system. Sci. Data 2014, 1, 140001. [Google Scholar] [CrossRef] [PubMed]
  35. Pozzi, W.; Sheffield, J.; Stefanski, R.; Cripe, D.; Pulwarty, R.; Vogt, J.V.; Nicholson, M. Toward global drought early warning capability. Bull. Am. Meteorol. Soc. 2013, 94, 776–787. [Google Scholar] [CrossRef]
  36. Vicente-Serrano, S.M.; Beguería, S.; López-Moreno, J.I. A multiscalar drought index sensitive to global warming: The standardized precipitation evapotranspiration index. J. Clim. 2010, 23, 1696–1718. [Google Scholar] [CrossRef] [Green Version]
  37. Daly, C.; Gibson, W.P.; Taylor, G.H.; Johnson, G.L.; Pasteris, P. A knowledge-based approach to the statistical mapping of climate. Clim. Res. 2002, 22, 99–113. [Google Scholar] [CrossRef] [Green Version]
  38. Thornton, P.E.; Running, S.W.; White, M.A. Generating surfaces of daily meteorology variables over large regions of complex terrain. J. Hydrol. 1997, 190, 214–251. [Google Scholar] [CrossRef] [Green Version]
  39. Alamgir, M.; Shahid, S.; Hazarika, M.K.; Nashrrullah, S.; Harun, S.B.; Shamsudin, S. Analysis of meteorological drought pattern during different climatic and cropping seasons in Bangladesh. J. Am. Water Resour. Assoc. 2015, 51, 794–806. [Google Scholar] [CrossRef]
  40. Thomas, T.; Nayak, P.C.; Ghosh, N.C. Spatiotemporal analysis of drought characteristics in the bundelkhand region of central india using the standardized precipitation index. J. Hydrol. Eng. 2015, 20, 05015004. [Google Scholar] [CrossRef]
  41. Meshram, S.G.; Gautam, R.; Kahya, E. Drought analysis in the tons River Basin, India during 1969–2008. Theor. Appl. Climatol. 2018, 132, 939–951. [Google Scholar] [CrossRef]
  42. Moreno, A.; Hasenauer, H. Spatial downscaling of European climate data. Int. J. Climatol. 2016, 36, 1444–1458. [Google Scholar] [CrossRef]
  43. Shah, R.D.; Mishra, V. Development of an Experimental Near-Real-Time Drought Monitor for India. J. Hydrometeorol. 2015, 16, 327–345. [Google Scholar] [CrossRef]
  44. Lorenz, R.; Davin, E.L.; Seneviratne, S.I. Modeling land-climate coupling in Europe: Impact of land surface representation on climate variability and extremes. J. Geophys. Res. Atmos. 2012, 117, D20109. [Google Scholar] [CrossRef] [Green Version]
  45. Hawkins, E.; Fricker, T.E.; Challinor, A.J.; Ferro, C.A.T.; Ho, C.K.; Osborne, T.M. Increasing influence of heat stress on French maize yields from the 1960s to the 2030s. Glob. Chang. Boil. 2012, 19, 937–947. [Google Scholar] [CrossRef] [Green Version]
  46. Maurer, E.P.; Hidalgo, H.G.; Das, T.; Dettinger, M.D.; Cayan, D.R. The utility of daily large-scale climate data in the assessment of climate change impacts on daily streamflow in California. Hydrol. Earth Syst. Sci. 2010, 14, 1125–1138. [Google Scholar] [CrossRef] [Green Version]
  47. Mosier, T.M.; Hill, D.F.; Sharp, K.V. 30-Arcsecond monthly climate surfaces with global land coverage. Int. J. Clim. 2013, 34, 2175–2188. [Google Scholar] [CrossRef]
  48. Wood, A.W.; Leung, L.R.; Sridhar, V.; Lettenmaier, D.P. Hydrologic implications of dynamical and statistical approaches to downscaling climate model outputs. Clim. Chang. 2004, 62, 189–216. [Google Scholar] [CrossRef]
  49. Kumar, M.N.; Murthy, C.S.; Sai, M.V.R.S.; Roy, P.S. Spatiotemporal analysis of meteorological drought variability in the Indian region using standardized precipitation index. Meteorol. Appl. 2011, 19, 256–264. [Google Scholar] [CrossRef] [Green Version]
  50. Aadhar, S.; Mishra, V. High-resolution near real-time drought monitoring in South Asia. Sci. Data 2017, 4, 170145. [Google Scholar] [CrossRef] [Green Version]
  51. Chowdhury, A.; Dandekar, M.M.; Raut, P.S. Variability in drought incidence over India—A statistical approach. Mausam 1989, 40, 207–214. [Google Scholar]
  52. Pai, D.S.; Sridhar, L.; Guhathakurtha, P.; Hatwar, H.R. District-Wide Drought Climatology of the South West Monsoon Season over India Based on Standard Precipitation Index (SPI). Nat. Hazards 2011, 59, 1797–1813. [Google Scholar] [CrossRef]
  53. Thomas, J.; Prasannakumar, V. Temporal analysis of rainfall (1871–2012) and drought characteristics over a tropical monsoon-dominated State (Kerala) of India. J. Hydrol. 2016, 534, 266–280. [Google Scholar] [CrossRef]
  54. Ganguli, P.; Reddy, M.J. Risk assessment of droughts in Gujarat using bivariate copulas. Water Resour. Manag. 2012, 26, 3301–3327. [Google Scholar] [CrossRef]
  55. Rohde, R. Comparison of Berkeley Earth, NASA GISS, and Hadley CRU averaging techniques on ideal synthetic data. Berkeley Earth Tech. Rep. 2013, 1, 15. Available online: http://static.berkeleyearth.org/memos/robert-rohde-memo.pdf (accessed on 26 December 2018).
  56. Dai, A.; Zhao, T. Uncertainties in historical changes and future projections of drought. Part I: Estimates of historical drought changes. Clim. Chang. 2017, 144, 519–533. [Google Scholar] [CrossRef]
  57. Leander, R.; Buishand, T.A. Resampling of regional climate model output for the simulation of extreme river flows. J. Hydrol. 2007, 332, 487–496. [Google Scholar] [CrossRef]
  58. Panofsky, H.A.; Brier, G.W. Some Applications of Statistics to Meteorology; Penn State University: Centre County, PA, USA, 1968. [Google Scholar]
  59. Van Der Schrier, G.; Jones, P.; Briffa, K.R. The sensitivity of the PDSI to the Thornthwaite and Penman-Monteith parameterizations for potential evapotranspiration. J. Geophys. Res. Space Phys. 2011, 116. [Google Scholar] [CrossRef]
  60. Allen, R.G.; Smith, M.; Perrier, A.; Pereira, L.S. An update for the definition of reference evapotranspiration. ICID Bull. 1994, 43, 1–34. [Google Scholar] [CrossRef]
  61. Allen, R.G. An update for the calculation of reference evapotranspiration. ICID Bull. 1994, 43, 35–92. [Google Scholar]
  62. Lockwood, J.G. Is potential evapotranspiration and its relationship with actual evapotranspiration sensitive to elevated atmospheric CO2 levels? Clim. Chang. 1999, 41, 193–212. [Google Scholar] [CrossRef]
  63. Allen, R.G.; Pereira, L.S.; Raes, D.; Smith, M. Crop Evapotranspiration-Guidelines for Computing Crop Water Requirement; FAO Irrigation and Drainage Paper 56; FAO: Rome, Italy, 1998; p. 300. [Google Scholar]
  64. Alley, W.M. The Palmer drought severity index: Limitations and assumptions. J. Appl. Meteorol. Climatol. 1984, 23, 1100–1109. [Google Scholar] [CrossRef] [Green Version]
  65. Wells, N.; Goddard, S.; Hayes, M.J. A self-calibrating Palmer drought severity index. J. Clim. 2004, 17, 2335–2351. [Google Scholar] [CrossRef]
  66. Dutta, D.; Kundu, A.; Patel, N.R.; Saha, S.K.; Siddiqui, A.R. Assessment of agricultural drought in Rajasthan (India) using remote sensing derived Vegetation Condition Index (VCI) and Standardized Precipitation Index (SPI). Egypt J. Remote Sens. Space Sci. 2015, 18, 53–63. [Google Scholar] [CrossRef] [Green Version]
  67. Preethi, B.; Ramya, R.; Patwardhan, S.K.; Mujumdar, M.; Kripalani, R.H. Variability of Indian summer monsoon droughts in CMIP5 climate models. Clim. Dyn. 2019, 53, 1937–1962. [Google Scholar] [CrossRef]
  68. Ghosh, K.G. Spatial and temporal appraisal of drought jeopardy over the Gangetic West Bengal, eastern India. Geoenviron. Disasters 2019, 6, 1. [Google Scholar] [CrossRef] [Green Version]
  69. Dai, A.; Trenberth, K.E.; Qian, T. A global dataset of Palmer Drought Severity Index for 1870–2002: Relationship with soil moisture and effects of surface warming. J. Hydrometeorol. 2004, 5, 1117–1130. [Google Scholar] [CrossRef]
  70. Dai, A. Characteristics and trends in various forms of the Palmer Drought Severity Index during 1900–2008. J. Geophys. Res. 2011, 116. [Google Scholar] [CrossRef] [Green Version]
  71. Pingale, S.M.; Khare, D.; Jat, M.K.; Adamowski, J. Spatial and temporal trends of mean and extreme rainfall and temperature for the 33 urban centers of the arid and semi-arid state of Rajasthan, India. Atmos. Res. 2014, 138, 73–90. [Google Scholar] [CrossRef]
  72. Singh, A.K.; Tripathi, J.N.; Singh, K.K.; Singh, V.; Sateesh, M. Comparison of different satellite-derived rainfall products with IMD gridded data over Indian meteorological subdivisions during Indian Summer Monsoon (ISM) 2016 at weekly temporal resolution. J. Hydrol. 2019, 575, 1371–1379. [Google Scholar] [CrossRef]
  73. Herrera, D.; Ault, T. Insights from a new high-resolution drought atlas for the Caribbean spanning 1950–2016. J. Clim. 2017, 30, 7801–7825. [Google Scholar] [CrossRef]
  74. Gutmann, E.; Pruitt, T.; Clark, M.P.; Brekke, L.; Arnold, J.R.; Raff, D.A.; Rasmussen, R.M. An intercomparison of statistical downscaling methods used for water resource assessments in the United States. Water Resour. Res. 2014, 50, 7167–7186. [Google Scholar] [CrossRef]
  75. Bhuiyan, C.; Singh, R.P.; Kogan, F.N. Monitoring drought dynamics in the Aravalli region (India) using different indices based on ground and remote sensing data. Int. J. Appl. Earth Obs. 2006, 8, 289–302. [Google Scholar] [CrossRef]
  76. Mishra, A.K.; Desai, V.R. Spatial and temporal drought analysis in the Kansabati river basin, India. Int. J. River Basin Manag. 2005, 3, 31–41. [Google Scholar] [CrossRef]
  77. Mittal, N.; Mishra, A.; Singh, R.; Bhave, A.G.; Van der Valk, M. Flow regime alteration due to anthropogenic and climatic changes in the Kangsabati River, India. Ecohydrol. Hydrobiol. 2014, 14, 182–191. [Google Scholar] [CrossRef]
  78. Bhattacharya, T.; Panda, R.K. Effect of climate change on rice yield at Kharagpur, West Bengal. Int. J. Food Agric. Vet. Sci. 2013, 4, 6–12. [Google Scholar] [CrossRef]
  79. Joshi, N.; Rahaman, M.; Thakur, B.; Shrestha, A.; Kalra, A.; Gupta, R. Assessing the effects of climate variability on groundwater in Northern India. In Proceedings of the World Environmental and Water Resources Congress 2020: Groundwater, Sustainability, Hydro-Climate/Climate Change, and Environmental Engineering, Henderson, NV, USA, 17–21 May 2020; pp. 41–52. [Google Scholar] [CrossRef]
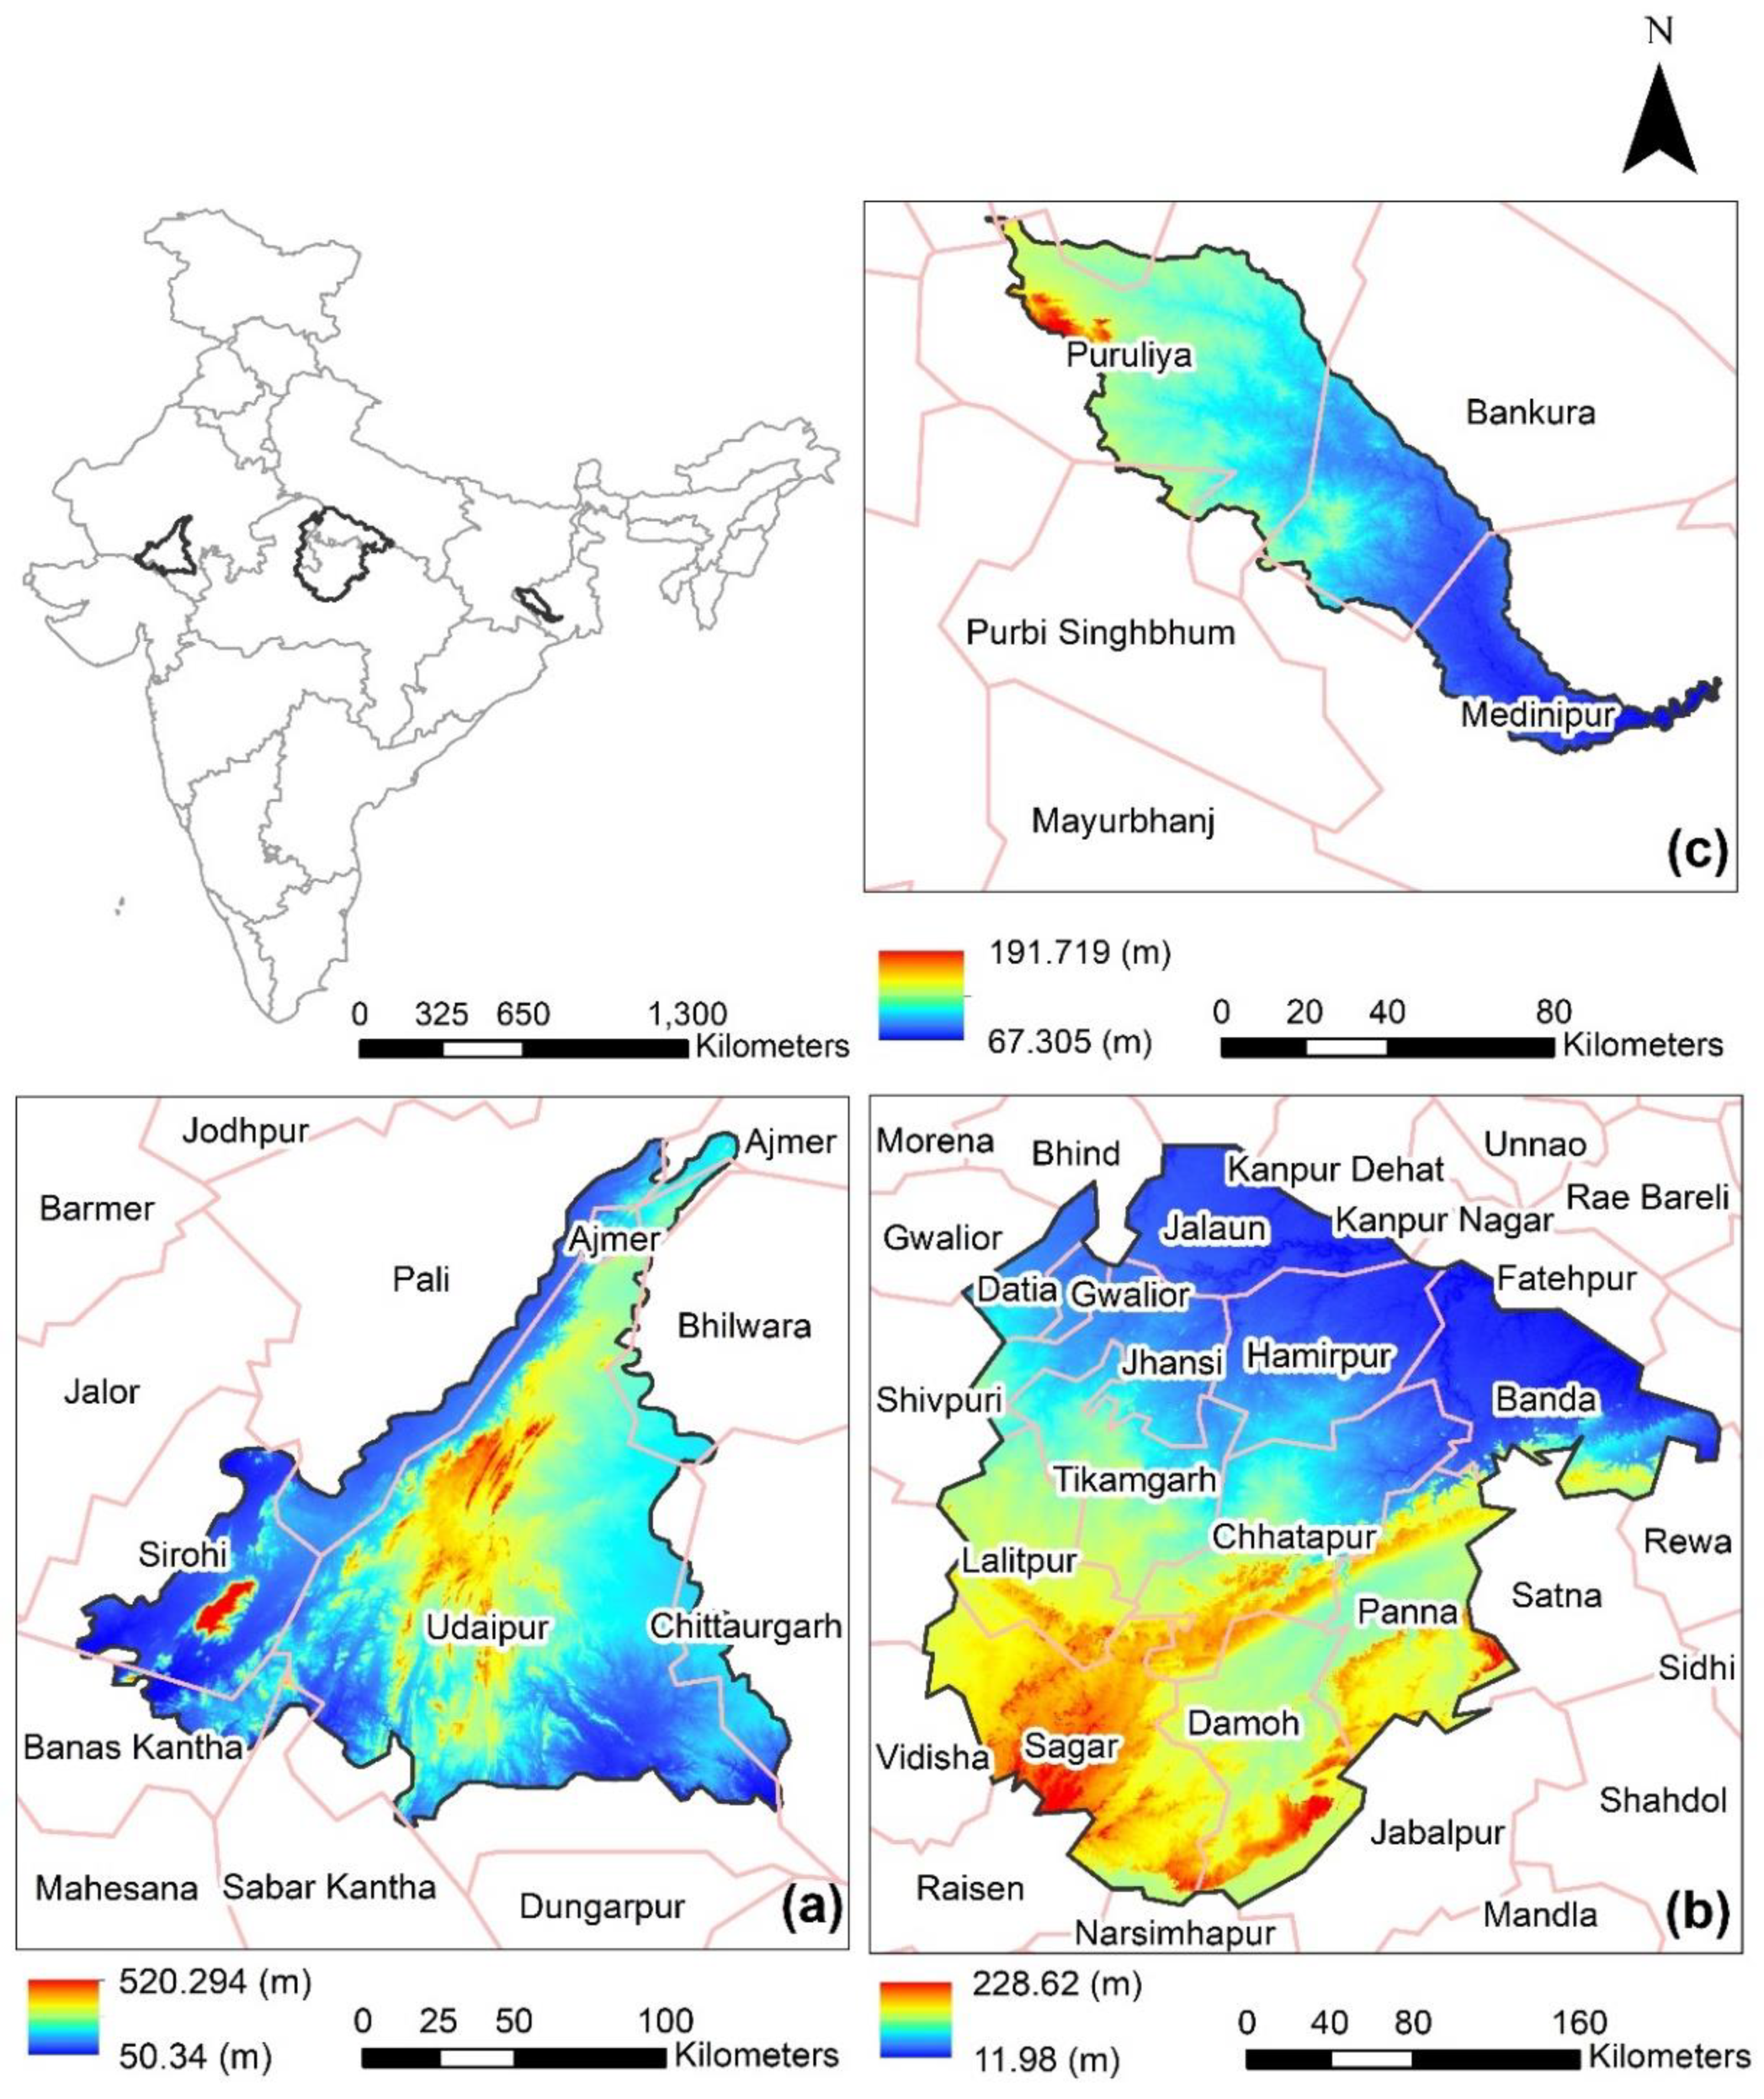
Figure 1. Elevation map of the study areas. (a) Araveli Region (b) Bundelkhand Region (c) Kansabati River Basin. The scale bar represents the elevation in meters.
Hydrology 07 00033 g001
Figure 2. Flowchart showing steps followed to downscale temperature.
Hydrology 07 00033 g002
Figure 3. Flowchart showing downscaling procedure of precipitation.
Hydrology 07 00033 g003
Figure 4. Scatterplots of basin averaged monthly mean values maximum temperatures (Tmax), minimum temperatures (Tmin) and precipitation (Prcp.) obtained from downscaled data and India Water Portal stations data between 1950 and 2002. Each row of scatterplots relates to each of the study area.
Hydrology 07 00033 g004
Figure 5. Taylor diagrams for all variables. (a,d,g) for Tmin; (b,e,h) for Tmax; (c,f,i) for Prcp. in each study area. Top row for AV; Middle row for BK; Bottom row for KSB.
Hydrology 07 00033 g005
Figure 6. Various events of major droughts (a,b) of at least two years of duration observed in the Araveli study area from 1950 to 2016. Each plot shows the averaged value of the self-calibrating Palmer Drought Severity Index (scPDSI) over the drought period. The scalebar represents corresponding scPDSI units.
Hydrology 07 00033 g006
Figure 7. Various events of major droughts (ad) of at least two years of duration observed in the Bundelkhand Region during 1950 to 2016. Each plot shows the averaged value of scPDSI over the drought period. The scalebar represents corresponding scPDSI units.
Hydrology 07 00033 g007
Figure 8. Various events of major droughts (a,b) of at least two years of duration observed in the Kansabati Region from 1950 to 2016. Each plot shows the averaged value of scPDSI over the drought period. The scalebar represents corresponding scPDSI units.
Hydrology 07 00033 g008
Figure 9. Time series of drought affected area in percentage for all three study areas calculated on the basis of percentage of grid cells facing drought with scPDSI ≤ −1.5 (mild drought) and scPDSI ≤ 3 (severe drought). (a) Araveli Region, (b) Bundelkhand Region, (c) Kansabati River Basin.
Hydrology 07 00033 g009
Figure 10. Frequency plots concerning the number of months of drought per year for all three study areas selected based on scPDSI ≤ −1.5 for each grid cell. (a) AV (b) BK (c) KSB. The scale bar represents the number of months.
Hydrology 07 00033 g010
Table 1. Table showing climate datasets used.
DatasetSpatial ResolutionTime PeriodVariableSpatial Coverage
BEST1950–2016TemperatureGlobal
NCEP-NCAR reanalysis2.5°1950–2016Global
Worldclim2 (climatology)1 km1970–2000Global
India Water PortalStation data1950–2002In India only
GPCC version 71950–2016PrecipitationGlobal
CHIRPS0.05°1981–2016Global
Worldclim2 (climatology)1 km1970–2000Global
India Water PortalStation data1950–2002In India only
NCEP-NCAR reanalysis1950–2016Cloud coverGlobal
NCEP-NCAR reanalysis2.5°1950–2016WindspeedGlobal
SRTM Elevation30 m-ElevationGlobal
Table 2. Table showing Drought Severity Index values.
SeverityIndex Values
Mild≤−1.5
Severe≤−3.0
Extreme≤−4.0
Table 3. Statistical parameters for each variable for each study area.
Study AreaStatistical ParametersMinimum TemperatureMaximum TemperaturePrecipitation
AVRMSE1.872.7541.21
Correlation0.950.910.92
Bias−0.531.50−0.98
BKRMSE2.752.8347.81
Correlation0.960.930.94
Bias−1.160.785.03
KSBRMSE1.522.0849.69
Correlation0.910.910.93
Bias0.14−0.18−3.14