Article

Flash Flood Impact Assessment in Jeddah City: An Analytic Hierarchy Process Approach

Department of Urban and Regional Planning, Imam Abdulrahman Bin Faisal University, P. O. Box 1982, Dammam 32141, Saudi Arabia
Hydrology 2020, 7(1), 10; https://doi.org/10.3390/hydrology7010010
Submission received: 2 January 2020 / Revised: 29 January 2020 / Accepted: 2 February 2020 / Published: 6 February 2020

Abstract

:
Floods are among the most destructive natural hazards that cost lives and disrupt the socioeconomic activities of residents, especially in the rapidly growing cities of developing countries. Jeddah, a coastal city situated in Saudi Arabia, has experienced severe flash flood events in recent years. With intense rainfall, extensive coastal developments, and sensitive ecosystems, the city is susceptible to severe flash flood risks. The objective of this article is to apply an Analytic Hierarchy Process (AHP) model to explore the impacts of flash flood hazards and identify the most effective approaches to reducing the flash flood impacts in Jeddah using expert’s opinions. The study utilizes experts’ judgments and employs the AHP for data analyses and modeling. The results indicated that property loss has the highest probability of occurrence in the events of a flash flood with a priority level of 42%, followed by productivity loss (28%). Injuries and death were rated the least priority of 18% and 12%, respectively. Concerning flood impact reduction alternatives, river management (41%) and early warning system (38%) are the most favorable options. The findings could assist the government to design appropriate measures to safeguard the lives and properties of the residents. The study concludes by underscoring the significance of incorporating experts’ judgments in assessing flash flood impacts.

1. Introduction

Recent decades have witnessed incessant and immeasurable impacts of floods across the globe. Floods are the most devastating and the costliest of natural disasters that destroy properties, and the lives of millions, accounting for nearly 34% of human loss caused by natural disasters [1]. Estimates show that between 1995 and 2015, 43% of all the documented natural disasters were caused by floods, disrupting the lives of 2.3 billion people around the globe, causing damages worth USD662 billion, and killing 157,000 people [2]. By 2050, the number of people susceptible to flooding is expected to reach 2 billion as a result of climate change, rapid population growth in flood-prone areas, deforestation, loss of wetlands, and sea-level rise [3,4].
Urban areas are the primary contributors to climate change due to the concentration of major activities that generate greenhouse gas emissions. The proportion of global urban dwellers is anticipated to grow from 54% in 2018 to 68% by 2030, with only African and Asian continents accounting for about 90% of the estimated 2.5 billion rise in urban populations from 2015 to 2050 [5]. According to an estimate by the World Bank [6] (p. 15), roughly 70% of the global CO2 emissions are generated in urban areas, with buildings and transportation being the key contributors. These have triggered global warming and the occurrence of natural disasters such as floods. Thus, urban decision-makers must be the key actors in combating climate change and promoting sustainability [3]. To help alleviate the devastating impacts of natural hazards, urban development stakeholders are increasingly directing their attention to flood risks and risk reduction alternatives. The Sustainable Development Goal (SDG) number 11, target 5 sets by 2030 to “significantly reduce deaths and economic losses caused by disasters, including water-related disasters” [5].
Saudi Arabia experiences a series of flood events annually in different parts of the country [7,8,9]. The country’s three largest cities of Jeddah and Dammam located along the coast, and Riyadh encircled by valleys, do experience frequent occurrences of floods in the nation [10]. Due mainly to geographical (e.g., low elevation) and topographical features (mountains and inadequate slope), as well as other natural and anthropogenic factors, flash floods are the most recurring natural disasters in these areas [7,8,11,12]. Flash floods occur when rainwater exceeds the absorptive capacity of the drainage basins, subjecting the basin outlets to a sudden high discharge of heavy inflow of water into the environment.
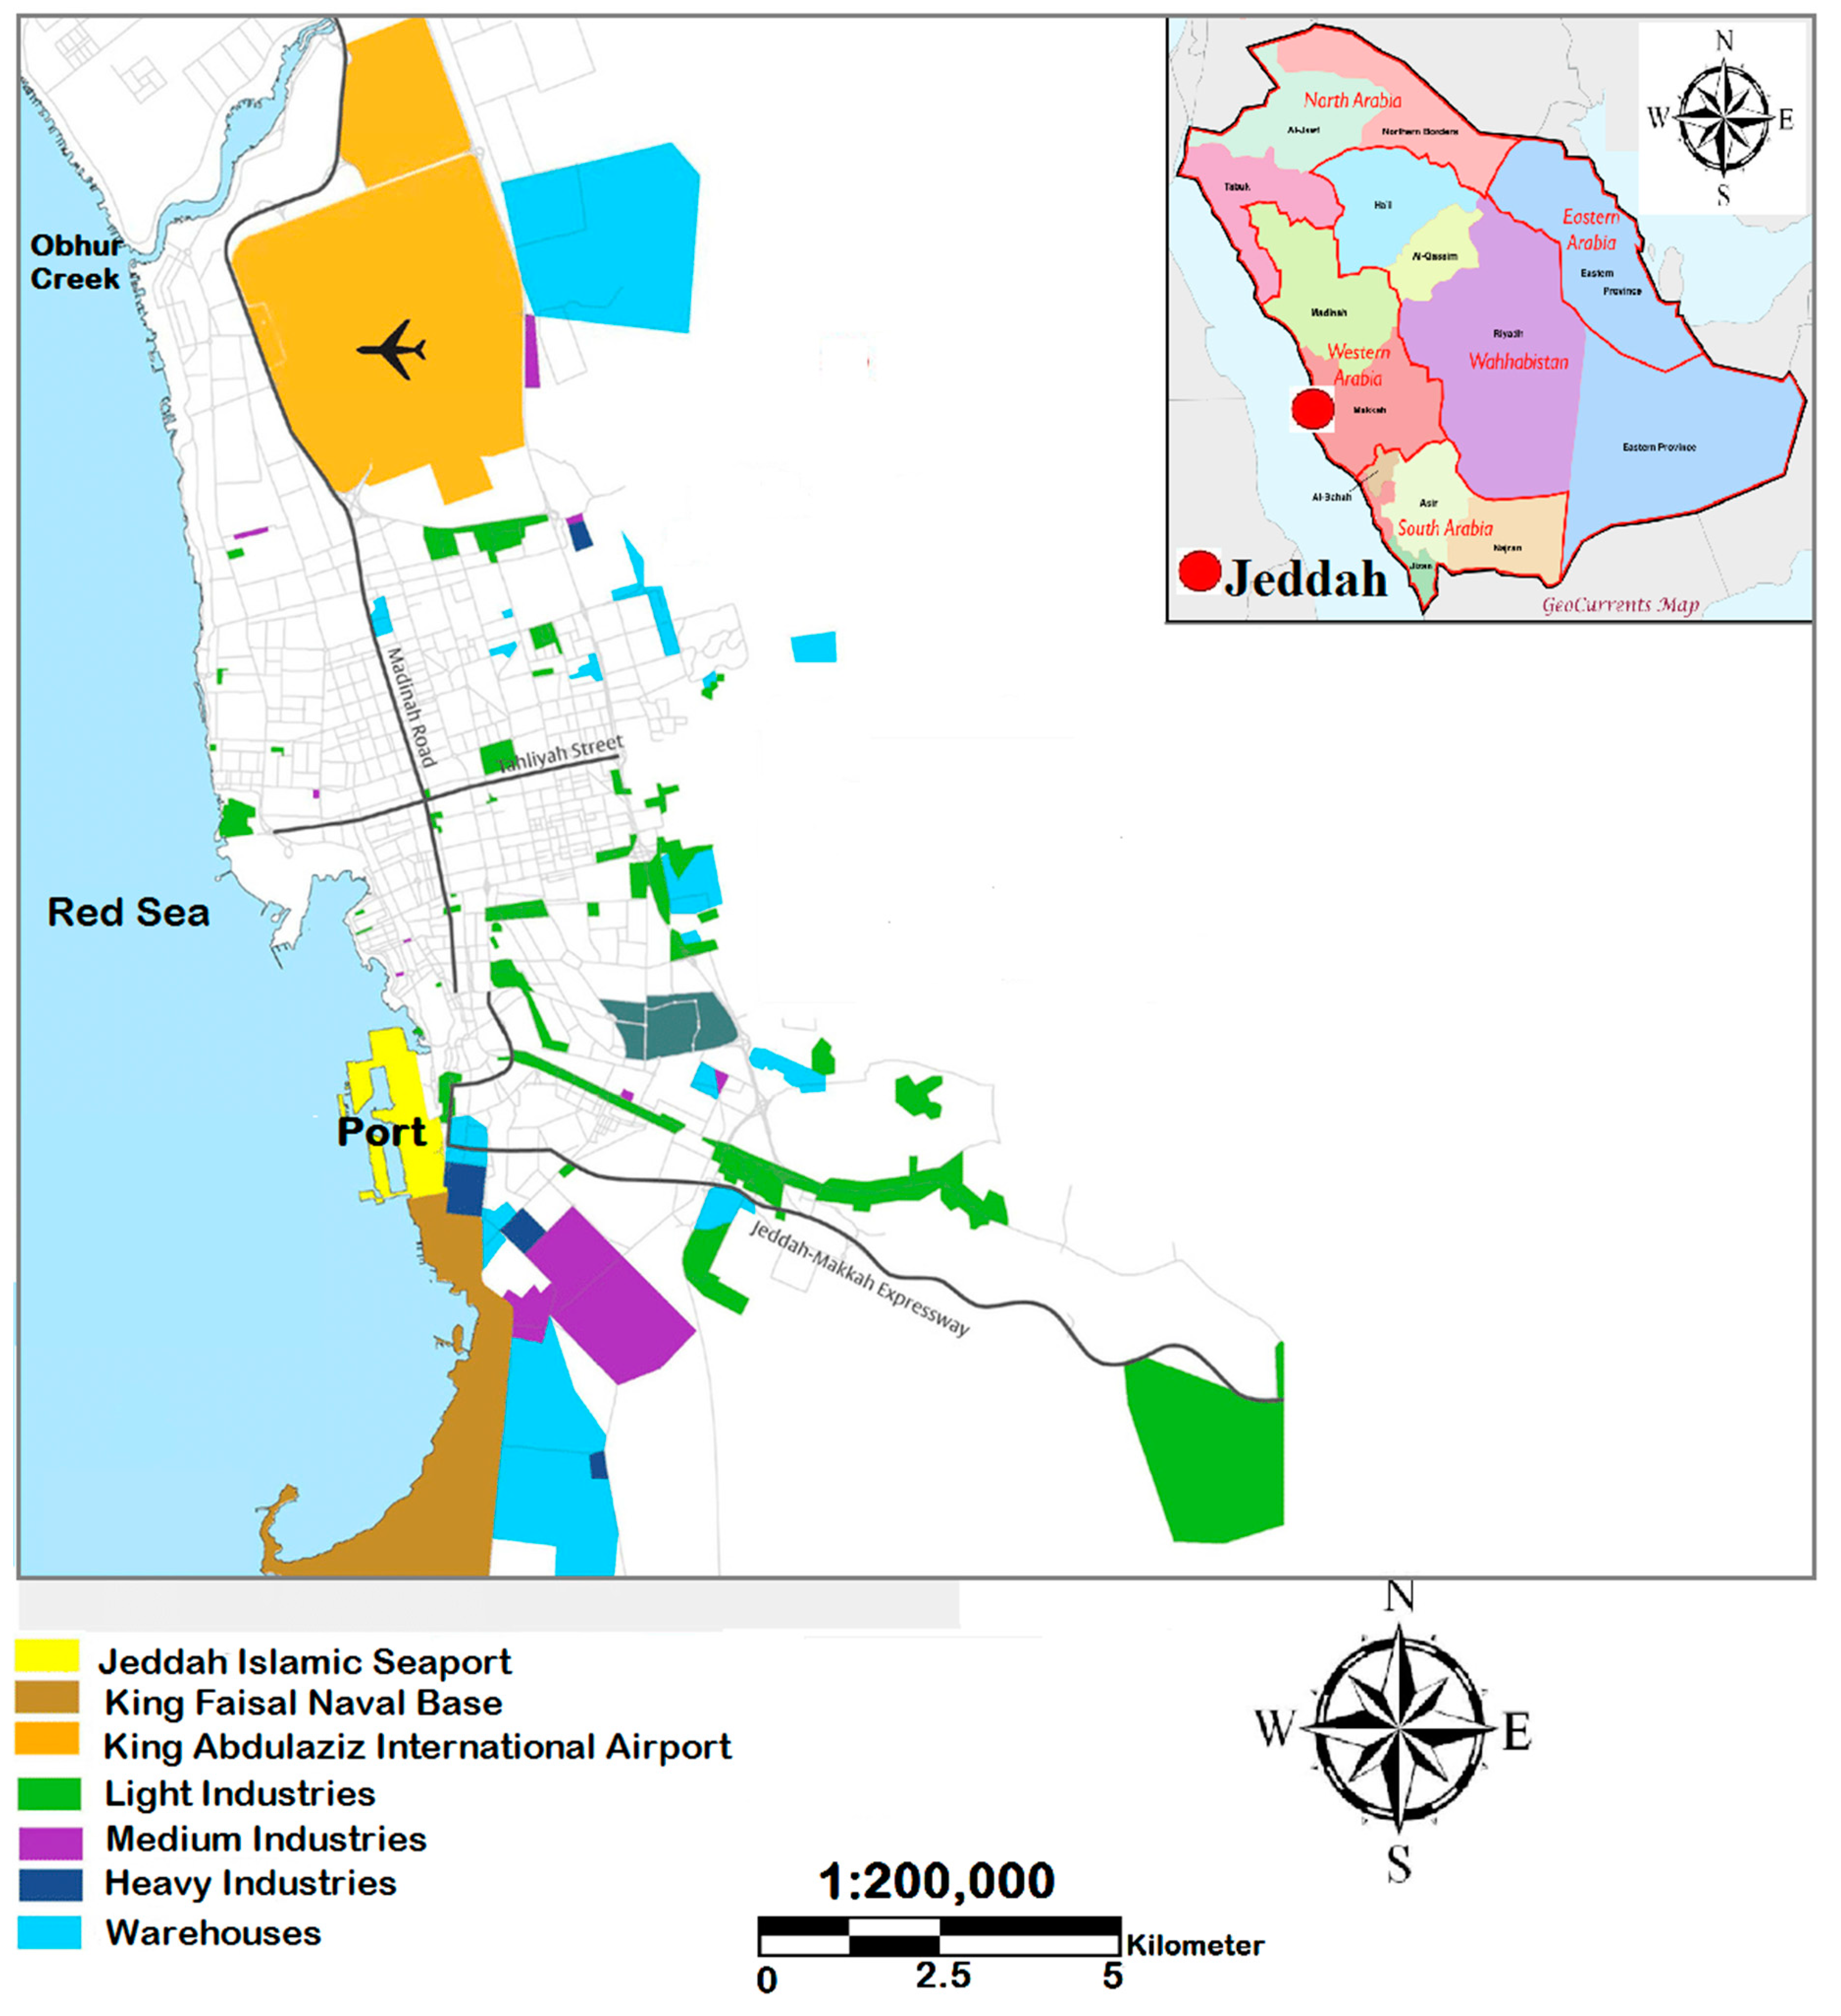
Jeddah city has within the last decade experienced several events of recurring flash floods which have caused human loss and severe damage to road infrastructures, settlements, and economic activities, especially along the floodplains of the Red Sea [13]. In 2009 and 2011, average damages caused by flash floods in the city cost nearly 10 billion Saudi Riyals (USD 2.6 billion) (USD 1 = 3.75 Saudi Riyals) [9]. The 2009 event killed 113 people, destroyed 10,000 houses and 17,000 vehicles [9]. Similarly, the importance of combating floods has been declared by the UN’s SDG 15.3 that called for global efforts to reduce the risks of floods, desertification, and drought to realize a degradation and disaster-free world and to improve the socioeconomic wellbeing of the people. With the recent increases in loss of lives, productivity, and properties resulting from flood disasters worldwide, sustainable flood risks assessment is required. Flood risk assessment is a vital tool for analyzing the likelihood and impacts of flood disasters. It provides useful information to decision-makers and enables them to strategize their responses to mitigate flood disasters. Billa et al. [14] indicated the urgent need for flood control and prevention measures to minimize the adverse impacts of flooding. The existing flash flood control practices in Jeddah involves (a) small-scale flood controls such as ponds, drainages, and seasonal cleaning and maintaining open channels by the private sectors and individuals; and (b) large-scale flood controls undertaken by the government which includes stormwater drainage and large dams [15]. However, these approaches are inadequate without an early warning system, which the government is planning to establish for disaster management. As such, experts’ ranking of the relative severity of flood impacts and the most effective approaches to reducing flood risks in Jeddah could provide valuable inputs to more effective design and implementation of the planned warning system.

2. Previous Studies

Several studies have been conducted worldwide on flood hazards and susceptibility mapping, flood monitoring, and flood risk analyses using Multi-Criteria Decision-Making (MCDM) techniques such as Analytic Hierarchy Process (AHP) and Analytic Network Process (ANP). As the MCDM techniques elicit and model experts’ flood preferences, they have several advantages, when it comes to evaluating flood impacts and determining risk mitigation measures, over other flood susceptibility assessment techniques such as probabilistic methods, hydrological and stochastic rainfall techniques, and data mining models that are more suitable for assessing flood causative factors [16]. Thus, several studies have utilized the MCDM technique in assessing and mapping flood susceptible zones [17,18,19,20,21]. Among the MCDM techniques, AHP is the most widely used technique in addressing flood disaster challenges because of its ability to solve a wide range of multiple-criteria decision-making problems using a pairwise comparison matrix to generate priority weights for each decision element [22,23,24,25,26,27].
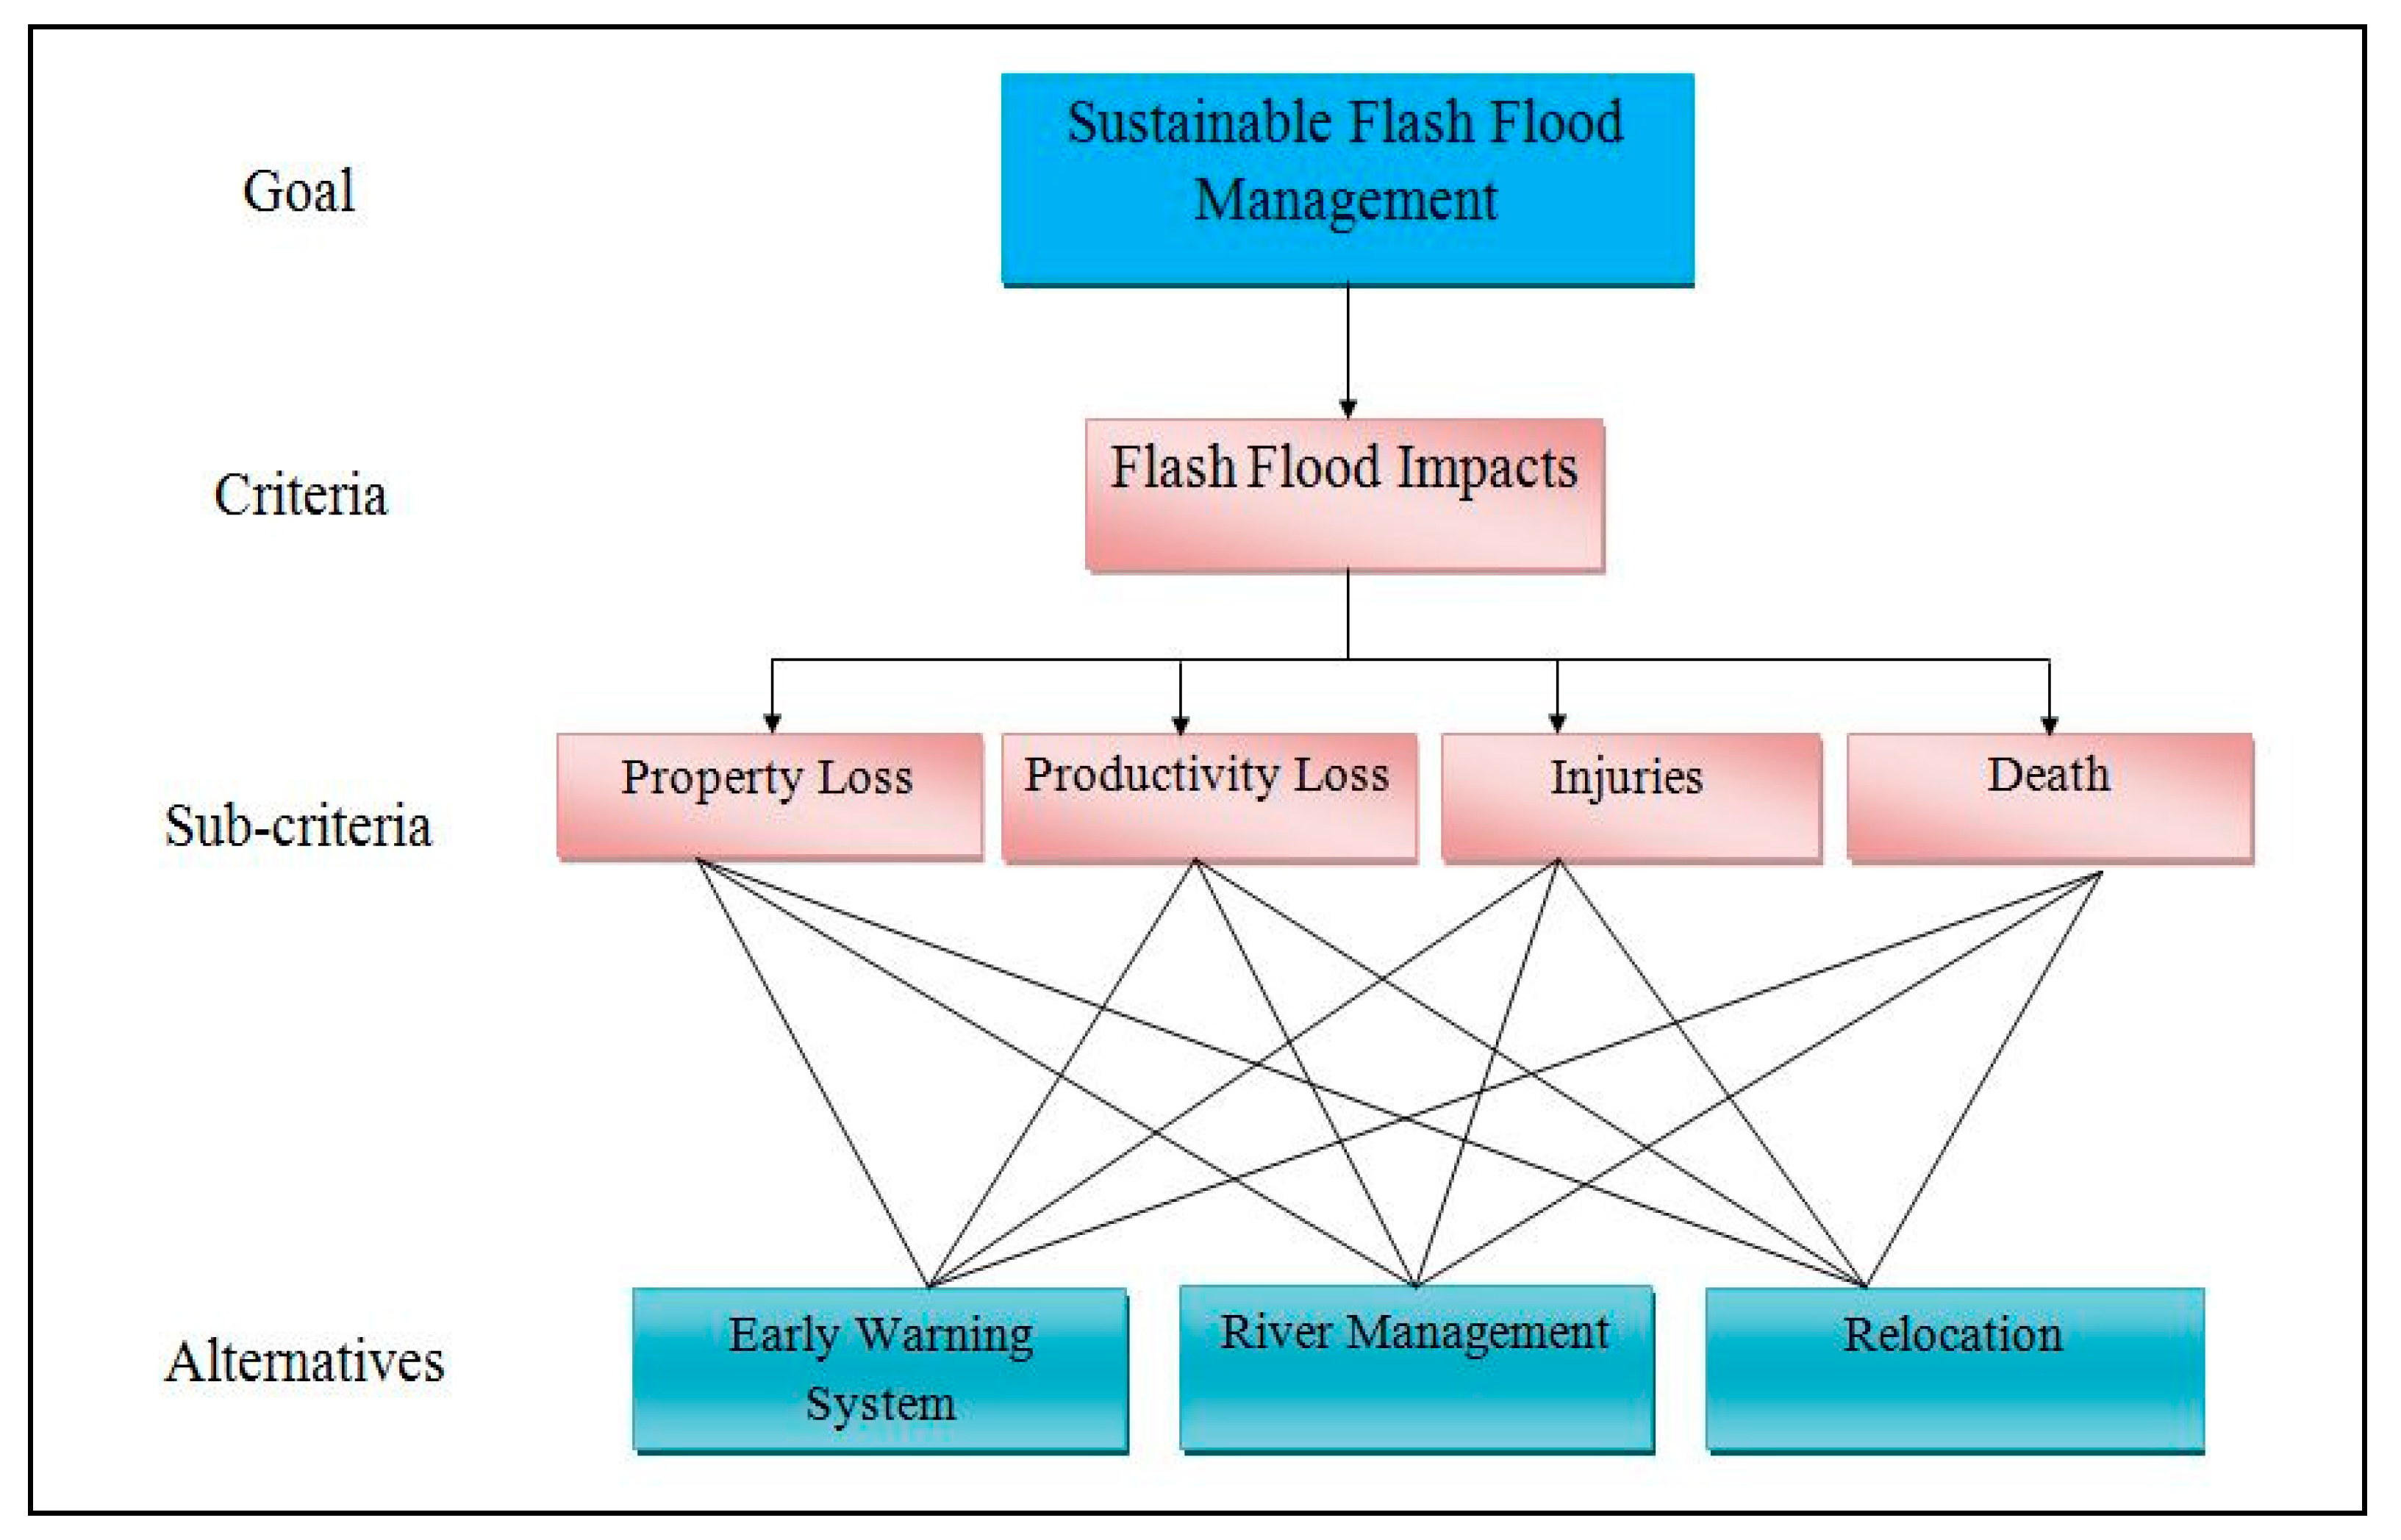
An AHP is a concept developed by Thomas L. Saaty based on MCDM principles. The concept addresses complex decision-making problems by decomposing them into units and subunits in a hierarchy. It is a mathematical model that analyzes and models complex decision problems through a structured hierarchy technique consisting of an overall goal, cluster of criteria or factors, and a cluster of alternatives or options related to the criteria for achieving the goal. The first stage in developing the hierarchy model is structuring the decision problems into a hierarchical chart, where the decision elements are structured in an interconnected elemental order, with the goal topping the hierarchy, followed by the criteria, sub-criteria, and alternatives at the bottom of the hierarchy.
The AHP approach has been utilized globally in flood risk mapping, susceptibility and impact assessment. In Perlis, Malaysia, Lawal et al. [28] forecasted areas susceptible to flooding using a group-based AHP and found that rainfall (0.44%), slope gradient (1.67), and geology (1.06) were the highest-ranked flood causative factors by weight. Similarly, Seejata et al. [29] have utilized AHP to map flood risk-prone districts in Sukhothai province, Thailand, and found that the most weighted factors contributing to flooding were rainfall intensity (4.0), river density (2.6), and slope (1.6). In Rhodope–Evros region of Greece, Kazakis et al. [30] employed AHP to assess flood hazard areas by estimating the weights of seven parameters with flow accumulation having the highest weight (3.0), followed in equal weight (2.1) by drainage distance and elevation. Additionally, in southeastern Tunisia, Souissi et al. [27] developed a flood susceptibility map using eight factors with elevation being the most prominent flood occurrence factor (0.23), followed by land use/land cover (0.18). In Abidjan, Cote D’Ivoire, Danumah et al. [25] used AHP to assess the risk of flooding and found that the highest weighted parameter was slope (4.31) and then rainfall (4.20). Adam [31] employed AHP in modeling flood hazards based on expert-based and public opinions to prioritize the likely impacts of floods and the efficacy of the available strategies for reducing flood impacts in Makassar city, Indonesia. The literature review above indicates the wider applicability of the AHP method in assessing and mapping flood risk zones. However, the reviewed prior studies are largely limited to exploring flood triggering factors. A notable exception is Adam [31] who investigated potential flood impacts but merged human loss and injuries as a single variable, despite their different disaster responses and global best practice of reporting [2]. Therefore, the novelty of the present study is assessing the likely impacts of floods on people and the environment, with a view of identifying the appropriate risk reduction alternatives, which are less investigated in the literature.
In Saudi Arabia, few studies have researched flood risk impacts and the efficacy of mitigation alternatives; however, more attention has been given to human-made disasters such as traffic accidents, fires, and stampedes [10]. In Riyadh city, Rahman et al. [11] estimated the extent of the physical and social vulnerability of the residents to flash flooding. The study classified the areas within the city as highly, moderately, and the least vulnerable to flash flooding, as well as the vulnerability of the residents according to income, employment, and nationality. In another study in Riyadh, Ledraa and Al-Ghamdi [32] investigated the challenges faced by the city administration in flash flood planning and management and recommended a more integrated approach that ensures public participation and good governance. In Makkah area, Subyani [33] estimates flood triggering hydrological factors in three low-lying areas. A thorough literature search on the application of MCDM techniques in flood assessment in the country yielded only one published article [34]. Radwan et al. [34] utilized AHP to assess flood risks in Riyadh city based on soil, geology, rainfall, elevation, and drainage systems data, and categorized the city into very low, low, medium, high, and very high risks zones.
In Jeddah, being a vulnerable city faced with recurrent flash flood hazards, more studies have been conducted compared to other Saudi cities. For instance, Maghrabi [35] assessed the impacts of flooding on the mental health of flood victims using descriptive statistics. The author found the highly scored impacts were feeling of fear of places and situation (4.43), jumpiness, easily frightened by sound (4.34), and then followed by sleeping problems (3.80). In another study, Haggag and El-Badry [36] simulated the extreme precipitation that caused the 2009 flash floods in Jeddah. Youssef et al. [9] utilized statistical methods to assess flash flood susceptibility in Jeddah city using factors such as rainfall, soil, geology, slope, drainage, elevation, and distance from the streams. Tekeli [37] estimated flood occurrences using three indices developed from rainfall, soil moisture, topography, and land use parameters. Another study by Al Saud [38] mapped areas that are prone to flash floods based on flood triggering factors: elevation, drainage system, soil type, and human activities. However, these studies mainly address the flood triggering factors with limited focus on the impacts of floods as well as their reduction options.
The above studies mainly assessed flood risk using conventional data such as geological, geomorphological, hydrological, and meteorological data, which mostly require long-term and large data, for example, spatio-temporal data. However, these study methods posed certain challenges of data availability, data scale, incomplete data, and data interpretations [31]. Certainly, there is the need to complement such studies by employing the opinions of experts in determining flash flood impacts and the efficacy of flood impacts reduction alternatives in the study area. The present study method can serve as a supplementary or an alternative to conventional methods, depending on the study’s objectives. Therefore, to bridge this research gap and contribute to the growing literature on the topic, the present study aims to apply an AHP model to explore the impacts of flash flood hazards and identify the most effective approaches to reducing the flash flood impacts in Jeddah using expert’s opinions. This study is important because it provides an alternative means of measuring flash flood impacts and ranking the effectiveness of flood impact reduction measures based on the MCDM technique.

3. Materials and Methods

3.1. Study Settings

Jeddah metropolis is situated in the west-central province of Saudi Arabia on latitude 21°32′32.57″ N and longitude 39°11′52.69″ E, at an altitude of 15 m (49 ft) above sea level, and along the coastal plain of the Red Sea (Figure 1). In the 1950s, Jeddah was the country’s largest town with around 119,000 inhabitants, and by 1995 the population rose to 2.2 million, and after about two decades, it is almost doubled to 4.08 million in 2016, which represents one-eighth of the country’s total population [39]. It is currently the second-largest city in the country after Riyadh. Apart from job opportunities in trade and manufacturing, housing the country’s busiest international airport and the largest seaport for import/export as well as its nearness to the holy city of Makkah have been contributing to the population growth rate of 3.5% per annum [39]. The city’s climate is usually hot and humid during the summer period, with temperatures ranging from 40 to 50 °C. The mean annual precipitation is roughly 52.5 mm, with maximum precipitation of 284 mm reported having occurred in 1996. The precipitation is occasional, and it occurs from November to April with intense thunderstorms; thus, it causes several cases of flash floods which flooded the city through natural drainages called wadis. The wadis are situated in the eastern part of the city and pass through masses of hills and pediments. Severe flood events were recorded in 2009 and 2011, causing immeasurable damages to properties and killed over 113 people [9].

3.2. Data Sources and Analyses

The data utilized in the current study were obtained through an expert-based questionnaire survey administered to 16 key informants with experience in flood disaster, impacts, and mitigation (Table 1). According to Saaty and Özdemir [40], an opinion from a single well versed and experienced individual in an area, his/her knowledge can be relied on to provide the opinions. Moreover, the reason the present study used more than one expert is to avoid bias [41]. Compared with the present study, several prior studies on flood assessments and modeling based on the AHP model have used smaller numbers of experts such as eight experts [42], nine experts [25,43], 10 experts [44,45], and 16 experts [46].
The questionnaire elicits the respondents’ opinions about the likely impacts of flash floods in Jeddah city and the most effective alternatives for reducing the impacts. The questionnaire was developed through two steps. First, flood impacts criteria and risk reduction alternatives were determined through a thorough literature survey. As such, four major impacts of flooding were identified: death, injuries, productivity loss, and property loss; and three most preferred alternatives for reducing flash flood impacts were also identified: relocation, early warning system, and river management [31,47]. Second, the experts were expected to rank the selected criteria and alternatives by comparing two criteria at a time using a pair-wise comparison matrix based on Saaty’s fundamental scale of judgment denoted by numbers 1–9 (Table 2).
The questionnaire was piloted among colleagues to fix ambiguities such as checking the wording to guarantee that respondents understood the questions within the context and to derive consensus opinions on the flood impacts criteria and alternatives. The application of questionnaire survey and group interaction for consensus weighting has been ascertained as a means of achieving impartiality in judgment [40,41]. To identify suitable experts to participate in the study, a review of literature on the subject matter in the Middle East and Asia yielded 28 academics with research interests that match the objectives of the present study. These were invited via email to participate in the study, where 16 agreed to participate in the study. The author had face-to-face, email, and phone communications with the participants to introduce the study, the criteria, and alternatives, as well as the implications of each criterion on each alternative. The benefits of developing a flash flood impact management model were further explained to them to aid their understanding of the topic and filling the questionnaire.

3.2.1. Respondents Preference Aggregation/Combination

The analysis of the completed questionnaires started with calculating priority weights that suitably reflected the collective ratings of all the respondents; thus, the individual preferences needed to be combined to generate a single consensus preference matrix. According to the literature, four main methods are used in aggregating individual judgments into a single consensus preference matrix suitable for all: (a) geometric mean method (GMM); (b) separate models or player; (c) vote or compromise, and (d) consensus, and some studies use the arithmetic mean method [48,49,50]. This study employed the GMM due to its suitability and consistency of combining individual ratings over other methods [51]. Additionally, it is capable of handling the issue of reciprocity of judgments [52]. GMM aggregates individual preferences of respondents to calculate their mean, which are then to be fed into the pairwise comparison table as values in the pairwise matrices used in computing local priorities using the AHP described below.

3.2.2. Analytic Hierarchy Process

In the AHP, each pair of the elements is compared based on the respondent’s judgments denoted by n (n − 1)/2, where n stands for the size of the respondents in the matrix. Through the pairwise comparison, the importance of each criterion or alternative over its brother criterion/alternative is determined. The comparison is carried out by comparing two criteria at a time in the hierarchy or subhierarchy levels. Then, the criteria are utilized to determine their effects on the choice of each flash flood reduction alternative. The next stage involves using the comparison matrix output to determine the strength of the AHP analysis executed for the flash flood impact management model. For example, if the value of the calculated matrix is X, the priority weight is acquired from an equation Xw = λ max, w, where w and λ stand for eigenvector and eigenvalue, respectively. Thus, from the generated pairwise comparisons, the largest eigenvalue indicated by λ max stands for the consistency index (CI) of the matrix calculated as CI = ( λ max − n)/(n − 1).
Furthermore, a consistency ratio (CR) is calculated to assess the consistency of the judgments using an equation denoted by CR = CI/RI, where RI stands for the random inconsistency index (Table 3). The RI is presented in Table 3 below in two rows, where the first row represents the sequence of the randomly generated matrix, and the second row represents the corresponding index of consistency for randomly generated judgments. The value of the CR is said to be consistent when it does not exceed 0.10 (10%); however, if the value exceeds 0.10, the set of judgments are assumed to be inconsistent to rely upon. The final stage is the estimation of the relative weights derived from the local priorities of each criterion. This is by calculating the average of all values in each row of the normalized comparison matrix.

3.2.3. Modeling the Problem

An AHP model was employed to explore the impacts of flash flood hazards and identify the most effective approaches of reducing the flash flood impacts by decomposing the decision problem into units and subunits [54], which could help reduce the incessant impacts of flash flooding in the study area. AHP modeling composed of six basic steps of MCDM, namely (a) structuring the problem, (b) obtaining judgments reflecting the knowledge of respondents, (c) representing the respondents’ judgments with meaningful values, (d) using the values to compute the priorities of the decision components of the hierarchy, (e) synthesizing the outputs to derive global priories (overall output), and (f) conducting a sensitivity analysis to see the effects of changes in the respondents’ judgments. One At a Time (OAT) technique of sensitivity analysis was employed to examine how sensitive the alterations are to the flash flood impact criteria. Hence, the abovementioned steps were adopted in modeling the impacts of flash flooding in the city.
The main criteria were structured and decomposed into sub-criteria in a hierarchy with feedbacks from the alternatives at the bottom of the hierarchy to assess the flash flood impact factors, as illustrated in Figure 2. The structure was designed into clusters in the model, with the upper cluster containing the primary criteria (flash flood impacts), followed by the secondary factors considered as the children nodes of the primary criteria at which the flash flood impacts are based. The alternatives are proposed as solutions to flash flood impacts reduction with some benefits including reducing flash flood impacts by relocating the flash flood victims, establishing early warning systems, and managing the river. The primary criteria and its sub-criteria are linked to the abovementioned alternatives; that is, their importance on the flash flood impacts assessment depends on the type of flash flood disaster management alternative selected.
In AHP, generating the priority vectors is done through pairwise comparison of the judgments. It involves calculating the priorities of a pairwise comparison, which is achieved using the GMM, the principle of eigenvector or arithmetic mean technique [55]. This is based on Equation (1) below:
X   ·   Y   =   λ · Y
where,
  • X stands for the comparison matrix,
  • Y stands for the priority vector, and
  • λ stands for the maximum eigenvalue.
According to Ishizaka and Labib [41], the eigenvector approach suffers from the issue of rank reversal when matrices’ dimension is greater than 3; and therefore, preferred the use of GMM due to its minimal errors. Equation (2) below shows the mathematical definition of a GMM (∏) as the root of the product of numbers:
Π = x 1 x 2 x 3 x 4 x 5 x n n
where,
  • n = the number of respondents
  • x = the value scored by each respondent

4. Results

This section presents the findings of the study based on the stated objective of applying an AHP model to explore the impacts of flash flood hazards and identify the most effective strategies of reducing the flash flood impacts in the study area. It first presents the preferences of each of the flash flood criteria and alternatives over the other through pairwise comparison judgments with respect to the likely impacts of flash flood and the most effective reduction alternatives. Next, it assesses the priority vectors for each criterion and alternative. Then, it explores whether these criteria and alternatives can measure and reduce flash flood impacts in the study area.

4.1. Ranking of Flash Flood Impacts Criteria

As illustrated in Table 4, property loss received the highest score with 42% probability of occurrence in the event of a flash flood in the study area, followed by productivity loss (28%), while, injuries and death are ranked the third and fourth with 18% and 12%, respectively. This implies that the experts regarded property loss as the most frequent impact of flash floods compared with the other impacts. This finding corresponds to the 2017 global disaster report that found that while the incidence of mortality due to flood disasters has decreased in recent years, the rate of property loss is increasing [1]. Though, the worst flash flood impacts seem to be injuries and death as they affect people’s lives directly; however, their chances of occurrence are low compared to property loss and productivity loss. The output of the inconsistency ratio for this matrix is 0.01; so, it is within the tolerable limits of less than or equal to 0.100 (10%) as highlighted earlier under the AHP methodology subsection.

4.2. Ranking of Flood Impacts Reduction Alternatives

The next evaluation involves comparing the effects of each alternative (relocation, river management, and early warning system) on each distinct flash flood impact (criterion). This reveals the experts’ judgments about the effects of the flash flood reduction alternatives on each criterion and vice versa. Table 5 presents the judgment matrix with respect to death reduction based on the alternatives. To reduce the chances of death during flash flood events, the respondents have rated establishing an early warning system as the most effective approach with a score of 43%, which is followed by river management (41%) as the second-best alternative action, with relocation being the least important (16%). This is because the respondents likely thought that relocation will not be the best option as people do not usually want to vacate their houses despite being exposed to a high level of disaster risks. Table A1, Table A2 and Table A3 in Appendix A present the results of the judgment matrices with respect to injuries, property loss, and productivity loss reduction based on the alternatives.
Values for each alternative with respect to the flash flood impacts are illustrated in Figure 3, which could be explained as follows: to reduce injuries, death, and productivity loss; early warning system is preferred. Similarly, to reduce property loss, river management is perceived to be the best alternative. Relocation has become less favorable because it requires people to move from their homes (Figure 3). Table 6 presents the synthesis of the priority judgments of the flash flood impacts (local priorities) and those of the flash flood reduction options to derive the most favored reduction alternative(s) (global priorities). Synthesis is another way of reducing bias in the comparison of criteria to identify the consistency of each matrix and afterward run the pairwise comparison again. Thus, a new set of priorities could be created with great consistency without altering the main opinion of the respondents. Therefore, the synthesized outputs of these judgments show that river management (41%) and early warning system (38%) are perceived to be the best alternatives in reducing flash flood impacts.

5. Discussion

The AHP model applied in the current study focused on risk assessment of flash flood hazards in the city of Jeddah. The analysis first assesses the likely impacts of flash flood based on four categories of impacts (property loss, productivity loss, injuries, and death) derived from expert judgments, which vary from that of non-experts such as the public or public agency officials [10]. Like in the present study, Adam [31] reported that in Makassar city, property loss has the highest (35.7%) probability of occurrence during flash flood events, followed distantly by productivity loss (1.1%). The findings are in line with what practically takes place as floods damage critical infrastructures such as roads and electricity, water, telecommunication and sewer networks, homes, schools, hospitals, businesses, and so on. In Dammam metropolis of Saudi Arabia, human death and injuries have been rated by the public as the highest impacts of natural hazards, followed by damage to infrastructure and buildings [10]. Globally, 126 cases of floods have been reported in 2017 that caused 3331 deaths and economic losses worth USD20.3 billion [1] due largely to rapid urbanization, unplanned urban growth, and climate change [2,3].
With respect to flash flood reduction options, river management was adjudged as having the highest (41%) potential of reducing impacts, followed by early warning system (38%) and then relocation (21%). This finding corresponds with that of Adam [31], where the experts rated river management as the most effective alternative (34.1%) for reducing flash flood impacts, followed by early warning system (13.4%), with relocation being the least (2.5%).
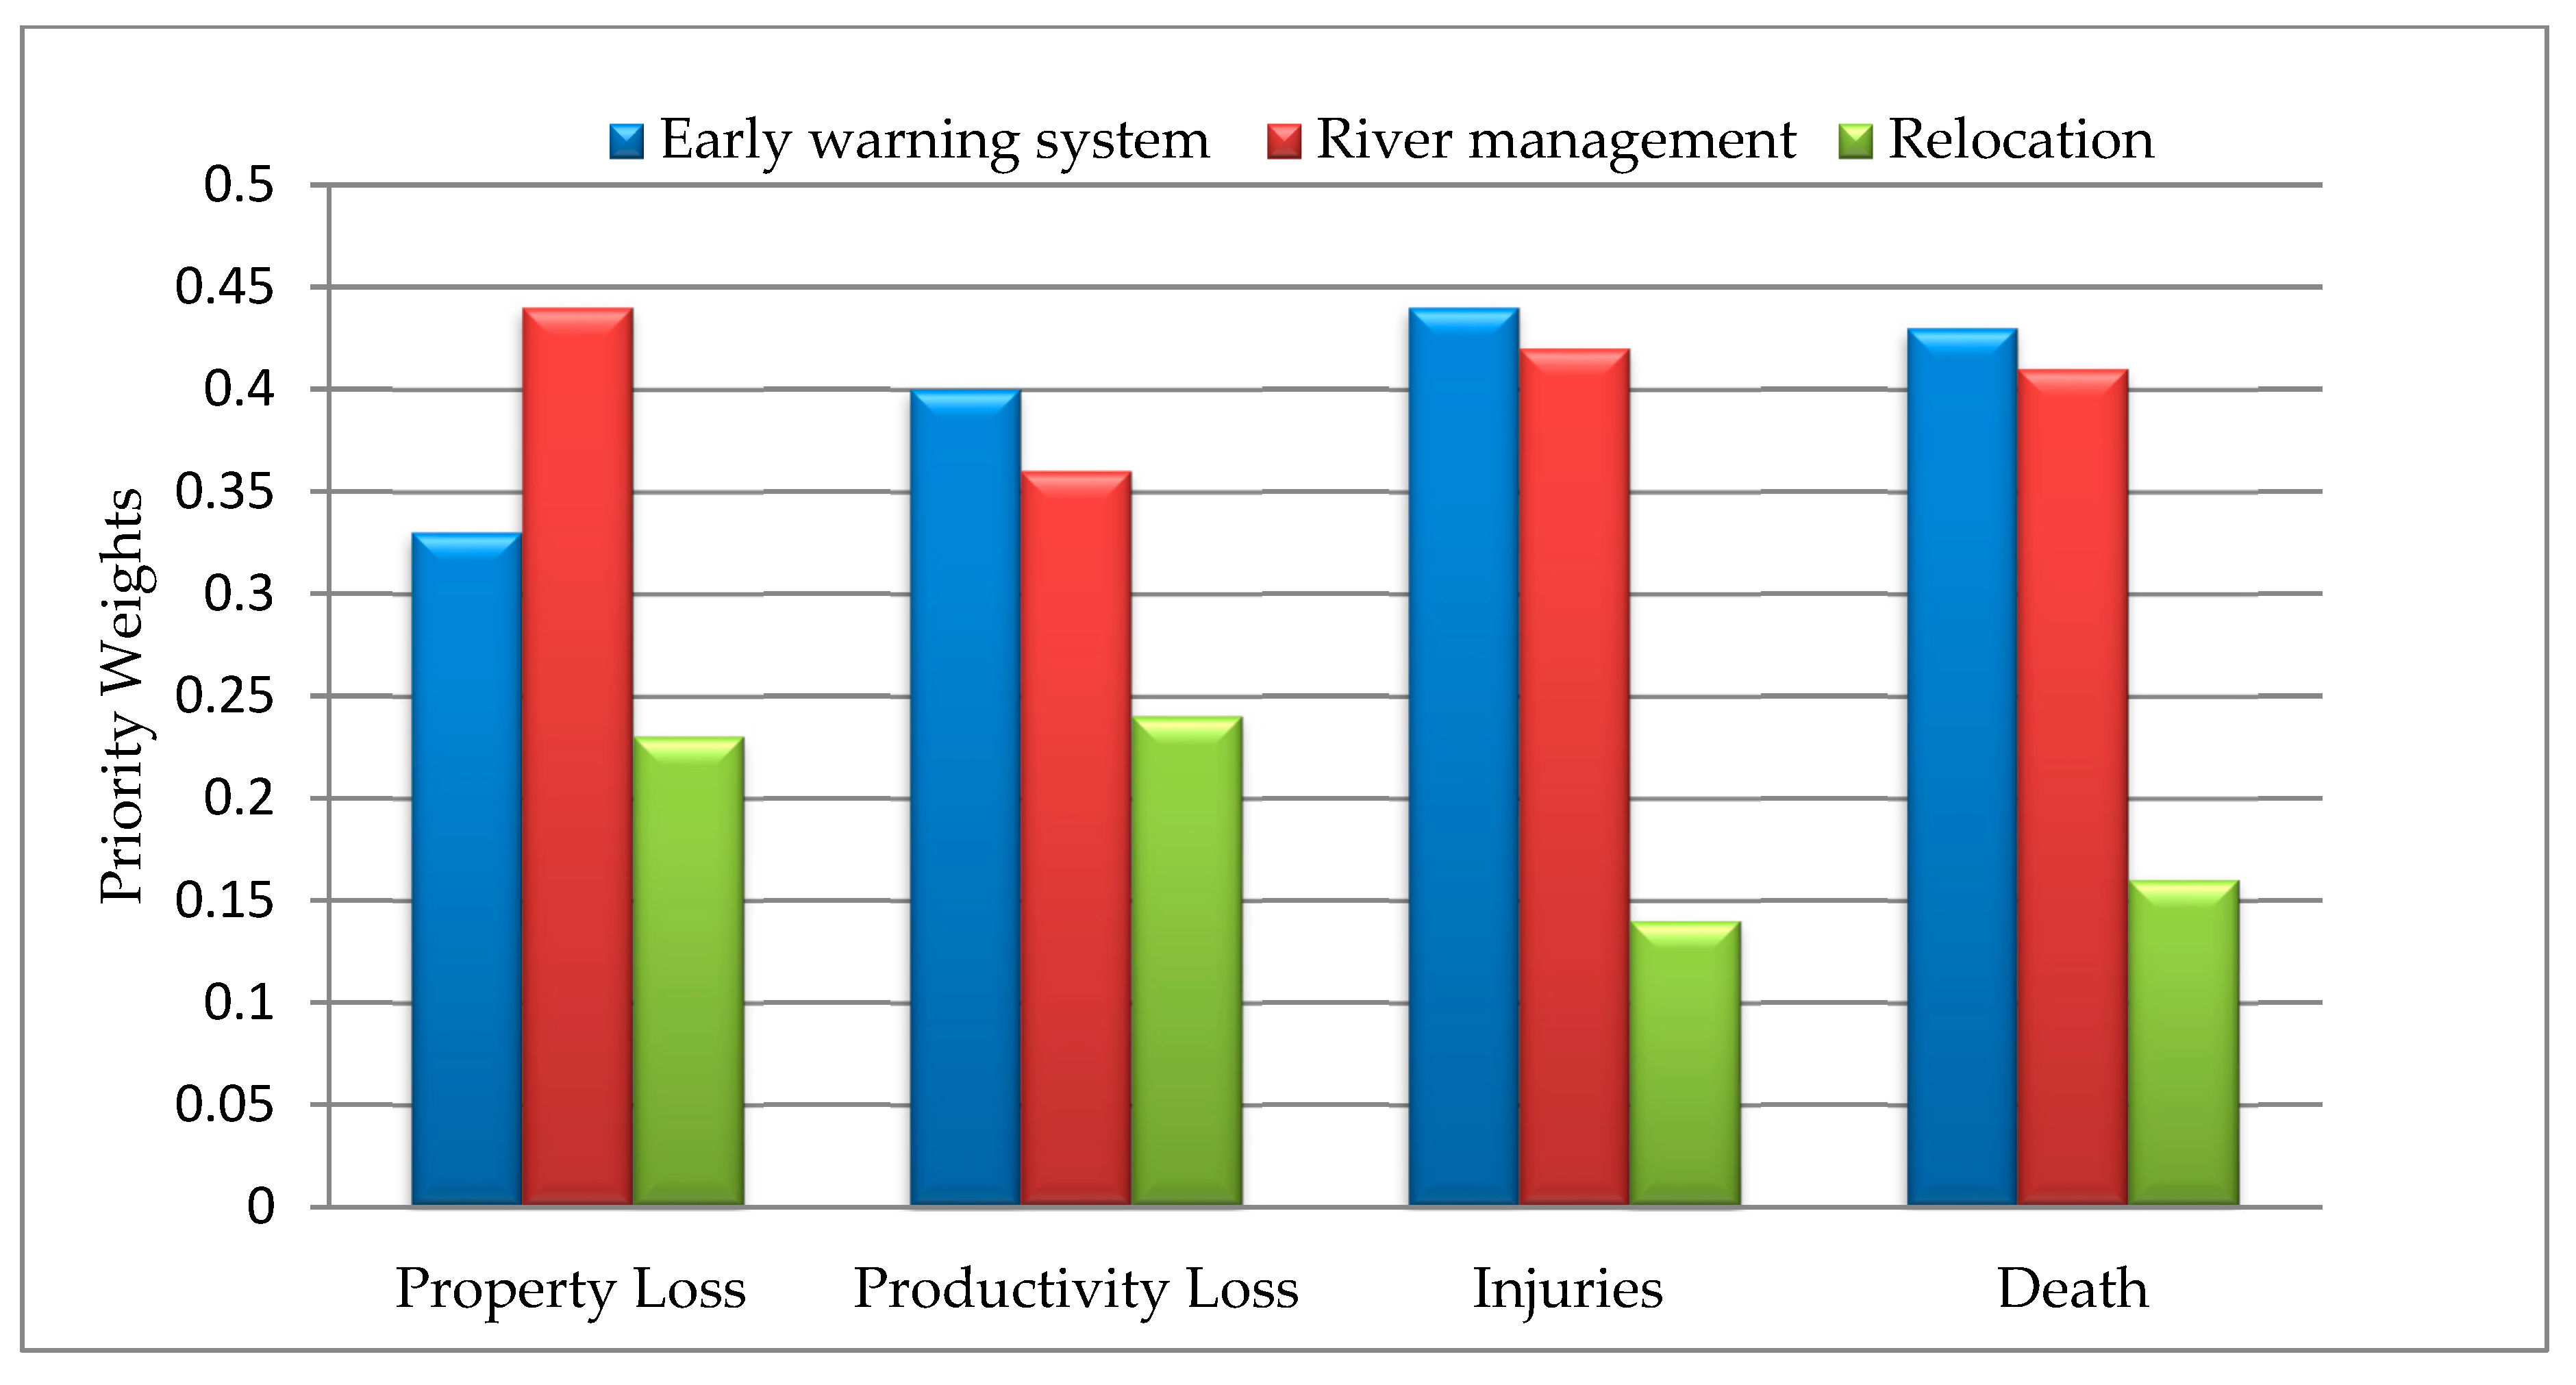
Concerning the efficacy of the three alternatives on reducing the impacts of a flash flood in the study area, early warning system has the highest likelihood (44%) of reducing injuries, followed by death (43%), and productivity loss (40%) more than the two other options. Moreover, some studies conducted on disaster reduction have accentuated the significance of an early warning system in controlling and reducing flood disasters [56,57]. Early warning system has been rated by the public as the second most important approach to reducing disaster risks in Dammam metropolis [10], and in a nationwide study in Saudi Arabia [58,59]. This is because an early warning system can save and protect people’s lives, infrastructure, and other amenities [60]. For this reason, the establishment of an early warning system in flood vulnerable areas will be immensely helpful to reduce the tremendous flood impacts. It enhances the communication between various districts and notifies residents on how to evacuate the disaster risk areas to save lives and properties in advance.
With respect to river management, it has the highest probability of reducing property loss (44%), it is the second-best alternative for reducing injuries (42%), deaths (41%), and productivity loss (36%). These findings are also in line with that of Adam [31], where river management is the overall best approach for reducing flood impacts. River management is a flood reduction technique that involves dredging (widening or deepening) water channels to allow it to carry more water or increase the flow to divert floodwaters away from settlements. It also involves building a reservoir, riverbank stabilization through the embankment of afforestation, and banning the dumping of garbage into water channels.
Lastly, relocation received the lowest score with respect to reducing all the impacts of a flash flood, compared with the other two alternatives. It has a 24% likelihood of reducing productivity loss, 23% probability of reducing property loss, and 16% likelihood of reducing death, and the least being injuries (14%). In a prior study, relocation has also been judged as the second-least important approach among five alternatives for reducing the risks of natural hazards in Dammam [10]. This is likely because the tendency for residents to leave their houses or neighborhoods is very low. Similarly, relocation is just a temporary solution to saving lives and belongings; it cannot substantially prevent damages to fixed properties and productivity.
This study approach of using expert-based judgment can provide government and relevant institutions with an alternative option of assessing different risk levels of flood disasters according to their needs and resources. Unlike the public opinion that is influenced by emotions and sentiments, this technique could help address the problems of scientific data accessibility faced by remote areas, especially in developing countries that experience incessant floods. These regions experience limitations in accessing physical data related to slope, land elevation, landforms, water flow and current, water accumulation, and depth, climatology, geology, and so forth, due to several issues including funds, remote locations, technology limitations, and availability of instruments among others.

6. Conclusions

This study explores an alternative technique for assessing flash flood impacts apart from the traditional technique of assessing risk, which is based on the assessment of physical factors such as hydrological, geographical, geological, and hydrogeological parameters among others. The present study underscores the efficacy of the AHP model in assessing flash flood impacts and risk reduction alternatives. The model can help incorporate experts’ judgments in measuring the impacts of flash flooding in cities susceptible to flash flood disasters and rating the different types of flash flood reduction options. Moreover, the study also shows the possibility of measuring the respondent’s risk perception and priority judgments and aggregating them into a collective risk priority using the geometric mean method. Similarly, the model employs the computation of consistency ratio to assess the inconsistency of every single judgment of the respondents. Fundamental implications of the study’s findings include the potentiality of the technique to be applied in any geographical setting. The model could be customized by altering, adding, or eliminating the decision elements in the hierarchy model to suit the flood criteria and characteristics of an area. Besides, the approach, due to its efficiency and effectiveness, can be deployed in several natural disaster assessments such as landslide, drought, earthquake, wildfire, and desertification, among others. Therefore, this study recommends that Jeddah city administrators should utilize the findings of this study as input for better planning of the proposed early warning system towards reducing the impacts of flash flood disaster in the city. The AHP model could help in flash flood management to prevent the loss of lives and properties experienced in an event of a flash flood, minimize the cost expended on the provision of relief packages, as well as a guide against various health hazard and challenges as the aftermath of floods.

Funding

This research received no external funding.

Acknowledgments

The author would like to express his heartfelt gratitude to Ismaila Rimi Abubakar for sharing his pearls of wisdom, giving immeasurable contribution in the course of this research, as well as the experts that participated in the survey.

Conflicts of Interest

The author declares no conflict of interest.

Appendix A

Table A1. Judgment matrix with respect to injuries reduction.
InjuriesRelocation Early Warning System River ManagementPriority Weights
Relocation 1.000.320.350.14
Early warning system3.161.001.050.44
River management 2.820.951.000.42
Table A2. Judgment matrix with respect to property loss reduction.
Property LossRelocation Early Warning System River ManagementPriority Weights
Relocation 1.000.560.650.23
Early warning system0.991.001.020.33
River management 1.831.391.000.44
Table A3. Judgment matrix with respect to productivity loss reduction.
Productivity LossRelocation Early Warning System River ManagementPriority Weights
Relocation 1.000.680.560.24
Early warning system1.481.001.290.40
River management 1.800.771.000.36

References

  1. Below, R.; Wallemacq, P. Annual Disaster Statistical Review 2017; Centre for Research on the Epidemiology of Disasters: Brussels, Belgium, 2018. [Google Scholar]
  2. Wahlstrom, M.; Guha-Sapir, D. The Human Cost of Weather-Related Disasters 1995–2015; UNISDR: Geneva, Switzerland, 2015. [Google Scholar]
  3. Abubakar, I.R.; Dano, U.L. Sustainable urban planning strategies for mitigating climate change in Saudi Arabia. Environ. Dev. Sustain. 2019, 1–24. Available online: https://doi.org/10.1007/s10668-019-00417-1 (accessed on 27 December 2019). [CrossRef]
  4. WWAP (World Water Assessment Programme). The United Nations World Water Development Report 4: Managing Water under Uncertainty and Risk; UNESCO: Paris, France, 2012. [Google Scholar]
  5. The World Bank. World Development Indicators 2016: Featuring the Sustainable Development Goals; The Highlights, World Bank Group: Washington, DC, USA, 2016. [Google Scholar]
  6. World Bank. World Development Report 2010: Development and Climate Change. © World Bank: Washington, DC, USA. Available online: https://openknowledge.worldbank.org/handle/10986/4387 (accessed on 16 December 2019).
  7. Solecki, W.; Leichenko, R.; O’Brien, K. Climate change adaptation strategies and disaster risk reduction in cities: Connections, contentions, and synergies. Curr. Opin. Environ. Sustain. 2011, 3, 135–141. [Google Scholar] [CrossRef]
  8. Hijji, M.; Amin, S.; Iqbal, R.; Harrop, W. A critical evaluation of the rational need for an IT management system for flash flood events in Jeddah, Saudi Arabia. In Proceedings of the 2013 Sixth International Conference on Developments in E-Systems Engineering, Abu Dhabi, UAE, 16–18 December 2013; IEEE: Piscataway, NJ, USA, 2013; pp. 209–214. [Google Scholar]
  9. Youssef, A.M.; Pradhan, B.; Sefry, S.A. Flash flood susceptibility assessment in Jeddah city (Kingdom of Saudi Arabia) using bivariate and multivariate statistical models. Environ. Earth Sci. 2016, 75, 12. [Google Scholar] [CrossRef]
  10. AlQahtany, A.M.; Abubakar, I.R. Public perception and attitudes to disaster risks in a coastal metropolis of Saudi Arabia. Int. J. Disaster Risk Reduct. 2020, 44, 101422. [Google Scholar] [CrossRef]
  11. Rahman, M.T.; Aldosary, A.S.; Nahiduzzaman, K.M.; Reza, I. Vulnerability of flash flooding in Riyadh, Saudi Arabia. Nat. Hazards 2016, 84, 1807–1830. [Google Scholar] [CrossRef]
  12. Youssef, A.M.; Maerz, N.H. Overview of some geological hazards in the Saudi Arabia. Environ. Earth Sci. 2013, 70, 3115–3130. [Google Scholar] [CrossRef]
  13. Hassan, O.A. Salient Geoenvironmental parameters of Ras Malaab–Abu Zenima Area, Gulf of Suez, Egypt, with an emphasis on flash flood potential and mitigative measures. Egypt. J. Remote Sens. Space Sci. 2000, 3, 37–58. [Google Scholar]
  14. Billa, L.; Shattri, M.; Rodzi, M.A.; Halim, G.A. Comprehensive planning and the role of SDSS in flood disaster management in Malaysia. Disaster Prev. Manag. 2006, 15, 233–240. [Google Scholar] [CrossRef]
  15. Al Saud, M.M. Flood Control Management for the City and Surroundings of Jeddah, Saudi Arabia; Springer: New York, NY, USA; London, UK, 2015; pp. 1–169. [Google Scholar]
  16. Levy, J.K. Multiple criteria decision making and decision support systems for flood risk management. Stoch. Environ. Res. Risk Assess. 2005, 19, 438–447. [Google Scholar] [CrossRef]
  17. Dano, U.L.; Balogun, A.L.; Matori, A.N.; Wan Yusouf, K.; Rimi Abubakar, I.; Mohamed, S.; Pradhan, B. Flood susceptibility mapping using GIS-based analytic network process: A case study of Perlis, Malaysia. Water 2019, 11, 615. [Google Scholar] [CrossRef] [Green Version]
  18. Lawal, D.U.; Matori, A.N.; Hashim, A.M.; Wan Yusof, K.; Chandio, I.A. Detecting flood susceptible areas using GIS-based analytic hierarchy process. In Proceedings of the 2012 International Conference on Future Environment and Energy IPCBEE, Kuala Lumpur, Malaysia, 22–23 December 2012; IACSIT Press: Singapore, 2012; Volume 28, pp. 1–5. [Google Scholar]
  19. Chitsaz, N.; Banihabib, M.E. Comparison of different multi criteria decision-making models in prioritizing flood management alternatives. Water Res. Manag. 2015, 29, 2503–2525. [Google Scholar] [CrossRef]
  20. Fernández, D.S.; Lutz, M.A. Urban flood hazard zoning in Tucumán Province, Argentina, using GIS and multicriteria decision analysis. Eng. Geol. 2010, 111, 90–98. [Google Scholar] [CrossRef]
  21. Wang, Y.; Li, Z.; Tang, Z.; Zeng, G. A GIS-based spatial multi-criteria approach for flood risk assessment in the Dongting Lake Region, Hunan, Central China. Water Res. Manag. 2011, 25, 3465–3484. [Google Scholar] [CrossRef]
  22. Lawal, D.U.; Matori, A.N.; Yusof, K.W.; Hashim, A.M.; Aminu, M.; Sabri, S.; Mokhtar, M.R.M. Flood Susceptibility Modeling: A Geo-spatial Technology Multi-criteria Decision Analysis Approach. Res. J. Appl. Sci. Eng. Technol. 2014, 7, 4638–4644. [Google Scholar] [CrossRef]
  23. Matori, A.N.; Lawal, D.U. Flood Disaster Forecasting: A GIS-based Group Analytic Hierarchy Process Approach. In Applied Mechanics and Materials; Trans Tech Publications Ltd.: Bäch, Switzerland, 2014; p. 567. [Google Scholar]
  24. Lawal, D.U.; Matori, A.N.; Yusuf, K.W.; Hashim, A.M.; Balogun, A.L. Analysis of the flood extent extraction model and the natural flood influencing factors: A GIS-based and remote sensing analysis. In IOP Conference Series: Earth and Environmental Science; IOP Publishing: Bristol, UK, 2014; Volume 18, p. 012059. [Google Scholar]
  25. Danumah, J.H.; Odai, S.N.; Saley, B.M.; Szarzynski, J.; Thiel, M.; Kwaku, A.; Akpa, L.Y. Flood risk assessment and mapping in Abidjan district using multi-criteria analysis (AHP) model and geoinformation techniques, (Cote D’ivoire). Geoenviron. Disasters 2016, 3, 10. [Google Scholar] [CrossRef] [Green Version]
  26. Yahaya, S.; Ahmad, N.; Abdalla, R.F. Multicriteria analysis for flood vulnerable areas in Hadejia-Jama’are River basin, Nigeria. Eur. J. Sci. Res. 2010, 42, 71–83. [Google Scholar]
  27. Souissi, D.; Zouhri, L.; Hammami, S.; Msaddek, M.H.; Zghibi, A.; Dlala, M. GIS-based MCDM-AHP modeling for flood susceptibility mapping of arid areas, southeastern Tunisia. Geocarto Int. 2019, 1–25. [Google Scholar] [CrossRef]
  28. Lawal, D.U.; Matori, A.N.; Yusof, K.W.; Hashim, A.M.; Aminu, M.; Balogun, A.L.; Mokhtar, M.R.M. Group-based Decision Support for Flood Hazard Forecasting: A Geospatial Technology-based Group Analytic Hierarchy Process Approach. Res. J. Appl. Sci. Eng. Technol. 2014, 7, 4838–4850. [Google Scholar] [CrossRef]
  29. Seejata, K.; Yodying, A.; Wongthadam, T.; Mahavik, N.; Tantanee, S. Assessment of flood hazard areas using analytical hierarchy process over the Lower Yom Basin, Sukhothai Province. Procedia Eng. 2018, 212, 340–347. [Google Scholar] [CrossRef]
  30. Kazakis, N.; Kougias, I.; Patsialis, T. Assessment of flood hazard areas at a regional scale using an index-based approach and Analytical Hierarchy Process: Application in Rhodope–Evros region, Greece. Sci. Total Environ. 2015, 538, 555–563. [Google Scholar] [CrossRef]
  31. Adam, U.E.F.B. Application of Analytical Hierarchy Process (AHP) to Flood Hazard Management for Makassar City, South Sulawesi-Indonesia. Ph.D. Thesis, University of Hawaii at Manoa, Honolulu, Hawaii, May 2014. [Google Scholar]
  32. Ledraa, T.A.; Al-Ghamdi, A.M. Planning and Management Issues and Challenges of Flash Flooding Disasters in Saudi Arabia: The Case of Riyadh City. J. Archit. Plan. 2020, 32, 155–171. [Google Scholar]
  33. Subyani, A.M. Hydrologic behavior and flood probability for selected arid basins in Makkah area, western Saudi Arabia. Arab. J. Geosci. 2011, 4, 817–824. [Google Scholar] [CrossRef]
  34. Radwan, F.; Alazba, A.A.; Mossad, A. Flood risk assessment and mapping using AHP in arid and semiarid regions. Acta Geophys. 2019, 67, 215–229. [Google Scholar] [CrossRef]
  35. Maghrabi, K. Impact of flood disaster on the mental health of residents in the Eastern Region of Jeddah Governorate, 2010: A study in medical geography. Life Sci. J. 2012, 9, 95–110. [Google Scholar]
  36. Haggag, M.; El-Badry, H. Mesoscale numerical study of quasi-stationary convective system over Jeddah in November 2009. Atmos. Clim. Sci. 2013, 3, 73. [Google Scholar] [CrossRef] [Green Version]
  37. Tekeli, A. Exploring Jeddah floods by tropical rainfall measuring mission analysis. Water 2017, 9, 612. [Google Scholar] [CrossRef] [Green Version]
  38. Al Saud, M. Assessment of flood hazard of Jeddah area 2009, Saudi Arabia. J. Water Resour. Prot. 2010, 2, 839–847. [Google Scholar] [CrossRef] [Green Version]
  39. Abubakar, I.R.; Aina, Y.A. Achieving sustainable cities in Saudi Arabia: Juggling the competing urbanization challenges. In Population Growth and Rapid Urbanization in the Developing World; IGI Global: Hershey, PA, USA, 2016; pp. 42–63. [Google Scholar]
  40. Saaty, T.L.; Özdemir, M.S. How many judges should there be in a group? Ann. Data Sci. 2014, 1, 359–368. [Google Scholar] [CrossRef] [Green Version]
  41. Ishizaka, A.; Labib, A. Review of the main developments in the analytic hierarchy process. Expert Syst. Appl. 2011, 38, 14336–14345. [Google Scholar] [CrossRef] [Green Version]
  42. Dahri, N.; Abida, H. Monte Carlo simulation-aided analytical hierarchy process (AHP) for flood susceptibility mapping in Gabes Basin (southeastern Tunisia). Environ. Earth Sci. 2017, 76, 302. [Google Scholar] [CrossRef]
  43. Papaioannou, G.; Vasiliades, L.; Loukas, A. Multi-criteria analysis framework for potential flood prone areas mapping. Water Resour. Manag. 2015, 29, 399–418. [Google Scholar] [CrossRef]
  44. Abbas, H.B.; Routray, J.K. Assessing factors affecting flood-induced public health risks in Kassala State of Sudan. Oper. Res. Health Care 2014, 3, 215–225. [Google Scholar] [CrossRef]
  45. Gigović, L.; Pamučar, D.; Bajić, Z.; Drobnjak, S. Application of GIS-interval rough AHP methodology for flood hazard mapping in urban areas. Water 2017, 9, 360. [Google Scholar] [CrossRef] [Green Version]
  46. Ouma, Y.; Tateishi, R. Urban flood vulnerability and risk mapping using integrated multi-parametric AHP and GIS: Methodological overview and case study assessment. Water 2014, 6, 1515–1545. [Google Scholar] [CrossRef]
  47. FitzGerald, G.; Du, W.; Jamal, A.; Clark, M.; Hou, X.Y. Flood fatalities in contemporary Australia (1997–2008). Emerg. Med. Australas. 2010, 22, 180–186. [Google Scholar] [CrossRef] [PubMed]
  48. Saaty, R.W. Decision Making in Complex Environment: The Analytic Hierarchy Process (AHP) for Decision Making and the Analytic Network Process (ANP) for Decision Making with Dependence and Feedback; Super Decisions: Pittsburgh, PA, USA, 2003. [Google Scholar]
  49. Şener, Ş.; Şener, E.; Nas, B.; Karagüzel, R. Combining AHP with GIS for landfill site selection: A case study in the Lake Beyşehir catchment area (Konya, Turkey). Waste Manag. 2010, 30, 2037–2046. [Google Scholar] [CrossRef]
  50. Balogun, A.L.; Matori, A.N.; Hamid-Mosaku, A.I.; Umar Lawal, D.; Ahmed Chandio, I. Fuzzy MCDM-based GIS model for subsea oil pipeline route optimization: An integrated approach. Mar. Georesources Geotechnol. 2017, 35, 961–969. [Google Scholar] [CrossRef]
  51. Forman, E.; Peniwati, K. Aggregating individual judgments and priorities with the analytic hierarchy process. Eur. J. Oper. Res. 1998, 108, 165–169. [Google Scholar] [CrossRef]
  52. Abba, A.H.; Noor, Z.Z.; Yusuf, R.O.; Din, M.F.M.; Hassan, M.A.A. Assessing environmental impacts of municipal solid waste of Johor by analytical hierarchy process. Resour. Conserv. Recycl. 2013, 73, 188–196. [Google Scholar] [CrossRef]
  53. Saaty, T.L.; Kearns, K.P. Analytical Planning: The Organization of System; Elsevier: Amsterdam, The Netherlands; Pergamon Press: New York, NY, USA, 2014; Volume 7. [Google Scholar]
  54. Saaty, T.L. Fundamentals of Decision Making and Priority Theory with the Analytic Hierarchy Process; RWS Publications: Pittsburgh, PA, USA, 2006. [Google Scholar]
  55. Saaty, T.L.; Vargas, L.G. Models, Methods, Concepts & Applications of the Analytic Hierarchy Process; Springer: Berlin/Heidelberg, Germany, 2012; Volume 175. [Google Scholar]
  56. Nygård, H.; Broen, M.L. The Role of Early Warning Systems in Natural Disasters: A Consideration of Contextual Factors. Master’s Thesis, University of Agder, Kristiansand, Norway, 2018. [Google Scholar]
  57. Wafi, Z.K.; Malek, M.F.A.; Alnajjar, S.H.; Ahmad, R.B. Early warning system for Disaster management in rural area. In Proceedings of the 2015 International Symposium on Technology Management and Emerging Technologies (ISTMET), Langkawai Island, Malaysia, 25 August 2015; IEEE: Piscataway, NJ, USA, 2015; pp. 369–372. [Google Scholar]
  58. Abosuliman, S.S.; Kumar, A.; Alam, F. Disaster preparedness and management in Saudi Arabia: An empirical investigation. Int. J. Soc. Hum. Sci. Eng. 2013, 7, 1979–1983. [Google Scholar]
  59. Alshehri, S.A.; Rezgui, Y.; Li, H. Public perception of the risk of disasters in a developing economy: The case of Saudi Arabia. Nat. Hazards 2013, 65, 1813–1830. [Google Scholar] [CrossRef]
  60. Abubakar, I.R.; Aina, Y.A. The prospects and challenges of developing more inclusive, safe, resilient and sustainable cities in Nigeria. Land Use Policy 2019, 87, 104–105. [Google Scholar] [CrossRef]
Figure 1. Map of Jeddah city showing sensitive land use facilities (Source: Author, 2019).
Hydrology 07 00010 g001
Figure 2. Analytic Hierarchy Process (AHP) model for sustainable flash flood management for Jeddah city (source: Author, 2019).
Hydrology 07 00010 g002
Figure 3. Contribution of the alternatives in reducing flash flood impacts.
Hydrology 07 00010 g003
Table 1. The survey respondents by expertise.
Expertise Number Percentage
Urban and Regional Planning743.75
Civil and Environmental Engineering318.75
Construction Management318.75
Geotechnical Engineering/Soil Mechanics16.25
Economics212.50
Total16100
Table 2. Saaty’s fundamental scale of judgment (source: Saaty [48]).
Degree of InfluenceDefinitionInterpretation
1Equal influenceTwo components generating equal contribution to the goal
3A bit more influentialModerate significance of a component above the other component
5Much more influentialSignificant or strong significance
7Very much influentialVery strong significance
9Extremely influentialExtreme significance
Scale, 2.4, 6, and 8Intermediary valuesThe intermediaries are used when a comparison between two adjacent judgments is required
ReciprocalsIf v is the judgment value when i is compared to j, then 1/v is the judgment value when j is compared to i.
Table 3. Average random consistency index values for different values of n (source: Saaty and Kearns [53]).
Size of Matrix12345678910
Random Consistency000.580.901.121.241.321.411.451.49
Table 4. Judgment matrix on the preferences of flash flood impacts criteria.
Flash Flood Impacts CriteriaA1A2A3A4Priority Weights
A1Death1.000.790.310.350.12
A2Injuries1.271.000.480.620.18
A3Property Loss3.222.101.001.780.42
A4Productivity Loss2.831.610.561.000.28
Inconsistency ratio = 0.01
Table 5. Judgment matrix with respect to death reduction.
DeathEarly Warning SystemRiver ManagementRelocationPriority Weights
Relocation1.000.350.420.16
Early warning system 2.831.001.020.43
River management 2.380.981.000.41
Table 6. Determining the global priorities through the synthesis of the local priorities.
A1A2A3A4Global Priorities
Local priorities0.120.180.420.28
Early warning system 0.430.44 0.330.400.38
River management0.410.42 0.440.360.41
Relocation 0.160.14 0.230.240.21

