A Counting Process Approach for Trend Assessment of Drought Condition


Abstract
1. Introduction
2. Materials and Methods
2.1. Data
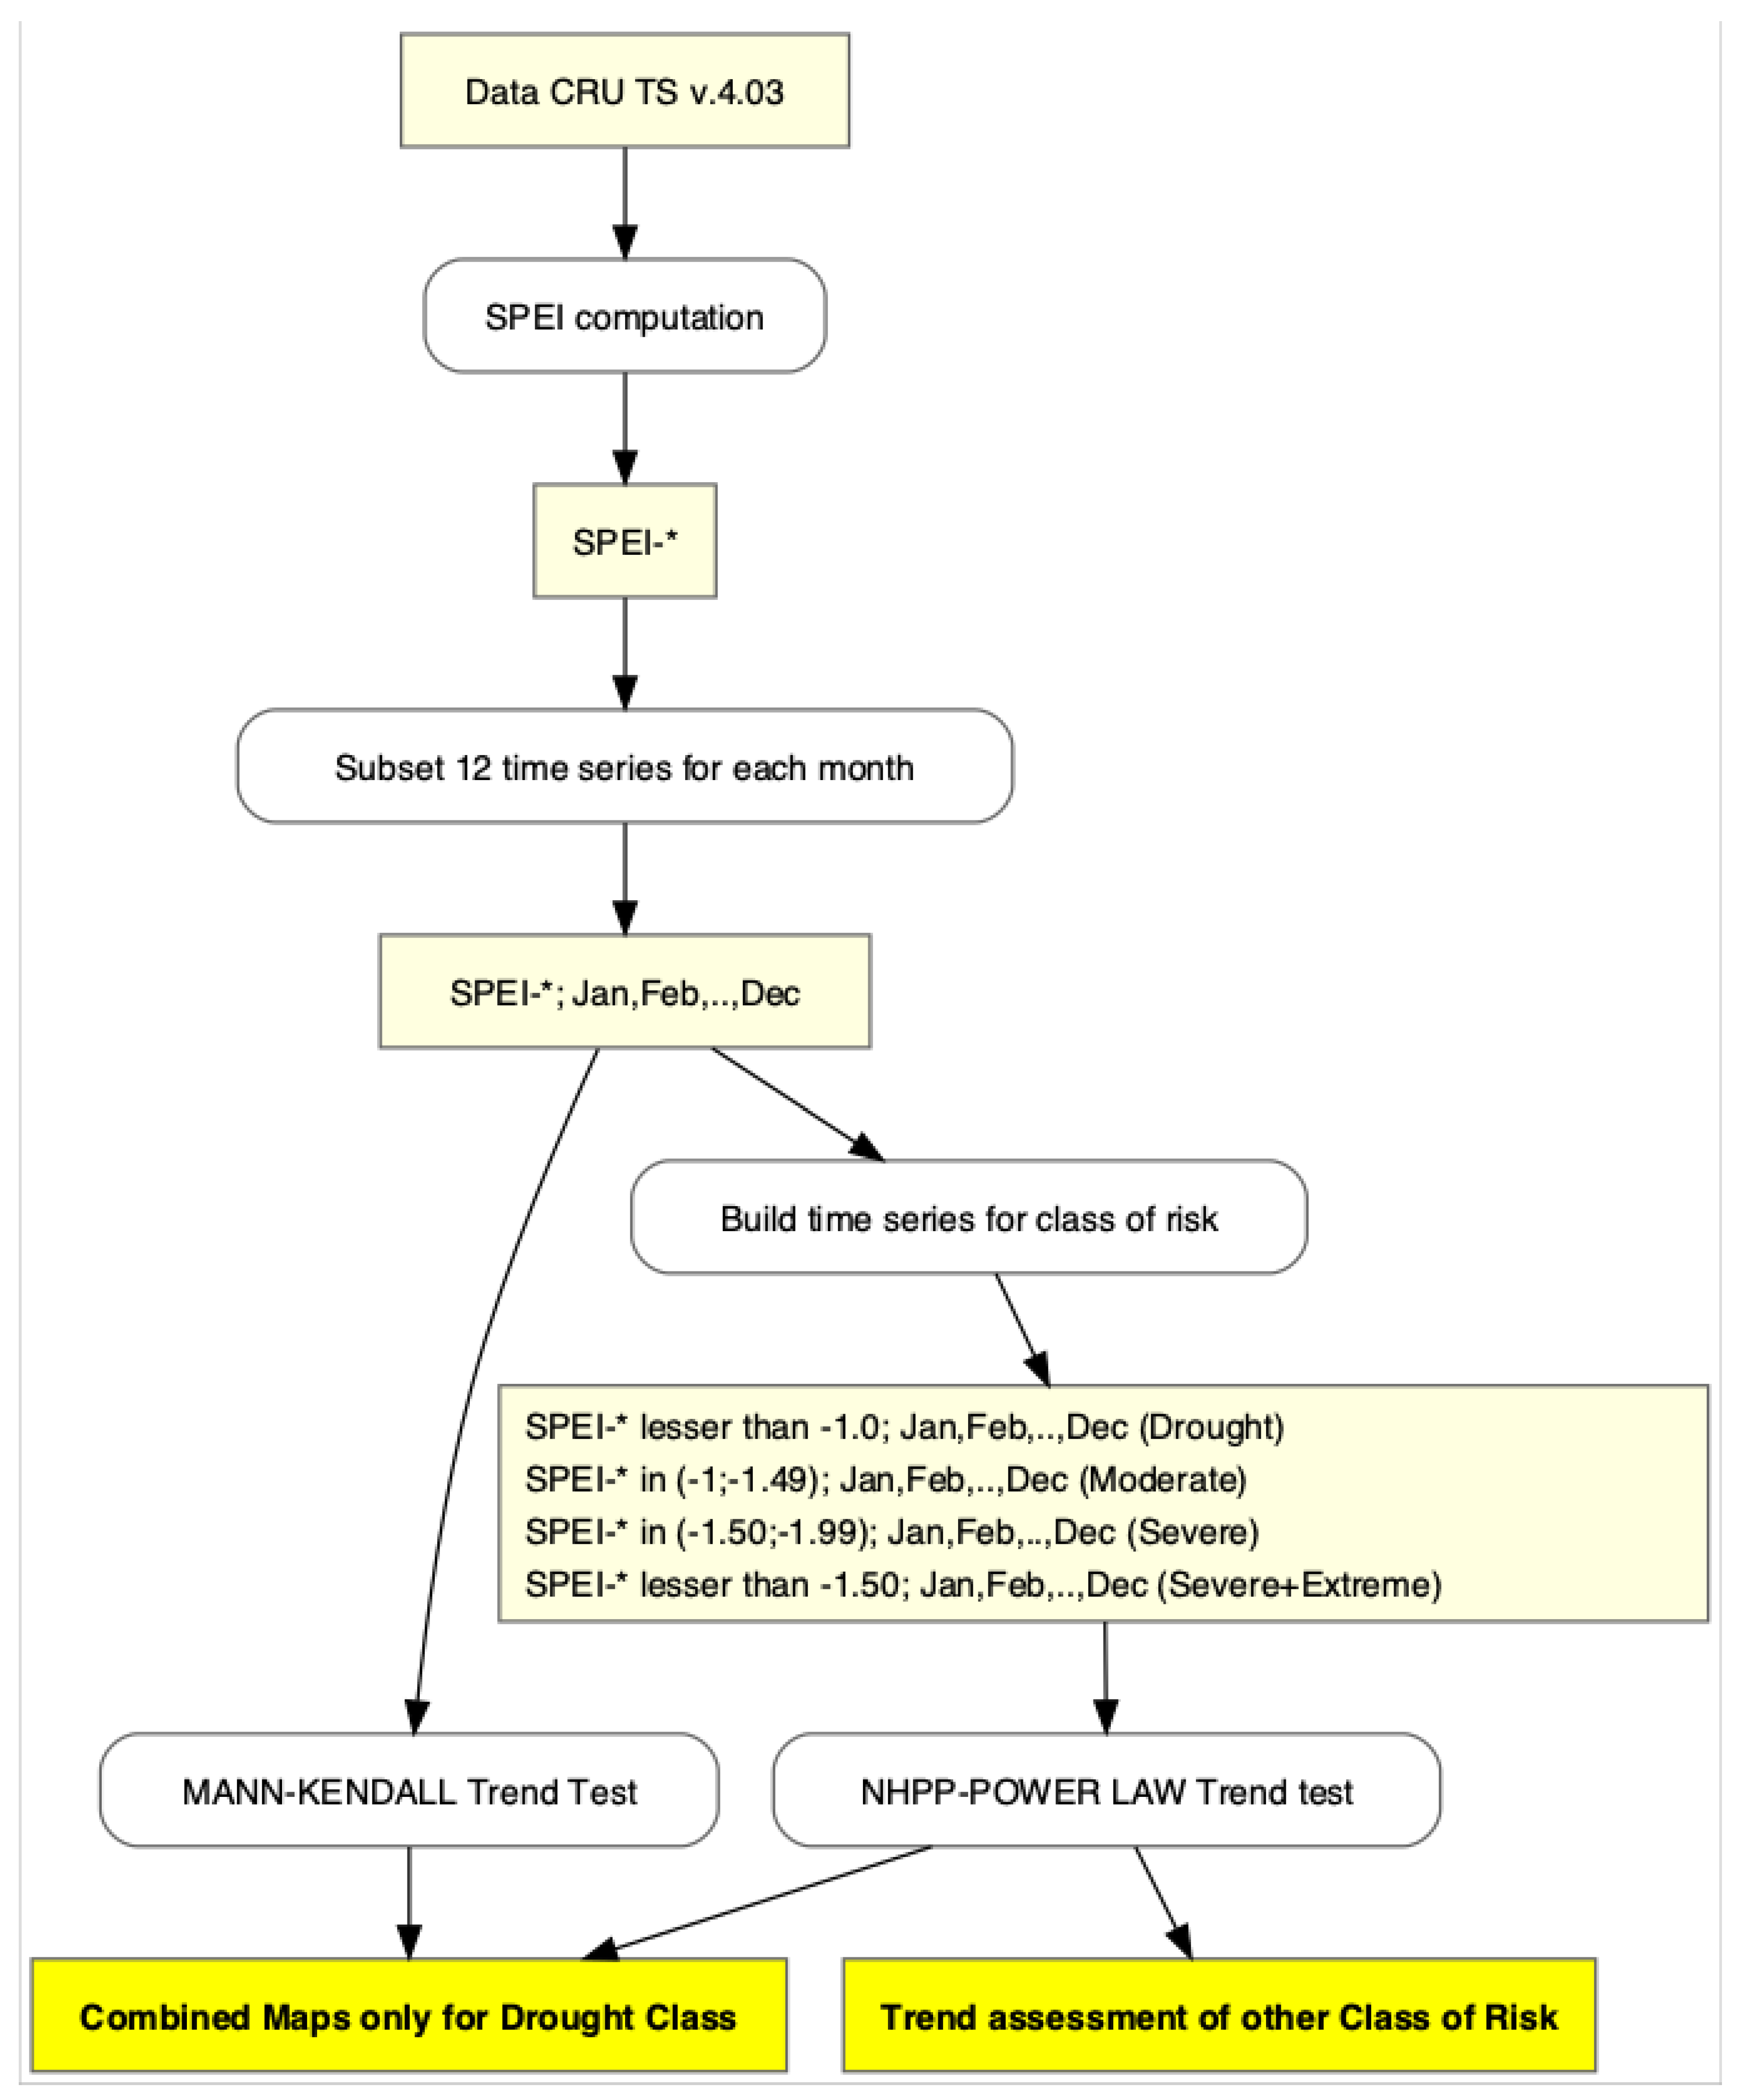
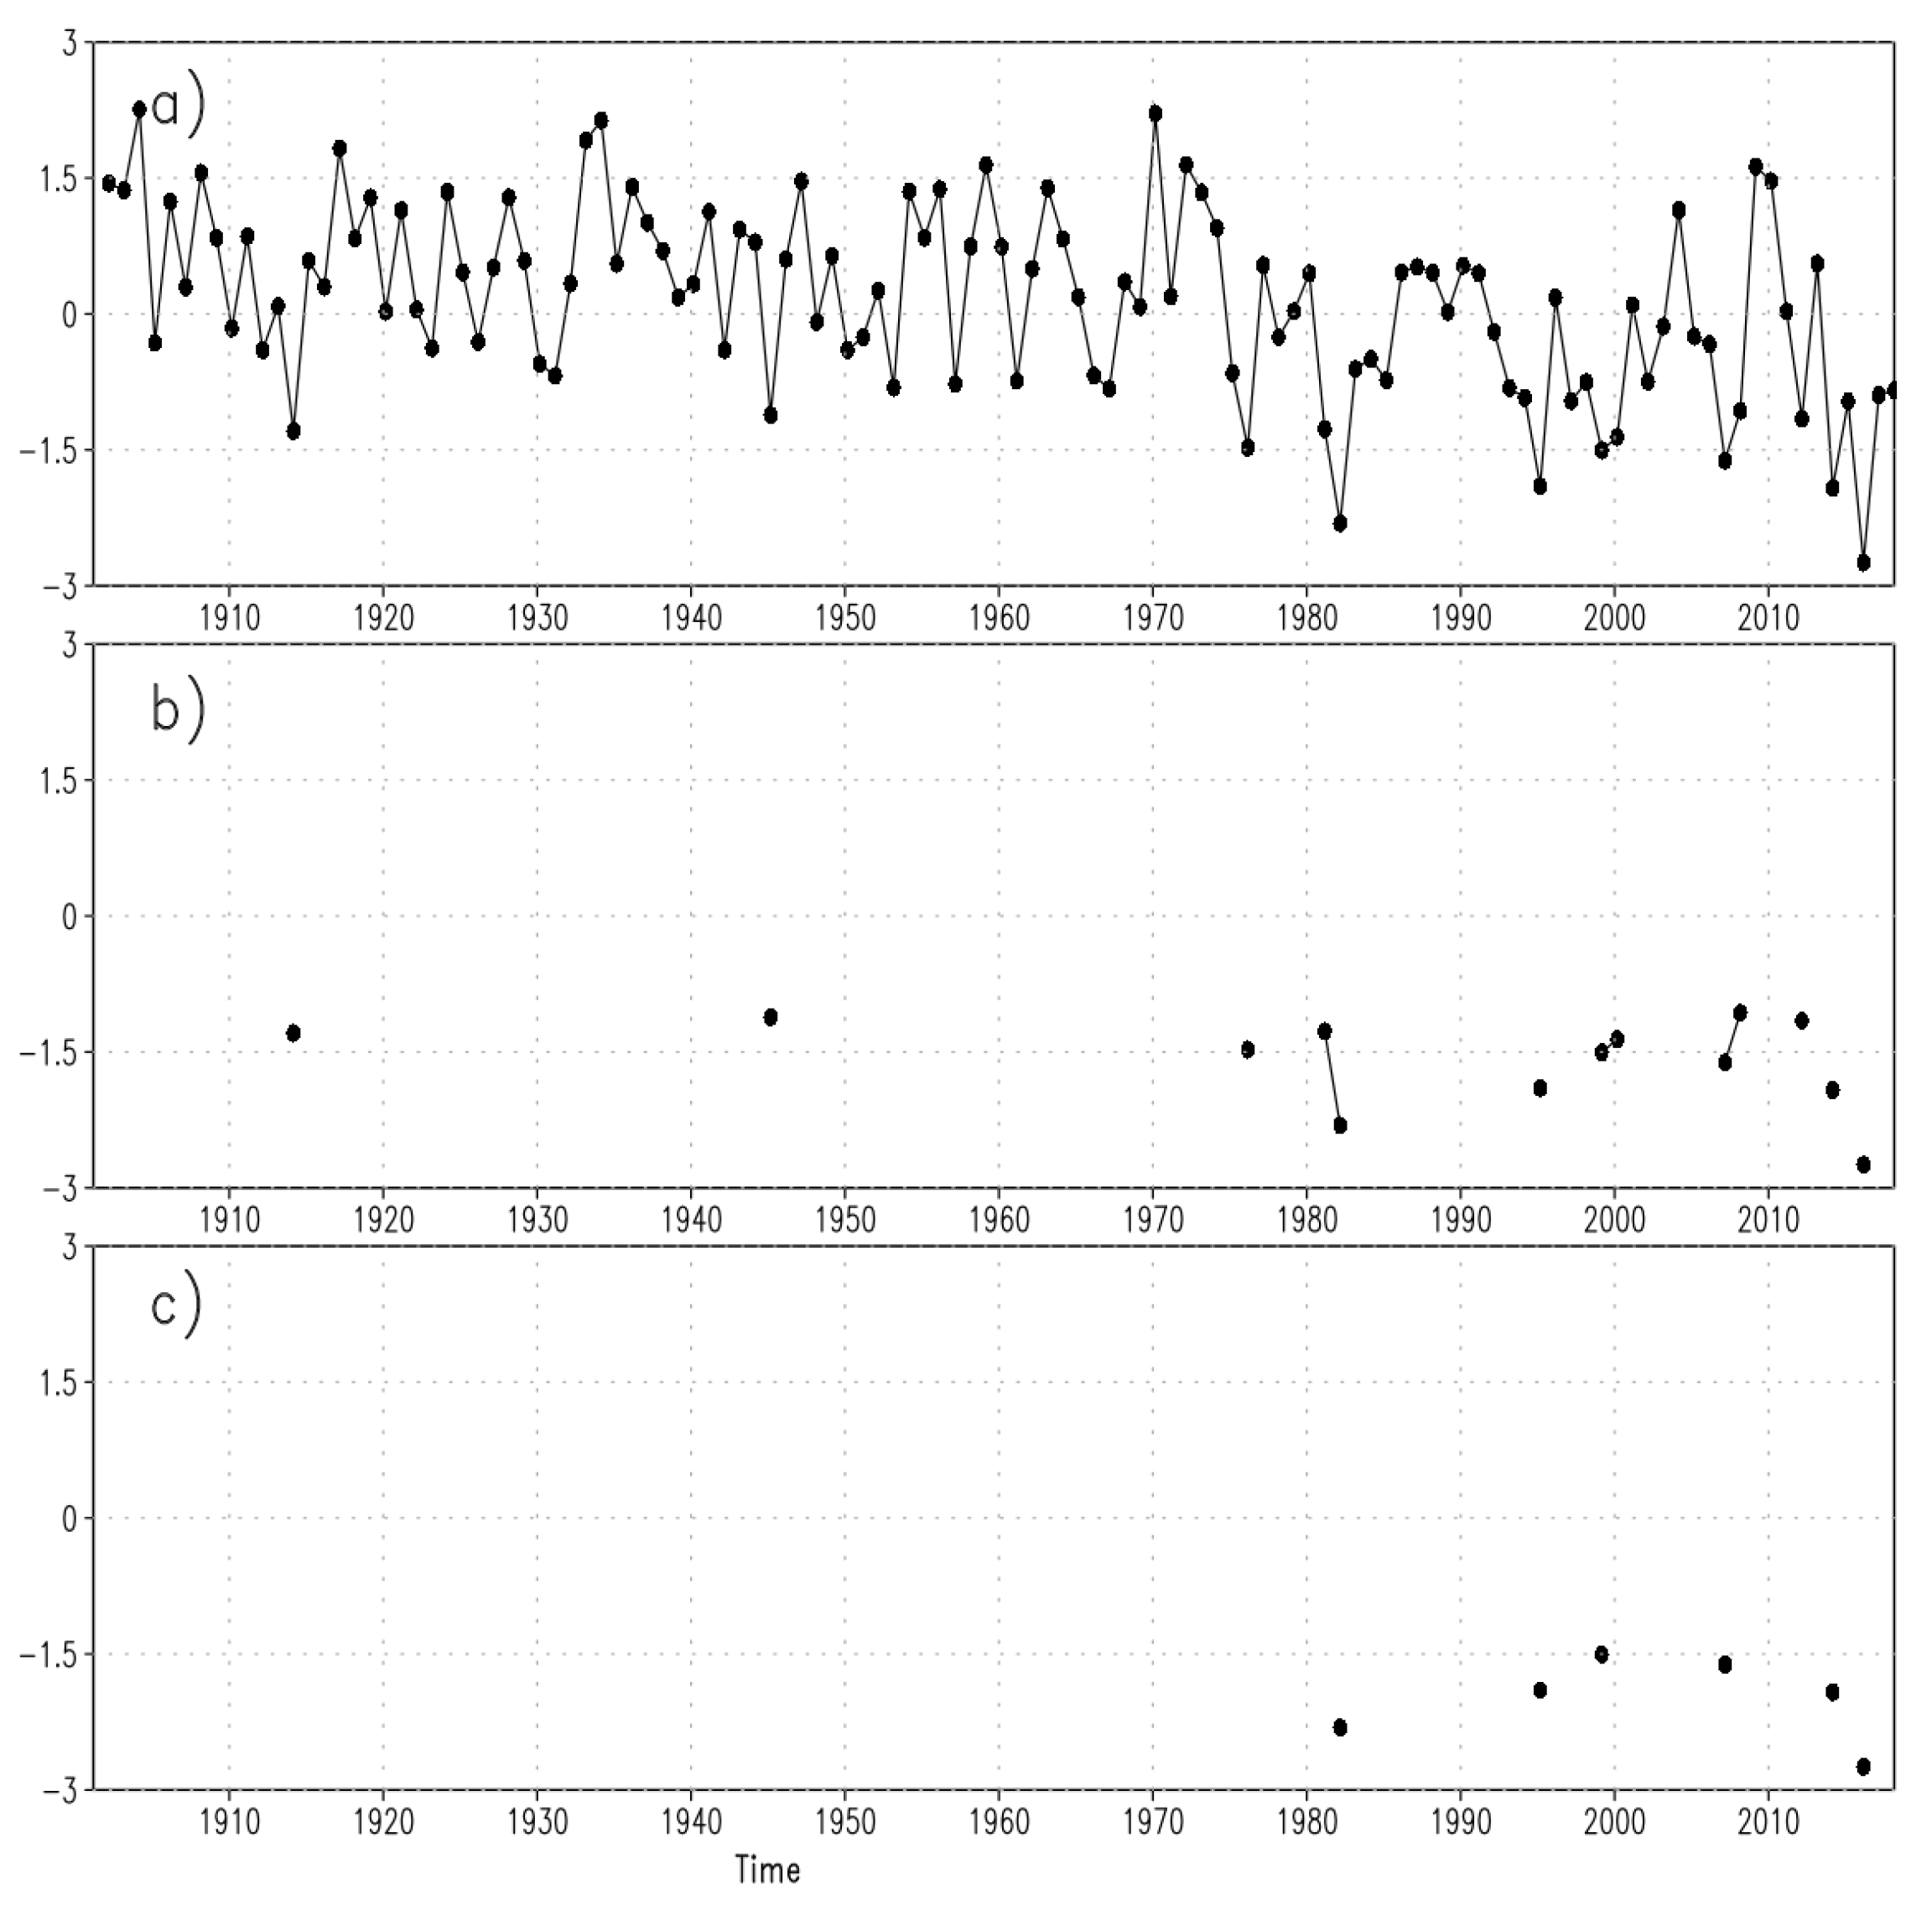
2.2. Data Preparation for Trend Analysis
2.3. Statistical Tests for Trend Analysis
2.3.1. Mann–Kendall Trend Test
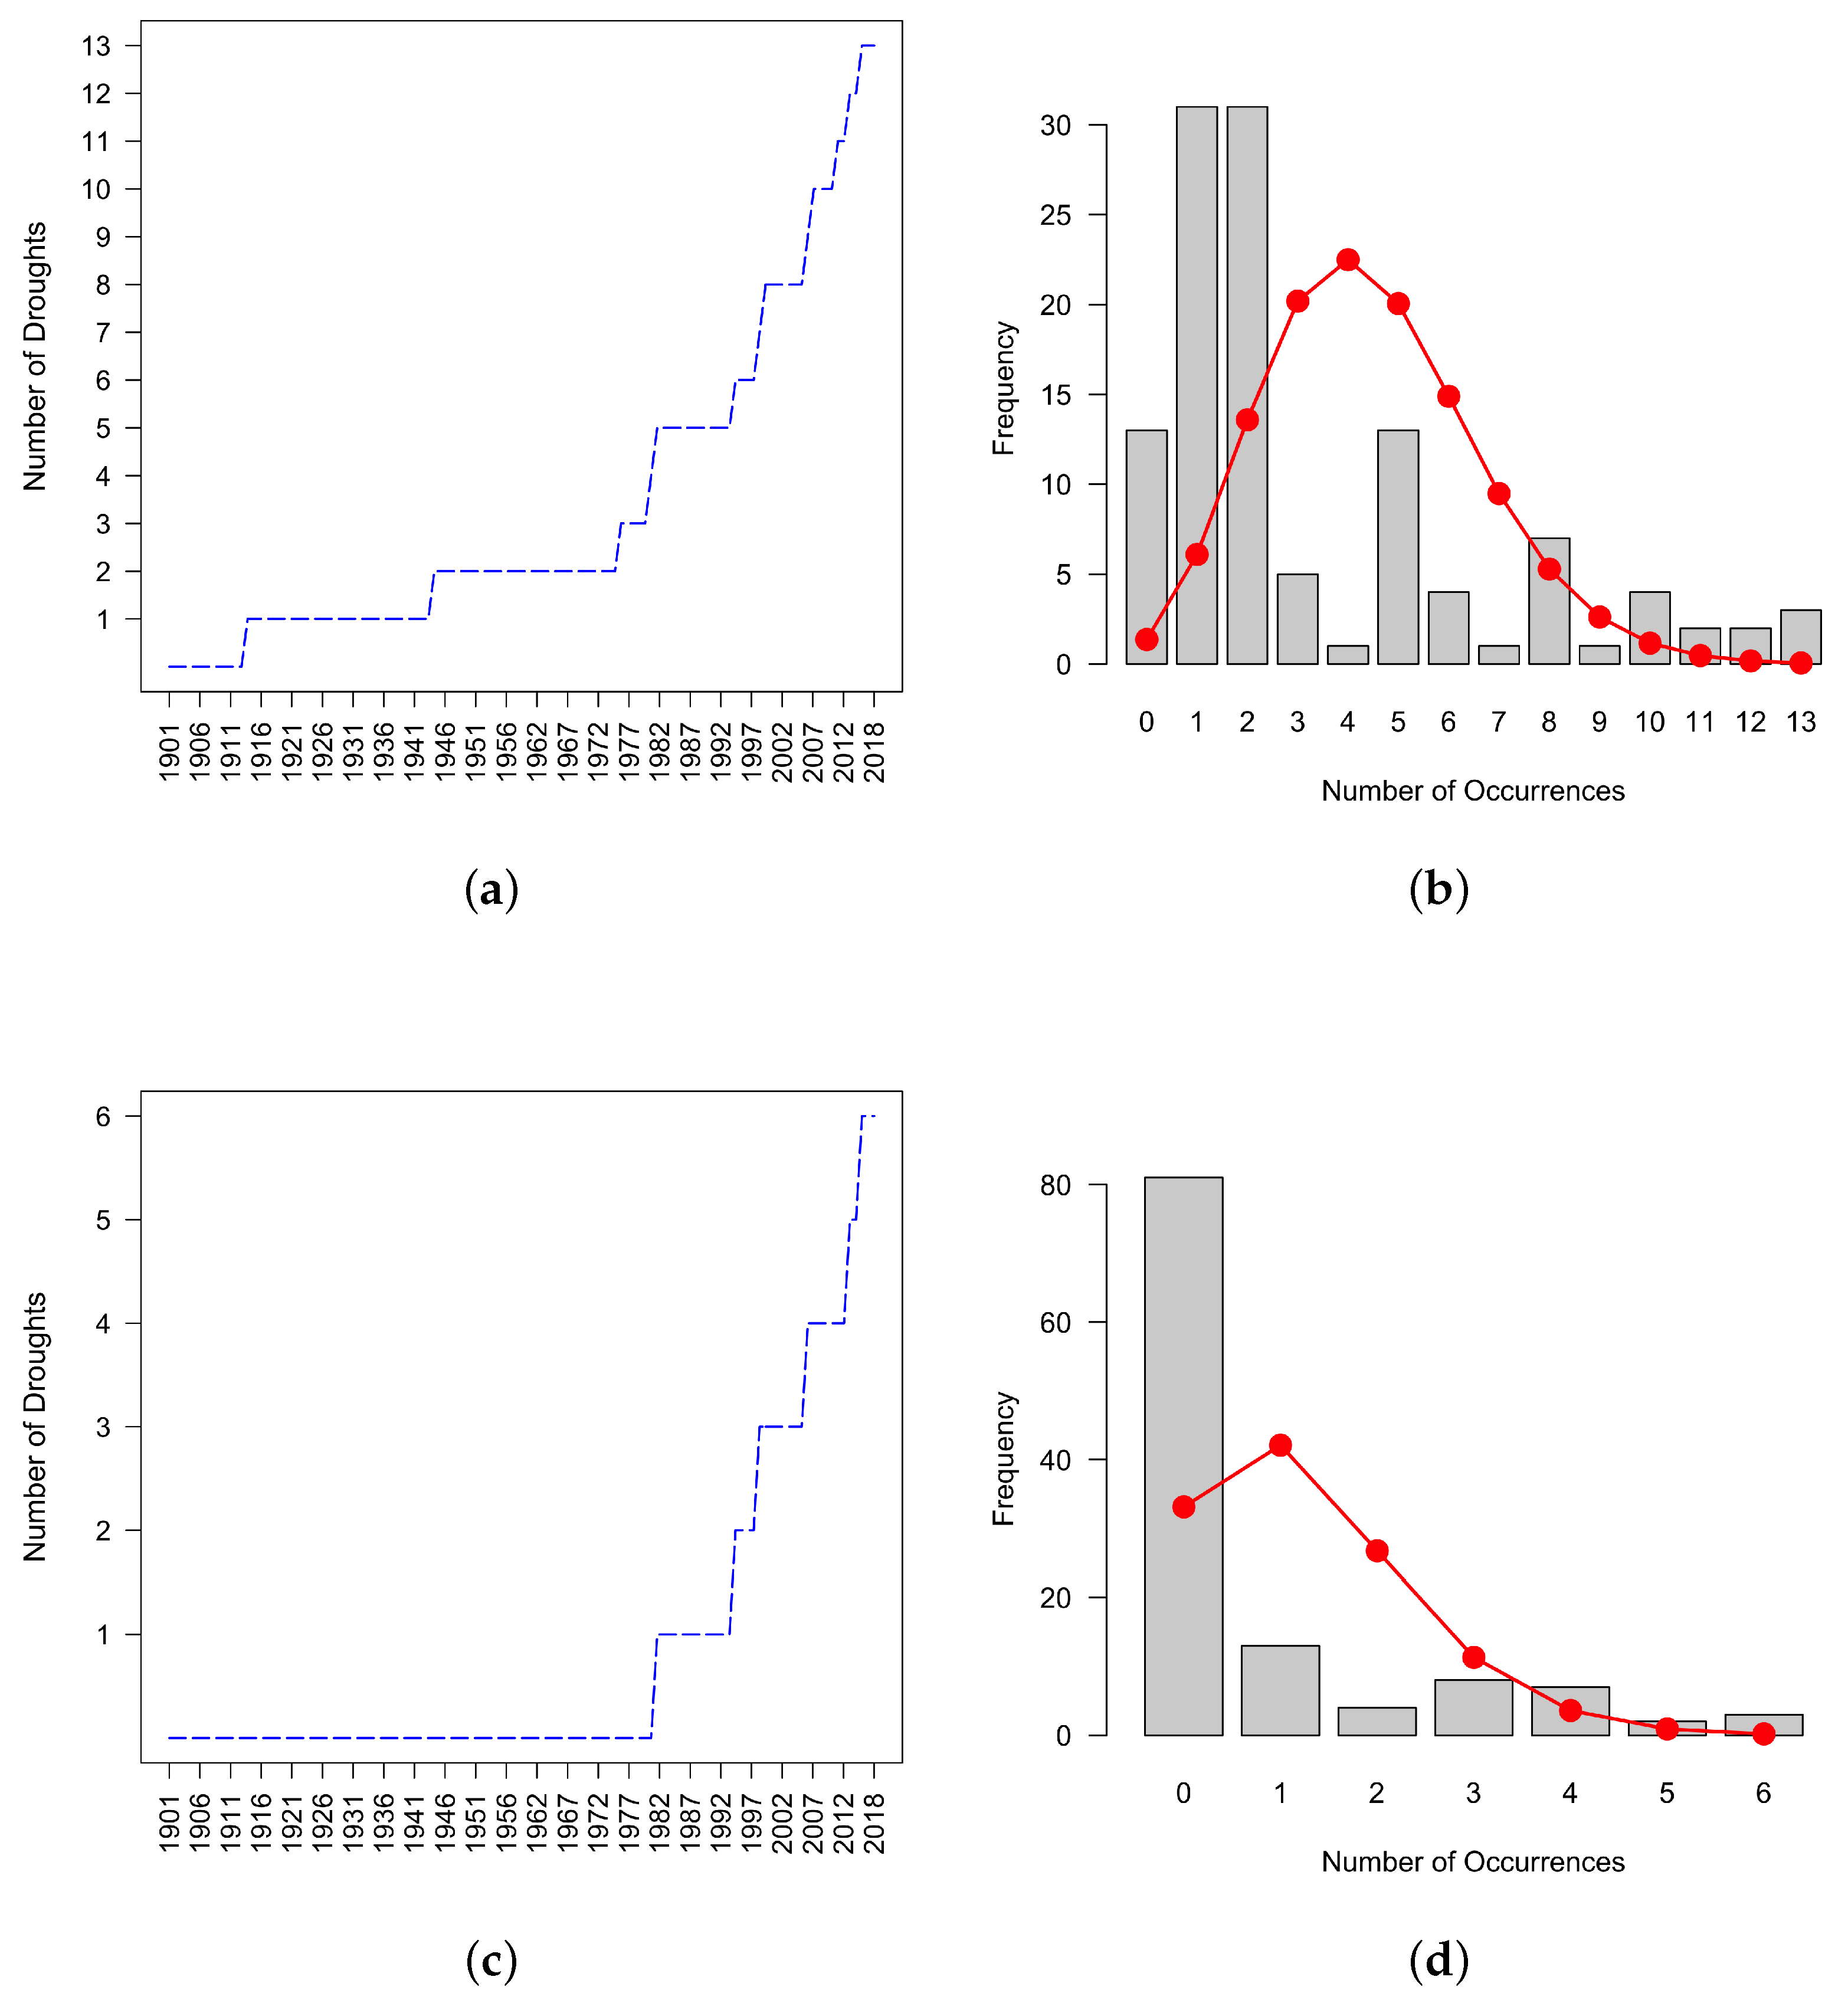
2.3.2. Non-Homogeneous Poisson Process (NHPP) with Power Law Trend Test
3. Results
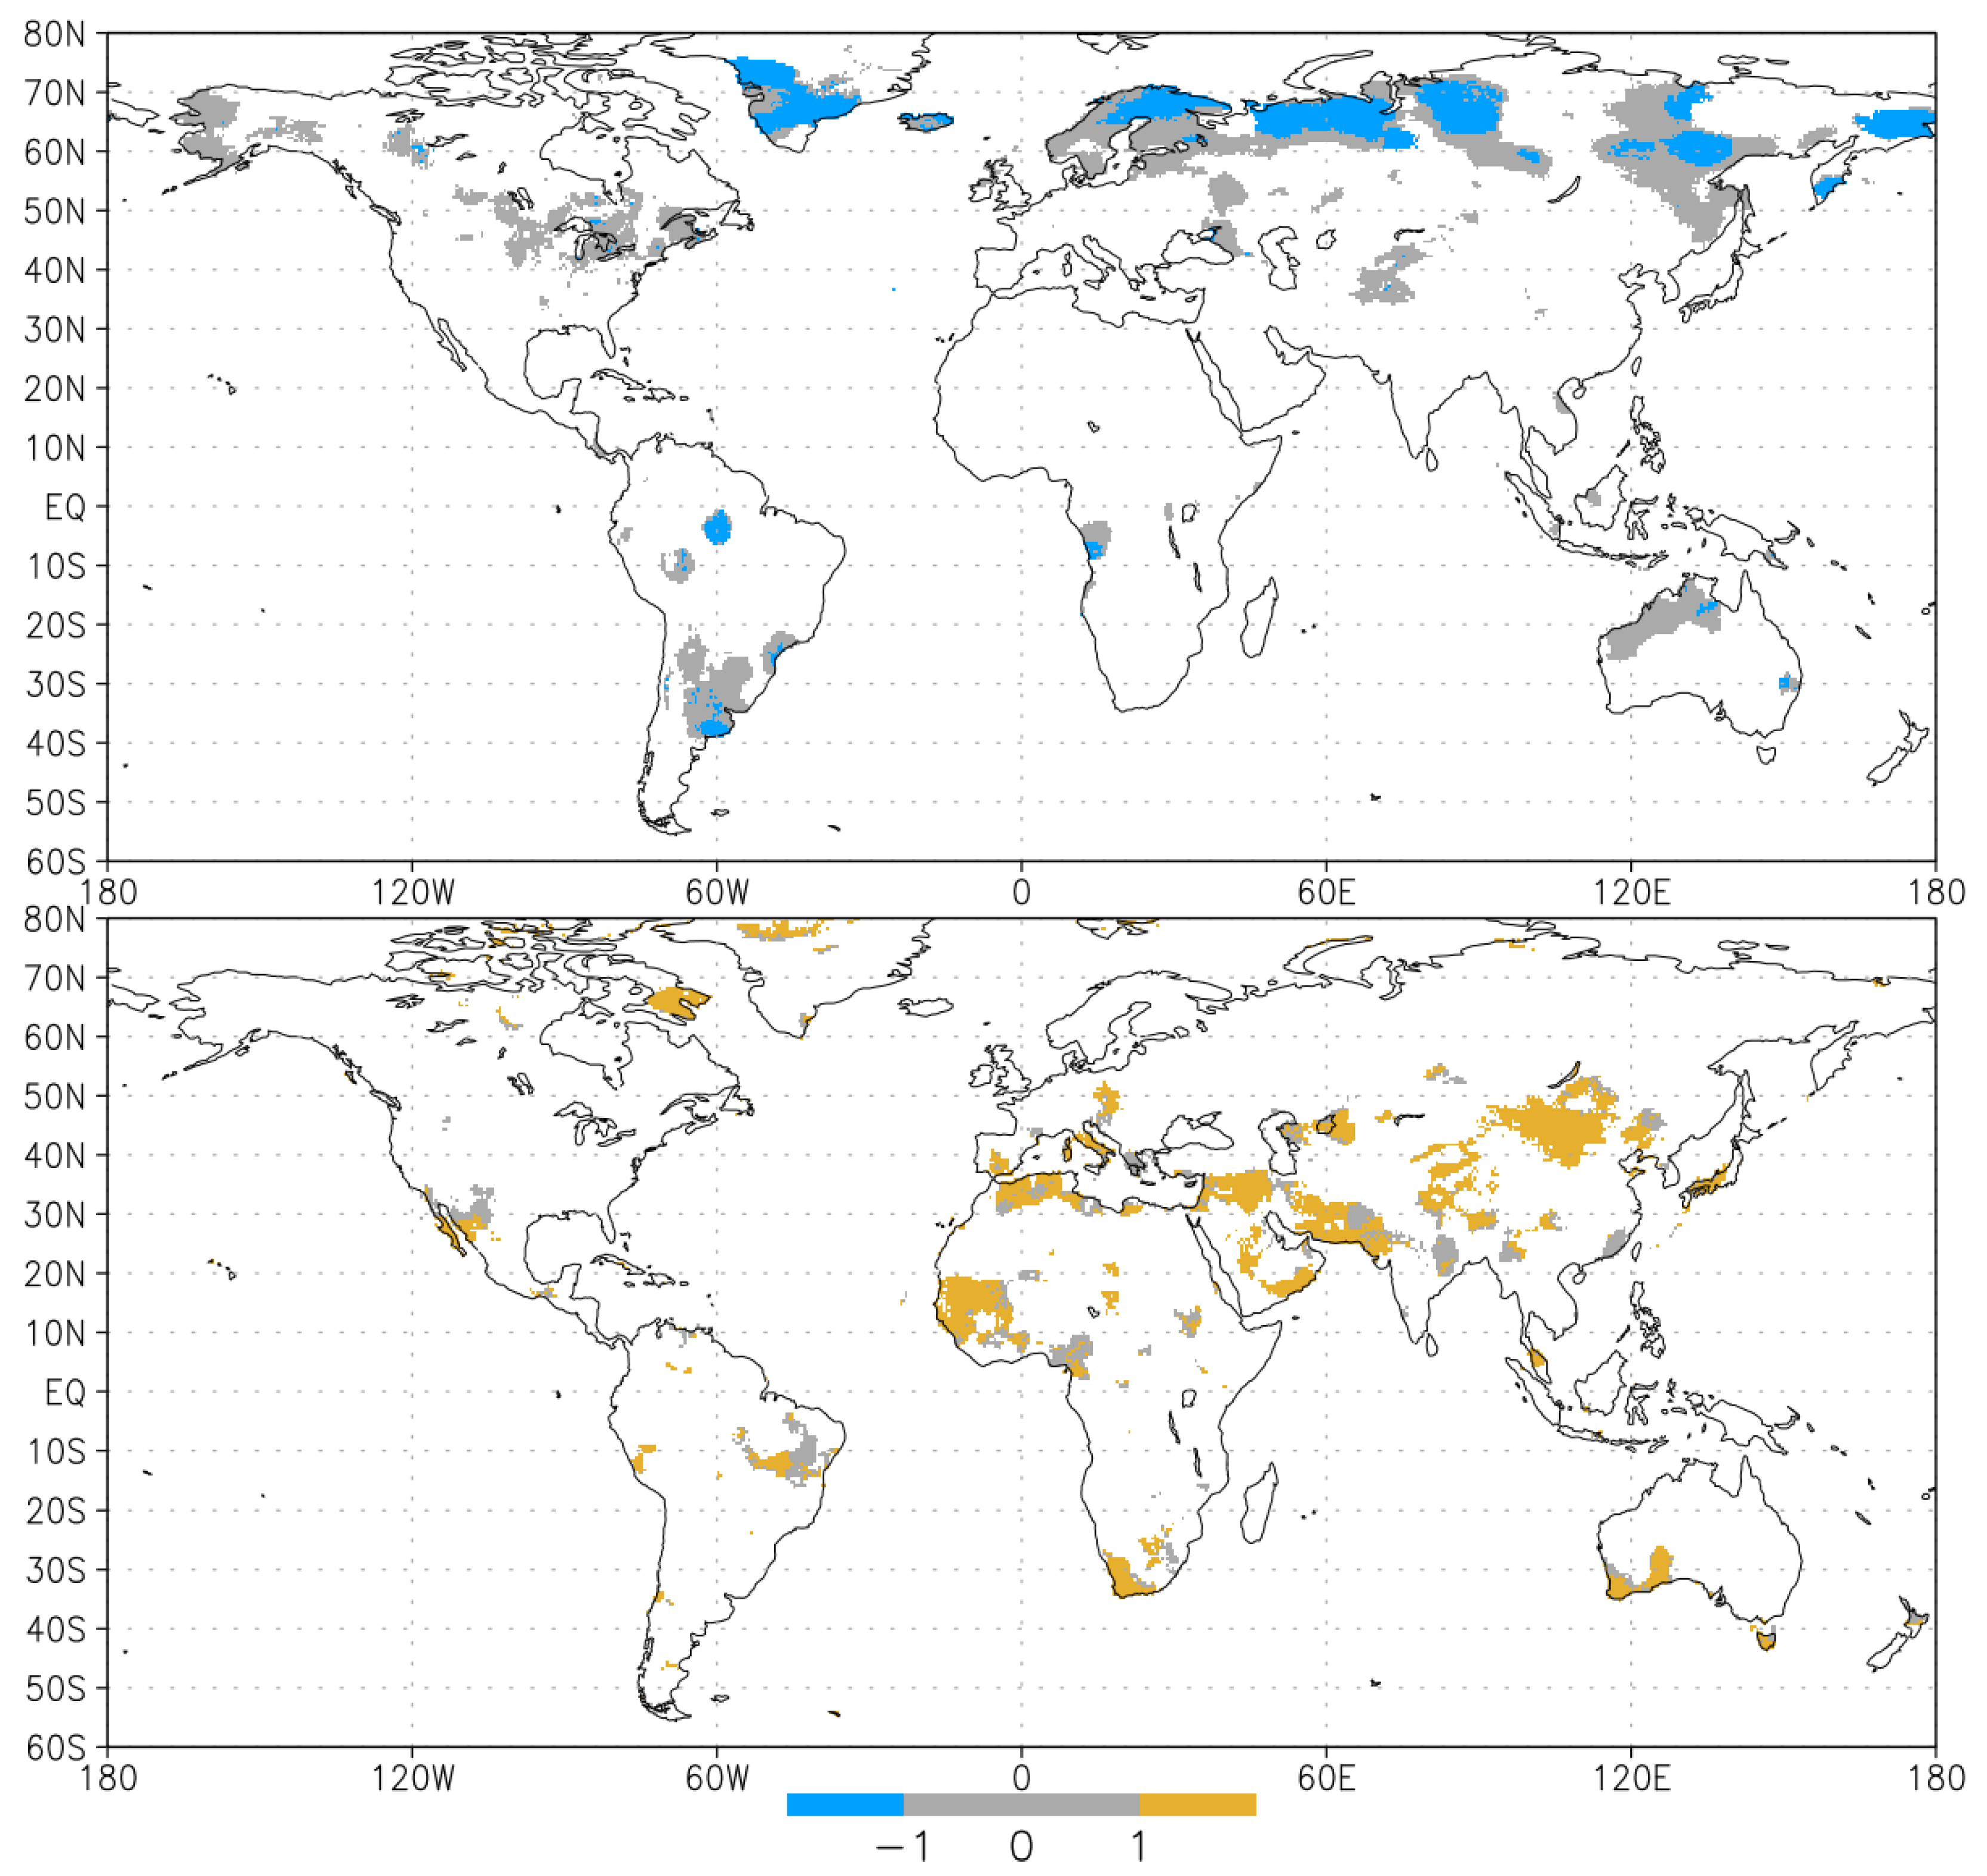
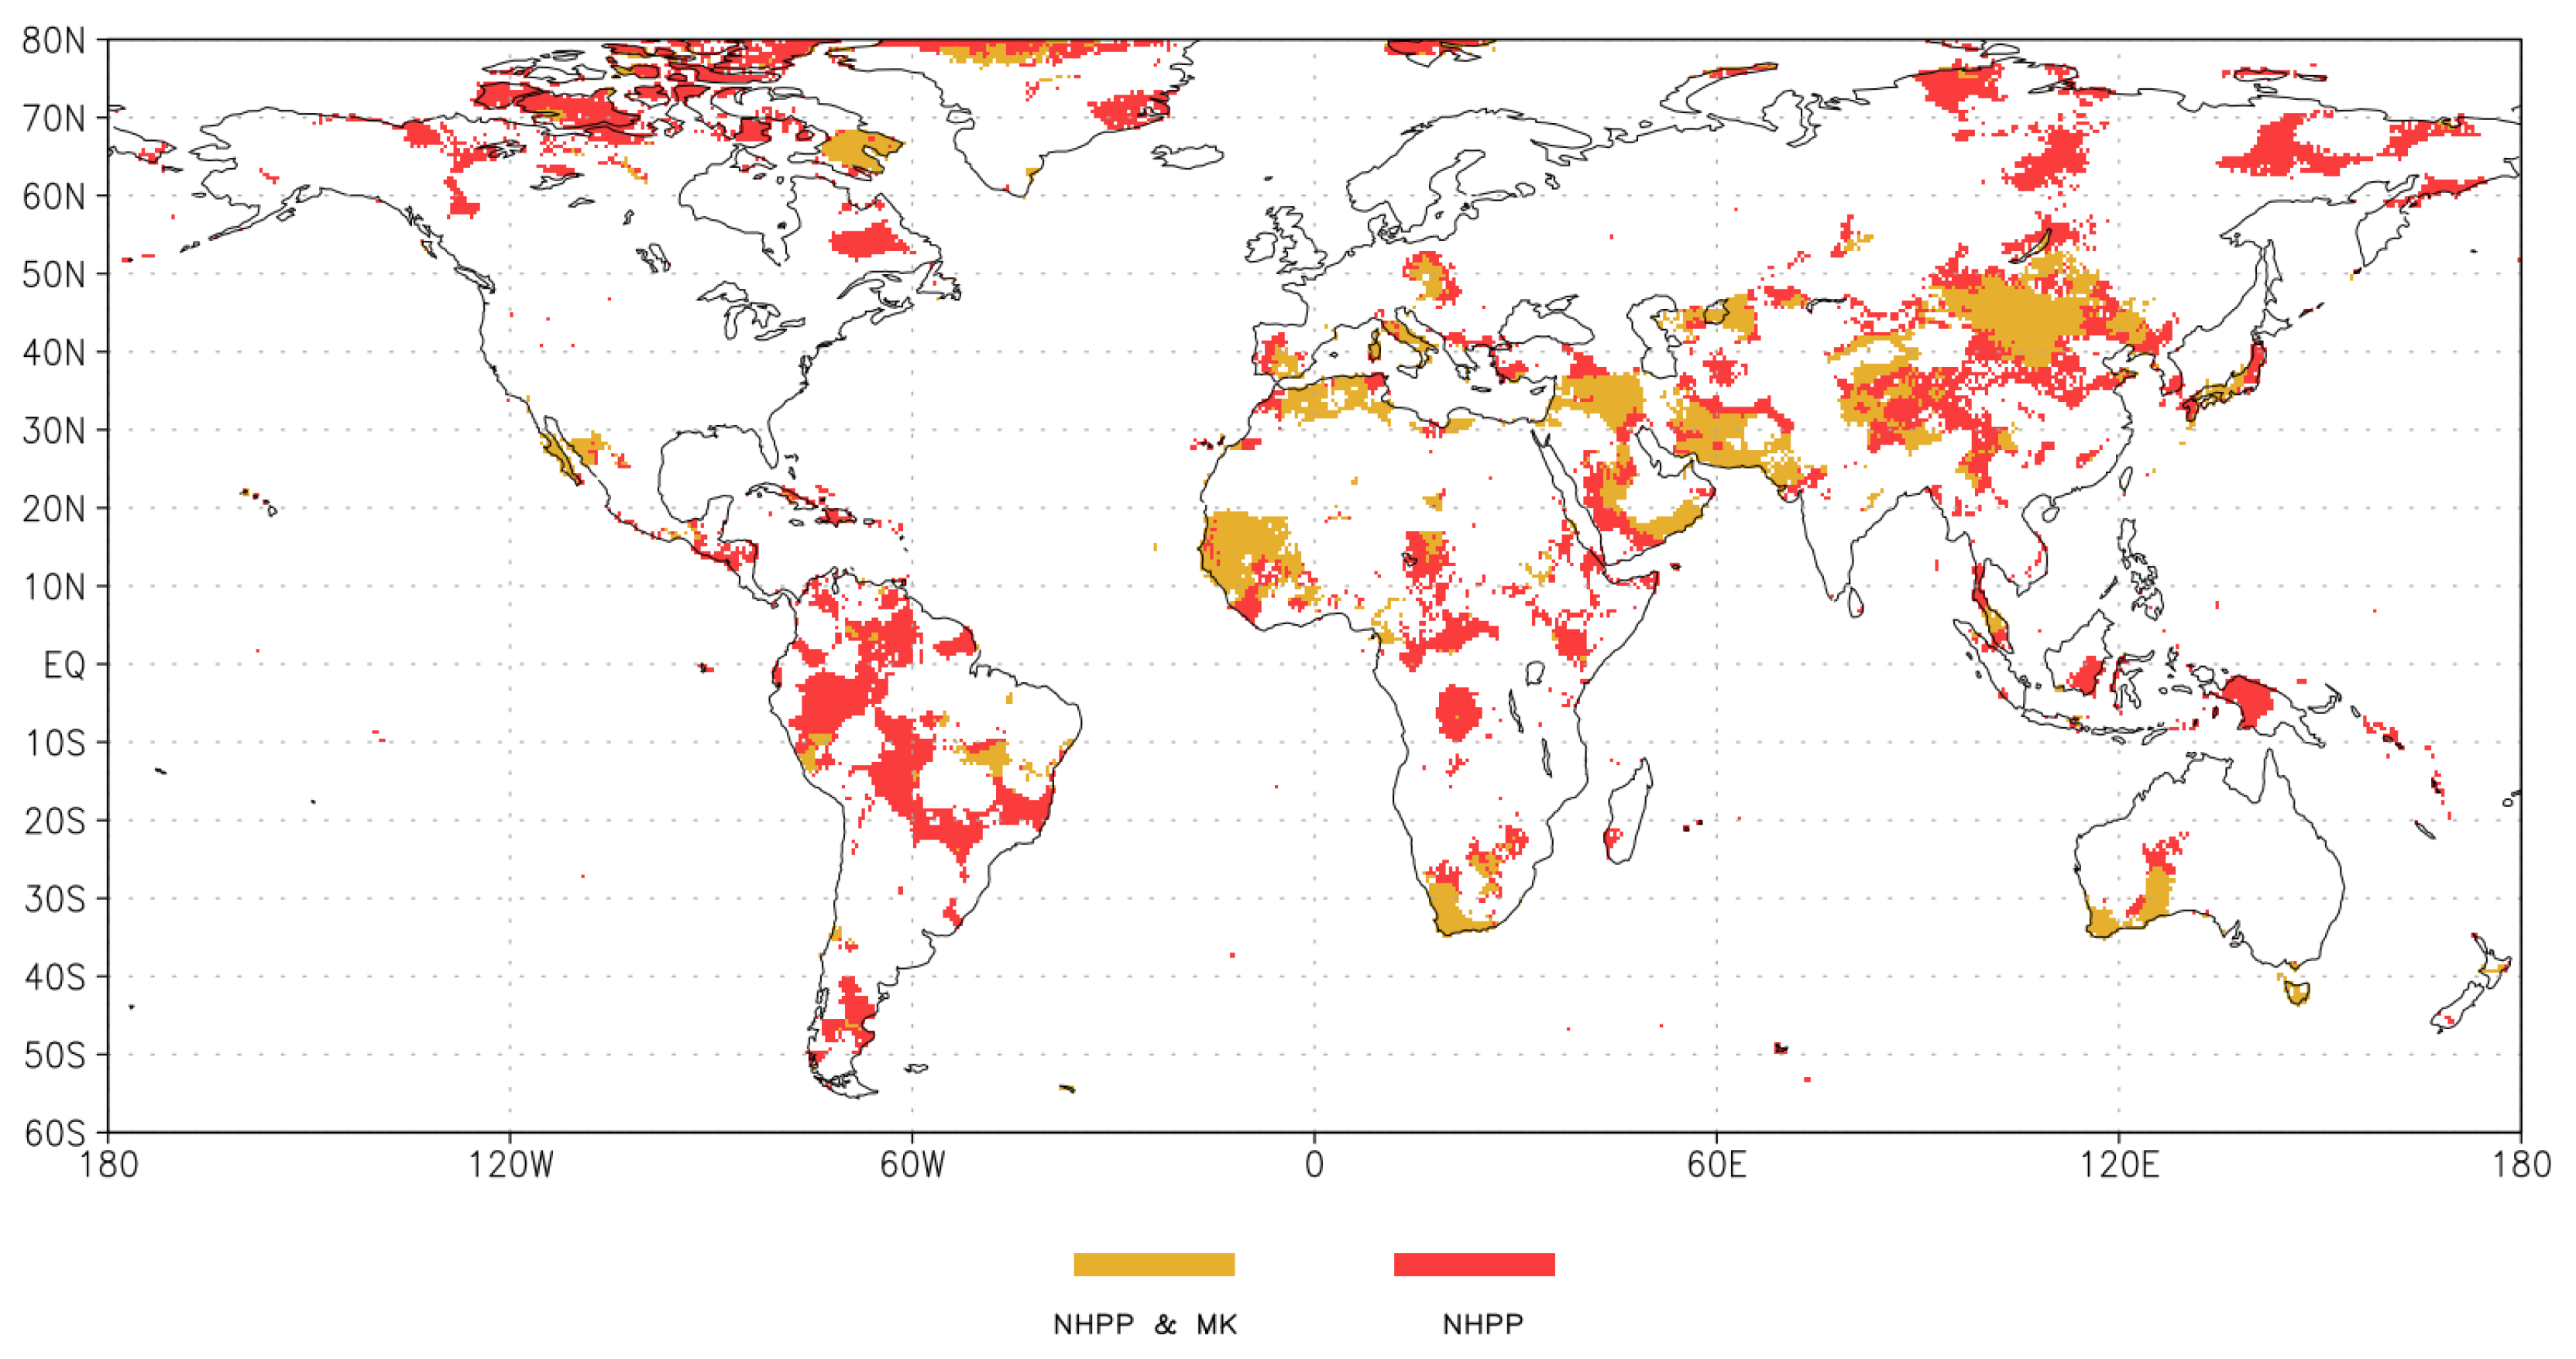
3.1. Differences between the Two Methods
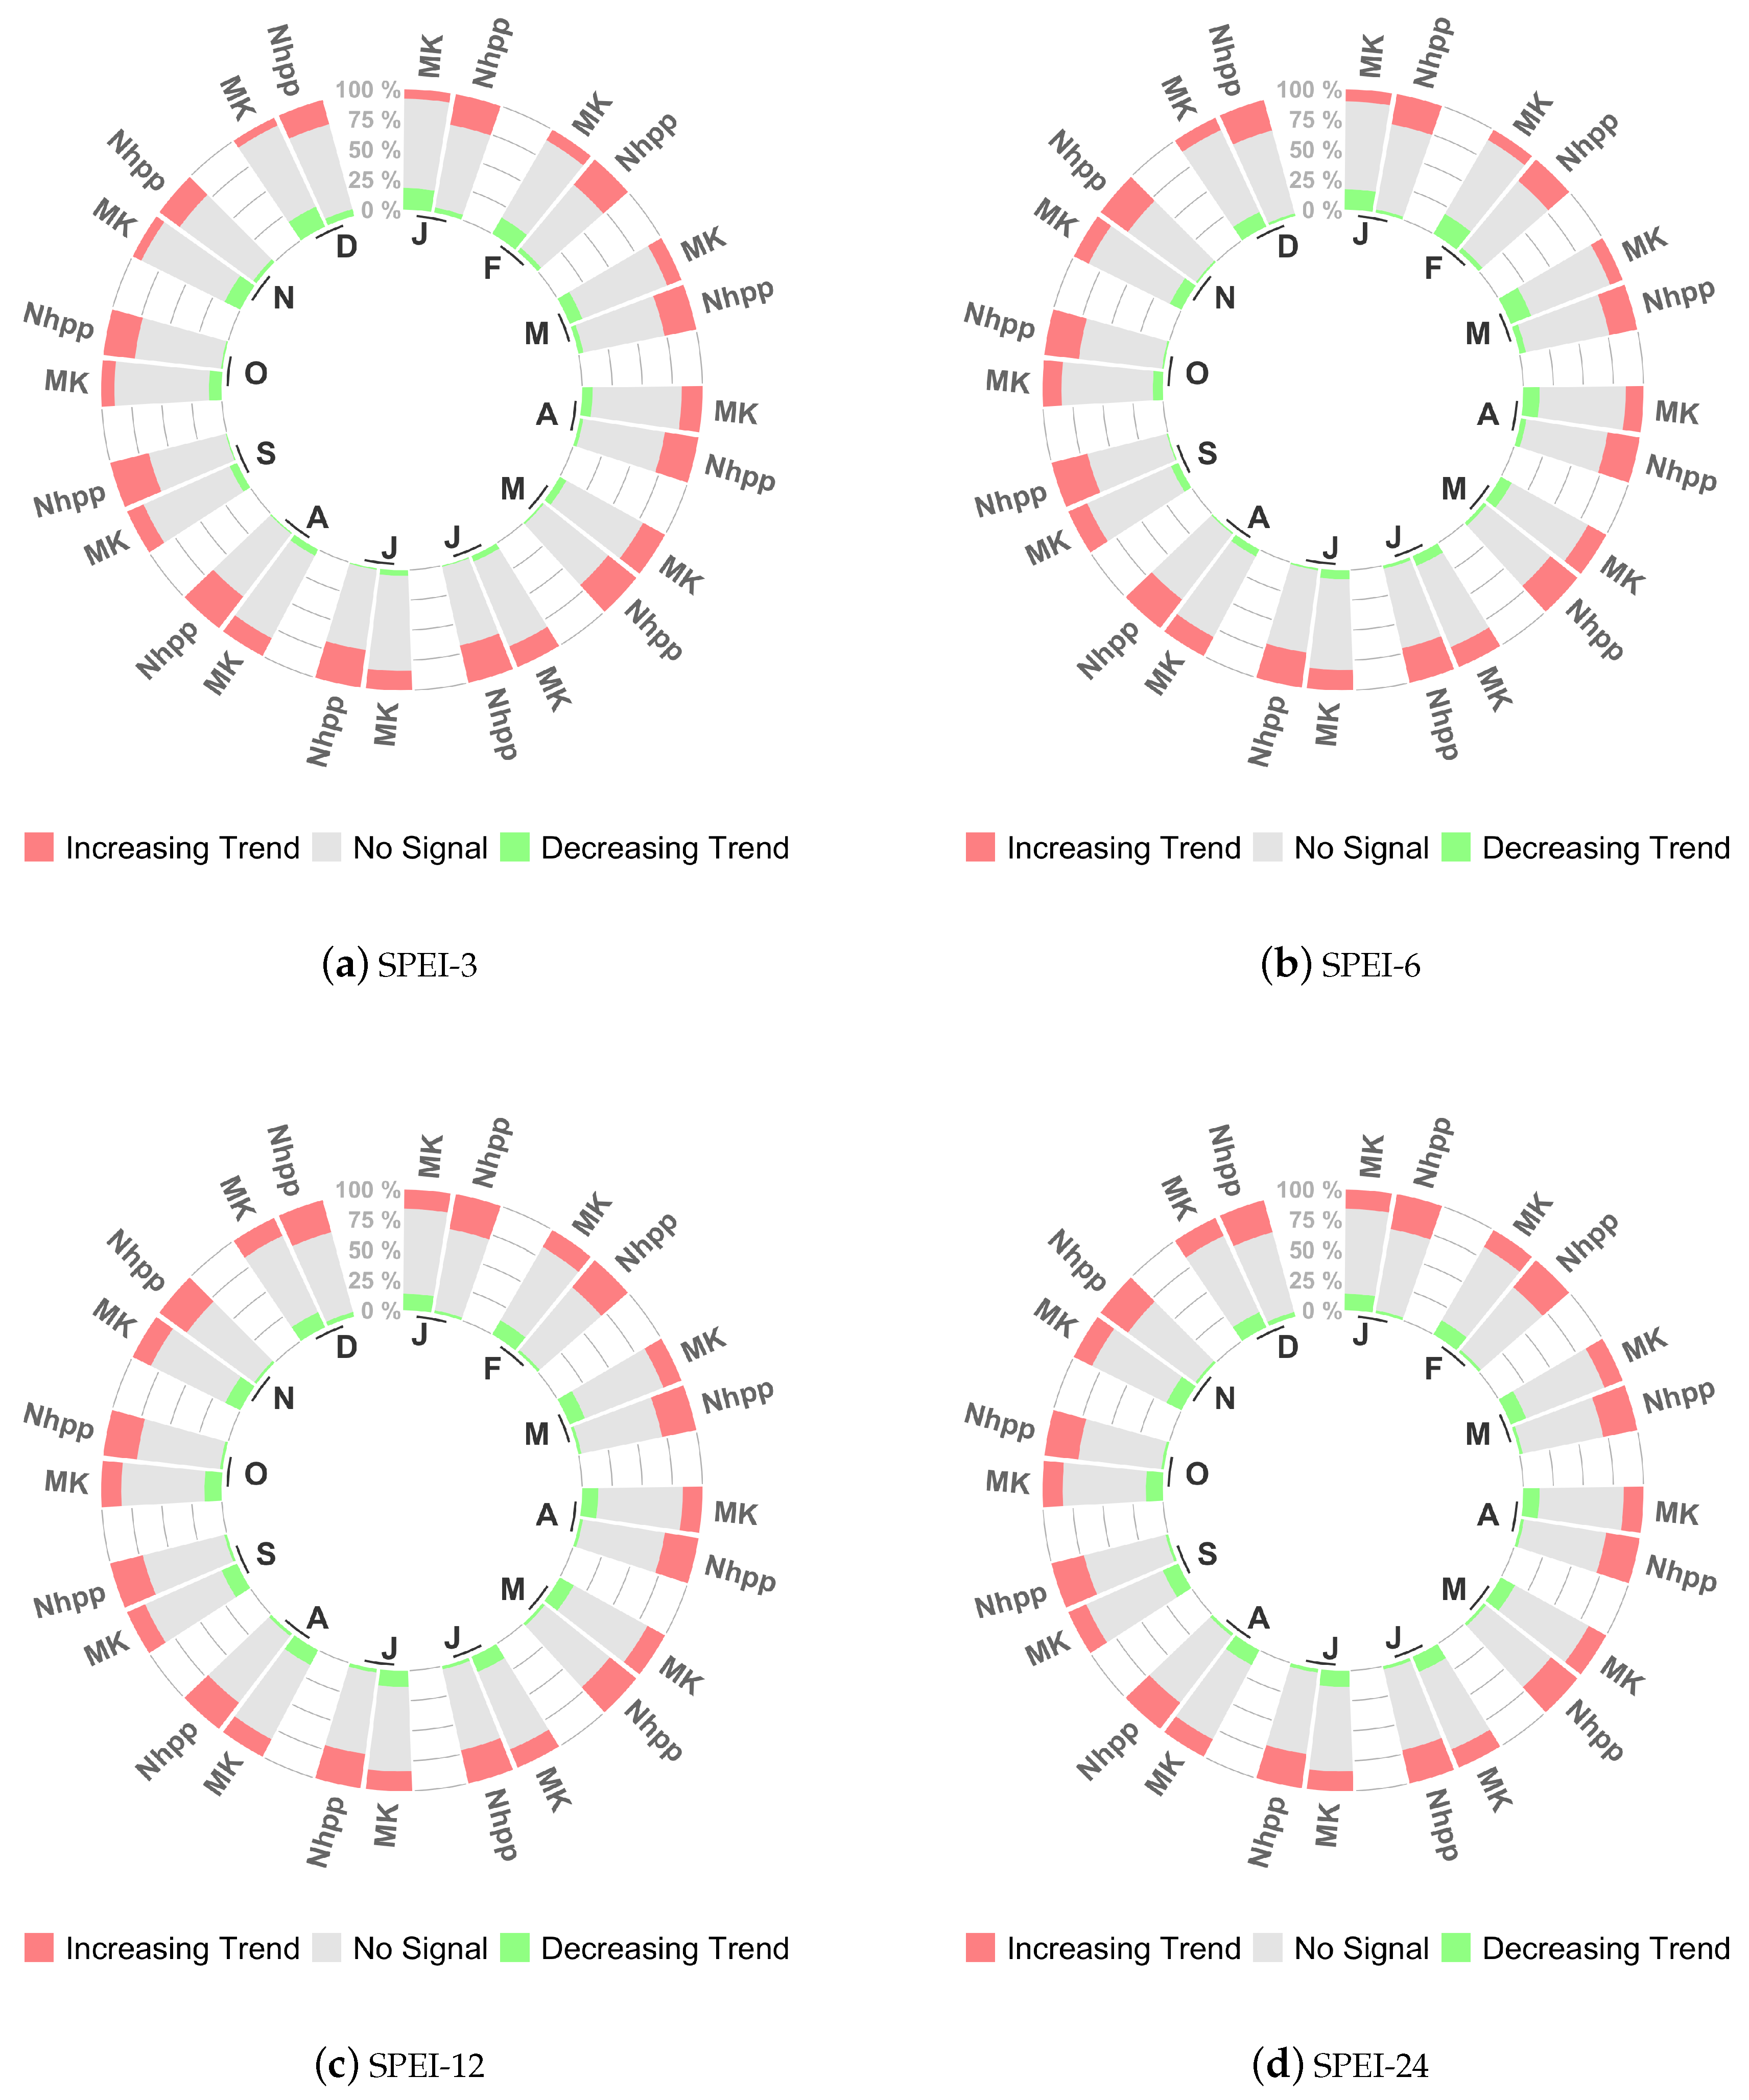
- 1 for positive trend, i.e., the increasing of drought episodes
- 0 for non-significant trend
- for negative trend, i.e., the decreasing of drought episodes
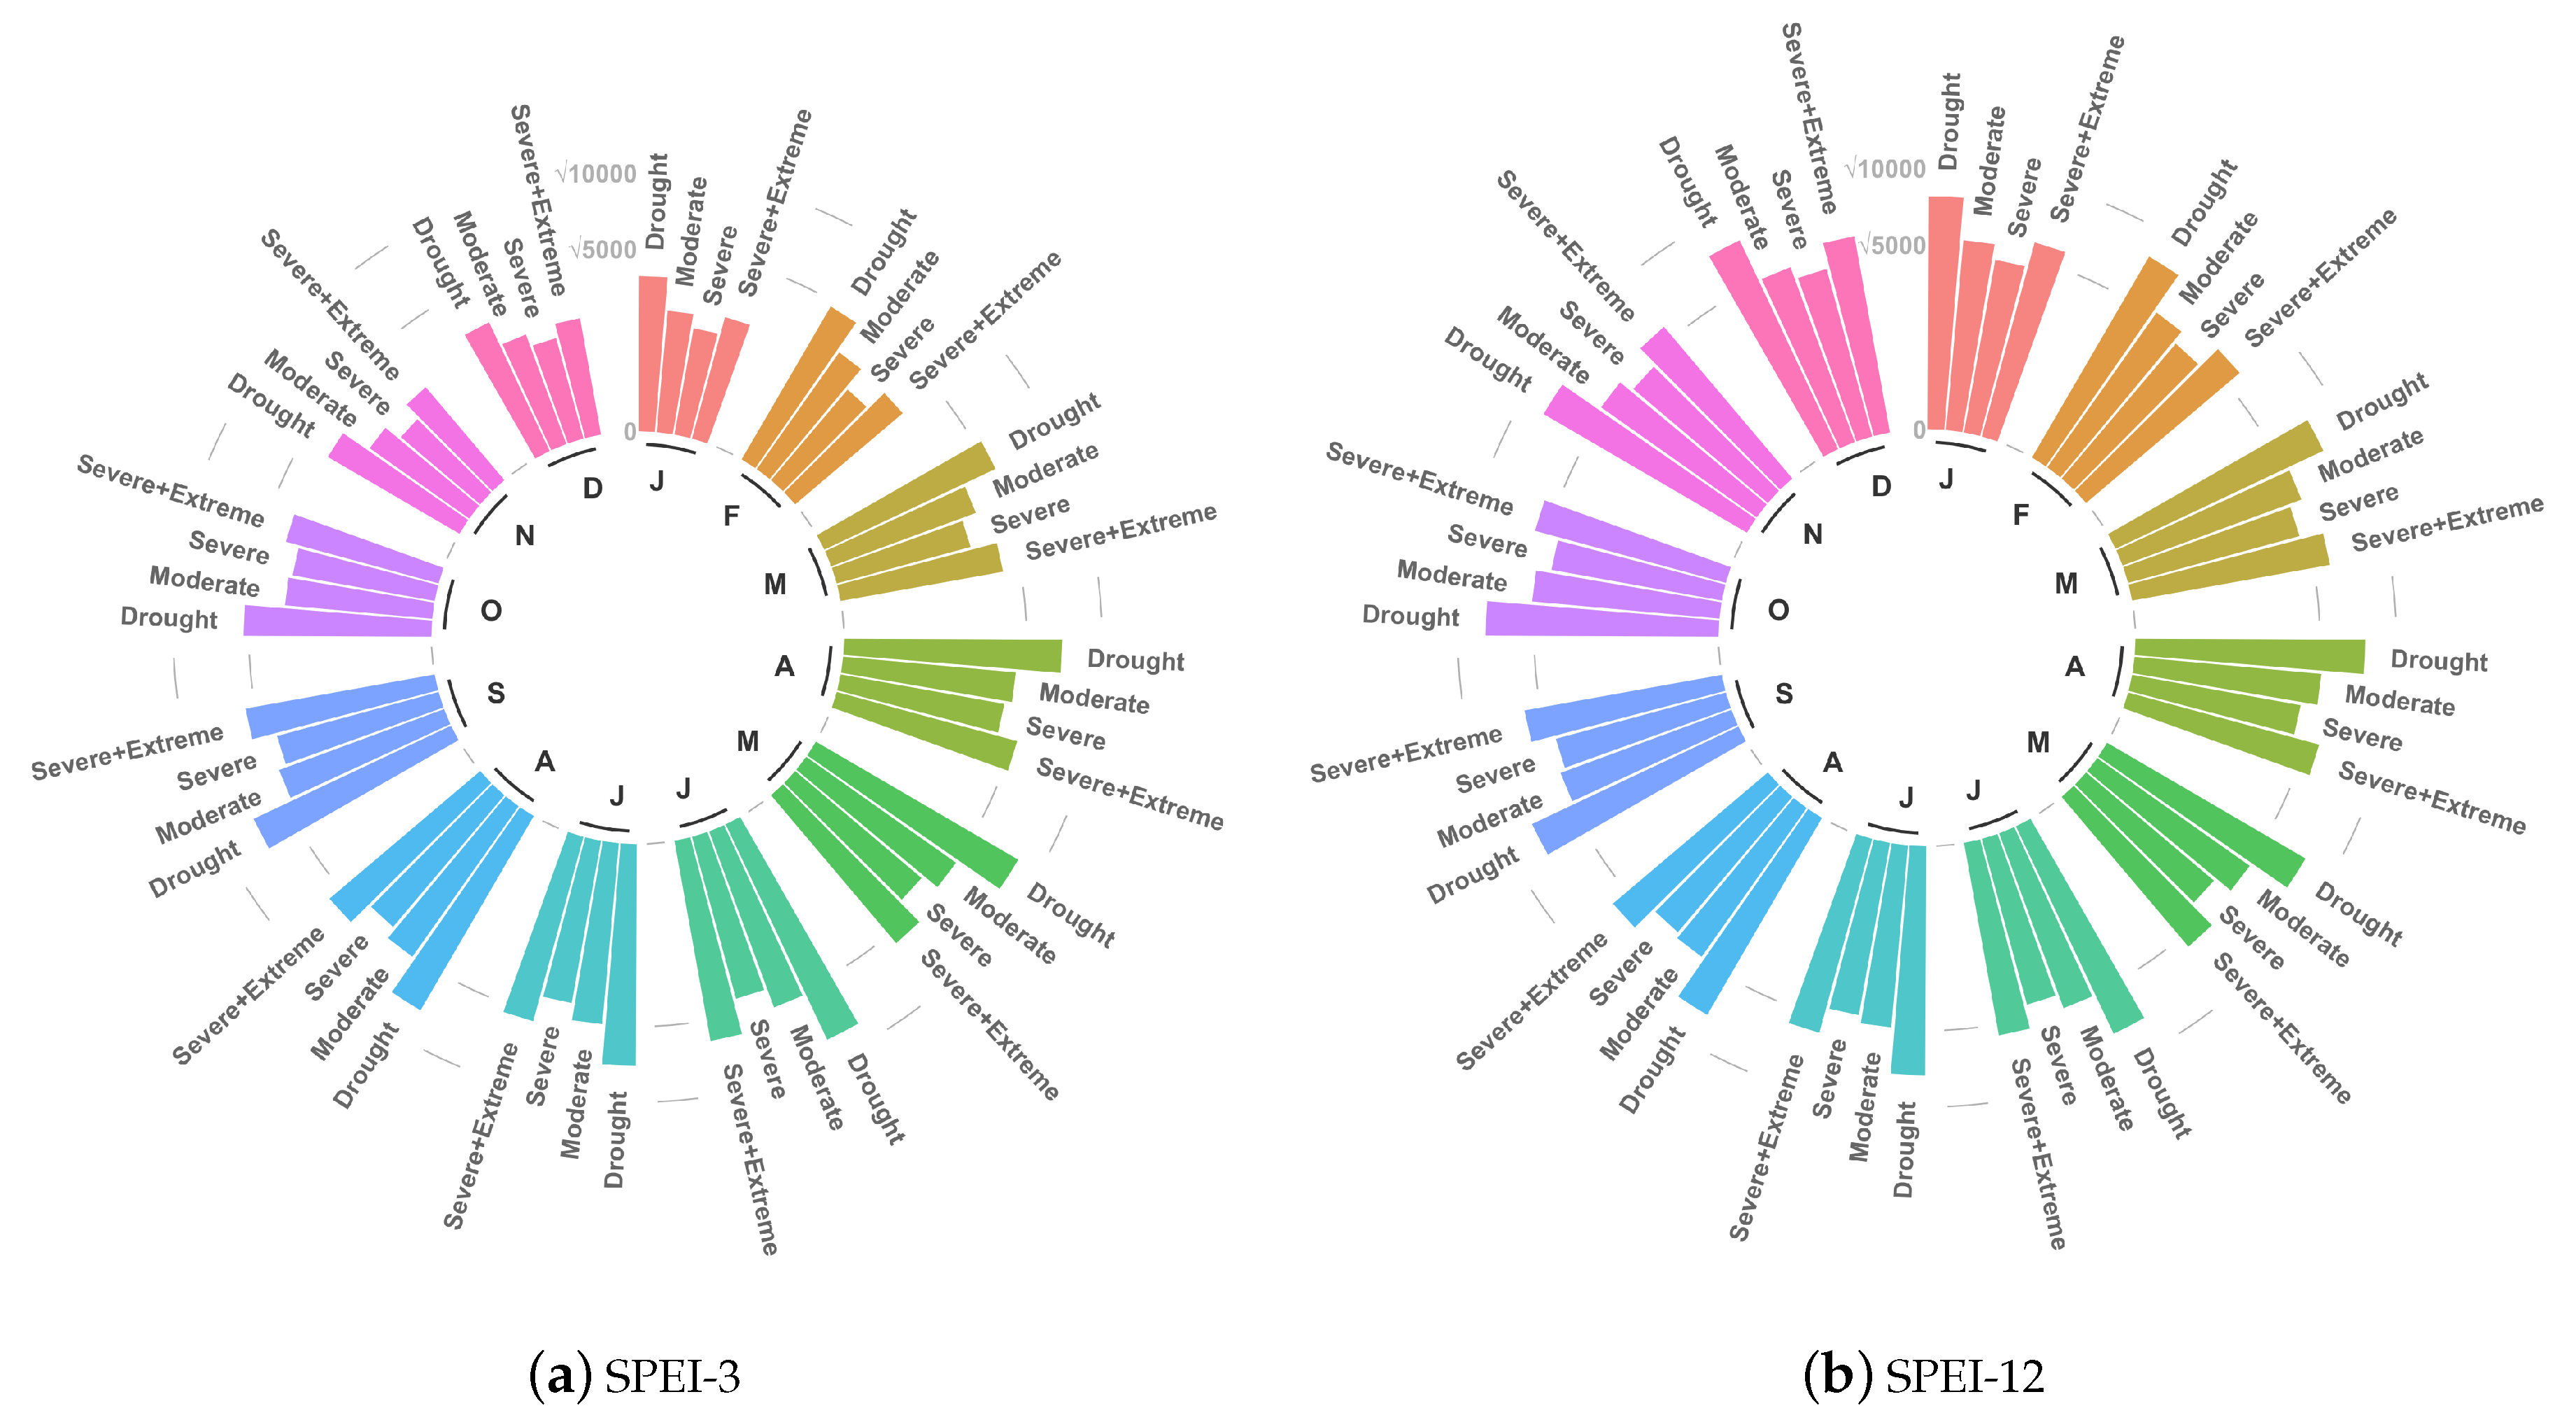
3.2. Characterizing Trend Results by Drought Risk Class
4. Discussion
Author Contributions
Funding
Acknowledgments
Conflicts of Interest
Abbreviations
| SPEI | Standardized Precipitation Evapotranspiration Index |
| PDSI | Palmer Drought Severity Index |
| NHPP | Non Homogeneous Poisson Process |
| SPI | Standardized Precipitation Index |
| GEV | Generalized Extreme Value Distribution |
| CRU | Climatic Research Unit |
| MK | Mann–Kendall |
| EDI | Effective Drought Index |
| CMI | Crop Moisture Index |
| SWSI | Surface Water Supply Index |
Appendix A
- /Dati (where to download CRU data)
- /Outputs
- /Plots
- (1)
- DroughtIndexGenerator.sh (parent)
- Look for the last CRU version among those in /Data then launch the childs DryMask.sh and *.R to compute SPI and SPEI for each grid cell (the outputs is a NetCDF file)
- The default SPEI time scales are set to 3, 4, 6, 12, 24, if they need to be changed in CRU_SPEI_calculation.R file
- The needed functions are in TrendFunctions.R
- DryMask.sh (child) set to NA the whole values of time series where yearly average precipitation is less than 73 mm (0.2 mm per day by 365 days) to guarantee the presence of missing values in the SPEI computation
- (2)
- DroughtTrendTest-Generator.sh (parent) (ONLY FOR SPEI)
- Check in /Outputs/../ if time series of SPEI have been generated
- Launch CRU_SPEI_TrendAnalysis.R to compute the trend analysis
- The outputs is a NetCDF file composed of four layers (Nhpp, MK, MK-classic, Difference Nhpp-MK), each one having −1, 0, or +1 values. Notice that an increasing trend of drought events is marked by −1 fo M-K whilst 1 for Nhpp.
- Another output is composed of the maps of the trend results (in /Plots)
- (1)
- Include ./ in the PATH
- (2)
- Add the bash command to call for the correspondent shell before the file name: e.g., nohup bash DroughtIndexGenerator.sh &
References
- Oki, T.; Agata, Y.; Kanae, S.; Saruhashi, T.; Yang, D.; Musiake, K. Global Assessment of Current Water Resources Using Total Runoff Integrating Pathways. Hydrol. Sci. J. 2001, 46, 983–995. [Google Scholar] [CrossRef]
- Rijsberman, F.R. Water Scarcity: Fact or Fiction? Agric. Water Manag. 2006, 80, 5–22. [Google Scholar] [CrossRef]
- Mishra, A.K.; Singh, V.P. A Review of Drought Concepts. J. Hydrol. 2010, 391, 202–216. [Google Scholar] [CrossRef]
- Vicente-Serrano, S.M.; Beguería, S.; López-Moreno, J.I. A Multiscalar Drought Index Sensitive to Global Warming: The Standardized Precipitation Evapotranspiration Index. J. Clim. 2009, 23, 1696–1718. [Google Scholar] [CrossRef]
- Newman, J.E.; Oliver, J.E. Palmer Index/Palmer Drought Severity Index. In Encyclopedia of World Climatology; Oliver, J.E., Ed.; Springer: Dordrecht, The Netherlands, 2005; pp. 571–573. [Google Scholar] [CrossRef]
- Mckee, T.B.; Doesken, N.J.; Kleist, J. The Relationship of Drought Frequency and Duration to Time Scales. In Proceedings of the Eight Conference of Applied Climatology, Anheim, CA, USA, 17–22 January 1993. [Google Scholar]
- Moreira, E.E.; Paulo, A.A.; Pereira, L.S.; Mexia, J.T. Analysis of SPI Drought Class Transitions Using Loglinear Models. J. Hydrol. 2006, 331, 349–359. [Google Scholar] [CrossRef]
- Bordi, I.; Fraedrich, K.; Sutera, A. Observed Drought and Wetness Trends in Europe: An Update. Hydrol. Earth Syst. Sci. 2009, 13, 1519–1530. [Google Scholar] [CrossRef]
- Hisdal, H.; Stahl, K.; Tallaksen, L.M.; Demuth, S. Have Streamflow Droughts in Europe Become More Severe or Frequent? Int. J. Climatol. 2001, 21, 317–333. [Google Scholar] [CrossRef]
- Burn, D.H.; Hag Elnur, M.A. Detection of Hydrologic Trends and Variability. J. Hydrol. 2002, 255, 107–122. [Google Scholar] [CrossRef]
- Vicente-Serrano, S.M.; Chura, O.; López-Moreno, J.I.; Azorin-Molina, C.; Sanchez-Lorenzo, A.; Aguilar, E.; Moran-Tejeda, E.; Trujillo, F.; Martínez, R.; Nieto, J.J. Spatio-Temporal Variability of Droughts in Bolivia: 1955–2012. Int. J. Climatol. 2015, 35, 3024–3040. [Google Scholar] [CrossRef]
- Li, B.; Zhou, W.; Zhao, Y.; Ju, Q.; Yu, Z.; Liang, Z.; Acharya, K. Using the SPEI to Assess Recent Climate Change in the Yarlung Zangbo River Basin, South Tibet. Water 2015, 7, 5474–5486. [Google Scholar] [CrossRef]
- Liu, X.; Pan, Y.; Zhu, X.; Yang, T.; Bai, J.; Sun, Z. Drought Evolution and Its Impact on the Crop Yield in the North China Plain. J. Hydrol. 2018, 564, 984–996. [Google Scholar] [CrossRef]
- Tan, M.L.; Chua, V.P.; Li, C.; Brindha, K. Spatiotemporal Analysis of Hydro-Meteorological Drought in the Johor River Basin, Malaysia. Theor. Appl. Climatol. 2019, 135, 825–837. [Google Scholar] [CrossRef]
- Krysanova, V.; Vetter, T.; Hattermann, F. Detection of Change in Drought Frequency in the Elbe Basin: Comparison of Three Methods. Hydrol. Sci. J. 2008, 53, 519–537. [Google Scholar] [CrossRef]
- Bazrafshan, J. Effect of Air Temperature on Historical Trend of Long—Term Droughts in Different Climates of Iran. Water Resour. Manag. 2017, 31, 4683–4698. [Google Scholar] [CrossRef]
- Yevjevich, V.M.; Colorado State University. An Objective Approach to Definitions and Investigations of Continental Hydrologic Droughts; Hydrology and Water Resources Program; Colorado State University: Fort Collins, CO, USA, 1967. [Google Scholar]
- Mishra, A.K.; Singh, V.P. Analysis of Drought Severity-Area-Frequency Curves Using a General Circulation Model and Scenario Uncertainty. J. Geophys. Res. Atmos. 2009, 114. [Google Scholar] [CrossRef]
- Mortuza, M.R.; Moges, E.; Demissie, Y.; Li, H.Y. Historical and Future Drought in Bangladesh Using Copula-Based Bivariate Regional Frequency Analysis. Theor. Appl. Climatol. 2019, 135, 855–871. [Google Scholar] [CrossRef]
- Onyutha, C. On Rigorous Drought Assessment Using Daily Time Scale: Non-Stationary Frequency Analyses, Revisited Concepts, and a New Method to Yield Non-Parametric Indices. Hydrology 2017, 4, 48. [Google Scholar] [CrossRef]
- Yue, S.; Pilon, P.; Cavadias, G. Power of the Mann–Kendall and Spearman’s Rho Tests for Detecting Monotonic Trends in Hydrological Series. J. Hydrol. 2002, 259, 254–271. [Google Scholar] [CrossRef]
- Yue, S.; Pilon, P.; Phinney, B.; Cavadias, G. The Influence of Autocorrelation on the Ability to Detect Trend in Hydrological Series. Hydrol. Process. 2002, 16, 1807–1829. [Google Scholar] [CrossRef]
- Von Storch, H.; Navarra, A. (Eds.) Analysis of Climate Variability: Applications of Statistical Techniques Proceedings of an Autumn School Organized by the Commission of the European Community on Elba from 30 October to 6 November 1993, 2nd ed.; Springer: Berlin/Heidelberg, Germany, 1999. [Google Scholar]
- Graham, C.; Talay, D. Stochastic Modelling and Applied Probability; Springer: Berlin/Heidelberg, Germany, 2013; Volume 68. [Google Scholar]
- Park, J.; Sung, J.H.; Lim, Y.J.; Kang, H.S. Introduction and Application of Non-Stationary Standardized Precipitation Index Considering Probability Distribution Function and Return Period. Theor. Appl. Climatol. 2019, 136, 529–542. [Google Scholar] [CrossRef]
- Crow, L.H. Reliability Analysis for Complex, Repairable Systems. In Reliability and Biometry; Proschan, F., Serfling, R.G., Eds.; SIAM: Philadelphia, PA, USA, 1974; pp. 379–410. [Google Scholar]
- Ho, C.H. Volcanic Time-Trend Analysis. J. Volcanol. Geotherm. Res. 1996, 74, 171–177. [Google Scholar] [CrossRef]
- Achcar, J.A.; Coelho-Barros, E.A.; de Souza, R.M. Use of Non-Homogeneous Poisson Process (NHPP) in Presence of Change-Points to Analyze Drought Periods: A Case Study in Brazil. Environ. Ecol. Stat. 2016, 1–15. [Google Scholar] [CrossRef]
- Beguería, S.; Vicente-Serrano, S.M.; Reig, F.; Latorre, B. Standardized Precipitation Evapotranspiration Index (SPEI) Revisited: Parameter Fitting, Evapotranspiration Models, Tools, Datasets and Drought Monitoring. Int. J. Climatol. 2014, 34, 3001–3023. [Google Scholar] [CrossRef]
- Harris, I.; Jones, P.D.; Osborn, T.J.; Lister, D.H. Updated High-Resolution Grids of Monthly Climatic Observations—The CRU TS3.10 Dataset. Int. J. Climatol. 2014, 34, 623–642. [Google Scholar] [CrossRef]
- Di Giuseppe, E.; Quaresima, S.; Pasqui, M. edidigiu/DROUGHT-SPEI: SPEI-Trend. Zenodo 2019. [Google Scholar] [CrossRef]
- Beguería, S. Sbegueria/SPEIbase: Version 2.5.1. Zenodo 2017. [Google Scholar] [CrossRef]
- Hijmans, R.J. Raster: Geographic Data Analysis and Modeling; R package version 3.0-2. 2018. Available online: https://CRAN.R-project.org/package=raster (accessed on 24 September 2019).
- R Core Team. R: A Language and Environment for Statistical Computing; R Foundation for Statistical Computing: Vienna, Austria, 2019. [Google Scholar]
- Beguería, S.; Vicente-Serrano, S.M. SPEI: Calculation of the Standardised Precipitation-Evapotranspiration Index; R Package Version 1.7. 2017. Available online: https://CRAN.R-project.org/package=SPEI (accessed on 24 September 2019).
- Patakamuri, S.K.; O’Brien, N. Modifiedmk: Modified Versions of Mann Kendall and Spearman’s Rho Trend Tests. Available online: https://CRAN.R-project.org/package=modifiedmk (accessed on 24 September 2019).
- Stagge, J.H.; Tallaksen, L.M.; Gudmundsson, L.; Van Loon, A.F.; Stahl, K. Candidate Distributions for Climatological Drought Indices (SPI and SPEI). Int. J. Climatol. 2015, 35, 4027–4040. [Google Scholar] [CrossRef]
- Vicente-Serrano, S.M.; Beguería, S. Comment on ‘Candidate Distributions for Climatological Drought Indices (SPI and SPEI)’ by James H. Stagge et al. Int. J. Climatol. 2016, 36, 2120–2131. [Google Scholar] [CrossRef]
- Mann, H.B. Nonparametric Tests Against Trend. Econometrica 1945, 13, 245–259. [Google Scholar] [CrossRef]
- Kendall, M. Rank Correlation Methods; C. Griffin: London, UK, 1948. [Google Scholar]
- Sen, P.K. Estimates of the Regression Coefficient Based on Kendall’s Tau. J. Am. Stat. Assoc. 1968, 63, 1379–1389. [Google Scholar] [CrossRef]
- Hamed, K.H.; Ramachandra Rao, A. A Modified Mann-Kendall Trend Test for Autocorrelated Data. J. Hydrol. 1998, 204, 182–196. [Google Scholar] [CrossRef]
- Zhang, X.; Zwiers, F.W. Comment on “Applicability of Prewhitening to Eliminate the Influence of Serial Correlation on the Mann-Kendall Test” by Sheng Yue and Chun Yuan Wang. Water Resour. Res. 2004, 40. [Google Scholar] [CrossRef]
- Sneyers, R. On the Statistical Analysis of Series of Observations; Number no. 143 in Technical Note; Secretariat of the World Meteorological Organization: Geneva, Switzerland, 1990. [Google Scholar]
- Gocic, M.; Trajkovic, S. Analysis of Changes in Meteorological Variables Using Mann-Kendall and Sen’s Slope Estimator Statistical Tests in Serbia. Glob. Planet. Chang. 2013, 100, 172–182. [Google Scholar] [CrossRef]
- Meyer, D.; Zeileis, A.; Hornik, K. Vcd: Visualizing Categorical Data; R package Version 1.4-4. 2017. Available online: https://cran.r-project.org/web/packages/ (accessed on 24 September 2019).
- Crow, L.H. Confidence Interval Procedures for the Weibull Process With Applications to Reliability Growth. Technometrics 1982, 24, 67–72. [Google Scholar] [CrossRef]
- Guttman, N.B. Accepting the Standardized Precipitation Index: A Calculation Algorithm 1. JAWRA J. Am. Water Resour. Assoc. 1999, 35, 311–322. [Google Scholar] [CrossRef]
- Palmer, W.C. Meteorological Drought; Research Paper No. 45; US Weather Bureau: Washington, DC, USA, 1965; Volume 58.
- Morid, S.; Smakhtin, V.; Moghaddasi, M. Comparison of Seven Meteorological Indices for Drought Monitoring in Iran. Int. J. Climatol. J. R. Meteorol. Soc. 2006, 26, 971–985. [Google Scholar] [CrossRef]
- Gibbs, W.; Maher, J. Rainfall Deciles as Drought Indicators; Bureau of Meteorology Bulletin No. 48; Commonwealth of Australia: Melbourne, Australia, 1967; Volume 29.
- Palmer, W.C. Keeping Track of Crop Moisture Conditions, Nationwide: The New Crop Moisture Index. Weatherwise 1968. [Google Scholar] [CrossRef]
- Shafer, B. Developemnet of a Surface Water Supply Index (SWSI) to Assess the Severity of Drought Conditions in Snowpack Runoff Areas. In Proceedings of the 50th Annual Western Snow Conference, Colorado State University, Fort Collins, CO, USA, 19–23 April 1982. [Google Scholar]


| Class | SPEI Values |
|---|---|
| Moderately dry | −1 to −1.49 |
| Severely dry | −1.50 to −1.99 |
| Extremely dry | −2 and less |
| Dry Risk Class | SPEI Values |
|---|---|
| Drought | −1 and less |
| Moderate | −1 to −1.49 |
| Severe | −1.50 to −1.99 |
| Severe+Extreme | −1.50 and less |
| January | February | March | April | May | June | July | August | September | October | November | December | |
|---|---|---|---|---|---|---|---|---|---|---|---|---|
| SPEI-3 | ||||||||||||
| SPEI-6 | ||||||||||||
| SPEI-12 | ||||||||||||
| SPEI-24 |
© 2019 by the authors. Licensee MDPI, Basel, Switzerland. This article is an open access article distributed under the terms and conditions of the Creative Commons Attribution (CC BY) license (http://creativecommons.org/licenses/by/4.0/).
Share and Cite
Di Giuseppe, E.; Pasqui, M.; Magno, R.; Quaresima, S. A Counting Process Approach for Trend Assessment of Drought Condition. Hydrology 2019, 6, 84. https://doi.org/10.3390/hydrology6040084
Di Giuseppe E, Pasqui M, Magno R, Quaresima S. A Counting Process Approach for Trend Assessment of Drought Condition. Hydrology. 2019; 6(4):84. https://doi.org/10.3390/hydrology6040084
Chicago/Turabian StyleDi Giuseppe, Edmondo, Massimiliano Pasqui, Ramona Magno, and Sara Quaresima. 2019. "A Counting Process Approach for Trend Assessment of Drought Condition" Hydrology 6, no. 4: 84. https://doi.org/10.3390/hydrology6040084
APA StyleDi Giuseppe, E., Pasqui, M., Magno, R., & Quaresima, S. (2019). A Counting Process Approach for Trend Assessment of Drought Condition. Hydrology, 6(4), 84. https://doi.org/10.3390/hydrology6040084