Article

2015 Disastrous Floods in Louisiana, USA, and Assam, India: Groundwater Impact on the Water Balance Estimation

by
Tatiana Trifonova
1,*,
Dmitriy Trifonov
2 and
Sergey Arakelian
2
1
Department of Soil Geography, Lomonosov Moscow State University, Moscow 119991, Russia
2
Department of Physics and Applied Mathematics, Stoletovs Vladimir State University, Vladimir 600000, Russia
*
Author to whom correspondence should be addressed.
Hydrology 2016, 3(4), 41; https://doi.org/10.3390/hydrology3040041
Submission received: 26 August 2016 / Revised: 14 November 2016 / Accepted: 15 November 2016 / Published: 21 November 2016
(This article belongs to the Special Issue Floods and Landslide Prediction)

Abstract

:
Traditionally torrential rains are considered as the main factor of flood emergence. With the examples of two disastrous floods in 2015 in absolutely different parts of the world, the authors roughly estimate the water balance and suggest an alternative hypothesis. The simplest model, taking into account precipitation, evaporation and soil permeability, clearly points out the significant discrepancy between potentially accumulated and observed water masses. This observation pushes the idea that precipitation is necessary but not sufficient for disastrous flood emergence, so the only other available water source—groundwater—cannot be ignored.

1. Introduction

Today the important role of groundwater does not raise any doubts: groundwater is one of the main parts of the river basin system alongside precipitation and surface water [1,2], and all the parts are closely interconnected [3,4]. Groundwater is the source of fresh water, and the state of groundwater is used even to predict earthquakes [5]. The list can be continued, but all these examples are just particular cases following from the fact that groundwater is a huge water source with an estimated volume of 1.05 × 10⁷ km3 [6]. Moreover, groundwater has its own source that goes even deeper in the Earth’s mantle. In addition, the volume of this source is even greater than the volume of the world’s oceans [7].
As for the interaction of groundwater and surface water, there many models describing this process: from basic analytical descriptions (see e.g., [8]) to complex numerical systems implementing different scenarios (see e.g., [9]). Not only theoretically but even practically, the dynamic of streamflow is being controlled by the artificial changing of the rate of the groundwater/surface water interaction [10].
However, the role of groundwater in flood emergence is still being downplayed or even ignored. The problem is that the interaction of groundwater and surface water is usually modeled for steady conditions, but floods do not emerge in such conditions. Since floods are considered as solely a surface phenomenon, there still is the risk of making incorrect predictions concerning flood development. It is important to understand that the river basin (with underlying aquifers) is a system with a complex balance, and changes in one part can cause significant changes in remote parts [11].
Not taking into account floods caused by tsunamis or tornadoes, the main traditionally declared factor of flood emergence and development remains precipitation. The purpose of the present work is water balance estimation on examples of two disastrous floods that took place in 2015. Briefly, it is just as important to compare the water mass potentially accumulated in the specific area (assuming precipitation as the main source of water) and the water mass actually observed during the flood to show that precipitation is not sufficient, that flood development should be researched assuming a complex interaction of the river basin system’s parts.
The discrepancy between calculation and real observation leaves no doubt that there must be another source of water in addition to precipitation. We are sure that groundwater is deeply involved in the process of flood emergence and development, so thorough study of the role of groundwater in flood emergence and deeper analytical and numerical modeling of the groundwater and surface water interaction in the conditions of flood development are obviously necessary, because it can be a way of better predicting the water mass behavior, which eventually can save people’s lives.

2. Materials and Methods

2.1. Problem of Water Budget Estimation during the Flood

It is very well known (see e.g., [12]) that soil water availability strongly depends on a number of factors, i.e., soil type, soil components, soil texture, soil structure. This determines the water permeability of soil (as a body which contains pores with air/water components) to absorb water and to pass it through. The amount of water incoming to soil through its surface is principal when we are talking about the discharge of a stream during the flood due to heavy rain.
However, on the other hand, there is a feedback for the process when water is also a driving force for soil formation, and each state of soil changes over time (in particular, the saturation level, when all pore spaces are filled with water, is varied). In fact, each water state of soil does not stable and static for very long time as under the action of gravity water will start to drain out of the larger pores and will be replaced by air [13]. Thus the soil permeability can be under dynamic processes during the rainfall, and therefore it is difficult to estimate exactly the water balance for flood based on parameters in comparison with water balance in equilibrium everyday state of river basin.
Other problem is to estimate the process of evaporation and transpiration of surface water to atmosphere. The different regimes of these phenomena require a non-trivial analysis based not only on climatic conditions but on the topography of relief and existing soil-vegetation zones as well.
If we take into account the groundwater possible impact on mentioned above processes the situation with water balance estimation becomes sufficiently more complicated. The analysis of all these processes is out of this paper and probably cannot be carried out in details in principle. We would like now to underline only the fact that water balance estimation during the flood under heavy rain has many problems from two sides.
First, fundamental—as a dynamic process of a soil permeability variation under two counterpropagating water flows from both surface and ground, and also, their interaction (see e.g., [14]).
Second, practical—uncertainty of the surface water discharge estimation in river basin during the flood by existing methods and instruments of monitoring in spatially separated different areas in river basin, including the evaporation/transpiration processes under different atmospheric conditions developing in time.
There are many modern techniques and methods for determination of main control parameters for catchment hydrology (precipitation, river flow, evapotranspiration, soil water, groundwater) but all of them have some disadvantages and inexactness. Therefore a correct estimation of water budget has many problems associated with errors of the technique employed. The principal item from practical point of view is that for the water events the measured/available database is usually not enough for values of vital parameters in dynamic developed processes of water flows.

2.2. Overview of the Basic Water Balance Estimation Approach

Two 2015 disastrous floods are considered as the examples of the algorithm application. The first one took place in the state of Louisiana, the USA, in the period of 7–20 June. It affected four parishes of the state: Caddo Parish, Bossier Parish, Natchitoches Parish and Rapides Parish. The flood-generating river was the Red River of the South with the catchment area of 169,890 km2 including some areas of Texas, Oklahoma and Arkansas states of the USA.
The second disastrous flood took place in the state of Assam, India, in the period of 22 August–8 September. It affected more than 1.5 million people, 42 people died. Nearly 80% of the state was engulfed by the flood [15]. The flood-generating river was the Brahmaputra river with the catchment area of 651,334 km2 including the North-Eastern part of India and the South-Western part of China.
The simplest model for water balance estimation inevitably includes such main elements:
  • Precipitation
  • Evaporation
  • Soil permeability
  • Calculated water mass
  • Observed water mass
Since the aim of exact estimation with the defined precision isn’t set in this work some aspects are purposefully simplified. For example accumulated water mass at a certain day is calculated simply:
V i = n V i n ,
V i n = V i 1 , n + ( P i n e i n p n ) S n
where Vi—the volume of the accumulated water mass in the whole catchment area at a day i, Vin—the volume of the accumulated water mass in a region n at a day i, Pin—precipitation intensity in a region n at a day i, ein—evaporation rate in a region n at a day i, pn—soil permeability of a region n, Sn—the area of a region n. A region is meant as a specific part of the river catchment area with the similar weather conditions. Region-to-region transfer of water mass is neglected (we just try to estimate the volume of accumulated water mass in the entire basin), that’s why there is no index n − 1 in the formulas.
The certain temporal and spatial simplification parameters of the used arguments as well as the sources of data are given in Table 1.
Besides there are some significant remarks. Firstly evaporation rate does not include transpiration because of its negligible role in the process of evapotranspiration. Secondly although there is Darcy’s law exactly describing the process of percolation, for the aims of the present work tabular values of permeability of different soil types are quite enough. So soil permeability of the specific region is calculated using the formula:
p n = j k j p j ,
where kj—is the approximate percentage of soil type j in the total area of a region, pj—minimal tabular value of permeability of soil type j. Soil permeability in the context of the present work is measured not in m2 as it appears in Darcy’s law, but in mm/day that means how much water daily permeate through the one square unit of the surface.
So we have calculated water mass that potentially could be observed during the floods. And the last thing we need to do is to compare calculation and real observation. Of course the most exact data would be the really measured volume of water mass, but the problem is that there is no such data. So we have to use two different but both approximate approaches to estimate really observed water mass.
In the case of Assam flood we use firstly the statement of Assam State Disaster Management Authority about the 80% of the Assam state flooding [15] and secondly numerous photo and video evidences that the depth of flooding water mass was at least 0.5 m. Then we just multiply the area and the depth to get the volume of observed water mass.
In the case of Louisiana flood more complex and precise approach is used. We take the information about the Red River levels at Shreveport, Coushatta, Grand Ecore and Alexandria (the most affected cities of the Louisiana state) [23] and combine this data with the topographic map of Louisiana provided by TopoZone service [24]. Then like in the previous case we multiply the area and the depth with the remark that we don’t take the whole flooded area but that part of it that accords to one of the four selected cities. After all we sum four calculated values to get the resulting volume of observed water mass. This approach allows us to get quite exact value.

2.3. Advanced Water Balance Estimation Approach

The main idea of the advanced water balance approach is to try to take into account the dynamic property of the river basin system. Two parameters of the described above model require it most of all:
  • Soil permeability
  • Region-to-region transfer of water mass (streamflow)
Since the task of exact modeling of such a dynamic system is really difficult due to its spatial and temporal complication some simplifications are made. Firstly to take into account rapid falling of soil permeability caused by soil oversaturation this parameter is still considered as static but the initial values are decreased to the values of the already saturated soil.
Secondly even the region-to-region transfer of water mass is obviously continuous dynamic process it also can be split into discrete stages, so the exactness of the model is reduced to the needed scale. Since daily scale is evidently too large, hourly scale seems to be quite exact in the context of the present work. In this case measuring of streamflow is reduced to calculating the volume of water masses which hourly cross the border between two neighboring regions. The model described in [25] using the data of Global Flood Monitoring System [26] gives the opportunity to make the necessary calculations with sufficient exactness.
Nevertheless since this approach is not dynamic in the exact meaning it should be considered as just one of alternative approaches not replacing basic one described above.

3. Results

3.1. The Louisiana Flood Analysis

In the case of the Louisiana flood, the flood-generating river was the Red River of the south. The whole basin has been divided into seven regions (see Figure 1).
In Table 2, some parameters of the distinguished regions are presented.
As was mentioned above, the approach for calculating the observed water mass in the case of the Louisiana flood is a little bit more complex than in the case of the Assam flood, so in Table 3 the parameters of calculation are presented for better understanding the used approach. The final result is 11.0 × 10⁹ m3.
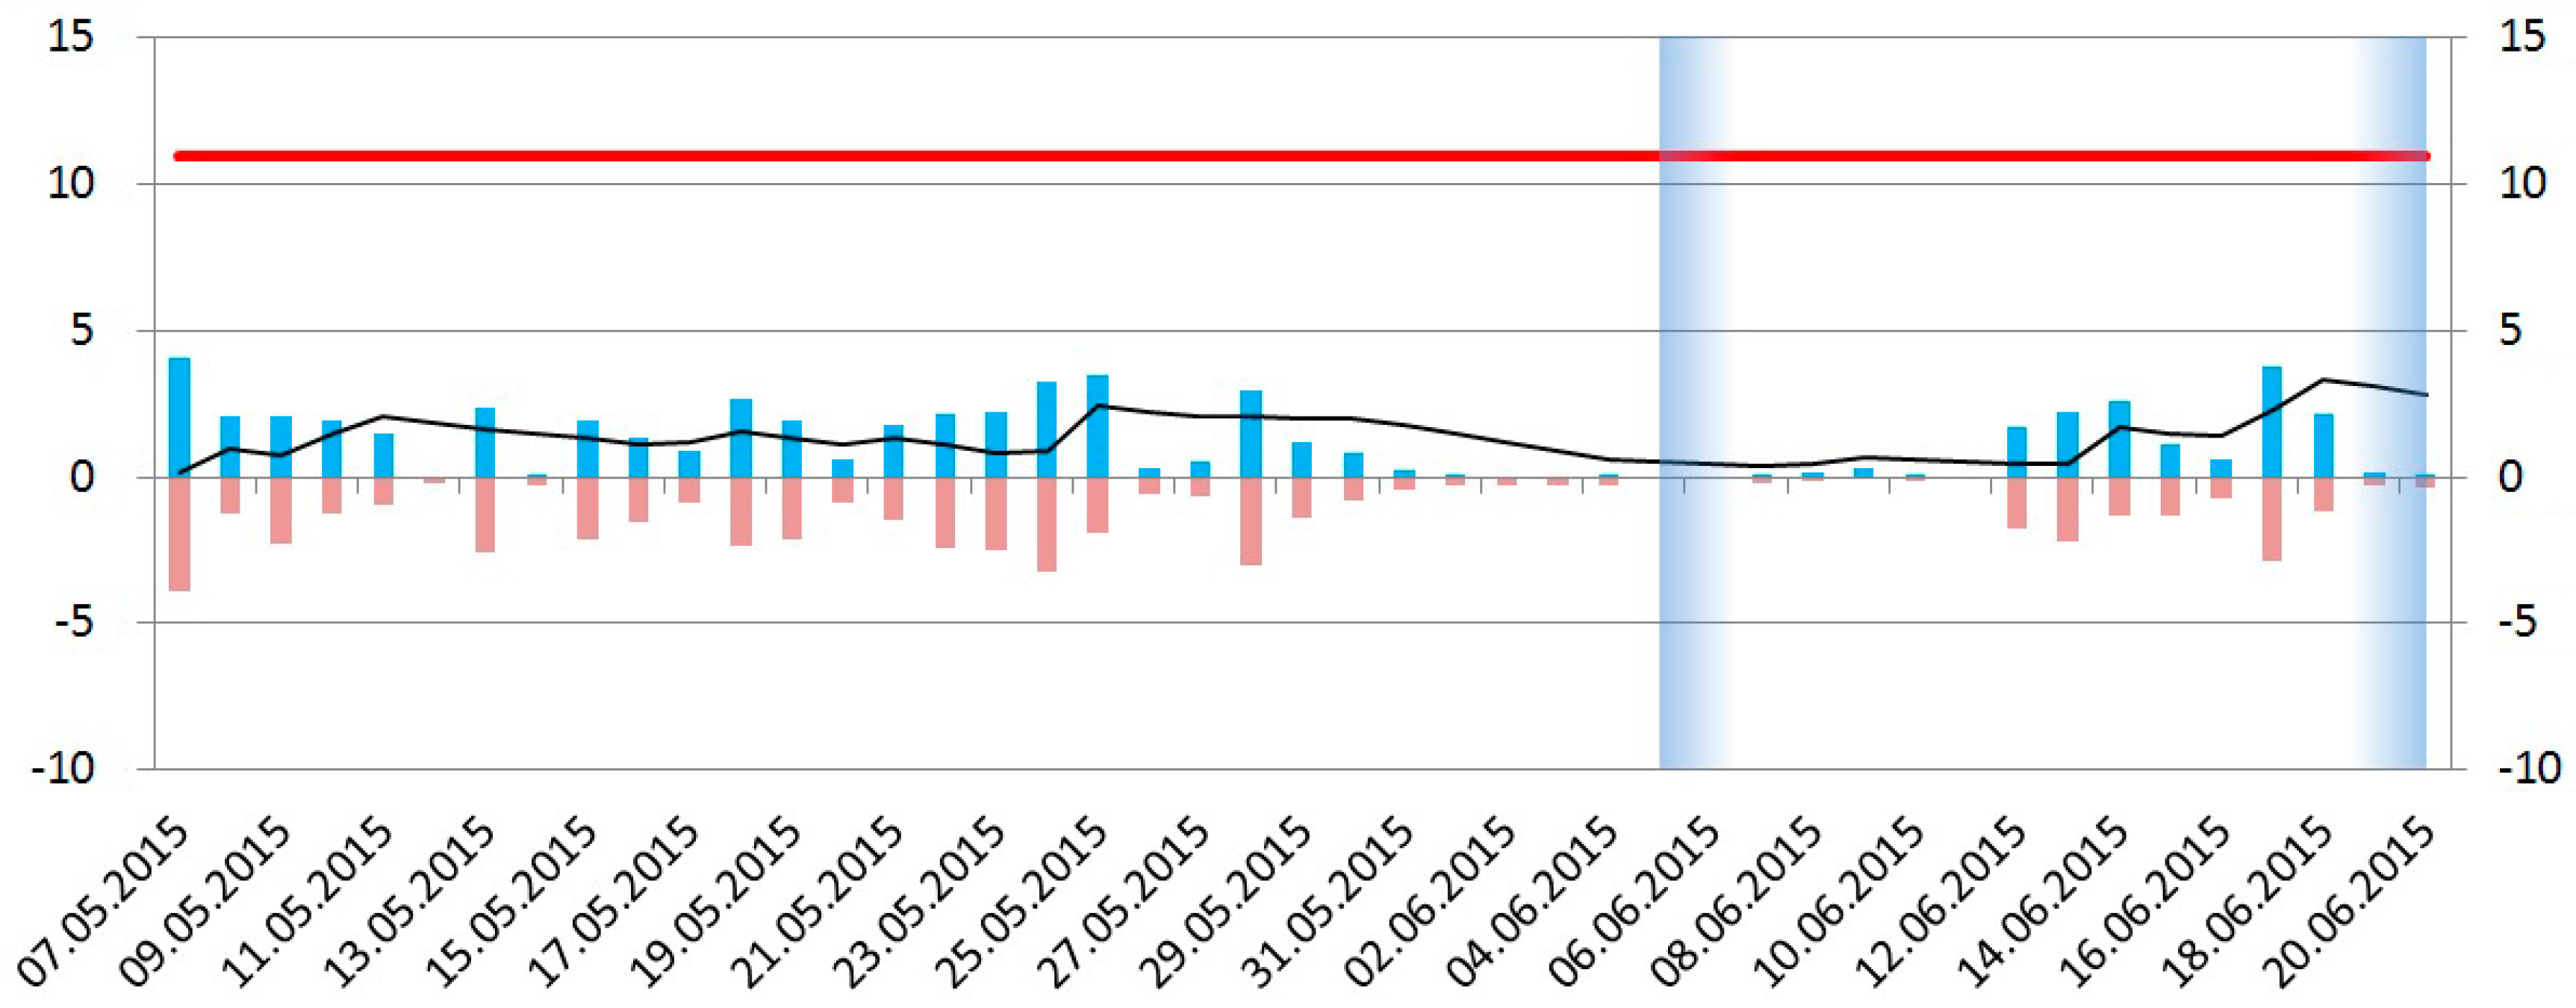
Figure 2 shows the result of applying the formula for calculating the accumulated water mass for the given parameters.

3.2. The Louisiana Flood Advanced Analysis

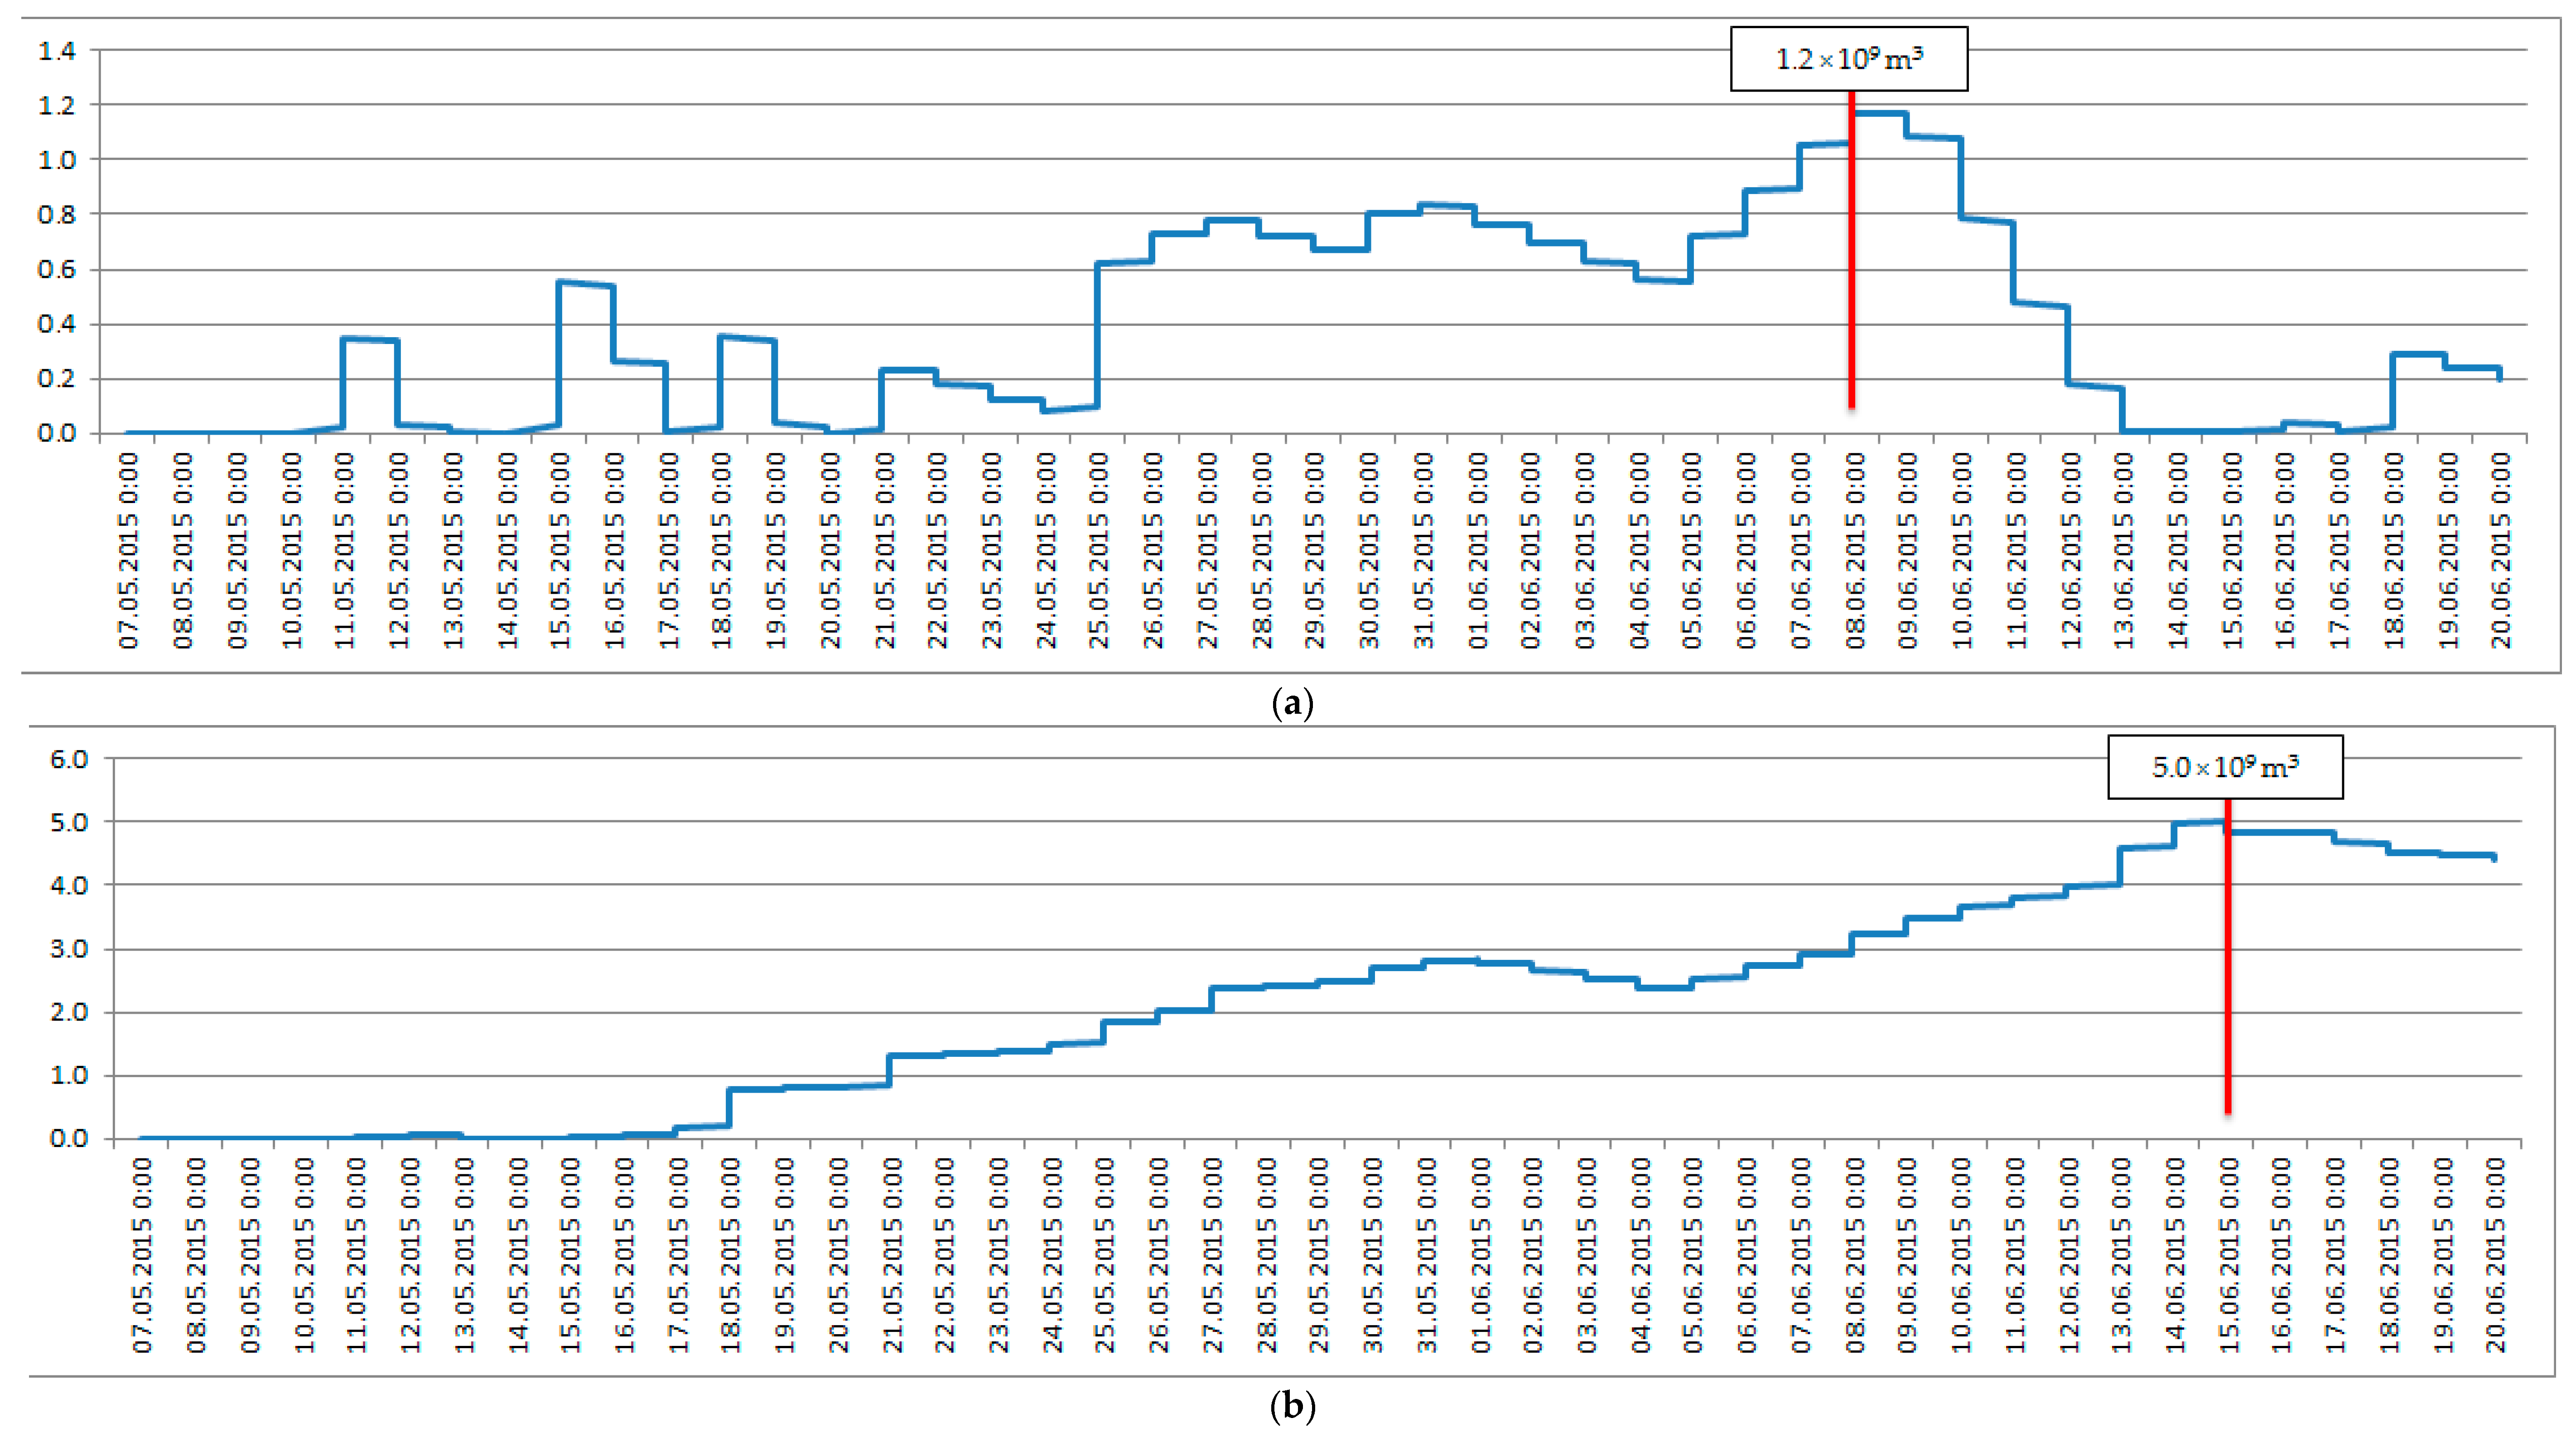
The advanced water balance estimation approach uses almost the same input data as the basic approach, but since we take into account region-to-region transfer of water mass, we do not need and do not have to estimate the volume of accumulated water mass in the entire basin. It is necessary to estimate the volume of accumulated water mass just in the regions of Shreveport and Alexandria, where the flooding took place. Figure 3 demonstrates the results for both regions.

3.3. The Assam Flood Analysis

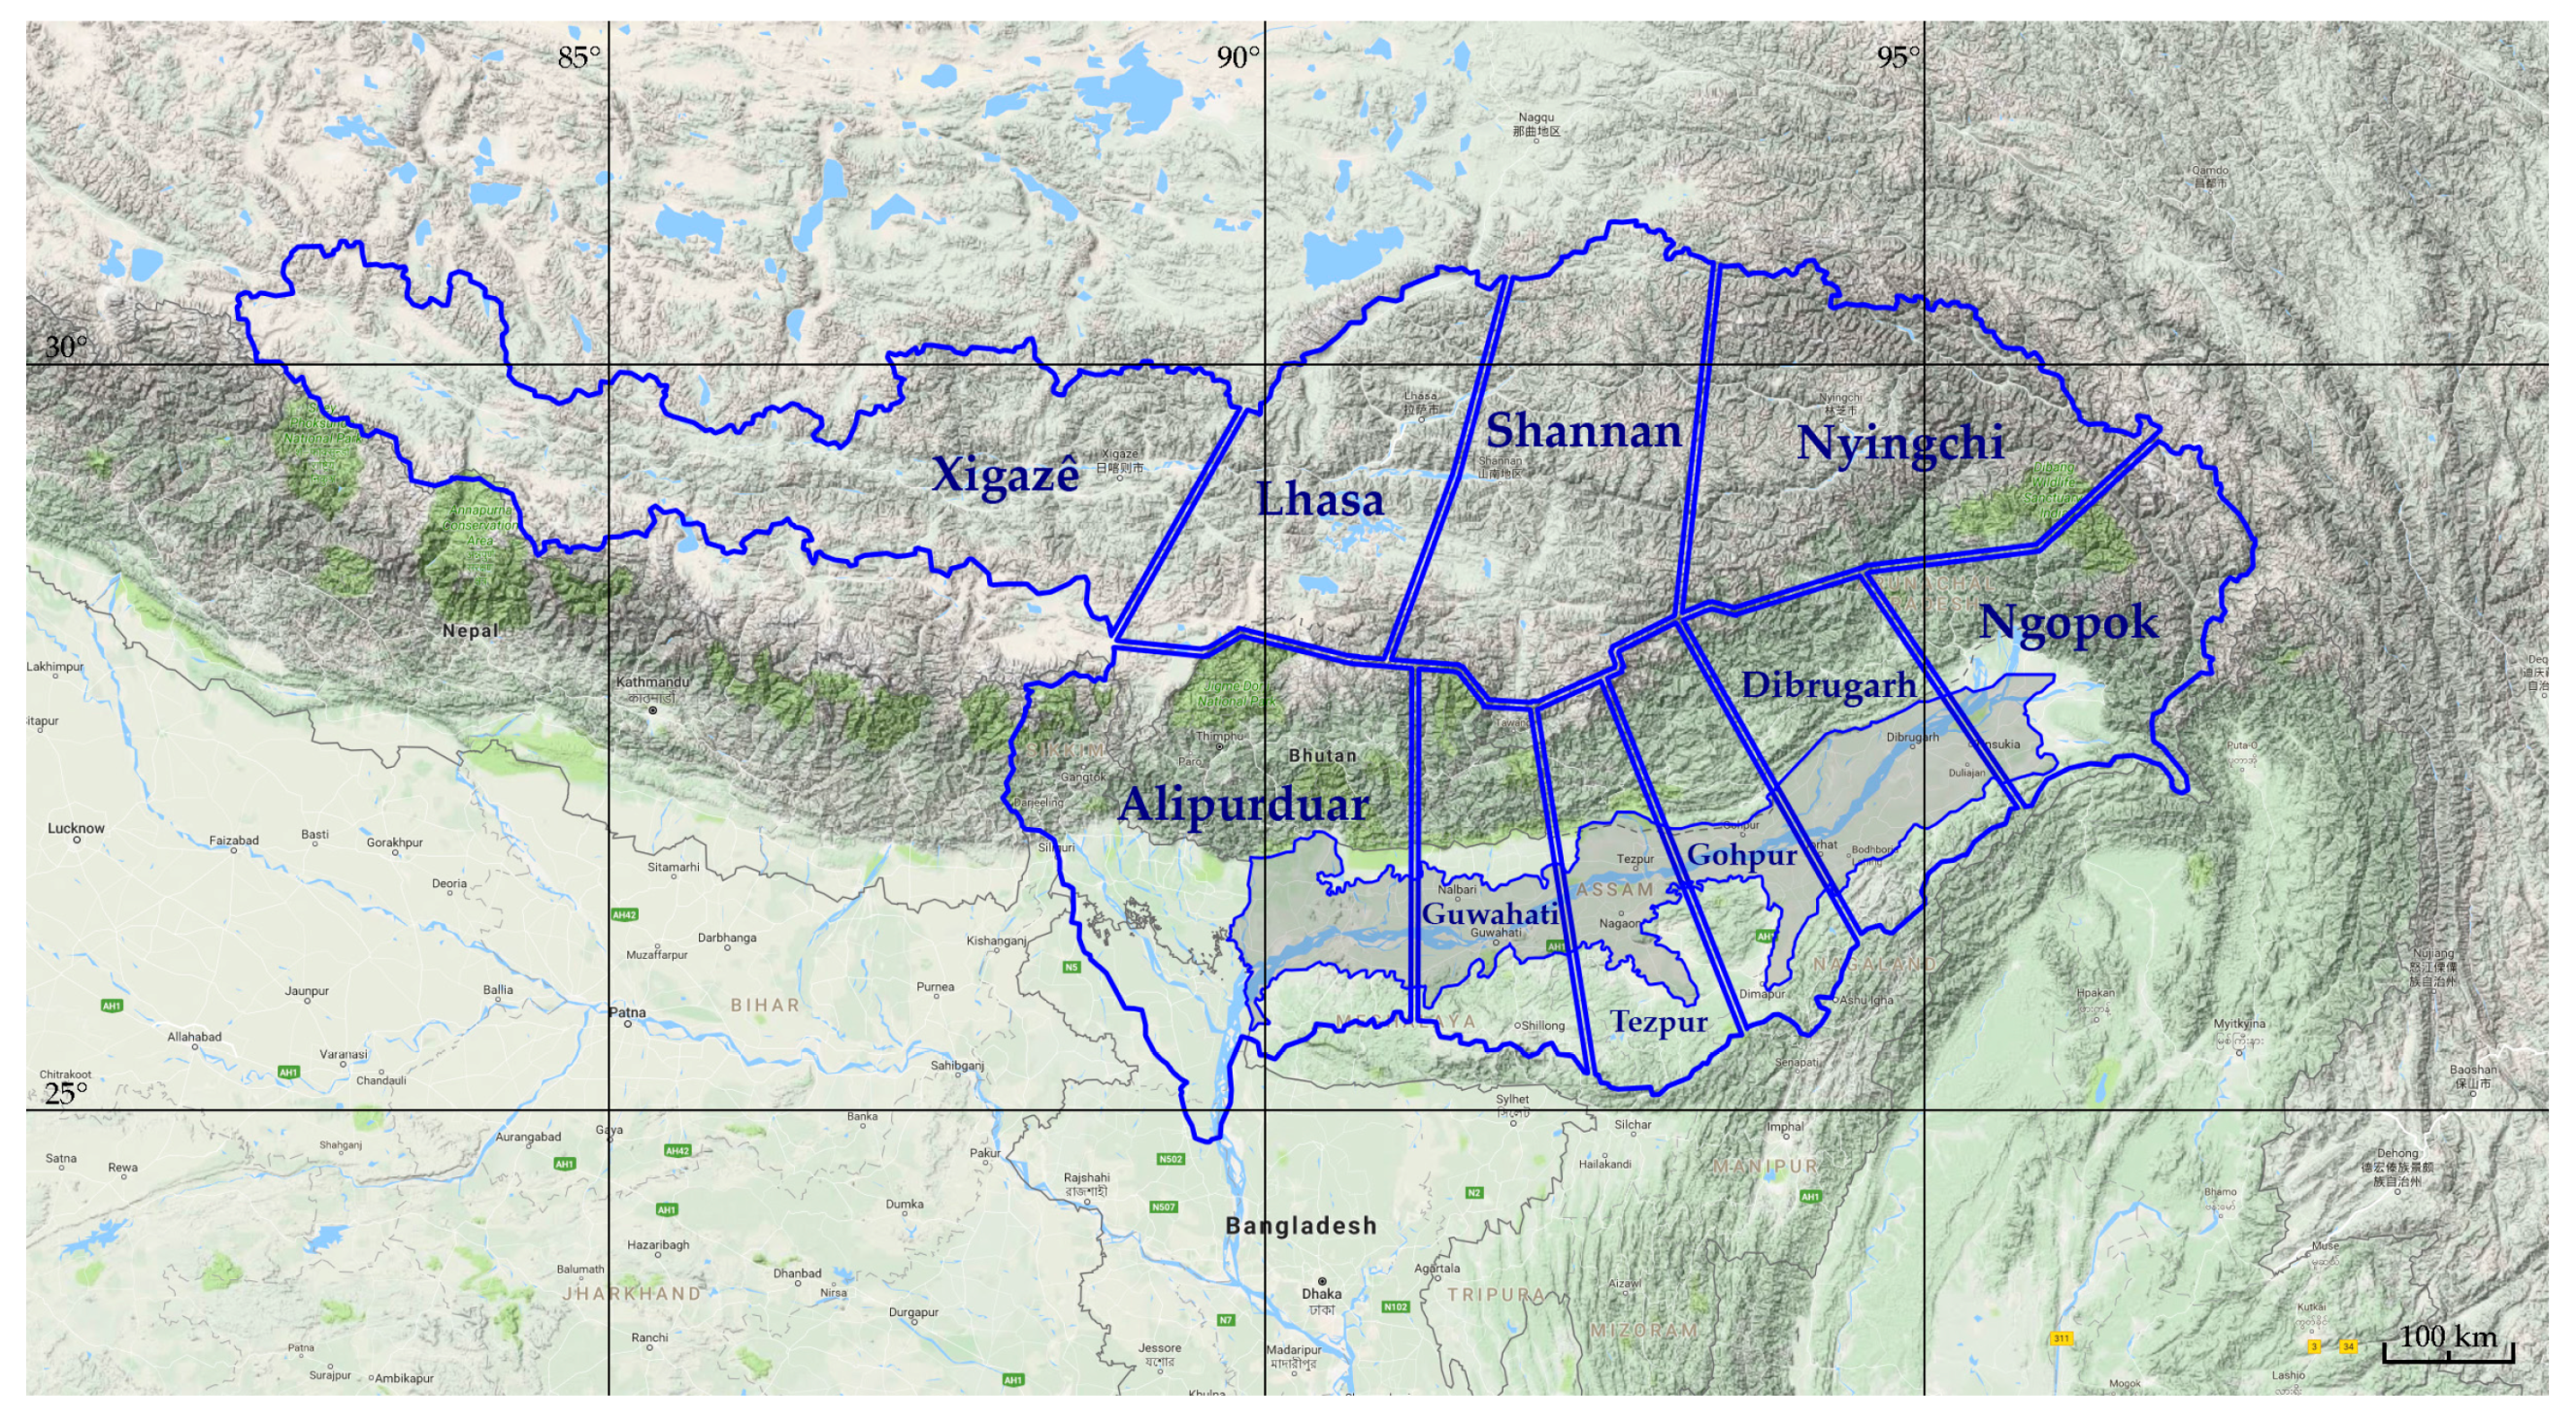
In the case of the Assam flood, the flood-generating river was the Brahmaputra River. The whole basin has been divided into 10 regions (see Figure 4).
In Table 4, some parameters of the distinguished regions are presented.
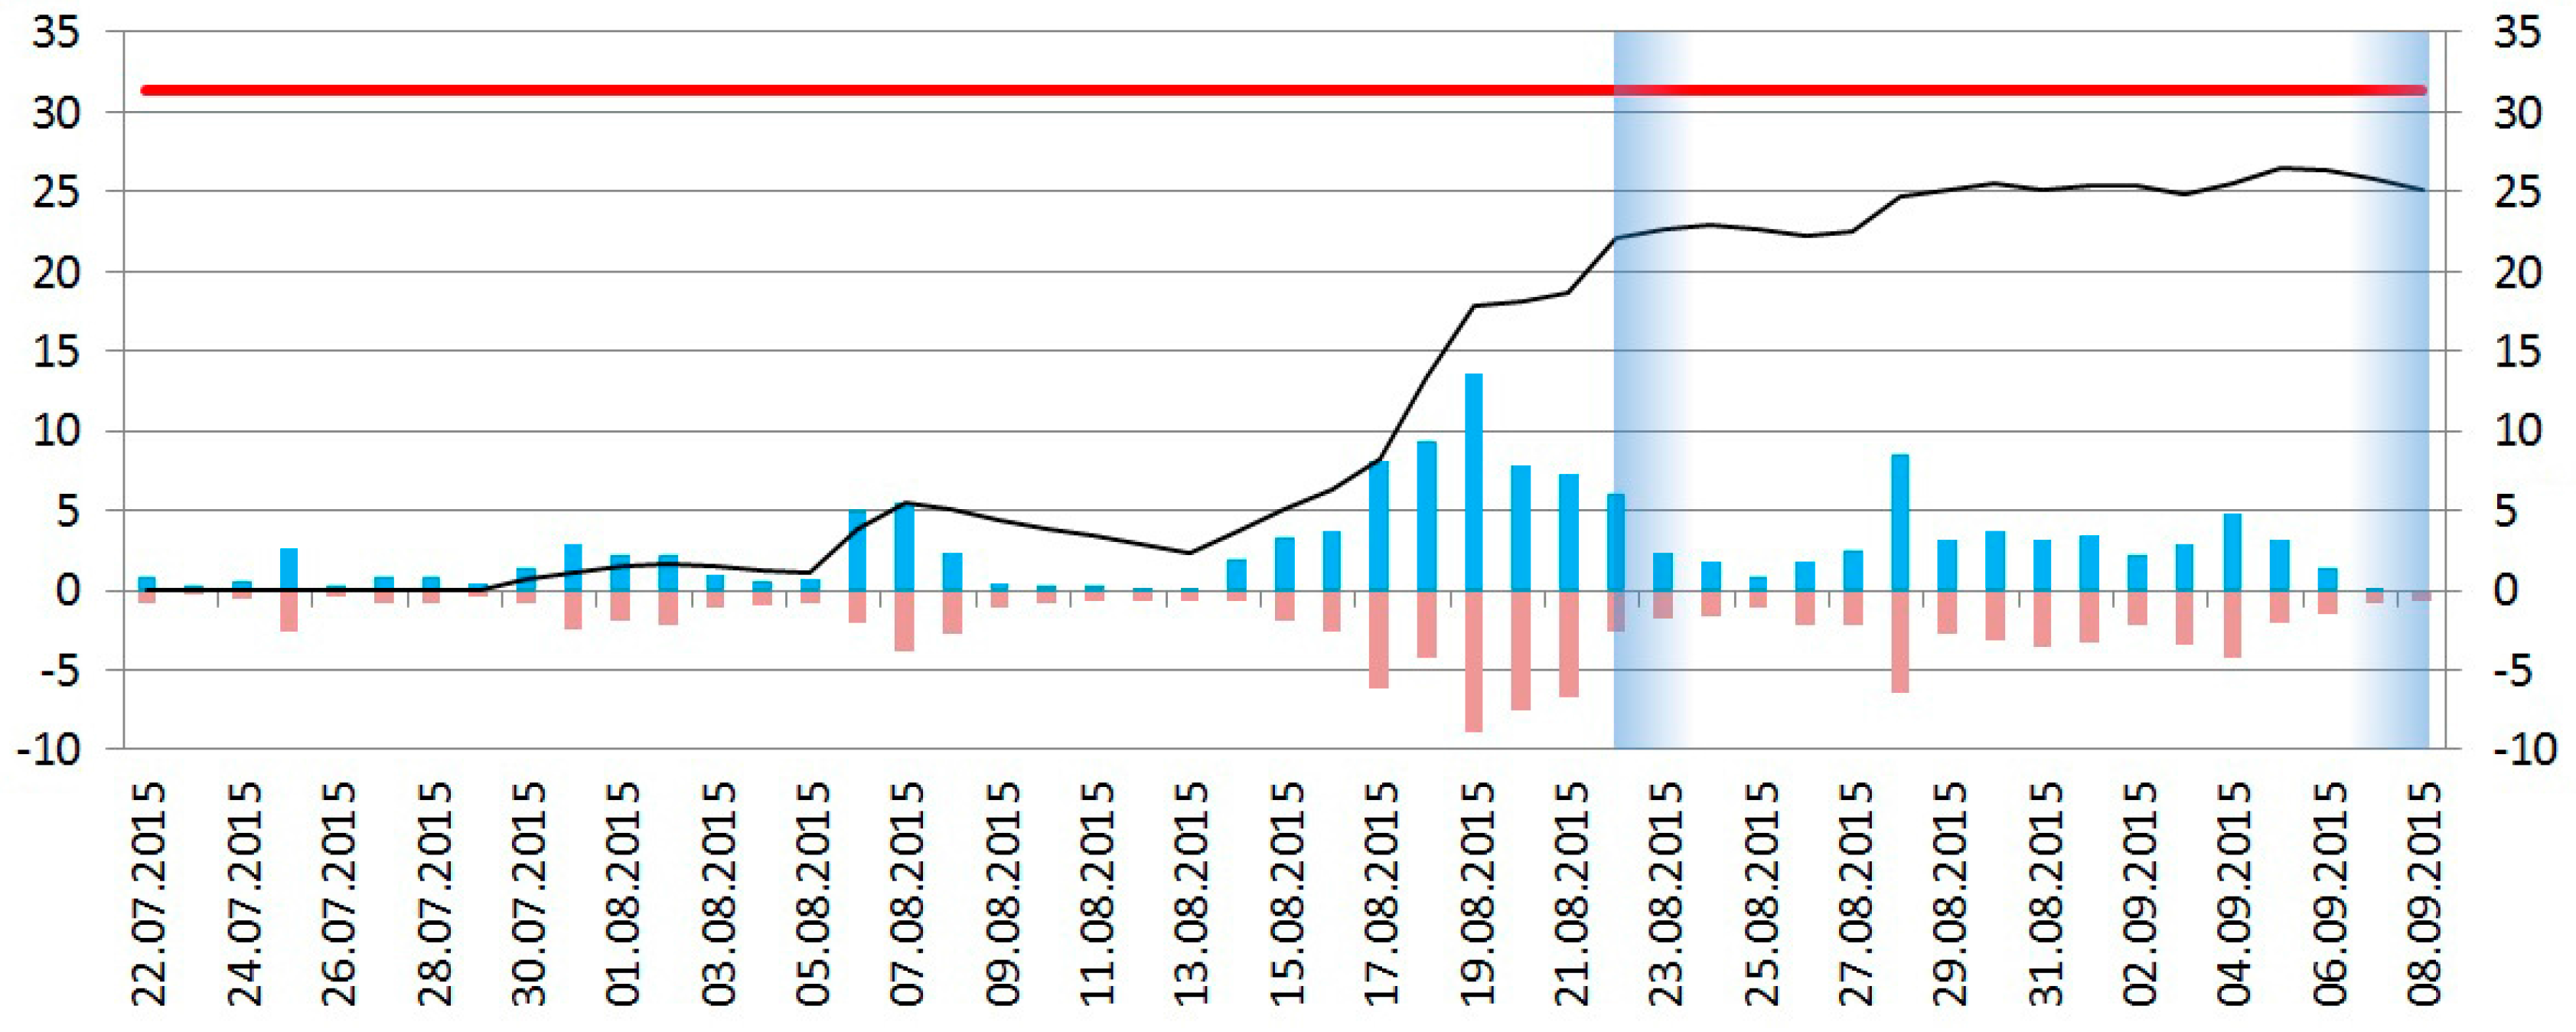
After combining all the input parameters and applying the formula for calculating the accumulated water mass, we obtained the following result (see Figure 5). The observed water mass was calculated as 80% of the Assam state area (78,438 km2) multiplied by the 0.5 m depth that has given the final result of 31.4 × 10⁹ m3.

4. Discussion

Despite the simplicity of the used model for water balance estimation, it makes us think about whether precipitation is really enough for floods’ (and especially disastrous floods) emergence and development. On the one hand, there are weaknesses in the presented model, the most significant among which is the static character of the model: dynamic changes of the parameters are almost neglected. The scales of temporal and spatial simplification are also too large. On the other hand, the soil permeability values were taken as the tabular minimums, for example.
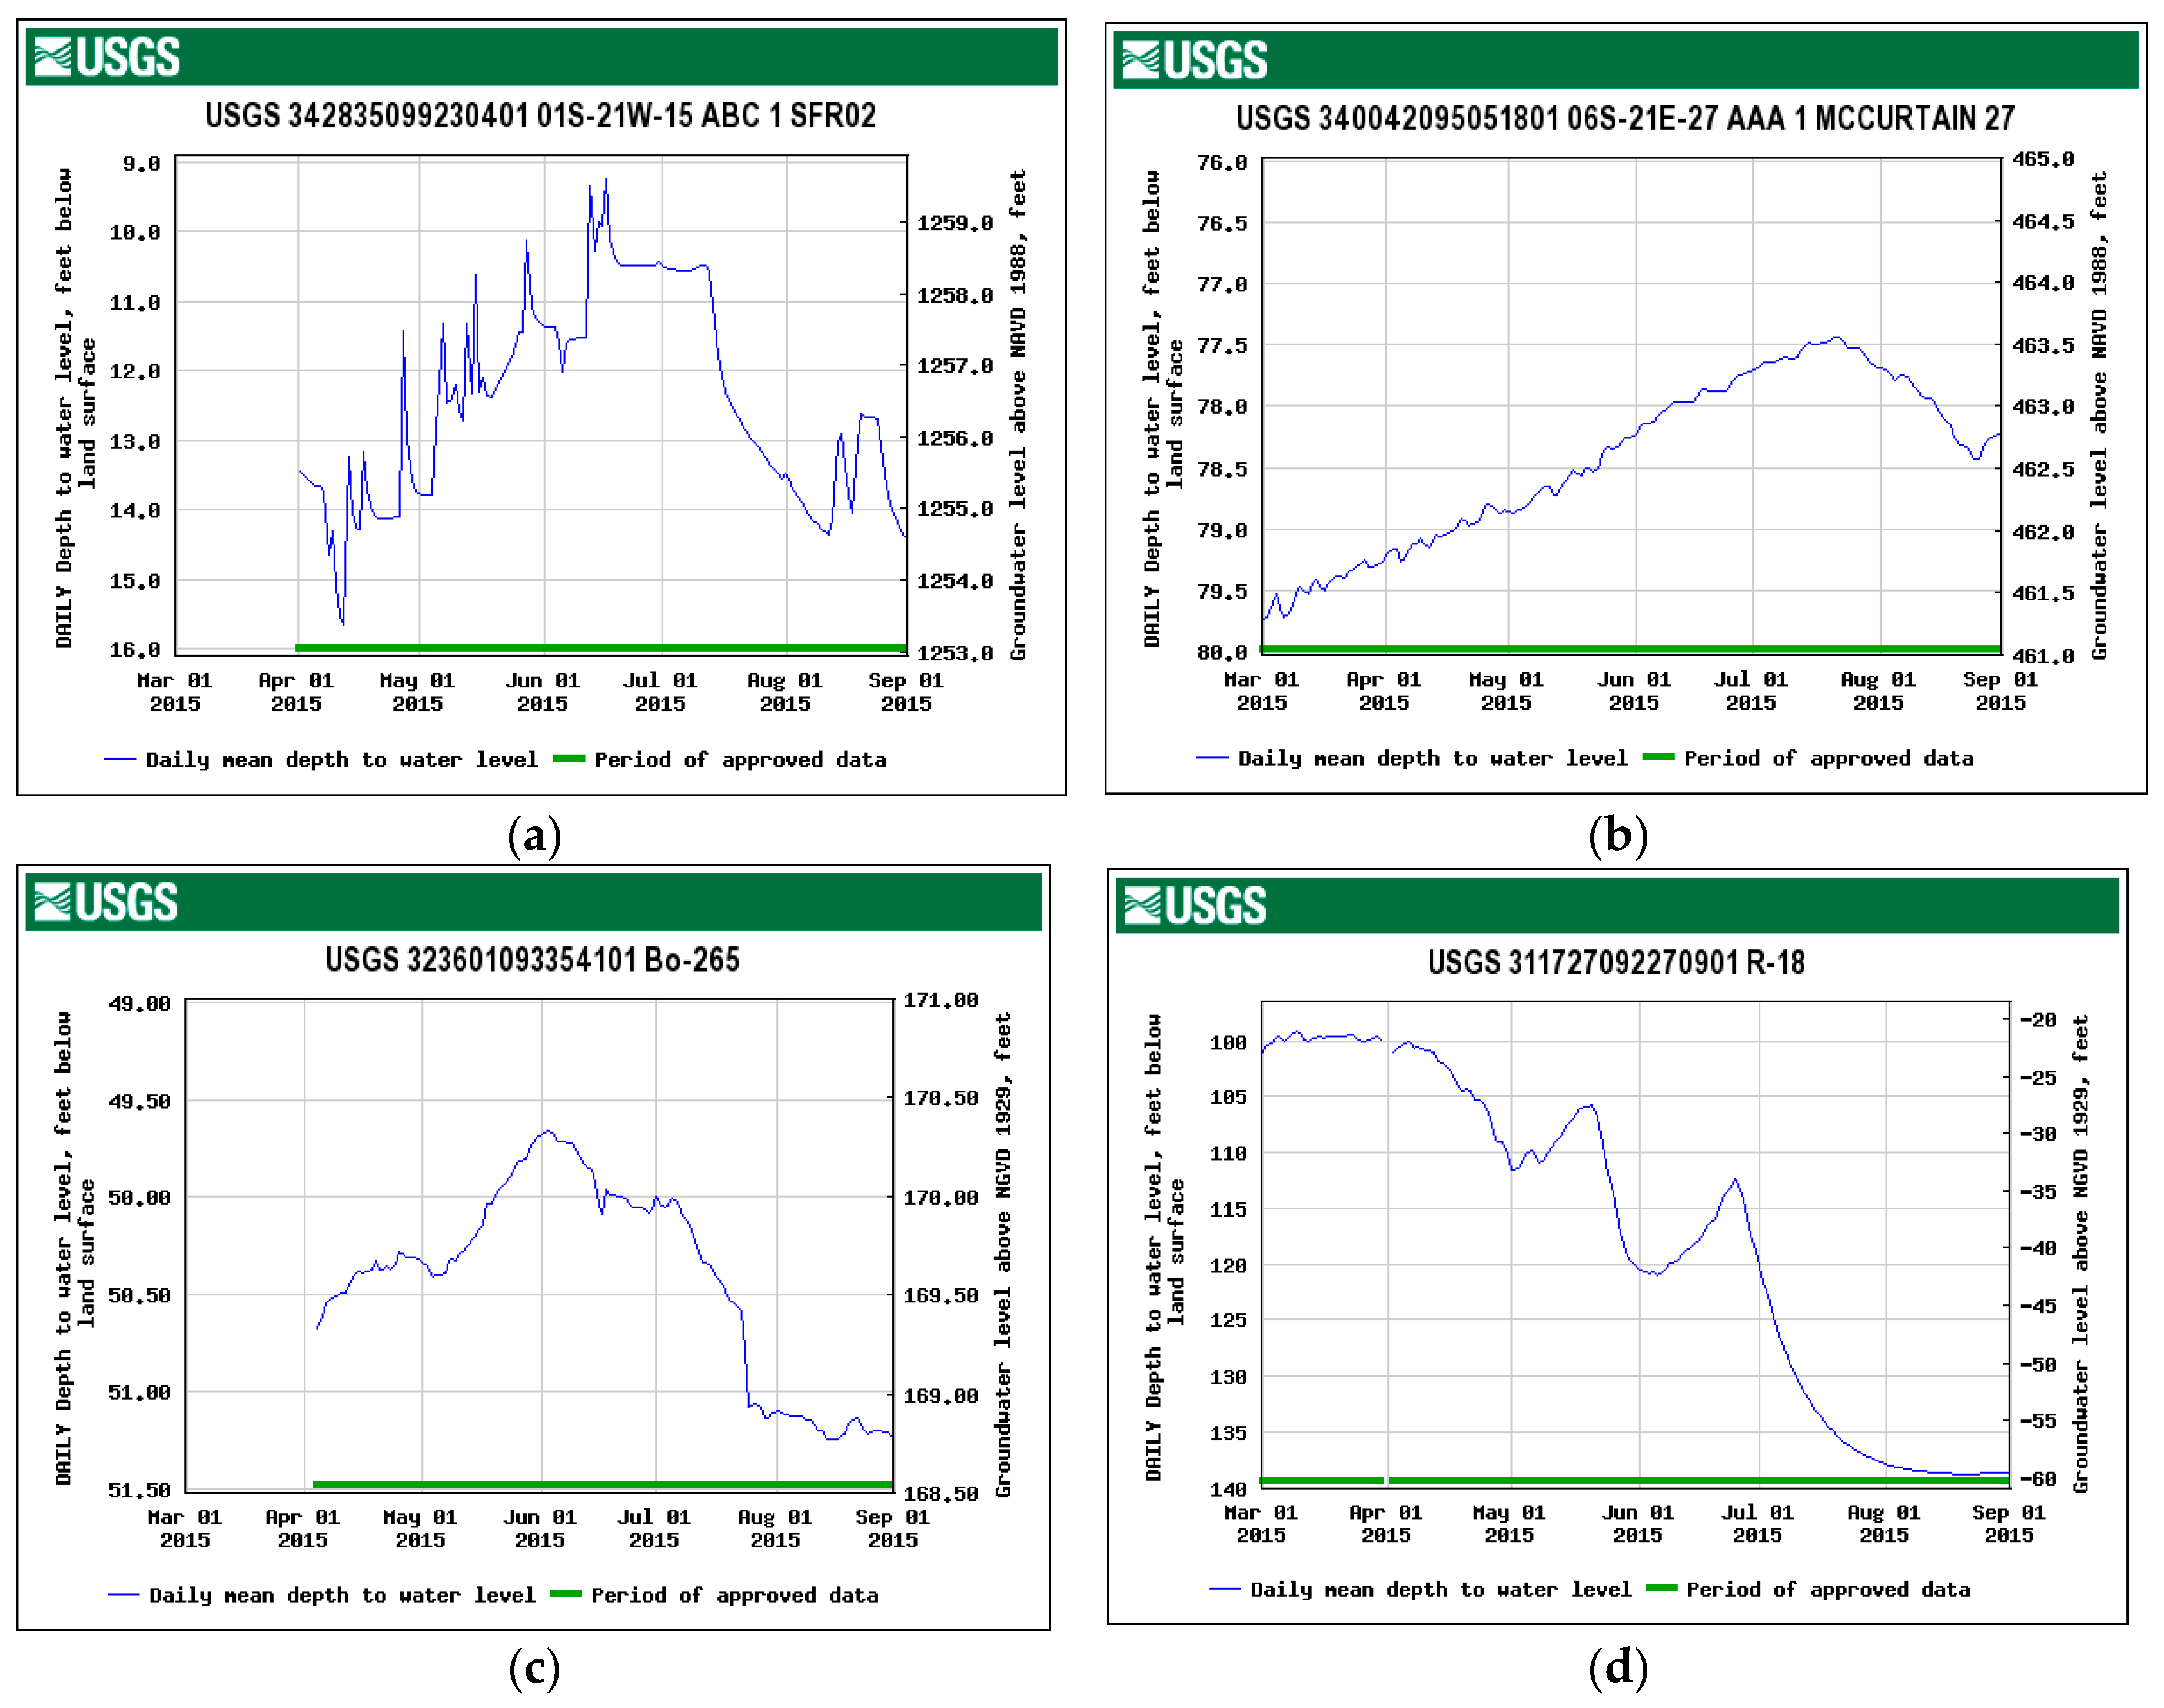
We now introduce the monitoring data of the artesian well level during the flood time at four points through the Red River with respect to the timing of groundwater recharge and discharge, and its impact on the flood event (see Figure 6). The data is provided by the United States Geological Survey’s (USGS) National Water Information System [27].
The coupling of groundwater and the flood event is very evident from Figure 1. In fact, we can see correlation between the level of water in artesian wells and flood development in Shreveport over the days: maximal water levels both in Red River on 9 June 2015 and in the well practically coincide. A principal fact is that the well water level has been increasing gradually for some months. In the same time period, the well water level near Alexandria (being lower on the Red River bed in comparison with Shreveport) has decreased.
The last non-obvious correlation fact (“the anticorrelation effect“) may be explained by the pressure aspect: backwater due to the rise of the surface water mass in a stream channel near Alexandria City was accompanied by the decrease of the ground horizon level in a lower sector of the channel.
Then, for all of the cases, the artesian well level has decreased and goes to the equilibrium state when the flood event has finished and the process of triggered/provoked and/or spontaneous release of water has stopped.
Returning to the imbalance of calculated and observed water masses, it is important to underline that it is quite large in both considered floods. In the case of the Assam flood, the difference is about 5 × 10⁹ m3, and in the case of the Louisiana flood, the difference is about 7 × 10⁹ m3. Even more impressive are the relative differences: ≈15% in the case of the Assam flood and ≈60% in the case of the Louisiana flood. So while we predict the potential area of flooding relying solely on the precipitation intensity, there is a high risk of underestimation of the possible outcome. In addition, because there is no other water source except groundwater, we have to more carefully estimate the role of groundwater in flood development.
Also note that the prevailing soil type in the most affected regions of Louisiana state is gleysols. This soil type is characterized by a close interconnection with groundwater [28] which means that groundwater aquifers are very close to the surface in those regions. We suggest it can really be of importance and this fact is not worth underestimating since we see such a great relative difference between the calculation and observation.

5. Conclusions

The given analysis of water balance on the examples of two disastrous floods in 2015 does not pretend to be exhaustive. The only aim was to show the possible discrepancy between potentially accumulated and observed water masses. The idea is not to downplay the role of precipitation in flood emergence and development, but to consider the whole system of the river basin in the close interconnection of its parts where the groundwater is as important an aspect as the precipitation, especially when we consider disastrous floods.

Acknowledgments

This study was performed by the Russian Foundation for Basic Research (16-41-330032). The scientific publication is prepared within the frameworks of the state task of VlSU No. 16-05-00697_a to perform state works in the field of scientific activity.

Author Contributions

Tatiana Trifonova—problem statement and approach developing; Dmitriy Trifonov—processing databases and performing calculations; Sergey Arakelian—general ideas, interpretation and modeling.

Conflicts of Interest

The authors declare no conflict of interest.

References

  1. Pinneker, E.V.; Howard, D.E.; Harvey, J.C. General Hydrogeology; Cambridge University Press: Cambridge, UK, 2010. [Google Scholar]
  2. Trifonova, T.A.; Tulenev, N.Y.; Trifonov, D.V.; Arakelian, S.M. Surface water, groundwater and unified 3D-crack network as a triple coupling dynamic system for a river watershed functioning—Manifestation in catastrophic floods. In Proceedings of the EGU General Assembly, Vienna, Austria, 27 April–2 May 2014.
  3. Fleckenstein, J.H.; Krause, S.; Hannah, D.M.; Boano, F. Groundwater-surface water interactions: New methods and models to improve understanding of processes and dynamics. Adv. Water Resour. 2010, 33, 1291–1295. [Google Scholar] [CrossRef]
  4. Trifonova, T.A.; Trifonov, D.V.; Arakelian, S.M. Catastrophic Floods—Possible Contribution of Groundwater due to Flash Reconstruction of the Rock Mass 3D-Cracknet under Seismic Factors. Mod. Appl. Sci. 2015, 9, 76–86. [Google Scholar] [CrossRef]
  5. Roeloffs, E.A.; Quilty, E.; Scholtz, C.H. Water level and strain changes preceding and following the August 4, 1985 Kettleman Hills, California, earthquake. Pure Appl. Geophys. 1997, 149, 21–60. [Google Scholar] [CrossRef]
  6. BGR—Whymap. Available online: http://www.whymap.org/whymap/EN/Home/whymap_node.html (accessed on 7 July 2016).
  7. Smyth, J.R.; Jacobsen, S.D. Nominally anhydrous minerals and Earth’s deep water cycle. Earth Deep Water Cycle Geophys. Monogr. Ser. 2006, 168. [Google Scholar] [CrossRef]
  8. Bouwer, H.; Maddock, T. Making sense of the interaction between groundwater and streamflow: Lessons for water masters and adjudicators. Rivers 1997, 6, 19–31. [Google Scholar]
  9. Carabin, G.; Dassargues, A. Modeling groundwater with ocean and river interaction. Water Resour. Res. 1999, 35, 2347–2358. [Google Scholar] [CrossRef]
  10. Kurth, A.-M.; Weber, C.; Schirmer, M. How effective is river restoration in re-establishing groundwater—surface water interactions?—A case study. Hydrol. Earth Syst. Sci. 2015, 19, 2663–2672. [Google Scholar] [CrossRef]
  11. King, A.C.; Raiber, M.; Cendón, D.I.; Cox, M.E.; Hollins, S.E. Identifying flood recharge and inter-aquifer connectivity using multiple isotopes in subtropical Australia. Hydrol. Earth Syst. Sci. 2015, 19, 2315–2335. [Google Scholar] [CrossRef]
  12. Holden, J. An Introduction to Physical Geography and the Environment; Pearson Education: New York, NY, USA, 2005. [Google Scholar]
  13. Ward, R.C.; Ward, R.C.; Robinson, M. Principles of Hydrology; McGraw-Hill: New York, NY, USA, 2000. [Google Scholar]
  14. Trifonova, T.A.; Arakelian, S.M. The interconnectedness of surface and groundwater in a single system of river catchment; manifestation of catastrophic events in the conditions of intense rainfall in mountainous areas with sharply dissected mountainous terrain (on mudflow model example). Successes Mod. Sci. 2013, 1, 53–67. [Google Scholar]
  15. 80 Per Cent of Assam Hit by Flood: ASDMA—Timesofindia-Economictimes. Available online: http://articles.economictimes.indiatimes.com/2015-09-07/news/66297150_1_jia-bharali-goalpara-sonitpur (accessed on 7 July 2016).
  16. Local Weather from AccuWeather—Superior Accuracy. Available online: http://www.accuweather.com (accessed on 7 July 2016).
  17. Climate Prediction Center—United States Evaporation Monitoring. Available online: http://www.cpc.ncep.noaa.gov/products/Soilmst_Monitoring/US/US_Evaporation-Monthly.php (accessed on 10 October 2016).
  18. Evaporation in Average Year—Maps—Evaporation—Evaporation. Available online: http://www.waterandclimatechange.eu/evaporation/average-monthly-1985-1999 (accessed on 7 July 2016).
  19. Evaporation. Available online: http://nihroorkee.gov.in/rbis/india_information/evaporation.htm (accessed on 7 July 2016).
  20. FAO/UNESCO Soil Map of the World|FAO|Food and Agriculture Organization of the United Nations. Available online: http://www.fao.org/soils-portal/soil-survey/soil-maps-and-databases/faounesco-soil-map-of-the-world/en/ (accessed on 7 July 2016).
  21. Kruseman, G.P.; de Ridder, N.A. Analysis and Evaluation of Pumping Test Data, 2nd ed.; International Institute for Land Reclamation and Improvement: Wageningen, The Netherlands, 1994; p. 21. [Google Scholar]
  22. Google Maps. Available online: https://www.google.com/maps (accessed on 7 July 2016).
  23. Red River Floods in Louisiana—River at Highest Levels for 70 Years—FloodList. Available online: http://floodlist.com/america/red-river-floods-louisiana-june-2015 (accessed on 7 July 2016).
  24. Louisiana Topographic Maps by Topo Zone. Available online: http://www.topozone.com/louisiana/ (accessed on 7 July 2016).
  25. Wu, H.; Adler, R.F.; Tian, Y.; Huffman, G.J.; Li, H.; Wang, J. Real-time global flood estimation using satellite-based precipitation and a coupled land surface and routing model. Water Resour. Res. 2014, 50, 2693–2717. [Google Scholar] [CrossRef]
  26. Global Flood Monitoring. Available online: http://flood.umd.edu/ (accessed on 10 October 2016).
  27. USGS Groundwater Daily Data for the Nation. Available online: http://nwis.waterdata.usgs.gov/nwis/dv/?referred_module=gw (accessed on 10 October 2016).
  28. Alexandru, R.-G.; Vlad, D.; Paisa, M.M. The influence of the pedological factor on the relief dynamics within Săsăuș river catchment. Cinq Cont. 2012, 2, 115–125. [Google Scholar]
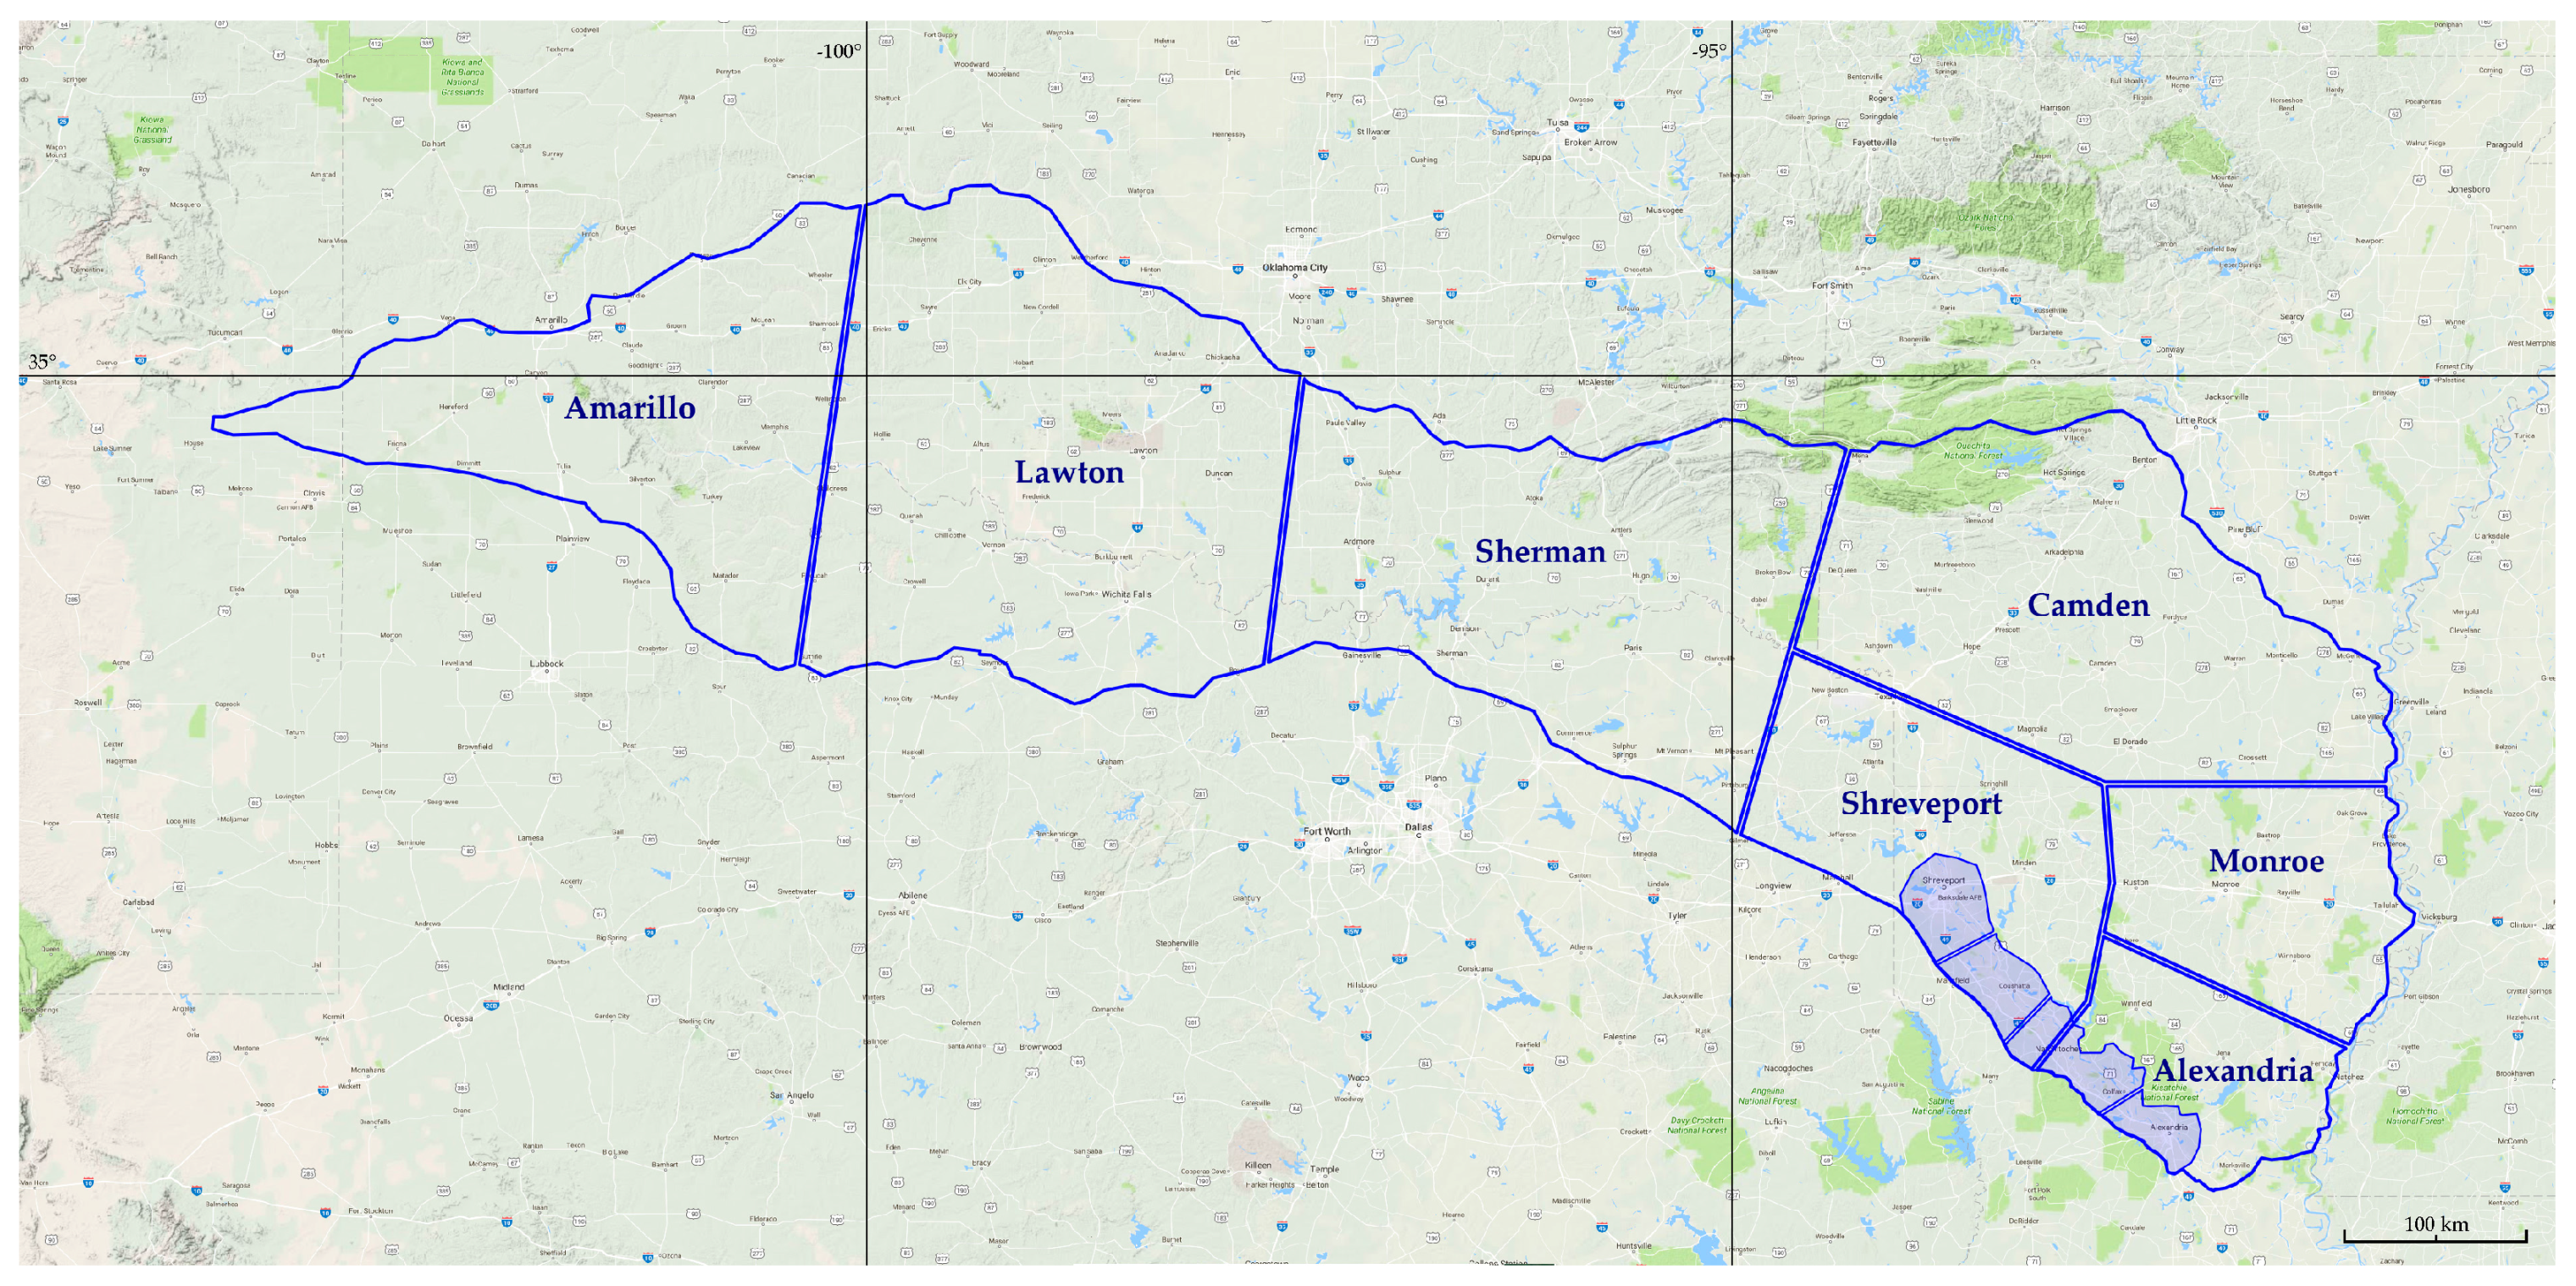
Figure 1. The distinguished regions of the Red River basin.
Hydrology 03 00041 g001
Figure 2. Water balance of the Louisiana flood: light blue bars represent precipitation values, pink bars—combined evaporation and permeation values, thin black line—accumulated water mass, thick red line—fixed maximum of observed water mass.
Hydrology 03 00041 g002
Figure 3. Accumulated water mass in the regions of: (a) Shreveport; (b) Alexandria.
Hydrology 03 00041 g003
Figure 4. The distinguished regions of the Brahmaputra river basin.
Hydrology 03 00041 g004
Figure 5. Water balance of the Assam flood: light blue bars represent precipitation values, pink bars—combined evaporation and permeation values, thin black line—accumulated water mass, thick red line—fixed maximum of observed water mass.
Hydrology 03 00041 g005
Figure 6. The artesian well levels in: (a) Jackson County, Oklahoma, USA—riverhead of the Red River; (b) McCurtain County, Oklahoma, USA—middle course of the Red River; (c) Shreveport, Louisiana, USA—upper flooded area; (d) Alexandria, Louisiana, USA—lower flooded area.
Hydrology 03 00041 g006
Table 1. Sources and simplification parameters of data.
ArgumentTemporal SimplificationSpatial SimplificationSource
precipitation intensity, Pinexact daily dataprecipitation intensity in any relatively large city near the center of a region is extrapolated to a whole regionAccuWeather service [16]
evaporation rate, einmonthly average dataUSA states: average evaporation rate of every region is used; China regions: all the regions are considered having the same evaporation rate, characteristic for the riverhead of the Brahmaputra river; India regions: all the regions are considered having the same evaporation rate, mentioned as the evaporation rate of northeast IndiaUSA states: National Oceanic and Atmospheric Administration’s (NOAA) National Weather Service [17]; China regions: Integrated Project Water and Global Change (EU WATCH project) [18]; India regions: National Institute of Hydrology, Roorkee, India [19]
soil permeability, pnno temporal dependencedifferent soil types of the region surface are distinguished; resulting soil permeability of a region is calculated as weighted averagesoil types: Food and Agriculture Organization of the United Nations (FAO)/UNESCO Soil Map of the World [20]; soil permeability: tabular values [21]
the area of region, Snno temporal dependence-Google Maps service [22]
Table 2. The parameters of the Red River basin regions.
Region NameArea, 103 km2Evaporation Rate, mm/DayPrevailing SoilsEstimated Soil Permeability, mm/Day
Amarillo24.4May: 6.7; June: 8.0kastanozems, luvisols800.2
Lawton34.4May: 8.2; June: 10.5kastanozems, luvisols, cambisols900.1
Sherman33.3May: 5.9; June: 8.7acrisols, cambisols, phaeozems, luvisols, kastanozems1450.1
Camden35.5May: 5.0; June: 5.7acrisols, gleysols0.1
Shreveport16.8May: 5.6; June: 6.3acrisols, phaeozems, planosols, gleysols3000.1
Monroe13.1May: 5.6; June: 6.3acrisols, gleysols, luvisols0.7
Alexandria12.5May: 4.8; June: 5.2acrisols, gleysols, phaeozems, luvisols500.2
Table 3. The Louisiana flood observed water mass calculation.
Affected CityFlood Stage, mRed River Level on 11.06.2015, mEstimated Observed Water Mass, 109 m3
Shreveport9.111.22.9
Coushatta9.411.83.3
Grand Ecore10.112.63.6
Alexandria9.810.61.2
Table 4. The parameters of the Brahmaputra river basin regions.
Region NameArea, 103 km2Evaporation Rate, mm/DayPrevailing SoilsEstimated Soil Permeability, mm/Day
Xigazê122.9July: 1.0; August: 1.0; September: 1.4lithosols1.0
Lhasa56.5July: 1.0; August: 1.0; September: 1.4lithosols1.0
Shannan58.0July: 1.0; August: 1.0; September: 1.4lithosols1.0
Nyingchi58.7July: 1.0; August: 1.0; September: 1.4lithosols1.0
Ngopok50.4July 3.9; August: 3.2; September: 1.7acrisols, cambisols100.0
Dibrugarh46.8July: 3.9; August: 3.2; September: 1.7acrisols, cambisols200.0
Gohpur36.6July: 3.9; August: 3.2; September: 1.7acrisols, cambisols200.0
Tezpur34.7July: 3.9; August: 3.2; September: 1.7acrisols, nitosols, cambisols, regosols100.4
Guwahati43.4July: 3.9; August: 3.2; September: 1.7acrisols, regosols, nitosols, cambisols50.2
Alipurduar143.3July: 3.9; August: 3.2; September: 1.7acrisols, cambisols, gleysols, regosols300.3