1. Introduction
Due to widespread silty soils of the European loess belt, the Saxon loess province, eastern Germany, is very prone to soil erosion, mainly caused by water erosion. Especially heavy rainfall events endanger the fragile and fertile landscape, which is characterized by intense land use, during cultivation periods of bare soil surfaces. As shown worldwide [
1,
2], these loess soils have a very low resistance to erosion by water and wind and sustain the greatest soil erosion losses on a global basis.
Soil erosion in agricultural landscapes occurs primarily due to interrill and rill erosion [
3,
4,
5]. Rainfall simulations are an important research tool in soil erosion research for studies on soil detachment and infiltration. Throughout the world and on a wide range of landscapes in Europe as well, small-scale portable rainfall simulators with plot dimensions <5 m² are more and more prominently used in current soil erosion research [
6,
7,
8]. As an investigation of 229 different rainfall simulators shows [
9], most simulators are smaller than 1.5 m². For that reason, experiments are focused on splash or initial interrill erosion [
10,
11,
12,
13,
14]. Interrill erosion by sheet flow is barely recognizable, but may contribute to soil loss of several tons per year. A surface denudation of 1 mm corresponds to 13–15 t/ha depending on the bulk density. Direct measurements of surface denudation demand high accuracy. Higher detachment rates on plot scale can be achieved by large- scale rainfall simulators [
15,
16], which require more manpower and logistics than small-scale simulators. In this regard, Schindewolf and Schmidt [
17] developed a small-scale rainfall simulator with a runoff feeding device to ensure higher runoff and sediment detachment rates, which are able to produce interrill and rill erosion on a 3 × 1 m plot size.
By using rainfall simulations it is also possible to quickly acquire soil loss data of rare rainfall events under controllable field conditions. However, these soil loss data are obtained with a high temporal and financial effort [
18].
Generally, rainfall simulators solely allow the measurement of the sediment reaching the plot outlet, which is then averaged for the entire plot area. Thus, changes within the plot cannot be assessed. SfM photogrammetry can overcome this issue. The low-cost and high-resolution topography data generating method is relatively new in soil erosion research to analyze and monitor soil erosion [
19,
20]. Terrestrial laser scanning also generates high-resolution topographic data, but still is less suitable for field applications and only limited to close ranges due to unfavorable scanning geometry [
21]. SfM photogrammetry is presenting new opportunities for the detection and measurements of high-resolution topographic changes due to its ease in data acquisition and processing [
19,
22,
23].
Recently published research papers of SfM photogrammetry and soil erosion concentrate on extreme features such as gullies [
20,
24,
25,
26,
27,
28,
29] with major topographic changes and badland erosion [
30]. Eltner et al. [
3] utilized SfM photogrammetry in combination with an unmanned aerial vehicle (UAV) to measure soil erosion with sub-cm accuracy at field scale and further developed a method for automatic rill extraction to quantify these processes by multi-temporal measurement of soil surface changes. Furthermore, a few studies exist, which deal with the 3D reconstruction of soil microtopography from close range [
31,
32,
33,
34]. The authors of [
35] were the first to analyze soil erosion by means of rainfall simulation and SfM photogrammetry on very small (0.25 m²) and round field plots in a Mediterranean vineyard. By comparing the soil loss measured by rainfall simulation and that derived from SfM photogrammetry, a good agreement between both values was obtained, but only as long as the sediment connectivity within the plot was considered.
This study aims to apply SfM photogrammetry on sheet erosion phenomena as produced by rainfall simulation on a small field plot (3 m2). The overall objective of the study is to validate SfM photogrammetry determined soil loss estimations with rainfall simulations in an agricultural landscape. Therefore, the soil loss is measured in high resolution (mm) by means of the two described methods, receiving a soil loss by sampling and a soil loss by DoD. Thus, three different approaches for DEM referencing (GCP approach No. 1, 2, 3) are used in this study in order to test which of the three DoD determined soil losses best agree with the measured soil loss by sampling. As the SfM approach reflects a total height loss during the erosion event, this study investigates influencing processes and factors of soil erosion in agricultural landscapes during rainfall in order to separate associated surface changes from the DoD determined soil loss. These include, on the one hand, the quantification of splash erosion beyond the plot (“out of the plot” splash) and, on the other, the calculation of surface changes due to soil compaction. By means of the determination of bulk density, being a measurement for the packing state of the soil, before and after the rainfall simulation changes in soil density and related surface changes will be calculated.
2. Materials and Methods
2.1. Research Area
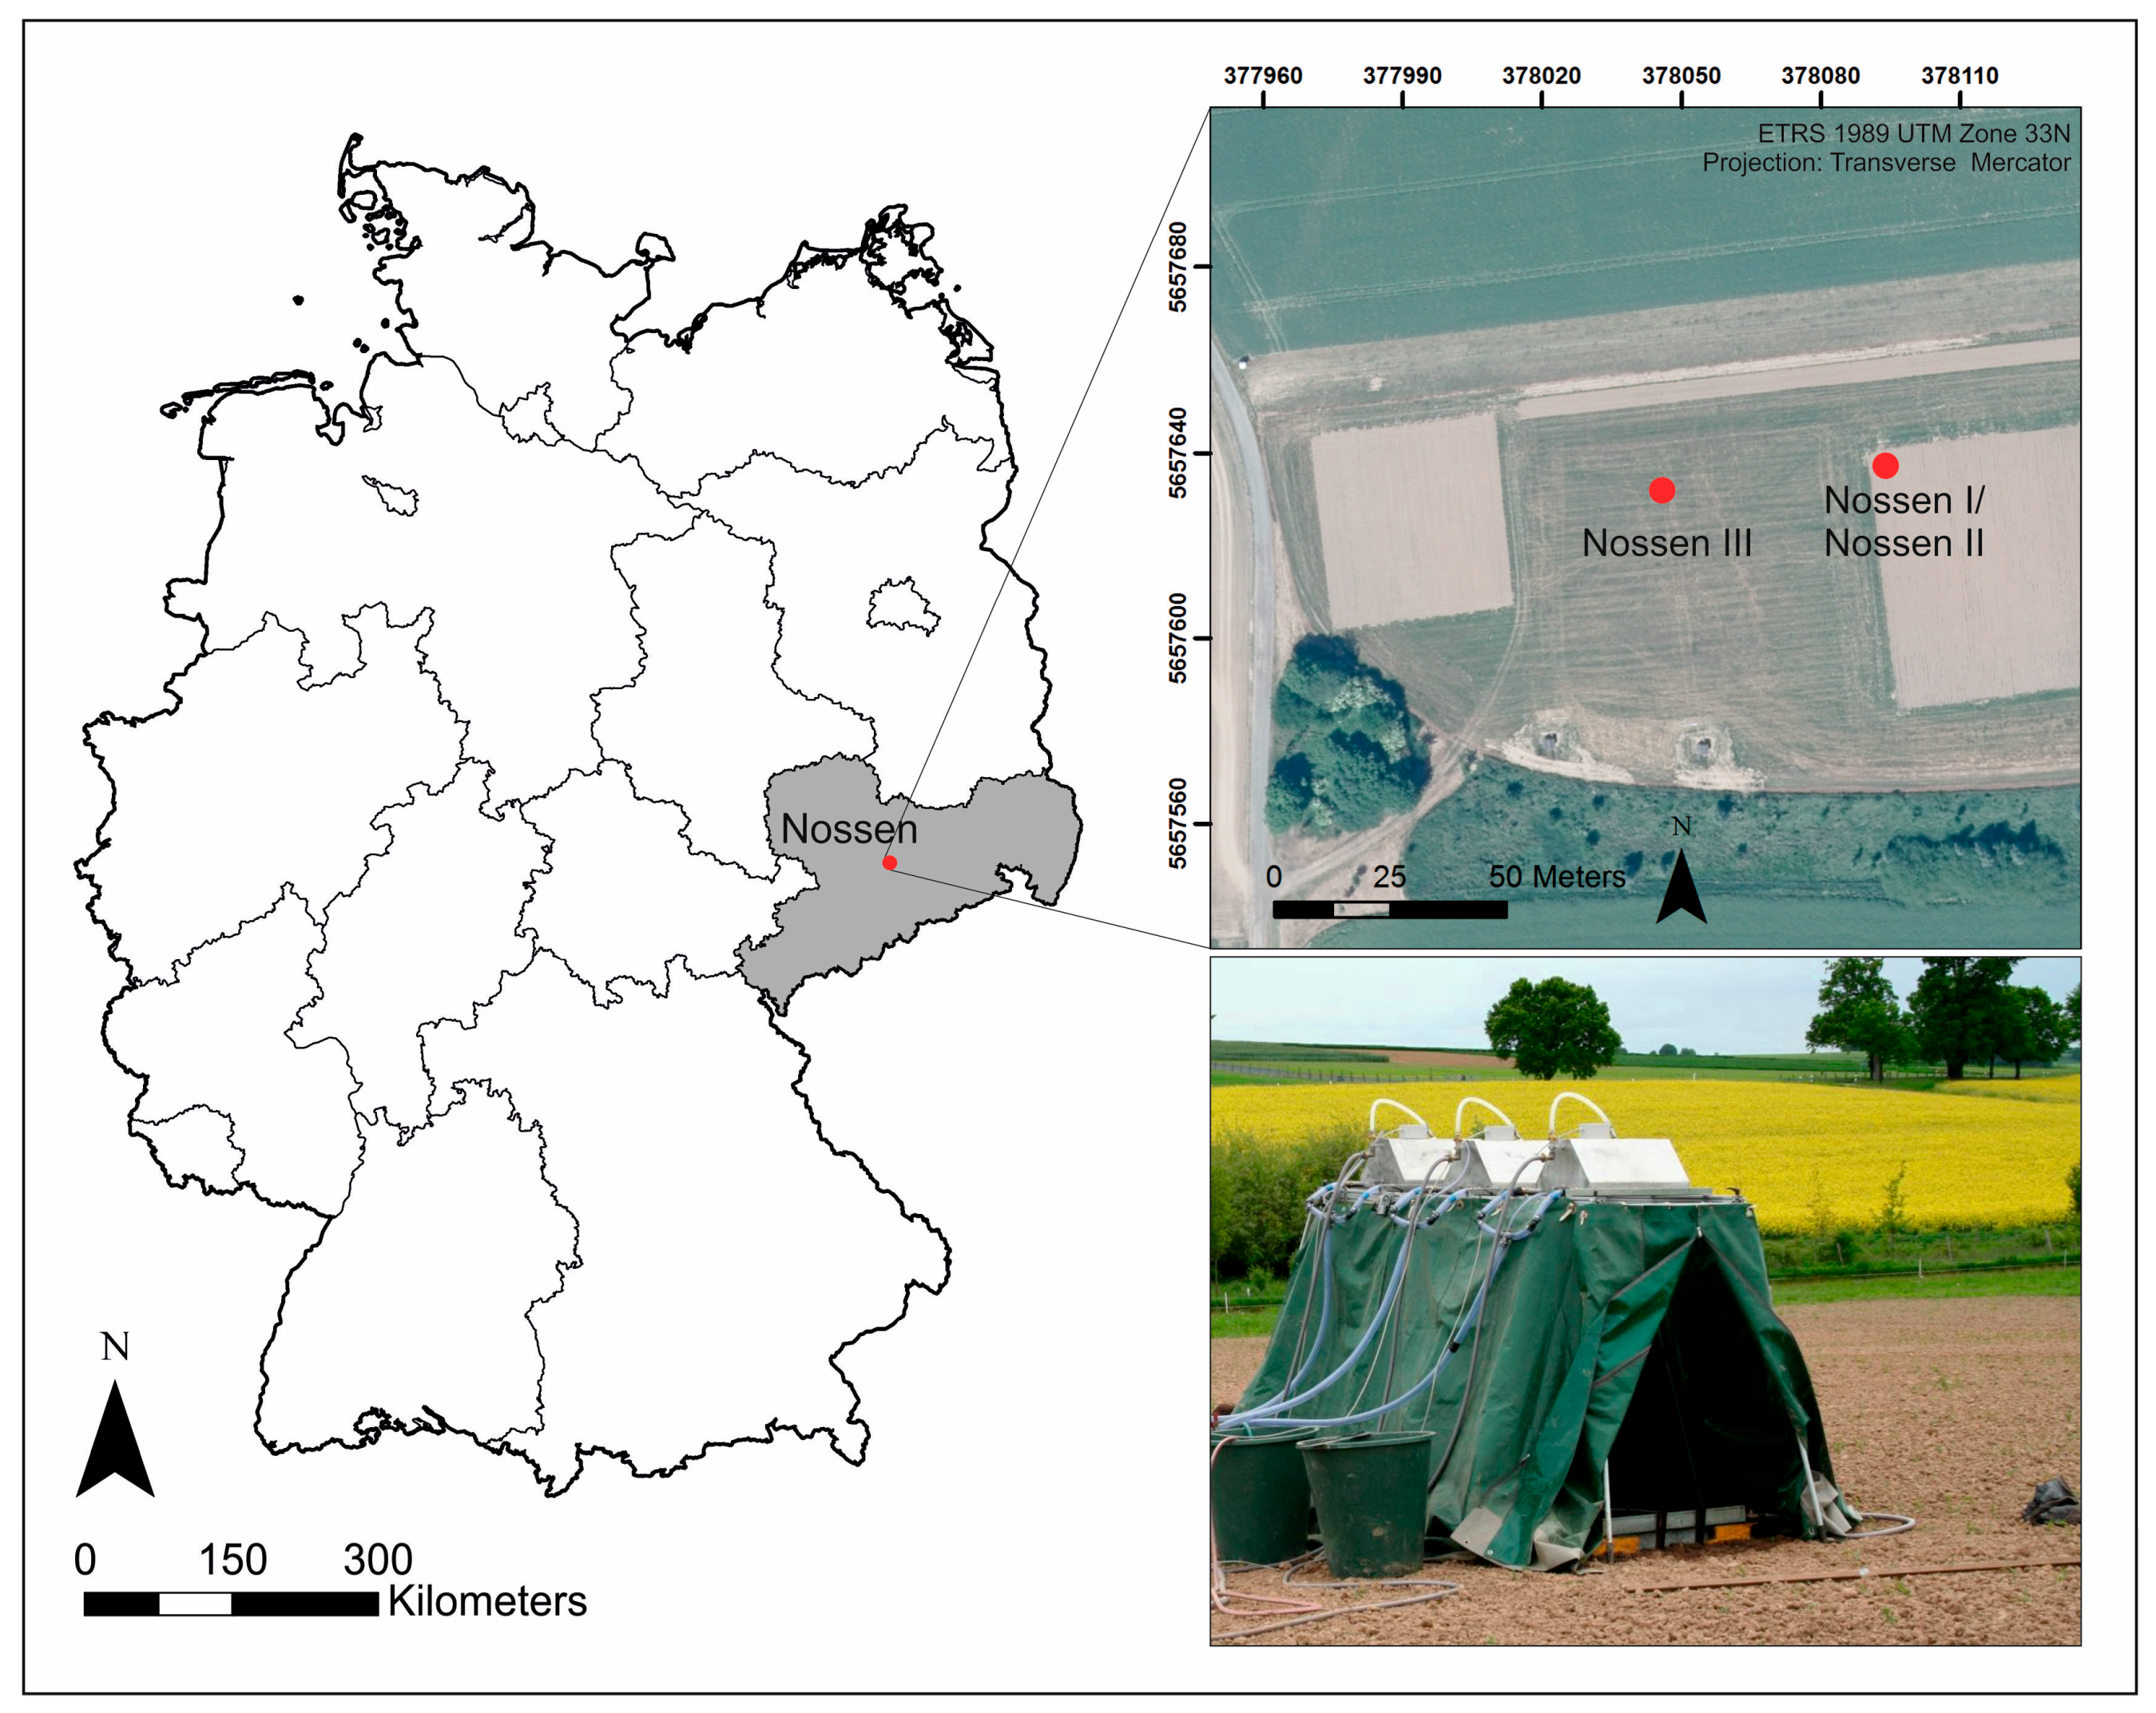
The rainfall simulation and data acquisition took place during three field campaigns at varying agricultural sites near Nossen, in the fertile, fragile and hilly landscape of the Saxon loess province, eastern Germany (
Figure 1).
The present study includes five plots at the three agricultural sites (
Table 1).
The different characters of the three agricultural sites reflect in the five simulated plots. Nossen I and Nossen III were cultivated with maize, whereas Nossen II was covered with winter wheat. Both arable crops are prone to water erosion, because during spring (maize cultivation) and autumn (winter wheat cultivation), the soil surface remains uncovered for a longer period. Three plots (Nossen I-2, Nossen II-2, Nossen III) were ploughed and the other two plots (Nossen I-1, Nossen II-1) were cultivated by cultivator. A few straw residues were visible on all the cultivator-plots.
2.2. Rainfall Simulations
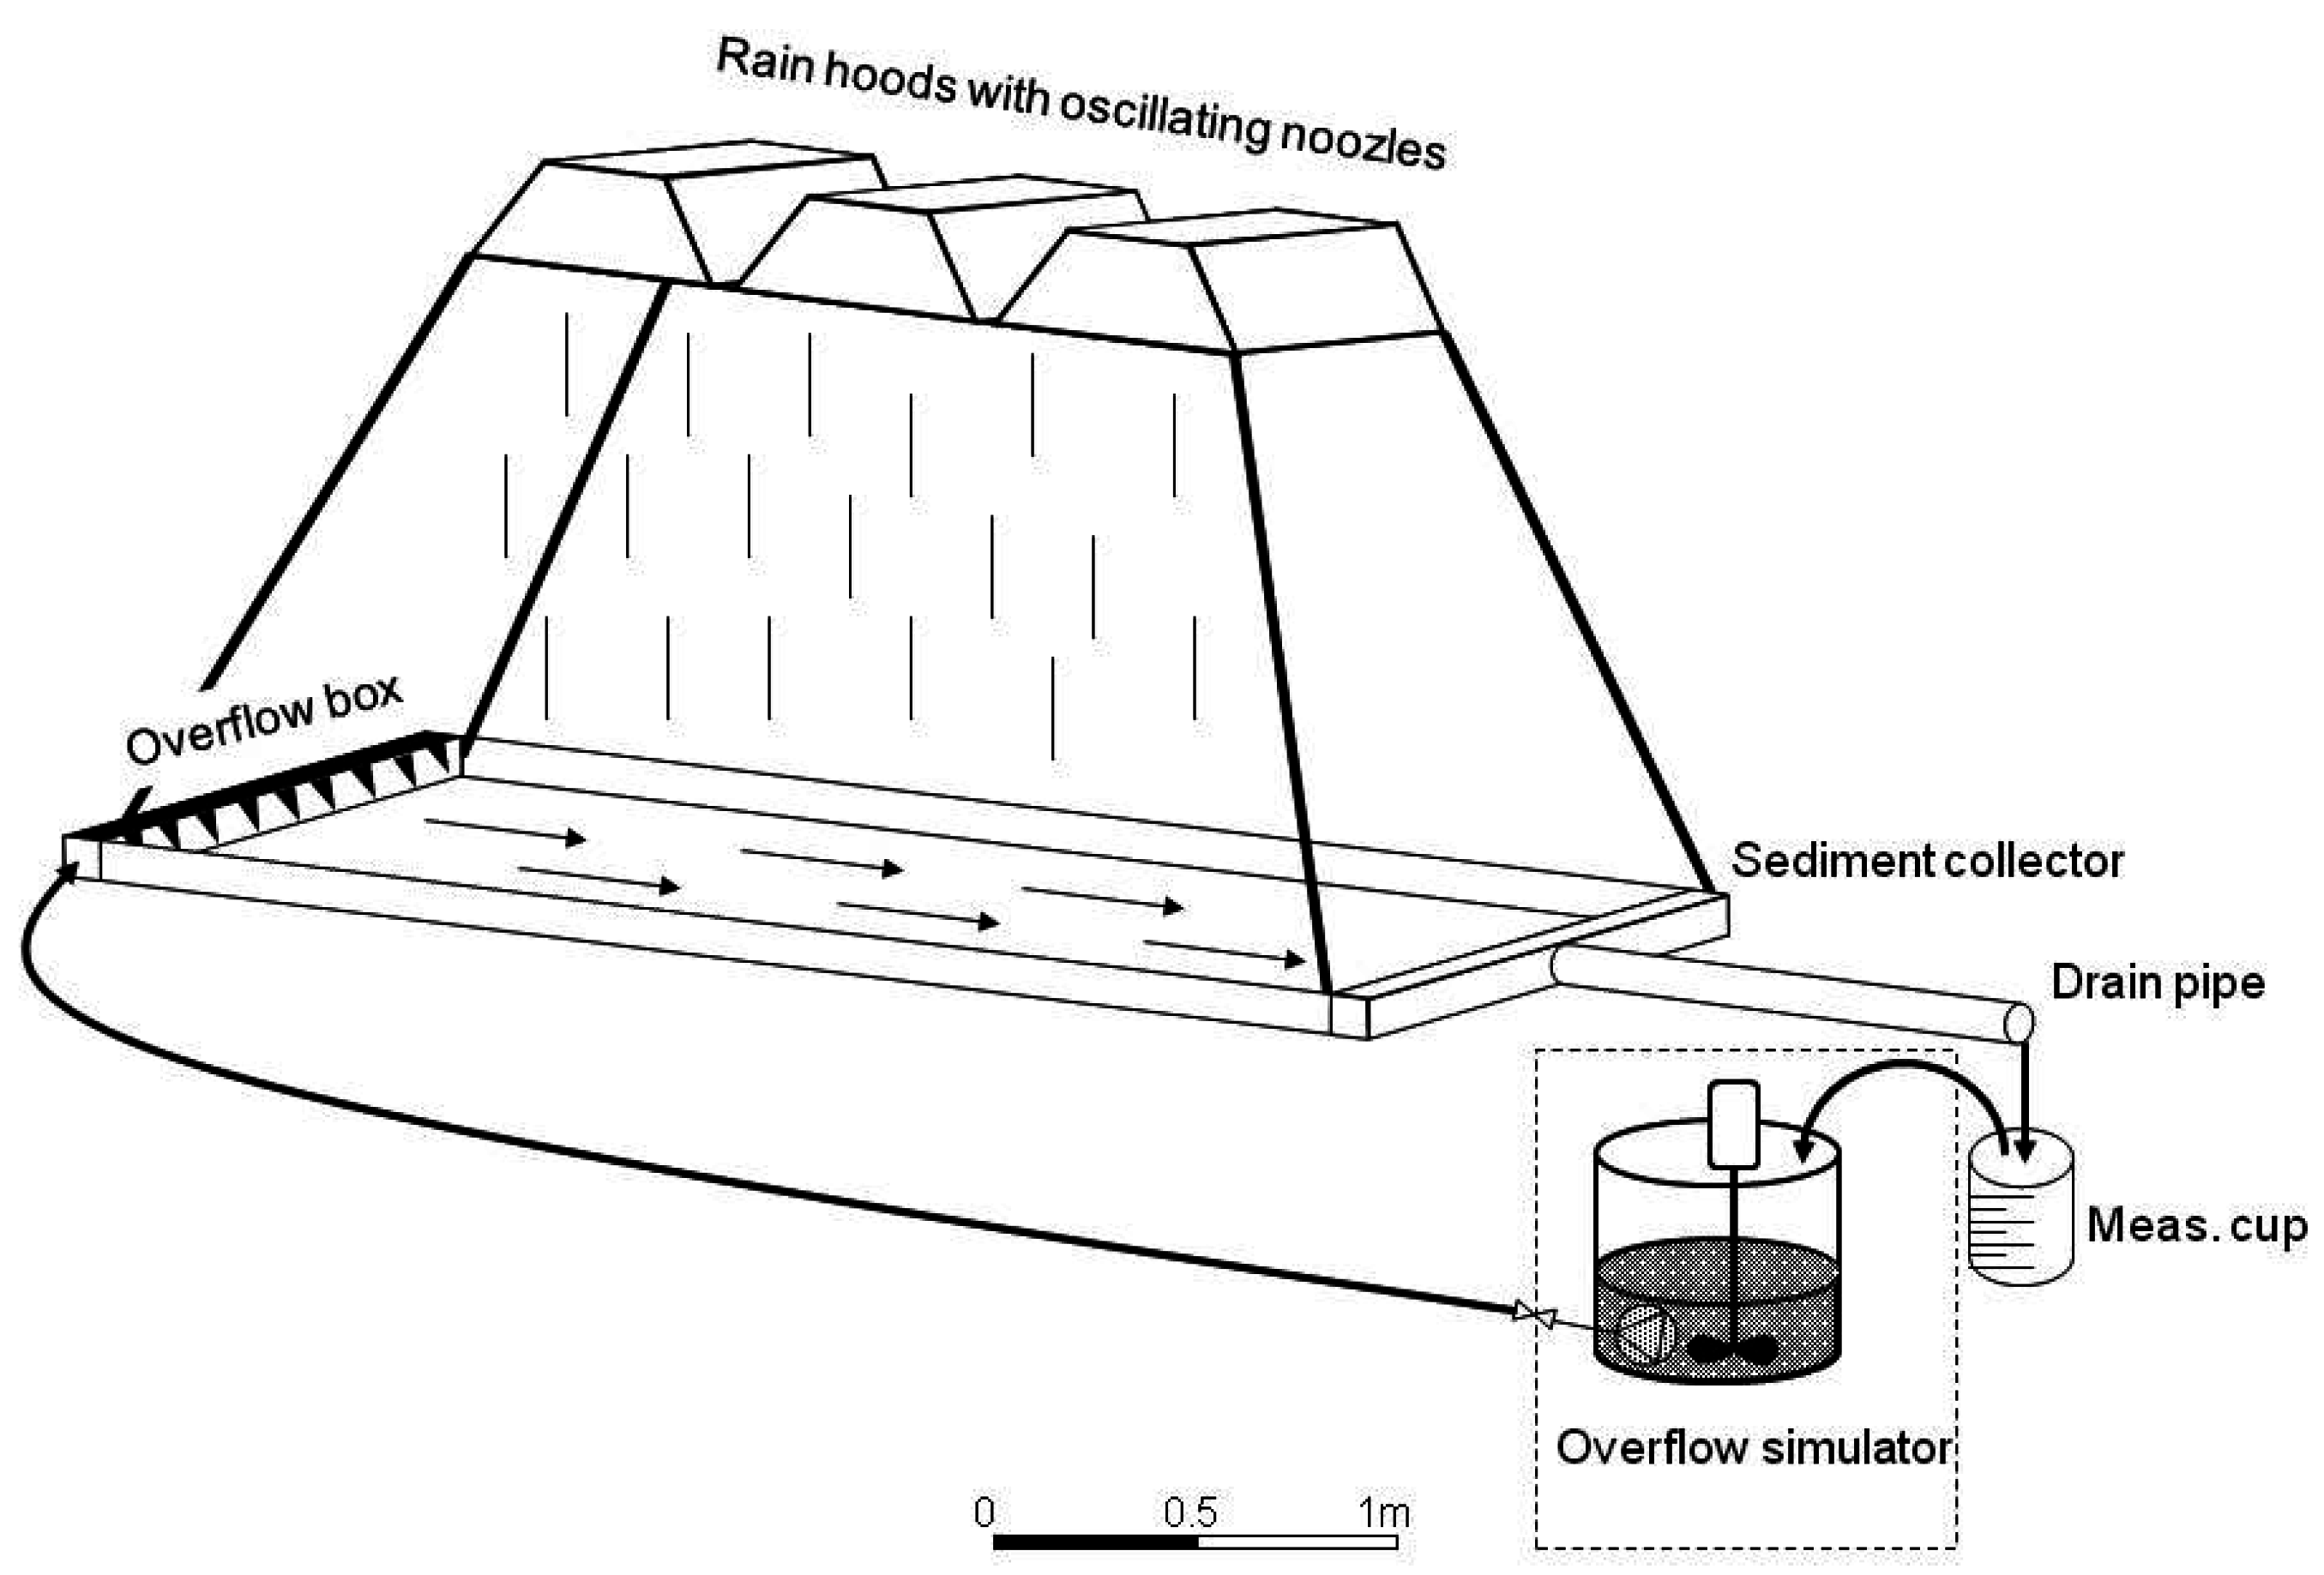
The Freiberg rainfall simulator has been described in detail by [
17] (
Figure 2). In short, it consists of three linked identical rainfall modules, which are equipped with oscillating battery-powered VeeJet 80/100 nozzles. The rainfall intensity is regulated by the nozzle’s oscillating speed and by the time the nozzle remains at the reversal points. The area covered by rainfall is 3 × 1 m.
Metal sheets and a sediment collector at the lower end inserted 10 cm into the soil keep sediment and runoff within the defined plot. Both runoff and sediments are stored in a barrel. In order to reproduce hydrodynamic conditions of longer slopes, a runoff feeding device is installed at the upper end of the plot. Via a sludge pump, water and suspended sediments can be added to the plot. The best conformity with natural rainstorms was attained at a nozzle pressure of 0.5 bar and a rainfall intensity of >30 mm/h according to experimental results of [
37], where the mean drop diameter is 0.7 mm and the mean fall velocity is 6.8 m/s [
38].
The rainfall duration time of the Nossen case studies was at least 45 min each (infiltration experiment). After reaching steady states of rainfall-runoff, the runoff feeding device was switched on to allow increased runoff rates over 7 min (experiment for surface runoff and sediment transport).
Runoff was measured every minute by a measuring cup. Suspended sediments were sampled with 125-mL PET-bottles in 5 min intervals during infiltration experiments, and every minute during increased runoff conditions. Sediment samples were evaporated at 105 °C and gravitationally measured afterwards. Subsequently, the soil loss (t/ha) was calculated in two steps. In the first step, the added sediment quantity (kg) of the plot area (3 m2) was calculated from the sum of the multiplication of the sediment concentration (g/L) per minute and the runoff volume (L) per minute. In the second step, the added sediment quantity was converted to the soil loss (t/ha). Corresponding soil loss values (mm) of the rainfall simulations were calculated from the division of the soil loss (t/ha) and the bulk density (kg/m3). Furthermore, the runoff coefficient as a relation between the amount of runoff to the amount of precipitation received was calculated. It describes, as a dimensionless coefficient, which proportion of the precipitation reaches the runoff.
2.2.1. Bulk Density
For the overall approach of soil surface changes due to soil erosion and its influencing factors, the range of methods was extended to the determination of soil compaction with the Nossen II-2-plot and the Nossen III campaign.
During rainfall simulation, the tilled and loosened soil surface can lower due to raindrop impact. Detached soil particles will be transported by water into the coarse pores. Consequently, their fraction and the total soil volume decreases [
39]. The soil surface lowers due to increasing soil bulk density. In contrast, the level of the soil surface can rise up to 7.5 cm after ploughing due to the loosening of the soil structure [
40], whereby the effect of tillage disappears with increasing precipitation [
41].
In soil science, the bulk density or soil density characterizes a measurement for the packing state of the soil. The bulk density (kg/m3) was determined before and after the rainfall simulation. For this study, it is therefore used to estimate the effect of soil compaction on soil surface changes to exclude this process from surface changes due to soil erosion. Additionally, the tractor lane of the ploughed Nossen III-plot was sampled to consider the spatially differentiated soil density betweenpre-compacted and tractor-lane-compacted soil.
For this purpose, before the rainfall simulation five core samples (100 cm
3) were taken adjacent to the plot at a depth of 5 cm. The plot was immediately sampled in the same way for the post-event. Subsequently, the soil samples were dried at 105 °C and weighted according to [
42] to calculate the bulk density.
2.2.2. “Out-of-the-Plot” Splash Erosion
The range of methods for the Nossen III campaign was further extended to measurement of “out-of-the-plot” splash erosion. The new method determines the proportion of soil in relation to the amount of soil, which gets lost from the plot during rainfall simulation. Soil particles are splashed on and beyond the edge of the metal sheets of the plot due to the impact of the rain drops. Consequently, these particles cannot be caught in the sediment collector at the plot outlet, resulting in a potential underestimation of the actual soil loss from the plot and related soil surface changes.
Therefore, three 0.1‑m
2 stripes of geotextile were placed on the left next to the plot before rainfall simulation. After the experiment, the geotextile stripes were dried, weighed and subsequently extrapolated to the plot area of 3 m
2. Additionally, splashed soil particles on the metal sheets were carefully collected, weighed and also extrapolated to the same area.
Figure 3 shows the experimental setup and the splash on the metal sheets after the experiment.
2.3. SfM Photogrammetry
In addition to the soil sampling approach, high resolution topography data were acquired before and after the rainfall simulations. The calculation of the digital 3D soil surface models for the pre- and the post-event from overlapping 2D images is achieved with SfM photogrammetry and multi-view dense matching methods in Agisoft PhotoScan [
43], resulting in dense point clouds representing the earth surface.
2.3.1. Camera
Terrestrial images were taken from close ranges to the plots with digital single lens reflex (DSLR) cameras. In order to cover the entire plot, the pre- and post-event surfaces were shot at least 40 times from different perspectives and ensuring sufficient image overlap (at least 60%). Throughout the rainfall simulations, the internal camera parameters were not changed due to the usage of a retained focal length and a fixed manual focus. The plots of Nossen II and III were both photographed with a Canon EOS 1100D (5.2 μm pixel size and 4272 × 2848 pixel sensor size), an aperture of ƒ/5.6 and a locked focal length at 28 mm. The chosen camera for Nossen I was a Canon EOS 350D (6.4 μm pixel size and 3456 × 2304 pixel sensor size) with focal lengths retained at 18 mm and 28 mm and an aperture of ƒ/10. Thus, for the first camera, ground sampling distance (GSD) resolves 0.4 mm at a distance of 1.5 m, and for the second camera, GSD amounts 0.7 mm for the short focal length and 0.5 mm for the larger focal length at the same distance.
Considering data acquisition scheme and camera specifications, a theoretical error (more detail e.g., [
19]) of 0.1 mm is estimated, which allows for a preliminary potential assessment of accuracy performance of the 3D reconstruction of the soil surface.
2.3.2. Referencing Methods
To perform multi-temporal change detection of the soil surface by subtracting the pre-DEM from the post-DEM [
44], a stable and consistent reference system has to be defined. In the following three different referencing methods for the plots, one per campaign (GCP approach No. 1, 2, 3), is described. The different referencing performance and their reasons are presented in the Results section of this study.
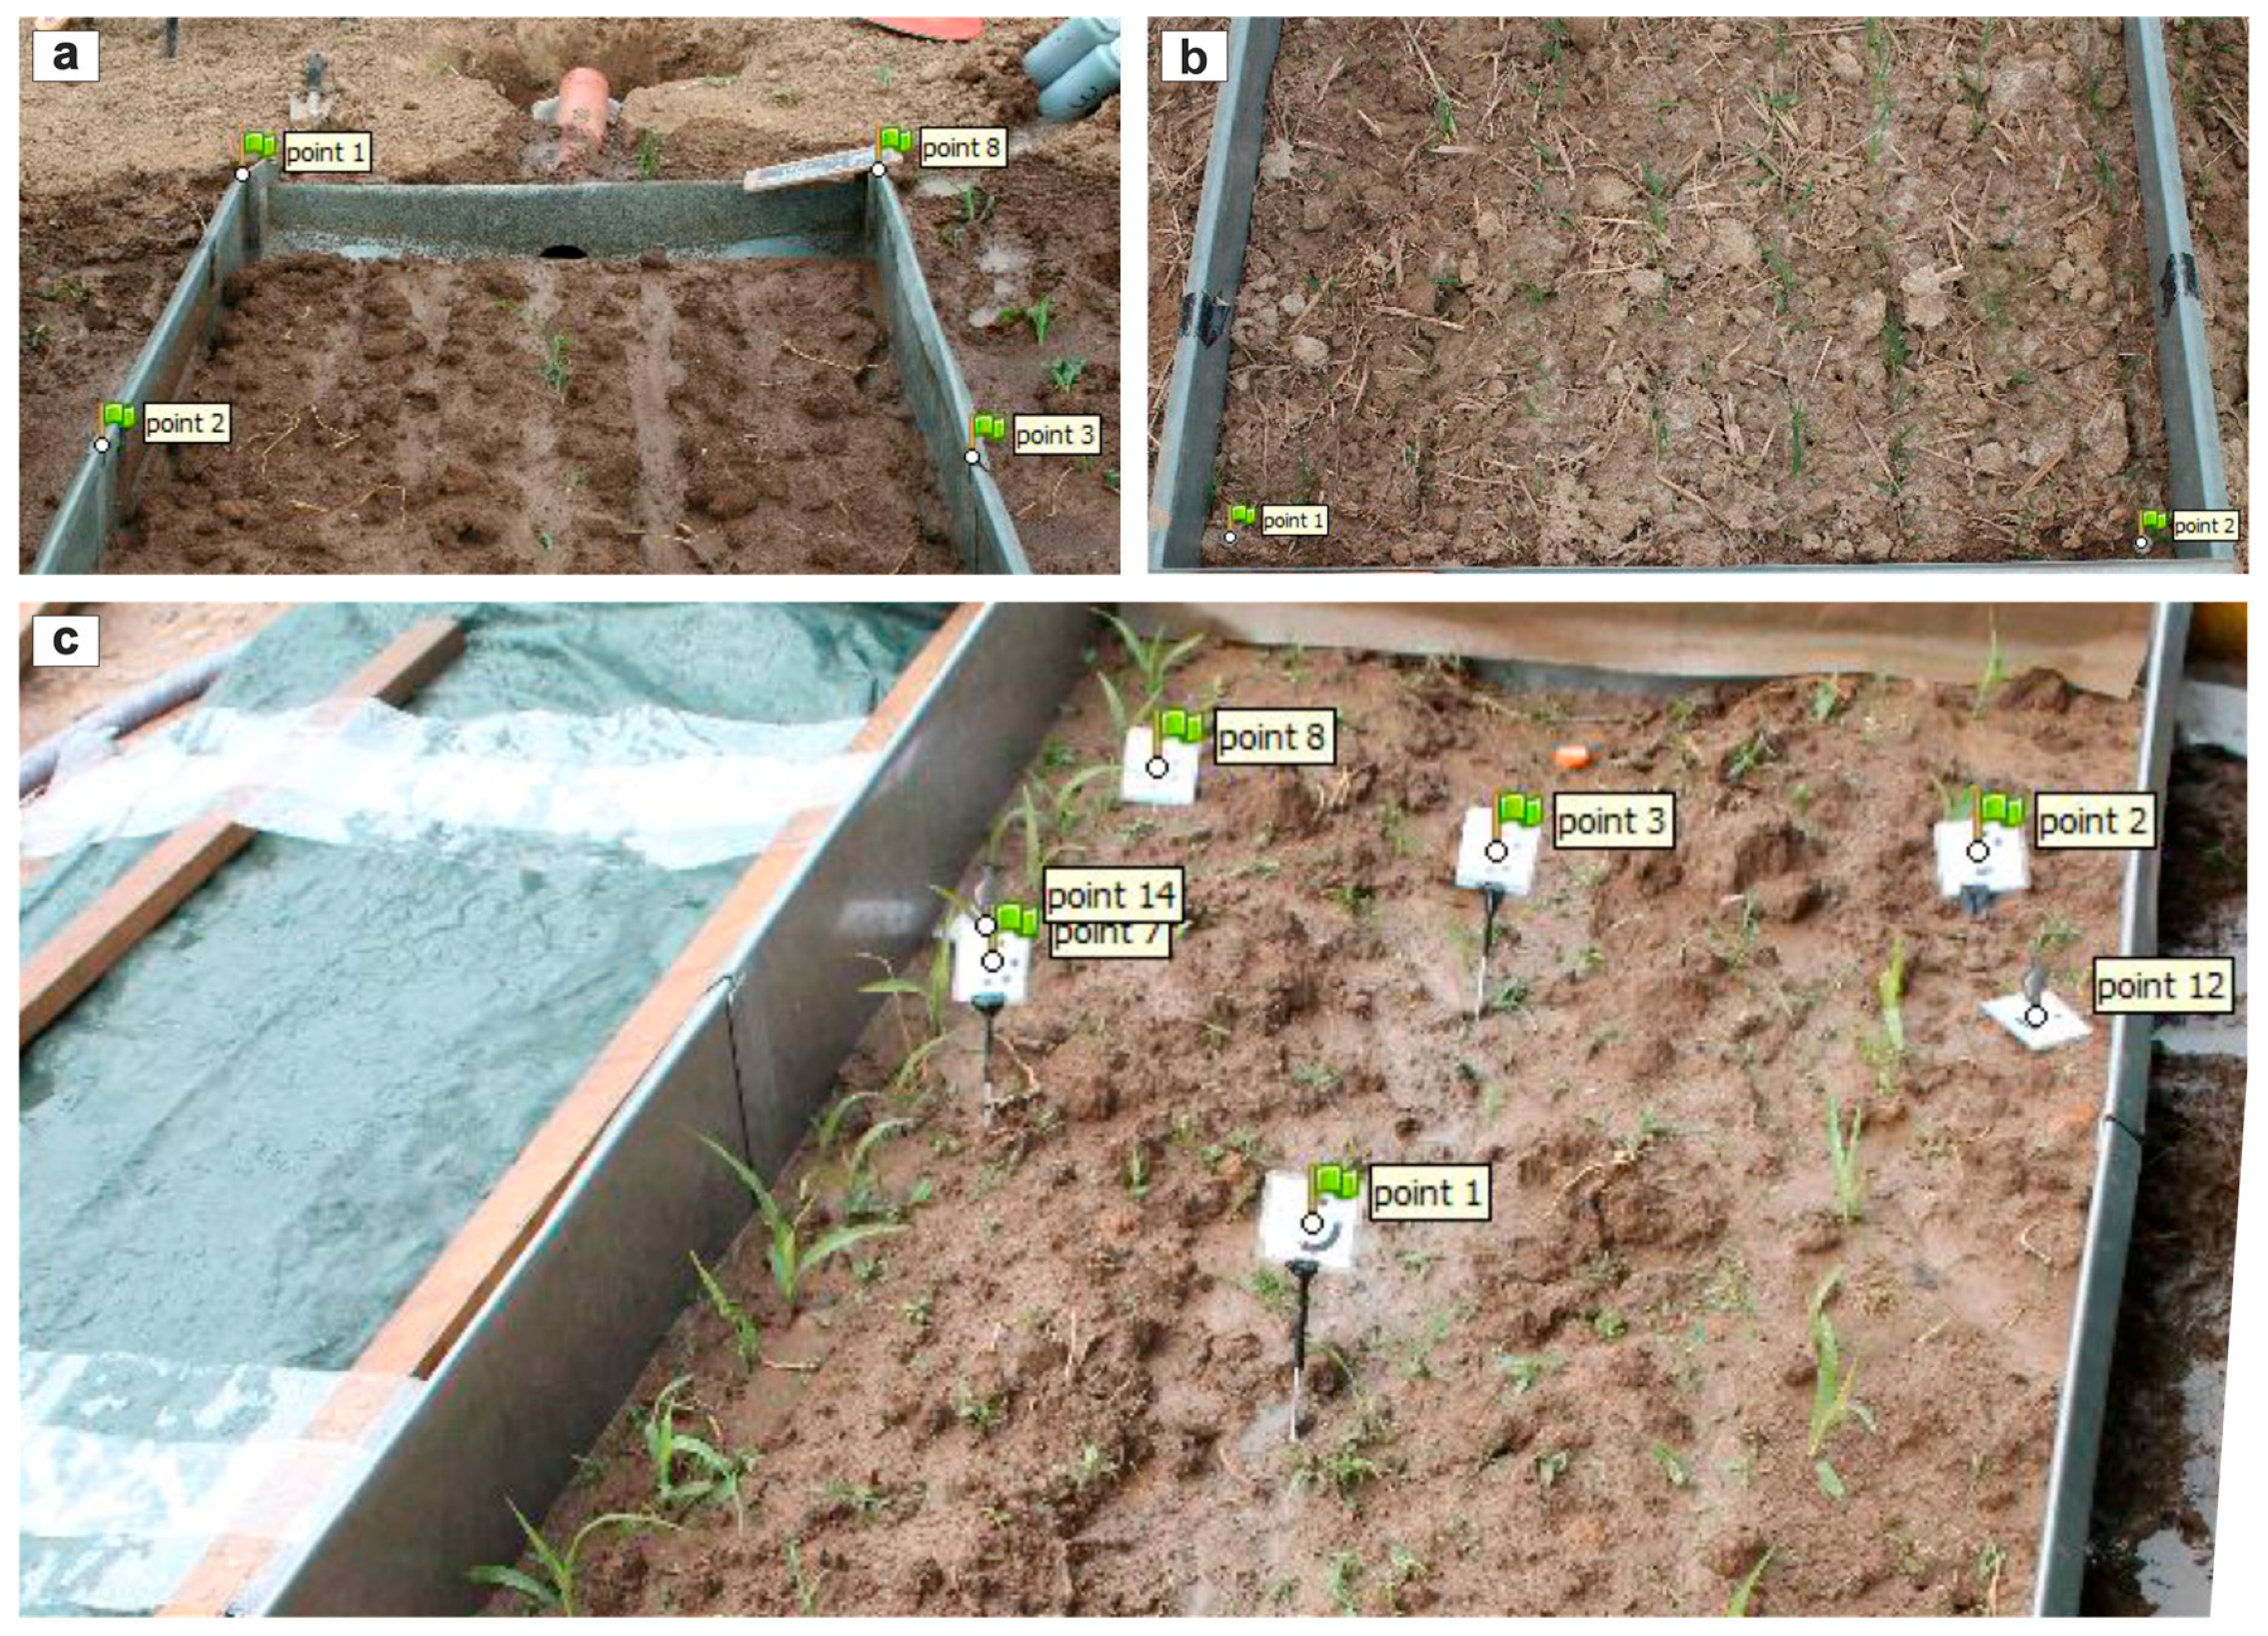
In Nossen I (GCP approach No. 1), distinctive image points are located at the metal sheets (
Figure 4a). To define a local reference, corresponding point coordinates in the object space are allocated, utilizing the knowledge about the metal sheet dimensions.
During the second case study (Nossen II, GCP approach No. 2), ground control points (GCPs) are placed directly on the soil surface (
Figure 4b). Nails with a length of 6 cm were driven into the soil at the four corners of the experimental plot. With a right angle tool, the four corners of the plot were checked on true orthogonality. This time, object space coordinates are measured directly (and not indirectly assuming plot extent sizes) using a measuring tape and assigning one of the surface points as the origin of the local reference system. In PhotoScan, the GCPs are used for referencing as well as distortion correction.
For the Nossen III-plot, a third approach of data referencing is pursued (GCP approach No. 3). Thus, 15 GCPs were installed at greater depths (>10 cm) on the experimental plot to ensure their stability and redundancy (
Figure 4c). To define a reference system, in a first step scale measurements between selected GCPs are used instead of direct estimation of
x and
y values. The scales were chosen for points at larger distances to ensure that inaccuracies of the distance measurement contain a lower weight at the final scale accuracy, i.e., mm measurement accuracy versus m scale assignment. Using the scale, the pre-event data is assigned a scaled but arbitrary coordinate system. Thus, orientation and location is random. However, for multi-temporal comparison pre- and post-event models need to be in the same coordinate system. Therefore, the scaled pre-event model is used to derive object space coordinates of the installed GCPs in the local system of this model. DEMs and orthophotos are generated from the pre-event 3D soil surface point cloud and subsequently used to measure
xy coordinates of the GCPs, which are identifiable in the images, and
z values are assigned extracting the height information at the corresponding position in the DEM. These GCP coordinates are then used to reference the post-event model.
2.3.3. DEM and DoD Generation
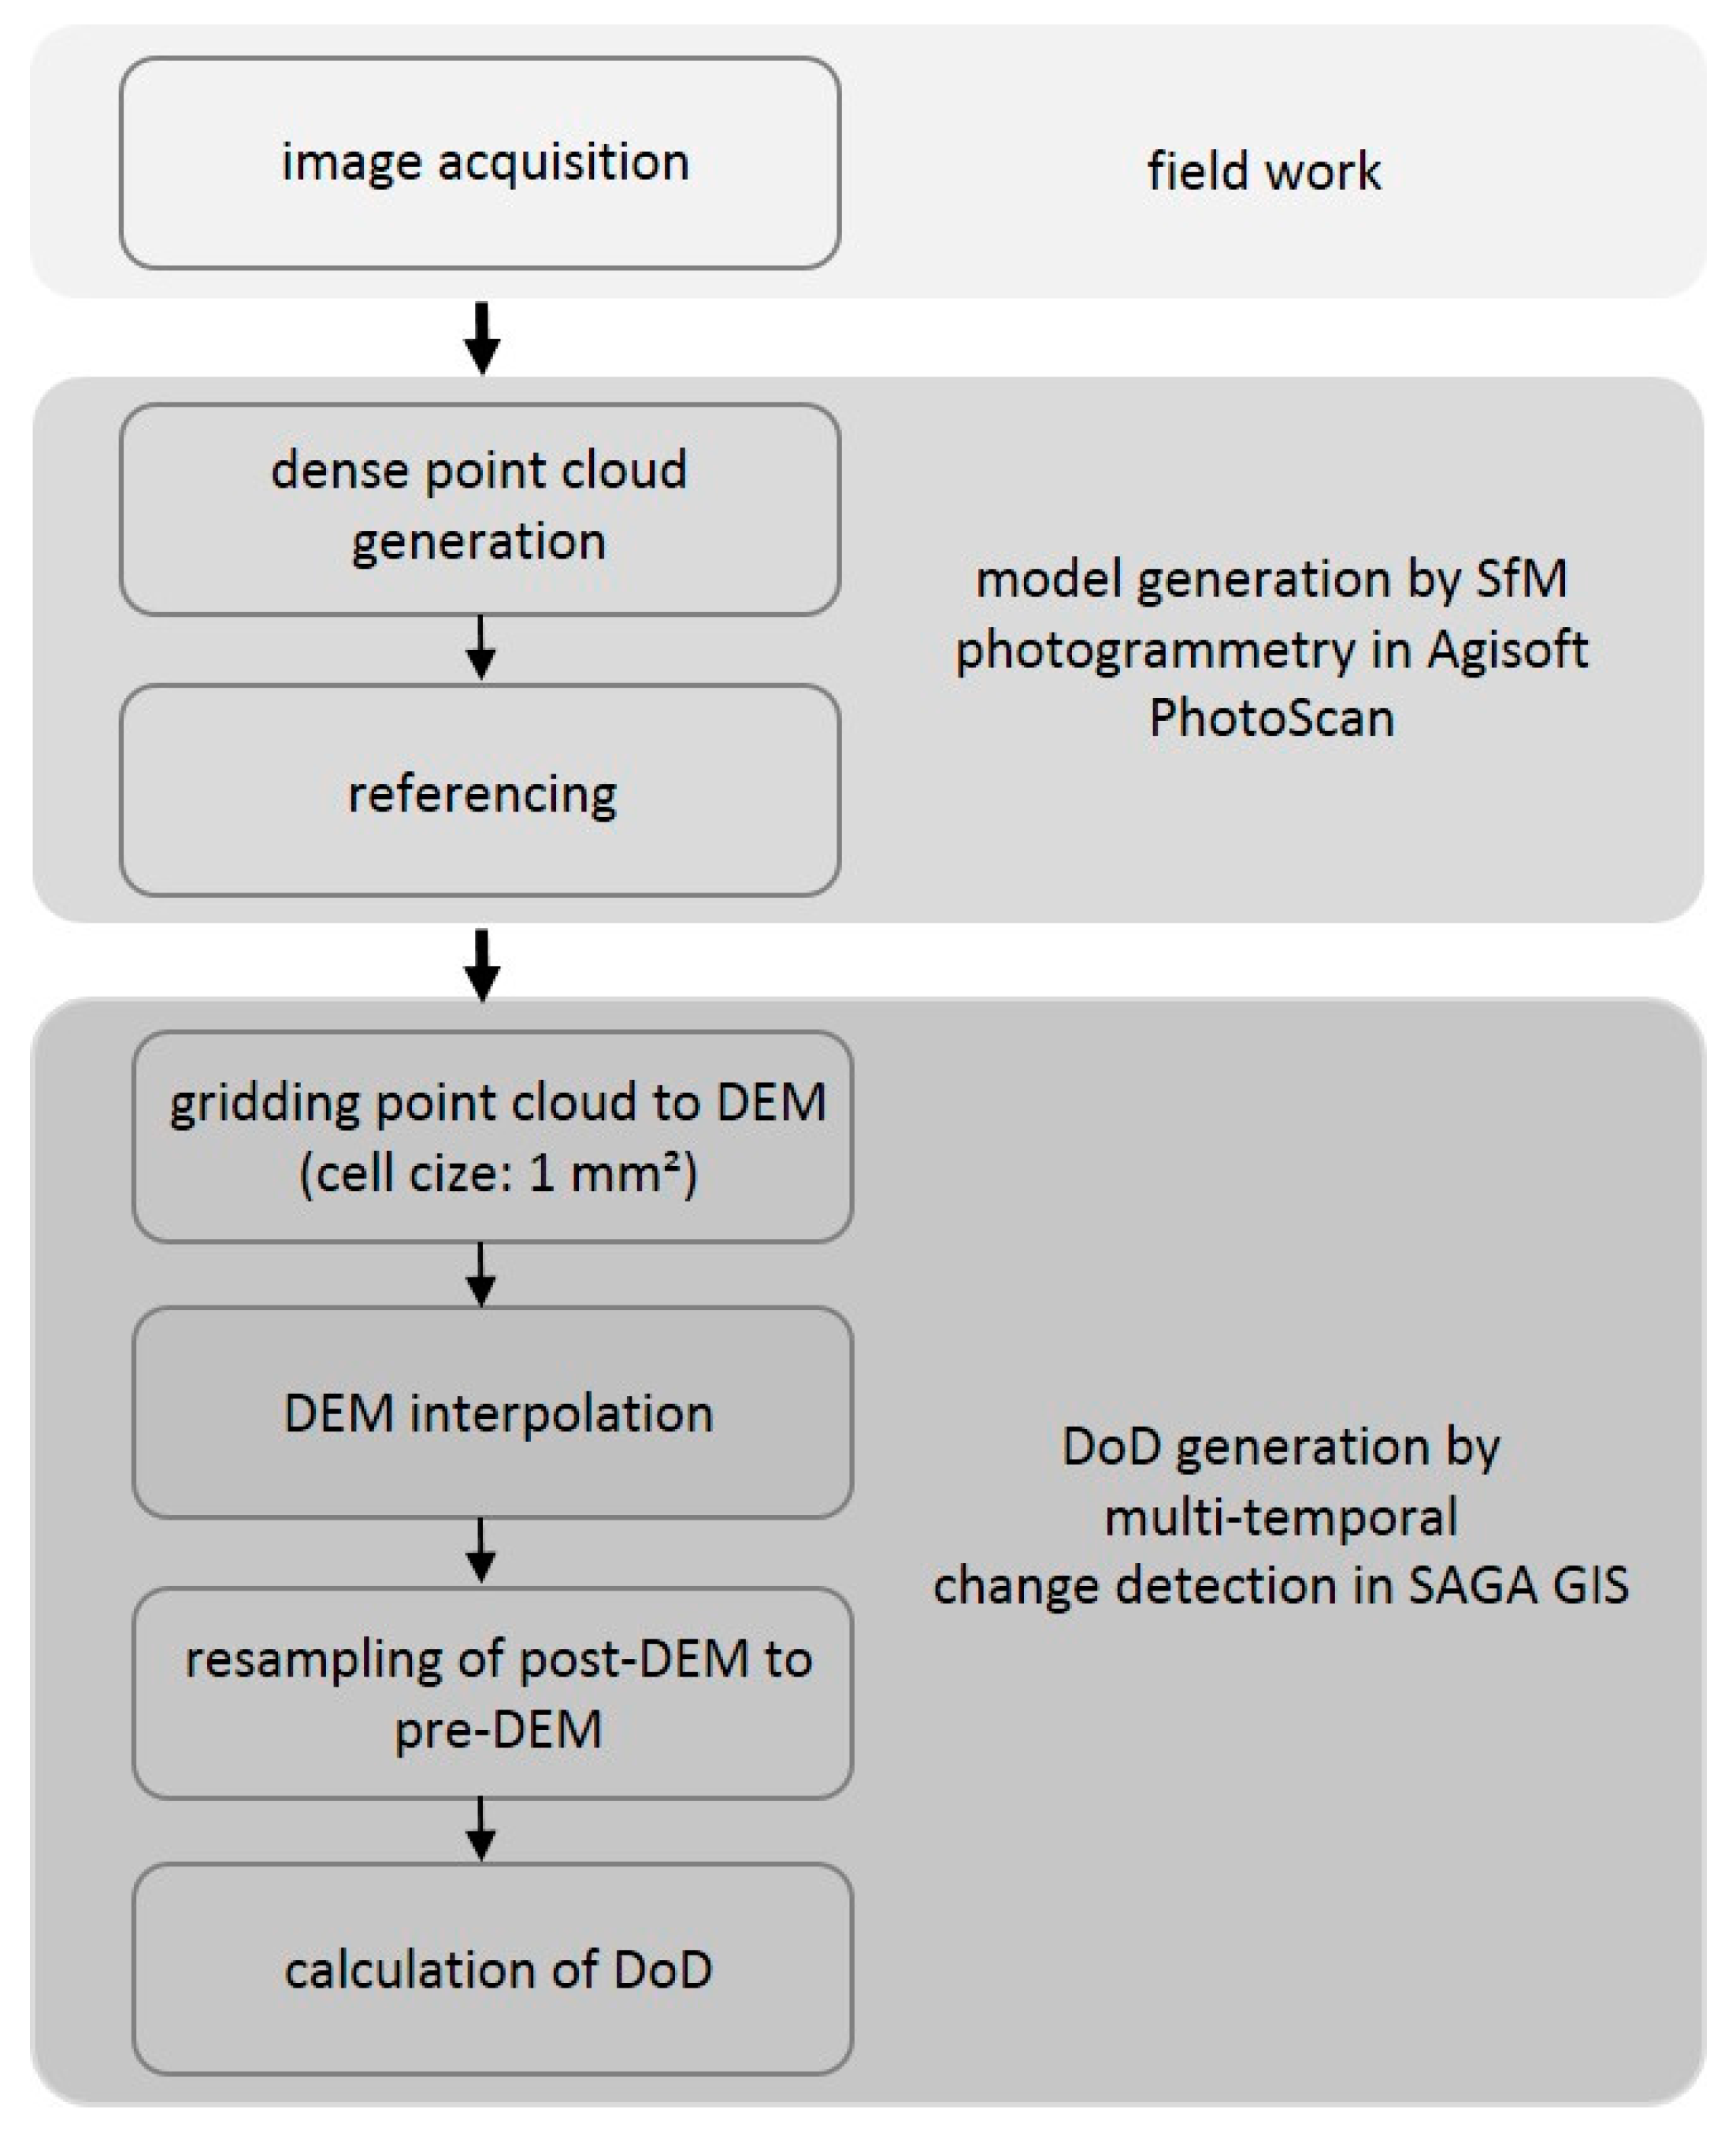
The general workflow from image acquisition to DoD generation is described in
Figure 5.
The referenced dense point clouds from PhotoScan are exported as TXT files to the open source software SAGA GIS [
45] and converted to grids in order to form DEMs with a resolution of 1 × 1 mm. Afterwards, Multilevel B-spline was used for the interpolation of missing data values of the gridded DEM. As the grid extent of the pre-DEM is not exactly the same as that of the post-DEM, the latter has to be resampled to the pre-DEM. Thus, the resulting resampled post-DEM covers the same grid extent as the pre-DEM and both grids can be used for the following grid calculation. Through subtraction of the post-DEM and the pre-DEM, the calculated DoD is received. This technique provides change detection maps of the soil surface before and after the experiment and an averaged soil loss value with sub-mm resolution if the cell values are summarized for the entire plot area. To reach reliable conclusions regarding the surface change, a level of detection (LoD) [
46,
47] is assigned, which considers the error propagation of the individual errors of each DEM into the final DoD.
3. Results
3.1. Rainfall Simulations
3.1.1. Runoff, Runoff Coefficient and Soil Loss
The total runoff of the rainfall simulations was in the range of 44.5–73.0 L/m
2. The runoff coefficient ranges between 0.02 and 0.56, whereby more than half of the values oscillate between 0.21 and 0.26 (
Table 2). The lower value of Nossen II-1 (cultivator) corresponds to lower runoff and higher infiltration, whereas the larger values stand for low infiltration and high runoff. The soil loss was in the range of 3.39–23.94 t/ha (
Table 2). Ploughed plots had relatively higher soil losses than the cultivator-plots.
3.1.2. Bulk Density
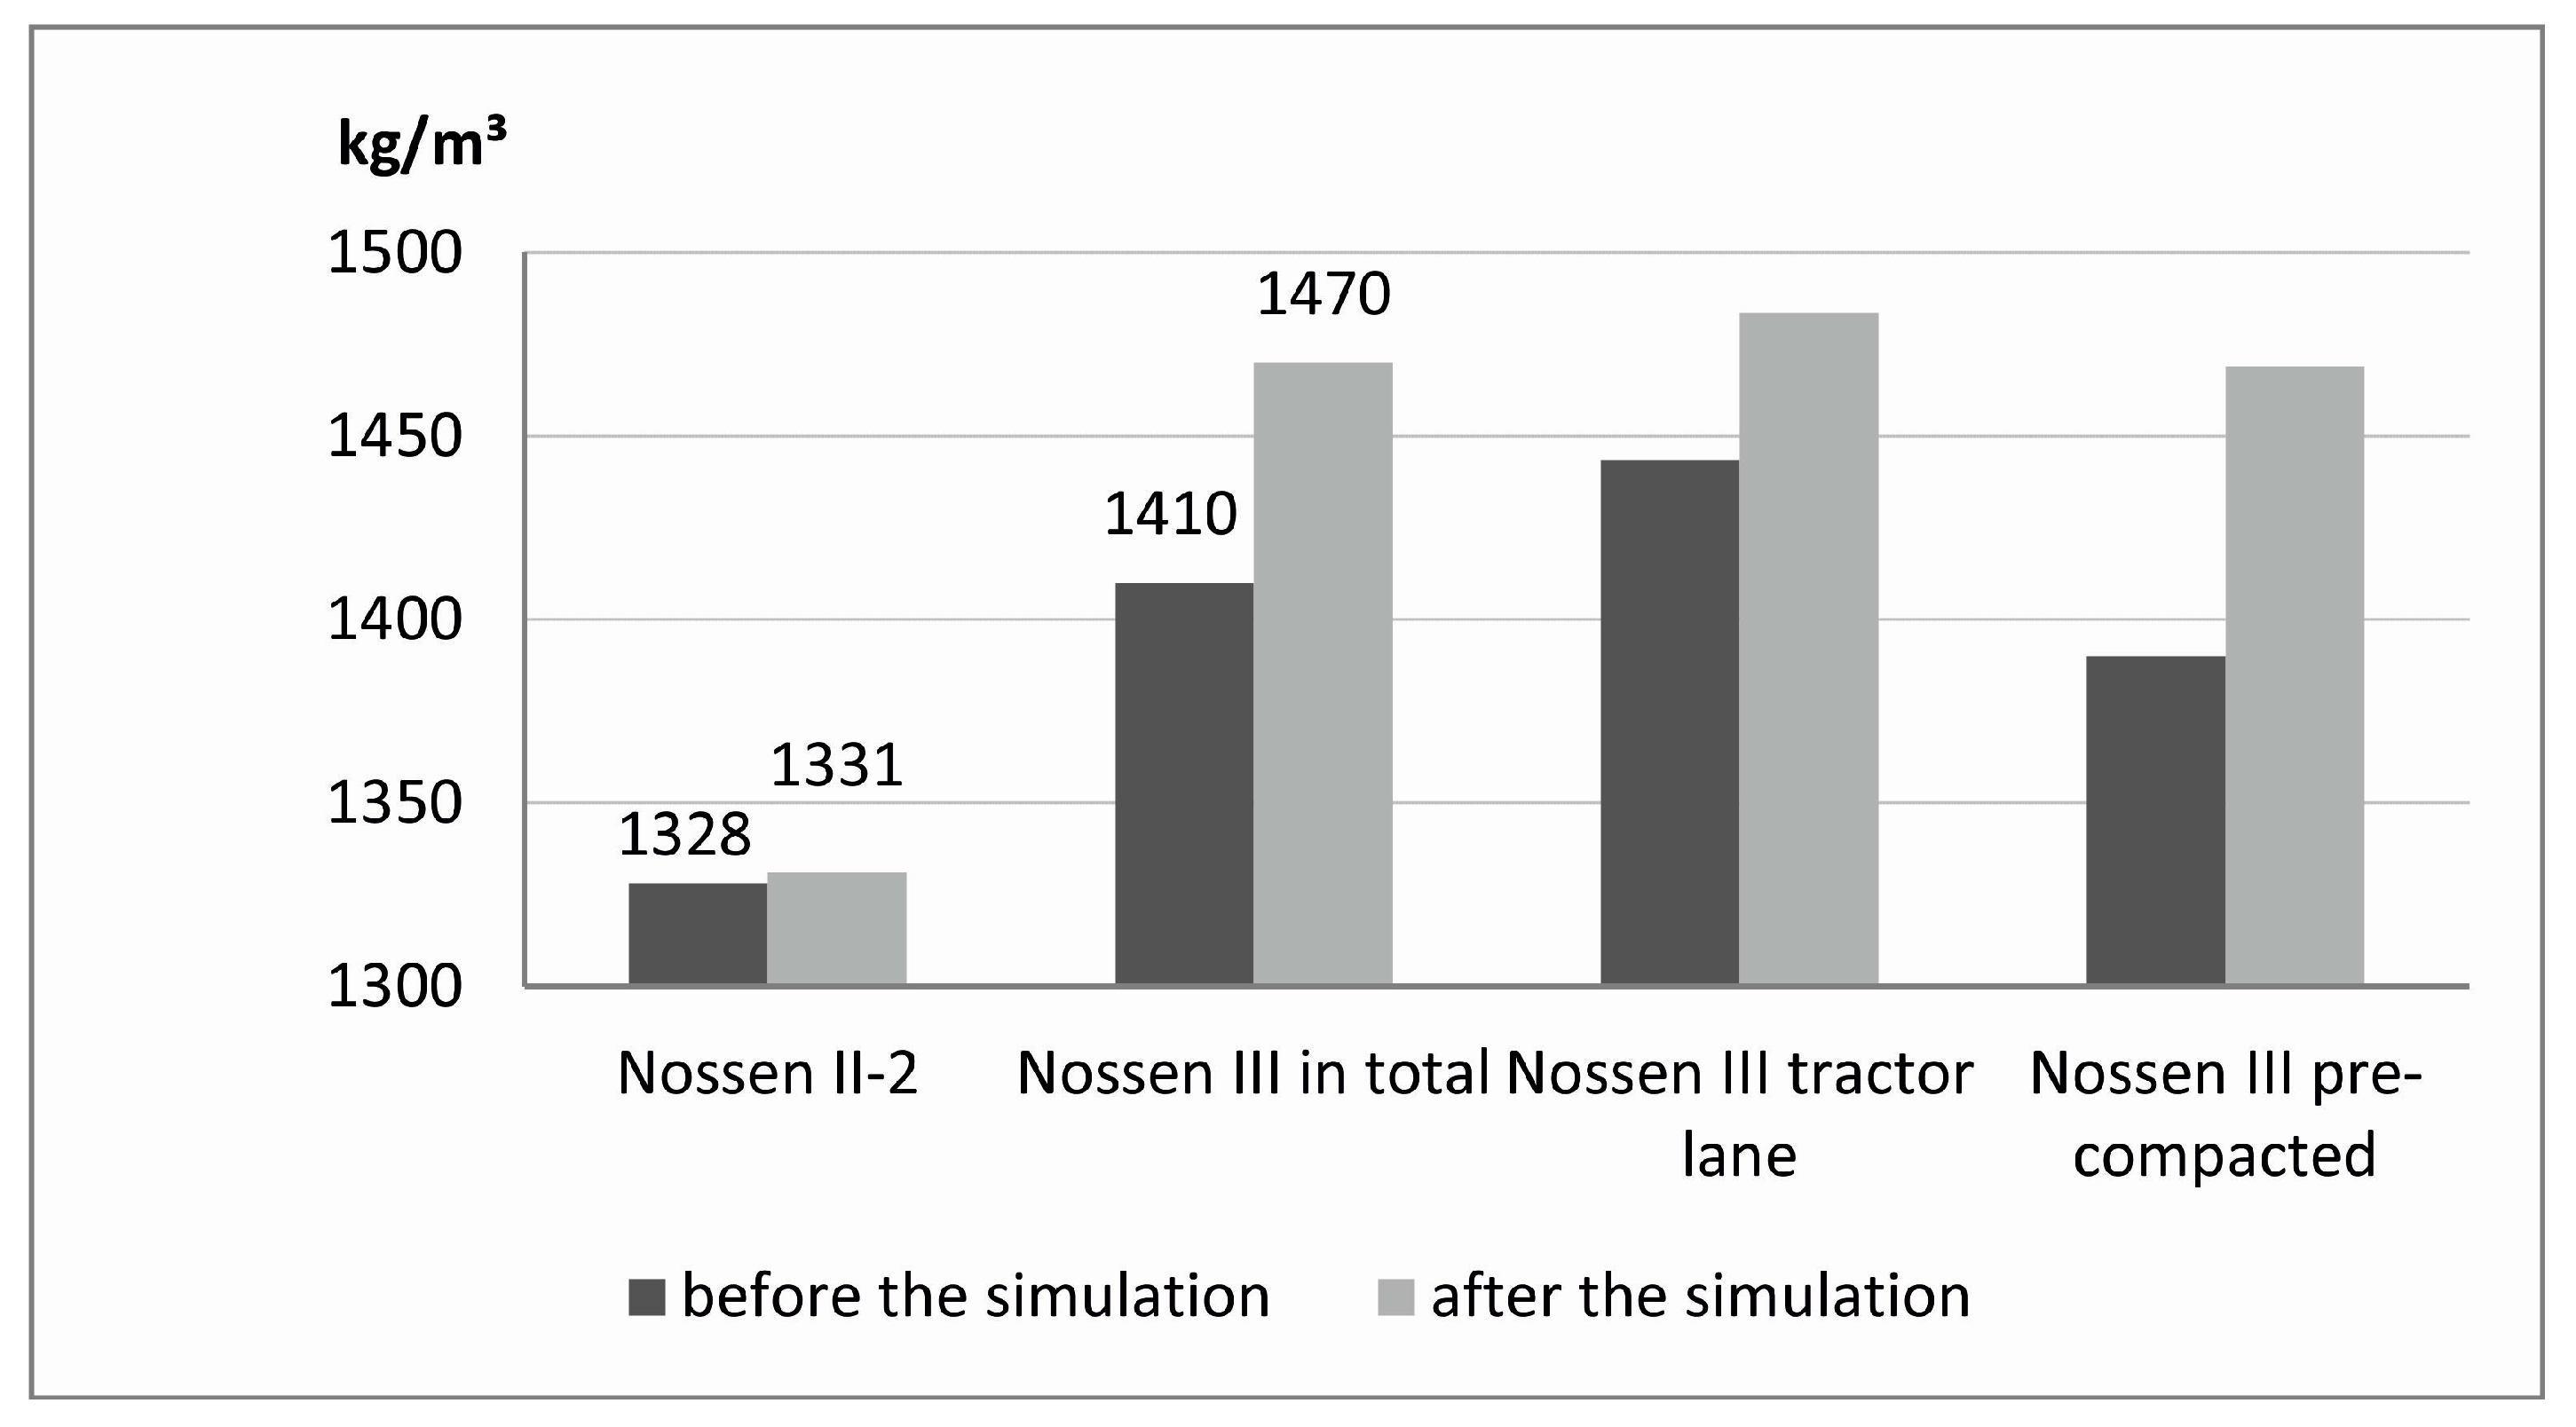
For Nossen II-2 and Nossen III the bulk densities before and after the rainfall simulation were determined and area weighted for the whole plot (
Figure 6). Nossen II-2 reveals that the bulk density slightly increases (by 3 kg/m
3 or 0.24%) after the simulation.
For Nossen III, the bulk density increases to a much greater extent (60 kg/m3 or 4.26%) compared to Nossen II-2. The tractor lane is already denser before the rainfall simulation compared to the pre-compacted soil samples. Thus, the compaction of the tractor lanes samples is less intense than at the pre-compacted positions.
3.1.3. “Out-of-the-Plot” Splash
The quantification of the splash from the geotextiles for the Nossen III-plot resulted in a splash-proportion of 1.60 g/m2 for the left side of the plot. Projected to all four sides of the plot and the plot-area of 3 m2, the splash outside of the plot adds up to 19.20 g. The splash-proportion on the metal sheets is 1.83 g for 3 m2. Generally, the soil loss due to splash out of the plot area (3 m2) amounts to 21.03 g or small 0.35%.
3.2. SfM Photogrammetry
3.2.1. Referencing Methods
Three different referencing methods were used to test which of the three DoD determined soil losses best agree with the measured soil loss by sampling.
Different accuracies are achieved with the different referencing methods. The Nossen I-approach inherits the disadvantage of the assumption that all points at the metal sheet are situated in local plane. This is questionable because the installation of the metal sheets is not as precise and stable due to flexible elements causing deviations from rectangular and coplanar plot shapes. Thus, plot extent estimates assumed from the metal sheet design can cause erroneous scale assignment, if plot sides are not parallel or even orthogonal.
For the Nossen II-approach, again coplanarity of the GCPs is not assured due to missing leveling measures. To avoid greater surface disturbances, only four points are installed, which possesses the drawback that erroneous point measurements cannot be compensated.
The third referencing method (Nossen III) was developed appearing to be the most reliable one. That assumption will be confirmed hereafter due to the estimation of the LoD for the Nossen III-DoD.
3.2.2. DoDs
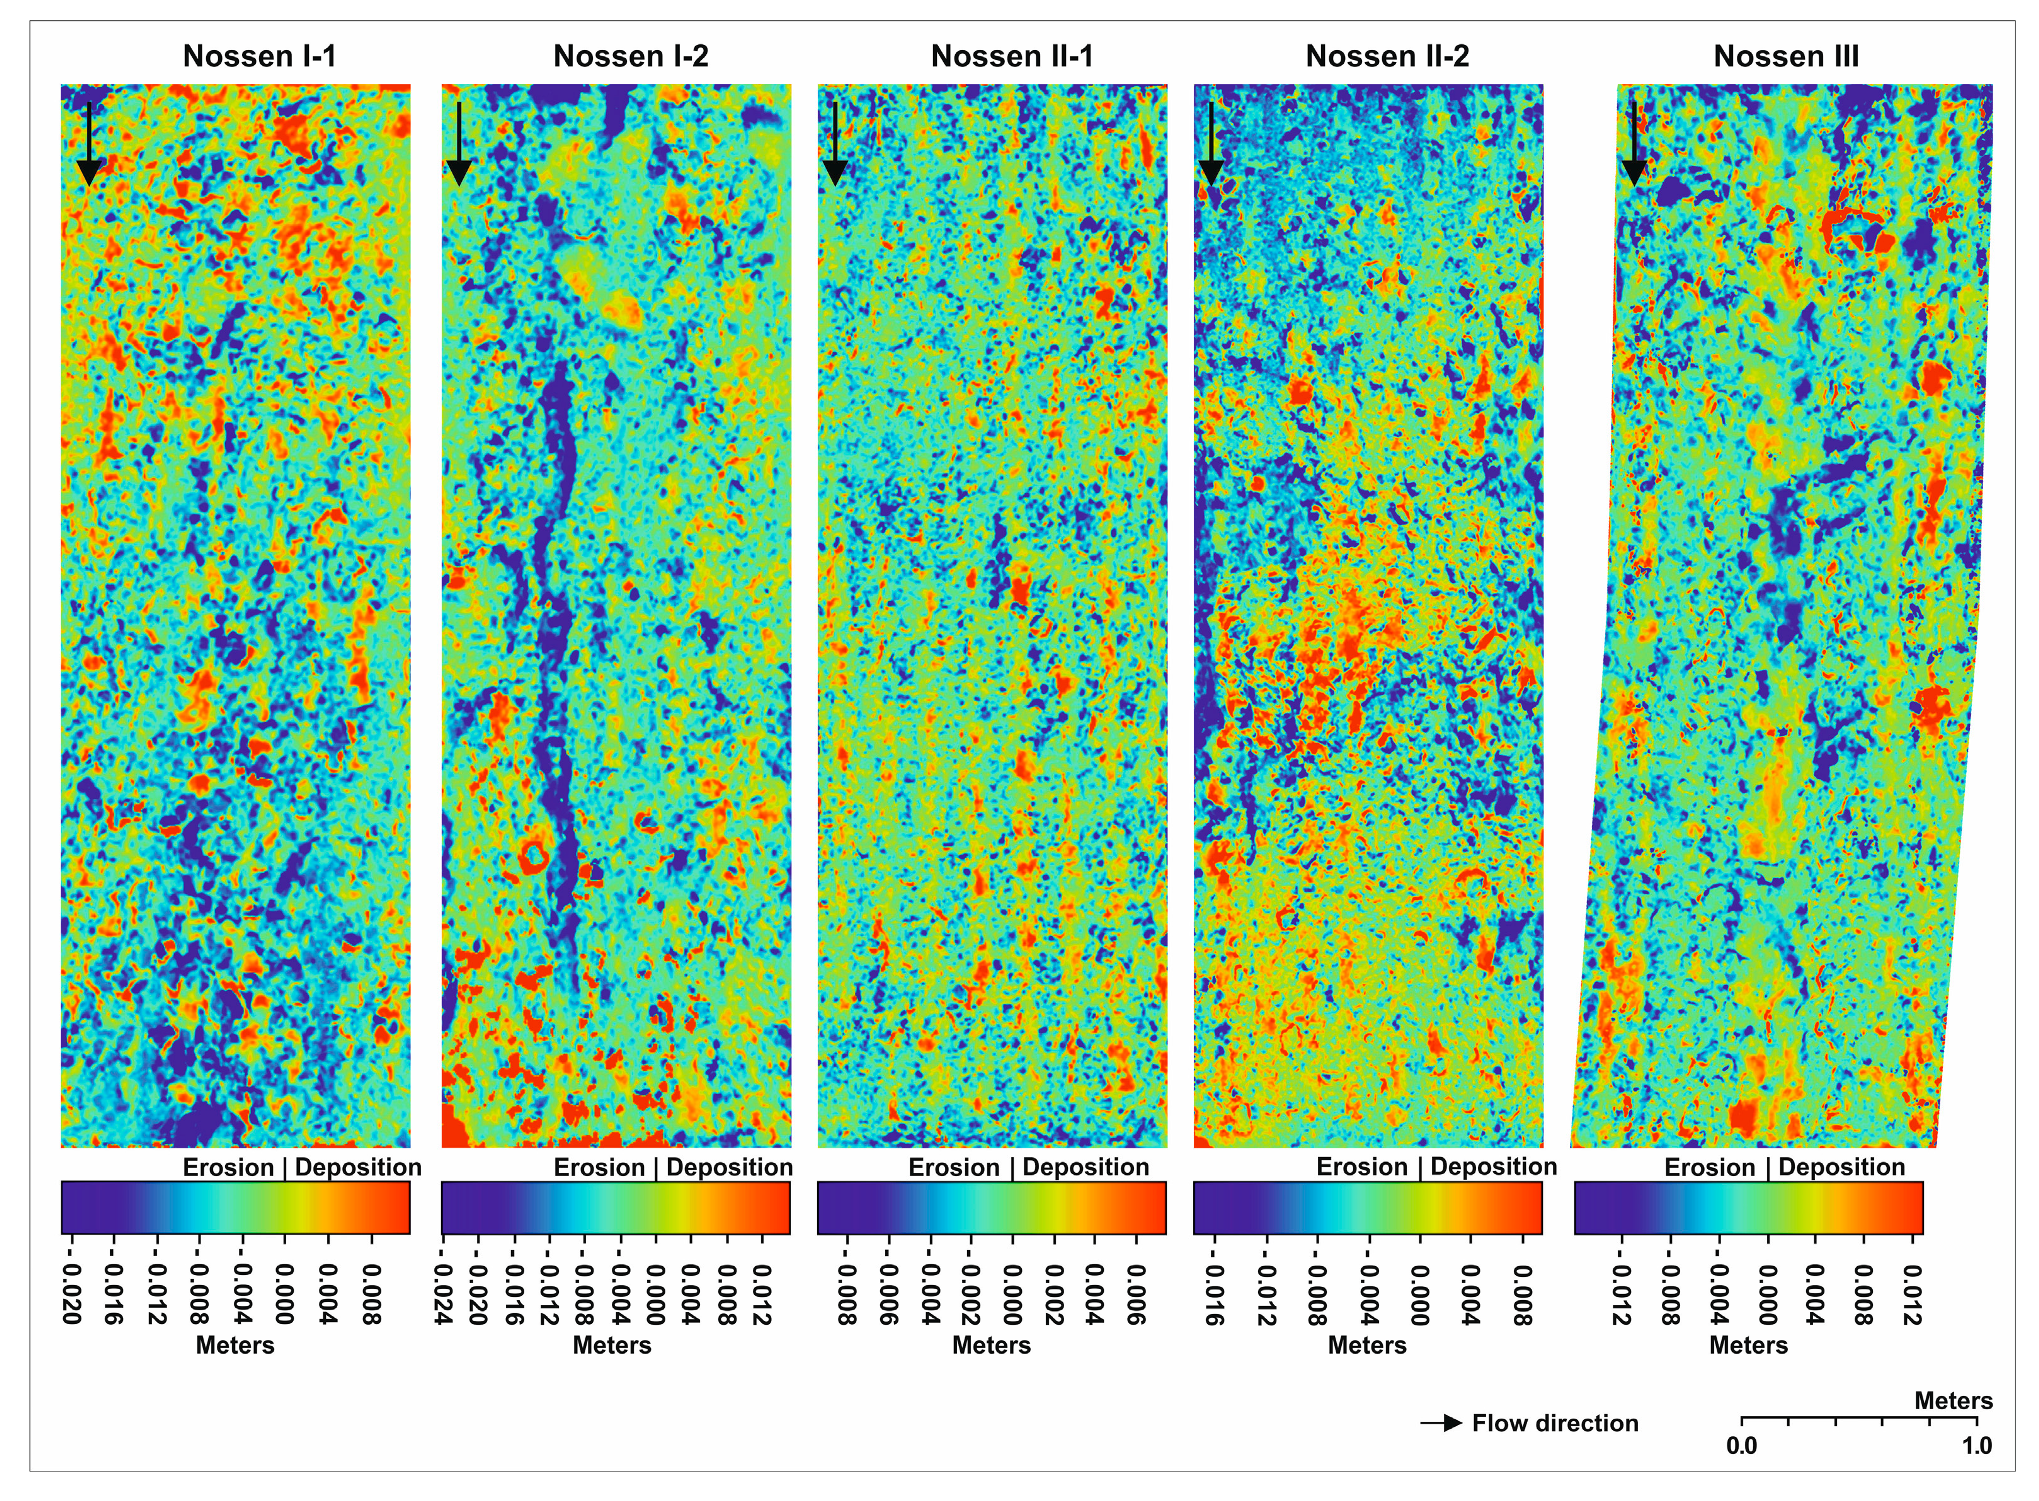
Surface changes with sub-mm resolution could be detected for all of the three ploughed and the two cultivator-plots, ranging from −24.28 mm to 15.01 mm (
Figure 7). However, these values are not corrected yet by accounting for the LoD due to individual random DEM errors and, hence, should be considered carefully.
The fine rills at the cultivator-plots (Nossen I-1, Nossen II-1) are almost completely filled with sediments, whereas the brighter ploughed rill of the Nossen I-2 plot is eroded up to 2.4 cm. The displacement of larger soil crumbs can be observed in all plots.
Nossen II-1 needs to be examined separately due to a possible systematic error because a dome effect (e.g., [
48]) seems to be given. The upper and lower plot parts are significantly stronger changing than the middle part, which is not solely explainable by surface change due to erosion. This potential error can be a consequence of too few GCPs.
3.2.3. Comparison of the Soil Loss Values
Comparing the soil loss values measured from soil sampling with the yet uncorrected soil loss calculated by DoD (
Table 3) highlights that the deviations between those two approaches are higher for the first and second experiments (Nossen I and II) than during the last case study (Nossen III). Solely the soil loss values of the Nossen III-experiment seem to coincide.
Thus, the deviations between the soil loss by sampling and the soil loss by DoD are higher for the first GCP approach than for the second one. This indicates that GCP approach No. 1 is not as reliable as GCP approach No. 2. Generally, GCP approach No. 3 seems to be the most reliable one.
3.2.4. LoD and Corrected Soil Loss by DoD
So far, the examination of the DoDs is conducted without considering potential error propagation. However, this is necessary if reliable comparison of soil sampling approaches with soil surface change values from 3D-reconstructed surfaces are sought. The accuracy potential of SfM photogrammetry must be considered. Thus, to estimate the LoD of the DoDs, the accuracy of the pre- and post-event model needs to be known. However, this performance evaluation can only be done for the Nossen III plot because only during this experiment a sufficient amount of GCPs or scales were available to use some of them as check points or check scales, respectively, which are not considered during the 3D reconstruction and are thus only used as final points of comparison to the 3D model.
Table 4 illustrates the difference at the check points and scales and the reconstruction residuals of the GCPs and scales. However, the latter is not as reliable because these points are considered in the reconstruction and thus they are not independent from the final model [
19].
To calculate the resolving propagated error of DEM subtraction, the check point and check scale difference are considered. Thereby, the square root of the sum of the squared individual DEM errors is estimated, which amounts to 3.2 mm for Nossen III. In a further step, this value is used to calculate the LoD of 3.5 mm for a confidence interval of 85% [
46,
47].
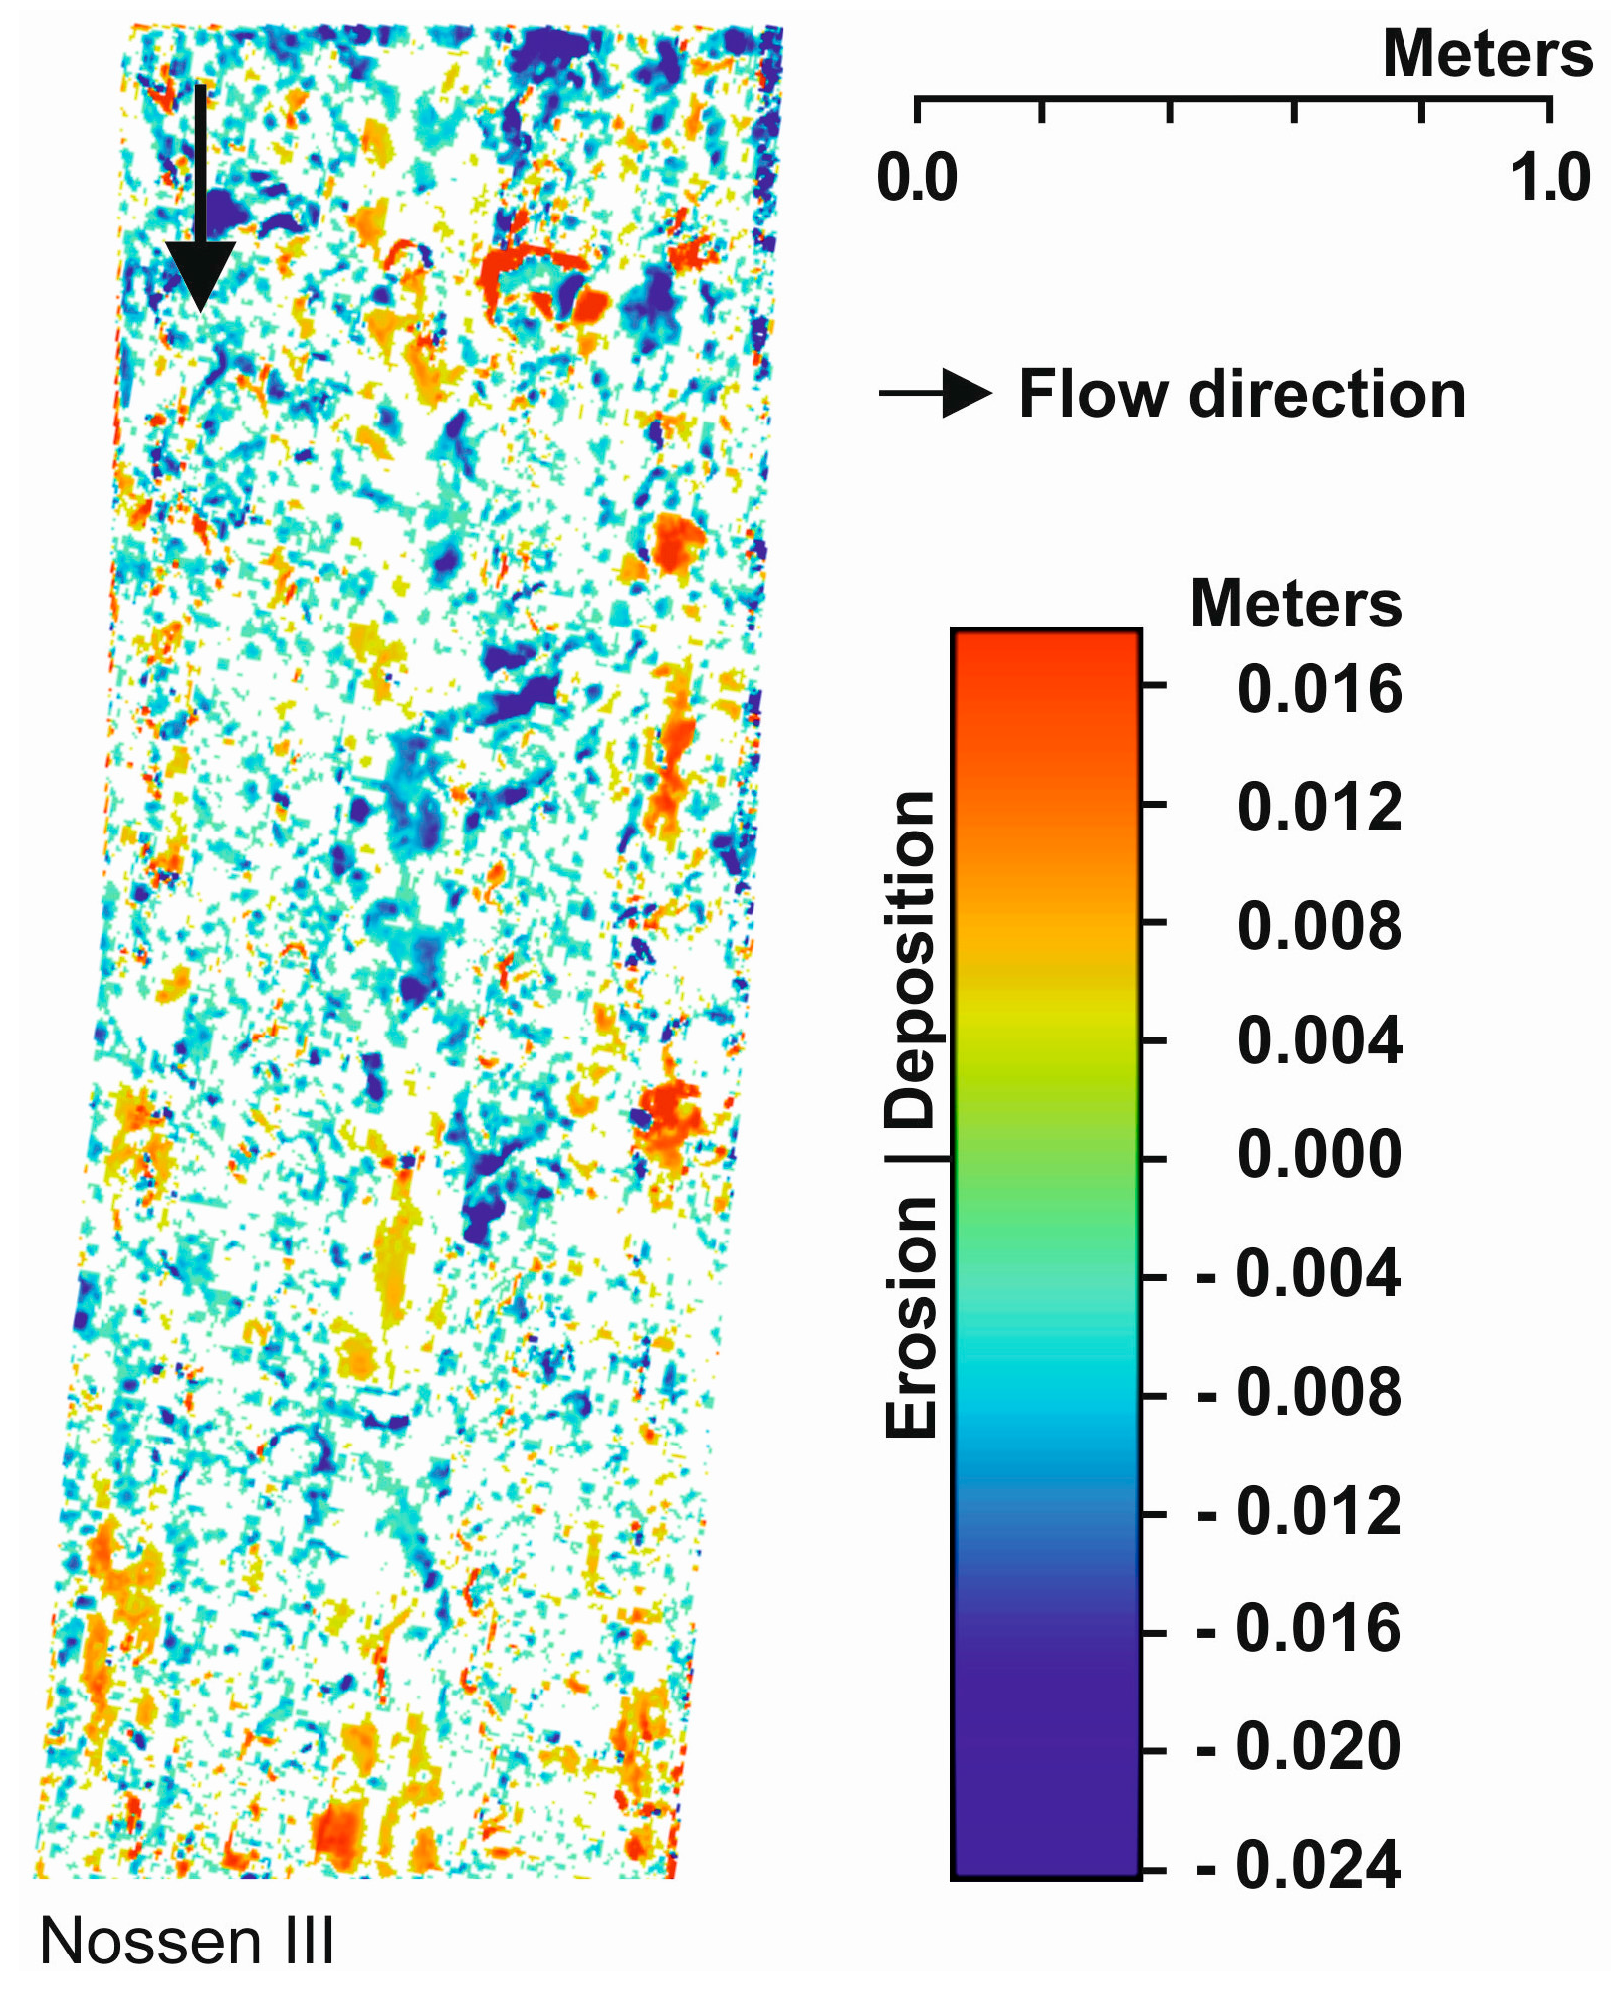
The LoD of 3.5 mm indicates that measurements below this value are considered as noise. Therefore, they are excluded in both directions (positive and negative changes) from the original DoD grid (
Figure 7) in SAGA GIS. For this purpose, the range of grid values of the DoD is reclassified by the LoD value of 3.5 mm in both directions. The resulting grid (
Figure 8) leads to a corrected averaged soil loss by DoD of 3.22 mm for Nossen III.
In comparison to the measured soil loss by sampling of 1.43 mm, the corrected soil loss by DoD of 3.22 mm is higher. Though, the soil surface changes due to soil compaction are included in the latter value and will be separated hereafter.
3.2.5. Calculation of DoD Determined Soil Loss Considering Soil Compaction
The corrected soil loss by DoD for the Nossen III-plot includes the height to which the soil surface lowered due to soil compaction during the rainfall simulation. That height could be separated by calculating the unknown height of the soil surface after the rainfall simulation with:
where
h is the soil height (cm) and
ρb the bulk density (g/cm
3) respectively before and after the rainfall simulation.
The height was 5.00 cm before the experiment and 4.80 cm after. The difference of 0.20 cm is a result of soil compaction.
By subtracting the corrected soil loss by DoD of 3.22 mm and the soil compaction value of 2.00 mm, a DoD-derived soil loss value of 1.22 mm for the Nossen III-plot is received. The soil loss value by sampling (1.43 mm) is higher than that by DoD of 1.22 mm. However, by subtracting the soil loss by DoD from the soil loss by sampling, there only remains a difference of 0.21 mm or 14.7%. These results offer crucial evidence for the inclusion of soil compaction when interpreting DoD determined soil loss in agricultural landscapes.
4. Discussion
The comparison between the two different determined soil losses reveals for the Nossen I and Nossen II campaign a higher soil loss by DoD. Even the more reliable referencing approach of Nossen II results in a similar high soil loss by DoD.
One possible cause for the higher soil loss by DoD of the two campaigns could be the loss of straw residues and their volumes for the Nossen I-1- and Nossen II-1-plot during the rainfall simulation. That height change could result in a higher determined soil loss by DoD. However, these cultivator-plots were minimally covered with straw. Therefore, the assumption that this potential influence could be a marginal error due to straw loss can be excluded, especially as the ploughed plots had no straw residues and further revealed significant differences.
During the rainfall simulation campaign of Nossen I and Nossen II, “out-of-the-plot” splash erosion happened as well as for Nossen III, but was not quantified. In Nossen III, the “out-of-the-plot” splash amounted insignificant 0.35% and thus was excluded from the SfM photogrammetry measurements. For Nossen I and II, it would have been of similar negligible dimensions as for Nossen III due to similar visible soil water contents and precipitation impact. Thus, the splash erosion is also not assumed to be a possible cause of the higher DoD determined soil losses of Nossen I and Nossen II.
Another reason for the higher soil loss by DoD might also be the effect of soil compaction. However, soil bulk densities were only determined for the Nossen II-2-plot during the Nossen II campaign. Bulk density slightly increased after the rainfall simulation (
Figure 6). However, possible surface changes at the Nossen II-2-plot due to soil compaction could not be observed by SfM photogrammetry measurements due to insufficient data accuracy.
Generally, the great difference between measured soil loss by sampling and determined soil loss by SfM photogrammetry measurements (at Nosssen I and II) is most likely due to the referencing issues, resulting in DoDs with insufficient precision.
Naturally, the sampling of suspended sediments during rainfall simulations can be a source of uncertainty for the soil loss by sampling, especially as the temporal resolution during the infiltration experiment is relatively lower than during increased runoff conditions. However, the percentage of the soil loss of the infiltration experiment to the total soil loss is around 8%. Furthermore, the sediment loads were stable. Thus, the effect of possible errors due to sampling on the soil loss by sampling is negligibly small.
Solely, the referencing approach of the Nossen III campaign (GCP approach No. 3) reveals reliable results for the soil loss by DoD. Hence, calculation of soil surface changes due to soil compaction was feasible. The process of soil compaction, neglecting the minimal effect of splash erosion beyond the plot, is crucial for the interpretation of the soil loss by DoD. The soil surface of the Nossen III plot was ploughed one month before the rainfall simulation and was thereby characterized by a loosened soil structure. During this month, total precipitation amounted to 60.3 mm, whereby 37.2 mm were related to a heavy rainfall event just a few days before the rainfall simulation [
49]. Bulk density changes at the Nossen III plot indicated that, even after the prior precipitations, soil density was significantly higher and thus soil surface crucially lowered after the rainfall simulation, also in the compacted tractor lane.
Calculation of soil surface changes due to soil compaction allowed for successful separation of this process from the DoD determined soil loss. Consequently, the measured soil loss by sampling and the soil loss by SfM photogrammetry measurements only differ by 14.7%.
In compliance with a precise referencing approach, it is possible to achieve a reliable soil loss determination, using DoDs calculated with SfM photogrammetry, in agricultural landscapes by rainfall simulation. As any anthropogenic cultivation of an agricultural soil surface, as well as natural process due to precipitation impact and soil water content change the packing of the soil, the determination of soil surface changes due to the soil compaction process has to be included.
5. Conclusions
The results of the comparison between the determined soil loss by DoD and the soil loss measurement using sampling during rainfall simulations solely showed for the Nossen III plot and its reliable referencing approach very good agreement. However, this validation of SfM photogrammetry determined soil loss estimations with rainfall simulation measurements were solely possible due to the consideration of soil compaction processes in agricultural landscapes. As the volume of the tilled and loosened soil during rainfall decreases, resulting soil surface changes were successfully calculated and separated from the total height loss of the soil loss by DoD. The results from this study offer crucial evidence for the inclusion of soil compaction for the interpretation of soil loss estimations using DoDs calculated with SfM photogrammetry in agricultural landscapes.
Nevertheless, although the soil loss by DoD is in the sub-mm range, the LoD of 3.5 mm comprises a soil loss, which could not exactly be detected and quantified. Hence, future research on soil surface changes with high spatial and temporal resolution on plot scale in agricultural landscapes should tackle an even more precise referencing approach with measured and accurate GCP coordinates in the sub-mm range. Moreover, it should be ensured that GCPs are installed at great depths of the soil and they are not influenced by soil compaction. Thus, height changes will not be attributed to the soil loss by DoD. Furthermore, for more precise and differentiated statements on soil compaction, bulk density samples should also be taken from different depths, because soil compaction occurs at greater depths of the tilled soil [
41].
The overall objective of the study was to validate SfM photogrammetry determined soil loss estimations with rainfall simulations. As it was achieved, the proposed method of SfM photogrammetry on soil erosion measurements will not only be interesting for the scientific community of rainfall simulation and soil erosion research, but also applicable for other small-scale geomorphological processes, e.g., frost pull in periglacial landscapes.
Acknowledgments
The present study was only possible due to the financial support of the European Social Fund in the Free State of Saxony (project: doctorate). Finally, the authors would like to thank Claudia Stöcker for her support.
Author Contributions
All authors conceived and designed the experiments; Phoebe Hänsel, Marcus Schindewolf and Anette Eltner performed the experiments; Phoebe Hänsel, Marcus Schindewolf and Anette Eltner analyzed the data; Andreas Kaiser and Jürgen Schmidt contributed analysis tools; Phoebe Hänsel, Marcus Schindewolf and Anette Eltner wrote the paper.
Conflicts of Interest
The authors declare no conflict of interest. The founding sponsors had no role in the design of the study; in the collection, analyses, or interpretation of data; in the writing of the manuscript, and in the decision to publish the results.
Abbreviations
The following abbreviations are used in this manuscript:
| DEM | Digital Elevation Model |
| DoD | Digital Elevation Model of Difference |
| DSLR | Digital Single Lens Reflex Camera |
| GCP | Ground Control Point |
| GSD | Ground Sampling Distance |
| LoD | Level of Detection |
| SfM | Structure from Motion |
| UAV | Unmanned Aerial Vehicle |
References
- Gao, G.; Ma, Y.; Fu, B. Temporal Variations of Flow-Sediment Relationships in a Highly Erodible Catchment of the Loess Plateau, China. Land Degrad. Dev. 2016, 27, 758–772. [Google Scholar] [CrossRef]
- Tian, P.; Zhai, J.; Zhao, G.; Mu, X. Dynamics of Runoff and Suspended Sediment Transport in a Highly Erodible Catchment on the Chinese Loess Plateau. Land Degrad. Dev. 2016, 27, 839–850. [Google Scholar] [CrossRef]
- Eltner, A.; Baumgart, P.; Maas, H.-G.; Faust, D. Multi-temporal UAV data for automatic measurement of rill and interrill erosion on loess soil. Earth Surf. Proc. Land. 2015, 40, 741–755. [Google Scholar] [CrossRef]
- Taguas, E.V.; Guzmán, E.; Guzmán, G.; Vanwalleghem, T.; Gómez, J.A. Characteristics and Importance of Rill and Gully Erosion: A Case Study in a Small Catchment of a Marginal Olive Grove. Cuadernos De Investigacion Geografica 2015, 41, 107–126. [Google Scholar] [CrossRef]
- Rodrigo Comino, J.; Iserloh, T.; Lassu, T.; Cerdà, A.; Keesstra, S.D.; Prosdocimi, M.; Brings, C.; Marzen, M.; Ramos, M.C.; Senciales, J.M.; et al. Quantitative comparison of initial soil erosion processes and runoff generation in Spanish and German vineyards. Sci. Total Environ. 2016, 565, 1165–1174. [Google Scholar] [CrossRef] [PubMed]
- Iserloh, T.; Ries, J.B.; Arnáez, J.J.; Boix-Fayos, C.; Butzen, V.; Cerdà, A.; Echeverría, M.T.; Fernández-Gálvez, J.; Fister, W.; Geißler, C.; et al. European Small Portable Rainfall Simulators: A Comparison of Rainfall Characteristics. CATENA 2013, 110, 100–112. [Google Scholar] [CrossRef]
- Iserloh, T.; Ries, J.B.; Cerdà, A.; Echeverría, M.T.; Fister, W.; Geißler, C.; Kuhn, N.J.; León, F.J.; Peters, P.; Schindewolf, M.; et al. Comparative measurements with seven rainfall simulators on uniform bare fallow land. Zeitschrift für Geomorphologie 2012, 57, 11–26. [Google Scholar] [CrossRef]
- Martínez-Murillo, J.F.; Nadal-Romero, E.; Regüés, D.; Cerdà, A.; Poesen, J. Soil Erosion and Hydrology of the Western Mediterranean Badlands throughout Rainfall Simulation Experiments: A Review. CATENA 2013, 106, 101–112. [Google Scholar] [CrossRef]
- Cerdá, A. Rain simulators and their application to geomorphology: State of the art. Cuad. Inf. Geogr. 1999, 25, 45–84. [Google Scholar]
- Alves Sobrinho, T.; Gómez-Macpherson, H.; Gómez, J.A. A portable integrated rainfall and overland flow simulator. Soil Use Manag. 2008, 24, 163–170. [Google Scholar] [CrossRef]
- Martínez-Mena, M.; Castillo, V.; Albaladejo, J. Relations between interrill erosion processes and sediment particle size distribution in a semiarid Mediterranean area of SE of Spain. Geomorphology 2002, 45, 261–275. [Google Scholar] [CrossRef]
- Seeger, M. Uncertainty of factors determining runoff and erosion processes as quantified by rainfall simulations. CATENA 2007, 71, 56–67. [Google Scholar] [CrossRef]
- Stroosnijder, L. Measurement of erosion: Is it possible? CATENA 2005, 64, 162–173. [Google Scholar] [CrossRef]
- Vahabi, J.; Nikkami, D. Assessing dominant factors affecting soil erosion using a portable rainfall simulator. Int. J. Sediment Res. 2008, 23, 376–386. [Google Scholar] [CrossRef]
- Kavka, P.; Dostál, T.; Iserloh, T.; Davidová, T.; Krása, J.; David, V.; Vopravil, J.; Khel, T.; Bauer, M. A large scale mobile rainfall simulator for experiments on soil erosion and soil hydrology. In Geophysical Research Abstracts 17, Proceedings of the EGU General Assembly 2015, Vienna, Austria, 12–17 April 2015.
- Knapen, A.; Poesen, J.; Govers, J.; Gyssels, G.; Nachtergaele, J. Resistance of soils to concentrated flow erosion: A review. Earth Sci. Rev. 2007, 80, 75–109. [Google Scholar] [CrossRef]
- Schindewolf, M.; Schmidt, J. Parameterization of the EROSION 2D/3D soil erosion model using a small-scale rainfall simulator and upstream runoff simulation. CATENA 2012, 91, 47–55. [Google Scholar] [CrossRef]
- Michael, A. Anwendung des Physikalisch Begründeten Erosionsprognosemodells EROSION 2D/3D—Empirische Ansätze zur Ableitung der Modellparameter. Ph.D. Thesis, TU Bergakademie Freiberg, Freiberg, Germany, 2000. [Google Scholar]
- Eltner, A.; Kaiser, A.; Castillo, C.; Rock, G.; Neugirg, F.; Abellán, A. Image-based surface reconstruction in geomorphometry—Merits, limits and developments. Earth Surf. Dyn. 2016, 4, 359–389. [Google Scholar] [CrossRef]
- Kaiser, A.; Neugirg, F.; Rock, G.; Müller, C.; Haas, F.; Ries, J.; Schmidt, J. Small-Scale Surface Reconstruction and Volume Calculation of Soil Erosion in Complex Moroccan Gully Morphology Using Structure from Motion. Remote Sens. 2014, 6, 7050–7080. [Google Scholar] [CrossRef]
- Eltner, A.; Baumgart, P. Accuracy constraints of terrestrial Lidar data for soil erosion measurement: Application to a Mediterranean field plot. Geomorphology 2015, 245, 243–254. [Google Scholar] [CrossRef]
- Micheletti, N.; Chandler, J.H.; Lane, S.N. Structure from Motion (SfM) Photogrammetry. In Geomorphological Techniques (Online Edition); Cook, S.J., Clarke, L.E., Nield, J.M., Eds.; British Society of Geomorphology: London, UK, 2015. [Google Scholar]
- Smith, M.W.; Carrivick, J.L.; Quincey, D.J. Structure from motion photogrammetry in physical geography. Prog. Phys. Geogr. 2015, 1–29. [Google Scholar] [CrossRef]
- Castillo, C.; James, M.R.; Redel-Macías, M.D.; Pérez, R.; Gómez, J.A. SF3M software: 3-D photo-reconstruction for nonexpert users and its application to a gully network. SOIL 2015, 1, 583–594. [Google Scholar] [CrossRef]
- Castillo, C.; Taguas, E.V.; Zarco-Tejada, P.; James, M.R.; Gómez, J.A. The normalized topographic method: An automated procedure for gully mapping using GIS. Earth Surf. Proc. Land. 2014, 39, 2002–2015. [Google Scholar] [CrossRef]
- Castillo, C.; Pérez, R.; James, M.R.; Quinton, J.N.; Taguas, E.V.; Gómez, J.A. Comparing the Accuracy of Several Field Methods for Measuring Gully Erosion. Soil Sci. Soc. Am. J. 2012, 76, 1319–1332. [Google Scholar] [CrossRef]
- Frankl, A.; Stal, C.; Abraha, A.; Nyssen, J.; Rieke-Zapp, D.; De Wulf, A.; Poesen, J. Detailed recording of gully morphology in 3-D through image-based modelling. CATENA 2015, 127, 92–101. [Google Scholar] [CrossRef]
- Gómez-Gutiérrez, Á.; Schnabel, S.; Berenguer-Sempere, F.; Lavado-Contador, F.; Rubio-Delgado, J. Using 3-D photoreconstruction methods to estimate gully headcut erosion. CATENA 2014, 120, 91–101. [Google Scholar] [CrossRef]
- Stöcker, C.; Eltner, A.; Karrasch, P. Measuring gullies by synergetic application of UAV and close range photogrammetry—A case study from Andalusia, Spain. CATENA 2015, 132, 1–11. [Google Scholar] [CrossRef]
- Smith, M.W.; Vericat, D. From experimental plots to experimental landscapes: Topography, erosion and deposition in subhumid badlands from Structure-from-Motion photogrammetry. Earth Surf. Proc. Landf. 2015, 40, 1656–1671. [Google Scholar] [CrossRef]
- Nouwakpo, S.K.; James, M.R.; Weltz, M.A.; Huang, C.-H.; Chagas, I.; Lima, L. Evaluation of structure from motion for soil microtopography measurement. Photogramm. Rec. 2014, 29, 297–316. [Google Scholar] [CrossRef]
- Nouwakpo, S.K.; Weltz, M.A.; McGwire, K. Assessing the performance of Structure-from-Motion photogrammetry and terrestrial lidar for reconstructing soil surface microtopography of naturally vegetated plots. Earth Surf. Proc. Land. 2015, 41, 308–322. [Google Scholar] [CrossRef]
- Snapir, B.; Hobbs, S.; Waine, T.W. Roughness measurements over an agricultural soil surface with Structure from Motion. ISPRS J. Photogramm. 2014, 96, 210–223. [Google Scholar] [CrossRef]
- Kaiser, A.; Neugirg, F.; Haas, F.; Schmidt, J.; Becht, M.; Schindewolf, M. Determination of hydrological roughness by means of close range remote sensing. SOIL 2015, 1, 613–620. [Google Scholar] [CrossRef]
- Prosdocimi, M.; Burguet, M.; Di Prima, S.; Sofia, G.; Terol Esparza, E.; Rodrigo Comino, J.; Cerdà, A.; Tarolli, P. Rainfall simulation and Structure-from-Motion photogrammetry for the analysis of soil water erosion in Mediterranean vineyards. Sci. Total Environ. 2017, 574, 204–215. [Google Scholar] [CrossRef] [PubMed]
- Geoportal Sachsenatlas. Available online: https://geodienste.sachsen.de/wms_geosn_dop-rgb/guest? (accessed on 29 July 2016).
- Zimmermann, T. Effekte der Kinetischen Energie Natürlicher Starkregen—Konsequenzen für die Technische Gestaltung von Regensimulatoren zur Kleinflächigen Infiltrationsmessung; Institut für Hydrologie und Wasserwirtschaft, Universität Karlsruhe: Karlsruhe, Germany, 1989. [Google Scholar]
- Hassel, J.M.; Richter, G. Ein Vergleich deutscher und schweizerischer Regensimulatoren nach Regenstruktur und kinetischer Energie. Zeitschrift für Pflanzenernährung und Bodenkunde 1992, 155, 185–190. [Google Scholar] [CrossRef]
- Schmidt, J. Wasserhaushalt und Feststofftransport an Geneigten, Landwirtschaftlich Bearbeiteten Nutzflächen. Ph.D. Thesis, Freie Universität Berlin, Berlin, Germany, 1988. [Google Scholar]
- Blume, H.-P.; Brümmer, G.W.; Fleige, H.; Horn, R.; Kandeler, E.; Kögel-Knabner, I.; Kretzschmar, R.; Stahr, K.; Wilke, B.-M. Scheffer/Schachtschabel Soil Science, 1st ed.; Springer: Berlin/Heidelberg, Germany, 2016. [Google Scholar]
- Schmidt, J. Entwicklung und Anwendung eines Physikalisch Begründeten Simulationsmodells für die Erosion Geneigter Landwirtschaftlicher Nutzflächen; des Inst. für Geographische Wissenschaften: Berlin, Germany, 1996. [Google Scholar]
- DIN EN ISO 11272, 2014-06: Bodenbeschaffenheit—Bestimmung der Trockenrohdichte (ISO 11272:1998). Beuth Verlag GmbH: Berlin, Germany, June 2014; p. 15.
- Agisoft PhotoScan. Available online: http://www.agisoft.com/downloads/user-manuals/ (accessed on 29 October 2015).
- James, L.A.; Hodgson, M.E.; Ghoshal, S.; Latiolais, M.M. Geomorphic change detection using historic maps and DEM differencing: The temporal dimension of geospatial analysis. Geomorphology 2012, 137, 181–198. [Google Scholar] [CrossRef]
- SAGA GIS 2013, version 2.1.0. Available online: https://sourceforge.net/projects/saga-gis/files/SAGA%20-%202.1/SAGA%202.1.0/ (accessed on 29 October 2015).
- Lane, S.; Westaway, R.; Hicks, D. Estimation of erosion and deposition volumes in a large, gravel-bed, braided river using synoptic remote sensing. Earth Surf. Proc. Land. 2003, 28, 249–271. [Google Scholar] [CrossRef]
- Brasington, J.; Langham, J.; Rumsby, B. Methodological sensitivity of morphometric estimates of coarse fluvial sediment transport. Geomorphology 2003, 53, 299–316. [Google Scholar] [CrossRef]
- Eltner, A.; Schneider, D. Analysis of Different Methods for 3-D Reconstruction of Natural Surfaces from Parallel-Axes UAV Images. Photogramm. Rec. 2015, 30, 279–299. [Google Scholar] [CrossRef]
- Agrarmeteorologisches Messnetz Sachsen—Wetterdaten. Available online: https://www.landwirtschaft.sachsen.de/Wetter09/asp/inhalt.asp?seite=uebersicht (accessed on 29 July 2016).
© 2016 by the authors; licensee MDPI, Basel, Switzerland. This article is an open access article distributed under the terms and conditions of the Creative Commons Attribution (CC-BY) license (http://creativecommons.org/licenses/by/4.0/).
