1. Introduction
Access to safe drinking water remains a central public health concern and a key requirement for sustainable water management. Although groundwater is often perceived as a naturally protected resource, its quality may vary substantially depending on geological substrate, recharge conditions, hydrological dynamics, seasonal influences, and potential contamination sources [
1,
2,
3]. By contrast, the physicochemical profile of treated municipal water reflects both source-water characteristics and treatment processes.
Within the European Union, drinking-water quality is regulated under Directive (EU) 2020/2184, which reinforces a risk-based approach to water intended for human consumption [
4]. In Portugal, this framework was transposed into national legislation by Decree-Law No. 69/2023, which defines quality requirements, monitoring obligations, and the responsibilities of entities involved in water-supply management [
5]. In this context, water supplied through public distribution systems is generally subject to treatment, monitoring, and regulatory control. Decentralized groundwater sources may require greater attention where treatment, monitoring, user responsibilities, and institutional oversight are less structured [
6]. Comparative assessments of treated municipal water and decentralized groundwater can therefore provide useful information on source-specific differences, stability, and variability under contrasting supply conditions.
In recent years, Internet of Things (IoT) technologies have emerged as promising tools for water-quality monitoring [
7,
8,
9,
10]. By enabling automated, networked, and relatively low-cost data acquisition, these systems can support more frequent and structured measurements in contexts where conventional monitoring is often based on discrete sampling. IoT-based systems have been applied to parameters such as pH, electrical conductivity, temperature, total dissolved solids, and turbidity [
11,
12,
13].
The application of IoT-based systems to water-quality assessment has expanded worldwide, supported by advances in low-cost sensors, wireless communication, automated data storage, and remote access to measurements. Previous studies [
9,
14,
15,
16] have reported IoT applications in drinking-water monitoring, water-treatment plants, surface waters, and rural or semi-rural water-supply systems. These studies showed the potential of IoT systems to improve data acquisition and operational awareness. However, their value depends on sensor calibration, data reliability, deployment duration, maintenance, and the specific monitoring objective. Although limitations remain regarding calibration, long-term stability, and interoperability, recent studies have highlighted the potential of IoT systems for centralized and integrated water-quality monitoring applications [
17,
18]. In comparative studies, their relevance lies not only in remote data transmission but also in the possibility of applying the same monitoring framework to different water sources under comparable conditions [
9,
10]. Repeated measurements can help identify short-term variability and temporal patterns that may be missed by isolated spot sampling, including in groundwater settings [
19,
20,
21].
Bragança, in northeastern Portugal, provides an appropriate setting for this comparison. The city combines a regulated public water supply based on treated surface-water-derived municipal water with a decentralized groundwater source serving part of the local higher education campus. This context makes it possible to compare treated municipal water and decentralized groundwater under the same monitoring framework and local environmental conditions. Available information on the groundwater source serving the campus remains scarce and is largely limited to occasional water-quality analyses. To the authors’ best knowledge, this appears to be the first application of an IoT-supported comparative approach to treated municipal water and decentralized groundwater under the same local conditions in this region. Given that IoT-based water-quality monitoring has already been widely reported, the contribution of this study does not lie in proposing a new IoT architecture. Instead, it lies in applying a standardized IoT-supported monitoring framework to two contrasting drinking-water supply contexts under the same local conditions. Therefore, this study aimed to compare the physicochemical characteristics and short-term measurement profiles of treated municipal water and decentralized groundwater in Bragança, with particular attention to physicochemical stability, mineralization, redox conditions, variability among sampling points and campaigns, and the usefulness of repeated short-interval measurements as a complementary tool for water-quality assessment and management.
2. Materials and Methods
This section describes the procedures used for the comparative assessment of drinking-water quality from different sources in Bragança, Portugal. It includes the study area, the monitored water sources, the sampling points, the monitoring campaigns, and the methods used to measure physicochemical and microbiological parameters. The data acquisition system, statistical analyses, and criteria adopted to support measurement reliability are also presented. Together, these elements provide a framework for the consistent and comparable evaluation of treated surface-water-derived municipal water and groundwater.
2.1. Study Area
Bragança is a medium-sized city located in northeastern Portugal (41°48′10″ N, 6°45′25″ W; 673 m a.s.l.), with 34,582 inhabitants [
22]. The region is characterized by a predominantly continental climate with Mediterranean influence. The mean annual precipitation in Bragança is 783.9 mm, with rainfall concentrated mainly in autumn and winter [
23]. The treated municipal water evaluated in this study is derived from surface water stored in the Serra Serrada reservoir, located in a predominantly granitic setting in northeastern Portugal [
24]. The groundwater source corresponds to a local decentralized abstraction system in the Bragança area, within a regional geological context that includes granitic and metasedimentary units [
25].
2.2. Study Design and Water Supply Contexts
This study followed a comparative observational design based on repeated monitoring of two types of drinking-water sources in Bragança, Portugal. The first source corresponded to treated municipal water derived from surface water and distributed through the public supply system. This source was monitored at two treated-water points: the outlet of the water treatment plant (ETA) and the distribution reservoir (MAE). The second source corresponded to groundwater from a decentralized supply system, monitored at three indoor sampling points located on the local higher education campus: ESA, ESE, and ESTIG. The characterization of the sampling points is presented in
Table 1.
Monitoring campaigns were conducted between January and March 2026. Publicly available municipal drinking-water quality reports for 2023–2025, issued by the local water supplier, were consulted to provide background information for the treated municipal supply [
26]. Microbiological analyses were performed only on groundwater samples because the decentralized supply system is not subject to the same centralized treatment, routine monitoring, and operational control as the public supply. According to Portuguese legislation [
5], water intended for human consumption must be free from fecal indicator microorganisms, including
Escherichia coli, intestinal enterococci, and
Clostridium perfringens. These analyses were used as supplementary evidence to support the assessment of groundwater quality, while the treated municipal supply was contextualized using the available historical monitoring records.
2.3. Monitoring System
Comparative monitoring was performed using a portable multiparameter meter (HI98195, Hanna Instruments [
27]) integrated into an IoT-enabled data acquisition workflow. The same equipment and monitoring approach were applied to both water-source types to ensure comparability between the treated municipal water and groundwater datasets. The system was used to measure pH, electrical conductivity (EC), temperature (TEMP), oxidation–reduction potential (ORP), and total dissolved solids (TDS). To minimize stagnation effects and ensure representative hydraulic conditions, the probe was installed in a flow-through chamber directly connected to the water supply line, allowing water renewal during each monitoring session. In the public supply system, a DULCOMETER diaLog DACb (ProMinent) was also available as part of the operational monitoring infrastructure. This equipment was used only as a supplementary reference to assess the consistency of the measurements obtained with the portable multiparameter meter. The IoT architecture enabled automated data acquisition, local storage, remote transmission via MQTT and HTTP, and timestamp synchronization via NTP (Network Time Protocol). Data transfer from the multiparameter meter to the remote database was supported by a middleware routine that organized the raw logged data into structured files before transmission, reducing manual handling and supporting a consistent data workflow. The data were stored in an MySQL database and subsequently processed in Python 3 using the Pandas, NumPy, and SciPy libraries. In the present study, the IoT component was used to support automated data transfer, storage, timestamping, and data organization rather than real-time operational decision-making or automated alert generation.
Each of the five sampling points was monitored during three campaigns, with repeated readings taken at 10 s intervals over approximately 10 min monitoring windows. The final dataset used for analysis is reported in
Table A1. This campaign-based design was intended to obtain short-term physicochemical profiles under comparable field conditions rather than to characterize long-term temporal dynamics.
2.4. Sensor Calibration and Quality Control
Calibration and quality-control procedures were applied before each monitoring campaign to support data reliability and comparability among sampling points. The HI98195 multiparameter meter was calibrated according to the manufacturer’s instructions using standard solutions for pH, EC, and ORP. The pH sensor was calibrated using pH 4.01, 7.01, and 10.01 buffer solutions; electrical conductivity was calibrated using a 1413 µS cm−1 standard solution; and ORP was checked using a 240 mV standard solution at 25 °C. Temperature readings were verified against a reference thermometer to support automatic temperature compensation. Sensor stabilization and thermal equilibrium with the calibration standards were ensured before accepting calibration readings. These procedures followed the manufacturer’s calibration guidance and were applied consistently before each campaign. To reduce methodological variability, the same instrument, flow-through configuration, monitoring procedure, calibration approach, and data-treatment workflow were applied to both treated municipal water and groundwater. During each monitoring session, the flow-through chamber allowed water renewal around the probe, minimizing stagnation effects and helping to maintain representative hydraulic conditions. The repeated short-interval readings were therefore interpreted as internally consistent measurements for comparative assessment, while recognizing that they do not replace laboratory-based confirmation or long-term regulatory monitoring.
The meter provides a pH resolution of 0.01 pH with an accuracy of ±0.02 pH, an ORP resolution of 0.1 mV with an accuracy of ±1.0 mV, and a temperature resolution of 0.01 °C with an accuracy of ±0.15 °C. For EC, the specified accuracy is ±1% of the reading or ±1 µS cm
−1, whichever is greater. TDS values were derived from conductivity measurements using the instrument’s conversion settings and were therefore interpreted as calculated estimates rather than independent measurements. Further technical information on calibration procedures, good laboratory practice records, automatic temperature compensation, and sensor specifications is available in the manufacturer’s documentation [
27].
2.5. Data Treatment and Statistical Analysis
Descriptive statistics were used to summarize the monitored physicochemical parameters, including mean, median, standard deviation, minimum, maximum, quartiles, and coefficient of variation. These metrics were calculated by sampling point, monitoring campaign, and water-source group to support the comparison between treated municipal water and groundwater. Data distribution was assessed using the Shapiro–Wilk test, and differences between water-source groups were evaluated using Student’s
t-test or the Mann–Whitney U test, depending on normality. Correlations among physicochemical parameters were analyzed using Spearman’s rank correlation coefficients, and statistical significance was considered at α = 0.05 [
28].
Given the short duration of each monitoring window and the campaign-based nature of the dataset, the analysis was restricted to descriptive statistics, exploratory group comparisons, and correlation analysis. Time-series, trend-detection, and predictive modeling approaches were not applied because the dataset was not designed to characterize long-term temporal dynamics or support operational forecasting. This statistical approach was therefore aligned with the main objective of comparing short-term physicochemical profiles obtained under comparable field conditions in two distinct drinking-water supply contexts.
3. Results and Discussion
This section presents the comparative results for treated surface-water-derived municipal water and groundwater in Bragança, Portugal, focusing on physicochemical characteristics, microbiological quality, statistical differences, short-term campaign-based variability, and parameter relationships. The analysis highlights contrasts in mineralization, redox conditions, stability, and heterogeneity between the regulated municipal supply and the naturally more variable decentralized groundwater sources. Given the short duration of each monitoring window, the results are interpreted as short-term physicochemical profiles obtained under comparable field conditions rather than as evidence of long-term temporal dynamics.
3.1. Physicochemical Characterization of the Two Water Sources
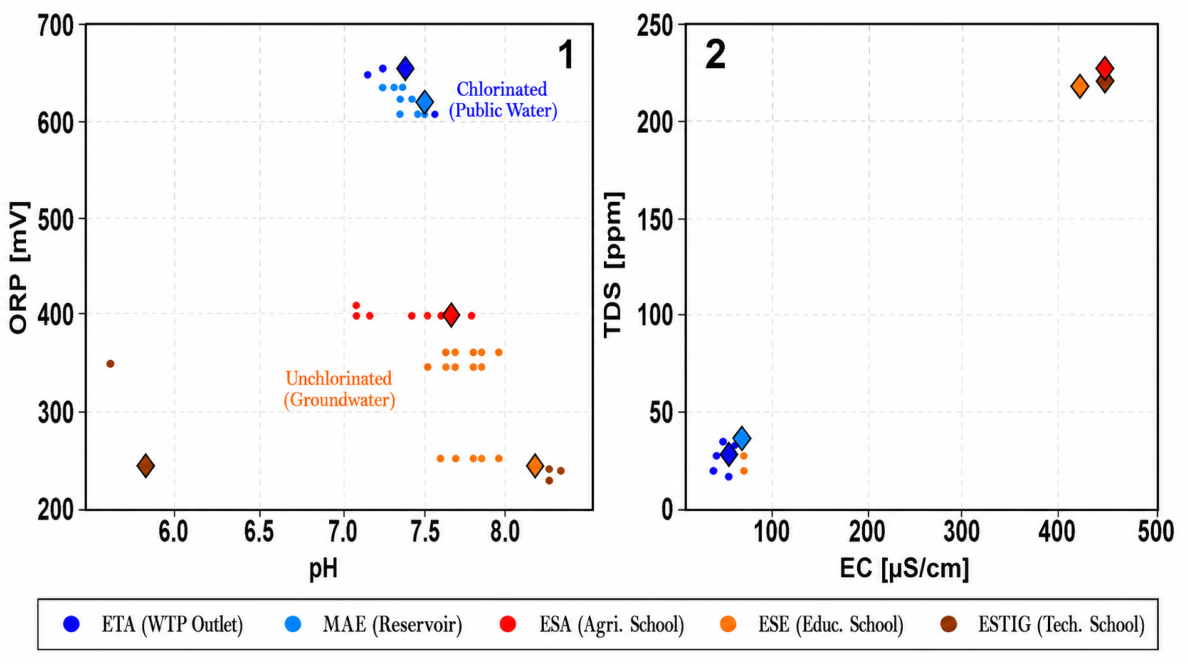
Treated municipal water from the public supply system and groundwater from the decentralized supply system showed clear physicochemical differences. Treated municipal water displayed a narrower range of variation, with pH values between 7.35 and 7.58, EC between 32 and 57 µS cm
−1, TDS between 21 and 37 ppm, ORP between 620 and 667 mV, and temperature between 18.50 and 22.10 °C. By comparison, groundwater showed wider variation, with pH ranging from 5.65 to 8.22, EC from 54 to 470 µS cm
−1, TDS from 25 to 235 ppm, ORP from 220.6 to 408.1 mV, and temperature from 12.74 to 23.28 °C. Overall, groundwater exhibited markedly higher EC and TDS values, indicating greater mineralization, whereas treated municipal water showed substantially higher ORP values and lower physicochemical variability (
Table A1 and
Table A2,
Appendix A). The lower EC and TDS values in treated municipal water are mainly consistent with its surface-water origin and lower mineralization, as discussed by [
24], whereas the narrower ranges of variation and higher ORP values reflect the operational control and disinfection conditions associated with the public supply system. These patterns are illustrated in
Figure 1.
As complementary information, microbiological analyses were performed only on groundwater samples collected in March 2026. The results were consistent with the Portuguese legal requirements for water intended for human consumption, with no fecal indicator microorganisms detected [
5]. However, because microbiological monitoring was limited to a single sampling moment, these results should be interpreted cautiously and cannot be extrapolated to long-term microbiological safety. This cautious interpretation is consistent with the regional baseline provided by [
29], who reported higher microbiological conformity in treated than in non-treated waters in the Bragança district. In this context, ORP provided useful complementary information because redox conditions can influence microbial persistence in water systems and may help identify situations where additional treatment or disinfection control should be considered. Higher ORP values in treated municipal water indicate more oxidizing conditions, generally associated with more effective disinfection environments, whereas lower ORP values in groundwater suggest the absence of a comparable oxidative barrier, as discussed by [
30]. However, the higher ORP observed in treated municipal water may also reflect the initial redox characteristics of the surface-water source and possible oxidative or aeration steps during treatment. Because raw-water ORP and treatment-stage-specific measurements were not available, these factors cannot be isolated in the present study.
3.2. Correlation Patterns and Short-Term Variability
Exploratory group comparisons indicated significant differences between treated municipal water and groundwater for all monitored parameters (
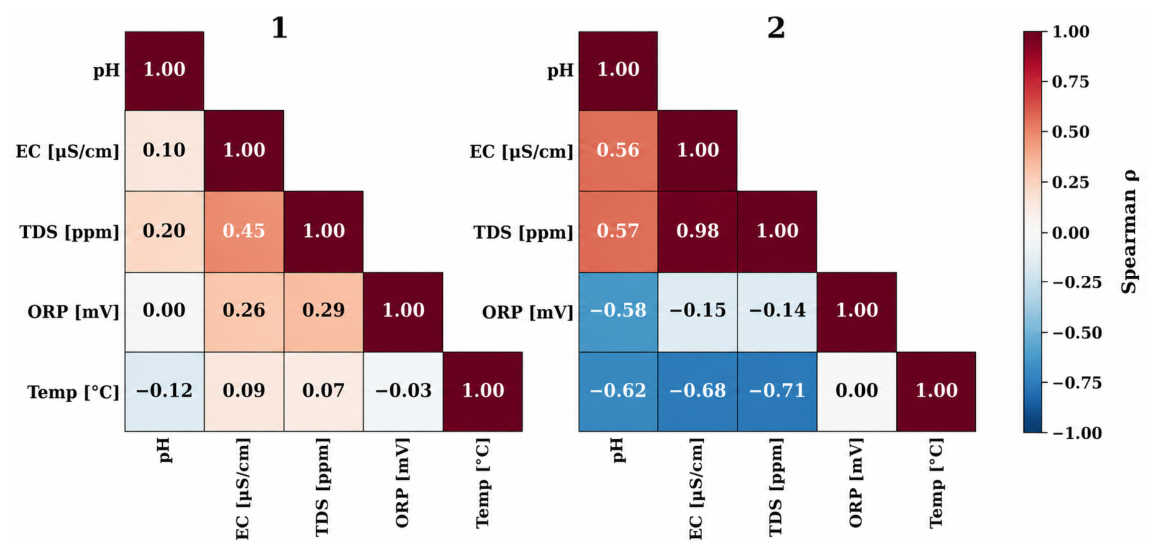
p < 0.05), with the strongest contrasts observed for EC, TDS, and ORP. The Spearman correlation matrices (
Figure 2) provided additional insight into the internal structure of the dataset. Strong positive correlations between EC and TDS were observed in both supply types, as expected for two mineralization-related parameters. However, because TDS values were derived from conductivity measurements, this relationship should be interpreted mainly as a consistency check rather than as evidence of an independent hydrochemical process. In groundwater, the generally more heterogeneous correlation patterns were consistent with the broader physicochemical variability observed among ESA, ESE, and ESTIG.
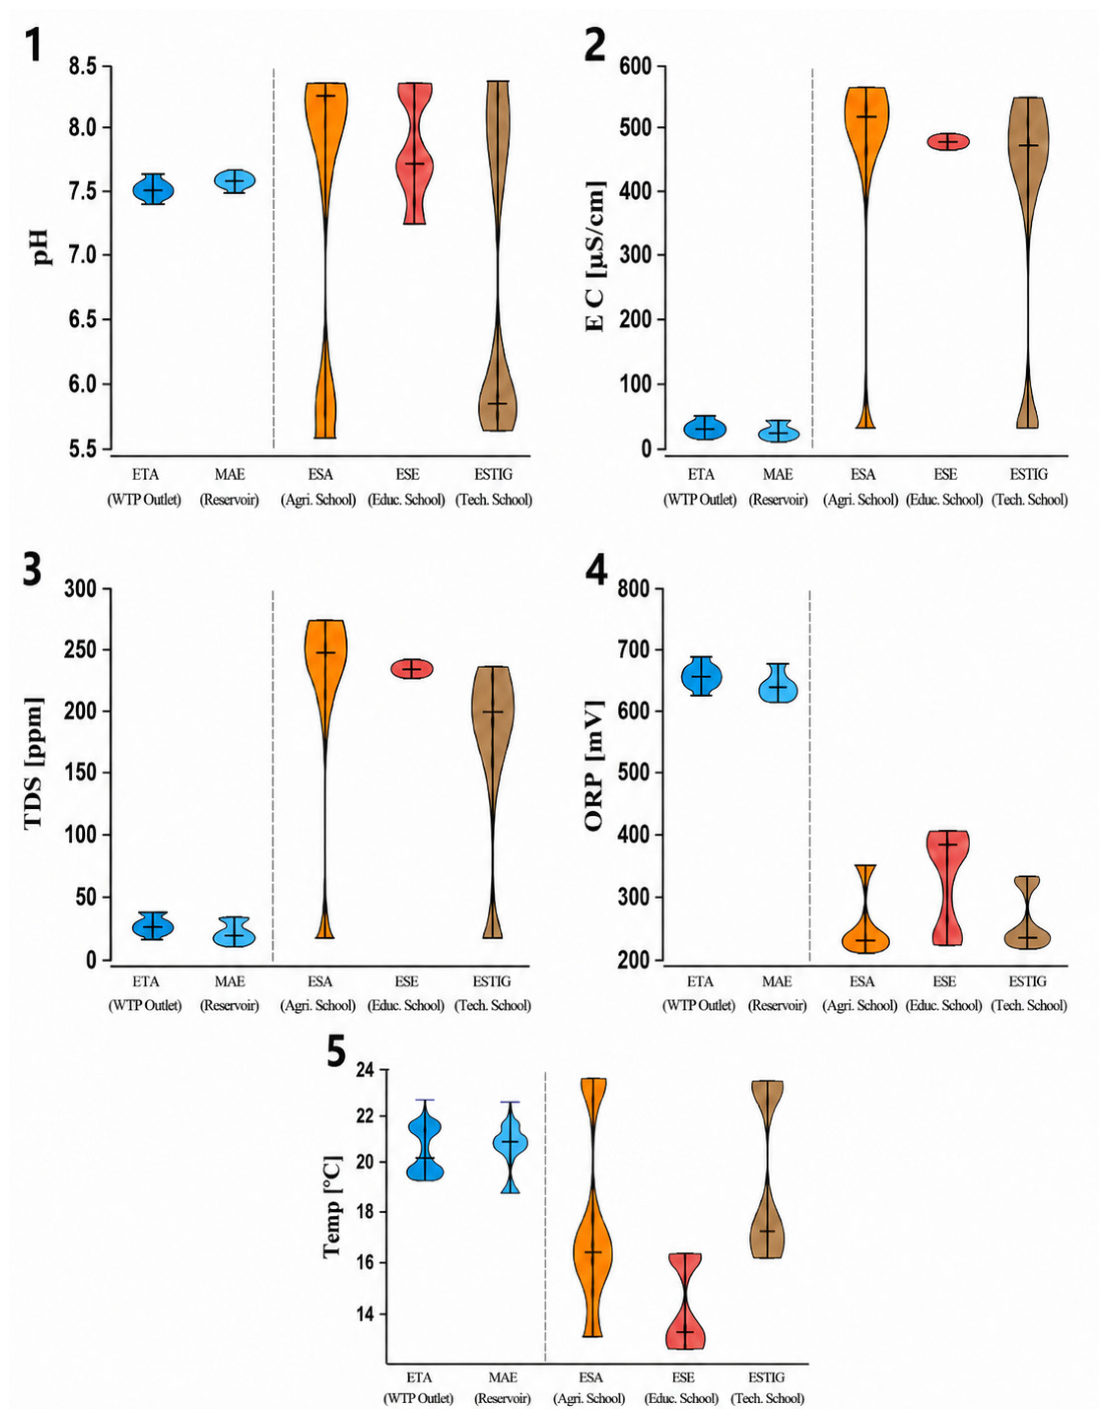
The violin plots shown in
Figure 3 further illustrate the differences between the two supply types. Groundwater showed greater dispersion, as reflected by higher standard deviations, coefficients of variation, and more irregular point-level distributions, particularly for pH, EC, TDS, and ORP. By contrast, treated-water points displayed narrower distributions for most parameters, indicating low within-point variability and greater campaign-scale consistency. The wider pH range observed in groundwater, including values below the lower reference value for drinking water, supports the need for periodic verification of decentralized supply points. Temperature also varied among points and campaigns, although the main distinction between source types was more evident for mineralization-related and redox parameters.
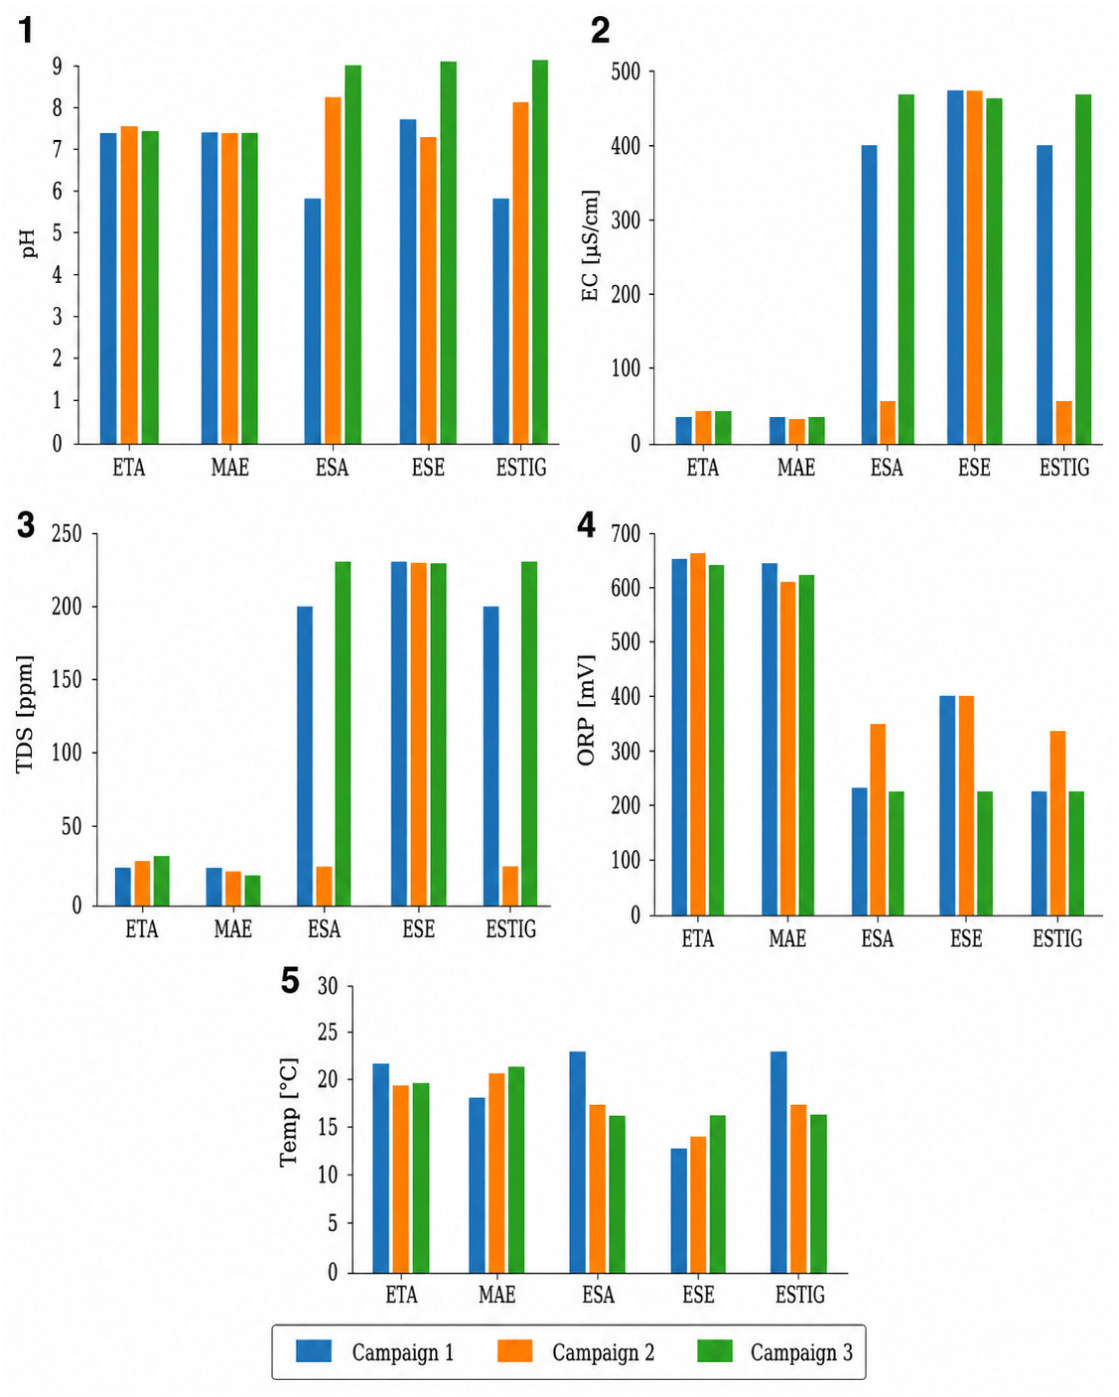
Campaign median values provided an additional summary of short-term variation across the three monitoring campaigns (
Figure 4). Treated-water points showed limited shifts among campaigns, whereas groundwater displayed larger differences both among campaigns and among sampling points. This pattern supports the interpretation that treated municipal water was more consistent under the monitored conditions, whereas groundwater reflected stronger site-specific and campaign-scale variability.
The variability observed among ESA, ESE, and ESTIG is likely related to local hydrogeochemical and operational differences affecting the decentralized groundwater system. Higher EC and TDS values indicate greater mineralization, which may result from water–rock interaction, residence time, abstraction conditions, or internal distribution characteristics, as commonly reported for groundwater systems [
1,
2,
31]. Because recharge areas, flow paths, residence times, and other controlling factors have not yet been characterized for this aquifer, these explanations should be considered plausible interpretations rather than definitive causal attributions. External environmental pressures may also influence some of the monitored parameters. Previous studies reported nutrient enrichment and trace-metal contamination in urban agriculture soils in Bragança [
32], as well as the occurrence and ecological risk of organic pollutants in nearby urban surface waters [
33]. Nevertheless, the presence of contaminants in nearby soils or surface waters does not necessarily imply contamination of the monitored groundwater points. Soils can provide an important filtering function for groundwater protection, although its effectiveness depends on pollutant behavior, soil properties, and hydrological transport processes [
34]. These local studies therefore support a cautious environmental reading of decentralized groundwater use, rather than providing direct evidence of contamination at the sampling points monitored in this study. More broadly, the results should be interpreted as an initial short-term comparative assessment conducted under standardized field conditions. The value of high-frequency or short-interval water-quality data depends on the alignment between monitoring frequency, duration, data processing, and the intended objective [
19,
20]. In the present study, 10 s readings provided more detailed information than isolated spot measurements and supported the comparison of short-term physicochemical profiles among source types and sampling points. However, because each monitoring window lasted approximately 10 min, the dataset should not be considered continuous high-frequency monitoring in the sense of long-term temporal surveillance. Longer monitoring periods would be required to assess seasonal patterns, event-driven responses, or long-term temporal behavior, as shown in a one-year high-frequency groundwater monitoring study [
21].
4. Conclusions
This study compared treated surface-water-derived municipal water and decentralized groundwater in Bragança, Portugal, using a standardized short-term sensor-based monitoring approach supported by an IoT-enabled data acquisition workflow. Clear physicochemical differences were observed between the two supply contexts. Treated municipal water showed lower EC and TDS values, narrower parameter ranges, and higher ORP values, consistent with its surface-water origin, lower mineralization, operational control, and disinfection conditions. Groundwater showed higher mineralization and greater variability among sampling points and campaigns, consistent with local hydrogeochemical and operational influences. The repeated 10 s readings provided more detailed short-term physicochemical profiles than isolated spot measurements and supported the comparison of source types, sampling points, and parameter relationships. However, the study should be regarded as an initial assessment rather than continuous high-frequency monitoring. Data collection was limited to three short campaigns between January and March 2026, with approximately 10 min monitoring windows, and therefore did not capture seasonal dynamics, event-driven responses, drought or recharge effects, or long-term temporal behavior. Other limitations relate to spatial scale, aquifer characterization, and parameter coverage. The study included a limited number of sampling points within the Bragança public supply system and the local higher education campus, meaning that the findings may not be directly generalizable to other hydrogeological contexts or decentralized supply systems. The local aquifer remains poorly characterized in terms of recharge areas, groundwater flow paths, residence times, and the factors controlling variability among groundwater sampling points. In addition, monitoring was restricted to basic physicochemical parameters—pH, EC, TDS, ORP, and temperature—and microbiological analyses were limited to one sampling moment. The IoT component supported automated data acquisition, timestamping, storage, and data organization, but real-time operational decision-making, automated alert generation, and integration into a routine warning system were not evaluated. Future research should extend monitoring to seasonal and multi-year scales, include hydrological events, combine sensor-based measurements with repeated laboratory analyses, and improve hydrogeological characterization of the groundwater source. Laboratory work should include microbiological testing, major ions, nutrients, trace metals, and relevant organic contaminants. Despite the limitations identified, the results support the usefulness of standardized sensor-based monitoring as a complementary tool for routine screening and local water-quality assessment. Such standardized sensor-based approaches may be particularly useful for decentralized groundwater supplies, where monitoring and operational control are often less continuous than in public supply systems. For these sources, regular sensor-based monitoring combined with periodic laboratory confirmation remains essential, particularly where recurrent deviations or increasing variability indicate the need for improved protection of abstraction points, control of potential contamination sources, or site-specific treatment before use as drinking water.
Author Contributions
Conceptualization, J.d.S. and A.M.A.-G.; methodology, J.d.S. and A.M.A.-G.; software, J.d.S. and C.P.d.S.; validation, J.d.S., A.M.A.-G. and V.B.P.; formal analysis, J.d.S. and A.M.A.-G.; investigation, J.d.S., A.M.A.-G., and V.B.P.; resources, J.d.S.; data curation, J.d.S.; writing—original draft preparation, J.d.S., A.M.A.-G. and C.P.d.S.; writing—review and editing, J.d.S., A.M.A.-G., and C.P.d.S.; visualization, J.d.S., A.M.A.-G., and C.P.d.S.; supervision, A.M.A.-G. and C.P.d.S.; project administration, J.d.S. and A.M.A.-G.; funding acquisition, J.d.S. All authors have read and agreed to the published version of the manuscript.
Funding
This research was funded by CONSTA—Serviço de Análise de Água Ltda., João Pessoa, PB, 58033-330, Brazil, under funding number 29228454000104.
Data Availability Statement
The original contributions presented in this study are included in the article. Further inquiries can be directed to the corresponding authors.
Acknowledgments
J.S. acknowledges the Sandwich PhD Program Abroad (PDSE) of the National Council for Scientific and Technological Development (CNPq, Brazil) for mobility funding. A.M.A.-G. is grateful to the Foundation for Science and Technology (FCT, Portugal) for financial support through national funds from FCT/MCTES (PIDDAC) to CIMO (UIDB/00690/2020 and UIDP/00690/2020) and SusTEC (LA/P/0007/2020). The authors are also grateful to Gracinda Rodrigues (Be Water, S.A.) for logistical support during water sampling at the DWTP.
Conflicts of Interest
Author Josean da Silva was employed by the company CONSTA Serviço de Análise de Àgua Ltd.a. The remaining authors declare that the research was conducted in the absence of any commercial or financial relationships that could be construed as a potential conflict of interest.
Appendix A
Appendix A.1
Table A1.
Descriptive statistics by sampling point.
Table A1.
Descriptive statistics by sampling point.
| Point | Parameter | Mean ± Std | Median | Range | IQR | CV (%) |
|---|
| ETA (WTP Outlet) | pH | 7.476 ± 0.053 | 7.460 | [7.35, 7.57] | [7.450, 7.520] | 0.7 |
| ETA (WTP Outlet) | EC [µS/cm] | 41.929 ± 8.034 | 45.000 | [33.00, 57.00] | [35.000, 45.000] | 19.2 |
| ETA (WTP Outlet) | TDS [ppm] | 31.864 ± 5.248 | 35.000 | [21.00, 37.00] | [28.000, 37.000] | 16.5 |
| ETA (WTP Outlet) | ORP [mV] | 658.921 ± 7.374 | 665.000 | [645.00, 667.00] | [651.000, 665.000] | 1.1 |
| ETA (WTP Outlet) | Temp [°C] | 20.250 ± 0.838 | 20.010 | [19.20, 22.10] | [19.500, 21.100] | 4.1 |
| MAE (Reservoir) | pH | 7.539 ± 0.047 | 7.550 | [7.45, 7.58] | [7.510, 7.580] | 0.6 |
| MAE (Reservoir) | EC [µS/cm] | 36.328 ± 6.104 | 35.000 | [32.00, 57.00] | [32.000, 35.000] | 16.8 |
| MAE (Reservoir) | TDS [ppm] | 28.955 ± 6.810 | 25.000 | [21.00, 37.00] | [21.000, 37.000] | 23.5 |
| MAE (Reservoir) | ORP [mV] | 641.912 ± 17.431 | 633.000 | [620.00, 665.00] | [628.000, 661.000] | 2.7 |
| MAE (Reservoir) | Temp [°C] | 20.055 ± 1.014 | 20.500 | [18.50, 22.10] | [18.500, 20.500] | 5.1 |
| ESA (Agri. School) | pH | 7.314 ± 1.083 | 8.140 | [5.65, 8.19] | [5.900, 8.160] | 14.8 |
| ESA (Agri. School) | EC [µS/cm] | 373.871 ± 149.917 | 461.000 | [54.00, 467.00] | [397.000, 464.000] | 40.1 |
| ESA (Agri. School) | TDS [ppm] | 187.019 ± 74.984 | 231.000 | [25.00, 233.00] | [199.000, 232.000] | 40.1 |
| ESA (Agri. School) | ORP [mV] | 255.432 ± 41.868 | 239.900 | [220.60, 355.50] | [235.800, 243.900] | 16.4 |
| ESA (Agri. School) | Temp [°C] | 17.965 ± 3.436 | 16.420 | [13.61, 23.28] | [16.260, 23.140] | 19.1 |
| ESE (Educ. School) | pH | 7.755 ± 0.326 | 7.680 | [7.22, 8.15] | [7.560, 8.140] | 4.2 |
| ESE (Educ. School) | EC [µS/cm] | 466.023 ± 2.361 | 467.000 | [460.00, 470.00] | [463.000, 468.000] | 0.5 |
| ESE (Educ. School) | TDS [ppm] | 233.050 ± 1.178 | 233.000 | [231.00, 235.00] | [232.000, 234.000] | 0.5 |
| ESE (Educ. School) | ORP [mV] | 341.239 ± 77.385 | 398.100 | [237.00, 408.10] | [239.900, 400.500] | 22.7 |
| ESE (Educ. School) | Temp [°C] | 14.252 ± 1.549 | 13.500 | [12.74, 16.27] | [12.875, 16.260] | 10.9 |
| ESTIG (Tech. School) | pH | 6.635 ± 1.038 | 5.900 | [5.65, 8.22] | [5.900, 7.780] | 15.6 |
| ESTIG (Tech. School) | EC [µS/cm] | 302.119 ± 169.406 | 397.000 | [54.00, 463.00] | [55.000, 398.000] | 56.1 |
| ESTIG (Tech. School) | TDS [ppm] | 151.304 ± 84.996 | 199.000 | [27.00, 232.00] | [27.000, 199.000] | 56.2 |
| ESTIG (Tech. School) | ORP [mV] | 274.010 ± 47.595 | 242.100 | [231.00, 340.10] | [239.700, 339.500] | 17.4 |
| ESTIG (Tech. School) | Temp [°C] | 20.017 ± 3.188 | 17.370 | [16.25, 23.28] | [17.200, 23.210] | 15.9 |
Appendix A.2
Table A2.
Direct comparison of descriptive statistics between treated surface water and decentralized groundwater.
Table A2.
Direct comparison of descriptive statistics between treated surface water and decentralized groundwater.
| Parameter | Group | Mean | Median | Std | Range | CV (%) |
|---|
| EC [µS/cm] | Group A | 39.129 | 35.000 | 7.662 | [32.000, 57.000] | 19.582 |
| EC [µS/cm] | Group B | 371.434 | 461.000 | 151.505 | [54.000, 470.000] | 40.789 |
| ORP [mV] | Group A | 650.417 | 652.000 | 15.854 | [620.000, 667.000] | 2.438 |
| ORP [mV] | Group B | 277.681 | 241.400 | 61.521 | [220.600, 408.100] | 22.155 |
| TDS [ppm] | Group A | 30.409 | 32.000 | 6.249 | [21.000, 37.000] | 20.549 |
| TDS [ppm] | Group B | 185.838 | 231.000 | 75.833 | [25.000, 235.000] | 40.806 |
| Temp [°C] | Group A | 20.152 | 20.500 | 0.935 | [18.500, 22.100] | 4.639 |
| Temp [°C] | Group B | 17.822 | 16.420 | 3.658 | [12.740, 23.280] | 20.522 |
| pH | Group A | 7.508 | 7.520 | 0.059 | [7.350, 7.580] | 0.789 |
| pH | Group B | 7.206 | 7.690 | 1.046 | [5.650, 8.220] | 14.509 |
References
- Olea-Olea, S.; Silva-Aguilera, R.A.; Alcocer, J.; Escolero, O.; Morales-Casique, E.; Florez-Peñaloza, J.R.; Almora-Fonseca, K.A.; Oseguera, L.A. Water–Rock Interaction Processes in Groundwater and Flows in a Maar Lake in Central Mexico. Water 2024, 16, 715. [Google Scholar] [CrossRef]
- Oliveira, P.C.N.d.; Athayde, G.B.; Licht, O.A.B.; Gastmans, D.; Amaral, B.D.; Tavares, D.A.; Garcia, L.H.; Athayde, C.d.V.M. Understanding Regional Groundwater Flow Using Water–Rock Interaction Processes and Anthropic Signatures in a Fractured Volcanic Aquifer. J. South Am. Earth Sci. 2023, 123, 104207. [Google Scholar] [CrossRef]
- Fira-Mladinescu, C.; Margan, M.-M.; Margan, R.; Ardelean, F.; Sînmârghițan, A.I.; Marincov, D.; Tuță-Sas, I.; Marin, I.; Cîndrea, A.-C.; Bodea, D.-A.; et al. Meteorological Influence on Drinking Water Quality: Microbial Variability in Groundwater Wells and Piped Distribution Networks from Western Romania. Microorganisms 2026, 14, 148. [Google Scholar] [CrossRef]
- European Parliament and Council of the European Union. Directive (EU) 2020/2184 of the European Parliament and of the Council of 16 December 2020 on the Quality of Water Intended for Human Consumption (Recast). Off. J. Eur. Union 2020, L435, 1–62. [Google Scholar]
- Decreto-Lei n.º 69/2023, de 21 de Agosto. Estabelece o Regime Jurídico da Qualidade da Água Destinada ao Consumo Humano. Diário da República 2023, 1.ª Série, n.º 160. Available online: https://diariodarepublica.pt/dr/detalhe/decreto-lei/69-2023-220113533 (accessed on 31 March 2026).
- Priadi, C.R.; Suleeman, E.; Darmajanti, L.; Putri, G.L.; Genter, F.; Foster, T.; Willetts, J. Policy and Regulatory Context for Self-Supplied Drinking Water Services in Two Cities in Indonesia: Priorities for Managing Risks. Environ. Dev. 2024, 49, 100940. [Google Scholar] [CrossRef]
- Essamlali, I.; Nhaila, H.; El Khaili, M. Advances in Machine Learning and IoT for Water Quality Monitoring: A Comprehensive Review. Heliyon 2024, 10, e27920. [Google Scholar] [CrossRef]
- Addow, M.A.; Jimale, A.D. Integrating IoT and Water Quality: A Bibliometric Analysis. SSRG Int. J. Electron. Commun. Eng. 2024, 11, 149–160. [Google Scholar] [CrossRef]
- Forhad, H.M.; Uddin, M.R.; Chakrovorty, R.S.; Ruhul, A.M.; Faruk, H.M.; Kamruzzaman, S.; Sharmin, N.; Jamal, A.H.M.S.I.M.; Haque, M.M.-U.; Morshed, A.K.M.M. IoT Based Real-Time Water Quality Monitoring System in Water Treatment Plants (WTPs). Heliyon 2024, 10, e40746. [Google Scholar] [CrossRef]
- Bandara, R.M.P.N.S.; Jayasignhe, A.B.; Retscher, G. The Integration of IoT Sensors and Location-Based Services for Water Quality Monitoring: A Systematic Literature Review. Sensors 2025, 25, 1918. [Google Scholar] [CrossRef] [PubMed]
- Georgantas, I.; Mitropoulos, S.; Katsoulis, S.; Chronis, I.; Christakis, I. Integrated Low-Cost Water Quality Monitoring System Based on LoRa Network. Electronics 2025, 14, 857. [Google Scholar] [CrossRef]
- Bogdan, R.; Paliuc, C.; Crisan-Vida, M.; Nimara, S.; Barmayoun, D. Low-Cost Internet-of-Things Water-Quality Monitoring System for Rural Areas. Sensors 2023, 23, 3919. [Google Scholar] [CrossRef] [PubMed]
- Wiryasaputra, R.; Huang, C.-Y.; Lin, Y.-J.; Yang, C.-T. An IoT Real-Time Potable Water Quality Monitoring and Prediction Model Based on Cloud Computing Architecture. Sensors 2024, 24, 1180. [Google Scholar] [CrossRef]
- Pasika, S.; Gandla, S.T. Smart Water Quality Monitoring System with Cost-Effective Using IoT. Heliyon 2020, 6, e04096. [Google Scholar] [CrossRef] [PubMed]
- Zulkifli, C.Z.; Garfan, S.; Talal, M.; Alamoodi, A.H.; Alamleh, A.; Ahmaro, I.Y.Y.; Sulaiman, S.; Ibrahim, A.B.; Zaidan, B.B.; Ismail, A.R.; et al. IoT-Based Water Monitoring Systems: A Systematic Review. Water 2022, 14, 3621. [Google Scholar] [CrossRef]
- Axiotidis, C.; Konstantopoulou, E.; Sklavos, N. A Wireless Sensor Network IoT Platform for Consumption and Quality Monitoring of Drinking Water. Discov. Appl. Sci. 2025, 7, 15. [Google Scholar] [CrossRef]
- Vicente, E.C.; Silva, L.A.; da Rocha Fernandes, A.M.; Parreira, W.D. A Structured Review of IoT-Based Embedded Systems and Machine Learning for Water Quality Monitoring. Appl. Sci. 2025, 15, 11719. [Google Scholar] [CrossRef]
- Silva, J.; Souza, C.P. Dispositivo de Baixo Custo Baseado em Internet das Coisas para Monitoramento Remoto da Qualidade de Água Destinada ao Consumo Humano. OKARA Geogr. Debate 2025, 19, 107–126. [Google Scholar] [CrossRef]
- Bieroza, M.; Acharya, S.; Benisch, J.; ter Borg, R.N.; Hallberg, L.; Negri, C.; Pruitt, A.; Pucher, M.; Saavedra, F.; Staniszewska, K.; et al. Advances in Catchment Science, Hydrochemistry, and Aquatic Ecology Enabled by High-Frequency Water Quality Measurements. Environ. Sci. Technol. 2023, 57, 4701–4719. [Google Scholar] [CrossRef]
- Rozemeijer, J.; Jordan, P.; Hooijboer, A.; Kronvang, B.; Glendell, M.; Hensley, R.; Rinke, K.; Stutter, M.; Bieroza, M.; Turner, R.; et al. Best Practice in High-Frequency Water Quality Monitoring for Improved Management and Assessment; A Novel Decision Workflow. Environ. Monit. Assess. 2025, 197, 353. [Google Scholar] [CrossRef]
- van Zweel, K.N.; Gourdol, L.; Iffly, J.-F.; Léonard, L.; Barnich, F.; Pfister, L.; Zehe, E.; Hissler, C. One Year of High-Frequency Monitoring of Groundwater Physico-Chemical Parameters in the Weierbach Experimental Catchment, Luxembourg. Earth Syst. Sci. Data 2025, 17, 2217–2229. [Google Scholar] [CrossRef]
- Censos 2021—População Residente em Bragança. Available online: https://censos.ine.pt/xportal/xmain?xpgid=censos21_populacao&xpid=CENSOS21 (accessed on 31 March 2026).
- Instituto Português do Mar e da Atmosfera (IPMA). Climate Normals 1991–2020: Bragança. IPMA: Lisbon, Portugal. Available online: https://www.ipma.pt/bin/file.data/climate-normal/cn_91-20_BRAGANCA.pdf (accessed on 30 April 2026).
- Geraldes, A.M.; Boavida, M.J. Distinct Age and Landscape Influence on Two Reservoirs under the Same Climate. Hydrobiologia 2003, 504, 277–288. [Google Scholar] [CrossRef]
- Meireles, C. Mapa Geológico do Sector Nordeste de Bragança, Escala 1:75 000; LNEG: Lisboa, Portugal, 2012; Available online: https://geoportal.lneg.pt/en/opendata/geological_maps/diverse_maps/northeastsectorbragancageologicalmap (accessed on 31 March 2026).
- Câmara Municipal de Bragança. Drinking Water Quality Reports; Bragança, Portugal, 2025. Available online: https://www.cm-braganca.pt/servicos-e-informacoes/aguas-e-saneamento/analises-de-qualidade-da-agua (accessed on 23 March 2026).
- Hanna Instruments. HI98194, HI98195, HI98196: Manual de Instruções; Hanna Instruments Portugal. Available online: https://www.hanna.pt/fichs/ficheiros/HI98194_95_96.pdf (accessed on 29 April 2026).
- Sokal, R.R.; Rohlf, F.J. Biometry: The Principles and Practice of Statistics in Biological Research, 3rd ed.; W.H. Freeman and Co.: New York, NY, USA, 1995. [Google Scholar]
- Nogueira, A.J.M.; Cardoso, M.; Delgadillo, I.; Almeida, A. Evaluation of the Microbiological Quality of Drinking Water in the District of Bragança (Northwest Portugal) throughout a Ten-Year Period (1996–2005), during the Implementation of the 1998/83 EC Directive. J. Environ. Qual. 2010, 39, 609–616. [Google Scholar] [CrossRef] [PubMed]
- Escobar-Díaz, A.; Villarreal, A.; Zárate-Nicolas, B.; Rojas-Olivos, A. System Design for Monitoring REDOX Potential in Treated Water Using an ORP Sensor. HardwareX 2025, 24, e00717. [Google Scholar] [CrossRef]
- de Carvalho, A.K.N.; de Souza, R.F. Hidroquímica de Águas Superficiais e Subterrâneas em Carnaúba dos Dantas, Rio Grande do Norte. Geol. USP. Série Científica 2022, 22, 55–75. [Google Scholar] [CrossRef]
- Arrobas, M.; Lopes, H.; Rodrigues, M.A. Urban Agriculture in Bragança, Northeast Portugal: Assessing the Nutrient Dynamic in the Soil and Plants, and Their Contamination with Trace Metals. Biol. Agric. Hortic. 2017, 33, 1–13. [Google Scholar] [CrossRef]
- Canle, M.; Antão-Geraldes, A.M. A Snapshot on the Occurrence and Risk Assessment of Organic Pollutants in an Urban River. Appl. Sci. 2023, 13, 146. [Google Scholar] [CrossRef]
- Keesstra, S.D.; Geissen, V.; Mosse, K.; Piiranen, S.; Scudiero, E.; Leistra, M.; van Schaik, L. Soil as a Filter for Groundwater Quality. Curr. Opin. Environ. Sustain. 2012, 4, 507–516. [Google Scholar] [CrossRef]
| Disclaimer/Publisher’s Note: The statements, opinions and data contained in all publications are solely those of the individual author(s) and contributor(s) and not of MDPI and/or the editor(s). MDPI and/or the editor(s) disclaim responsibility for any injury to people or property resulting from any ideas, methods, instructions or products referred to in the content. |




 ,
,