1. Introduction
Groundwater is one of the most vital water resources in the world and plays a crucial role in providing water for drinking, agriculture, and industry, particularly in arid and semi-arid regions. In such regions, the limitation of surface water resources has led to a strong dependence on aquifers [
1,
2]. In Iran, as an example, population growth, expansion of agricultural and industrial activities, land use changes, and excessive well extraction have led to a decline in groundwater levels and a decline in the quality of these resources. In recent decades, water quality has become one of the fundamental challenges of water resource management [
3,
4,
5]. Since aquifer contamination is often irreversible or very costly, preventive approaches have gained priority over remedial approaches [
6,
7]. In this regard, groundwater vulnerability assessment has received widespread attention as an effective tool for identifying sensitive areas and planning sustainable water resource management.
Groundwater vulnerability indicates the inherent sensitivity of an aquifer to the entry of pollutants or destructive factors. To be more precise, it does not necessarily mean the presence of actual pollution but rather indicates the potential capacity of the aquifer to be contaminated [
8,
9]. In addition to the reduction in the quantity of groundwater resources, the decline in the quality of these resources has also become one of the fundamental challenges of sustainable water management. Water Quality Indices, as efficient tools, provide a comprehensive assessment of the quality status of aquifers and play an important role in sustainable water resource planning [
10,
11].
Among the index-based models, the Depth, Recharge, Aquifer Media, Soil, Topography, Impact of Vadose Zone, Conductivity (DRASTIC) model is one of the most widely used methods for assessing the inherent vulnerability of aquifers to surface contamination. It was developed based on seven hydrogeological parameters including depth to groundwater level, net recharge, aquifer environment, soil type, land slope, unsaturated environmental characteristics, and hydraulic conductivity, and has been widely used in domestic and international studies [
12,
13]. Despite its widespread use, the use of fixed and empirical weights in the classic version of DRASTIC has always been criticized because they do not necessarily reflect the real conditions of all regions.
Coastal aquifers are particularly vulnerable to saltwater intrusion in addition to conventional pollution. The former results from a decline in the groundwater table and a consequent disruption of the freshwater-saltwater interface. The primary impacts are salinization and a reduction in the exploitability of the aquifer [
14,
15]. In this context, the groundwater occurrence (G), aquifer hydraulic conductivity (A), groundwater level (L), distance from the shore (D), impact of the existing status of saltwater intrusion (SWI) (I), and aquifer thickness (T) or GALDIT model has been specifically developed to assess the vulnerability of coastal aquifers to saltwater intrusion [
16,
17].
In recent years, the use of modern weighting and optimization methods has been considered to increase the accuracy of index-based models. The Shannon entropy method determines weights of different parameters based on the amount of dispersion and information available in the data by reducing the dependence on a researcher’s subjective judgment [
18,
19]. Additionally, meta-heuristic algorithms, such as particle swarm optimization (PSO), have been employed to calibrate weights and enhance model performances. Previous studies indicated that these methods can significantly improve the performance of DRASTIC and GALDIT models [
20]. Also, in recent years, the use of data-driven methods and artificial intelligence algorithms in groundwater resource studies has increased significantly. Machine learning models have been able to provide high performance in predicting and analyzing groundwater status by utilizing various hydrogeological and qualitative parameters [
10].
Coastal aquifers of Hormozgan province are considered among the most vulnerable hydrogeological systems in Iran due to their hot and dry climate, strong dependence on groundwater resources, expanding agricultural and urban activities, and proximity to the Persian Gulf and the Sea of Oman [
1,
21]. The decline in groundwater levels due to excessive extraction, land use changes, and increasing human pressures has significantly increased the risk of aquifer contamination and saltwater intrusion. Therefore, identifying sensitive areas and accurately assessing groundwater vulnerability plays a key role in the sustainable management of water resources in the region [
22].
In recent years, several studies have attempted to improve the performance of index-based groundwater vulnerability models by coupling them with alternative weighting and optimization methods. Classical vulnerability indices such as DRASTIC and GALDIT, which rely on fixed empirical weights, have been modified using multi-criteria decision-making approaches (e.g., entropy-based weighting and analytic hierarchy processes) to reduce subjectivity and better reflect spatial variability of hydrogeological parameters. Other studies have employed methodology and optimization algorithms, including genetic algorithms and particle swarm optimization, to calibrate parameter weights and enhance spatial coherence of vulnerability maps. These approaches generally report improved discrimination of vulnerable zones compared to traditional weighting schemes, although uncertainty related to data quality and model assumptions remains.
Despite these advances, most existing studies focus on a single vulnerability index, a single weighting strategy, or a single time period. Comparatively fewer studies have jointly evaluated multiple vulnerability indices under different weighting methods within a spatio-temporal framework. In this context, the present study builds upon previous work by integrating two widely used vulnerability indices (DRASTIC and GALDIT) with three weighting strategies (normal, entropy-based, and PSO-based) and by analyzing their spatial and temporal behavior over multiple time periods.
In this study, the aim is to assess and analyze the vulnerability of coastal aquifers to surface pollution and salinity using DRASTIC and GALDIT in Hormozgan. Furthermore, effects of three weighting methods, including the classical normal method, Shannon entropy, and PSO, were comparatively investigated. The innovation of this study lies in combining the models with different weighting methods, analyzing the temporal changes in vulnerability over a 15-year period, and evaluating the role of land use changes in the spatial pattern of aquifer vulnerability. The results of this study can provide a scientific and practical framework for improving the planning, protection, and sustainable management of groundwater resources in coastal areas.
3. Results
This section presents and interprets the results of the groundwater vulnerability assessment of coastal aquifers in Hormozgan Province obtained using the DRASTIC and GALDIT models under different weighting schemes. The results are reported for three consecutive five-year periods (2010–2014, 2015–2019, and 2020–2024) to highlight both the spatial distribution of vulnerability and its temporal evolution. The observed changes in land use patterns across these periods are first described, as land use represents a key anthropogenic factor influencing groundwater vulnerability. Subsequently, the spatial and temporal variability of vulnerability classes derived from the DRASTIC model under normal, Shannon entropy, and PSO-based weighting is examined. This is followed by an analysis of the GALDIT model outputs, which reveal the evolution of vulnerability to saltwater intrusion in coastal aquifers over time. Finally, a comparative evaluation of the DRASTIC and GALDIT results across the three weighting methods is presented to identify critical zones and to elucidate the overall trend of aquifer vulnerability changes during the 15-year study period.
3.1. Land Uses
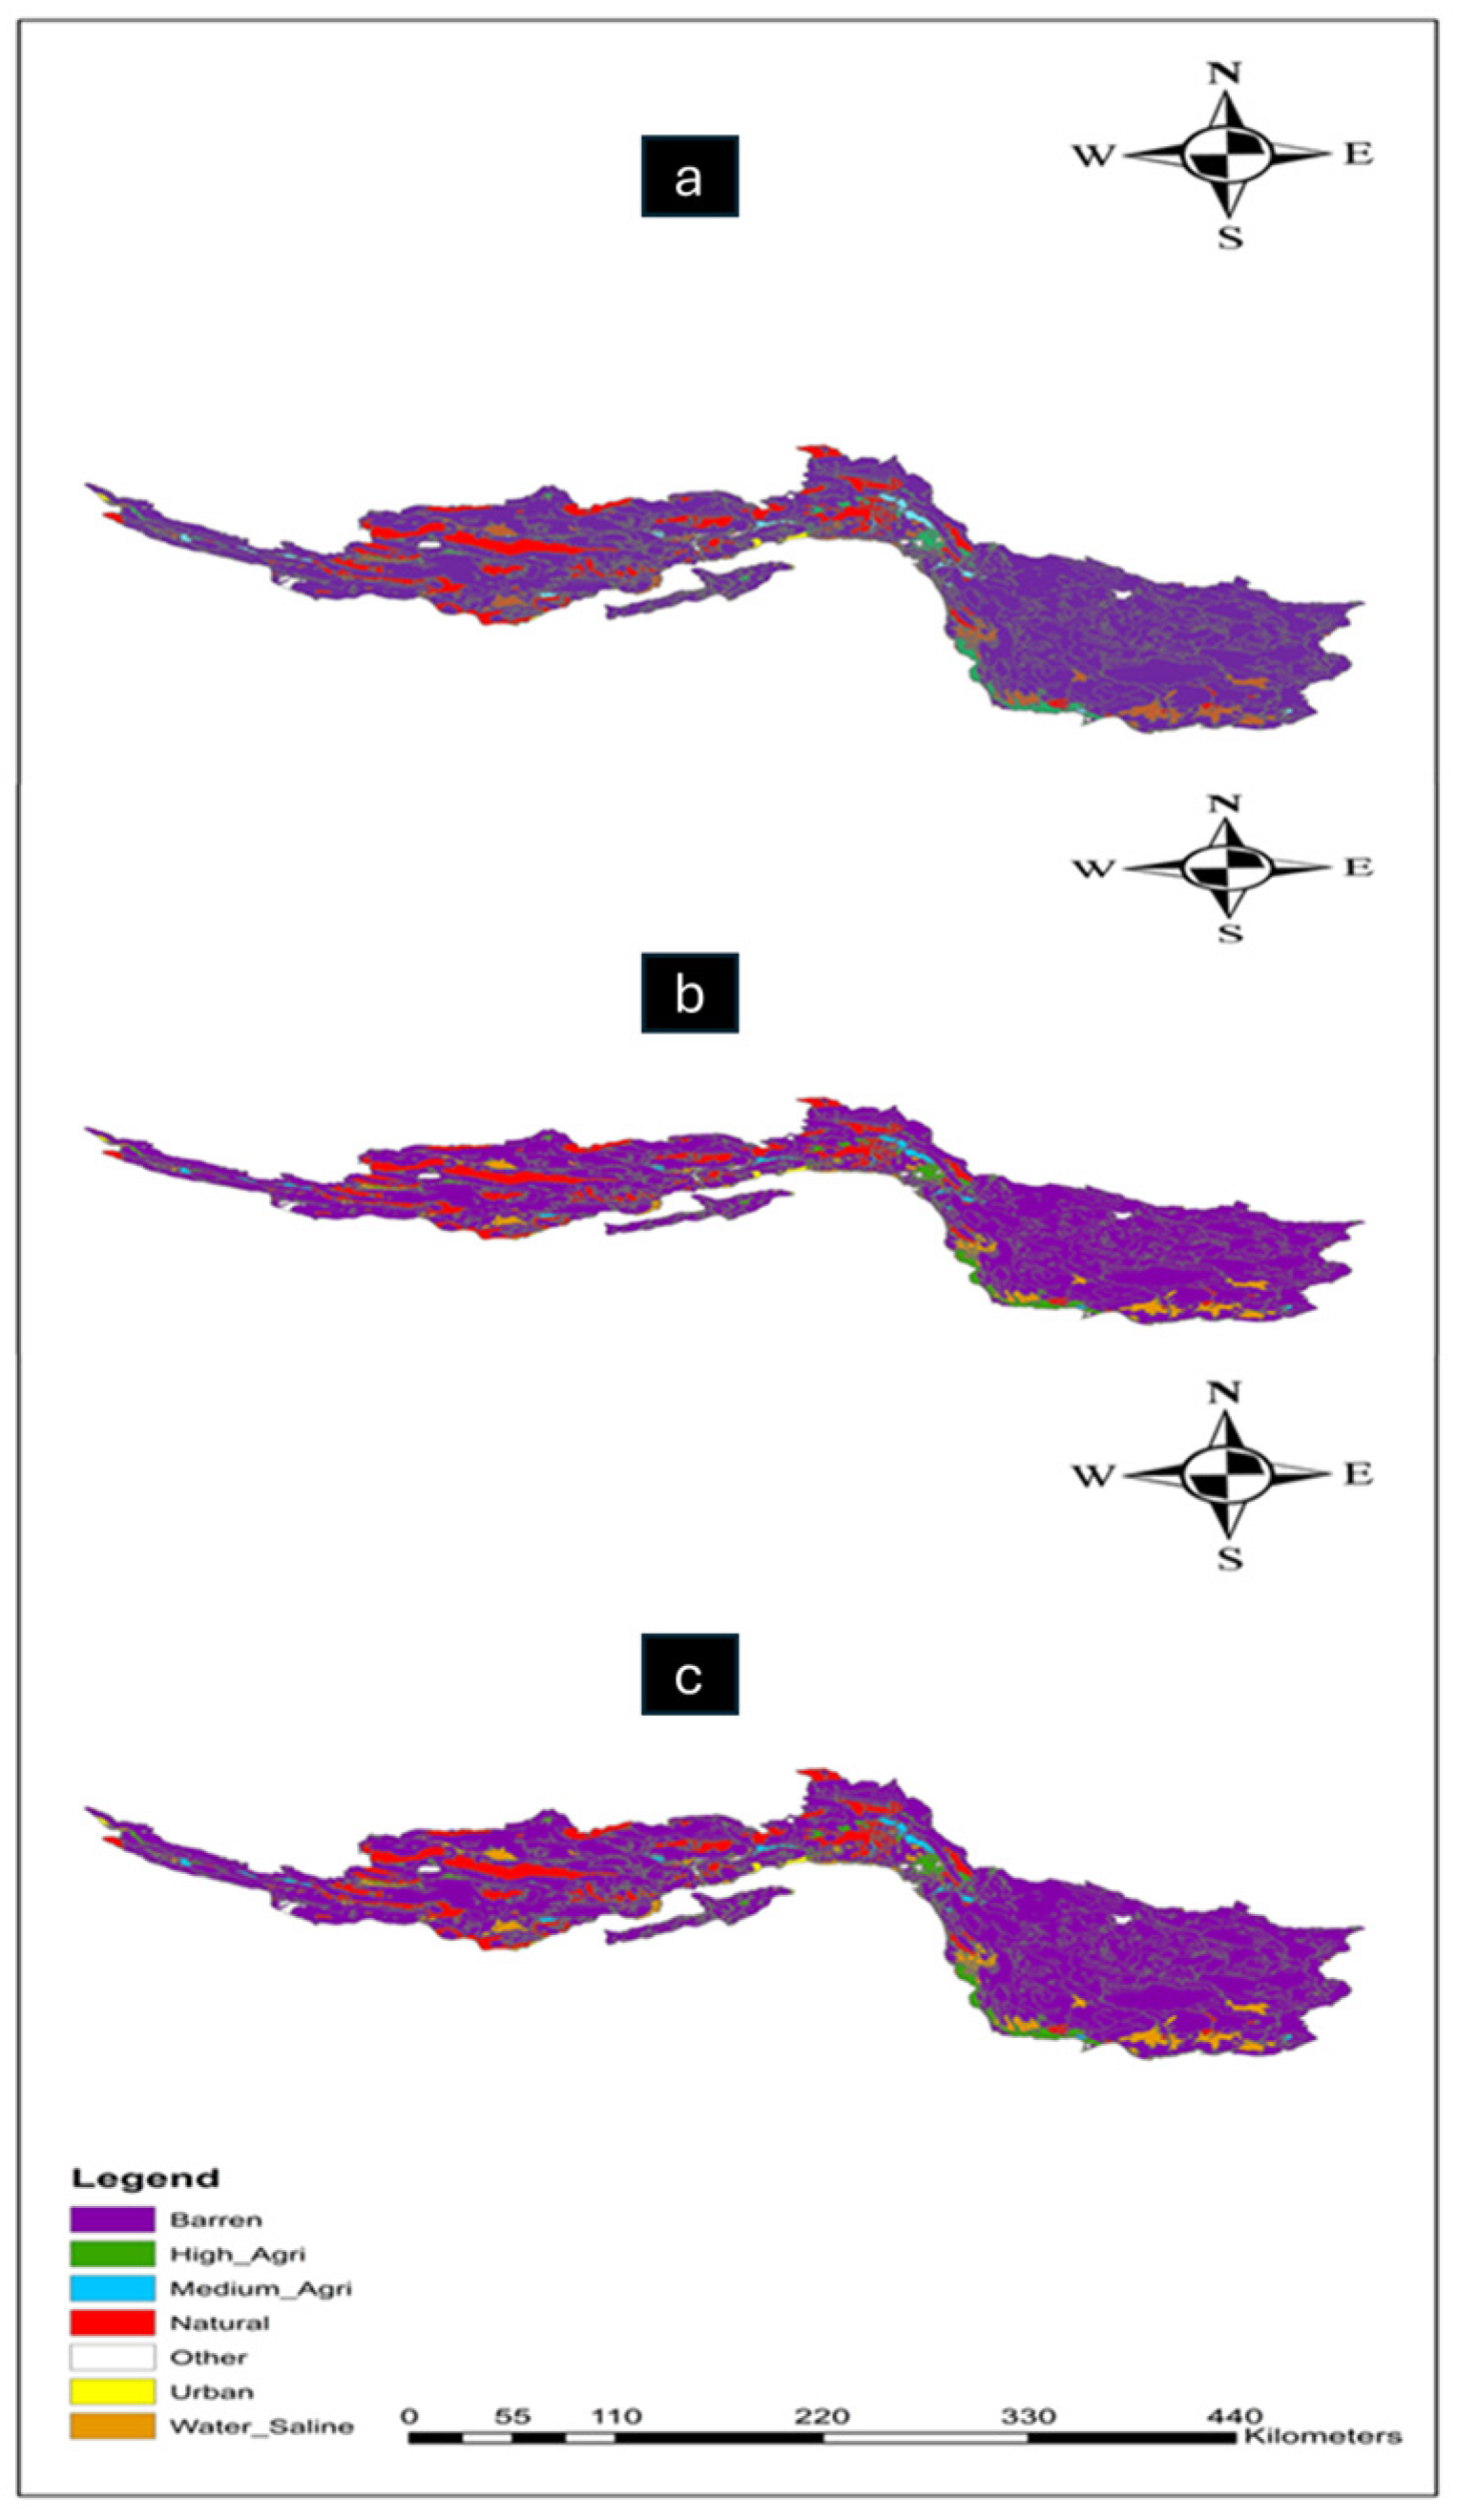
A study of land use changes in the region over a 15-year period shows that the landscape has undergone gradual but significant changes, which can be separated and analyzed into three five-year periods. In the first period (2010–2014), whose land use map is presented in
Figure 3a, the structure of land uses was relatively stable, and natural uses, such as pastures, groves, low-density forests, marshes, and wastelands, occupied the majority of the region’s surface. During this period, human activities were limited, and only scattered patches of agricultural lands, orchards, and urban settlements were observed, indicating minimal human intervention and the dominance of natural conditions over the region’s landscape. In the second period (2015–2019), as shown in
Figure 3b, the process of land use changes intensified, and a significant portion of natural areas were converted to human or mixed uses. The development of agricultural lands, the increase in the area of orchards, the conversion of some pasture lands into semi-agricultural uses, and the scattered expansion of urban areas are among the most important changes in this period. The widespread emergence of mixed land uses indicates the beginning of the transition from natural to man-made uses and the increase in the pressure of exploitation of land resources. These developments indicate a gradual decrease in ecological integrity and an increase in the impact of socio-economic factors on the land use pattern of the region. In the third period (2020–2024), the results of which are shown in
Figure 3c, the intensity and scope of changes reached their maximum, and a significant part of natural uses have changed to man-made lands. Irrigated and rainfed agricultural lands, orchards, mixed land uses, and urban areas have developed more than in the two previous periods, while the area of pasture lands, forests, and some sensitive ecosystems, such as wetlands, has decreased significantly. During the third period, the land use pattern has become scattered, mixed, and under pressure, and the landscape of the region has changed from a relatively natural structure in the first period to a dense, human-made, and discontinuous pattern in the third one.
In summary, a comparison of the three five-year periods shows that the region has experienced a clear trend of continuous decline in natural land uses and rapid increase in human uses over the past 15 years. The decline in pasture, forest, wetland, and barren lands, in contrast to the expansion of agricultural, garden, urban, and mixed-use lands, indicates the gradual destruction of the natural structure of the land and the increase in human pressure on the environment. In addition to changing the ecological landscape of the region, these changes can have significant consequences on increasing the vulnerability of groundwater resources and environmental management challenges in the study area.
3.2. DRASTIC Results
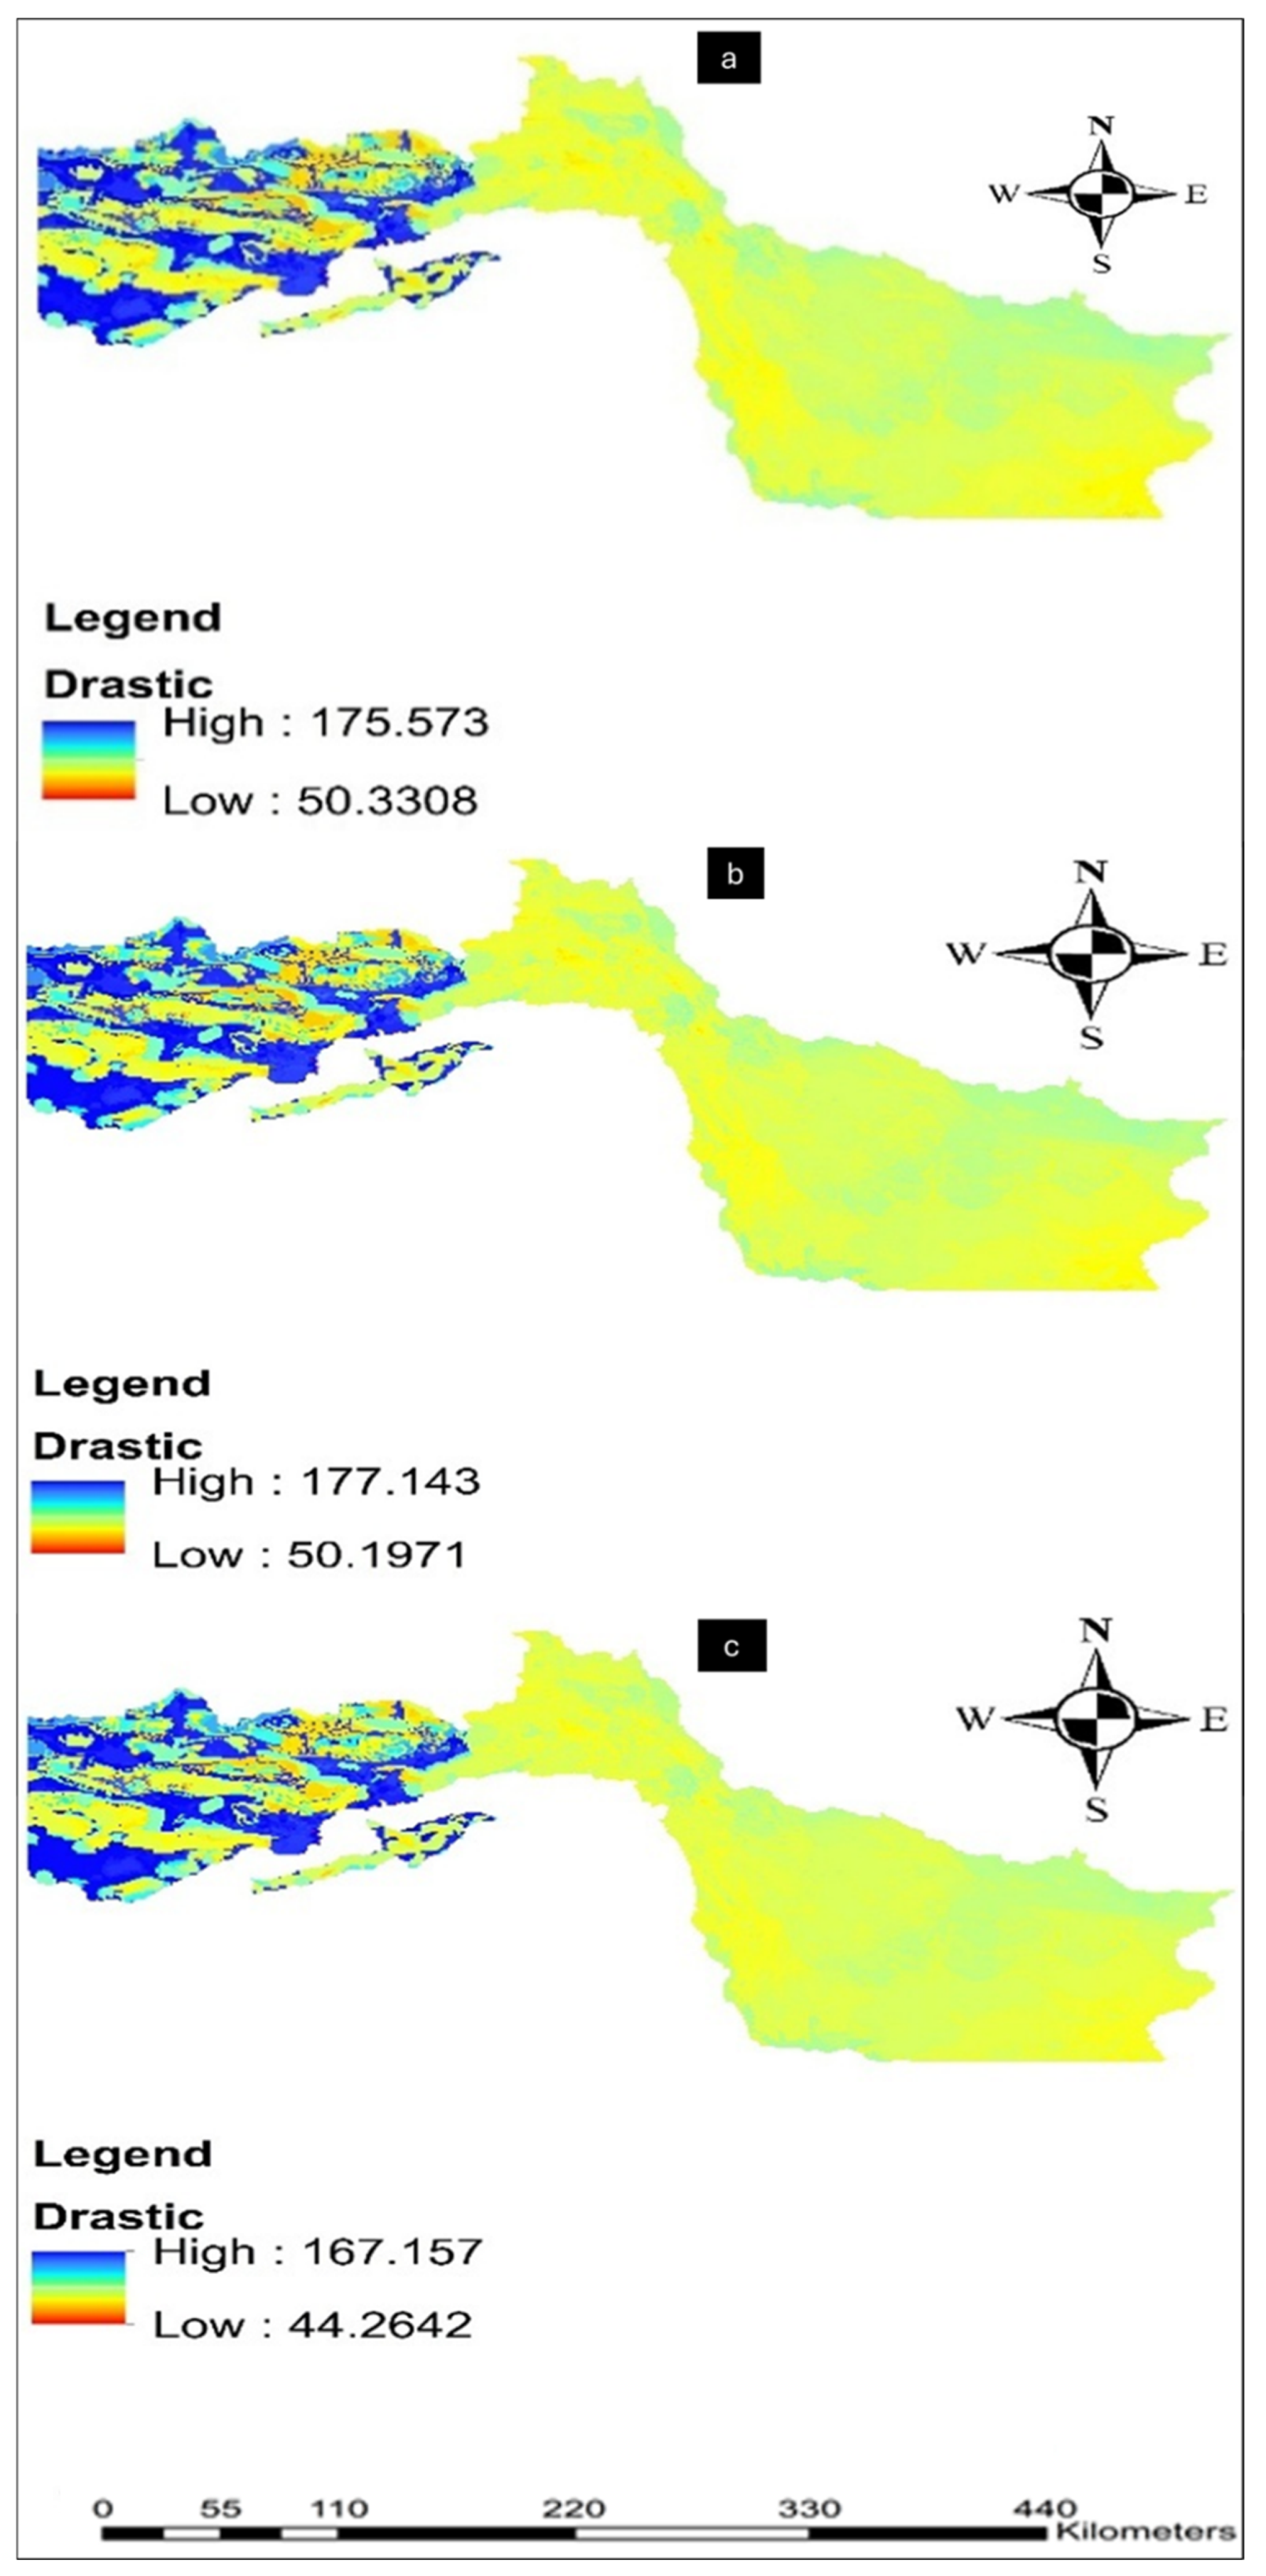
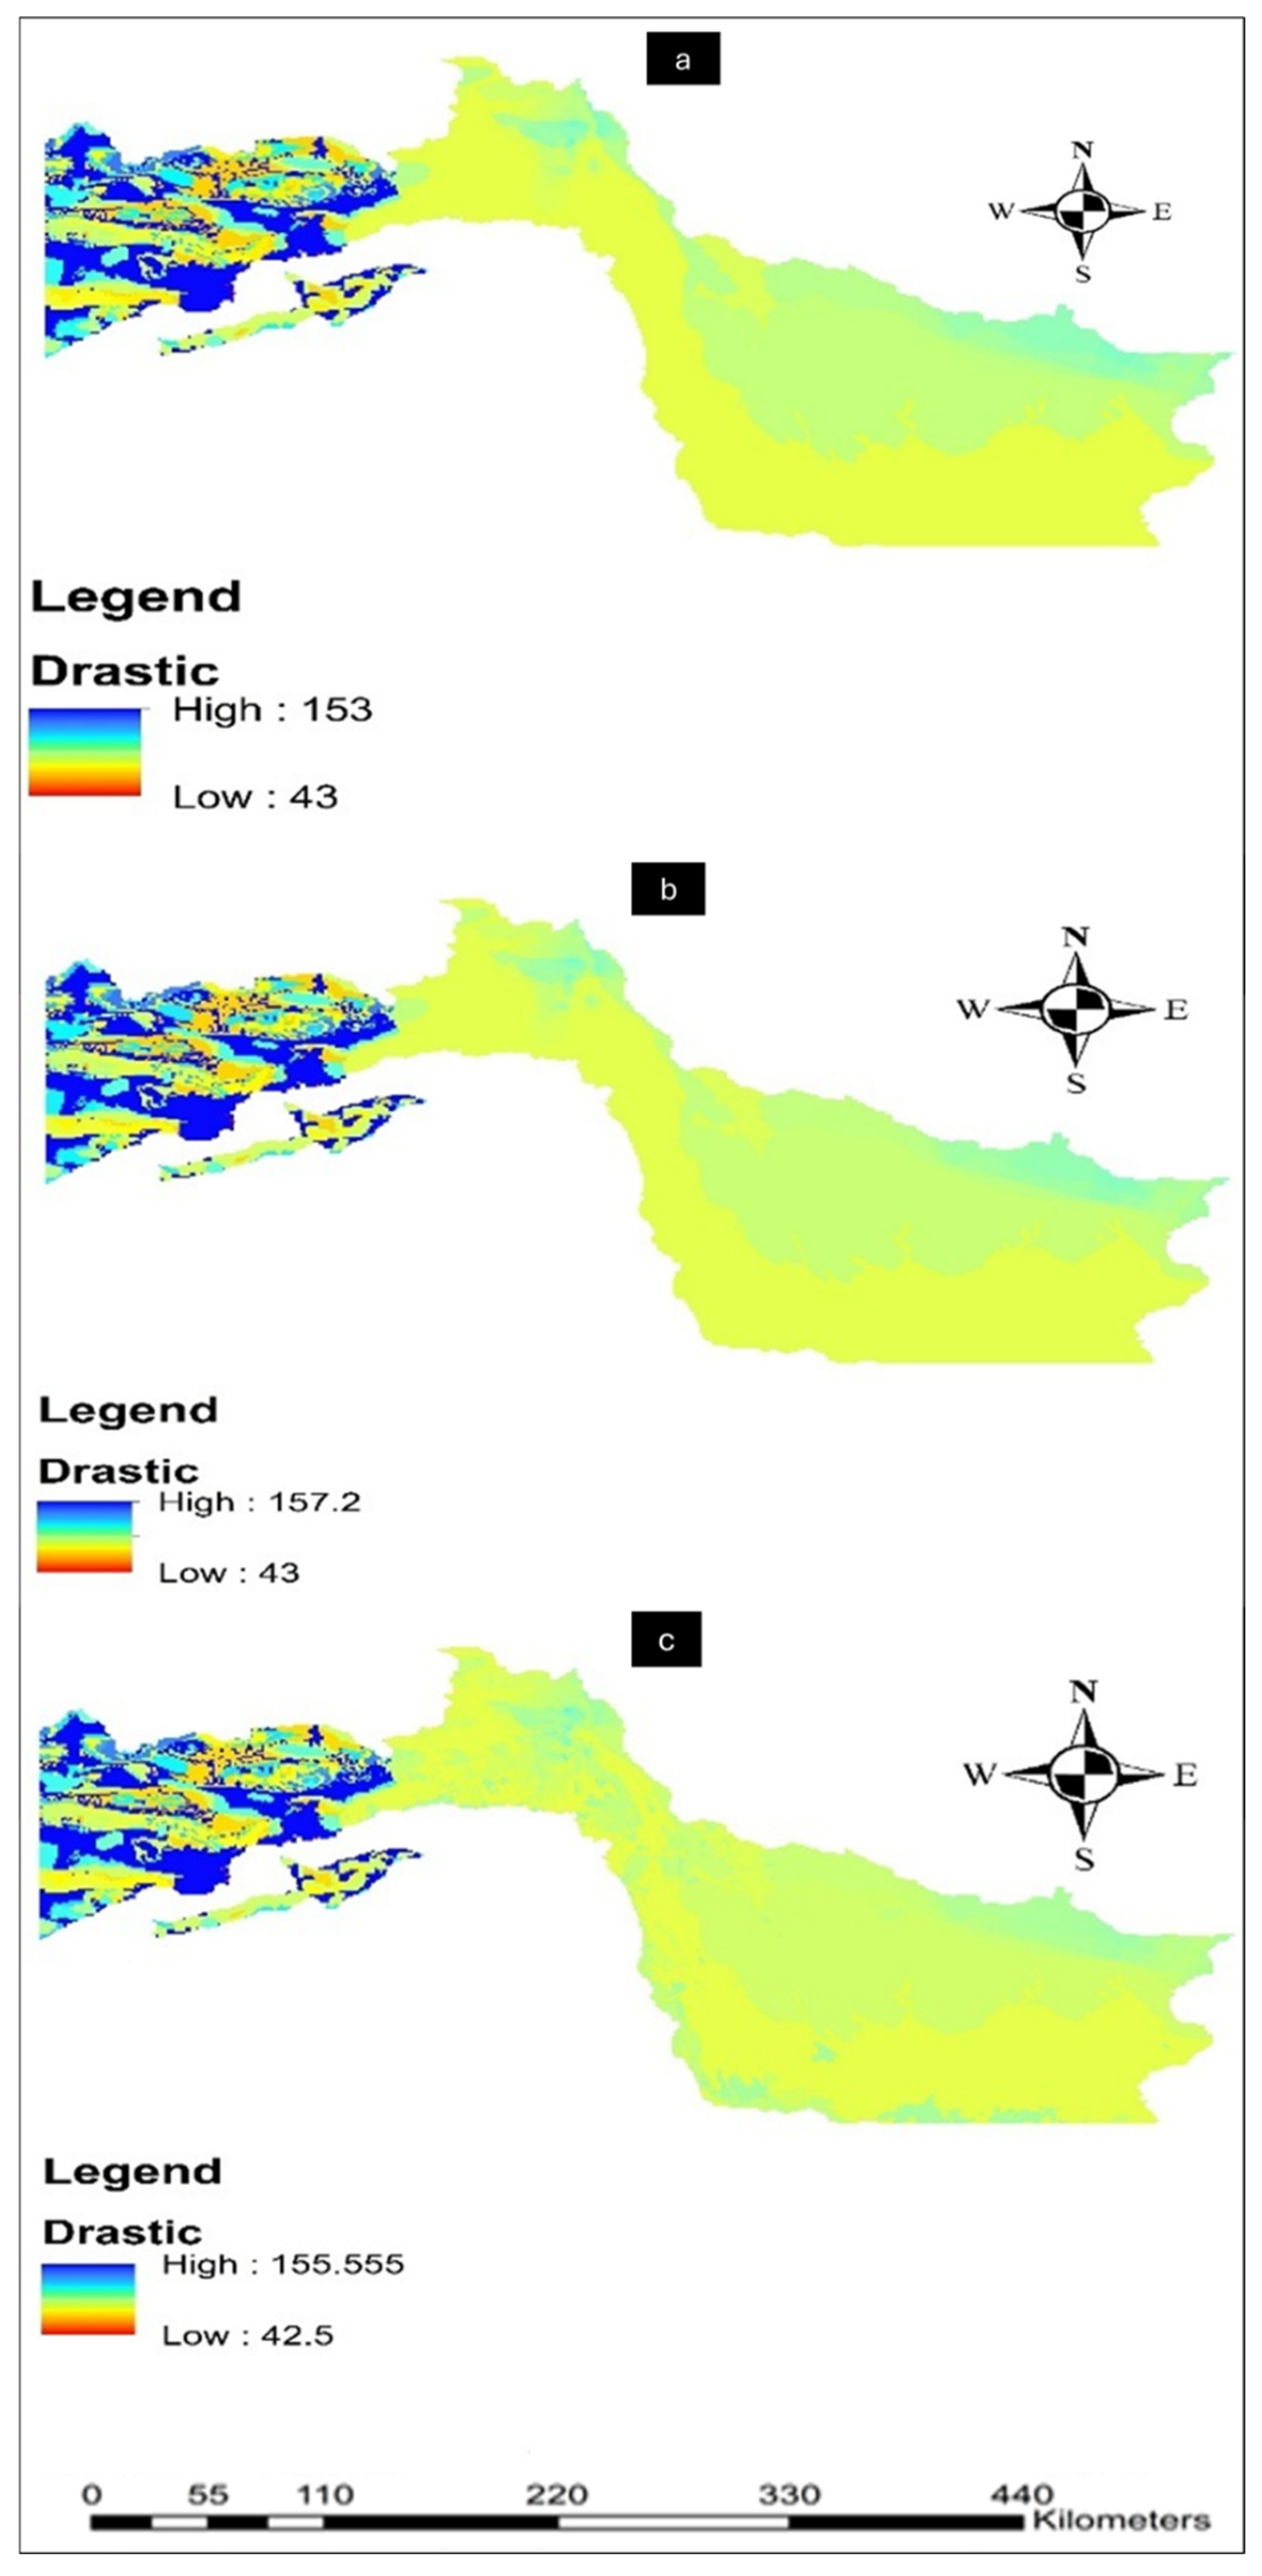
The DRASTIC model-based aquifer vulnerability maps for the period 2010–2014, with three weighting methods, are presented in
Figure 4. As shown, a relatively stable spatial pattern but with differences in the intensity and extent of vulnerable zones was achieved. In the normal weighting method (
Figure 4a), which is based on the standard and uncalibrated weights of the DRASTIC model, the highest index values are observed mainly in the western areas, coastal areas, and young alluvial plains. These areas have obtained higher scores in the final index due to their shallow depth to the groundwater table, higher hydraulic conductivity, higher sediment permeability, and gentle slope. In contrast, the central and eastern parts of the range, which often have harder rocks, deeper water tables, and less permeable conditions, are in the low-to-medium vulnerability classes. This pattern shows that the normal map provides a general and reasonable picture of the inherent sensitivity of the aquifer, but its vulnerability intensity is relatively conservative. According to
Figure 4b, the DRASTIC map based on entropy weighting during the same period, while maintaining the overall spatial pattern, has increased the intensity and contrast of the more sensitive zones. To be more precise, parameters that have greater spatial dispersion and heterogeneity have received higher weights, and as a result, the areas with noticeable changes in the thickness of the unsaturated zone, soil type, hydraulic conductivity, or land use have become more prominent. The highest index values are still seen in the coastal and western plains of the range, but the zones with moderate to high vulnerability have become more extensive than in the normal method. In the central and eastern parts, due to the greater uniformity of geological and hydrogeological conditions, there is not much difference from the normal map. Overall, the entropy method identified areas prone to contamination more clearly even though in some cases, there is a tendency to exaggerate the risk in areas with high statistical fluctuations. In contrast, the map resulting from the calibrated PSO weighting in
Figure 4c presents a more focused and process-oriented picture of the inherent vulnerability of the aquifer. In this method, the role of key parameters, such as depth to groundwater level (D), net recharge (R), and topography (T), is strengthened, while other parameters, such as soil type, aquifer environment, and land use, are given less weight. The PSO result is that the high-vulnerability zones are mainly limited to the western and northwestern coastal strip of the range, where shallow water levels, higher recharge rates, and gentle slopes provide more favorable conditions for pollutant transport. In contrast, some of the central plains shown to be somewhat high-risk in the entropy method have been adjusted in the PSO map and moved to lower classes. The high and rocky areas in the east and northeast of the range also remain in low-risk classes in all three methods, especially in PSO, indicating high spatial coherence of the results of this method.
Based on
Figure 4, a comparison of the three weighting methods in the period 2010–2014 shows that even though the spatial pattern of vulnerable zones is similar in all methods, the intensity and extent of these zones are strongly dependent on the type of weighting. The normal method provides a more balanced and less risky picture; the entropy method is more sensitive to data variability and shows high-risk zones more widely. Finally, the PSO algorithm provides the most accurate and hydrogeologically oriented estimate in which vulnerability is concentrated in truly sensitive areas. Accordingly, it can be said that the PSO map is the most appropriate tool for identifying priority areas in groundwater pollution management for this time period, while the normal and entropy maps are more useful for comparative analyses and initial evaluation.
The aquifer intrinsic vulnerability maps obtained from the DRASTIC model during the period 2015–2019 show that the spatial pattern of vulnerability in the region, despite the differences in weighting methods, has a relatively similar overall structure, while the intensity and spatial distribution of high-risk zones obtained by three weighting methods have significant differences. In
Figure 5a (normal weighting method) the highest index values (up to about 175) are observed in the western and northwestern parts of the region. These areas mainly include young coastal and alluvial plains, which are highly sensitive to pollutant intrusion due to the shallow depth of the groundwater table, high permeability, coarse-grained sediment texture, and higher recharge rates. In contrast, the central areas and parts of the eastern part of the region, in light yellow and green, are in the medium vulnerability class, indicating deeper groundwater and more limited permeability conditions. The east and southeast of the region are also mainly in the low-risk classes, which is attributed to the presence of low-permeable bedrock, limited recharge, and high-water table depth. Comparing this map with the previous period indicates that some western areas have experienced a relative increase in vulnerability during this period, while the central and eastern parts have not changed significantly; it could be due to the decline in groundwater levels, land use changes, and drought conditions. In
Figure 5b, the entropy-weighted DRASTIC map, the overall vulnerability pattern remains similar to that of the normal method. However, the contrast between high-risk and low-risk areas has intensified. The range of index changes in this method varies from about 50 to more than 177, and the areas with high vulnerability are seen to be wider and more continuous in the west and northwest of the region. Furthermore, the entropy weighting method made the areas with sensitive hydrogeological conditions more prominent by strengthening the role of parameters that have more dispersion and information diversity, such as groundwater depth, aquifer thickness, and land use. However, the overall position of high-risk and low-risk areas did not change significantly compared to the normal map, and most of the differences are observed in the intensity and boundaries of the classes. In
Figure 5c, the map obtained from the weights calibrated by the PSO algorithm presents a more refined and focused picture of the vulnerability of the aquifer in this period. To be more precise, the weights of the parameters of groundwater depth (D), net recharge (R), and slope/topography (T) increased, whereas the contribution of other factors, like soil, unsaturated environment, and land use, reduced. The index range in this map is more compact than in the normal case (about 44 to 167), indicating a reduction in fluctuations due to low-impact factors. The high-vulnerability areas in the west of the region are still preserved, but the patches are more coherent, and the boundary between the medium and high classes is more regular. In contrast, many areas in the high-vulnerability class in the entropy method have been moved to the medium class in the PSO map. Additionally, the central and eastern parts of the region are more uniform in the lower classes due to the deeper water table and more limited recharge.
According to
Figure 5, a comparison of the three weighting methods over the period 2015–2019 demonstrates that the normal method provides a broad and conservative picture of vulnerability, while the entropy method increases the severity of vulnerability in some areas. Finally, the PSO algorithm draws the most realistic and accurate spatial pattern of vulnerability. Thus, the PSO map is more reliable than those of two other weighting methods for management analyses and prioritization of critical areas during this time period.
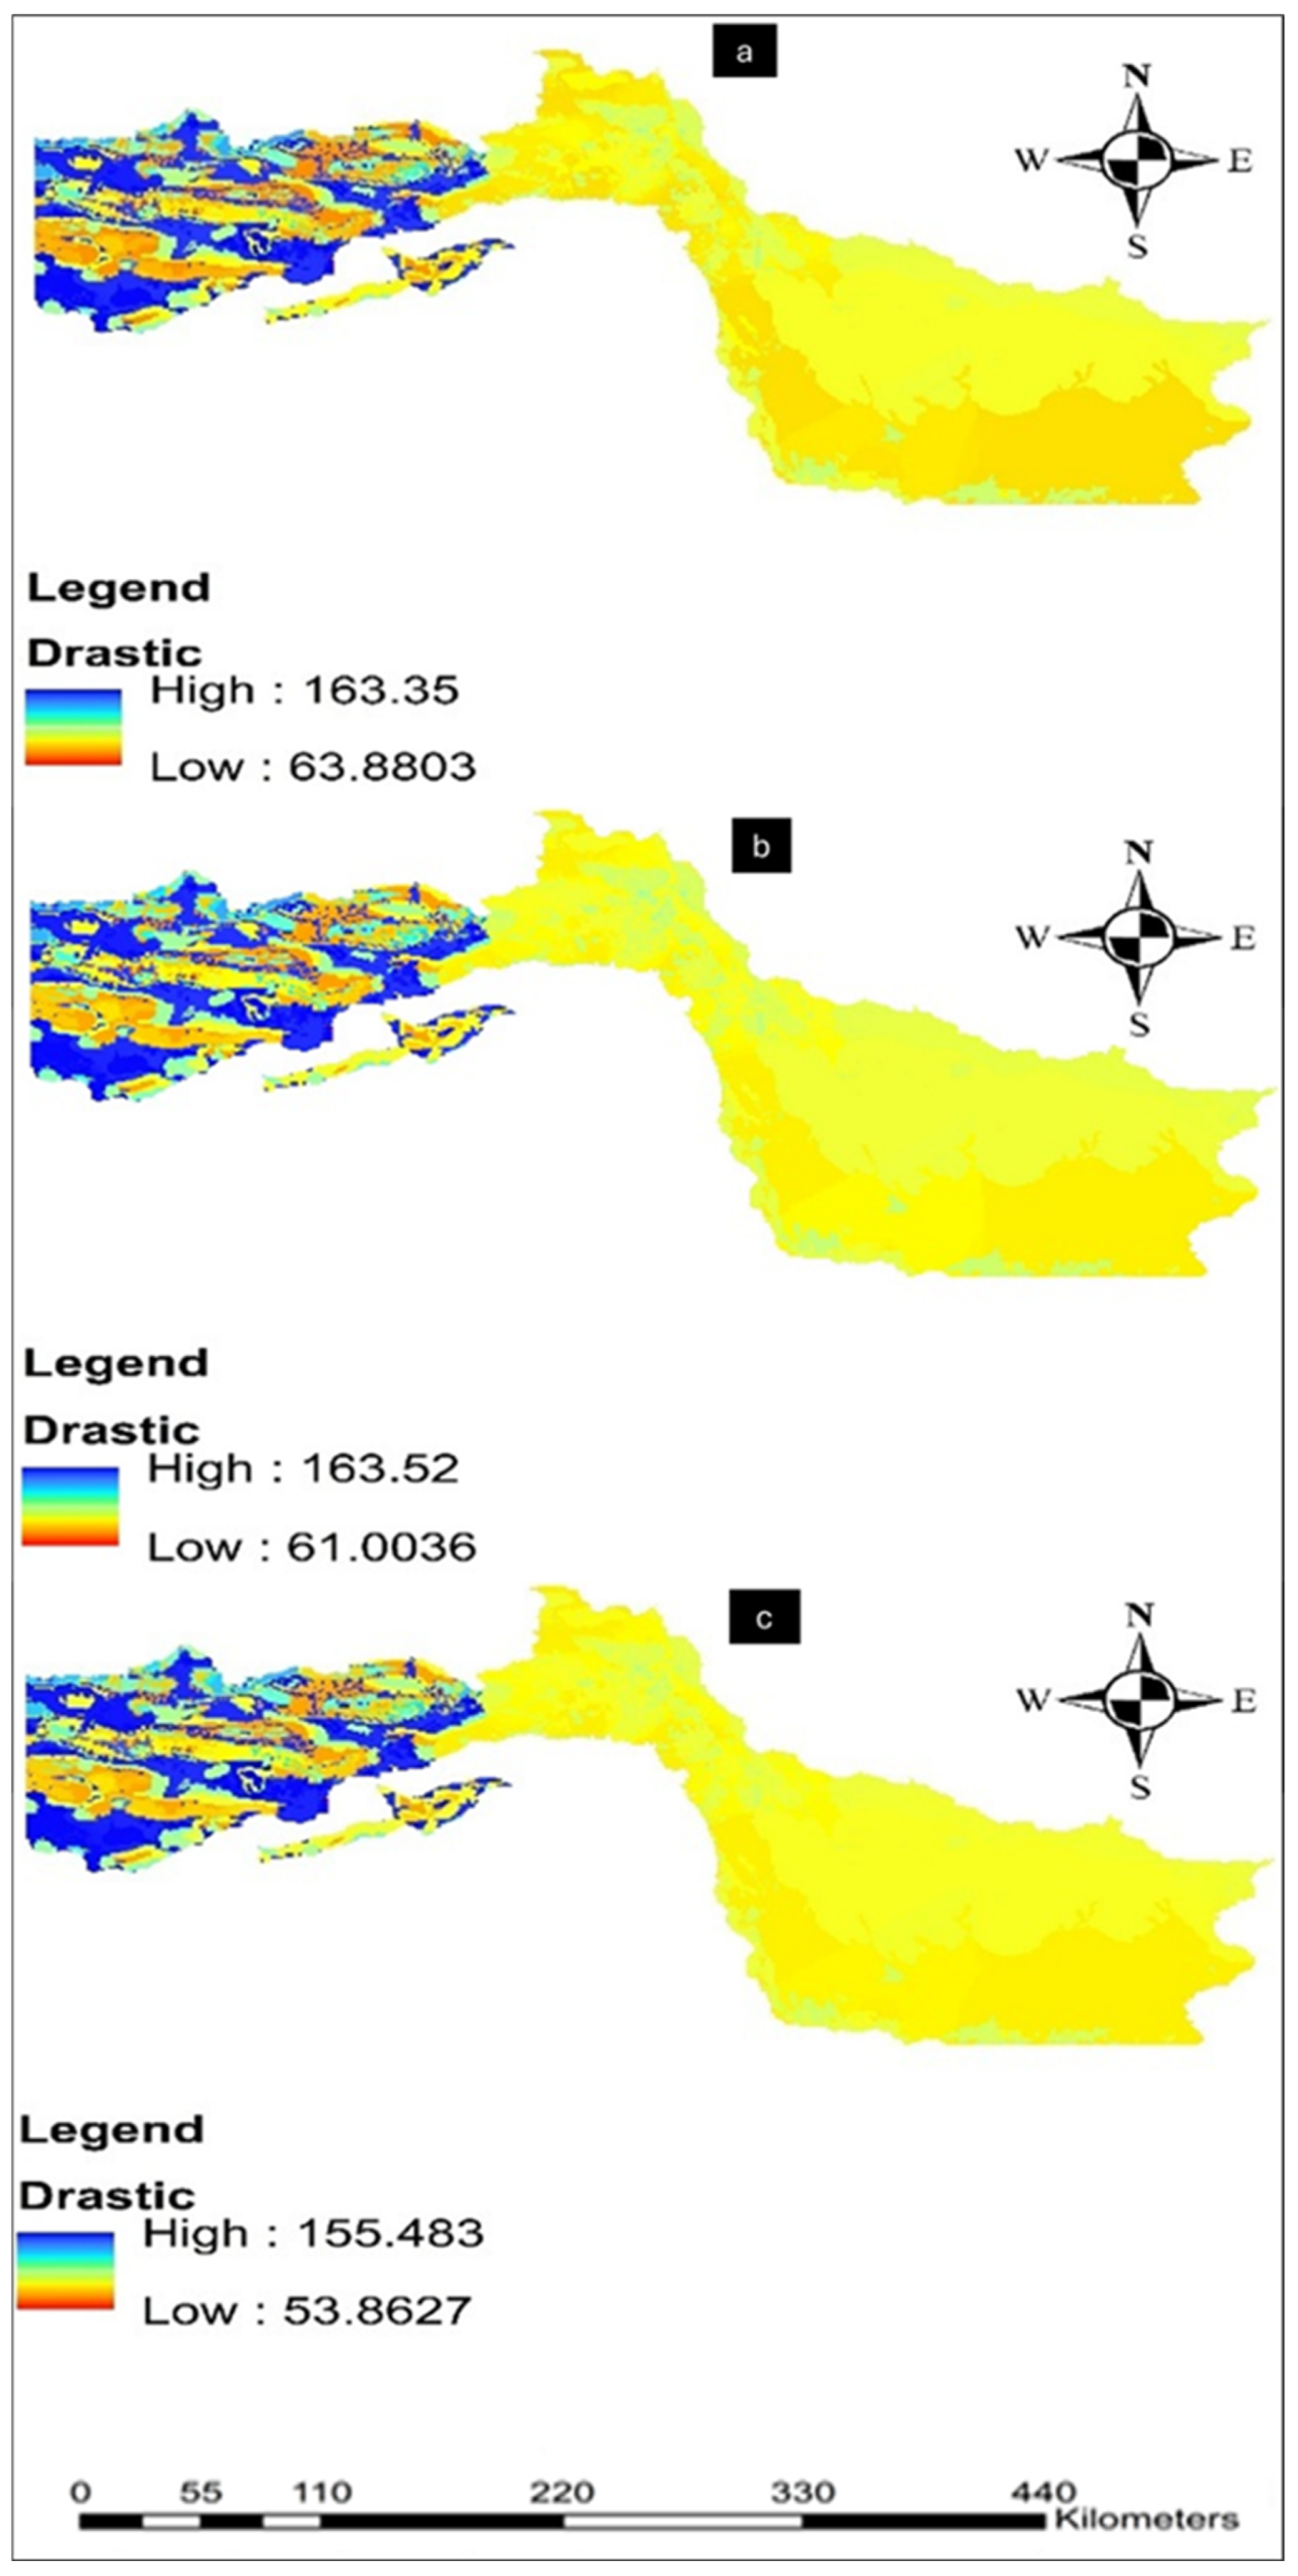
The DRASTIC aquifer vulnerability maps for the period 2020–2024 are presented in
Figure 6. As shown, the overall vulnerability pattern of the region is spatially similar to the previous periods but has experienced significant changes in terms of the severity and distribution of high-risk zones. These changes reflect the cumulative impact of hydrogeological pressures, ongoing groundwater withdrawals, and gradual land use changes over the past decade. In the normal-weighted DRASTIC map in
Figure 6a, the highest vulnerability is still observed in the western parts of the region, especially coastal plains and areas with shallow water tables and high permeability. The maximum value of the index in this period is about 163, which is slightly lower than that of the 2015–2019 period but still higher than that of the 2014–2010 period. Although the absolute severity of vulnerability has moderated in some western areas, these areas are still considered the most sensitive parts of the aquifer. In contrast, the central and eastern parts of the region are mainly in the low-to-medium vulnerability classes, which is attributed to the deeper groundwater table, gentler slope, and lower permeability of the formations. Overall, the normal map indicates that the natural structure and hydrogeological base characteristics have played a major role in determining the vulnerability pattern during this period. Furthermore, it indicates that there are no fundamental changes in zoning even though the relative decrease in the maximum values and the increase in the range of average values imply a gradual adjustment in the severity of the risk. In
Figure 6b, the entropy-weighted DRASTIC map for the period 2020–2024 presents a more balanced picture of vulnerability. As shown, the range of changes in the index in this map is between about 61 and 163.52, which indicates a relative compression of the range of values compared to the normal state. Although the western areas still have the highest vulnerability, the intensity of the colors related to very high classes has decreased slightly, and the class boundaries have become softer. In the central and southeastern parts, due to the redistribution of weights and the relative increase in the contribution of some parameters, such as land use, recharge, and hydraulic conductivity, the vulnerability values have increased slightly compared to the normal model and are mostly in the low to medium range. This pattern shows that the entropy method, by reducing the bias caused by empirical weights, provides a more realistic picture of the statistical behavior of the data and can be interpreted as an intermediate between the classical normal model and the PSO technique. In the DRASTIC map with calibrated PSO weights illustrated in
Figure 6c, the vulnerability index varies in a range of about 53.8 to 155.5. Although the range of values has decreased slightly compared to those of two other methods, the spatial contrast and separation of sensitive zones have become much clearer. In this model, by strengthening the weights of the parameters of groundwater depth (D), net recharge (R), and hydraulic conductivity (I), truly critical zones, especially the western coastal plains and the Persian Gulf marginal strip, have been more strongly identified as high-risk areas. In contrast, the central and eastern regions, which do not have an unfavorable combination of these key parameters, have remained more coherently in the low to medium classes. Compared to the entropy map, many areas with heterogeneous data or limited parameter influence are moved to lower classes, and only areas that are truly hydrogeologically susceptible to pollution are highlighted. This feature indicates that PSO was able to reduce statistical noise and increase the focus of the model on real effective processes.
Overall,
Figure 6 demonstrates that all three weighting methods provide a similar spatial pattern of vulnerability distribution, while they have fundamental differences in the intensity and extent of high-risk zones. The normal method provides the simplest and most conservative picture and is more subject to classical fixed weights; the entropy method has a higher sensitivity to data dispersion and highlights spatial differences; and finally, the PSO method provides the most accurate and focused picture of truly critical areas of the aquifer. Accordingly, for management analyses, groundwater quality monitoring, and prioritization of conservation measures in the period 2020–2024, the results obtained from the PSO-based DRASTIC model are more reliable.
Applying the DRASTIC model to evaluate the aquifer’s total risk for three five-year windows (2010–2014, 2015–2019, and 2020–2024)indicates that overall the spatial distribution of vulnerability zones remains largely stable; however, the intensity, extent, and density of these high-risk zones have been changing throughout this period with some identifiable trends developing due to cumulative effects of hydrogeological stressors, continuous groundwater extractions, land-use conversions, and climate change over a 15-year period. In the first period (2010–2014), the DRASTIC maps exhibited a classic pattern of aquifer vulnerability, with the highest index values observed mainly in the western regions and coastal plains. This pattern was largely controlled by the natural characteristics of the hydrogeological system, especially the shallow depth of the groundwater table, high permeability of alluvial sediments, and high hydraulic conductivity. During this period, the extent of high-risk zones was relatively limited, and the central and eastern parts of the region were mainly in the low- to medium-vulnerability classes. In other words, the vulnerability of the aquifer during this period was more “intrinsic” in nature, and the impact of human activities was not yet widely reflected in the spatial structure of the model. In the second period (2015–2019), the severity of vulnerability increased in the coastal and western areas, and the range of index values expanded in all weighting methods. This change indicates an intensification of pressure on the aquifer, especially due to increased groundwater withdrawal, water table decline, and the expansion of agricultural and urban activities. During this period, the zones with medium to high vulnerability also developed in some central areas, indicating a gradual transfer of risk from purely coastal areas to the more inland parts of the aquifer. In fact, the intermediate period can be considered a “transition” stage in the behavior of the system, in which the role of human factors has become more prominent alongside natural factors. Although the overall spatial pattern of vulnerability in the third period remained similar to previous ones, the concentration of very high-risk zones increased, and some areas with very high values in the previous periods showed a relative adjustment. It demonstrates two simultaneous trends: (a) an intensification of vulnerability in truly sensitive areas, such as the western coastal plains with shallow groundwater depth and high recharge, and (b) a relative reduction or stabilization of vulnerability in intensity in some areas that have probably reached saturation of the effects of harvesting or changes in the exploitation pattern. Particularly, high-risk zones obtained in the calibrated models (entropy and PSO) have become more concentrated and coherent in the third period, suggesting an increase in the model’s capability to distinguish truly critical areas from areas with moderate risk.
3.3. GALDIT Result
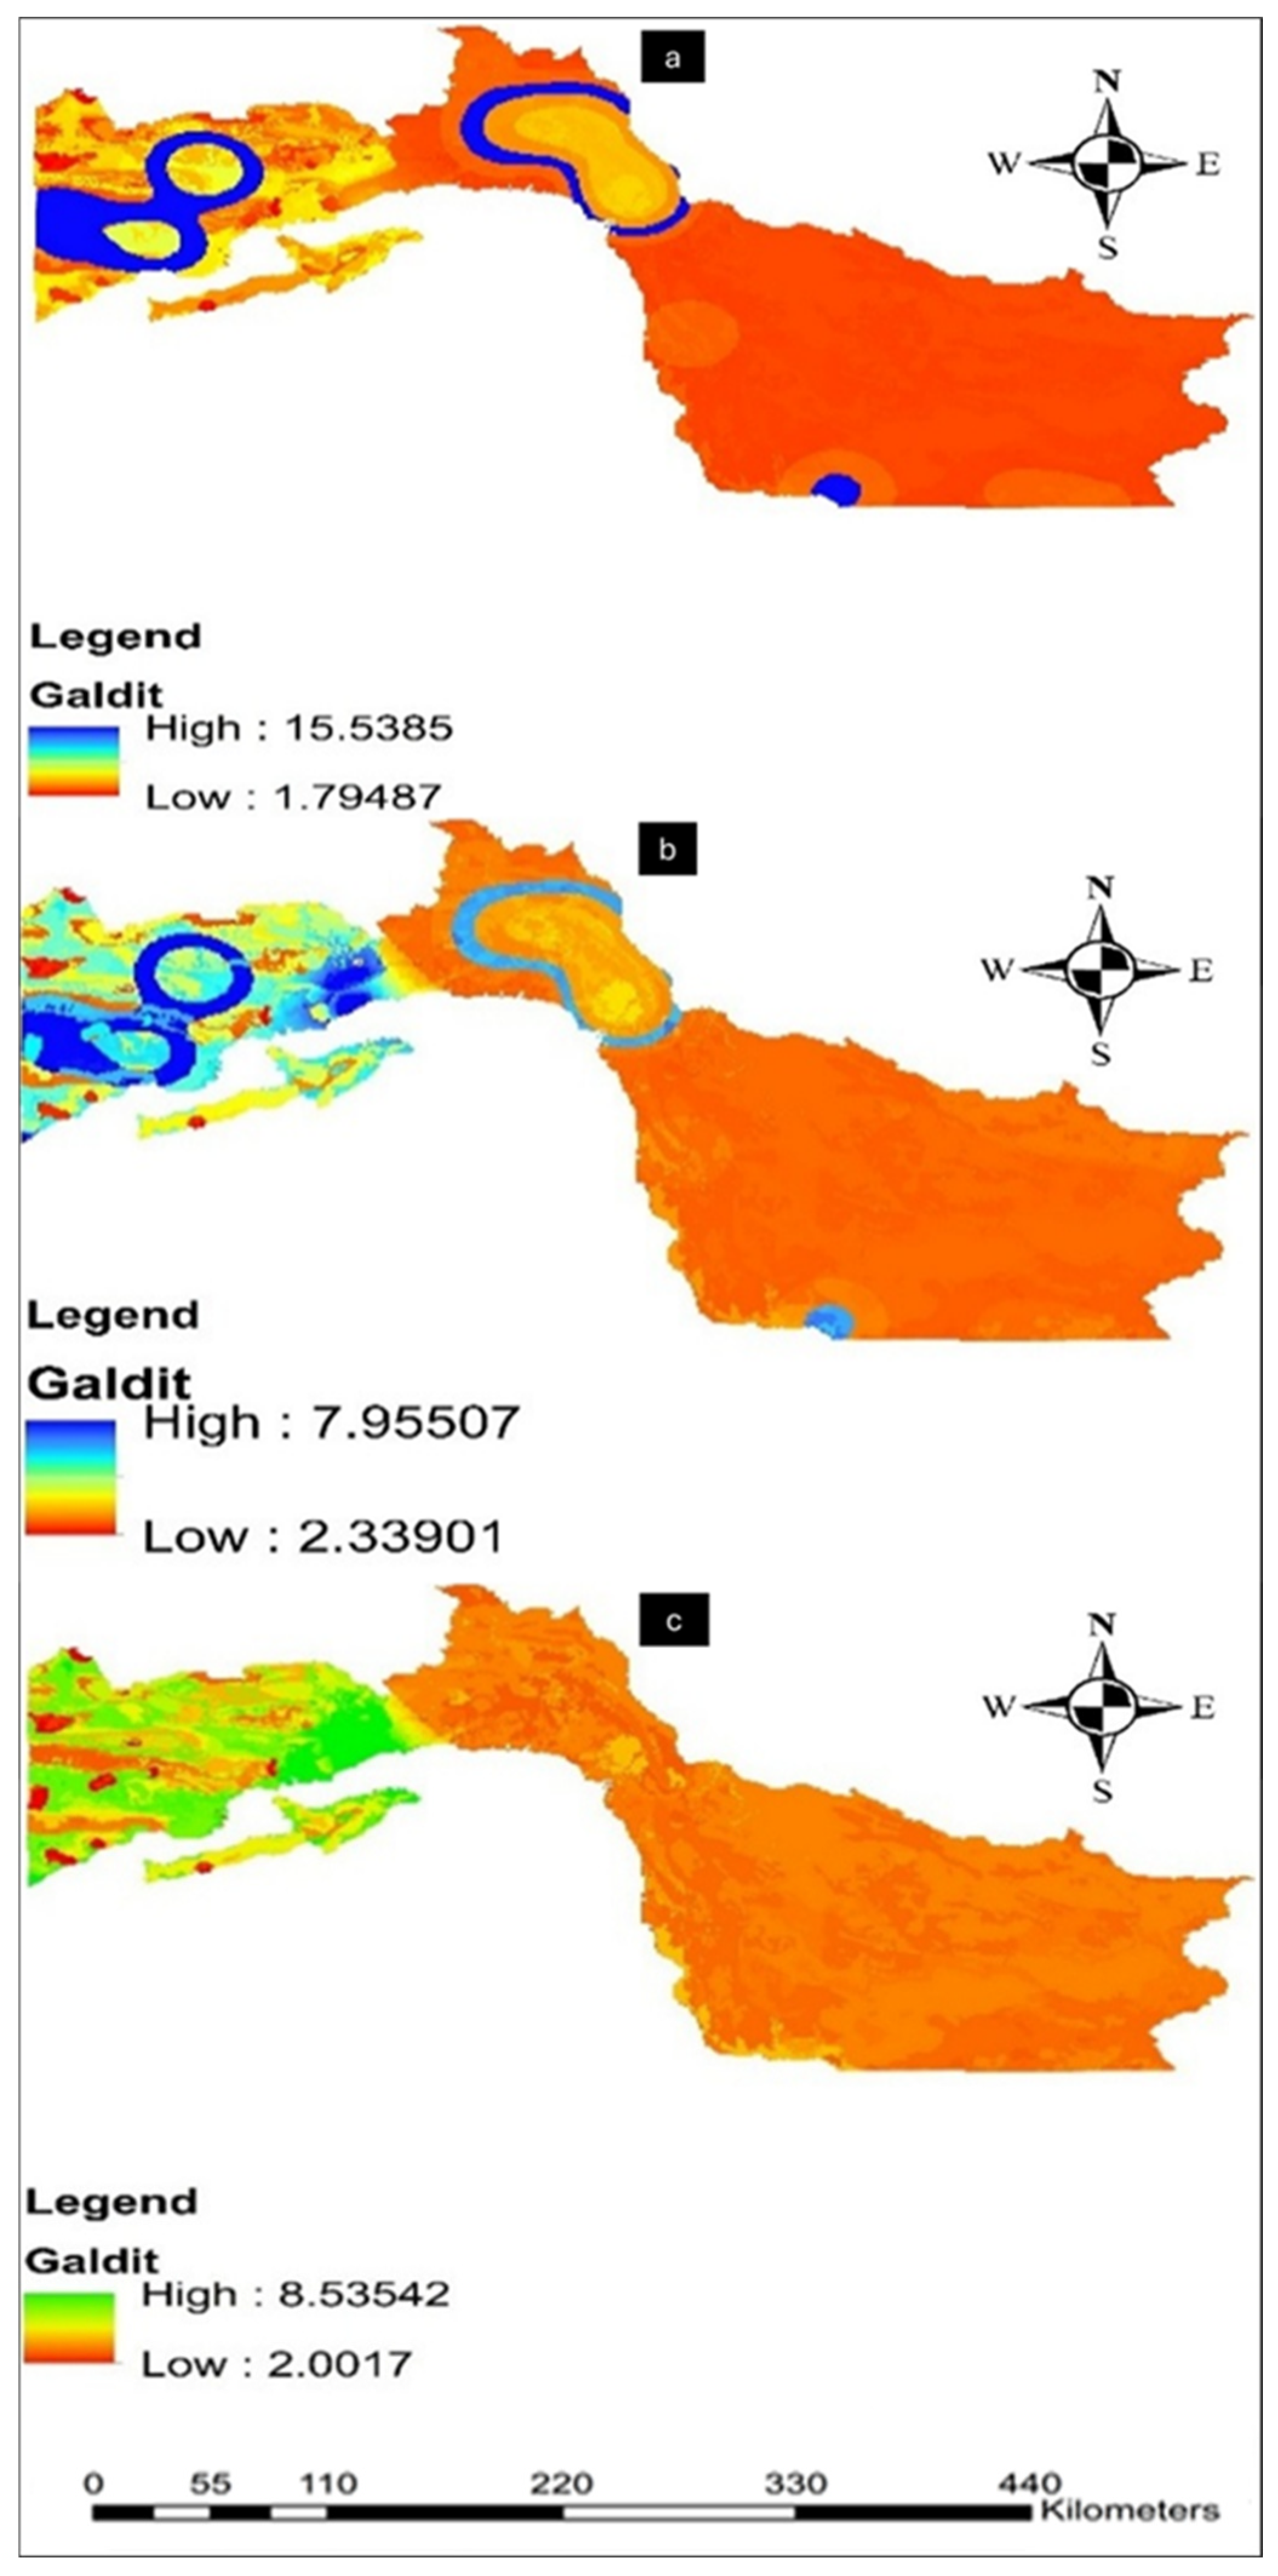
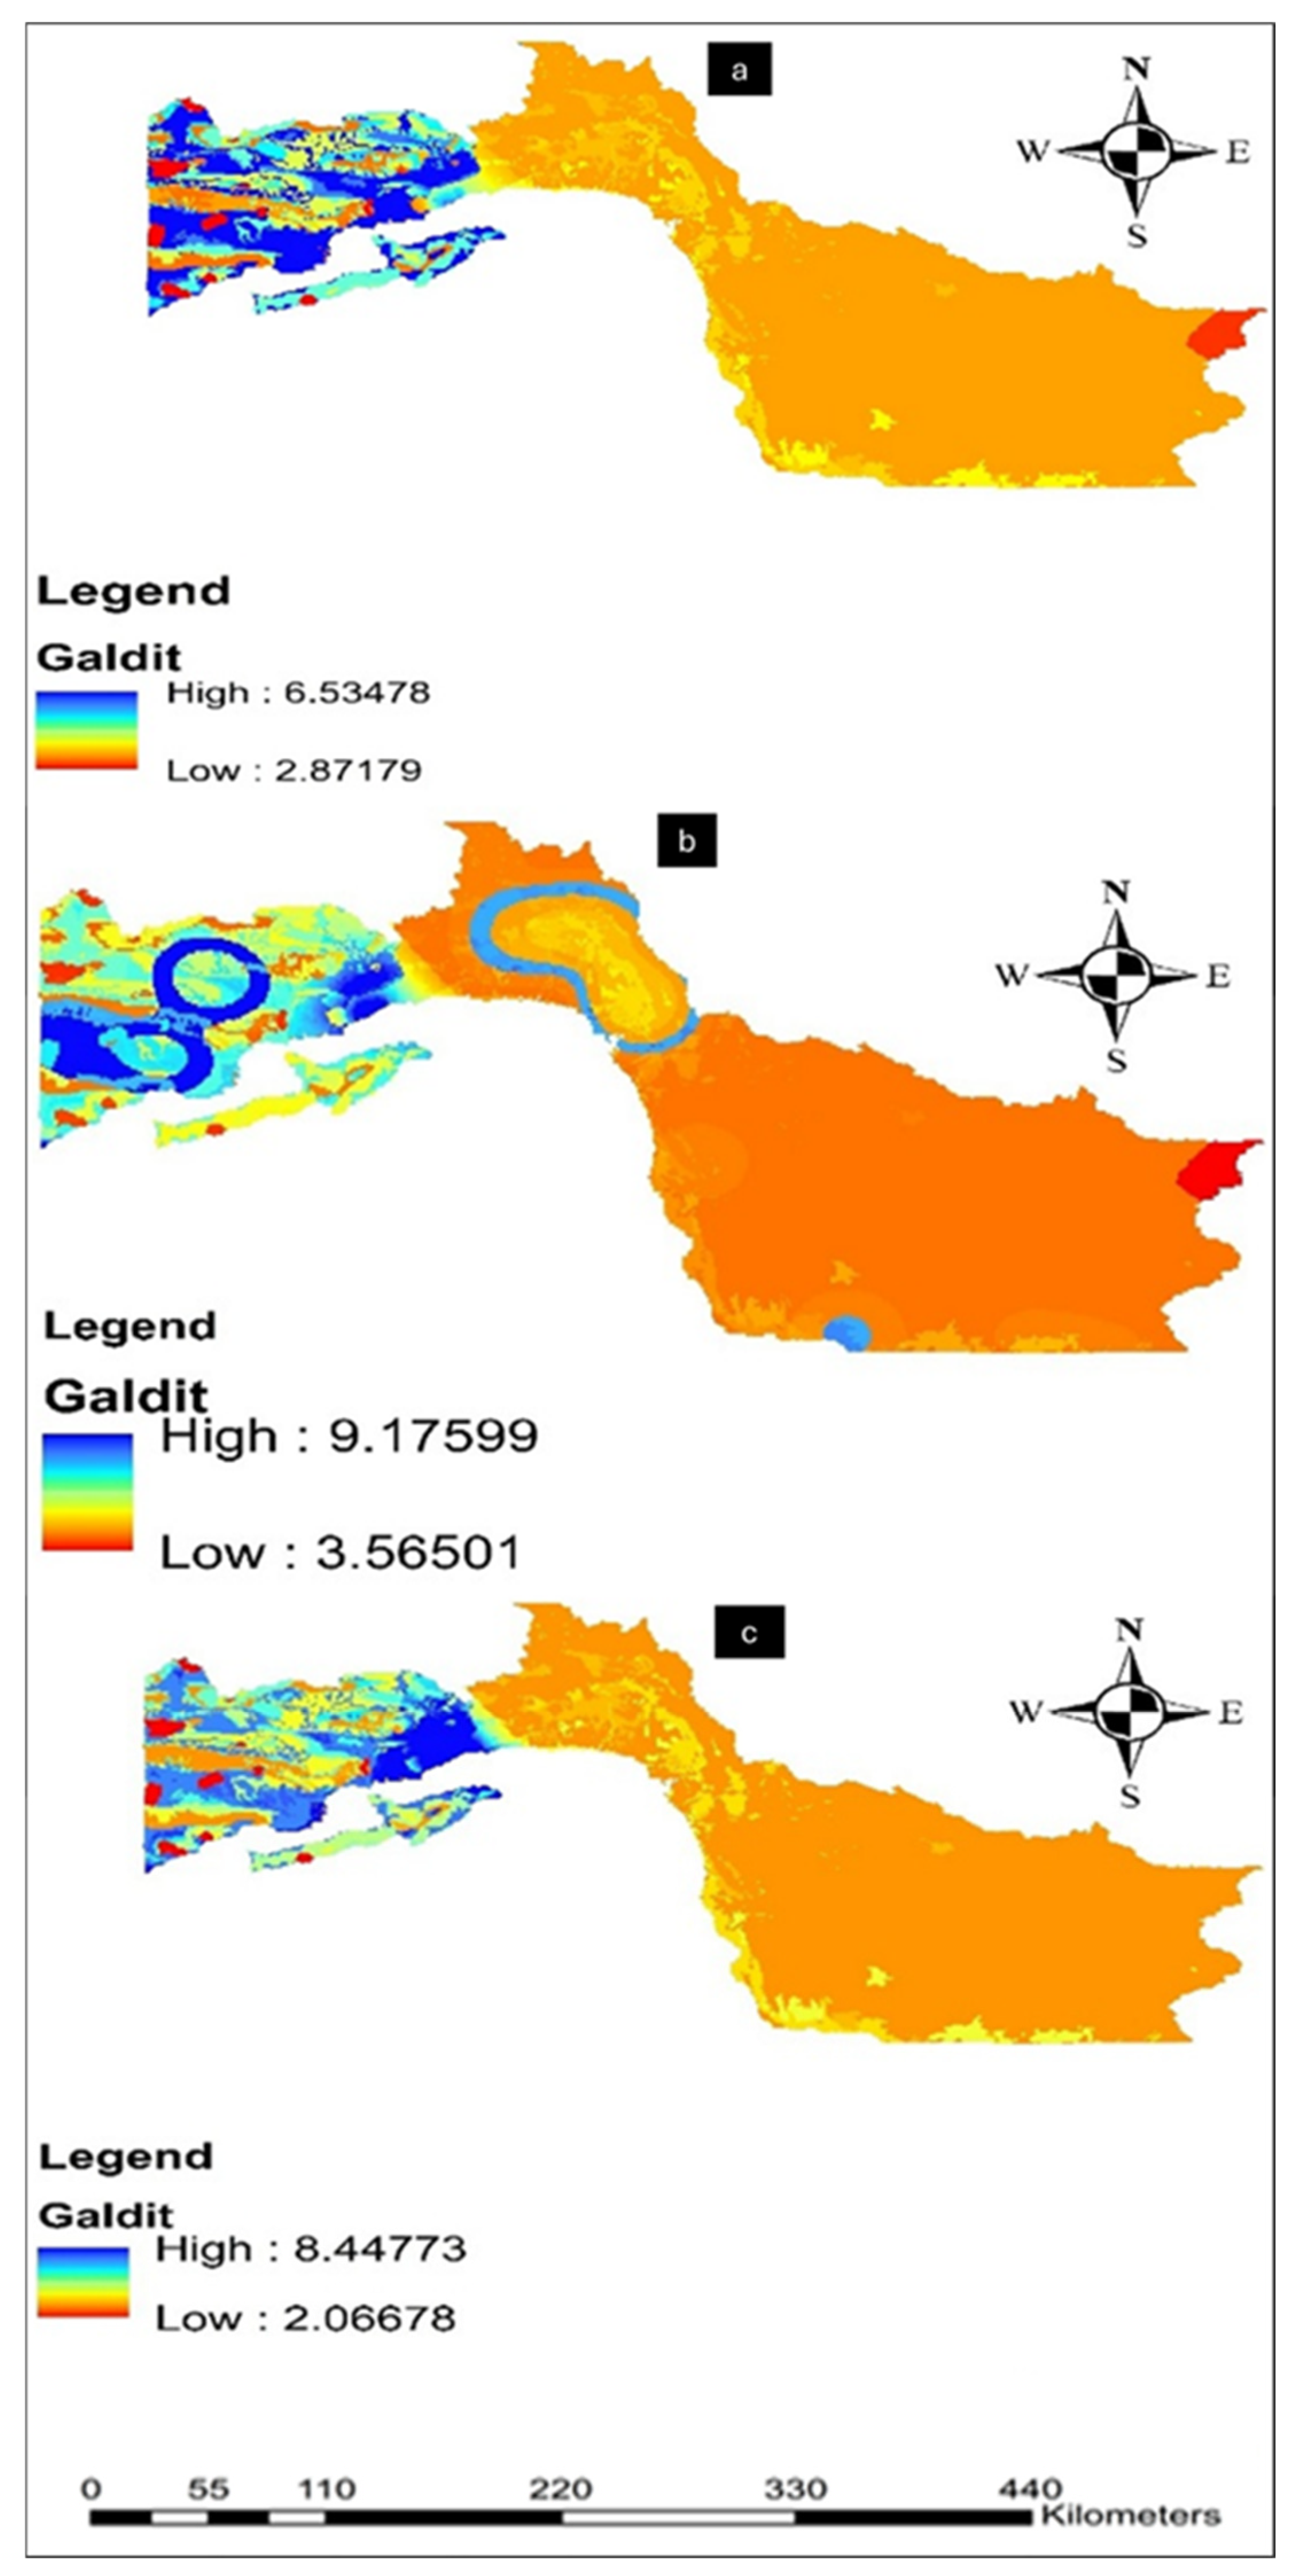
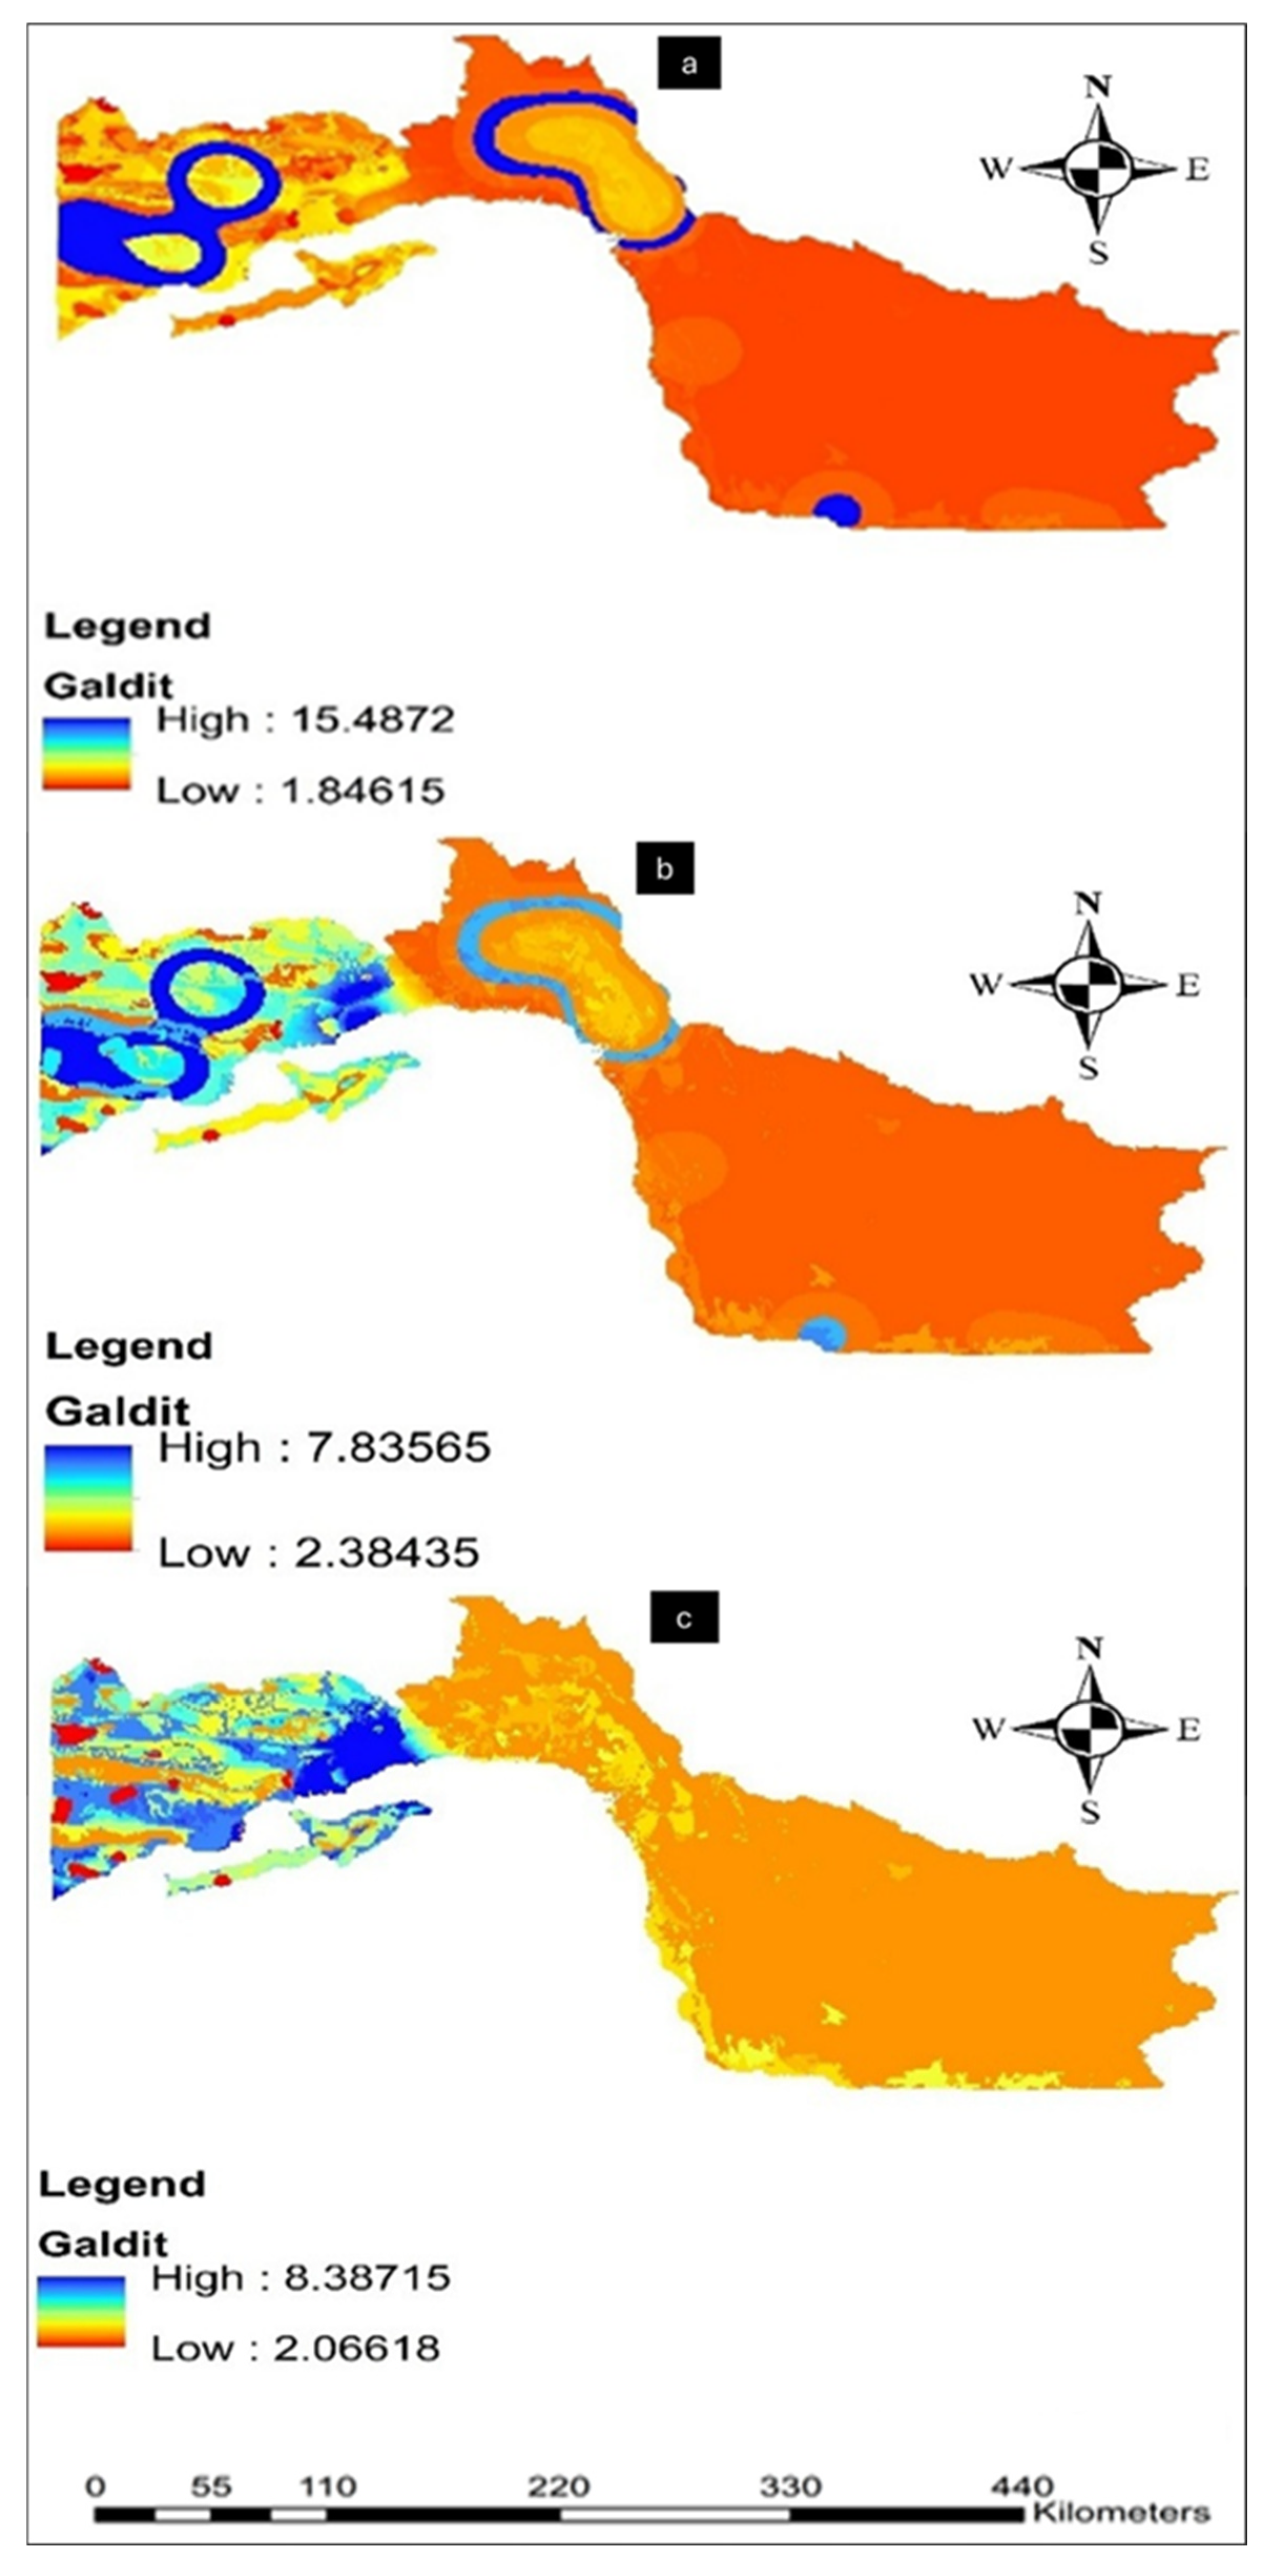
The GALDIT index map for the period 2010–2014, using three weighting methods shows different patterns of vulnerability of coastal aquifers in Hormozgan province. In
Figure 7a of the normal weighting method, the index values vary from 2.87 to 6.53, indicating a range from low to very high vulnerability. The spatial pattern of
Figure 7a demonstrates that the eastern parts of the province, including Minab, Sirik, and Jask, are mainly in the medium- to high-vulnerability classes, a situation that could be due to the shallow depth of the groundwater table, high permeability of coastal sediments, proximity to the coastline, and high density of extraction wells. In contrast, higher elevations and areas further from the coast, especially in parts of the western part of the province and the center of Qeshm Island, generally show lower vulnerability, which is consistent with more resistant lithology, higher slope, and deeper groundwater table. However, due to the use of fixed weights, GALDIT has a limited ability to distinguish local differences and the real complexities of the hydrogeological system. In
Figure 7b, the range of index values achieved by the entropy weighting method has increased significantly (from 3.56 to 9.17). This rise in the range indicates GALDIT’s higher sensitivity to statistical dispersion of the data. In the entropy map, the spatial contrast between the low- and high-risk zones is intensified, and larger parts of the eastern parts of the province, especially Minab, Jask, and Sirik, are in the high to very high vulnerability classes. Furthermore, in some coastal areas of the western part of the province, index values have increased compared to the normal method. It indicates that the entropy method overemphasizes factors, such as high electrical conductivity, shallow groundwater depth, and proximity to the sea. However, in some cases, an exaggeration of the risk is observed, which could be due to the lack of direct consideration of physical processes and the focus solely on the statistical properties of the data. In
Figure 7c, the map obtained from the PSO algorithm for the same time period presents a more balanced and realistic pattern of vulnerability of coastal aquifers. The index range in this method is between 2.06 and 8.44, which is narrower than that of entropy but more spatially coherent. By optimally adjusting the weights based on maximizing spatial compatibility and reducing the effect of statistical noise, the PSO algorithm has been able to identify areas that are truly sensitive to saltwater interference with greater accuracy. In
Figure 7c, the high vulnerability zones are mainly limited to parts of the eastern part of the province and some coastal areas south of Minab, while the western areas and areas with more stable geological conditions remain in the low to medium classes. This spatial concentration reveals the higher power of PSO in distinguishing between the true effect of hydrogeological factors and the mere dispersion of the data.
Overall, a comparison of the three weighting methods shows that the normal method provides a general and conservative picture of vulnerability, the entropy method has a higher resolution with an increase in the range of index values but leads to an exaggeration of the risk in some areas, and the PSO method provides the most accurate estimate of the vulnerability status of coastal aquifers in the period 2010–2014 by providing a more coherent and realistic map. Therefore, the results of this period indicate that the use of PSO can play an effective role in reducing weight uncertainty and increasing the reliability of vulnerability maps and can be a suitable basis for analyzing temporal changes and making management decisions in subsequent periods.
The vulnerability maps of coastal aquifers in Hormozgan province during the period 2015–2019, prepared with the GALDIT model and three weighting methods, indicate a continuation and at the same time an intensification of the trend of increasing vulnerability compared to the previous period. In the normal weighting method shown in
Figure 8a, which is based on the fixed and classical weights of the model, a wide range of coastal areas, especially in the west and south of the province, including Minab, Qeshm, and parts of Bandar Lengeh, are in the medium to high vulnerability classes. The increase in the maximum value of the index during this period indicates the intensification of hydrogeological pressures, including the decline in groundwater levels, increased well withdrawals, and the gradual advance of saltwater. However, due to the fixed nature of the weights, this method has limited sensitivity to local changes and tends to generalize high-risk areas on a large scale. In contrast, the entropy-weighted map in
Figure 8b presents a disaggregated picture of vulnerability. In this method, the range of index changes is more compressed, and the areas of high vulnerability appear mainly as limited and isolated spots in the western and central coastal areas. This pattern shows that entropy, by emphasizing indicators with greater statistical dispersion, has been able to keep the areas further from the sea and the interior of the province in low-risk classes with higher accuracy. However, in some places, especially in areas with severe data fluctuations, there is still a possibility of risk exaggeration, which relies on statistical features.
Figure 8c depicts the map obtained from the PSO algorithm, which shows the most balanced and realistic spatial pattern of vulnerability for this time period. In
Figure 8c, most of the eastern and central aquifers of the province remain in the medium vulnerability class, while high-risk zones are identified in a concentrated and limited manner in truly sensitive areas, especially in Minab, Qeshm, and parts of Bandar Lengeh. By optimizing the weights based on the final model performance, PSO has been able to better reflect the real effect of parameters, such as groundwater depth, electrical conductivity, distance from the coast, and lithological characteristics, and prevent risk overestimation or underestimation.
According to
Figure 8, a comparison of the three weighting methods over the period 2015–2019 overall demonstrates that the normal method provides a conservative approach with a broad vulnerability zoning; the entropy method is more sensitive to data variability and creates more spatial contrast. Finally, the PSO algorithm provides the most accurate and reliable picture of the real vulnerability status of coastal aquifers. Accordingly, the results obtained by PSO can be a more appropriate basis for management decision-making, prioritization of conservation measures, and monitoring of critical areas during this period.
Figure 9 presents the vulnerability maps of coastal aquifers in Hormozgan province in the period 2020–2024, obtained by applying the GALDIT model and three weighting methods. It indicates a significant intensification of the salinization trend and increased hydrogeological pressure compared to the previous two periods. Using the normal weighting method (
Figure 9a), the range of the GALDIT index includes a wide range of low to very high values. Furthermore, a large part of the eastern and southern coastal areas of the province, especially on the Makran fringe and the areas close to the low-lying coast, are in the high to very high vulnerability classes. This pattern indicates an increase in saltwater intrusion from the Oman Sea and an intensification of groundwater level decline under the influence of human withdrawals, urbanization development, and a decrease in natural recharge of aquifers. At the same time, the central areas of the province remain mainly in the medium vulnerability class, which indicates a greater distance from the coast and relatively more stable geological conditions. However, due to the use of fixed weights, the normal method tends to overestimate high-risk areas and understate local differences.
Figure 9b shows the GALDIT map based on entropy weighting for the same period, providing a more balanced picture of vulnerability. To be more specific, the range of index changes is more compressed, and the severity of vulnerability is moderated compared to the normal method. Coastal areas remain in the medium- to high-vulnerability classes, but the extent of very high-risk areas has decreased, and their concentration is mainly limited to coastal strips and areas with strong evidence of inundation. The interior and central parts of the province remain mainly in the low to medium classes, which are more consistent with the hydrogeological reality of the region. These results indicate that the entropy method, by emphasizing the dispersion of information and statistical diversity of indicators, has prevented unrealistic risk magnification and achieved a more accurate distinction between coastal and non-coastal areas. In contrast, in
Figure 9c, the map obtained from the PSO algorithm presents the most accurate and structured spatial pattern of vulnerability for the period 2020–2024. As shown, the zones with high and very high vulnerability are identified in a concentrated and limited manner, mainly in the western coastal areas of the province, including Bandar Lengeh, Gavbandi, and parts of Qeshm. This concentration demonstrates the dominant role of factors, such as high electrical conductivity, shallow groundwater depth, and permeable geological conditions in these areas. In contrast, the eastern areas of the province, including Minab, Sirik, and Jask, are in low to medium classes, indicating that PSO, by optimally adjusting the weights of the parameters, has prevented overestimation of vulnerability in areas further from the sea and has presented a more realistic picture of the conditions. Also, transitional areas with medium vulnerability are observed between the western coast and the central parts, which mainly correspond to alluvial aquifers with intermediate hydrogeological conditions.
In summary, the comparison of the three weighting methods in the period 2020–2024 shows that the normal weighting method displays the largest range of high-risk zones and has a conservative and somewhat exaggerated approach, while the entropy method provides a more balanced model by adjusting the intensity of the values. Finally, PSO provides the most accurate and realistic estimate of the vulnerability of coastal aquifers. The results of this period show that despite the difference in the intensity and extent of vulnerable zones, the overall trend of salinization in the coastal aquifers of the province has intensified in recent years, and the management of groundwater withdrawal, control of coastal development, and continuous monitoring of critical areas, especially on the western coast of the province, are inevitable.
The results of applying the GALDIT model in three five-year periods of 2010–2014, 2015–2019, and 2020–2024 indicate an increasing and alarming trend in the vulnerability of coastal aquifers in Hormozgan province to saltwater intrusion. The study of the temporal changes in the GALDIT index indicates that in the first period, vulnerability was mainly concentrated in limited coastal areas, and large parts of the inland areas were in low to medium classes. However, from the second period onwards, both the intensity and the extent of vulnerable areas increased, and in the third period, a significant part of the coastal areas of the west and east of the province were transferred to high and very high vulnerability classes. The temporal changes reflect the intensification of human pressures, increased groundwater withdrawal, decline in aquifer levels, decreased natural recharge, and the expansion of human activities in coastal areas. A comparison of the three different weighting methods over 15 years shows that even though the general pattern of increasing vulnerability is common to all methods, the intensity and manner of representing high-risk areas differ significantly. The normal weighting method tends to represent the areas with moderate to high vulnerability over all periods, and consequently, it reaches a conservative and somewhat exaggerated approach. In contrast, the entropy method has been able to create a better separation between low-risk and high-risk areas and prevent unrealistic magnification of the risk in inland areas even though in some places with severe data fluctuations, the smoothing effect is still observed. Moreover, the PSO algorithm yielded the most accurate and realistic picture of the vulnerability of coastal aquifers over the entire 15-year period. It shows that high-vulnerability zones are mainly concentrated and consistent with the actual hydrogeological conditions, especially in the coastal aquifers of the western part of the province (Bandarlenge, Gavbandi, and parts of Qeshm) and some sensitive eastern areas. It extracted the real effect of key GALDIT parameters, including groundwater depth, electrical conductivity, distance from the coast, and lithological characteristics, and reduced the statistical noise present in two other methods. Overall,
Figure 3,
Figure 4 and
Figure 5 indicate that coastal aquifers in Hormozgan province have been confronted with an increasing risk of saltwater intrusion over the last 15 years. Furthermore, under present conditions, the potential for future expansion of critical zones is likely to occur in the next several years. In this context, intelligent optimized weighting methods like PSO coupled with Entropy can represent viable solutions to providing managers with accurate information on controlling groundwater extraction and developing sustainable adaptation strategies to preserve water resources in coastal regions.
4. Discussion
The spatio-temporal assessment of groundwater vulnerability in the coastal aquifers of Hormozgan Province using the DRASTIC and GALDIT models reveals a complex interplay between intrinsic hydrogeological conditions, anthropogenic pressures, and methodological influences associated with weighting strategies and land-use representation. Interpreting the observed temporal increases in vulnerability therefore requires a careful distinction between genuine hydrogeological degradation and variations induced by model structure and parameter weighting.
Across all three five-year periods (2010–2014, 2015–2019, and 2020–2024), both DRASTIC and GALDIT models consistently identified coastal and western alluvial plains as the most vulnerable zones. This spatial persistence, observed irrespective of the weighting method, strongly suggests that the primary drivers of vulnerability are real hydrogeological processes rather than methodological artifacts. Key controlling factors include shallow groundwater table depth, high permeability of Quaternary alluvial sediments, gentle topography, proximity to the coastline, and intensive groundwater abstraction. These characteristics have been widely reported as dominant drivers of groundwater contamination and salinization in arid and semi-arid coastal regions and are well documented for southern Iran.
The temporal evolution of vulnerability indicates an overall intensification of stress on the aquifer system over the 15-year period. In the early period (2010–2014), vulnerability patterns were largely controlled by intrinsic hydrogeological settings, with limited spatial expansion of high-risk zones. During the intermediate period (2015–2019), the extent and intensity of medium-to-high vulnerability classes increased, particularly in coastal and western areas, reflecting cumulative impacts of groundwater level decline, expansion of irrigated agriculture, and increased urban water demand. In the most recent period (2020–2024), vulnerability became more concentrated and spatially coherent in truly sensitive zones, suggesting that prolonged stress has reduced the natural buffering capacity of the aquifers and amplified their susceptibility to pollution and saltwater intrusion.
While the overall direction and spatial location of vulnerability trends are robust, the magnitude and spatial extent of high-vulnerability classes are influenced by the choice of weighting strategy. The normal (classical) weighting approach provides a conservative and relatively uniform representation of vulnerability, reflecting the original conceptual design of DRASTIC and GALDIT. In contrast, Shannon entropy weighting derives parameter importance from data dispersion and therefore tends to amplify vulnerability in areas with higher statistical variability. This behavior can lead to local exaggeration of vulnerability in heterogeneous zones, even if physical conditions are only moderately unfavorable.
The PSO-based weighting approach, by optimizing parameter weights under a defined objective function, produces more spatially concentrated and hydrogeologically coherent vulnerability patterns. However, PSO results remain dependent on algorithm settings and the chosen optimization criterion. Consequently, PSO-based maps should be interpreted as optimized representations of relative vulnerability rather than deterministic predictions. Importantly, despite differences in intensity and class boundaries, all three weighting methods consistently identify the same critical areas and show similar temporal trajectories. This consistency demonstrates that weighting strategies mainly modulate vulnerability intensity, not the direction of change, reinforcing the conclusion that the observed temporal increases primarily reflect real hydrogeological degradation rather than methodological artifacts
It is important to recognize that numerical weighting methods used in index-based vulnerability assessment, including entropy- and PSO-based approaches, do not explicitly represent the physical groundwater system. These methods operate on numerical parameter values and statistical or optimization principles rather than on process-based simulation of flow and solute transport. As a result, vulnerability patterns may be influenced by data distribution, normalization, and optimization objectives, potentially amplifying or attenuating certain parameters independently of their direct physical causality.
In this study, vulnerability indices are therefore interpreted as conceptual screening tools rather than physically calibrated models. Consequently, calibration is not performed in the classical numerical modeling sense. Instead, the evaluation of weighting methods relies on comparative and consistency-based criteria. Weighting schemes are assessed according to their ability to produce spatially coherent vulnerability patterns that align with known hydrogeological controls, such as shallow groundwater levels, high-permeability alluvial deposits, proximity to the coastline, and areas of intensive groundwater abstraction.
Rather than identifying a single “best” weighting method, robustness is inferred from the persistence of high-vulnerability zones across different indices, weighting strategies, and time periods. Areas consistently classified as highly vulnerable are considered more reliable for groundwater management and prioritization, while discrepancies among weighting methods highlight uncertainty and sensitivity to methodological assumptions. This approach allows vulnerability mapping results to be interpreted cautiously and transparently, acknowledging both their utility and their inherent limitations.
Land-use change represents an important anthropogenic driver of groundwater vulnerability, particularly through increased abstraction, fertilizer application, and urban wastewater generation. In this study, land use was incorporated as a supplementary parameter in modified versions of both DRASTIC and GALDIT models. To reduce classification-induced uncertainty, a consistent land-use classification scheme, ranking system, and aggregation of functional land-use groups were applied across all time periods. This approach ensured that temporal comparisons reflect actual land-use transitions rather than methodological inconsistencies.
Although direct field validation of PSO-based vulnerability maps is limited at the regional scale, the performance of PSO was evaluated through comparative and consistency-based criteria. The PSO-weighted results exhibit greater spatial coherence, reduced overestimation of high-vulnerability zones compared to entropy-based weighting, and stable identification of critical areas across multiple time periods and across both DRASTIC and GALDIT models. These characteristics indicate that PSO improves the discrimination between hydrogeologically meaningful vulnerability patterns and statistical artifacts. Nevertheless, PSO-based weighting should be interpreted as an optimization-based screening approach rather than a definitive validation of vulnerability, and its application to long-term groundwater management should be complemented by independent hydrochemical validation and process-based modeling in future studies.
Although land-use changes locally intensified vulnerability, especially in agricultural and urban expansion zones, they did not control the overall temporal trend. Hydrogeological parameters such as groundwater depth, recharge, aquifer properties, and distance from the coastline remained dominant in both models. Therefore, land-use representation primarily influenced local vulnerability amplification rather than generating artificial regional-scale trends.
Index-based models such as DRASTIC and GALDIT are inherently conceptual screening tools that assess relative vulnerability rather than directly simulating contaminant transport or saltwater intrusion dynamics. Their reliability depends on input data quality, spatial resolution, and the assumptions embedded in weighting and aggregation procedures. In addition, comprehensive field validation at the provincial scale is constrained by monitoring density and data availability.
Despite these limitations, the combined use of two complementary indices (DRASTIC for intrinsic pollution vulnerability and GALDIT for saltwater intrusion) and multiple weighting schemes provides an effective robustness check. Areas identified as highly vulnerable across models, weighting methods, and time periods can be considered higher-confidence priority zones for management and monitoring. Future studies should further strengthen validation by integrating independent hydrochemical indicators (e.g., EC, Cl−, NO3−), continuous monitoring data, and numerical flow–transport modeling at representative sub-aquifer scales.
The confidence with which identified high-vulnerability zones can support groundwater management decisions depends on the type of decision being considered. In the absence of independent validation data, vulnerability maps derived from DRASTIC and GALDIT models are most reliable for relative prioritization rather than for site-specific engineering design. Zones consistently classified as high risk across multiple models, weighting schemes, and time periods represent robust targets for monitoring, protection, and precautionary management. However, uncertainties remain when extrapolating these results to long-term planning. These uncertainties stem from limitations in monitoring density, potential classification errors in land-use mapping, sensitivity of data-driven and optimization-based weighting methods, and the conceptual nature of index-based vulnerability models. Consequently, long-term groundwater management strategies should integrate vulnerability mapping with adaptive monitoring, periodic model updating, and complementary numerical simulations to reduce uncertainty and improve decision robustness over time.
The PSO-optimized DRASTIC and GALDIT models enhance the distinction between true hydrogeological vulnerability and statistical artifacts by calibrating parameter weights based on overall model response rather than solely on empirical assumptions or data dispersion. Compared with entropy-based weighting, PSO reduces vulnerability inflation in statistically heterogeneous areas and yields more spatially coherent high-risk zones that align with known hydrogeological controls, such as groundwater depth, aquifer permeability, recharge conditions, and distance from the coastline. However, uncertainties remain due to the dependence of PSO on algorithm configuration and objective function selection, as well as limitations in input data quality and spatial coverage. Moreover, PSO-optimized indices remain conceptual representations of relative vulnerability and do not explicitly simulate groundwater flow or solute transport. Consequently, while PSO-based results are well suited for identifying priority areas and supporting precautionary groundwater management, their application to long-term planning should be accompanied by adaptive monitoring and complementary process-based modeling.
The integrated interpretation of DRASTIC and GALDIT results indicates that several coastal aquifers in Hormozgan Province are simultaneously exposed to intrinsic pollution vulnerability and saltwater intrusion risk, creating zones of compounded or “double” vulnerability. The progressive intensification of vulnerability over the past 15 years highlights the urgent need for adaptive groundwater management strategies, including controlled abstraction, land-use planning in coastal zones, protection of recharge areas, and targeted monitoring in consistently identified hotspots. The findings demonstrate that combining conceptual vulnerability models with optimized weighting methods and temporal analysis provides a robust scientific basis for prioritizing interventions and supporting sustainable groundwater management in coastal regions.
Although weighting strategies and land-use representation influence the magnitude and spatial extent of vulnerability classes, they do not alter the direction of temporal change. The persistence of high-vulnerability zones across DRASTIC and GALDIT models and across all weighting methods indicates that the observed increase in vulnerability largely reflects genuine hydrogeological degradation driven by groundwater level decline and intensified human pressures, rather than being an artifact of model structure.
While the individual vulnerability indices and weighting techniques applied in this study have been reported in previous research, the novelty of the present work lies in their integrated and comparative application. By simultaneously evaluating DRASTIC and GALDIT models under three different weighting strategies within a spatio-temporal framework, this study provides new insights into the stability, sensitivity, and robustness of groundwater vulnerability patterns. The identification of high-risk zones that persist across models, weighting methods, and time periods represents an original contribution that supports more reliable groundwater management and prioritization.
5. Conclusions
In this study, the vulnerability of coastal aquifers in Hormozgan province was assessed using two widely used models, DRASTIC and GALDIT, with an integrated and temporal approach over a 15-year period (2010–2024). The main innovation of the study lies in the simultaneous comparison of three weighting methods, (a) normal, (b) Shannon entropy, and (c) the PSO algorithm, and the analysis of spatio-temporal changes in vulnerability over consecutive five-year periods. The results showed that both models, despite their differences in conceptual nature, provide a consistent and complementary picture of the status of groundwater resources, and their combination allows for more accurate identification of critical areas.
Based on the results of the DRASTIC model, the inherent vulnerability of aquifers during the study period was mainly controlled by groundwater table depth, net recharge, and topographic conditions. The coastal areas of the western province showed the highest level of vulnerability in all periods, while the severity increased in recent periods. This trend indicates a gradual decrease in the natural protective capacity of aquifers against pollution and the cumulative impact of human withdrawals and climate change. The results of the GALDIT model also demonstrate a rise in the salinization potential of coastal aquifers, particularly in the areas close to the coastline and shallow western plains over successive periods. The temporal analysis revealed that in the period 2020–2024, both the extent and severity of the zones susceptible to saltwater intrusion have increased compared to the previous periods. This finding confirms that the process of seawater invasion into coastal aquifers in the study area intensified in recent years and has become a serious threat to the sustainability of groundwater resources.
Comparison of weighting methods suggests that the normal method, due to the use of classical fixed weights, provides a conservative and relatively uniform vulnerability distribution. On the contrary, the entropy method, relying on the statistical dispersion of the data, created more spatial vulnerability variations. However, it led to an exaggeration of the severity of vulnerability in some cases. On the other hand, the PSO algorithm provided the most accurate and realistic results as it identified truly critical zones in a focused and coherent manner and prevented unnecessary generalization of risk to less sensitive areas. It shows that the use of optimization algorithms can significantly increase the efficiency of conceptual vulnerability models.
The combination of DRASTIC and GALDIT results demonstrated that some coastal areas of the province are simultaneously in a critical state in terms of inherent vulnerability and risk of inundation. These areas should be considered top priorities in management planning, groundwater withdrawal control, quality monitoring, and the implementation of protection policies. The results of the study emphasize that the continuation of the current trend of exploitation, without considering the ecological capacity of aquifers, can lead to irreversible degradation of groundwater resources. Overall, this study showed that the integrated approach of conceptual models with advanced weighting methods and temporal analysis is a powerful tool for more accurate assessment of the vulnerability of coastal aquifers. The results of this study can assist decision-makers and water resources managers in developing sustainable strategies, reducing the risk of pollution and salinization, and ensuring long-term protection of groundwater resources in coastal areas. For future studies, combining this approach with numerical models of flow and solute transport, as well as climate change scenarios, is suggested in light of improving the prediction and sustainable management of aquifers.