Article

Divergent Compositions and Biogeochemical Pathways of Dissolved Organic Matter in a Monsoon-Affected Coastal Aquifer: Insights from Molecular Characterization

1
State Key Laboratory of Environmental Chemistry and Ecotoxicology, Research Center for Eco-Environmental Sciences, Chinese Academy of Sciences, Beijing 100085, China
2
University of Chinese Academy of Sciences, Beijing 100049, China
3
National Medicines Regulatory Authority, No 120, Norris Canal Road, Colombo 01000, Sri Lanka
4
State Key Laboratory of Regional Environment and Sustainability, Research Center for Eco-Environmental Sciences, Chinese Academy of Sciences, Beijing 100085, China
5
Laboratory of Water Pollution Control Technology, Research Center for Eco-Environmental Sciences, Chinese Academy of Sciences, Beijing 100085, China
6
China-Sri Lanka Joint Research and Demonstration Center for Water Technology, Meewathura, Peradeniya 20400, Sri Lanka
7
National Water Supply and Drainage Board, Katugastota 20800, Sri Lanka
8
National Institute of Fundamental Studies, Hanthana Road, Kandy 20000, Sri Lanka
*
Authors to whom correspondence should be addressed.
These authors contributed equally to this work.
Hydrology 2026, 13(5), 120; https://doi.org/10.3390/hydrology13050120
Submission received: 10 March 2026 / Revised: 17 April 2026 / Accepted: 21 April 2026 / Published: 28 April 2026

Abstract

Coastal groundwater in monsoon-dominated regions faces compounding threats from seasonal hydrological extremes and seawater intrusion (SWI), yet the molecular-scale response of dissolved organic matter (DOM) remains poorly understood. We conducted a two-season investigation in Mannar District, Sri Lanka, integrating hydrochemistry, fluorescence spectroscopy, and Fourier-transform ion cyclotron resonance mass spectrometry to characterize DOM dynamics across shallow and deep groundwater. Dry-season chloride averaged 302 mg/L (shallow—5 to 12 m) and 505 mg/L (tube wells—20 to 30 m), then declined by 60–80% during monsoon recharge. Despite this freshening, DOM dynamics were decoupled from salinity: shallow wells showed dry-season DOC peaks (6.64 mg/L) driven by soil concentration, while tube wells exhibited wet-season enrichment (5.02 mg/L). Shallow aquifers maintained consistently high humification indices (around 0.70) and aromatic-rich DOM, indicating sustained buffering by soil-derived inputs. In contrast, wet-season recharge in tube wells appeared to stimulate microbial processing, as indicated by elevated protein-like fluorescence (C2: 26% to 36%) and a higher contribution of nitrogen-bearing formulas (CHONs: 31.4% to 37.1%). Tube wells also accumulated reduced, energy-rich DOM with correspondingly high molecular lability indices. Paradoxically, correlation networks suggested that these saturated aliphatic and halogenated structures persist due to kinetic protection under low oxygen, high-salinity conditions. These findings indicate that aquifer structure and redox conditions control DOM biogeochemistry in coastal groundwater systems. At the molecular level, DOM dynamics are influenced by aquifer depth and seasonal recharge, leading to a decoupling between salinity and organic matter transformation.

1. Introduction

Coastal aquifers sustaining over one billion people face converging threats from accelerating groundwater decline driven by irrigation overexploitation and the extreme hydrological variability inherent to tropical monsoon systems [1]. In the South and Southeast Asian monsoon belt, this coupling creates a volatile hydrochemical environment [2,3,4]. Prolonged dry seasons concentrate solutes and promote landward seawater intrusion (SWI) as water tables decline, while intense wet-season pulses trigger rapid recharge that abruptly alters redox boundaries and salinity gradients [5]. These compounding stressors do not only fluctuate water levels; they fundamentally restructure groundwater chemistry and redox conditions, mobilizing organic carbon, and shifting microbial substrates [6,7]. Such processes are not regionally confined; groundwater systems globally represent a major source of dissolved organic matter (DOM) to coastal environments, with fluxes that can significantly influence biogeochemical cycling and ecosystem functioning. This volatility poses cascading risks to water security and ecosystem health [8,9,10].
DOM plays multifaceted roles in this biogeochemical restructuring [11,12]. As a heterogeneous mixture of organic compounds, DOM can complex with metal ions, influence nutrient bioavailability, serve as a microbial substrate controlling redox reactions, and contribute to disinfection byproduct formation in drinking water systems [13,14]. The sensitivity of DOM composition and reactivity to seasonal hydrological shifts in monsoon-dominated coastal aquifers remains poorly constrained. Wet-season recharge may introduce fresh terrestrial organic matter from surface soils and vegetation, while dry-season water table decline and SWI can alter DOM sources and induce compositional changes through ionic strength effects and redox transformations [6,8]. Recent research has documented salinity-driven increases in dissolved organic carbon (DOC) content in coastal soils and aquatic systems, as well as shifts in DOM optical properties along salinity gradients in estuarine and coastal environments [6,8,15]. Yet, these bulk-level observations from temperate and estuarine settings leave critical questions unanswered for tropical monsoon-affected groundwater. Specifically, it remains unclear how seasonal monsoon-recharge and SWI cycles shape DOM at the molecular scale, whether DOM transformations reflect simple source mixing or are mediated by aquifer-specific biogeochemical processing, and the implications for water quality remain unclear. Addressing these gaps is urgent given that hundreds of millions of people in South and Southeast Asia depend on monsoon-recharged coastal aquifers [4,16].
The Mannar District in northwestern Sri Lanka is currently experiencing extreme seasonal climate variability and severe SWI driven by groundwater overexploitation [17]. This semi-arid coastal region faces pronounced hydrological extremes: the dry season (May–September) receives <50 mm monthly rainfall and experiences intensive evapotranspiration, promoting landward SWI penetration up to 15 km inland, while the northeast monsoon (October–January) delivers >800 mm cumulative precipitation, driving rapid aquifer freshening [17]. Groundwater extraction occurs across a heterogeneous aquifer framework, including shallow unconfined zones recharged by diffuse infiltration and deeper confined limestone units accessed via fracture networks. This spatial variability in recharge pathways, residence times, and salinity exposure creates a natural gradient for examining how multiple stressors differentially shape DOM composition [17]. More critically, Mannar is recognized as an endemic region for chronic kidney disease of unknown etiology in Sri Lanka [18], where groundwater quality including trace contaminants potentially complexed with DOM has been hypothesized as a contributing factor [18]. Given these compounding health and ecological concerns, characterizing the compositional distribution, seasonal biogeochemistry, and water quality implications of groundwater DOM in this monsoon-affected coastal system is imperative.
To address these knowledge gaps, we conducted a two-season field investigation in the Mannar District, integrating fluorescence excitation-emission matrix spectroscopy (EEM) coupled with parallel factor analysis (PARAFAC) and Fourier-transform ion cyclotron resonance mass spectrometry (FT-ICR-MS) to characterize groundwater DOM dynamics. By sampling across coastal-inland and shallow-deep aquifers, this study seeks to disentangle the coupled effects of monsoon forcing, SWI, and aquifer heterogeneity. Specifically, this study aims to: (1) quantify seasonal and spatial variations in DOM optical properties and molecular formulas along the coastal-inland gradient; (2) identify molecular signatures that sensitively track seasonal hydrological shifts and SWI intensity; (3) elucidate dominant transformation mechanisms (source switching, biodegradation, or ionic strength effects) by integrating molecular data with hydrochemical tracers. Ultimately, our findings will provide molecular-scale insights into how multiple anthropogenic and climatic stressors interact with aquifer spatial structure to govern DOM biogeochemistry in vulnerable tropical coastal regions.

2. Materials and Methods

2.1. Study Area and Sample Collection

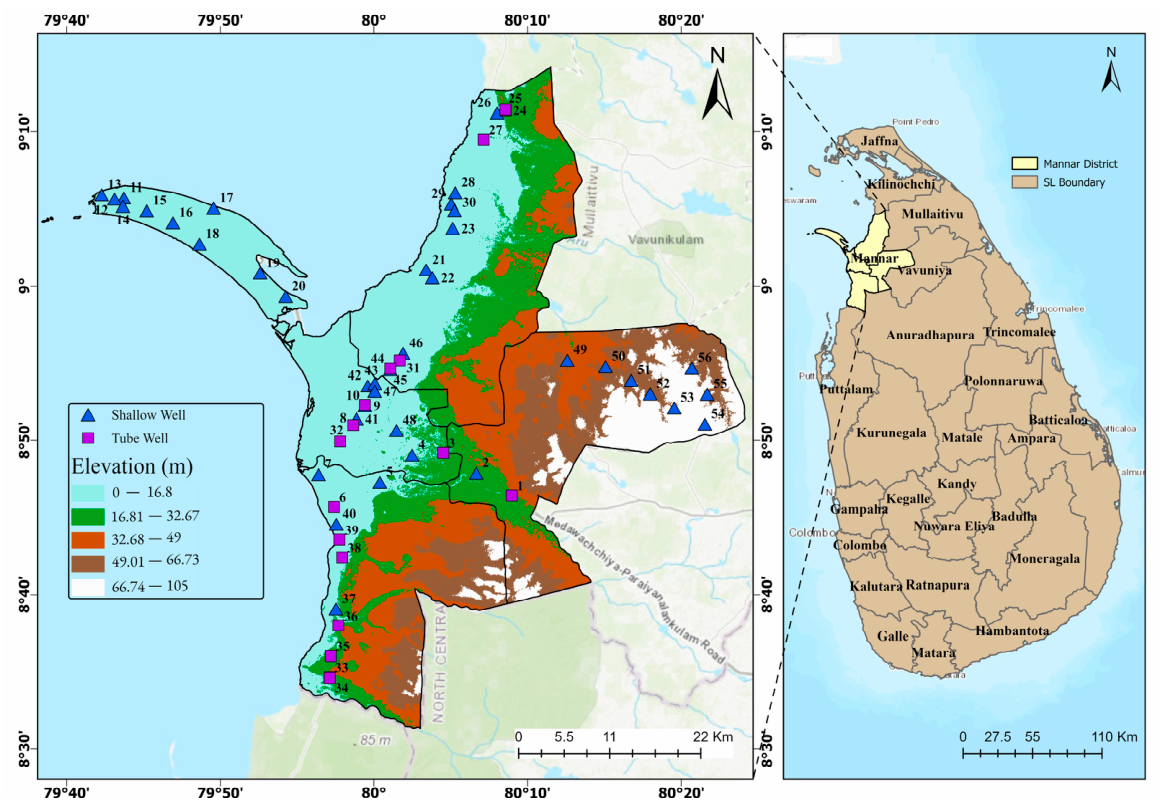
The Mannar District (8°52′ N, 80°04′ E) is located in northwestern Sri Lanka, covering approximately 1996 km2 in the semi-arid climatic zone (Figure 1). Elevation in the coastal belt on the western side of Mannar District is mostly low (0–16 m), while central and eastern regions show moderate elevations, with higher elevation zones (up to 105 m) occurring inland. The region experiences pronounced seasonal rainfall variability, with an average annual precipitation of 975 mm concentrated during the northeast monsoon (October–January) and contrasting sharply with a potential evapotranspiration of ~2135 mm. Seasonal temperatures range from 23 and 35 °C [17]. The aquifer system is primarily hosted in Miocene limestone formations, with groundwater recharge occurring through precipitation infiltration, surface runoff, and controlled inputs from water bodies such as the Giant Tanks [17]. The district supports a low population density, with local livelihoods depending primarily on agriculture, fisheries, and animal husbandry. However, intensive groundwater extraction for irrigation during the dry seasons has depressed water tables and exacerbated SWI in coastal zones [17].
Groundwater sampling was conducted during the dry season (May 2022) and wet season (December 2022) to capture seasonal DOM dynamics under contrasting hydrological conditions. A total of 112 groundwater samples were collected from 56 spatially distributed sites comprising 39 shallow wells and 17 tube wells spanning from near-shore to inland zones [17]. The large variability observed in several parameters reflects the spatial heterogeneity of groundwater conditions across the study region, as samples represent multiple wells rather than repeated measurements at a single location. The selected periods correspond to well-established hydrological extremes in the region (May: peak dry conditions; December: peak monsoon recharge), allowing us to capture first-order contrasts in DOM dynamics. Wells were categorized operationally as shallow and tube wells based on construction depth and usage. Tube wells were 20–30 m deep, whereas shallow wells ranged from 5 to 12 m. While these depth differences likely correspond to contrasting hydrological conditions, detailed hydrostratigraphic information (e.g., borehole logs, screen intervals, and confining layer characteristics) was not available. Therefore, this classification should be interpreted as a practical distinction rather than a strictly defined hydrogeological separation. Site selection prioritized actively used domestic and irrigation wells to ensure samples represented actual groundwater conditions. All available wells in the study area were included in the sampling design; however, the spatial distribution of wells is inherently uneven, with lower well density in the eastern region. Consequently, spatial interpolation results in these areas may be associated with higher uncertainty and should be interpreted with caution. At each site, in situ physicochemical parameters were measured using a portable multi-parameter meter (Eutech 01X099414, Thermo Scientific, Waltham, MA, USA), including pH, temperature, electrical conductivity (EC), total dissolved solids (TDS), and dissolved oxygen (DO). From each site, 2 L of groundwater was collected directly into polypropylene bottles pre-cleaned with 10% (v/v) hydrochloric acid and deionized water, and triple-rinsed with sample water prior to filling. Samples were transported in dark conditions, filtered within 24 h through 0.45 µm glass fiber filters (Whatman GF/F) and stored at 4 °C until analysis. Quality control measures included procedural blanks and replicate analyses. Procedural blanks showed no detectable contamination or background interference. Replicates demonstrated analytical precision with relative standard deviations for target compounds, confirming reproducible measurements within method uncertainty.

2.2. Hydrochemical and DOM Bulk Property Analyses

Hadrochemical analyses were performed at the China–Sri Lanka Joint Research and Demonstration Center for Water Technology, Ministry of Water Supply, Peradeniya. Major cations were quantified using inductively coupled plasma optical emission spectrometry (ICP-OES, Optima 8300, PerkinElmer, Waltham, MA, USA). Major anions were analyzed by ion chromatography (Dionex ICS-1100, Thermo Scientific, USA). Dissolved organic carbon (DOC) was analyzed using a TOC analyzer (MULTI N/C 2100, Analytik Jena, Jena, Germany).

2.3. Fluorescence Spectroscopy and PARAFAC Modeling

Three-dimensional EEM (3D-EEM) fluorescence spectra were acquired using a fluorescence spectrophotometer (F-4700, Hitachi, Tokyo, Japan). Samples with UV254 absorbance > 0.05 were diluted with ultrapure water to minimize inner-filter effects. EEM spectra were measured at excitation wavelengths (Ex) of 200–400 nm and emission wavelengths (Em) of 220–550 nm with 5 nm resolution. Ultrapure water blanks were measured daily to correct for Raman and Rayleigh scattering using the drEEM toolbox (v0.6.4) in MATLAB R2017a [19]. Fluorescence indices including the humification index (HIX), biological index (BIX), freshness index (FreI) and fluorescence Index (FI) were calculated from EEM intensities to track DOM source and diagenetic state [20]. PARAFAC modeling was performed using the DOM Fluor toolbox (version 1.7) in MATLAB (Mathworks, Natick, MA, USA) to decompose overlapping fluorescence signals into statistically independent components (Tables S1 and S2) [21]. Model validation employed split-half analysis and core consistency diagnostics to confirm component robustness. Maximum fluorescence intensities for each component were used to quantify seasonal and spatial variations in DOM fluorophore composition (Figure S1).

2.4. Molecular Characterization Using FT-ICR-MS

A subset of 32 samples was chosen to detail the full variation in hydrochemistry, location (from coastal to inland areas), and depth (from shallow to tube wells) present in the complete dataset. The selection also covered both seasons and all key hydrochemical types, including 9 tube wells and 23 shallow wells. DOM was concentrated and desalted using solid-phase extraction (SPE) on Agilent Bond Elut PPL cartridges (500 mg, 6 cc, Agilent Technologies, Santa Clara, CA, USA) following previous methods (Text S1) [22,23,24]. Ultrahigh-resolution mass spectra were acquired on a solariX 15T FT-ICR-MS, Bruker, Bremen, Germany equipped with an electrospray ionization source operated in negative ion mode.
Molecular formulas were assigned to FT-ICR-MS peaks using automated mass assignment based on high-resolution accurate mass measurements. Only peaks with a signal-to-noise ratio greater than 4 and a mass error below 1 ppm were considered reliable for formula calculation. Elemental compositions were constrained to combinations of 12C (1–100), 1H (1–200), 16O (0–50), 35Cl (0–4), 79Br (0–3), 127I (0–3), and 13C (0–1) within defined atomic ranges, and additional H/C and O/C ratio limits were applied to ensure chemically reasonable formulas. When multiple formulas were possible, the one with the lowest mass deviation was selected. The assigned formulas were further evaluated using van Krevelen diagrams, Kendrick mass defect analysis, and the modified aromaticity index (AI_mod) to examine compositional patterns and classify DOM compounds into major structural groups (Tables S4–S7) [22,25].

2.5. Data Analysis

Statistical analyses including mean and standard deviation calculations, Mann–Whitney U test, T-tests, Spearman correlation analysis and corresponding graphical visualizations were executed using the R statistical computing environment (v4.4) and Python (v3.10) [26,27]. To visualize the spatial distribution of groundwater quality parameters, spatial interpolation was performed utilizing the inverse distance weighted (IDW) algorithm in ArcGIS Pro (v3.1) [28].

3. Results and Discussion

3.1. Monsoon-Driven Freshening Decouples Salinity and DOM Dynamics in Stratified Coastal Aquifers

Groundwater samples showed pronounced seasonal and depth-related variations in major ion chemistry, reflecting the coupled influence of monsoon-driven recharge SWI (Table 1) (Figure S2). A substantial ~2-unit alkaline shift occurred between seasons: dry-season pH averaged 6.97 ± 0.56 in shallow wells and 6.48 ± 0.40 in tube wells, whereas wet-season values rose to 8.84 ± 0.26 (shallow) and 8.54 ± 0.29 (tube wells). The wide pH range observed likely reflects strong seasonal and geochemical variability, with enhanced limestone buffering during monsoon recharge and intensified carbonate weathering within the aquifer matrix, alongside varying degrees of seawater intrusion and water–rock interaction [29,30,31].
Chloride concentrations revealed the most dramatic seasonal response. Dry-season Cl concentration averaged 302 ± 368 mg/L in shallow wells and 505 ± 431 mg/L in tube wells, with high standard deviations reflecting substantial spatial heterogeneity across the study area rather than variability at individual sites. Both frequently exceeding the WHO drinking water guideline (250 mg/L). Conversely, monsoon recharge drove wet-season Cl to 43.50 ± 70.93 mg/L in shallow wells and 59.12 ± 26.53 mg/L in tube wells, representing a substantial decline. Despite this substantial freshening, the deeper confined limestone aquifer preserved a persistent SWI imprint. Across both seasons, tube wells not only maintained ~60% higher Cl than shallow wells but also exhibited substantially elevated electrical conductivity (averaging ~2334 µS/cm) and TDS (~1167 mg/L) approximately 45–50% higher than their shallow counterparts (Table 1). Spatially, extensive dry-season inland penetration of both Cl and Na+ were evident, reaching up to ~10 km from the coast, particularly in tube wells (Na+: 234 ± 157 mg/L; Cl: 505 ± 431 mg/L). This depth-dependent salinity persistence suggests either longer residence times in the confined aquifer or preferential seawater penetration through fracture networks that bypass the shallow zone, accompanied by cation exchange processes where intruding influenced by seawater intrusion Na+ displaces matrix divalent cations [17].
In contrast to the conservative salinity tracers, DOC exhibited well-type-dependent seasonal dynamics that completely decoupled from SWI patterns. Shallow wells showed higher dry-season DOC (6.64 ± 3.19 mg/L) that declined during wet season (5.31 ± 3.11 mg/L; −20%). Tube wells exhibited the inverse pattern, with wet-season DOC (5.02 ± 9.97 mg/L) exceeding dry-season levels (3.93 ± 2.55 mg/L; +28%). Consequently, DOC showed no significant correlation with Cl across seasons [32], indicating that DOM dynamics in this aquifer are not governed by simple binary mixing between fresh recharge and saline endmembers. We attribute this divergent behavior to distinct DOM source mechanisms. The elevated dry-season DOC in shallow wells likely stems from the evapotranspiration-driven concentration of soil-derived organic matter during low-recharge periods when groundwater residence times lengthen. Conversely, the wet-season DOC enrichment in tube wells probably indicates rapid infiltration of fresh, labile organic matter through fractured limestone pathways during monsoon recharge, which temporarily supplements the deep-aquifer DOM pool before microbial degradation and sorption take effect [33,34].

3.2. Aquifer Depth Governs DOM Buffering Capacity: Contrasting Fluorescence Signatures Reveal Decoupled Source Connectivity

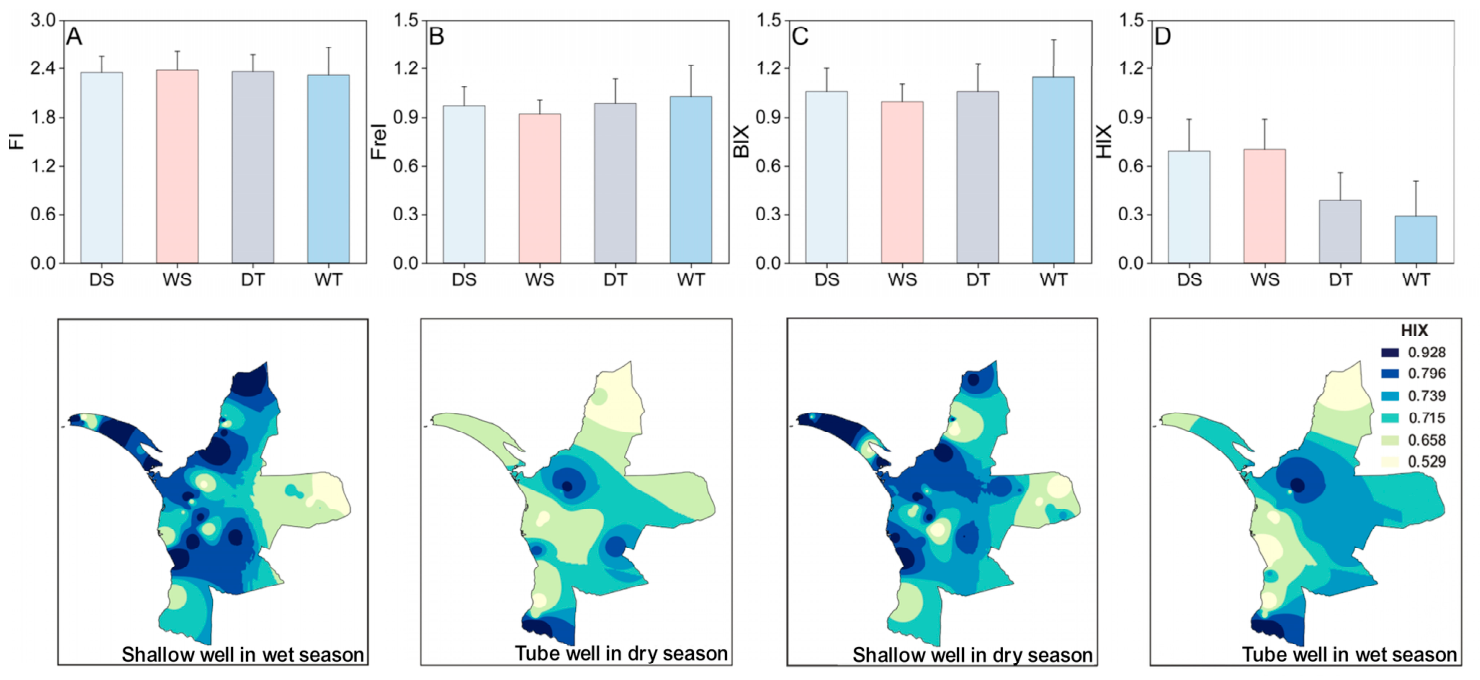
Fluorescence indices tracked a fundamental decoupling of DOM dynamics between aquifer depths (Table 2). In shallow wells, FI remained essentially stable between the dry (2.35 ± 0.20) and wet (2.38 ± 0.23) seasons, while FreI experienced a slight decline from 0.97 ± 0.12 to 0.92 ± 0.09. BIX and HIX mirrored this invariance, with BIX narrowing from 1.06 ± 0.14 to 1.00 ± 0.11 and HIX holding steady at 0.69 ± 0.20 and 0.70 ± 0.19, respectively, with no statistically significant seasonal differences observed (p > 0.05). All four indices shifted by less than 0.06 units between seasons, indicating remarkably consistent DOM composition despite the dramatic salinity reduction and pH increase. Spatial interpolation reinforced this picture: HIX values in shallow wells remained uniformly elevated (>0.5) across the entire study area in both seasons (Figure 2 and Figure S3), with no discernible spatial reorganization during monsoon recharge. The persistent HIX values around 0.70 suggest continuous contributions from moderately humified terrestrial sources, likely reflecting sustained equilibration with soil organic matter in the vadose zone [21,35].
In stark contrast, tube wells displayed highly dynamic seasonal behavior (Table 2 and Figure 2). FI decreased modestly from 2.36 ± 0.21 to 2.32 ± 0.34, while FreI shifted in the opposite direction, climbing from 0.99 ± 0.15 to 1.03 ± 0.19, although these changes were not statistically significant (p > 0.05). More revealing than these minor shifts were the changes in BIX and HIX: BIX rose from 1.06 ± 0.17 to 1.15 ± 0.23, while HIX fell from 0.39 ± 0.17 to 0.29 ± 0.22 (p < 0.05). The elevated wet-season BIX may indicate enhanced microbial production [34], while the depressed HIX (<0.3) suggests reduced humification relative to shallow wells [36]. Spatial patterns corroborated these trends that high-BIX zones in tube wells expanded during the wet season, particularly across central and southern regions, hinting at localized recharge hotspots where fresh organic matter penetrates the confined aquifer via fracture networks. Following this trend, tube well HIX values already low during the dry season declined further across the study area upon monsoon recharge, with the lowest values (<0.1) concentrated in the southern coastal belt. This optical signature aligns with the wet-season DOC increase (5.02 mg/L), indicating that monsoon recharge delivers a pulse of fresh, compositionally distinct organic matter to depth rather than simply diluting the existing pool.
This depth-dependent contrast in seasonal responsiveness reflects fundamentally different source connectivity regimes. Shallow aquifers might experience continuous DOM exchange with overlying soils, which dampens compositional shifts during seasonal flushing and maintains the stable humification signature observed above. The deeper confined aquifer, by contrast, receives episodic pulses of fresh terrestrial DOM only during high-intensity monsoon events, when hydraulic gradients overcome confining layer resistance [37,38,39]. The observed dynamic index variations in tube wells (ΔHIX = −0.10, ΔBIX = +0.09) suggest temporally variable recharge processes, which may include fracture-mediated pathways, rather than simple gradual mixing. Particularly striking is the spatial concentration of the most dynamic fluorescence responses in southern coastal tube wells, where SWI penetration is deepest. This spatial overlap suggests that prolonged SWI may precondition the confined aquifer for enhanced microbial activity perhaps by delivering marine nutrients or altering redox boundaries thereby priming the system for rapid DOM compositional shifts upon the delivery of fresh monsoon substrates [40].

3.3. Well Type Outweighs Seasonality in Shaping Groundwater DOM Composition

PARAFAC modeling resolved six fluorescent components explaining >99.8% of EEM variance (Table 2 and Figure 3). The model identified three humic-like components (C1: terrestrial humic, Ex 280/360 nm, Em 450 nm; C3: microbial humic, Ex 250/330 nm, Em 390 nm; C6: low-molecular-weight humic, Ex 225 nm, Em 440 nm) and three protein-like components (C2: tryptophan-like, Ex 220 nm, Em 300 nm; C4: tryptophan-like: Ex 245/280 nm, Em 350 nm; C5: tyrosine-like, Ex 230/275 nm, Em 320 nm) [41,42].
Well-type differences dominated compositional patterns, far exceeding seasonal variations in magnitude. Shallow wells maintained a roughly balanced humic-protein composition across both seasons: combined humic-like contributions (C1 + C3 + C6) accounted for 51.0% (dry) and 54.3% (wet), while the protein-like C2 remained low at 11.5 ± 15.5% (dry) and 12.9 ± 13.8% (wet), with no statistically significant seasonal differences (p > 0.05). In stark contrast, tube wells presented a protein-dominated signature. C5 alone contributing 43.6 ± 22.6% (dry) and 39.2 ± 22.7% (wet), while C2 surged from 24.6 ± 17.9% to 35.6 ± 24.1%, a 45% relative increase that represents the most pronounced seasonal shift among all components. Conversely, humic-like contributions in tube wells (C1 + C3) totaled only 15.9% in the dry season and declined further to 12.0% in the wet season, representing roughly 30% of shallow well values remaining significantly lower (p < 0.001). This compositional divergence parallels the contrasting DOC seasonal patterns, where shallow wells showed dry-season peaks (6.64 mg/L) while tube wells peaked during the wet season (5.02 mg/L).
C4 (tryptophan-like) emerged as the sole fluorophore exhibiting a synchronized reduction across both shallow and tube well types (p < 0.05), declining from 13.5% to 10.7% in shallow wells and from 11.9% to 9.4% in tube wells (p > 0.05). This synchronized reduction likely reflects temperature-dependent microbial tryptophan production during the warmer dry season (27.6 °C), followed by dilution during monsoon recharge [43]. In contrast, C6 (low-molecular-weight humic) displayed a striking well-type-specific response: shallow wells showed a marked wet-season enrichment (8.4 ± 5.2% → 13.3 ± 6.9%) (p < 0.01), whereas tube wells remained essentially unchanged (4.1% → 3.8%) (p > 0.05). This shallow-well C6 enrichment may reflect enhanced delivery of low-molecular-weight humic substances from soil leaching during monsoon infiltration a source pathway largely inaccessible to the confined aquifer.
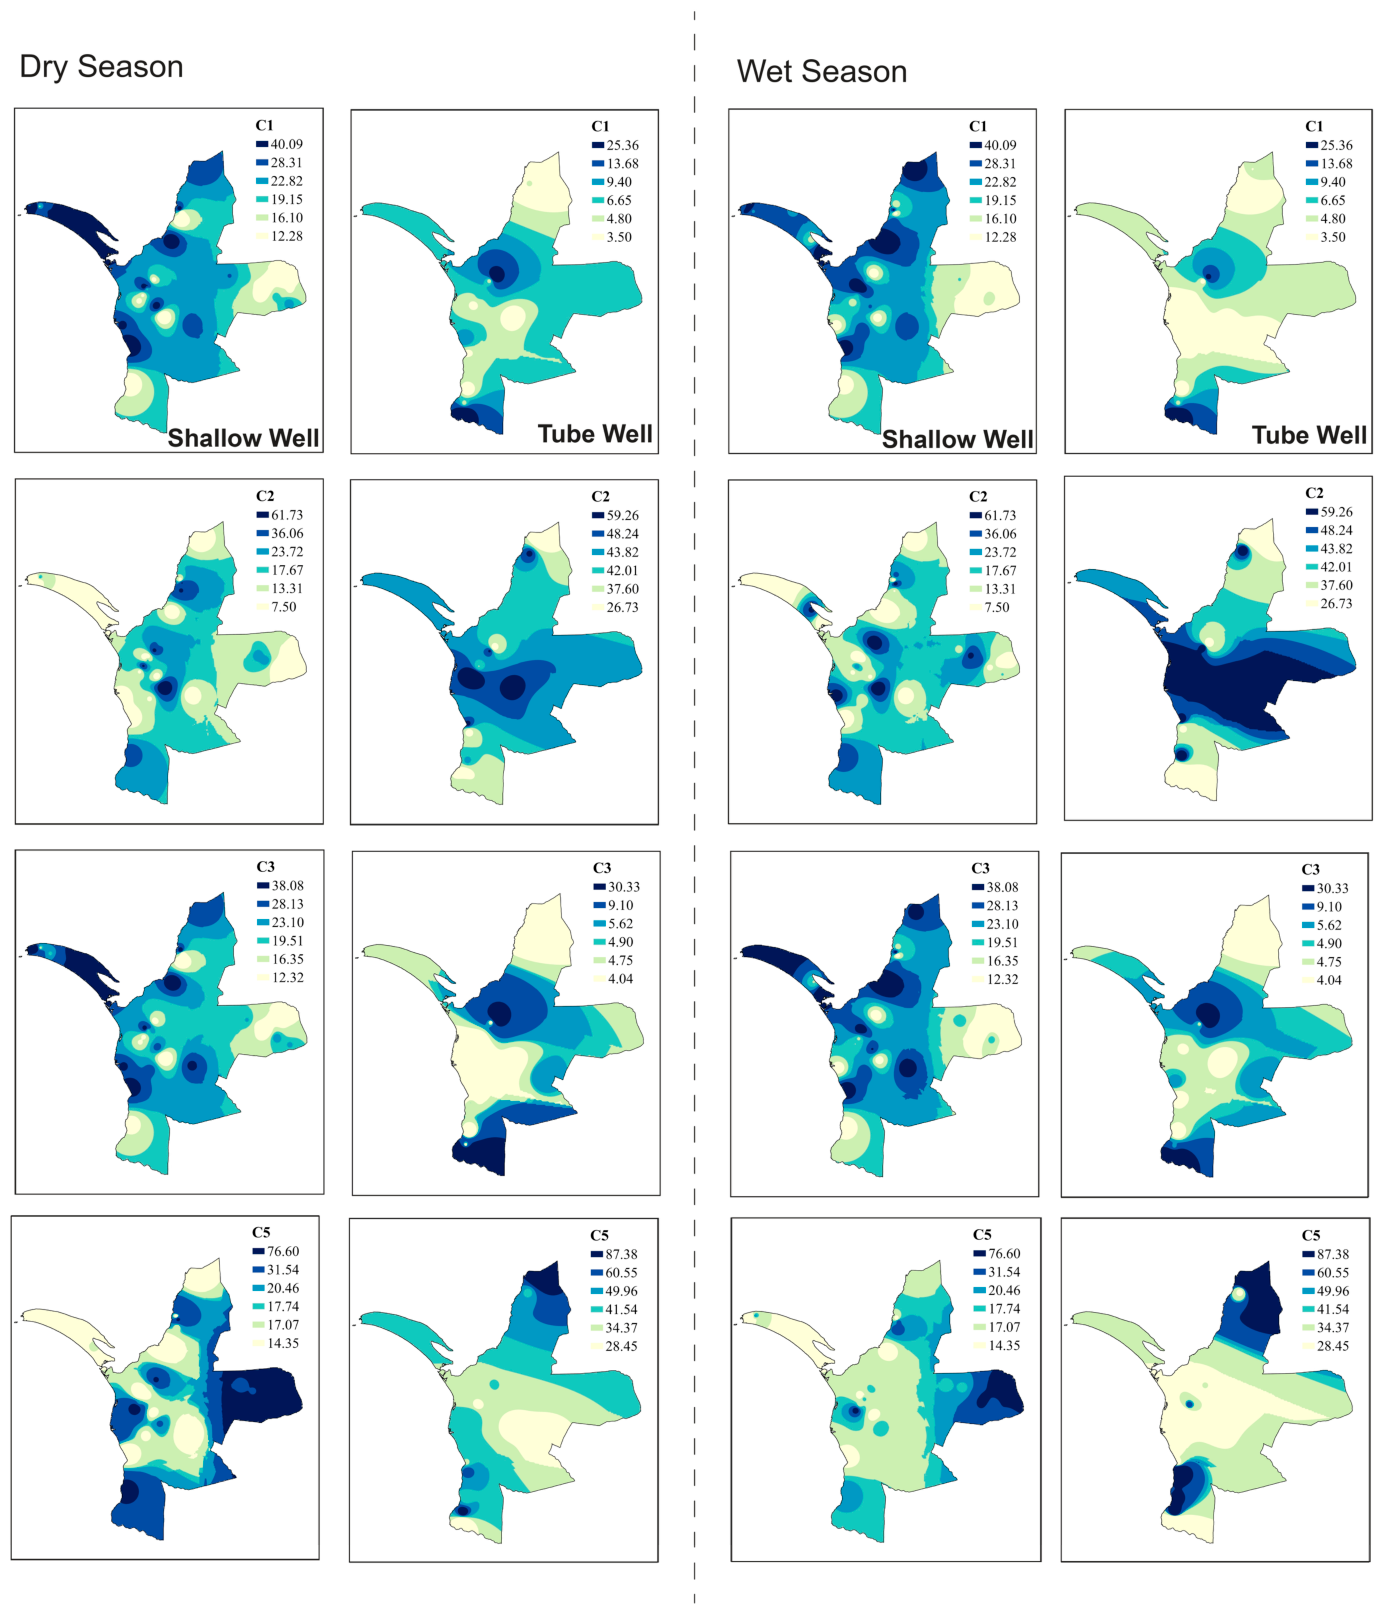
Spatial interpolation revealed distinct seasonal redistribution patterns that reinforced the well-type contrast (Figure 3). In shallow wells, C1 maintained uniformly high values (16–40%) across the study area in both seasons, with peak concentrations in northern and central zones. This spatial stability mirrors the consistent HIX values (~0.70) and confirms that shallow aquifer DOM composition is buffered by continuous soil organic matter exchange. ube well C1 values, conversely, remained uniformly low (<14%) and diminished further during the wet season, particularly in the southern coastal belt where values dropped below 5% the exact region experiencing the most intense dry-season SWI. More striking than these humic shifts was the C2 spatial pattern in tube wells. During the dry season, moderate C2 values (26–48%) were distributed across central and southern areas. However, wet-season recharge amplified C2 dramatically in the southeastern coastal zone, with values frequently exceeding 48% and reaching up to 59%. This spatial concentration of the C2 surge in the most SWI-affected region reinforces our hypothesis that prolonged seawater–aquifer interaction preconditions the confined system, priming it for explosive microbial activity upon monsoon-driven nutrient or substrate delivery [44,45]. Following a similar trajectory, C5 wet-season values exceeded 60% in the southern coastal tube wells, consistent with the elevated BIX values.
The contrasting spatial patterns between humic-like and protein-like components indicate fundamentally different hydrological pathways governing allochthonous terrestrial inputs versus autochthonous microbial production in this dual-porosity karst system [46]. Humic-like DOM enters primarily through diffuse matrix recharge in the shallow zone, maintaining spatial uniformity, whereas protein-like DOM accumulates preferentially in the confined aquifer through fracture-mediated flow, creating localized hotspots that intensify during monsoon periods.

3.4. Depth-Dependent Shifts in Molecular Composition During Monsoon Recharge: Molecular Evidence from FT-ICR-MS Analysis

3.4.1. Elemental Composition and Halogen Signatures

FT-ICR-MS analysis detected 1021–6105 unique molecular formulas per sample, with dry-season samples exhibiting significantly higher molecular diversity than wet-season samples across both well types (p < 0.05). To assess the potential impact of SWI on DOM composition, we analyzed both halogenated and non-halogenated compounds separately. Non-halogenated compounds showed an apparent seasonal pattern: dry-season samples exhibited significantly higher formula counts (shallow: 3411 ± 417; tube: 3169 ± 463) than wet-season samples (shallow: 2649 ± 711; tube: 2592 ± 1022) (p < 0.05). This decline contradicted the expectation that terrestrial runoff would enhance molecular diversity. Instead, it possibly suggests a “compositional resetting” mechanism: massive infiltration of structurally homogeneous soil-derived DOM temporarily dilutes the complex, microbially processed molecular assemblage accumulated during the dry season [47].
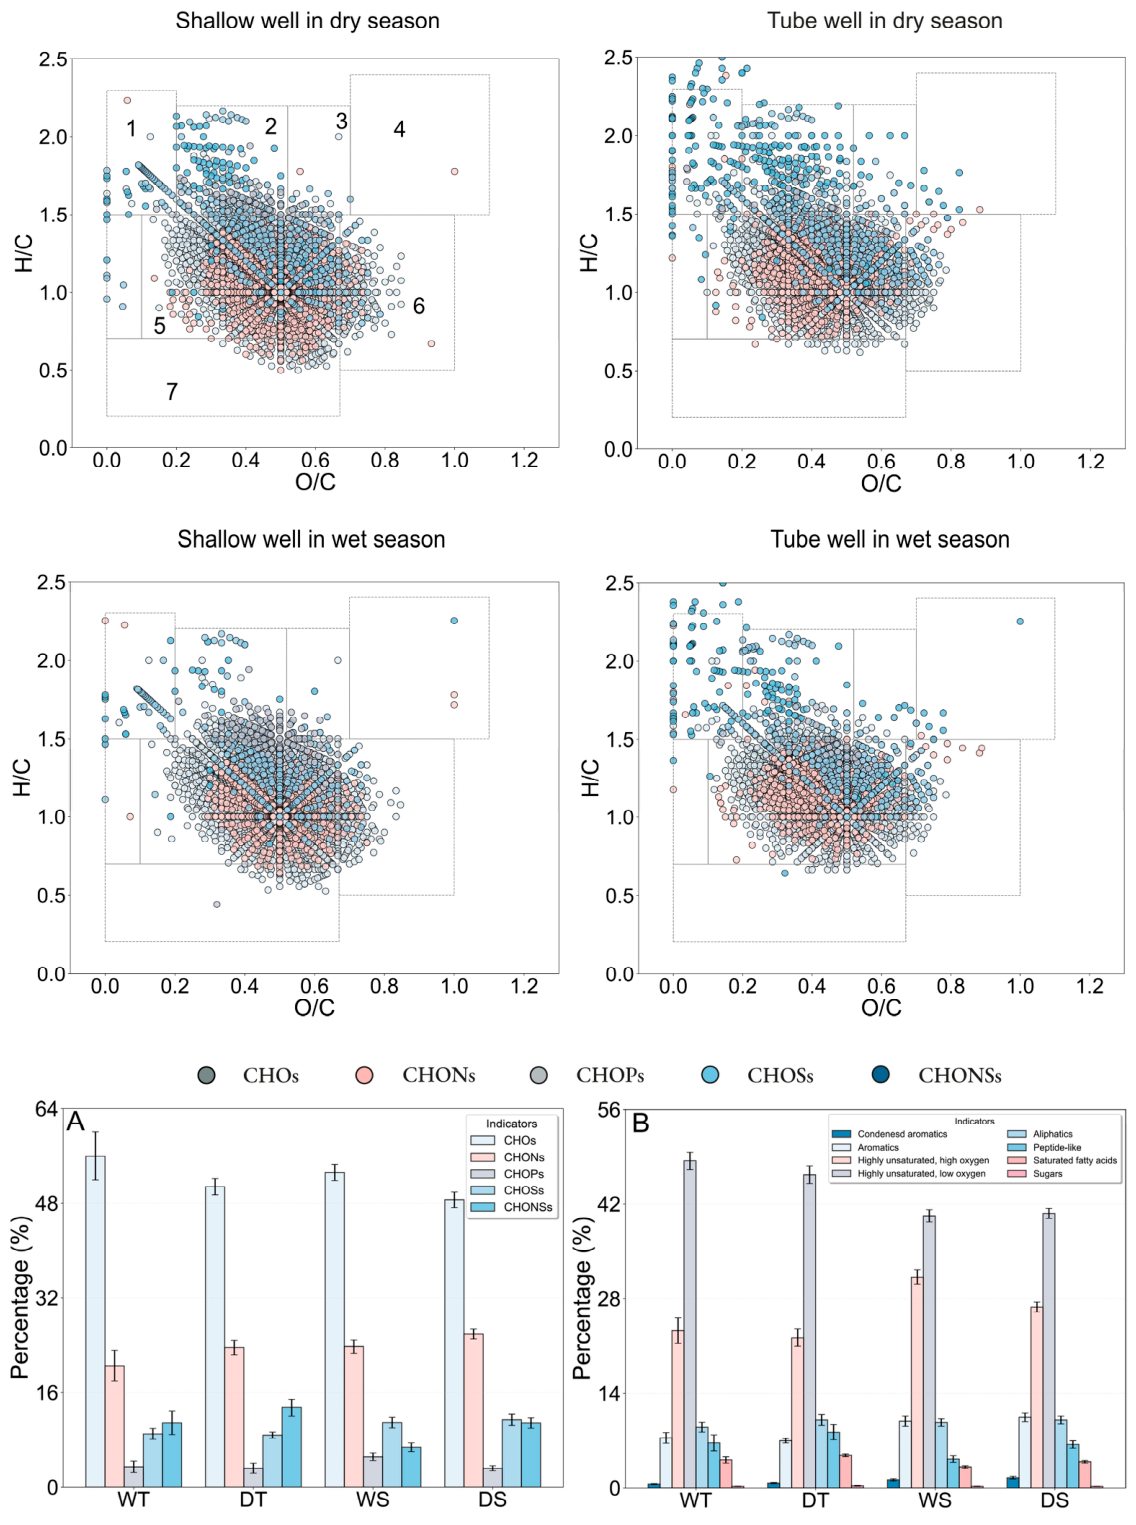
Elemental composition revealed systematic depth-related gradients. CHOs compounds dominated nearly all samples (31.9–80.5% of formulas), with tube wells maintaining higher CHOs abundance (dry: 50.8 ± 4.2%; wet: 56.0 ± 12.0%) than shallow wells (dry: 48.6 ± 6.3%; wet: 53.3 ± 6.5%) although these differences were not statistically significant (p > 0.05). For nitrogen-bearing compounds (CHONs + CHONSs), tube wells exhibited a striking wet-season enrichment (37.1% vs. 31.4% dry), whereas shallow wells showed the opposite trend, declining from 36.8% (dry) to 30.6% (wet) (p < 0.05). This divergent nitrogen trajectory in tube wells parallels the protein-like fluorescence patterns, where tube wells displayed elevated wet-season BIX (1.06→1.15) and C2 abundance (26%→36%). The convergence of molecular and optical evidence strongly suggests enhanced autochthonous microbial production of nitrogen-rich DOM in the confined aquifer during monsoon recharge [48], likely stimulated by the infiltration of fresh labile organic matter and nutrients through preferential flow paths in fractured limestone. Complementing this pattern, tube wells exhibited consistently lower O/C ratios (0.412–0.435) and higher H/C ratios (1.283–1.294) than shallow wells (O/C: 0.455–0.460; H/C: 1.234–1.246), indicating selective enrichment of aliphatic, oxygen-depleted compounds in the deeper aquifer. Conversely, the nitrogen depletion in wet-season shallow wells likely reflects dilution by nitrogen-poor terrestrial DOM mobilized from surface soils during intense rainfall events [49].
Halogenation patterns also provided striking depth-related signatures. The complementary halogenated fraction (OHCs) exhibited systematic depth and seasonal gradients. Dry-season tube wells contained 1242 ± 346 halogenated formulas (27.7 ± 4.2% of total), substantially exceeding shallow wells (962 ± 362 formulas, 21.5 ± 5.2%) corresponding to a higher relative abundance in tube wells (p < 0.05). While wet-season recharge reduced overall OHCs abundance, tube wells retained 933 ± 568 formulas (23.2 ± 8.8%), whereas shallow wells declined sharply to 593 ± 498 formulas (16.3 ± 7.0%), representing a 42% depth-related enrichment during the wet season (p < 0.05). This decoupled seasonal response implies that the confined aquifer acts as a persistent, long-term reservoir for halogenated DOM [50].
Weighted halogen abundances revealed that bromine serves as a more sensitive depth tracer than chlorine. Dry-season tube wells contained 42% more bromine (Brw: 0.071 ± 0.010) than shallow wells (0.050 ± 0.018), with this enrichment persisting into the wet season (tube wells: 0.055 ± 0.021; shallow wells: 0.046 ± 0.030) (p < 0.05). Chlorine exhibited a contrasting seasonal pattern: shallow wells showed a slight decline (from 0.112 ± 0.028 to 0.108 ± 0.031), whereas tube wells showed an increase from 0.118 ± 0.041 (dry) to 0.147 ± 0.127 (wet). However, variability was high, and the differences were not consistently statistically significant (p > 0.05). This divergent behavior triggered a dramatic shift in the Br/Cl weighted ratio. Dry-season tube wells maintained a high ratio of 0.61 (approaching to the seawater value), which subsequently plummeted to 0.37 in the wet season, a 39% reduction driven primarily by the surge in chlorinated compounds. This pattern suggests that bromine, enriched in seawater, may serve as a potential tracer of marine DOM influence, with brominated compounds accumulating likely due to their higher hydrophobicity and resistance to biodegradation [42]. The wet-season surge in chlorinated compounds in tube wells likely reflects chlorination of fresh terrestrial organic matter introduced during monsoon recharge, a process facilitated by the elevated background chloride levels in the confined aquifer. In contrast, efficient flushing in shallow aquifers dilutes both brominated and chlorinated compounds proportionally, maintaining a relatively stable Br/Cl ratio (~0.43–0.45) across seasons [22,51].
Van Krevelen classification revealed systematic depth-related shifts in compound class distributions (Figure 4). Highly unsaturated low-oxygen (HULO) compounds dominated tube wells (46.4–48.4%) [52], significantly exceeding the value in shallow wells (40.2–40.6%) (p < 0.05) and indicating the accumulation of microbially processed, recalcitrant DOM in the confined aquifer [53]. Conversely, shallow wells retained higher aromatic abundance (11.1–11.9% vs. 7.8–8.0% in tube wells) (p < 0.05) and exhibited a marked wet-season spike in highly unsaturated high-oxygen (HUHO) compounds (31.2% vs. 26.8% in dry season), indicating the monsoon-driven infiltration of fresh, soil-derived DOM. Tube wells, by contrast, maintained elevated proportions of peptide-like (6.7–8.3%) and saturated fatty acids (4.2–4.9%) compared to shallow wells. This aliphatic enrichment likely reflects enhanced autochthonous microbial production and selective preservation of lipid-like structures under the reducing, high-ionic-strength conditions typical of the deep confined aquifer [13].

3.4.2. Thermodynamic Stability and Mechanistic Integration

Thermodynamic properties revealed fundamental depth-related divergence. Tube wells harbored significantly more reduced DOM, with nominal oxidation state of carbon (NOSCw) averaging −0.314 ± 0.056 (dry) to −0.373 ± 0.185 (wet), compared to a narrower, more oxidized range (−0.235 to −0.230) in shallow wells (p < 0.05). This more negative NOSCw was accompanied by elevated Gibbs free energy (GFEw), which increased from 69.2 ± 1.6 kJ/mol-C (dry) to 70.9 ± 5.3 kJ/mol-C (wet) in tube wells, significantly exceeding shallow well values (66.8–67.0 kJ/mol-C) (p < 0.05). These patterns indicate that deep aquifer DOM possesses higher thermodynamic potential for oxidation [54].
Consistent with this reduced state, molecular lability boundary index (MLBL) a proxy for bioavailability based on H/C ratios was significantly higher (p < 0.05) in tube wells (0.235 ± 0.019) than in shallow wells (0.206 ± 0.041). The co-occurrence of low NOSC, high GFE, and high MLBL indicates a selective accumulation of saturated aliphatic compounds (e.g., fatty acids, alkanes) in the confined aquifer [55,56]. High MLBL values indicate a greater proportion of bioavailable, aliphatic-rich DOM which may promote microbial regrowth when anoxic groundwater is exposed to oxygen during pumping or treatment processes. In such conditions, the presence of energy-rich, reduced DOM (low NOSC and high GFE) may enhance assimilable organic carbon (AOC) levels, thereby stimulating biomass development within distribution systems and biofilters [57]. In addition, aliphatic DOM characterized by higher H/C ratios is generally more reactive during chlorination than aromatic DOM, which may lead to increased formation of disinfection byproducts (DBPs), including trihalomethanes (THMs) and haloacetic acids (HAAs). The elevated thermodynamic potential of reduced DOM further suggests that these compounds may undergo oxidative transformation into reactive intermediates during treatment, potentially enhancing DBP formation under standard disinfection conditions [58,59,60]. While these molecules represent theoretically labile and energy-rich substrates for aerobic metabolism, their persistence at depth likely reflects kinetic limitations imposed by anoxia and structural halogenation. Simpson evenness indices reinforced this interpretation: tube wells (0.204 ± 0.031) showed 41% lower evenness than shallow wells (0.287 ± 0.043) (p < 0.05), confirming that the deep aquifer DOM assemblage is dominated by a specific subset of compounds likely the halogenated aliphatics and saturated fatty acids identified above while hundreds of minor components contribute to the high overall richness [61].

3.5. Integrating Optical, Molecular, and Thermodynamic Signatures Reveals Contrasting Dissolved Organic Matter Biogeochemistry Across Aquifer Strata

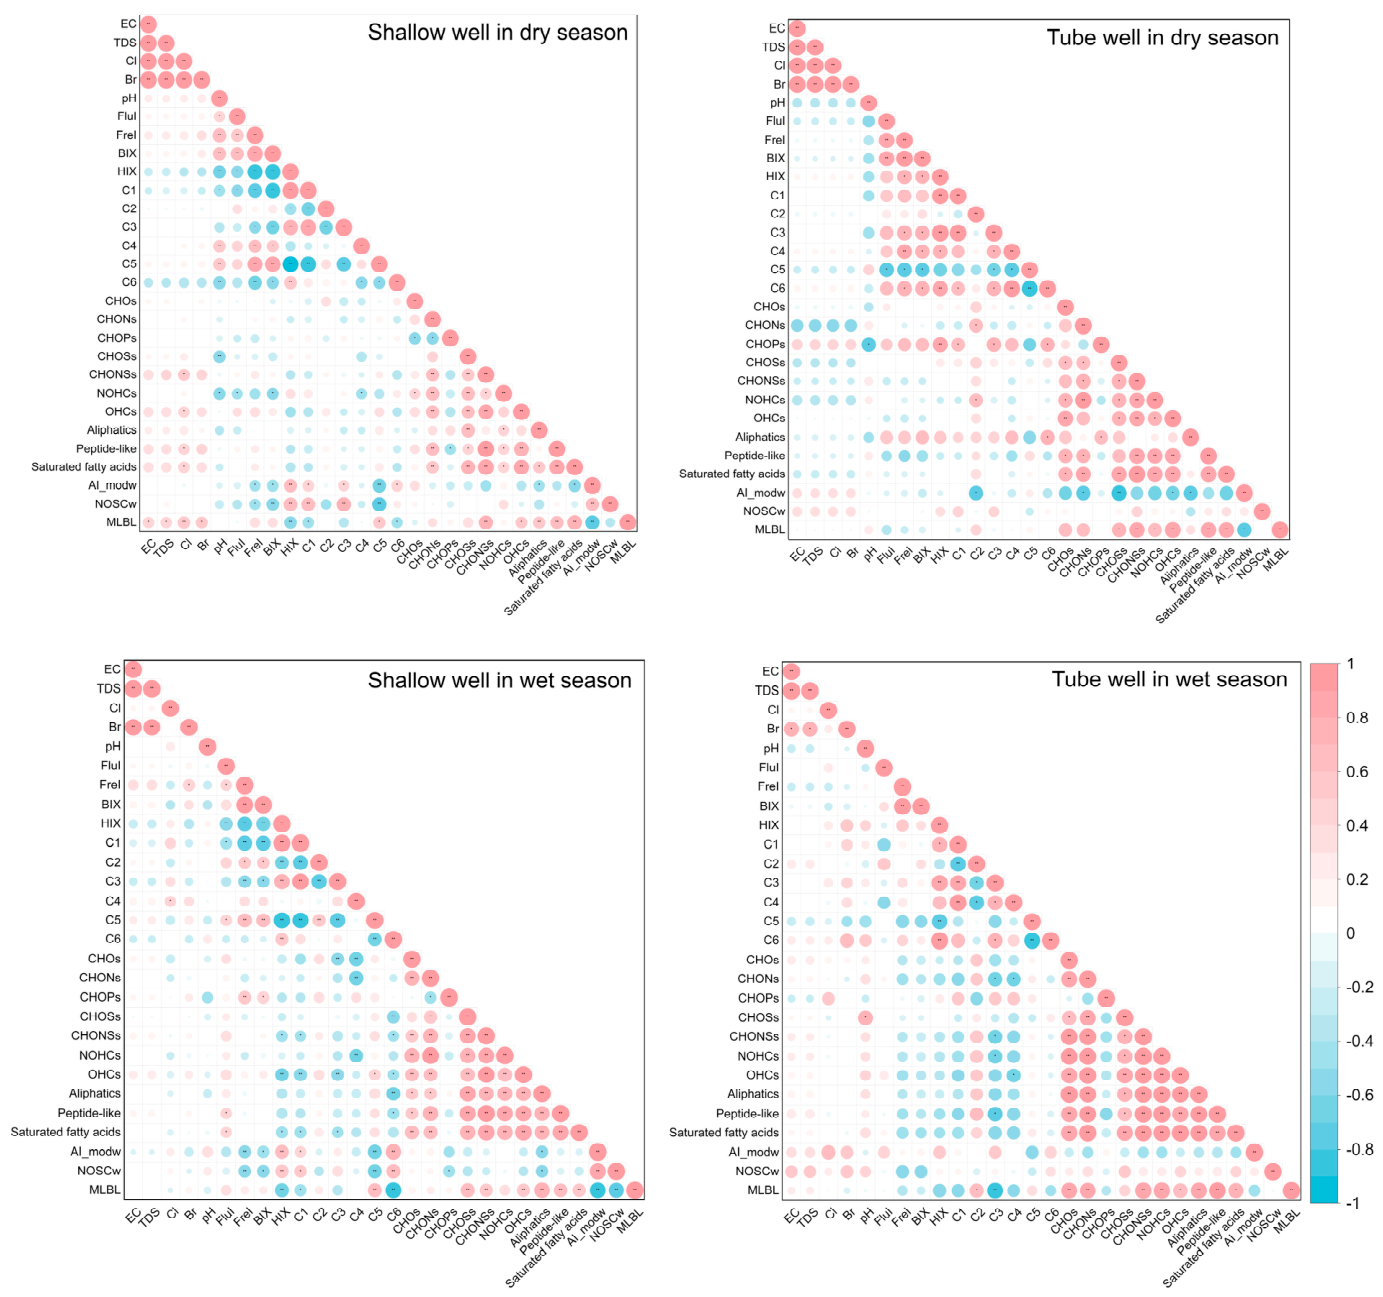
To disentangle the complex interplay among monsoon hydrology, hydrological setting, and DOM biogeochemistry, we constructed condition-specific Spearman correlation matrices integrating bulk hydrochemistry, fluorescence indices, PARAFAC components, and FT-ICR-MS molecular descriptors (Figure 5). Rather than revealing a single dominant driver, the resulting networks expose fundamentally different coupling regimes between shallow and deep groundwater, providing statistical validation for the distinct transformation mechanisms proposed in the preceding sections.
The HIX emerged as the most robust cross-scale connector, and its behavior sharply discriminates between the two aquifer types. In shallow wells, HIX maintained strong, season-invariant positive correlations with the terrestrial humic component C1 (r ≥ 0.93, p < 0.001), aromaticity index (AI_modw, r ≈ 0.60, p < 0.01), and NOSCw (r = 0.60–0.70, p < 0.01). Conversely, it correlated negatively with the protein-like component C5 (r = −0.92 dry, −0.89 wet; p < 0.001), H/C ratios (r ≈ −0.65, p < 0.01) and GFEw (r = −0.70, p < 0.001). Consistent with this humic signature, DOC concentrations in dry-season shallow wells exhibited strong positive correlations with the oxidized signatures (HIX: r = 0.78; C1: r = 0.79) but operated completely independently of salinity tracers (Cl, Na+). This source-independent DOC behavior confirms that shallow groundwater DOM dynamics are driven by evapotranspirative concentration and continuous equilibration with vadose zone soils, rather than by mixing with saline endmembers [40].
In tube wells, the correlation structure fundamentally diverged from shallow wells. The HIX–molecular coupling weakened substantially (e.g., HIX vs. NOSCw: r = 0.35 dry, 0.18 wet), indicating that deep groundwater DOM is shaped by multiple, partially independent transformation pathways that decouple optical and molecular signatures. This statistical decoupling suggests that deep aquifer DOM responds to more complex, seasonally variable forcing than shallow systems. The protein-like fluorescence component C2 proved more effective than BIX as a molecular-scale tracer of microbial activity in tube wells. C2 correlated positively with nitrogen-bearing formulas CHONs (r = 0.68 dry, 0.52 wet), peptide-like compounds (r = 0.30 dry, 0.62 wet), and aliphatic structures (r = 0.43 dry, 0.53 wet). Strikingly, these correlations were largely absent in shallow wells across both seasons (|r| < 0.18), confirming that the fluorescence shifts correspond to autochthonous production of reduced, nitrogen-rich, aliphatic metabolites exclusively within the confined aquifer [48]. The seasonal intensification of the C2–peptide correlation (from 0.30 to 0.62) is consistent with monsoon-triggered fracture-flow infiltration delivering fresh substrates that stimulate secondary microbial production in the previously stagnant deep aquifer [62].
Contrary to expectations based on conservative mixing, Cl showed only weak to moderate correlations with OHCs across most conditions, decoupling from the persistent OHC enrichment observed in deep groundwater. This lack of instantaneous correlation possibly suggests that deep-aquifer halogenation reflects cumulative, long-residence-time abiotic reactions and matrix interactions rather than simple mixing driven by seasonal salinity fluctuations. In other words, the halogenated DOM pool in confined aquifers is not a direct product of seawater mixing but rather an accumulated legacy of prolonged chemical transformation [53].
Beyond these individual shifts, the correlation networks resolve the thermodynamic paradox surrounding the MLBL. Across all conditions, MLBL correlated strongly with H/C ratios (r = 0.65–0.85) and saturated fatty acids (r = 0.58–0.85), confirming its fundamental dependence on aliphatic hydrogen content. Critically, in tube wells, MLBL simultaneously correlated with OHCs (r = 0.90 dry, 0.70 wet) and peptide-like compounds (r = 0.84 dry, 0.90 wet) molecular classes that are nominally labile but functionally recalcitrant under the anoxic, high-ionic-strength conditions of confined aquifers. The positive MLBL–GFEw correlation observed in shallow wells (r = 0.35 dry, 0.75 wet) collapsed entirely in tube wells, mathematically demonstrating that the expected coupling between molecular lability and thermodynamic favorability breaks down in deep groundwater [63]. This covariance structure clarifies why deep tube wells exhibited both high MLBL and low NOSC: the elevated MLBL scores are driven by the accumulation of long-chain lipids, halogenated aliphatics, and hydrophobic fatty acids that, while possessing high H/C ratios, remain kinetically protected from biodegradation under anoxic and saline conditions [64]. These findings highlight a critical limitation in applying terrestrial DOM lability frameworks to structurally stratified, marine-influenced groundwater systems, where thermodynamic potential and actual bioavailability fundamentally diverge.

4. Conclusions

This integrated multi-proxy investigation of a monsoon-affected coastal aquifer reveals that DOM biogeochemistry in vertically stratified groundwater systems is fundamentally shaped by the interplay of seasonal hydrology, aquifer structure, and long-term SWI. We identify the shallow unconfined aquifer as a resilient, soil-buffered system, where continuous vadose zone equilibration insulates DOM from extreme hydrochemical perturbations. Despite monsoon-driven freshening, shallow groundwater maintained consistent humification characteristics, aromaticity, and oxidation state across seasons. Correlation analysis indicated that DOM concentrations in shallow wells were largely decoupled from salinity, reflecting the influence of evapotranspirative concentration during dry periods. This buffering capacity has important implications for water quality, this stability suggests more predictable DOM reactivity, with potential implications for reducing variability in disinfection byproduct formation during water treatment.
In contrast, the deeper confined aquifer exhibits more dynamic, seasonally responsive DOM characteristics. Wet-season infiltration triggered an enhanced microbial activity evidenced by elevated protein-like fluorescence, enriched nitrogen compounds, and reduced oxidation states. Particularly striking is the spatial concentration of this microbial activation in SWI-affected regions, strongly suggesting that prolonged seawater–aquifer interaction preconditions the system, priming it for enhanced biological activity upon the delivery of fresh monsoon substrates. Concurrently, the deeper groundwater accumulates persistent halogenated DOM, with bromine serving as a sensitive tracer of marine influence. The wet-season increase in chlorinated compounds likely indicates halogenation of monsoon-delivered terrestrial DOM under elevated chloride backgrounds in the deep groundwater.
Our molecular results highlighted a severe limitation in conventional thermodynamic paradigms for predicting DOM bioavailability. Deep groundwater exhibited both high theoretical lability and elevated chemical potential. Paradoxically, our correlation matrices suggest that this apparent lability is fundamentally decoupled from actual bioavailability. The elevated indices are driven by the selective accumulation of long-chain saturated fatty acids and halogenated aliphatics. While structurally labile, these hydrophobic compounds remain kinetically protected and biologically recalcitrant under the saline, anoxic conditions of the confined aquifer. Consequently, established terrestrial lability frameworks break down in structurally stratified, marine-influenced systems. As climate change intensifies monsoon extremes and accelerates coastal salinization, these findings carry urgent public health implications. The accumulation of persistent organohalogens and kinetically locked, energy-rich DOM in deep aquifers often the primary drinking water sources in regions vulnerable to endemic kidney disease poses cryptic water quality risks that standard bulk carbon measurements completely fail to detect. Overall, sustainable management of tropical coastal groundwater must account for these vertically stratified, chemically hidden transformations of organic matter driven by the compounding stressors of monsoon hydrology and seawater intrusion. However, we acknowledge that higher temporal resolution sampling would be required to fully resolve intra-seasonal variability and indicates the persistence of these patterns.

Supplementary Materials

The following supporting information can be downloaded at: https://www.mdpi.com/article/10.3390/hydrology13050120/s1, Text S1. Solid-Phase Extraction (SPE) for FT-ICR-MS Sample Preparation. Table S1. Spectral characteristics of five components identified by PARAFAC analysis compared to previously identified sources. Table S2. Fluorescent components and optical indices of DOM in shallow and tube wells during the dry and wet seasons. Table S3. Fluorescent components and optical indices of DOM in shallow and tube wells during the dry and wet seasons. Table S4. The number and relative intensity-weighted parameters of DOM molecular compositions in shallow wells during dry season. Table S5. The number and relative intensity-weighted parameters of DOM molecular compositions in shallow wells during wet season. Table S6. The number and relative intensity-weighted parameters of DOM molecular compositions in tube wells during dry season. Table S7. The number and relative intensity-weighted parameters of DOM molecular compositions in tube wells during wet season. Figure S1. EEM fingers, excitation (blue lines) and emission (orange lines) loadings of the six components identified by the DOM PARAFAC analysis. Figure S2. Seawater intrusion interpolation maps of dry and wet seasons. Figure S3. Spatial distribution maps of fluorescence indices in groundwater from shallow and tube wells during dry and wet seasons. Biological index (BIX), Fluorescence index (Fl), Freshness Index (Frel).

Author Contributions

All authors contributed to the conception and design of the study. A.R., S.A. and R.W. (Ruizhe Wang) drafted the manuscript, performed data analysis, and prepared the figures and maps. Y.W. (Yawei Wang) and H.Z. (Hui Zhong) assisted with the funding acquisition. M.M., S.K.W. and R.W. (Rohan Weerasooriya) conduct investigation and supply resources. Z.H. and Y.W. (Yuansong Wei) were responsible for project administration, supervision, as well as the writing, review, and editing of the manuscript. All authors have read and agreed to the published version of the manuscript.

Funding

The authors would like to acknowledge the financial support from the China Sri Lanka Joint Research and Demonstration Center for Water Technology, China-Sri Lanka Joint Center for Education and Research, Chinese Academy of Sciences (CAS); National Natural Science Foundation of China (22176199); Beijing Natural Science Foundation (IS24058); Research Center for Eco-Environmental Sciences (RCEES-TDZ-2021–14); Program of the International Partnership Program of Chinese Academy of Sciences (059GJHZ2023104MI); CAS-ANSO Fellowship Program (ANSO-VF-2022-02; CAS-ANSO-FP-2024-07; CAS-ANSO-FS-2025-36; CAS-ANSO-FA-2025-03); The Alliance of International Science Organizations (ANSO) Scholarship for Young Talents (MSc) (Series No. 2020-140; 2023ANSOM057).

Data Availability Statement

Data is contained within the article or Supplementary Materials.

Acknowledgments

The authors express their sincere appreciation to the staff and members of the China–Sri Lanka Joint Research and Demonstration Center for Water Technology for their valuable assistance in sample collection. The authors also acknowledge the anonymous reviewers for their insightful and constructive comments, which substantially improved the quality of this manuscript.

Conflicts of Interest

The authors declare no conflicts of interest.

References

  1. Connolly, C.T.; Cardenas, M.B.; Burkart, G.A.; Spencer, R.G.M.; McClelland, J.W. Groundwater as a Major Source of Dissolved Organic Matter to Arctic Coastal Waters. Nat. Commun. 2020, 11, 1479. [Google Scholar] [CrossRef]
  2. Meem, F.F.; Rabbeny, A.K.S.; Musa, T.B.; Al Mamud, M.; Halder, C.; Karmakar, S.; Zaman, S.M.S.; Joardar, J.C. Groundwater Salinity Dynamics and Seasonal Water Quality Trends in Coastal Bangladesh: A Case Study from Khulna. Appl. Water Sci. 2025, 15, 275. [Google Scholar] [CrossRef]
  3. Jasechko, S.; Seybold, H.; Perrone, D.; Fan, Y.; Shamsudduha, M.; Taylor, R.G.; Fallatah, O.; Kirchner, J.W. Rapid Groundwater Decline and Some Cases of Recovery in Aquifers Globally. Nature 2024, 625, 715–721. [Google Scholar] [CrossRef]
  4. Chandrajith, R.; Bandara, U.G.C.; Diyabalanage, S.; Senaratne, S.; Barth, J.A.C. Application of Water Quality Index as a Vulnerability Indicator to Determine Seawater Intrusion in Unconsolidated Sedimentary Aquifers in a Tropical Coastal Region of Sri Lanka. Groundw. Sustain. Dev. 2022, 19, 100831. [Google Scholar] [CrossRef]
  5. Wijerathne, D.; Samarasekara, R.S.M.; Satanarachchi, N.; Vithanage, M.; Lakmal, H.M.A. Evaluating the Environmental Impacts of Hard Coastal Engineering Structures on Groundwater Salinity and Salinity Intrusion: Insights from the Marawila Coastal Zone, Sri Lanka. Environ. Chall. 2025, 19, 101145. [Google Scholar] [CrossRef]
  6. Jiang, X.; Liu, D.; Li, J.; Duan, H. Eutrophication and Salinization Elevate the Dissolved Organic Matter Content in Arid Lakes. Environ. Res. 2023, 233, 116471. [Google Scholar] [CrossRef] [PubMed]
  7. Morsy, S.M.; El-Hadidy, S.M. Hydrogeological Characterization and Seawater Intrusion Inference in the Coastal Aquifer, Using Groundwater Chemistry and Remote Sensing Data. Groundw. Sustain. Dev. 2025, 28, 101399. [Google Scholar] [CrossRef]
  8. Chi, W.; Yang, Y.; Wang, P.; Guo, C.; Hong, Z.; Hu, S.; Cheng, K.; Wang, S.; Li, H.; Wang, Q.; et al. Seawater Intrusion Causes Substantial Release of Dissolved Organic Carbon in Coastal Paddy Soils. Geochim. Cosmochim. Acta 2025, 403, 112–129. [Google Scholar] [CrossRef]
  9. Su, Q.; Kambale, R.D.; Tzeng, J.H.; Amy, G.L.; Ladner, D.A.; Karthikeyan, R. The Growing Trend of Saltwater Intrusion and Its Impact on Coastal Agriculture: Challenges and Opportunities. Sci. Total Environ. 2025, 966. [Google Scholar] [CrossRef]
  10. Álvarez-Alonso, R.; Robledo Ardila, P.A.; Deudero, S.; Melo-Aguilar, C.A.; Alomar, C.; Micheo, F.; Durán, J.J.; Pérez, S.; Árcega Cabrera, F.; Martínez Pérez, S. Multivariate Assessment of Groundwater Contamination Levels Associated with Saline Intrusion Processes in Mediterranean Coastal Aquifers. J. Contam. Hydrol. 2026, 278, 104877. [Google Scholar] [CrossRef] [PubMed]
  11. He, J.; Wu, X.; Zhi, G.; Yang, Y.; Wu, L.; Zhang, Y.; Zheng, B.; Qadeer, A.; Zheng, J.; Deng, W.; et al. Fluorescence Characteristics of DOM and Its Influence on Water Quality of Rivers and Lakes in the Dianchi Lake Basin. Ecol. Indic. 2022, 142, 109088. [Google Scholar] [CrossRef]
  12. Pan, T.; Zhang, Y.; Yang, F.; Liao, H.; Feng, W.; Sun, F.; Jiang, W.; Wang, Q.; Ji, M.; Yang, C.; et al. Characteristics of the Presence and Migration Patterns of DOM between Ice and Water in the Cold and Arid Daihai Lake. Sci. Total Environ. 2024, 920, 170876. [Google Scholar] [CrossRef] [PubMed]
  13. Ding, H.; Su, J.; Sun, Y.; Yu, H.; Zheng, M.; Xi, B. Insight into Spatial Variations of DOM Fractions and Its Interactions with Microbial Communities of Shallow Groundwater in a Mesoscale Lowland River Watershed. Water Res. 2024, 258, 121797. [Google Scholar] [CrossRef] [PubMed]
  14. Shakhawat, M.; Gelda, R.K.; Moore, K.E.; Mukundan, R.; Lanzarini-Lopes, M.; McBeath, S.T.; Guzman, C.D.; Reckhow, D. Impact of Storm Events on Disinfection Byproduct Precursors in a Drinking Water Source in the Northeastern United States. Water Res. 2024, 255, 121445. [Google Scholar] [CrossRef]
  15. Xie, R.; Qi, J.; Shi, C.; Zhang, P.; Wu, R.; Li, J.; Waniek, J.J. Changes of Dissolved Organic Matter Following Salinity Invasion in Different Seasons in a Nitrogen Rich Tidal Reach. Sci. Total Environ. 2023, 880, 163251. [Google Scholar] [CrossRef] [PubMed]
  16. Jayathunga, K.; Diyabalanage, S.; Frank, A.H.; Chandrajith, R.; Barth, J.A.C. Influences of Seawater Intrusion and Anthropogenic Activities on Shallow Coastal Aquifers in Sri Lanka: Evidence from Hydrogeochemical and Stable Isotope Data. Environ. Sci. Pollut. Res. 2020, 27, 23002–23014. [Google Scholar] [CrossRef]
  17. Athauda, S.; Wang, Y.; Hao, Z.; Indika, S.; Yapabandara, I.; Weragoda, S.K.; Liu, J.; Wei, Y. Geochemical Assessment of the Evolution of Groundwater under the Impact of Seawater Intrusion in the Mannar District of Sri Lanka. Water 2024, 16, 1137. [Google Scholar] [CrossRef]
  18. Hu, D.; Indika, S.; Zhong, H.; Weragoda, S.K.; Jinadasa, K.B.S.N.; Weerasooriya, R.; Wei, Y. Fluorescence Characteristics and Source Analysis of DOM in Groundwater during the Wet Season in the CKDu Zone of North Central Province, Sri Lanka. J. Environ. Manag. 2023, 327, 116877. [Google Scholar] [CrossRef]
  19. Murphy, K.R.; Timko, S.A.; Gonsior, M.; Powers, L.C.; Wünsch, U.J.; Stedmon, C.A. Photochemistry Illuminates Ubiquitous Organic Matter Fluorescence Spectra. Environ. Sci. Technol. 2018, 52, 11243–11250. [Google Scholar] [CrossRef]
  20. Yang, L.; Han, D.H.; Lee, B.M.; Hur, J. Characterizing Treated Wastewaters of Different Industries Using Clustered Fluorescence EEM-PARAFAC and FT-IR Spectroscopy: Implications for Downstream Impact and Source Identification. Chemosphere 2015, 127, 222–228. [Google Scholar] [CrossRef]
  21. Mealio, K.N.; Wells, M.J.M.; Bell, K.Y.; Wolgemuth, D.; Stretz, H.A. Fluorescent EEM-PARAFAC Considerations of Aldrich Humic Acid Salt as an Aquatic or Terrestrial Organic Matter Surrogate. J. Environ. Chem. Eng. 2024, 12, 113864. [Google Scholar] [CrossRef]
  22. Hao, Z.; Yin, Y.; Cao, D.; Liu, J. Probing and Comparing the Photobromination and Photoiodination of Dissolved Organic Matter by Using Ultra-High-Resolution Mass Spectrometry. Environ. Sci. Technol. 2017, 51, 5464–5472. [Google Scholar] [CrossRef] [PubMed]
  23. He, Y.; Jarvis, P.; Huang, X.; Shi, B. Unraveling the Characteristics of Dissolved Organic Matter Removed by Aluminum Species Based on FT-ICR MS Analysis. Water Res. 2024, 255, 121429. [Google Scholar] [CrossRef]
  24. Yu, S.; Tang, S.; Lv, J.; Li, F.; Huang, Z.; Zhao, L.; Cao, D.; Wang, Y. High Throughput Identification of Carbonyl Compounds in Natural Organic Matter by Directional Derivatization Combined with Ultra-High Resolution Mass Spectrometry. Water Res. 2024, 258, 121769. [Google Scholar] [CrossRef] [PubMed]
  25. Chen, M.; Wei, D.; Li, L.; Wang, F.; Du, Y. Magnitude Filter Combined with Mass Filter: A Reliable Strategy to Improve the Reproducibility of ESI-FT-ICR-MS Analysis on the Fingerprint of Dissolved Organic Matter. Anal. Chem. 2022, 94, 10643–10650. [Google Scholar] [CrossRef]
  26. Halloran, L.J.S. Improving Groundwater Storage Change Estimates Using Time-Lapse Gravimetry with Gravi4GW. Environ. Model. Softw. 2022, 150, 105340. [Google Scholar] [CrossRef]
  27. Ai, C.; Huang, L.; Zhang, Z. A Mann–Whitney Test of Distributional Effects in a Multivalued Treatment. J. Stat. Plan. Inference 2020, 209, 85–100. [Google Scholar] [CrossRef]
  28. Ahmad, A.Y.; Saleh, I.A.; Balakrishnan, P.; Al-Ghouti, M.A. Comparison GIS-Based Interpolation Methods for Mapping Groundwater Quality in the State of Qatar. Groundw. Sustain. Dev. 2021, 13, 100573. [Google Scholar] [CrossRef]
  29. Hajji, S.; Allouche, N.; Bouri, S.; Aljuaid, A.M.; Hachicha, W. Assessment of Seawater Intrusion in Coastal Aquifers Using Multivariate Statistical Analyses and Hydrochemical Facies Evolution-based Model. Int. J. Environ. Res. Public Health 2022, 19, 155. [Google Scholar] [CrossRef]
  30. Promilton, A.A.A.; Ravindran, A.A.; Pitchaimani, V.S.; Kingston, J.V.; Karuppannan, S. Comprehensive Hydrogeochemical Characterization and Seasonal Water Quality Index Analysis for Sustainable Groundwater Management in Valliyur Region, Southern Tamil Nadu, India. Sci. Rep. 2025, 15, 33251. [Google Scholar] [CrossRef] [PubMed]
  31. Schroeter, S.A.; Orme, A.M.; Lehmann, K.; Lehmann, R.; Chaudhari, N.M.; Küsel, K.; Wang, H.; Hildebrandt, A.; Totsche, K.U.; Trumbore, S.; et al. Hydroclimatic Extremes Threaten Groundwater Quality and Stability. Nat. Commun. 2025, 16, 720. [Google Scholar] [CrossRef]
  32. Fidelibus, M.D.; Balacco, G.; Alfio, M.R.; Arfaoui, M.; Bassukas, D.; Güler, C.; Hamzaoui-Azaza, F.; Külls, C.; Panagopoulos, A.; Parisi, A.; et al. A Chloride Threshold to Identify the Onset of Seawater/Saltwater Intrusion and a Novel Categorization of Groundwater in Coastal Aquifers. J. Hydrol. 2025, 653, 132775. [Google Scholar] [CrossRef]
  33. Carvalho da Silva, R.; Seidel, M.; Dittmar, T.; Waska, H. Groundwater Springs in the German Wadden Sea Tidal Flat: A Fast-Track Terrestrial Transfer Route for Nutrients and Dissolved Organic Matter. Front. Mar. Sci. 2023, 10, 1128855. [Google Scholar] [CrossRef]
  34. Freeman, E.C.; Emilson, E.J.S.; Dittmar, T.; Braga, L.P.P.; Emilson, C.E.; Goldhammer, T.; Martineau, C.; Singer, G.; Tanentzap, A.J. Universal Microbial Reworking of Dissolved Organic Matter along Environmental Gradients. Nat. Commun. 2024, 15, 187. [Google Scholar] [CrossRef] [PubMed]
  35. Lapworth, D.J.; Gooddy, D.C.; Butcher, A.S.; Morris, B.L. Tracing Groundwater Flow and Sources of Organic Carbon in Sandstone Aquifers Using Fluorescence Properties of Dissolved Organic Matter (DOM). Appl. Geochem. 2008, 23, 3384–3390. [Google Scholar] [CrossRef]
  36. Unno, T.; Kim, J.; Kim, Y.; Nguyen, S.G.; Guevarra, R.B.; Kim, G.P.; Lee, J.H.; Sadowsky, M.J. Influence of Seawater Intrusion on Microbial Communities in Groundwater. Sci. Total Environ. 2015, 532, 337–343. [Google Scholar] [CrossRef] [PubMed]
  37. Coble, P.G. Characterization of Marine and Terrestrial DOM in Seawater Using Excitation-Emission Matrix Spectroscopy. Mar. Chem. 1996, 51, 325–346. [Google Scholar] [CrossRef]
  38. Das, T.K.; Ahmed, S.; Hossen, A.; Rahaman, M.H.; Rahman, M.M. Multivariate Statistics and Hydrogeochemistry of Deep Groundwater at Southwestern Part of Bangladesh. Heliyon 2022, 8, e11206. [Google Scholar] [CrossRef]
  39. Kumar, P.; Biswas, A.; Banerjee, S. Spatio-Temporal Variability of Seawater Mixing in the Coastal Aquifers Based on Hydrogeochemical Fingerprinting and Statistical Modeling. J. Environ. Manag. 2023, 346, 118937. [Google Scholar] [CrossRef]
  40. Yao, W.; Dong, Y.; Qi, Y.; Han, Y.; Ge, J.; Volmer, D.A.; Zhang, Z.; Liu, X.; Li, S.L.; Fu, P. Tracking the Changes of DOM Composition, Transformation, and Cycling Mechanism Triggered by the Priming Effect: Insights from Incubation Experiments. Environ. Sci. Technol. 2025, 59, 430–442. [Google Scholar] [CrossRef]
  41. Baghoth, S.A.; Sharma, S.K.; Amy, G.L. Tracking Natural Organic Matter (NOM) in a Drinking Water Treatment Plant Using Fluorescence Excitation-Emission Matrices and PARAFAC. Water Res. 2011, 45, 797–809. [Google Scholar] [CrossRef]
  42. Ding, H.; Zheng, M.; Yan, L.; Zhang, X.; Liu, L.; Sun, Y.; Su, J.; Xi, B.; Yu, H. Spectral and Molecular Insights into the Variations of Dissolved Organic Matter in Shallow Groundwater Impacted by Surface Water Recharge. Water Res. 2025, 273, 122978. [Google Scholar] [CrossRef]
  43. Kulkarni, H.V.; Mladenov, N.; Datta, S.; Chatterjee, D. Influence of Monsoonal Recharge on Arsenic and Dissolved Organic Matter in the Holocene and Pleistocene Aquifers of the Bengal Basin. Sci. Total Environ. 2018, 637–638, 588–599. [Google Scholar] [CrossRef]
  44. Servais, S.; Kominoski, J.S.; Coronado-Molina, C.; Bauman, L.; Davis, S.E.; Gaiser, E.E.; Kelly, S.; Madden, C.; Mazzei, V.; Rudnik, D.; et al. Effects of Saltwater Pulses on Soil Microbial Enzymes and Organic Matter Breakdown in Freshwater and Brackish Coastal Wetlands. Estuaries Coasts 2020, 43, 814–830. [Google Scholar] [CrossRef]
  45. Murphy, K.R.; Hambly, A.; Singh, S.; Henderson, R.K.; Baker, A.; Stuetz, R.; Khan, S.J. Organic Matter Fluorescence in Municipal Water Recycling Schemes: Toward a Unified PARAFAC Model. Environ. Sci. Technol. 2011, 45, 2909–2916. [Google Scholar] [CrossRef] [PubMed]
  46. Kim, J.; Kim, G. Inputs of Humic Fluorescent Dissolved Organic Matter via Submarine Groundwater Discharge to Coastal Waters off a Volcanic Island (Jeju, Korea). Sci. Rep. 2017, 7, 7921. [Google Scholar] [CrossRef] [PubMed]
  47. Ning, C.; Sun, S.; Gao, Y.; Xie, H.; Wu, L.; Zhang, H.; Chen, J.; Geng, N. Characterization of Natural and Anthropogenic Dissolved Organic Matter in the Yangtze River Basin Using FT-ICR MS. Water Res. 2025, 268, 122636. [Google Scholar] [CrossRef]
  48. Liu, S.; He, Z.; Tang, Z.; Liu, L.; Hou, J.; Li, T.; Zhang, Y.; Shi, Q.; Giesy, J.P.; Wu, F. Linking the Molecular Composition of Autochthonous Dissolved Organic Matter to Source Identification for Freshwater Lake Ecosystems by Combination of Optical Spectroscopy and FT-ICR-MS Analysis. Sci. Total Environ. 2020, 703, 134764. [Google Scholar] [CrossRef]
  49. Wang, L.; Wang, Q.; Zheng, D. Study on the Pollution Mechanism and Driving Factors of Groundwater Quality in Typical Industrial Areas of China. Water 2025, 17, 1420. [Google Scholar] [CrossRef]
  50. Biester, H.; Selimovi’c, D.; Hemmerich, S.; Petri, M. Halogens in Pore Water of Peat Bogs-the Role of Peat Decomposition and Dissolved Organic Matter. Biogeosciences 2006, 3, 53–64. [Google Scholar] [CrossRef]
  51. Puzyn, T.; Haranczyk, M.; Suzuki, N.; Sakurai, T. Estimating Persistence of Brominated and Chlorinated Organic Pollutants in Air, Water, Soil, and Sediments with the QSPR-Based Classification Scheme. Mol. Divers. 2011, 15, 173–188. [Google Scholar] [CrossRef]
  52. Leyva, D.; Tariq, M.U.; Jaffé, R.; Saeed, F.; Lima, F.F. Unsupervised Structural Classification of Dissolved Organic Matter Based on Fragmentation Pathways. Environ. Sci. Technol. 2022, 56, 1458–1468. [Google Scholar] [CrossRef]
  53. Du, Y.; Deng, Y.; Liu, Z.; Huang, Y.; Zhao, X.; Li, Q.; Ma, T.; Wang, Y. Novel Insights into Dissolved Organic Matter Processing Pathways in a Coastal Confined Aquifer System with the Highest Known Concentration of Geogenic Ammonium. Environ. Sci. Technol. 2021, 55, 14676–14688. [Google Scholar] [CrossRef]
  54. Moore, O.C.; Holt, A.D.; Richards, L.A.; McKenna, A.M.; Spencer, R.G.M.; Lapworth, D.J.; Polya, D.A.; Lloyd, J.R.; van Dongen, B.E. Characterisation of Dissolved Organic Matter in Two Contrasting Arsenic-Prone Sites in Kandal Province, Cambodia. Org. Geochem. 2024, 198, 104886. [Google Scholar] [CrossRef]
  55. Lechtenfeld, O.J.; Kaesler, J.; Jennings, E.K.; Koch, B.P. Direct Analysis of Marine Dissolved Organic Matter Using LC-FT-ICR MS. Environ. Sci. Technol. 2024, 58, 4637–4647. [Google Scholar] [CrossRef]
  56. Huo, C.; Hao, Z.; Yuan, C.; Chen, Y.; Liu, J. Probing the Phytosynthesis Mechanism of Gold and Silver Nanoparticles by Sequential Separation of Plant Extract and Molecular Characterization with Ultra-High-Resolution Mass Spec-trometry. ACS Sustain. Chem. Eng. 2022, 10, 3829–3838. [Google Scholar] [CrossRef]
  57. Shube, H.; Karuppannan, S.; Haji, M.; Paneerselvam, B.; Kawo, N.; Mechal, A.; Fekadu, A. Appraising Groundwater Quality and Probabilistic Human Health Risks from Fluoride-Enriched Groundwater Using the Pollution Index of Groundwater (PIG) and GIS: A Case Study of Adama Town and Its Vicinities in the Central Main Ethiopian Rift Valley. RSC Adv. 2024, 14, 30272–30285. [Google Scholar] [CrossRef] [PubMed]
  58. Huang, X.; Ren, X.; Zhang, Z.; Gu, P.; Yang, K.; Miao, H. Characteristics in Dissolved Organic Matter and Disinfection By-Product Formation during Advanced Treatment Processes of Municipal Secondary Effluent with Orbitrap Mass Spectrometry. Chemosphere 2023, 339, 139725. [Google Scholar] [CrossRef] [PubMed]
  59. Hossain, M.M.; Sikder, R.; Hua, G.; Ye, T. From Model Development to Mitigation: Machine Learning for Predicting and Minimizing Iodinated Trihalomethanes in Water Treatment. Environ. Sci. Technol. 2025, 59, 11638–11652. [Google Scholar] [CrossRef]
  60. Kalita, I.; Kamilaris, A.; Havinga, P.; Reva, I. Assessing the Health Impact of Disinfection Byproducts in Drinking Water. ACS EST Water 2024, 4, 1564–1578. [Google Scholar] [CrossRef] [PubMed]
  61. Kurek, M.R.; Frey, K.E.; Guillemette, F.; Podgorski, D.C.; Townsend-Small, A.; Arp, C.D.; Kellerman, A.M.; Spencer, R.G.M. Trapped Under Ice: Spatial and Seasonal Dynamics of Dissolved Organic Matter Composition in Tundra Lakes. J. Geophys. Res. Biogeosci. 2022, 127, e2021JG006578. [Google Scholar] [CrossRef]
  62. Zhang, Y.; Horne, R.N.; Hawkins, A.J.; Primo, J.C.; Gorbatenko, O.; Dekas, A.E.; Jorgensen, B.B. Geological Activity Shapes the Microbiome in Deep-Subsurface Aquifers by Advection. Proc. Natl. Acad. Sci. USA 2022, 119, e2113985119. [Google Scholar] [CrossRef] [PubMed]
  63. Stegen, J.C.; Johnson, T.; Fredrickson, J.K.; Wilkins, M.J.; Konopka, A.E.; Nelson, W.C.; Arntzen, E.V.; Chrisler, W.B.; Chu, R.K.; Fansler, S.J.; et al. Influences of Organic Carbon Speciation on Hyporheic Corridor Biogeochemistry and Microbial Ecology. Nat. Commun. 2018, 9, 585. [Google Scholar] [CrossRef] [PubMed]
  64. Pidchenko, I.N.; Christensen, J.N.; Kutzschbach, M.; Ignatyev, K.; Puigdomenech, I.; Tullborg, E.L.; Roberts, N.M.W.; Rasbury, E.T.; Northrup, P.; Tappero, R.; et al. Deep Anoxic Aquifers Could Act as Sinks for Uranium through Microbial-Assisted Mineral Trapping. Commun. Earth Environ. 2023, 4, 128. [Google Scholar] [CrossRef]
Figure 1. Study area and sampling locations. Blue triangles representing shallow wells and purple squares representing tube wells. Seawater intrusion (SWI) mainly affects the western coastal zone and southeastern coastal zone.
Hydrology 13 00120 g001
Figure 2. Fluorescence indices (FI (A), FreI (B), BIX (C), and HIX (D), upper) of DOM and spatial distribution of HIX (lower panels) across shallow and tube wells during wet and dry seasons. Fluorescence index (FI), freshness index (FreI), biological index (BIX), humification index (HIX), dry shallow (DS), wet shallow (WS), dry tube (DT), and wet tube (WT). Spatial distributions were generated using inverse distance weighting (IDW).
Hydrology 13 00120 g002
Figure 3. Spatial and temporal distribution maps of fluorescence components C1, C2, C3, and C5 in groundwater from shallow and tube wells during the dry and wet seasons. Component 1 (C1), Component 2 (C2), Component 3 (C3), Component 5 (C5). Spatial distributions were generated using inverse distance weighting (IDW). Values are expressed as percentage (%).
Hydrology 13 00120 g003
Figure 4. Molecular composition of dissolved organic matter (DOM) in shallow and tube wells during dry and wet seasons. Upper panels show van Krevelen diagrams (H/C vs. O/C) of molecular formulas (CHOs, CHONs, CHOSs, CHONSs). Lower panels display (A) relative abundance of elemental groups and (B) distribution of compound classes across well types and seasons. Compound classes (Regions 1–7) represent lipid-, protein-, amino sugar-, carbohydrate-, lignin-, tannin-, and condensed aromatic-like compounds. Dry shallow (DS), wet shallow (WS), dry tube (DT), and wet tube (WT).
Hydrology 13 00120 g004
Figure 5. Spearman correlation coefficients between groundwater parameters and DOM spectral and molecular parameters in shallow and tube wells during the dry and wet seasons. Asterisks (* and **) denote statistical significance at p < 0.05 and p < 0.01 between groundwater parameters and DOM spectral and molecular parameters.
Hydrology 13 00120 g005
Table 1. Geochemical characteristics of DOM across shallow and tube wells during wet and dry seasons.
Well TypeSeasonpHEC (µS/cm)TDS (mg/L)Na+ (mg/L)Cl (mg/L)Br (mg/L)DOC (mg/L)
ShallowDry6.97 ± 0.561548.23 ± 1249.07773.80 ± 624.13162.20 ± 178.90301.77 ± 368.190.93 ± 1.116.64 ± 3.19
TubeDry6.48 ± 0.402336.24 ± 1360.391168.35 ±680.6234.12 ± 156.83505.24 ± 430.861.75 ± 1.573.93 ± 2.55
ShallowWet8.84 ± 0.261624.87 ± 1232.95812.44 ± 616.47173.02 ± 202.9043.50 ± 70.931.02 ± 1.225.31 ± 3.11
TubeWet8.54 ± 0.292332.94 ± 1344.421166.47 ± 672.21259.25 ± 192.5659.12 ± 26.531.26 ± 1.155.02 ± 9.97
Note: Values are reported as mean ± standard deviation. Electrical conductivity (EC, µS/cm), Total dissolved solids (mg/L), Dissolved organic carbon (DOC, mg/L).
Table 2. Fluorescent components and optical indices of DOM in shallow and tube wells during the dry and wet seasons.
Well TypeSeasonFIFreIBIXHIXC1 (%)C2 (%)C3 (%)C4 (%)C5 (%)C6 (%)
ShallowDry2.35 ± 0.200.97 ± 0.121.06 ± 0.140.69 ± 0.2021.62 ± 11.3411.53 ± 15.5320.99 ± 11.0313.54 ± 4.2623.93 ± 16.568.39 ± 5.16
ShallowWet2.38 ± 0.230.92 ± 0.091.00 ± 0.110.70 ± 0.1920.70 ± 11.2712.91 ± 13.8420.24 ± 9.7210.74 ± 3.6822.09 ± 19.9013.31 ± 6.89
TubeDry2.36 ± 0.210.99 ± 0.151.06 ± 0.170.39 ± 0.177.98 ± 5.5624.55 ± 17.907.91 ± 6.5711.85 ± 5.9043.62 ± 22.614.09 ± 4.00
TubeWet2.32 ± 0.341.03 ± 0.191.15 ± 0.230.29 ± 0.225.60 ± 7.0135.62 ± 24.106.44 ± 8.389.44 ± 6.8939.15 ± 22.723.75 ± 4.87
Note: Values are reported as mean ± standard deviation. Component 1 (C1), Component 2 (C2), Component 3 (C3), Component 4 (C4), Component 5 (C5), Component 6 (C6), Fluorescence index (FI), Freshness index (FreI), Biological index (BIX), Humification index (HIX).
Disclaimer/Publisher’s Note: The statements, opinions and data contained in all publications are solely those of the individual author(s) and contributor(s) and not of MDPI and/or the editor(s). MDPI and/or the editor(s) disclaim responsibility for any injury to people or property resulting from any ideas, methods, instructions or products referred to in the content.