
Monitoring the Impacts of Human Activities on Groundwater Storage Changes Using an Integrated Approach of Remote Sensing and Google Earth Engine

 , ,
, , 
Abstract
1. Introduction
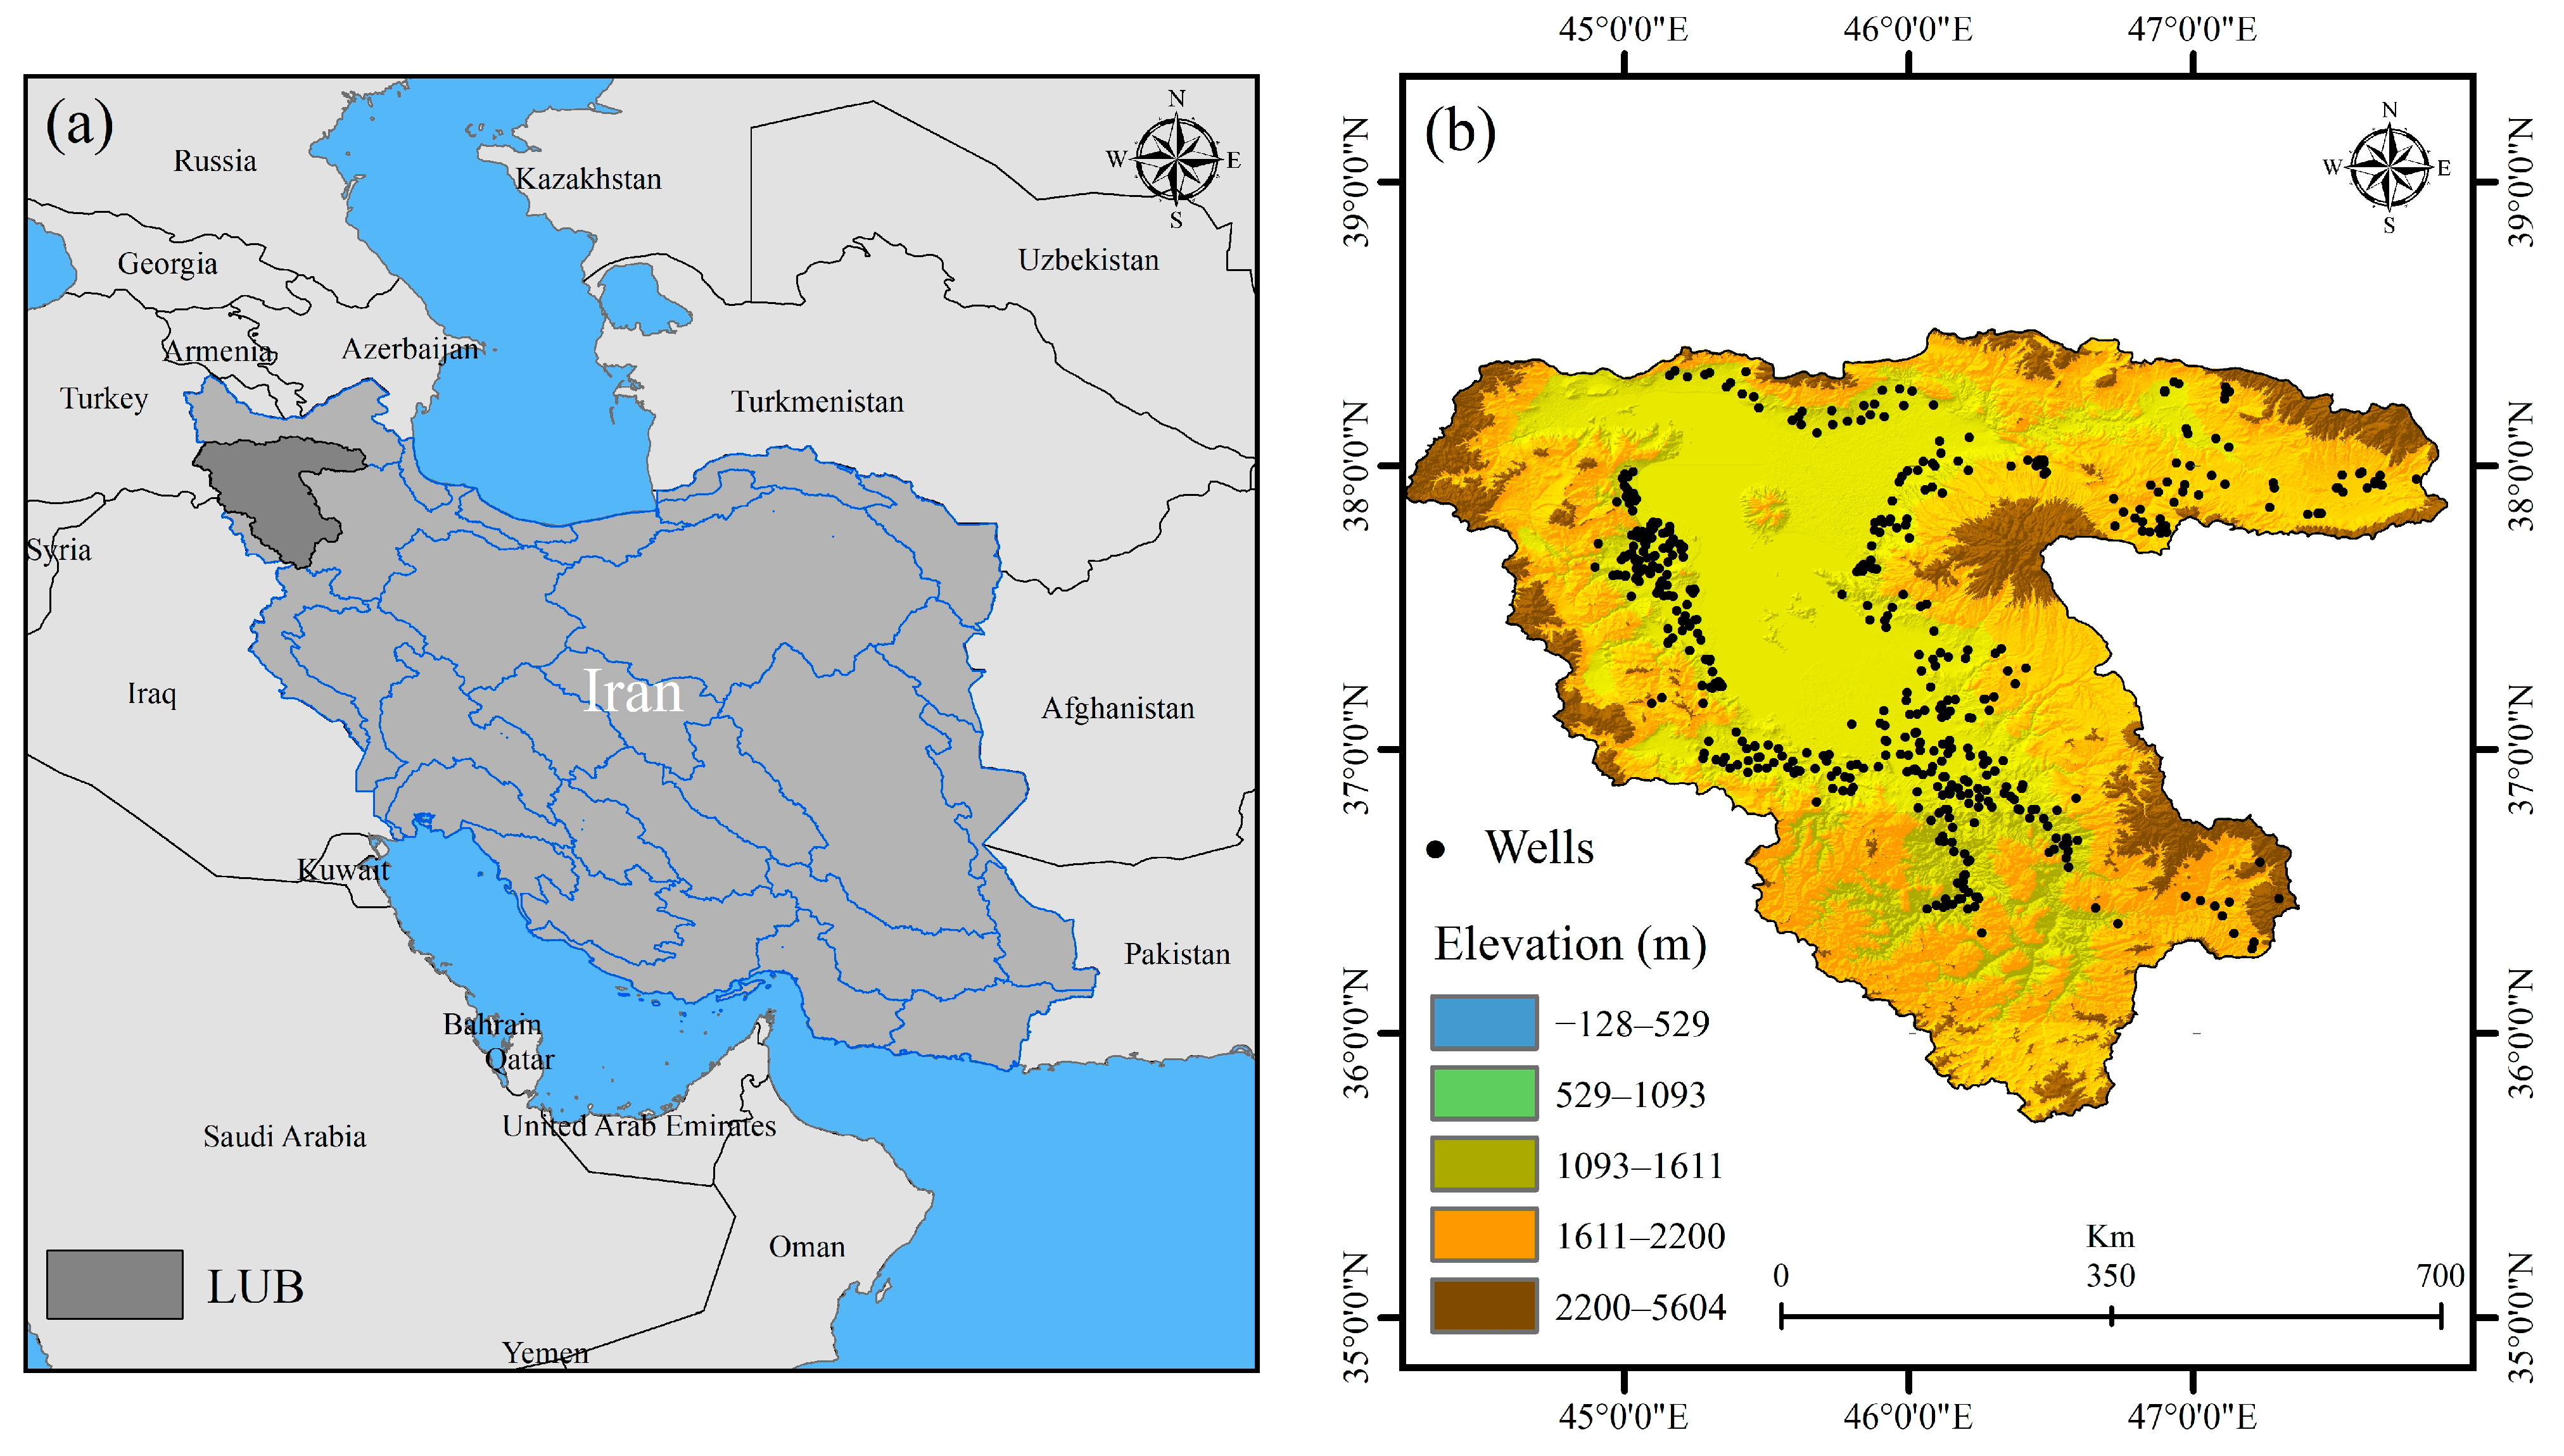
2. Study Area
3. Material and Methods
3.1. Materials
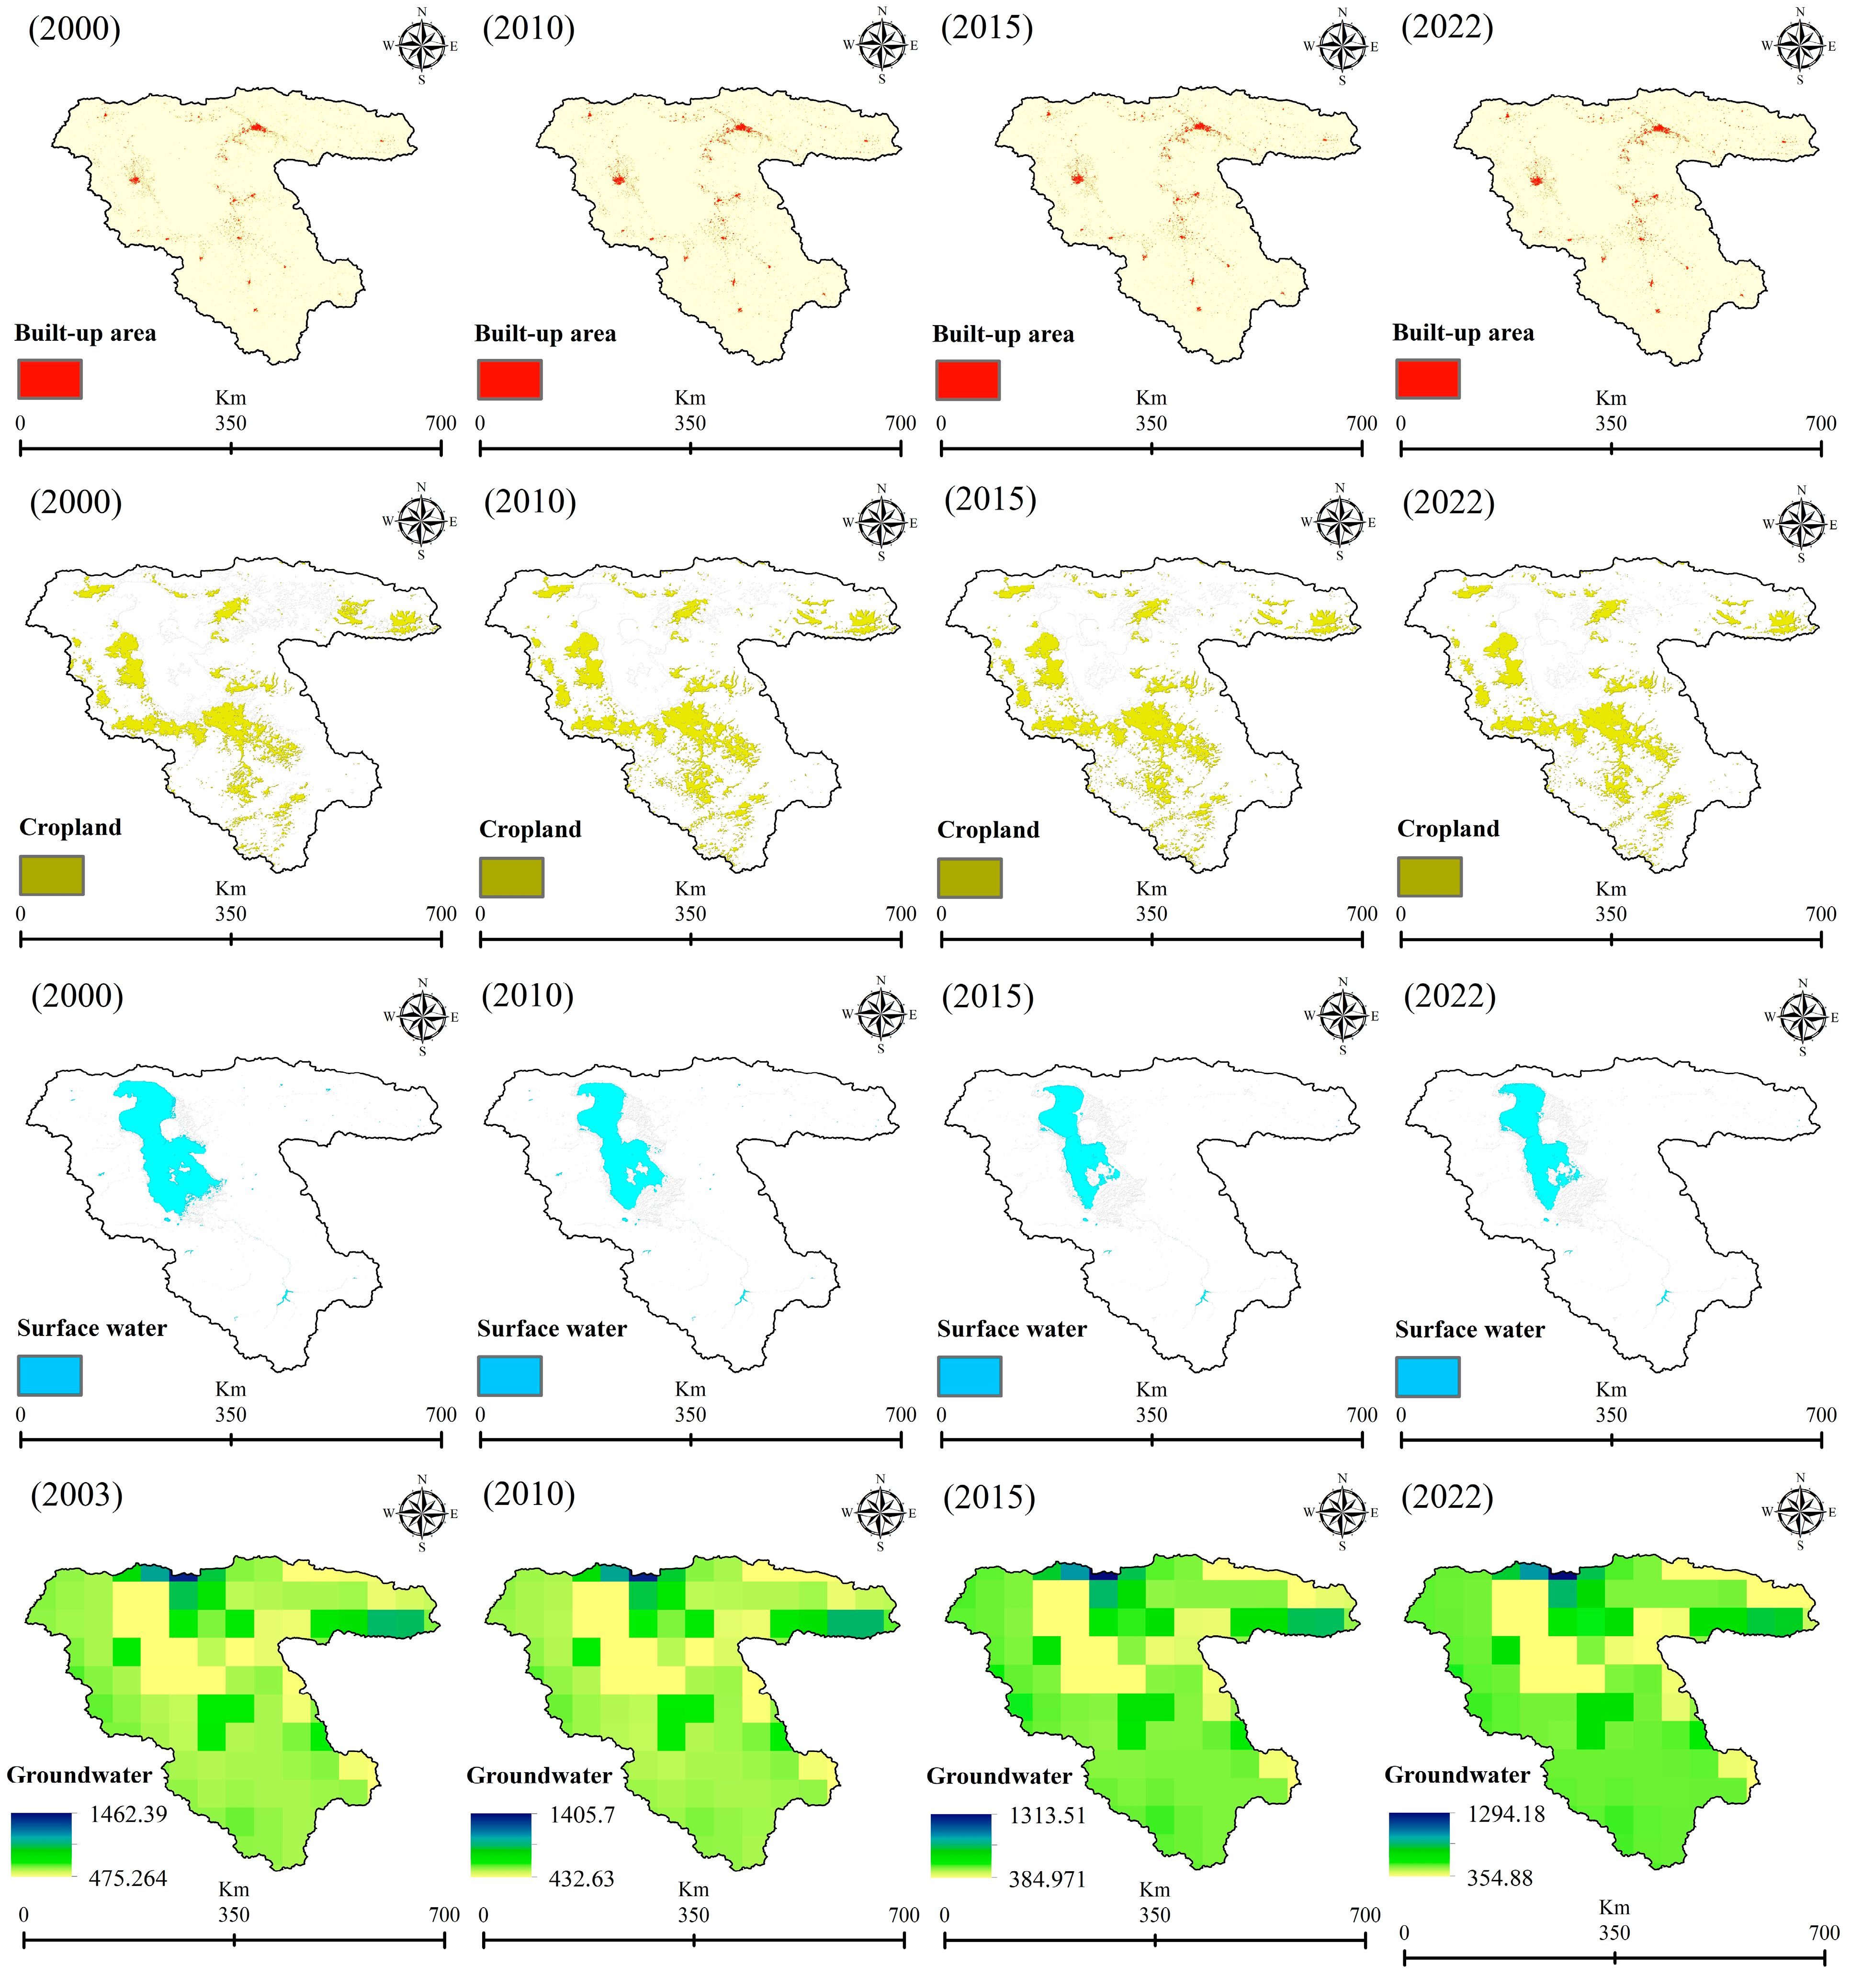
3.1.1. Built-Up Area
3.1.2. Cropland
3.1.3. Surface Water
3.1.4. Groundwater
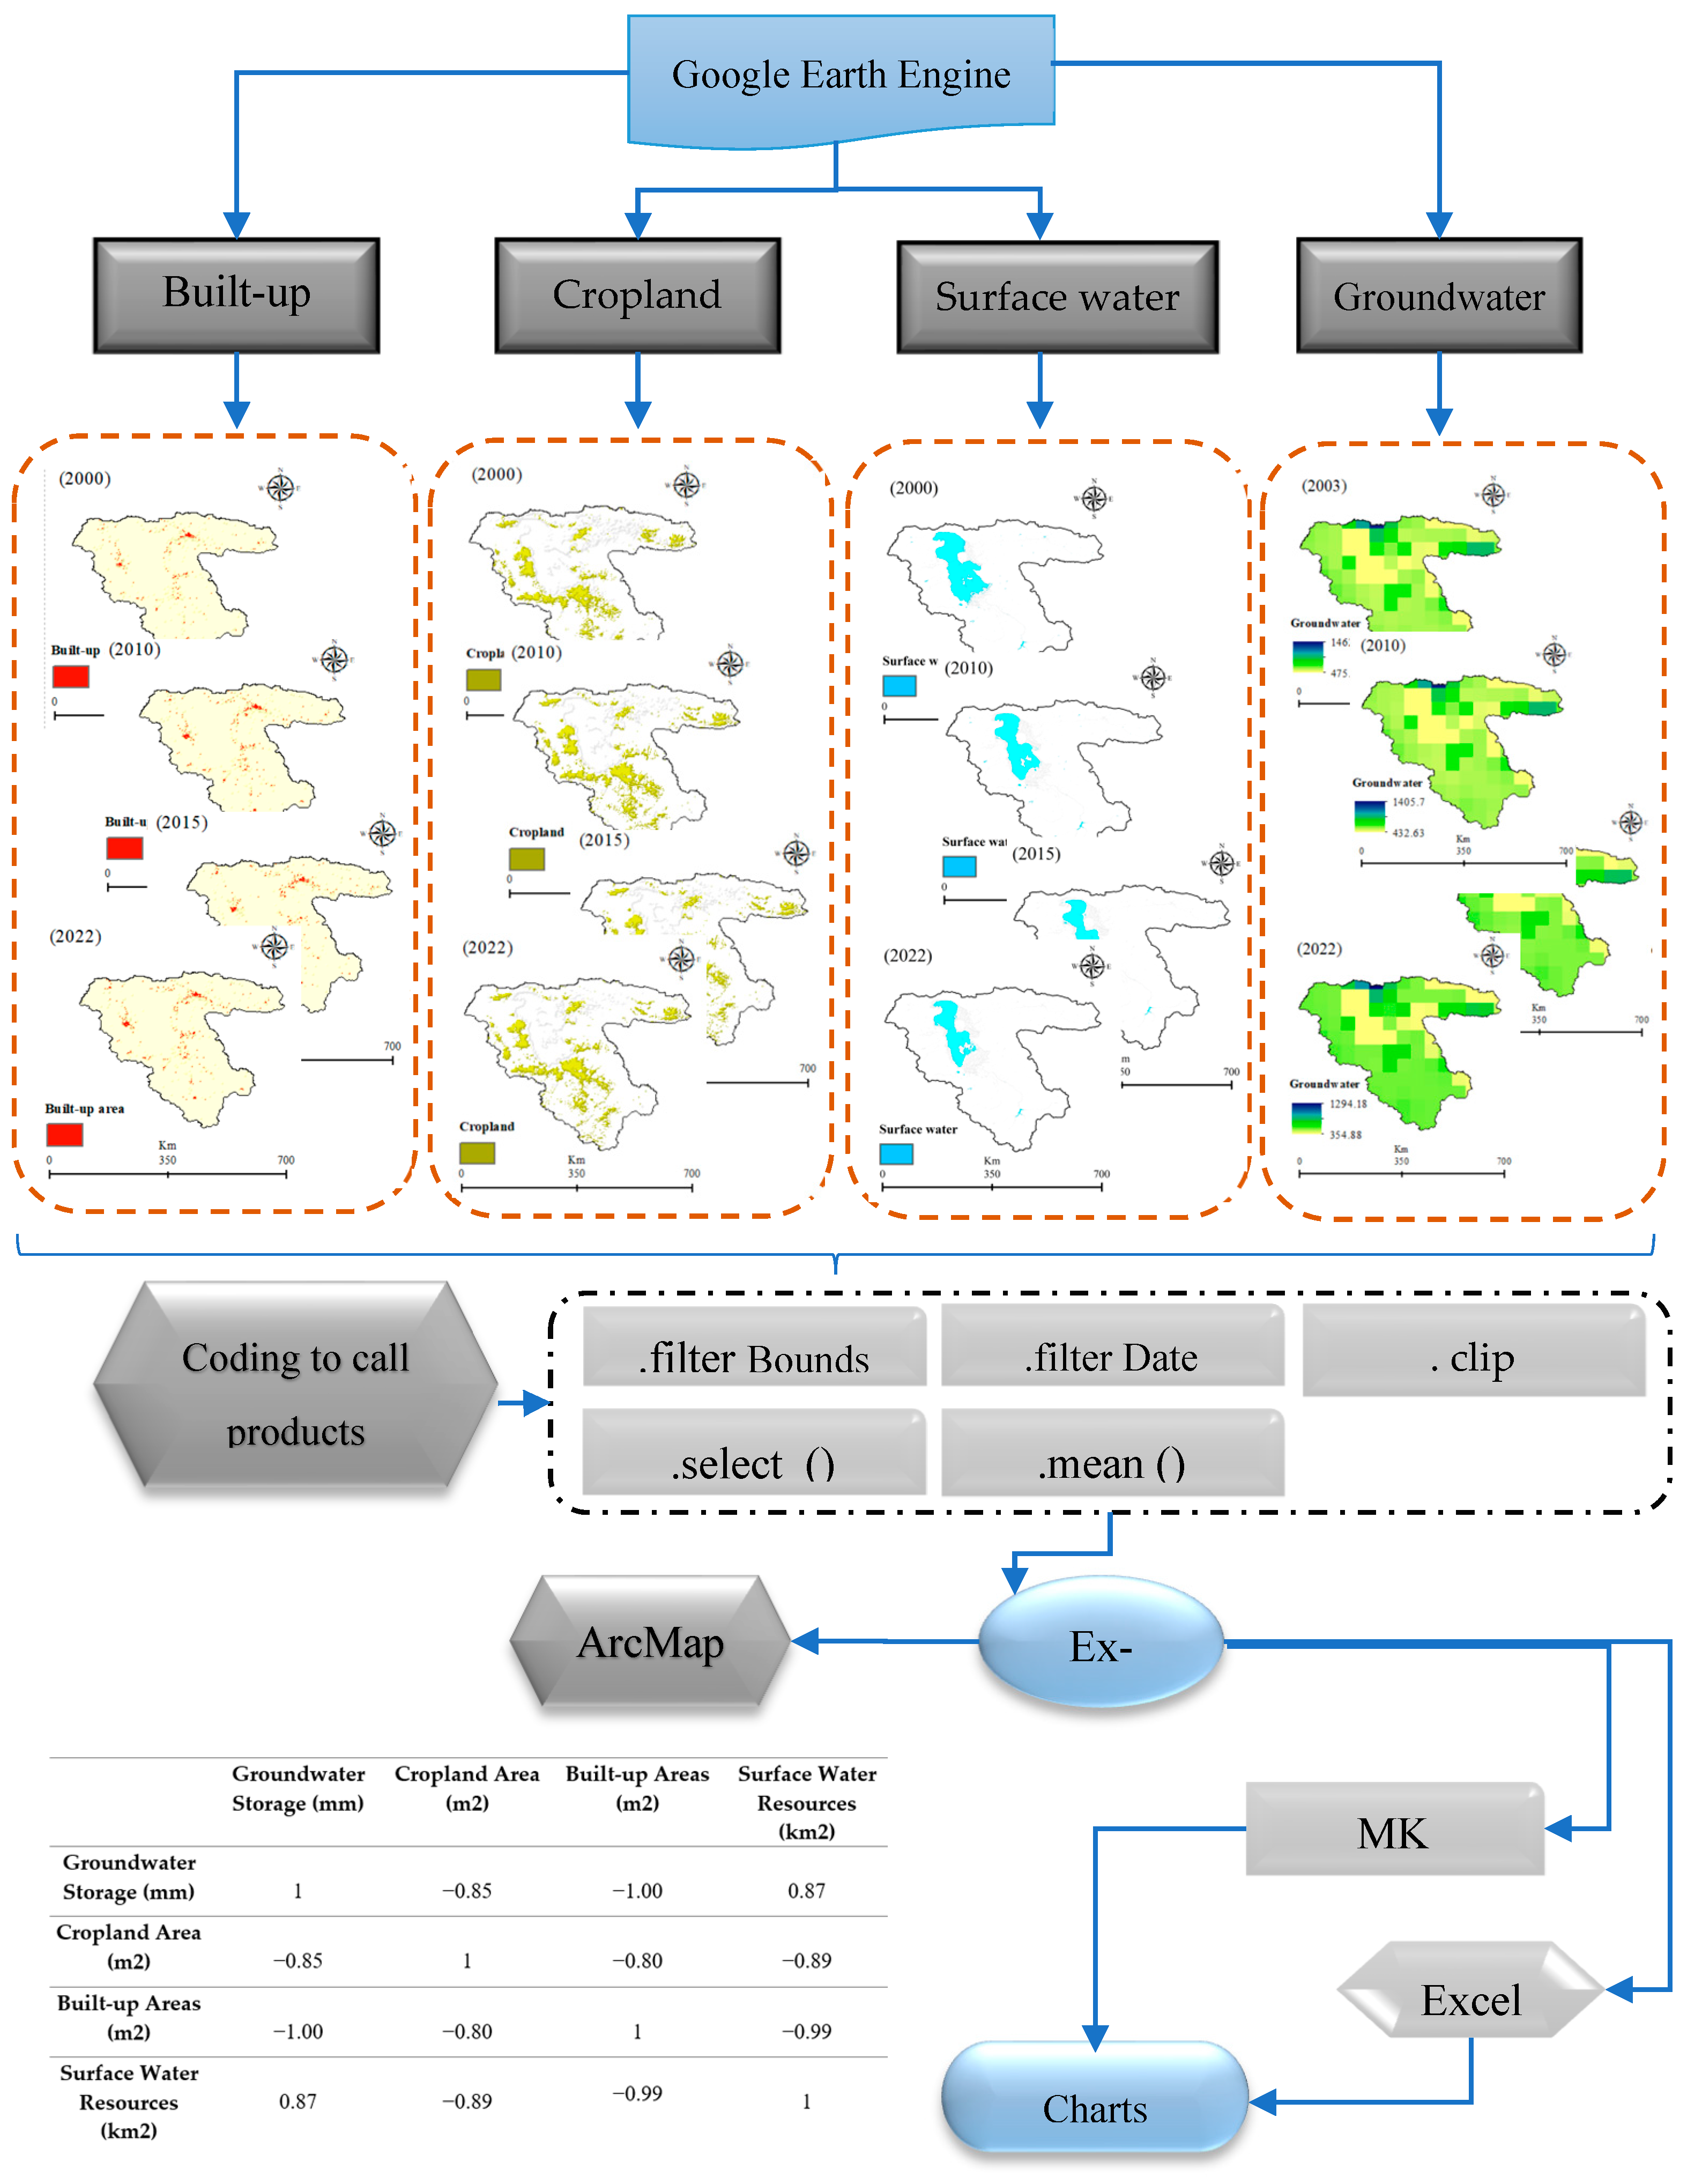
3.2. Methodology
Statistical Analysis
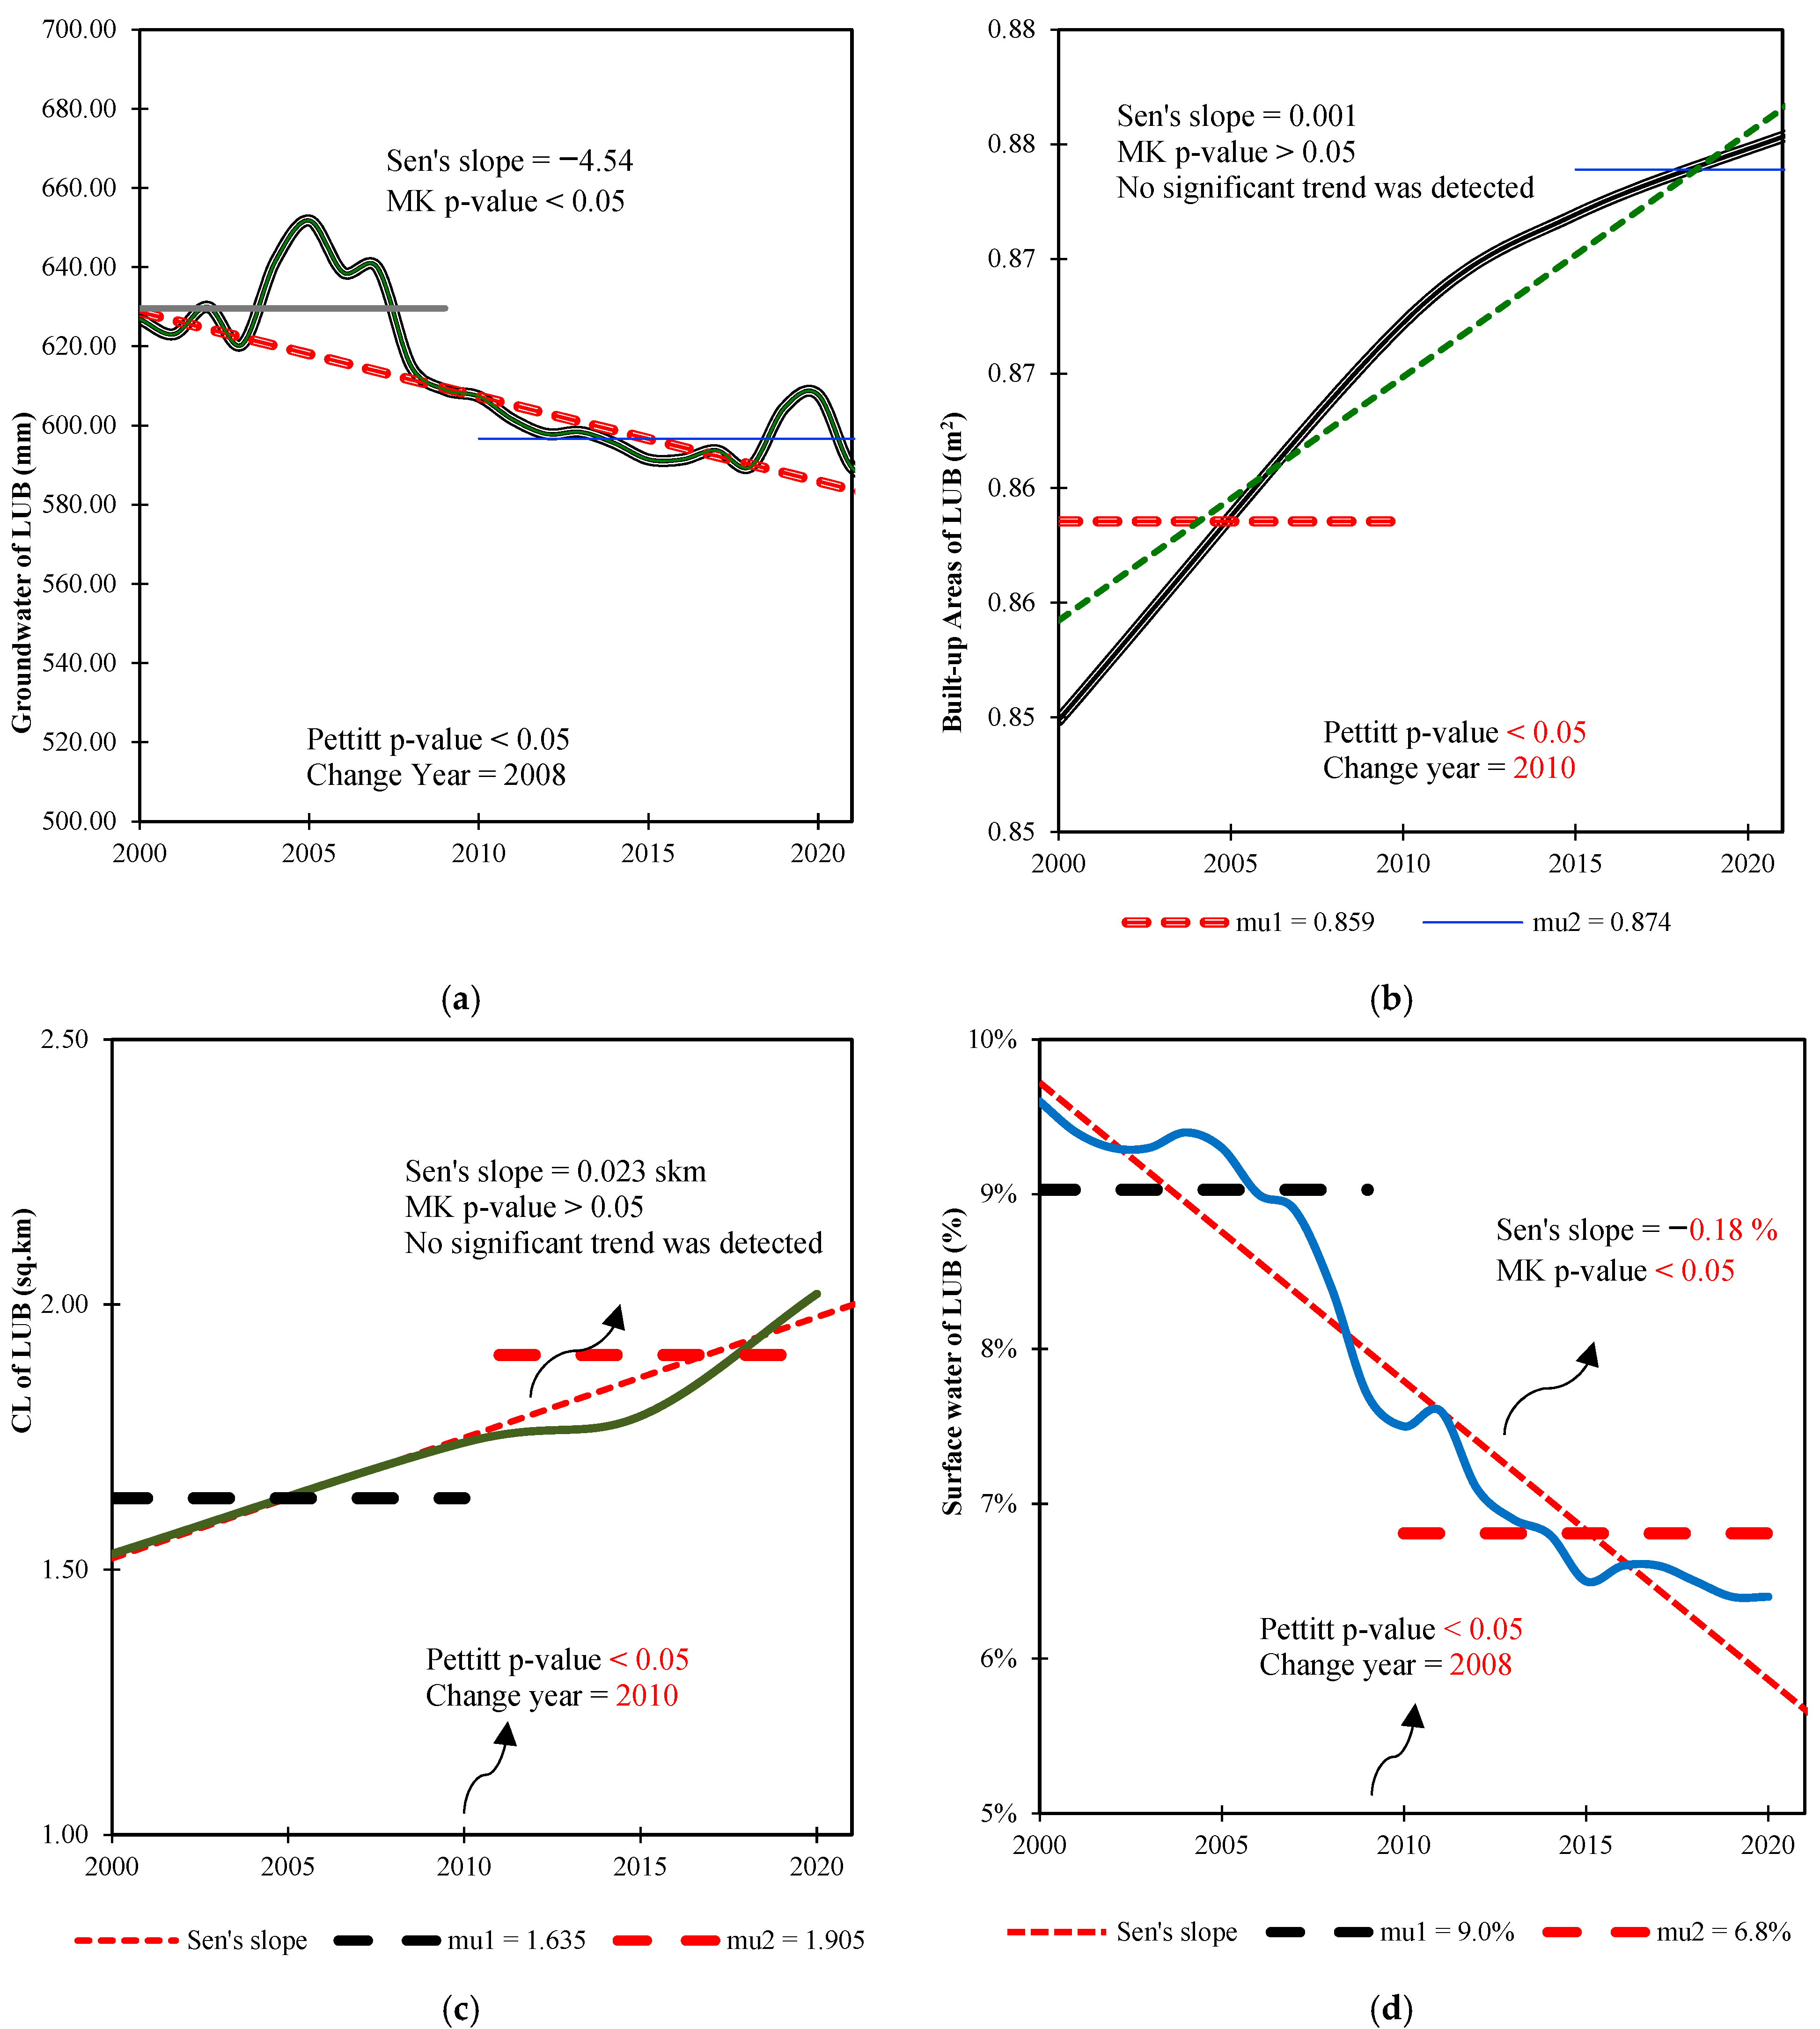
4. Results
5. Discussion
6. Conclusions
Author Contributions
Funding
Data Availability Statement
Conflicts of Interest
Appendix A
References
- Dean, W.E.; Neff, B.P.; Rosenberry, D.O.; Winter, T.C.; Parkhurst, R. The significance of ground water to the accumulation of iron and manganese in the sediments of two hydrologically distinct lakes in north-central Minnesota: A geological perspective. Groundwater 2003, 41, 951–963. [Google Scholar] [CrossRef]
- Johnson, C.D.; Nandi, A.; Joyner, T.A.; Luffman, I. Iron and manganese in groundwater: Using kriging and GIS to locate high concentrations in Buncombe County, North Carolina. Groundwater 2018, 56, 87–95. [Google Scholar] [CrossRef] [PubMed]
- Gleeson, T.; Wada, Y.; Bierkens, M.F.; Van Beek, L.P. Water balance of global aquifers revealed by groundwater footprint. Nature 2012, 488, 197–200. [Google Scholar] [CrossRef] [PubMed]
- Famiglietti, J.S. The global groundwater crisis. Nat. Clim. Change 2014, 4, 945–948. [Google Scholar] [CrossRef]
- Xie, C.; Wu, S.; Zhuang, Q.; Zhang, Z.; Hou, G.; Luo, G.; Hu, Z. Where anthropogenic activity occurs, anthropogenic activity dominates vegetation net primary productivity change. Remote Sens. 2022, 14, 1092. [Google Scholar] [CrossRef]
- Wada, Y.; Van Beek, L.P.; Van Kempen, C.M.; Reckman, J.W.; Vasak, S.; Bierkens, M.F. Global depletion of groundwater resources. Geophys. Res. Lett. 2010, 37, L20402. [Google Scholar] [CrossRef]
- Bierkens, M.F.; Wada, Y. Non-renewable groundwater use and groundwater depletion: A review. Environ. Res. Lett. 2019, 14, 063002. [Google Scholar] [CrossRef]
- de Graaf, I.E.; Gleeson, T.; Van Beek, L.P.H.; Sutanudjaja, E.H.; Bierkens, M.F. Environmental flow limits to global groundwater pumping. Nature 2019, 574, 90–94. [Google Scholar] [CrossRef]
- Frenken, K. Irrigation in the Middle East Region in Figures AQUASTAT Survey-2008; Food And Agriculture Organization of the United Nations (FAO): Rome, Italy, 2009. [Google Scholar]
- Alamrani, N.A.; Almutairi, F.M.; Alatawi, N.M.; Mogharbel, A.T.; Al-Aoh, H.A.; Hajri, A.K.; Elsayed, N.H. Assessment and management of heavy metals pollution in Tabuk region Saudi Arabia, improvement for future development: A review. Wulfenia 2022, 29, 32–51. [Google Scholar]
- Marchal, V.; Dellink, R.; Van Vuuren, D.; Clapp, C.; Chateau, J.; Magné, B.; Van Vliet, J. OECD environmental outlook to 2050. Organ. Econ. Co-Oper. Dev. 2011, 8, 397–413. [Google Scholar]
- Gleeson, T.; Villholth, K.; Taylor, R.; Perrone, D.; Hyndman, D. Groundwater: A call to action. Nature 2019, 576, 213–214. [Google Scholar] [CrossRef] [PubMed]
- Rateb, A.; Scanlon, B.R.; Pool, D.R.; Sun, A.; Zhang, Z.; Chen, J.; Zell, W. Comparison of groundwater storage changes from GRACE satellites with monitoring and modeling of major US aquifers. Water Resour. Res. 2020, 56, e2020WR027556. [Google Scholar] [CrossRef]
- Toth, J. A theoretical analysis of groundwater flow in small drainage basins. J. Geophys. Res. 1963, 68, 4795–4812. [Google Scholar] [CrossRef]
- Scanlon, B.R.; Healy, R.W.; Cook, P.G. Choosing appropriate techniques for quantifying groundwater recharge. Hydrogeol. J. 2002, 10, 18–39. [Google Scholar] [CrossRef]
- Huet, M.; Chesnaux, R.; Boucher, M.A.; Poirier, C. Comparing various approaches for assessing groundwater recharge at a regional scale in the Canadian Shield. Hydrol. Sci. J. 2016, 61, 2267–2283. [Google Scholar] [CrossRef]
- Crosetto, M.; Monserrat, O.; Cuevas, M.; Crippa, B. Spaceborne differential SAR interferometry: Data analysis tools for deformation measurement. Remote Sens. 2011, 3, 305–318. [Google Scholar] [CrossRef]
- Wang, L.; Ma, Y.; Yan, J.; Chang, V.; Zomaya, A.Y. pipsCloud: High performance cloud computing for remote sensing big data management and processing. Future Gener. Comput. Syst. 2018, 78, 353–368. [Google Scholar] [CrossRef]
- Gomes, V.C.F.; Queiroz, G.R.; Ferreira, K.R. An overview of platforms for big earth observation data management and analysis. Remote Sens. 2020, 12, 1253. [Google Scholar] [CrossRef]
- Kazemi Garajeh, M.; Laneve, G.; Rezaei, H.; Sadeghnejad, M.; Mohamadzadeh, N.; Salmani, B. Monitoring trends of CO, NO2, SO2, and O3 pollutants using time-series sentinel-5 images based on google earth engine. Pollutants 2023, 3, 255–279. [Google Scholar] [CrossRef]
- Feizizadeh, B.; Omarzadeh, D.; Kazemi Garajeh, M.; Lakes, T.; Blaschke, T. Machine learning data-driven approaches for land use/cover mapping and trend analysis using Google Earth Engine. J. Environ. Plan. Manag. 2023, 66, 665–697. [Google Scholar] [CrossRef]
- Kazemi Garajeh, M. Monitoring the Spatio-Temporal Distribution of Soil Salinity Using Google Earth Engine for Detecting the Saline Areas Susceptible to Salt Storm Occurrence. Pollutants 2024, 4, 1–15. [Google Scholar] [CrossRef]
- Rodell, M.; Houser, P.R.; Jambor, U.E.A.; Gottschalck, J.; Mitchell, K.; Meng, C.J.; Toll, D. The global land data assimilation system. Bull. Am. Meteorol. Soc. 2004, 85, 381–394. [Google Scholar] [CrossRef]
- Shen, Y.; Zheng, W.; Zhu, H.; Yin, W.; Xu, A.; Pan, F.; Zhao, Y. Inverted algorithm of groundwater storage anomalies by combining the gnss, grace/grace-fo, and gldas: A case study in the north china plain. Remote Sens. 2022, 14, 5683. [Google Scholar] [CrossRef]
- Li, B.; Rodell, M.; Kumar, S.; Beaudoing, H.K.; Getirana, A.; Zaitchik, B.F.; Bettadpur, S. Global GRACE data assimilation for groundwater and drought monitoring: Advances and challenges. Water Resour. Res. 2019, 55, 7564–7586. [Google Scholar] [CrossRef]
- Nie, N.; Zhang, W.; Zhang, Z.; Guo, H.; Ishwaran, N. Reconstructed terrestrial water storage change (ΔTWS) from 1948 to 2012 over the Amazon Basin with the latest GRACE and GLDAS products. Water Resour. Manag. 2016, 30, 279–294. [Google Scholar] [CrossRef]
- Li, W.; Wang, W.; Zhang, C.; Yang, Q.; Feng, W.; Liu, Y. Monitoring groundwater storage variations in the Guanzhong area using GRACE satellite gravity data. Chin. J. Geophys. 2018, 61, 2237–2245. [Google Scholar]
- Kazemi Garajeh, M.; Akbari, R.; Aghaei Chaleshtori, S.; Shenavaei Abbasi, M.; Tramutoli, V.; Lim, S.; Sadeqi, A. A Comprehensive Assessment of Climate Change and Anthropogenic Effects on Surface Water Resources in the Lake Urmia Basin, Iran. Remote Sens. 2024, 16, 1960. [Google Scholar] [CrossRef]
- Amitrano, D.; Martino, G.D.; Iodice, A.; Mitidieri, F.; Papa, M.N.; Riccio, D.; Ruello, G. Sentinel-1 for monitoring reservoirs: A performance analysis. Remote Sens. 2014, 6, 10676–10693. [Google Scholar] [CrossRef]
- Bozzano, F.; Esposito, C.; Franchi, S.; Mazzanti, P.; Perissin, D.; Rocca, A.; Romano, E. Understanding the subsidence process of a quaternary plain by combining geological and hydrogeological modelling with satellite InSAR data: The Acque Albule Plain case study. Remote Sens. Environ. 2015, 168, 219–238. [Google Scholar] [CrossRef]
- Chen, B.; Gong, H.; Chen, Y.; Li, X.; Zhou, C.; Lei, K.; Zhao, X. Land subsidence and its relation with groundwater aquifers in Beijing Plain of China. Sci. Total Environ. 2020, 735, 139111. [Google Scholar] [CrossRef]
- Ezquerro, P.; Tomás, R.; Béjar-Pizarro, M.; Fernández-Merodo, J.A.; Guardiola-Albert, C.; Staller, A.; Herrera, G. Improving multi-technique monitoring using Sentinel-1 and Cosmo-SkyMed data and upgrading groundwater model capabilities. Sci. Total Environ. 2020, 703, 134757. [Google Scholar] [CrossRef] [PubMed]
- Awasthi, S.; Jain, K.; Bhattacharjee, S.; Gupta, V.; Varade, D.; Singh, H.; Budillon, A. Analyzing urbanization induced groundwater stress and land deformation using time-series Sentinel-1 datasets applying PSInSAR approach. Sci. Total Environ. 2022, 844, 157103. [Google Scholar] [CrossRef] [PubMed]
- Orellana, F.; Rivera, D.; Montalva, G.; Arumi, J.L. InSAR-based early warning monitoring framework to assess aquifer deterioration. Remote Sens. 2023, 15, 1786. [Google Scholar] [CrossRef]
- Landerer, F.W.; Swenson, S.C. Accuracy of scaled GRACE terrestrial water storage estimates. Water Resour. Res. 2012, 48, 1–11. [Google Scholar] [CrossRef]
- Liesch, T.; Ohmer, M. Comparison of GRACE data and groundwater levels for the assessment of groundwater depletion in Jordan. Hydrogeol. J. 2016, 24, 1547. [Google Scholar] [CrossRef]
- Sun, J.; Hu, L.; Liu, X.; Sun, K. Enhanced understanding of groundwater storage changes under the influence of river basin governance using GRACE data and downscaling model. Remote Sens. 2022, 14, 4719. [Google Scholar] [CrossRef]
- Zhang, X. Impacts of Water Resources Management on Land Water Storage in the Lower Lancang River Basin: Insights from Multi-Mission Earth Observations. Remote Sens. 2023, 15, 1747. [Google Scholar] [CrossRef]
- Chowdary, V.M.; Ramakrishnan, D.; Srivastava, Y.K.; Chandran, V.; Jeyaram, A. Integrated water resource development plan for sustainable management of Mayurakshi watershed, India using remote sensing and GIS. Water Resour. Manag. 2009, 23, 1581–1602. [Google Scholar] [CrossRef]
- Al-Bahrani, H.S.; Al-Rammahi, A.H.; Al-Mamoori, S.K.; Al-Maliki, L.A.; Nadhir, A.A. Groundwater detection and classification using remote sensing and GIS in Najaf, Iraq. Groundw. Sustain. Dev. 2022, 19, 100838. [Google Scholar] [CrossRef]
- Guerrón-Orejuela, E.J.; Rains, K.C.; Brigino, T.M.; Kleindl, W.J.; Landry, S.M.; Spellman, P.; Rains, M.C. Mapping Groundwater Recharge Potential in High Latitude Landscapes Using Public Data, Remote Sensing, and Analytic Hierarchy Process. Remote Sens. 2023, 15, 2630. [Google Scholar] [CrossRef]
- Khan, M.Y.A.; ElKashouty, M.; Zaidi, F.K.; Egbueri, J.C. Mapping aquifer recharge potential zones (ARPZ) using integrated geospatial and analytic hierarchy process (AHP) in an arid region of Saudi Arabia. Remote Sens. 2023, 15, 2567. [Google Scholar] [CrossRef]
- Ng, G.H.C.; McLaughlin, D.; Entekhabi, D.; Scanlon, B.R. Probabilistic analysis of the effects of climate change on groundwater recharge. Water Resour. Res. 2010, 46, W07502. [Google Scholar] [CrossRef]
- Ansari, S.; Massah Bavani, A.; Roozbahani, A. Effects of climate change on groundwater recharge (Case study: Sefid Dasht plain). Water Soil 2016, 30, 416–431. [Google Scholar]
- Barbieri, M.; Barberio, M.D.; Banzato, F.; Billi, A.; Boschetti, T.; Franchini, S.; Petitta, M. Climate change and its effect on groundwater quality. Environ. Geochem. Health 2023, 45, 1133–1144. [Google Scholar] [CrossRef] [PubMed]
- Ayotte, J.D.; Szabo, Z.; Focazio, M.J.; Eberts, S.M. Effects of human-induced alteration of groundwater flow on concentrations of naturally-occurring trace elements at water-supply wells. Appl. Geochem. 2011, 26, 747–762. [Google Scholar] [CrossRef]
- Khalaj, M.; Kholghi, M.; Saghafian, B.; Bazrafshan, J. Impact of climate variation and human activities on groundwater quality in northwest of Iran. J. Water Supply Res. Technol.—AQUA 2019, 68, 121–135. [Google Scholar] [CrossRef]
- Zhai, Y.; Han, Y.; Xia, X.; Li, X.; Lu, H.; Teng, Y.; Wang, J. Anthropogenic organic pollutants in groundwater increase releases of Fe and Mn from aquifer sediments: Impacts of pollution degree, mineral content, and pH. Water 2021, 13, 1920. [Google Scholar] [CrossRef]
- Alizadeh-Choobari, O.; Ahmadi-Givi, F.; Mirzaei, N.; Owlad, E. Climate change and anthropogenic impacts on the rapid shrinkage of Lake Urmia. Int. J. Climatol. 2016, 36, 4276–4286. [Google Scholar] [CrossRef]
- Hosseini-Moghari, S.M.; Araghinejad, S.; Tourian, M.J.; Ebrahimi, K.; Döll, P. Quantifying the impacts of human water use and climate variations on recent drying of Lake Urmia basin: The value of different sets of spaceborne and in situ data for calibrating a global hydrological model. Hydrol. Earth Syst. Sci. 2020, 24, 1939–1956. [Google Scholar] [CrossRef]
- Shadkam, S.; Ludwig, F.; van Oel, P.; Kirmit, C.; Kabat, P. Impacts of climate change and water resources development on the declining inflow into Iran’s Urmia Lake. J. Great Lakes Res. 2016, 42, 942–952. [Google Scholar] [CrossRef]
- Ahmadzadeh, H.; Morid, S.; Delavar, M.; Srinivasan, R. Using the SWAT model to assess the impacts of changing irrigation from surface to pressurized systems on water productivity and water saving in the Zarrineh Rud catchment. Agric. Water Manag. 2016, 175, 15–28. [Google Scholar] [CrossRef]
- Forootan, E.; Rietbroek, R.; Kusche, J.; Sharifi, M.A.; Awange, J.L.; Schmidt, M.; Famiglietti, J. Separation of large scale water storage patterns over Iran using GRACE, altimetry and hydrological data. Remote Sens. Environ. 2014, 140, 580–595. [Google Scholar] [CrossRef]
- Pesaresi, M.; Politis, P. GHS-BUILT-S R2023A-GHS Built-Up Surface Grid, Derived from Sentinel2 Composite and Landsat, Multitemporal (1975–2030). European Commission, Joint Research Centre (JRC) PID: 2023. Available online: https://data.jrc.ec.europa.eu/dataset/9f06f36f-4b11-47ec-abb0-4f8b7b1d72ea (accessed on 30 October 2024).
- Pekel, J.F.; Cottam, A.; Gorelick, N.; Belward, A.S. High-resolution mapping of global surface water and its long-term changes. Nature 2016, 540, 418–422. [Google Scholar] [CrossRef]
- Hamed, K.H.; Rao, A.R. A modified Mann-Kendall trend test for autocorrelated data. J. Hydrol. 1998, 204, 182–196. [Google Scholar] [CrossRef]
- Zhang, X.; Harvey, K.D.; Hogg, W.D.; Yuzyk, T.R. Trends in Canadian streamflow. Water Resour. Res. 2001, 37, 987–998. [Google Scholar] [CrossRef]
- Burn, D.H.; Elnur, M.A.H. Detection of hydrologic trends and variability. J. Hydrol. 2002, 255, 107–122. [Google Scholar] [CrossRef]
- Fan, C.; Li, Y.; Guang, J.; Li, Z.; Elnashar, A.; Allam, M.; de Leeuw, G. The impact of the control measures during the COVID-19 outbreak on air pollution in China. Remote Sens. 2020, 12, 1613. [Google Scholar] [CrossRef]
- Zemp, M.; Frey, H.; Gärtner-Roer, I.; Nussbaumer, S.U.; Hoelzle, M.; Paul, F.; Vincent, C. Historically unprecedented global glacier decline in the early 21st century. J. Glaciol. 2015, 61, 745–762. [Google Scholar] [CrossRef]
- Es’haghi, S.R.; Karimi, H.; Rezaei, A.; Ataei, P. Content analysis of the problems and challenges of agricultural water use: A case study of Lake Urmia Basin at Miandoab, Iran. Sage Open 2022, 12, 21582440221091247. [Google Scholar] [CrossRef]
- Schmidt, M.; Gonda, R.; Transiskus, S. Environmental degradation at Lake Urmia (Iran): Exploring the causes and their impacts on rural livelihoods. GeoJournal 2021, 86, 2149–2163. [Google Scholar] [CrossRef]
- Bashirian, F.; Rahimi, D.; Movahedi, S.; Zakerinejad, R. Water level instability analysis of Urmia Lake Basin in the northwest of Iran. Arab. J. Geosci. 2020, 13, 1–14. [Google Scholar] [CrossRef]
- Long, D.; Chen, X.; Scanlon, B.R.; Wada, Y.; Hong, Y.; Singh, V.P.; Yang, W. Have GRACE satellites overestimated groundwater depletion in the Northwest India Aquifer? Sci. Rep. 2016, 6, 24398. [Google Scholar] [CrossRef] [PubMed]
- Feizizadeh, B.; Lakes, T.; Omarzadeh, D.; Sharifi, A.; Blaschke, T.; Karimzadeh, S. Scenario-based analysis of the impacts of lake drying on food production in the Lake Urmia Basin of Northern Iran. Sci. Rep. 2022, 12, 6237. [Google Scholar] [CrossRef] [PubMed]
- Kazemi Garajeh, M.; Haji, F.; Tohidfar, M.; Sadeqi, A.; Ahmadi, R.; Kariminejad, N. Spatiotemporal monitoring of climate change impacts on water resources using an integrated approach of remote sensing and Google Earth Engine. Sci. Rep. 2024, 14, 5469. [Google Scholar] [CrossRef]

| Groundwater Storage (mm) | Cropland Area (m2) | Built-up Areas (m2) | Surface Water Resources (km2) | |
|---|---|---|---|---|
| Groundwater Storage (mm) | 1 | −0.85 | −1.00 | 0.87 |
| Cropland Area (m2) | −0.85 | 1 | −0.80 | −0.89 |
| Built-up Areas (m2) | −1.00 | −0.80 | 1 | −0.99 |
| Surface Water Resources (km2) | 0.87 | −0.89 | −0.99 | 1 |
Disclaimer/Publisher’s Note: The statements, opinions and data contained in all publications are solely those of the individual author(s) and contributor(s) and not of MDPI and/or the editor(s). MDPI and/or the editor(s) disclaim responsibility for any injury to people or property resulting from any ideas, methods, instructions or products referred to in the content. |
© 2025 by the authors. Licensee MDPI, Basel, Switzerland. This article is an open access article distributed under the terms and conditions of the Creative Commons Attribution (CC BY) license (https://creativecommons.org/licenses/by/4.0/).
Share and Cite
Chaleshtori, S.A.; Aliabad, O.G.; Fallatah, A.; Faisal, K.; Shirali, M.; Saei, M.; Lacava, T. Monitoring the Impacts of Human Activities on Groundwater Storage Changes Using an Integrated Approach of Remote Sensing and Google Earth Engine. Hydrology 2025, 12, 165. https://doi.org/10.3390/hydrology12070165
Chaleshtori SA, Aliabad OG, Fallatah A, Faisal K, Shirali M, Saei M, Lacava T. Monitoring the Impacts of Human Activities on Groundwater Storage Changes Using an Integrated Approach of Remote Sensing and Google Earth Engine. Hydrology. 2025; 12(7):165. https://doi.org/10.3390/hydrology12070165
Chicago/Turabian StyleChaleshtori, Sepide Aghaei, Omid Ghaffari Aliabad, Ahmad Fallatah, Kamil Faisal, Masoud Shirali, Mousa Saei, and Teodosio Lacava. 2025. "Monitoring the Impacts of Human Activities on Groundwater Storage Changes Using an Integrated Approach of Remote Sensing and Google Earth Engine" Hydrology 12, no. 7: 165. https://doi.org/10.3390/hydrology12070165
APA StyleChaleshtori, S. A., Aliabad, O. G., Fallatah, A., Faisal, K., Shirali, M., Saei, M., & Lacava, T. (2025). Monitoring the Impacts of Human Activities on Groundwater Storage Changes Using an Integrated Approach of Remote Sensing and Google Earth Engine. Hydrology, 12(7), 165. https://doi.org/10.3390/hydrology12070165