Abstract
As academic institutions expand, the proliferation of laboratories dealing with hazardous chemicals has risen. While the physicochemical characterization equipment employed in these academic chemical laboratories is widely recognized, its usage presents a notable risk to researchers at various levels. This paper presents a simplified approach for evaluating the effects of the implementation of prevention investments in regard to working with nanomaterials on a lab scale. The evaluation is based on modeling the benefits (avoided accident costs) and costs (safety training), as opposed to an alternative (not investing in safety training). Each scenario analyzed in the economic evaluation reflects a different level of risk. The novelty of this study lies in its objective to provide an economic assessment of the benefits and returns from safety investments—specifically training—in a chemical laboratory, using a framework that integrates qualitative insights to explore and define the context alongside quantitative data derived from a cost–benefit analysis. The Net Present Value (NPV) was evaluated. The results of the cost–benefit analysis demonstrated that the benefits exceed the cost of the investment. The findings from the sensitivity analysis highlight the significant influence of insurance benefits on safety investments in the specific case study. In this case study, the deterministic analysis yielded a Net Present Value (NPV) of €280,414.67, which aligns closely with the probabilistic results. The probabilistic NPV indicates 90% confidence that the investment will yield a positive NPV ranging from €283,053 to €337,356. The cost–benefit analysis results demonstrate that the benefits outweigh the costs, showing that with an 87% training success rate, this investment would generate benefits of approximately €6328 by preventing accidents in this study. To the best of the researchers’ knowledge, this is the first study to evaluate the influence of safety investment through an economic evaluation of laboratory accidents with small-angle X-ray scattering during the physicochemical characterization process of engineered nanomaterials. The proposed approach and framework are relevant not only to academic settings but also to industry.
1. Introduction
In contrast to industrial production safety, laboratory safety is not accorded the highest priority [1]. However, the American Chemical Society has been very interested in matters related to the safety of laboratories and accident prevention. About 75% of laboratory accidents take place in chemical laboratories, with 28% being attributed to equipment misuse [2]. The laboratory setting is intricate and varied, encompassing numerous factors that pose potential hazards [3]. A variety of hazardous materials (chemical substances, flammables, and explosives) can be found in a laboratory, thus forcing its personnel to address substantial threats while managing and using such materials; the slightest oversight in the process may trigger an accident [1]. Laboratory accidents are a frequent phenomenon: they threaten the health and safety of employees and may severely burden a laboratory’s budget [4]. Common accidents in university laboratories have resulted in the damage of expensive instruments and buildings, as well as the loss of valuable scientific data. When compared to process safety accidents in industry, laboratory accidents generally have less severe consequences [5]. Yet, it is crucial to emphasize that in numerous laboratories, faculty members, researchers, and both undergraduate and graduate students [6,7] are directly exposed to hazards. Insufficient oversight of safety management contributes to significant risks in university laboratories. These settings may potentially lead to more severe accidents than those observed in industrial laboratories. Consequently, there has been a gradual recognition and extensive study of laboratory safety in recent years [5].
There is no established authoritative database specifically designed by relevant parties to systematically record data on laboratory accidents and near-misses [8]. However, some insights into laboratory accidents can be gleaned by utilizing partial statistical or regional data from open reports and related literature. This information is sufficient to attest to and underscore the seriousness of the risks associated with laboratory accidents. In accordance with previous definitions, the safety climate in a laboratory pertains to the collective perceptions held by lab members concerning safety policies, practices, and procedures. Ensuring laboratory safety, especially in a chemical laboratory, encompasses factors such as (1) comprehending the physical and chemical properties of materials; (2) ensuring the accessibility and appropriate utilization of equipment; (3) understanding additional practices to mitigate risks; (4) proficiency in emergency procedures; (5) maintaining a well-designed and organized workspace; and (6) employing personal protective equipment (PPE) [9]. Regarding the Chinese Ministry of Education, between 2015 and 2017, in 75 university facilities, 100% of them had underlying risks in terms of managing chemical safety, while 80% had concealed dangers in their water and electrical systems, along with personal protection issues. The handling of instruments and equipment in 76% of the cases was not standardized, and training on laboratory safety was deficient in 45% of the cases [1].
Nevertheless, the aforementioned accidents have served as a wake-up call for all, underscoring the imperative to enhance accident prevention measures in laboratories. In recent years, there has been a growing focus among laboratory researchers, governmental agencies, industries, and universities on enhancing laboratory safety [9]. The importance of these initiatives is underscored by the fact that laboratory personnel face hazards that may lead to serious injuries and even fatalities [10]. While increasing investment in safety may crowd out time and resources for research, one should consider that laboratory accidents may severely burden a laboratory’s budget [4,11,12]. Managers consistently face challenges in safety-related decisions, such as determining the appropriate allocation of resources to safety programs. Assessing whether the costs align with the benefits poses a constant dilemma. The lack of a strong belief in safety, or holding misconceptions in this domain due to ignorance about the cost–benefit implications of safety programs, can undermine their effective implementation [13]. There is a growing interest in the economic value of occupational safety and health (OSH) interventions, primarily driven by limited resources allocated to OSH interventions and the acknowledgment that proven economic gains are appealing to employers [14]. Recognizing the economic efficiency and safety benefits, there is a shift towards preventing hazards in the first place, as it is more cost-effective and safer than addressing processes after an accident occurs [15]. Gupta et al. [16] highlighted that the costs associated with addressing hazards in the establishment of a new plant could constitute a significant portion, ranging from one-third to one-half or even more, of the capital and operating costs of the new facility.
A substantial body of literature investigates safety investments in both laboratory and industrial settings. It is generally expected that academic laboratories handle smaller quantities of hazardous substances compared to industrial facilities, which often work with larger volumes for scaled-up manufacturing processes [17]. Consequently, laboratory safety tends to receive less priority than industrial safety, largely due to the perception that the smaller amounts of materials pose limited risks to people and the environment [1], and academic labs typically exhibit more relaxed safety management practices [10]. The persistent presence of risk factors in laboratories is primarily attributed to a complex interplay of inadequate safety awareness and a weak safety culture. Unlike in industry, the barrier to cultivating a strong safety culture in academic labs often stems from the principle of academic freedom, which is frequently cited as a challenge to enforcing safety practices [1]. For example, Chao Hu et al. applied the 24Model accident analysis framework alongside Why–Because Analysis to statistically examine the causes behind 64 typical fire and explosion accidents in university laboratories. The 24Model breaks down safety culture into 32 factors, including economic benefits associated with safety. Their analysis revealed common deficiencies such as insufficient safety training and education, poor safety awareness and habits among laboratory personnel, and inadequate equipment conditions in university labs [18]. Furthermore, the Occupational Safety and Health Administration (OSHA) has reported that laboratories in higher-education institutions are 11 times more hazardous than those in industrial facilities [19].
Additional challenges include limited budget allocations for laboratory safety management and the underdevelopment of data management systems, increasing the risk of major lab accidents [20]. Moreover, data obtained from early-stage technologies (lab-scale or pilot-scale) often do not accurately represent industrial-scale processes, limiting their applicability for technology evaluation [21]. Laboratory hazards also have distinct characteristics compared to industrial settings, such as high turnover of personnel, insufficient training of students for laboratory work, research freedom, often developmental-stage equipment, and difficulties in gathering accident statistics [1]. This sensitivity complicates long-term discussions about whether investments in academic lab safety research could impact industrial-scale safety. In this context, Snakard et al. adapted process safety management principles, widely used in the process industry, for academic teaching and research laboratories [22]. There is consensus that this approach likely produces spill-over benefits for industry, as better-trained and more safety-conscious students become better industrial employees, leading to financial savings by reducing accident costs, insurance premiums, and litigation expenses [23].
Although the economic aspects of safety have been explored in various fields, and economic tools have been utilized for safety investment decision-making [24], many fundamental issues in laboratory safety economics remain unexamined. This includes the use of physicochemical characterization equipment, which poses significant risks to researchers at different levels.
Prompt action is needed to demonstrate the returns on safety investments at the lab scale, enabling economic evidence to underpin both scientific and financial goals. Considering these challenges and the many confounding factors, it is crucial to contribute to long-term safety improvements in academic chemical laboratories by enhancing understanding of the economic dimensions of safety culture. Motivated by the inherent value of safety culture, this study explores a broad economic scope of safety investment—specifically training—in a university chemistry laboratory, examining the implementation of prevention investments and their associated costs.
Over the past decades, cost–benefit analyses and their specific application to the field of safety have been extensively examined. The predominant method for the economic evaluation of interventions in Occupational Safety and Health (OSH) studies is cost–benefit analysis (CBA), which is particularly well-suited for this field. A comprehensive economic evaluation—the only kind that yields legitimate insights about efficiency—involves identifying, measuring, and valuating both the costs and consequences. This approach is essential as it facilitates the comparison of effectiveness and benefits across multiple interventions [14]. Chen et al. proposed a methodology aimed at preventing and mitigating intentional domino effects, incorporating economic considerations into safety and security decision-making. The approach is structured into five components: threat analysis, vulnerability assessment of installations against intentional attacks, vulnerability assessment of installations susceptible to domino effects, cost–benefit analysis, and optimization. The analysis uses the Net Present Value of Benefits (NPVB) to assess whether a particular protection strategy, combining safety and security measures, is economically viable [25]. In a separate study, Valeria Villa et al. introduced a new model for conducting cost–benefit and cost-effectiveness analyses specifically for counter-terrorism measures in the process industry. This model begins with assessing the baseline effectiveness of a facility’s physical protection system and allows for comparison between the costs of security upgrades and the potential losses from both anticipated and retrospective accidental events, defined as benefits, while also accounting for improvements in system effectiveness. The model supports more rational and efficient selection and allocation of physical security measures within the process industry [26].
Ongoing research in the chemical industry continues to explore economic evaluation methods for safety-related decision-making [27]. However, despite the fact that occupational accidents represent a negative externality of economic activity, no economic assessment for safety decision-making has yet been conducted at the scale of university laboratories. Our study combines experimental and economic methodologies. We begin with Event Tree Analysis (ETA), a risk assessment tool used to explore possible paths in given scenarios and estimate the probabilistic likelihood of accidents. By identifying the consequences of a system failure (specifically SAXS equipment), ETA facilitates qualitative risk evaluation. Complementing this, cost–benefit analysis (CBA) supports informed decision-making on safety investments. To address uncertainty, we apply sensitivity analysis, scenario analysis, and Monte Carlo simulation. The Monte Carlo method generates a wide range of values for input variables, weighing scenarios by their probability of occurrence. This approach provides managers with interval results represented as probability distributions rather than single-point estimates. A key advantage is the incorporation of expert judgment in selecting appropriate probability distributions and defining limits.
The primary goal of this study is to economically evaluate a safety investment in a chemical laboratory and assess the profitability of investing in safety during a physicochemical characterization process. The objectives are threefold: (i) to evaluate accident scenarios at the lab scale and demonstrate how safety measures and training support decision-making; (ii) to identify the most significant factor influencing the economics of safety in the physicochemical process; and (iii) to develop a strategic management perspective at the laboratory level. The novelty of this work lies in providing an economic evaluation of the benefits and returns of safety investments (training) in a chemical laboratory through a framework that integrates qualitative insights to explore the field with quantitative cost–benefit analysis. Ultimately, incorporating economic considerations into laboratory safety management is expected to catalyze a financially sustainable shift in safety culture. The goal is to encourage a more profound shift in thinking, driven by safety training interventions.
2. Materials and Methods
In the last section, we analyzed how economic issues of risk interconnect with all other parts of the risk management set (including safety training and education), affecting the efficiency of a laboratory’s policies and of a laboratory’s profitability in the long term.
2.1. ISO 45001:2018 (Safety)
The ISO 45001:2018 [28] standard was introduced, outlining the requirements for Occupational Health and Safety (OH&S) management systems. ISO 45001 [28] incorporates provisions for addressing new hazards during processes such as hazard identification and change management. According to ISO 45001, organizations must establish processes for various aspects, including (i) monitoring, measurement, analysis, and performance evaluation; (ii) managing planned changes affecting OH&S performance; and (iii) reporting, investigating, and taking action on incidents and nonconformities [29]. ISO 45001 is designed for application across organizations of any size, type, or nature, fostering a culture of continuous improvement by encouraging regular assessment, measurement, and monitoring of health and safety performance [30]. Within the OH&S domain, ISO 45001 defines OH&S risk as the likelihood of work-related hazardous events or exposures occurring, combined with the severity of injury or illness they can cause. It defines a management system as a set of interrelated or interacting elements within an organization used to establish policies, objectives, and processes to achieve those objectives. The OH&S management system operates on the Plan-Do-Check-Act (PDCA) cycle, ensuring continuous improvement and effectiveness [29].
- Plan: OH&S planning under ISO 45001 includes managing risks and opportunities, setting OH&S objectives, and determining strategies to achieve them. Hephaestus Laboratory identifies and assesses hazards and risks related to OH&S during activities such as the physicochemical characterization of Gold Nanoparticles, using risk assessment techniques outlined in ISO 31010.
- Do: Implementation involves executing planned processes throughout the characterization activities. Researchers are educated on the rationale behind safety protocols, enabling them to identify safety issues and make informed decisions aligned with safety values.
- Check: Monitoring and measuring activities and processes against safety policies and OH&S objectives are critical. Results are documented and reported accordingly.
- Act: Continuous improvement is integral, where actions are taken based on performance evaluations of the OH&S MS to achieve desired outcomes [28].
2.2. ISO IEC 31010:9019 (Risk Assessment)
The ISO/IEC 31010 standard on Risk Management—Risk Assessment Techniques encompasses a diverse array of over 30 instruments, including methods, models, techniques, and tools that support the risk management process. These instruments illustrate various risk assessment approaches, ranging from expert judgment to methods based on constructing patterns and logical event scenarios. The tools and techniques are categorized according to their applicability at different stages of the risk management process, specifically for risk identification, risk analysis, and risk evaluation purposes [31]. ISO 31010 categorizes risk assessment techniques based on their primary application in the risk assessment process.
The following techniques are delineated within it [32]:
- Expert opinion elicitation techniques (e.g., brainstorming, Delphi technique, nominal group technique, interviews, surveys).
- Risk identification techniques, e.g., check lists, failure modes and effects analysis (FMEA)/failure modes and effects and criticality analysis (FMECA), hazard and operability studies (HAZOP), scenario analysis (SWIFT).
- Determination of sources, causes, and drivers of risk (Cindynic Approach, Ishikawa Analysis).
- Control analysis techniques (bow tie analysis, HACCP, and LOPA).
- Consequence and likelihood assessment methods (e.g., Bayesian analysis, Bayesian network and influence diagrams, business impact analysis, cause–consequence analysis, event tree analysis, fault tree analysis, human reliability analysis, Markov analysis, Monte Carlo simulation, and privacy impact analysis).
- Dependency and interaction analysis (causal mapping, cross-impact analysis).
- Risk quantification methods (toxicological risk assessment, value at risk, conditional value at risk).
- Evaluation of risk significance (ALARP/SFAIRP, frequency number diagrams, Pareto chart, reliability-centered maintenance, risk indices).
- Option selection techniques (cost–benefit analysis, decision tree analysis, game theory, multicriteria analysis).
- Reporting and documentation tools (risk registers, consequence/likelihood matrix, S-curves).
Some techniques are dedicated to specific stages of the assessment process, while others integrate multiple stages [33]. The analysis focused on employing methods from various categories of risk assessment techniques outlined in the ISO 31010 standard. Specifically, the following methods were chosen:
- Qualitative approaches utilized tools such as expert interviews to identify and prioritize risks.
- Event tree analysis was employed to outline sequences of accidents stemming from specific initiating events as part of the qualitative assessment.
- Quantitative approaches utilized tools like Monte Carlo analysis, providing a mathematical perspective on risk assessment.
- Cost–benefit analysis was used as a tool to facilitate decision-making between different options.
2.3. Simplified Hypothesis
These selected risk assessment techniques and the criteria characteristics used in the subsequent analysis are detailed below. The suggested approach consists of a series of steps, as depicted in Figure 1. Each step is reviewed in detail in the next section.
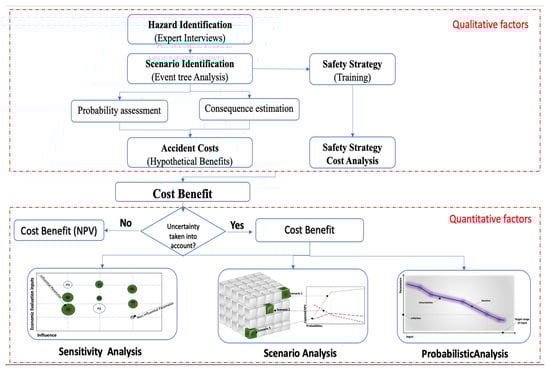
Figure 1.
Flowchart of research approach, as input for quantitative and qualitative assessment.
The qualitative part explores and delineates the field. The quantitative analysis relies on a cost–benefit analysis.
2.4. Physicochemical Characterization Process
The behavior, biodistribution, potential risks, and efficiency of nanoparticles are markedly influenced by their physicochemical attributes. Various techniques are available for the physicochemical characterization of nanomaterials. However, the challenge lies in selecting the most appropriate method that will yield optimal capacity for studying the characteristics of nanomaterials [34]. The size, stability, and other characteristics can be verified through small-angle X-ray scattering (SAXS) [35]. SAXS’s increasing popularity could be attributed to the cooperative improvement in both hardware and software, which allows for automated data gathering and in-depth analysis of the data [36]. One of the most common problems after the destruction of the filament of the source is the increase in its temperature, which eventually leads to the destruction of the source [37]. Proper use of laboratory equipment is critical when working with hazardous materials. Instruments like small-angle X-ray scattering (SAXS) systems, which emit X-rays and are often costly, require extensive training to ensure both safe operation and proper handling. Due to the high operating voltage (50,000 volts), personnel are prohibited from using such machinery unless they have completed mandatory safety training.
SAXS enables detailed analysis of cluster structures and can detect subtle structural changes [38]. In this study, in situ SAXS was used to characterize the size, dispersion, particle count, yield, and morphological evolution during the radiolytic formation of gold nanoparticles (AuNPs). Measurements were performed using a SAXS setup provided by JJ X-ray Systems, equipped with a CuKα X-ray source (λ = 0.15056 nm). The apparatus included a 2D Rigaku SMAX-3000 detector, a vacuum chamber, beam-collimating pinholes, and an X-ray source operating at 50 kV and 40 mA. The distance between the sample and the detector was 0.8 m, and the experimental Q range extended from 0.011 to 0.5 Å−1. Silver behenate (Rose Chemical Ltd., London, United Kingdom) was used for calibrating the detector’s center and Q range. All data were corrected for background radiation and transmission. Information regarding the physicochemical process was sourced from the Hephaestus Laboratory.
2.5. Case Study
In the following test case, the accident of the studied scenario took place during the physicochemical characterization process, while using the SAXS. A clogged filter was identified as the source of the issue, which resulted in both material damage and employee injuries. More specifically, the X-ray source was damaged, causing burns to the hand of the researcher who was operating it. The accident was categorized as low severity [39] due to the minor nature of the injury, which necessitated only a brief absence. Corresponding equipment parts were procured and replaced as needed.
2.6. Risk Identification
2.6.1. Interviews
Qualitative factors were explored through interviews with two elite participants serving as laboratory managers. The term “elite” refers to individuals recognized as professional experts in specific fields [40]. A series of expert interviews was conducted to contextualize the research at the laboratory level, thereby broadening perspectives and deepening the understanding of the subject, as recommended by Jick [41]. The aim was to assemble a research group with comprehensive knowledge within the defined scope. This group, identified beforehand, consisted of two laboratory managers from the technology science sector with technical expertise relevant to the study. During discussions, each expert focused on aspects of the problem within their specialized area. Both experts were male and had attained the rank of professor, and one was of legal retirement age. Their specializations included environmental chemistry (n = 1) and physical chemistry (n = 1).
2.6.2. Event Tree
To investigate the factors that pose risks to laboratory safety and prevent laboratory accidents, event tree analysis (ETA) has been incorporated into laboratory risk assessments [42]. An evaluation of the available safety investment options can be made based on the event tree, which is usually conducted as a bottom-up analysis. This means that the accident or failure is considered the starting point of the series of events that might take place as a result. The illustrated diagram features distinct levels representing safeguards, with the branches of the tree symbolizing the pathways for the outcome of each safety concern [43]. The event tree (Figure 2) is designed with only one starting point but ends up with multiple endpoints. Each branch reflects a distinct consequence.
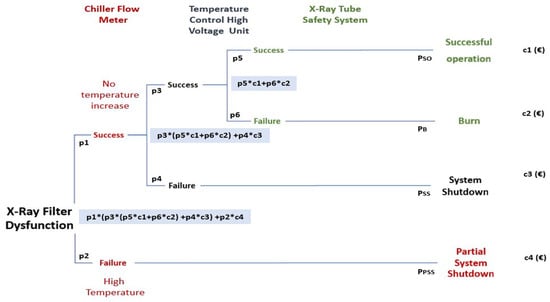
Figure 2.
Event analysis diagram for a potential X-ray filter dysfunction (clogged filter) in a SAXS. The asterisks indicate multiplication of the values.
Successful Operation (SO): has a probability of PSO to cause the cost c1
Partial System Shutdown (PSS): has probability PPSS to cause the cost c2
System Shutdown (SS): has probability PSS to cause the cost c3
Burn (B): has probability PB to cause the cost c4
where
and
PSO + PPSS + PSS + PB = 1
Cevent = PSO × c1 + PPSS c2 + PSS × c3 + PB × c4
2.7. Economic Analysis/Identification of Accident Cost Factors
The initial stage in the scenario development process involves specifying the necessary parameters for scenario implementation. Cost considerations encompass training costs, while potential benefits encompass insurance and training benefits and the prevention of medical expenses, among others. These factors were selected according to previous work on the subject [44], as well as experts’ input.
The choice of interviews as the preferred approach for qualitative data collection aligns with the recommendation by [45]. They involved discussions with accident technicians from the Hephaestus Laboratory. Particularly, three (3) experienced technicians were contacted to arrange the interviews, which lasted about 40 min each. The experts were informed about the expected goals and structure of the interviews. Their personal details were protected as confidential information, and they provided written consent allowing for the contents of these interviews to be used for the purposes of this study. The experts’ expressed opinions were recorded for further analysis, and the answers remained anonymous to promote freedom of expression without fear of consequences for their expressed opinions. The selection of costs and benefits was informed by existing literature on the topic [44], as well as insights from expert interviews. These interviews, drawn from various sources, emphasized consistent qualitative and quantitative factors. Conducted without predefined statements, the interviews allowed experts to share unbiased perspectives, enhancing the objectivity of the developed methodology and supporting broader applicability to other types of hazards. The following parameters were employed:
2.7.1. Initial Costs
Training Costs
The laboratory conducts training sessions for its facility employees regarding the new safety measures. The associated costs, whether incurred by employees, external consultants, or coaches, can be calculated (Table 1) and estimated by multiplying the hourly wage of an employee by the duration of the training, and then by the number of employees participating in the session [46].

Table 1.
Summary of annual safety investment costs.
2.7.2. Hypothetical Benefits/Advantages Resulting from Investments in Safety Expenditures [44]
Human and Environmental
- Recruit: Accidents may result in employee injuries, fatalities, or departures, necessitating the hiring of new staff. Recruitment costs encompass the expenses involved in hiring and training new employees.
- Training.
- Human: In the event of an accident-causing injuries, the company is responsible for compensating the injured parties. This includes both minor and major injuries.
Damage/Damage to Property
- Accidents can result in damage to buildings, infrastructure, products, machinery, etc. These expenses are categorized as “damage costs” and are typically included in any cost–benefit analysis (CBA).
Medical/Medical and Travel Expenses
- This cost category applies to accidents with injuries. Medical expenses often constitute a significant portion of an accident’s total cost and are usually covered by insurance, though the extent of coverage depends on the insurance policy.
Insurance
- Insurance serves to transfer risk and share losses. There are various types of insurance, such as business interruption and property damage insurance, which help a company manage the financial impact of an accident. Companies pay annual premiums to ensure that the insurer will shoulder (part of) the financial burden in the event of an accident. The amount of the premium is influenced by the frequency and severity of accidents, the size of the company (e.g., multinational or national), and the locations of its facilities. Additionally, insurance companies incorporate a profit margin into the premium.
Other Costs/Cleaning
- One often overlooked cost is the expense of cleaning up after an accident. Prior to rebuilding and restoration, the affected area must be thoroughly cleaned, which might require hiring an external cleaning company [46].
Table 2 presents an overview of the benefits and their formulas.
Table 2.
Overview of the benefits and their formulas.
2.8. Quantitative Data Collection
2.8.1. Risk Management Protocol
The implementation of a safety investment analysis involves several stages. Table 3 provides a concise overview of these phases.
Table 3.
Protocol for risk management in assessing the safety investment analysis.
2.8.2. Cost–Benefit Analysis
Economic Analysis
Cost–benefit analysis has been initially selected as the principal method of evaluative reasoning in order to support a broader assessment. Cost–benefit analysis (CBA) is a method of evaluating costs and benefits, facilitating comprehensive comparisons and presenting recommendations, along with the measurements and methods used for their aggregation [47,48]. CBA is primarily employed for comparing investments and assessing the net financial gain in relation to public welfare. The aim is to furnish stakeholders with adequate information to determine if the project is likely to benefit society. It has been applied for making yes/no decisions on project approvals and choosing among alternative courses of action [49]. CBA is classified into three categories: ex-ante, in medias res, and ex-post. Ex-ante, the most commonly employed method, takes place before project initiation while its approval is under consideration. This type heavily relies on forecasts. In medias res occurs during the project’s progress, contributing to the adjustment of the ex-ante analysis to inform potential decisions. Ex-post evaluation occurs at the project’s completion, functioning as a learning tool for managers by assessing the efficiency of cost–benefit analysis (CBA) estimations [50]. The underlying principle guiding economic analysis is that project inputs are evaluated according to their opportunity cost, which may not necessarily align with their financial cost, while outputs are assessed based on consumers’ willingness to pay. Safety investments have varying impacts on different aspects of a laboratory [51]. CBA serves as a tool to evaluate potential investments by comparing the overall benefits and costs associated with each alternative. The results of this assessment can guide managers in determining the financial viability of the available options [52]. Analyzing the costs and benefits associated with workplace safety is crucial to achieving a level of safety where the likelihood of both serious and minor accidents is minimized [53]. The concept of the time value of money plays a crucial role in all investment projects. The primary method extensively used to assess the profitability of an investment in financial and economic analysis is the Net Present Value (NPV). Once the costs and benefits of the investment plan are examined, the evaluation phase follows, utilizing various models categorized into two main groups [54]:
- Models based on Discounted Cash Flow (DCF).
- Non-discounted cash flow models.
NPV signifies the net cash flow after discounting. In essence, NPV is calculated by deducting the discounted expected costs of the investment from the discounted value of the expected benefits [55]. An investment is deemed profitable when the cumulative Net Present Value (NPV) of all associated cash flows is positive, whereas it is typically rejected if the NPV is negative [56].
where:
NPV = Net Present Value.
Bt = benefit after t time periods.
Ct = cost after t time periods.
Rt = net cash flow
i = discount rate.
t = is the number of time periods.
A positive NPV is a requirement, and the option with the highest value will be chosen. A positive value for a particular investment, focusing on operational safety, indicates that the benefits of the project outweigh its costs [56].
Time Preferences
A zero-discount rate implies an equal weighting of present and future considerations. However, the common approach prioritizes present costs and benefits over potential future ones, given the uncertainty associated with the future. Discount rates also play a crucial role in evaluating future cash flows: the higher the discount rate, the lower the present value of those future returns [46]. Weitzman suggests using within-period marginal discount rates for long-term public projects, with approximate rates for the immediate future (between 1 and 5 years) at about 4% per annum, the near future (6–25 years) at about 3%, the medium future (between 26 and 75 years) at about 2%, the distant future (between 76 and 300 years) at about 1%, and the far-distant future (more than 300 years) at about 0% [57]. Laboratories tend to take full advantage of the equipment’s technical lifetime, which for SAXS is considered to be about 20 years. A discount rate of 3% is taken into account for the scenario.
Kaldor Hicks Principle
Hicks played a pivotal role in introducing most of the theories associated with welfare economy and cost–benefit analysis [58,59], as did Kaldor [60] between the 1930s and 1940s. The ‘compensation principle’ introduced the concept of hypothetical compensation as a pragmatic guideline for making decisions [59,60]. A Kaldor–Hicks improvement occurs when the total social benefits of a policy outweigh its associated costs compared to the current status [61].
2.8.3. Economic Evaluation
Assigning a value to operational safety may lack clarity, as it could be contingent on the manager’s risk preferences, which may change over time due to personal experiences and evolving circumstances [46]. Evaluating the desired success probabilities of safety training can be effectively achieved using the rating scale method, rooted in psychometric theory. This approach involves a linear scale marked with specific points representing the best and worst potential safety scenarios, along with intermediate options. On this scale, the lowest safety investment corresponds to a 20% annual probability of a type I accident (labeled as the ‘floor’), while the highest safety investment aligns with just a 1% annual probability of a type I accident (referred to as the ‘ceiling’). Each marker on the scale is assigned a safety value: the ‘floor’ (representing the least preferred level of safety) is valued at 0, whereas the ‘ceiling’ (indicating the highest level of operational safety) is given a value of 1 [46]. The value of the probability that the safety measure will be effective is set at 89%.
SAXS equipment has a service life of 20 years, after which it holds no salvage value. Additional economic evaluation parameters are provided in Table 4.
Table 4.
Economic evaluation parameters for a SAXS model based on safety training.
2.9. Uncertainty Analysis
Similar to any type of statistical analysis, the outcomes of economic evaluation carry a degree of uncertainty. Various types of uncertainty contribute to the final outcome, such as uncertainty related to input data, decisions made, or the chosen model. When addressing uncertainty in input data, a sensitivity analysis may be applicable, while scenario analysis proves useful in dealing with uncertainty stemming from decisions made [62]. Uncertainty can also be expressed as probabilities [63].
Uncertainties are an inherent limitation of all decision support systems, as these systems represent simplified versions of reality [64,65]. To enhance decision-making effectiveness, it is essential to systematically address these uncertainties [66]. How uncertainty is handled by different methods plays a critical role in sensitivity analysis, particularly when key variables change. Common quantitative techniques used to manage uncertainty include sensitivity analysis, scenario analysis, decision tree analysis, and probabilistic simulation. Stress tests typically involve sensitivity and scenario analyses [67]. To improve reliability and realism, stress testing models often combine multiple subtypes. Various researchers have identified factors and patterns that highlight the current limitations hindering the widespread adoption and effectiveness of stress testing models.
2.9.1. Uncertainty Due to Input/Sensitivity Analysis
To conduct this cost–benefit analysis (CBA), an initial step involves performing a one-at-a-time sensitivity analysis to identify the variables that exert a more significant influence on the results. This approach can shed light on the impact of each factor on the final value of a project. The first step is the calculation of the NPV for the base scenario, following up with calculations for any changes to the base settings [68]. Only one variable is updated at a time, noting its effect on the NPV. The suggested rule is to deem the variables for which a change of ±1% leads to a change of more than 1% in the value of the NPV as critical. To achieve this, each variable is individually adjusted by both +10% and −10%, and the resulting NPV is recorded. A tornado diagram, essentially a unique form of bar chart, is used in sensitivity analysis to compare the significance of different variables. This diagram places all uncertainties at their base values on the y-axis, while the x-axis represents the range or impact of each uncertainty on the outcome under scrutiny. Variables are arranged in descending order of their impact on the outcome’s range. The chart’s name derives from the tornado-like appearance created by outlining the bars in the manner described. The most influential variables appear at the bottom of the diagram, indicating their impact on the model. Maximum and minimum values are shown on either side of the bars, or just the base value if no range exists. The bars are organized from the largest on the left to the smallest. To assess the relative impact of different input parameters, a sensitivity analysis was performed. The results were presented using a tornado chart, which illustrates the baseline scenario alongside variations in key parameters. The parameters examined in this study include (i) discount factor (I = 4.0%), (ii) property damage (base case ± 20%), (iii) medical expenses (base case ± 20%), (iv) insurance benefits (base case ± 20%), and (v) human benefits (base case ± 20%).
2.9.2. Uncertainty Due to Choices/Scenario Analysis
Scenario analysis serves to validate and supplement the identified influential parameters. In employing this method, it is vital to create various potential scenarios and assess the likelihood of each available option. These scenarios may range from pessimistic to feasible or even optimistic. However, predicting the behavior of the chosen variables and the likelihood of a scenario unfolding in reality can be challenging when using this approach [69]. In the scenario analysis, three factors were examined, each with three scenarios: base case, worst case, and best case. These factors were initial costs, annual benefits, and the discount factor. For every combination of factor and scenario, the probability of occurrence was estimated. All variables were adjusted by ±20%. Specifically, the discount factor was considered at 4%, 3%, and 2%, initial costs varied by ±20% from the base case, and annual benefits also changed by ±20% from the base case.
2.9.3. Uncertainty Due to Modelling/Probabilistic Analysis
Probabilistic risk analysis evaluates risks and unpredictability in terms of cost, schedule, or scope, taking into account both risks and opportunities that are not easy to accurately determine during the design process. Monte Carlo simulations are thought to be a very direct means of uncertainty analysis [63]. The triangular distribution is considered a suitable choice in cases where there is insufficient literature to establish probabilities and is frequently employed for modeling expert input [63]. The triangular distribution is widely regarded as an appropriate choice when literature data alone are insufficient to determine probabilities and is the most commonly used distribution for modeling expert opinions [63]. This distribution is defined by three parameters: the minimum, the mode, and the maximum values of the uncertain variable. These correspond directly to a three-point estimate, enabling straightforward modeling without the need for transformation or adjustment. Due to its intuitive characteristics and support from both expert input and existing literature, triangular probability distributions were selected to represent uncertainty in this study. @Risk version 8 software has been utilized for the Monte Carlo simulations. The iteration number has been set to 10,000 random scenarios. Generally, the more iterations, the higher the accuracy of the evaluation, although this does require more processing time. When the simulation starts, the software chooses random variables to make the defined calculations. This results in 10,000 random NPVs to be assessed with the corresponding evaluations. In the Monte Carlo simulation, a triangular distribution was employed using the same combined probabilities for each scenario as those applied in the scenario and sensitivity analyses.
3. Results
3.1. Cost–Benefit Analysis
The laboratory has analyzed the costs related to the investment and uncovered the most significant benefits (Table 5) and costs. The initial costs related to the investment consist of the training costs, which amount to €3150.
Table 5.
Hypothetical benefits expected due to the safety training investment.
The formula utilized for NPV calculation assumes the presence of both negative (Ct) and positive cash flows (Bt) for each year t, with a discount factor set at i = 3% (Figure 3). The total NPV is €280,414.67 with an IRR of 605.07%. Since the value of NPV is positive, the investment is considered profitable.
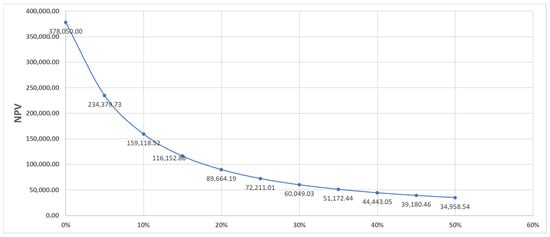
Figure 3.
NPV associated with safety training investment.
Upon analyzing the deterministic model, it becomes evident that all evaluation indicators illustrate a positive impact on the laboratory’s well-being resulting from the implementation of safety training.
3.2. Economic Evaluation
The expected value of the probability that the safety measure will be successful is set to 87%. As a result, the difference in the two scenarios [46] can be calculated as described below:
where
Diff = {(Cwt × Fwt) − (Cw × Fw)} × Prctrl
Cwt = Cw = 19,060.00.
Fwt = 8.
Fw = 4.
Prctrl = 87%.
Thus, the final results are:
Cost of scenario I over 20 years = 4*19,060 = 76,240 €
Cost of Scenario II over 20 years = 8*19,060 = 152,480 €
Difference = ((19,060*8) − (19,060*4)) *0.87 = 66,328 €
The difference is 66,328 €, which is greater than 63,000 €, i.e., the benefits exceed the cost of the investment, which means that when considering an 87% training success rate, this investment will result in benefits equivalent to 6328 Euros due to the avoided accidents.
3.3. Sensitivity Analysis
The impact of the uncertainty of each parameter on the NPV variance is obvious in the tornado diagram in Figure 4. The x-axis shows the discount factor, expressed as a percentage, used in NPV calculations to reflect the cost of capital or required rate of return. A positive percentage implies that increasing the corresponding parameter’s value results in a higher NPV based on the diagram.
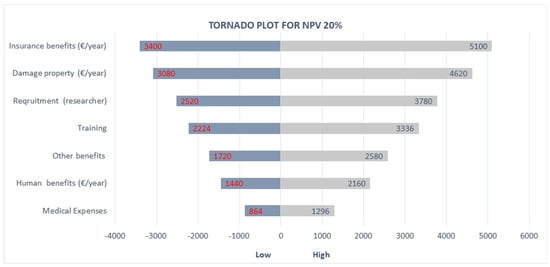
Figure 4.
Tornado Plot.
The one-at-a-time sensitivity analysis indicates that the NPV of the project is sensitive to the insurance benefits and the damage property that follows. Their combined uncertainty explains almost 50% of the NPV total variance. In relation to non-linearity, all variables exhibit slight non-linearities, with the exception of the insurance benefits variable, which demonstrates a significant non-linear pattern. The medical expenses, human, and other benefits have a relatively small impact on the NPV. The two items with great sensitivity to NPV are all related to choices of insurance benefits and recruitment, which will have a large impact on the economics of the physicochemical process.
3.4. Scenario Analysis
The overall risk associated with an investment can be assessed by examining the dispersion of NPV values, focusing on variance and standard deviation, as highlighted in Table 6. The estimation of standard deviation helps gauge the extent to which returns on an investment may deviate from their average, serving as a measure of volatility and risk.
Table 6.
Standard deviation for the scenario.
The anticipated return on the investment is 283,936.11, with a standard deviation of 58,620.53. This results in a 21% confidence interval ranging from 225,315.58 to 342,556.64, indicating a substantial range of potential outcomes. The coefficient of variation stands at 0.21, indicating 0.21 units of risk for each unit of accepted return. Upon identifying the probability distributions for key variables, evaluating the Net Present Value (NPV) of the project becomes feasible.
3.5. Monte Carlo Simulation
The Monte Carlo simulation model provides both a value and a probability range for an investment’s NPV, extending beyond just the expected and average NPV to include an assessment of the investment’s risk. The statistical and graphical outcomes of this are shown in Figure 5. This study’s simulation outcomes revealed two key risk metrics. The first is the likelihood of the NPV being negative (p < 0), indicating the investment’s potential failure to generate profits. A lower probability signifies reduced investment risk. The second risk measure is the standard deviation, reflecting the potential deviation of the NPV from its mean value. A higher standard deviation indicates a riskier option, as it suggests a broader dispersion of potential outcomes.
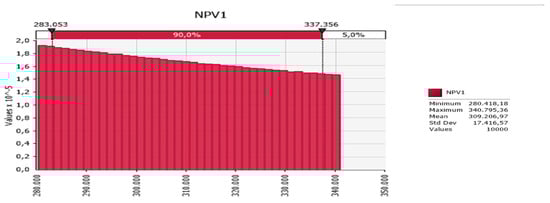
Figure 5.
Monte Carlo simulation for NPV.
Moreover, the examination of the probabilistic model reveals that the NPV does not fall into negative values, ranging between 283,053 and 337,356 with a 90% probability. The minimum observed value was 280,418.18, while the maximum attained was 340,795.36.
Table 7 presents a comparison showing NPV or ROI from various industrial/laboratory safety investments.
Table 7.
Comparison of various industrial/laboratory safety investments.
4. Discussion
4.1. Comparison Between Industrial and Laboratory Safety Investments
There is an ongoing debate about the allocation of safety investments in laboratory and industrial environments. A closer analysis of the similarities in their safety practices reveals a shared foundational commitment to protecting both personnel and the environment, regardless of contextual differences. This shared priority is evident in their mutual focus on regulatory compliance—not merely as a legal requirement but as a reflection of a deeply embedded safety culture. Despite differences in how safety training is delivered or scaled, both sectors emphasize its importance, highlighting a common understanding of the need to equip personnel with the necessary safety competencies. Additionally, both academic and industrial laboratories employ risk assessments, emergency protocols, and personal protective equipment (PPE), demonstrating a proactive and structured approach to safety management. These elements, while differing in application, form the backbone of a safety-oriented culture in both settings [73,74,75]
From an economic standpoint, another key similarity lies in the recognition that preventive safety strategies benefit from economic evaluation. In industrial settings, cost–benefit analyses (CBAs) are particularly valuable due to budget constraints companies frequently face [76]. This concept applies equally to laboratory contexts, where limited protection resources necessitate careful prioritization [77]. The CBA method offers strategic insights and can be effectively applied to safety investment decisions in both industrial and academic laboratories. For example, Eslami Baladeh et al. reported the use of CBA in the chemical industry to support decisions on safety expenditures [78], while Chen et al. employed a cost–benefit management framework to determine optimal protection strategies for intentional domino effects using a “maximin” decision rule [25].
Insurance also plays a central role in industrial safety strategies. Organizations often weigh the cost of safety investments against the benefits of risk coverage provided by insurers. If the cost–benefit ratio is favorable, investing in insurance is considered justified. Proactive safety investments can also lead to reduced insurance premiums, providing an additional economic incentive. A case study by Sandip Roy and Ankit Gupta illustrated how choosing insurance coverage for residual risks, followed by a cost–benefit analysis of potential additional safeguards, helped identify the most beneficial combination of safety measures for an organization [79].
Despite these shared goals and approaches, there are significant differences between laboratory and industrial environments. Academic laboratories, characterized by their exploratory and diverse nature, often require flexible and project-specific safety protocols. In contrast, industrial laboratories operate under more standardized, process-driven safety systems. This structural difference contributes to variations in the overall safety culture, with industrial laboratories typically maintaining a more consistent and integrated approach [80]. Additionally, industrial settings usually offer more extensive and well-structured safety training programs, supported by larger budgets and better infrastructure. Their risk management practices and documentation systems are generally more formalized, emphasizing continuous monitoring and thorough recordkeeping—areas where academic labs may be more variable in implementation [80].
4.2. Implications for Risk Management
The reasons and attributes of accidents in university laboratories bear similarities to those in process safety incidents. Laboratory technicians, faculty, and administrators can learn valuable lessons from the process industries to avert accidents in laboratory settings [5]. The absence of professional knowledge and the lack of professional training were identified as the most significant factors in laboratory explosion accidents through the application of Fault Tree Analysis (FTA). This finding aligns with the results obtained in the current study [42]. In this contribution, we have described a safety investment evaluation conducted during the gold nanoparticle characterization process at a lab setting. The proposed method allows one to conduct a comparative analysis of the costs and resulting benefits in terms of safety and the financial impact on the number of accidents occurring in a laboratory.
Muhammad Shah Ab Rahim et al. argue that semi-quantitative techniques effectively capture both uncertainty and variability in risk factors and the dynamic nature of process systems, providing a more realistic risk assessment compared to purely qualitative or quantitative methods. Managing process safety and security risks holistically requires the development and adoption of unified risk assessment frameworks. These frameworks should support comprehensive and integrated risk management strategies that encompass safety and security considerations. They should facilitate risk assessment, guide decision-making processes, and enhance system resilience. Organizations are encouraged to foster continuous learning and adaptive strategies to address the evolving nature of process safety and security risks. This commitment can be demonstrated through regular safety audits, thorough incident investigations, and periodic updates to risk assessment frameworks to ensure their ongoing relevance and effectiveness [33].
Training is a vital component in both industrial and laboratory environments, although its frequency and scope may differ [80]. The risk profile of an organization may change over time due to evolving hazards, the introduction of new safety measures, and the adoption of updated equipment and techniques. Consequently, the associated costs and benefits of safety interventions may also shift, affecting the balance between safety priorities and economic constraints [24]. Nonetheless, it is widely acknowledged that many laboratories lack precise knowledge of the actual costs of the services they offer. Furthermore, they often delay essential investments in upgrading equipment and analytical tools or replacing staff lost through resignation or retirement. These delays are frequently linked to limited budgets or insufficient government funding [32]. While machinery plays a crucial role in laboratory operations, its value depends on more than market price alone—it is also shaped by economic lifespan, utilization rates, and technological advancement. Many organizations face persistent challenges in managing the full lifecycle of their equipment, which represents a significant financial commitment both in terms of initial investment and ongoing operational and maintenance expenses. Equipment age and performance are major cost drivers [81], and breakdowns can lead to hazardous conditions, interrupt research activities, and cause expensive delays [80].
Integrating risk management and risk-based thinking is pivotal for ensuring safety, integrity, and ethical standards in physicochemical characterization processes. The decision to adopt ISO 45001 carries strategic significance for managers and organizations, necessitating a comparison between investment requirements and potential impacts on laboratory performance. This study’s implications extend into academia, particularly in educating and training researchers. It underscores the significance of OH&S not just for compliance but as a strategic driver for value creation. Educational institutions can play a crucial role in instilling awareness among future leaders about the role of OH&S standards in enhancing laboratory performance, fostering a culture of safety and sustainability. One aspect of managing risks associated with ENMs is effectively communicating both actual and potential risks to workers, employers, and occupational health and safety (OHS) professionals. Previous studies have indicated that safety data sheets (SDSs), commonly used for workplace hazard communication, are inadequate for conveying the specific risks of ENMs and need further enhancement. Another method of risk communication involves using warning signage, labels, or pictograms to clearly indicate the presence of nanomaterials in the workplace. These recommendations have been made by various organizations, universities, and scientific articles [82].
4.3. Regulatory Requirements for Laboratory Personnel
Existing policies and regulations concerning chemical safety are considered adequate for addressing the risks and safety needs associated with nanomaterials (EC, 2012; OECD, 2013). In the European Union, the REACH regulation (Registration, Evaluation, Authorisation, and Restriction of Chemicals; EU 2006) has been in effect since 2007. This framework requires the registration of all chemical substances, whether already on the market or newly developed, that are manufactured or sold within the EU [83], in order to be evaluated. REACH defines chemicals as “a chemical element and its compounds in the natural state or obtained by any manufacturing process, including any additive necessary to preserve its stability and any impurity deriving from the process used, but excluding any solvent which may be separated without affecting the stability of the substance or changing its composition.” (EP and CEU 2006, art. 3).
Due to worker safety being closely tied to the cost of implementing safety measures, conflicts of interest often emerge between maintaining safe practices and allocating funds to project safety [84]. A key factor contributing to the increased difficulty in effectively monitoring hazards is the lack of sufficient human and financial resources. Smaller companies, in particular, tend to prioritize resource allocation for financial survival, which can lead to the neglect of necessary health and safety measures. Moreover, some employers may view occupational safety as the sole responsibility of their employees, reducing their motivation to comply with safety regulations [85]. These challenges significantly hinder the effective implementation of safety frameworks. Evaluating the risk of a chemical substance to cause harm involves compiling accurate, detailed information from hazard pictograms, labels, and material safety data sheets (SDS), based on the globally harmonized system (GHS). Engineered nanomaterials (ENMs) are intentionally produced through chemical or physical processes. Researchers need to have sufficient knowledge and expertise to operate chemical process equipment, adhering to health, safety, and environmental regulations. For ENMs, occupational exposure limits (OELs) and standard equipment for detailed routine exposure measurements do not exist, necessitating alternative approaches to assess the probability of occurrence and exposure [86]. Early-stage researchers are considered to be more exposed to most risk categories. Furthermore, statistical data suggest that experienced, older employees have lower accident rates than their younger counterparts [87]. Occupational accidents might inflict direct and indirect damages to the whole society; however, risk management cost assessment has been found to be the biggest barrier for small businesses [88,89]. The transition from risk into opportunity will only occur if and when both the risks and potential gains can be determined [90].
As research processes and equipment rapidly advance, employing simplified methods with specific corrective actions becomes crucial. Continuous monitoring, adaptation, control, and regular review of implemented measures are highly prioritized [91]. With the increasing pace of research and production, more workers are likely to encounter engineered nanomaterials (ENMs) in their workplaces, particularly during research, production, and maintenance activities. Elina Buitrago et al. emphasize the critical importance of maintenance procedures, noting that they are often overlooked, leading to potential hazards for maintenance personnel. While maintenance procedures are generally standardized across different levels of nanomaterials, it is essential to observe stricter safety protocols, including the use of nano 3 personal protective equipment for nano 2 and nano 3 maintenance tasks. Comprehensive preventive and protective measures are tailored to specific laboratory classes of nanomaterials [92], encompassing technical, organizational, and personal protective elements based on assessed risks. These measures are designed to safeguard workers and the environment from potential hazardous exposures to ENMs [93].
Classification involves determining whether a chemical substance or mixture is hazardous or non-hazardous based on established hazard class criteria. However, the classification systems employed can differ depending on the manufacturer and the country of origin. Efforts to manage risks associated with the use and emissions of dangerous chemicals have led to the creation of an international regulatory framework that incorporates both “hard” and “soft” laws. The term “hard” law refers to international treaties that typically focus on regulating specific substances or groups of substances, as well as activities like the transportation of hazardous waste. In contrast, only a limited number of substances are governed by such treaties compared to the hundreds of thousands of materials currently available on the market. [94]. Hazardous materials are categorized into nine groups: explosives, gases, flammable liquids, flammable solids, oxidizing agents, toxic and infectious substances, radioactive materials, corrosives, and miscellaneous dangerous goods. The dangerous properties of these materials, along with the disruptions and uncertainties they may cause, present considerable challenges to the transportation systems involved and pose serious risks to both human health and environmental stability [95].
Research scientists frequently work with a wide range of hazardous substances or equipment in their experiments, which can put them at risk of injury if appropriate safety protocols are not followed. While academic laboratories typically handle smaller quantities of hazardous materials, industrial laboratories often work with larger volumes during the development of scaled-up production processes. To protect researchers when hazards cannot be eliminated or substituted, research institutions generally implement a four-tiered safety approach:
- Isolation, by restricting access to personnel who are not directly involved with the hazardous material.
- Engineering controls, such as proper ventilation systems, chemical fume hoods, and biosafety cabinets, create a safer work environment when handling hazardous chemicals or biological agents.
- Administrative controls, including safety training, access to information on hazardous substances, and regular laboratory inspections conducted by institutional health and safety personnel.
- Personal protective equipment (PPE), such as lab coats, gloves, and eye protection, serves as the final layer of defense when other control measures are insufficient or bypassed. Depending on the specific hazard, additional PPE may be required.
Wearing the appropriate PPE is often viewed as an indicator of a researcher’s adherence to institutional safety policies [17].
The World Health Organization (WHO) has issued guidelines aimed at safeguarding workers from potential risks posed by ENMs, encompassing hazard assessment, exposure control measures for inhaled ENMs, and recommendations for worker training [96]. However, due to the diverse nature of ENMs, achieving comprehensive guidelines in practice remains challenging. Currently, no Occupational Exposure Limits (OELs) have been established for ENMs. Nevertheless, regulatory agencies are beginning to compile lists of recommended exposure limits for frequently used ENMs, leveraging available hazard and exposure data. These values serve as references for other ENMs with similar properties and modes of action, employing frameworks for grouping and read-across in nanomaterial assessments. In 1996, the American Public Health Association adopted a resolution titled ‘The Precautionary Principle and Chemical Exposure Standards for the Workplace,’ advocating its use in situations where scientific evidence is insufficient to assess the safety of a material, as is often the case with ENMs. Therefore, applying the precautionary approach is strongly recommended in risk assessments concerning ENMs [93].
For a laboratory to align with the updated standards, it is crucial to embrace risk-based thinking and thoroughly examine functions, procedures, and activities related to risks and opportunities. This study adopts and applies the global ISO 31000 risk framework along with ISO 31010 processes. There is a growing preference for methods that integrate rigorous quantitative data analysis with the contextual insights provided by qualitative expert judgment. This approach highlights the complexity of risks in domains like process safety and resilience, emphasizing the need for a balanced approach. Some techniques focus solely on specific stages of risk assessment, while others encompass multiple stages. For instance, early Hazard and Operability Studies (HAZOP) are primarily used during hazard identification to pinpoint potential hazards and their consequences. In contrast, Event Tree Analysis (ETA) and Monte Carlo simulation excel in probability analysis within the quantitative realm [33]. Certain techniques are comprehensive enough to span multiple stages of assessment. Examples include Layer of Protection Analysis (LOPA), Bayesian Networks (BNs), System-Theoretic Accident Model and Processes (STAMP), and Functional Resonance Analysis Method (FRAM). These methods integrate hazard identification, likelihood analysis, consequence assessment, and overall risk evaluation. The selection of appropriate risk assessment techniques depends on factors such as the type of risk, data availability and reliability, process complexity, and specific assessment goals. Methodological choices are tailored to address the unique challenges and objectives of each study or application [33].
Emergency plans must be tailored to each laboratory based on its specific discipline and operational context. These plans should outline detailed procedures and clearly assign responsibilities. To ensure their effectiveness in the event of an incident, emergency drills must be conducted regularly [97]. Adhering to legal and regulatory standards is critical in chemical laboratories. Compliance with relevant laws not only protects laboratory personnel and the environment but also helps minimize legal risks and potential penalties. Failure to comply with applicable regulations can lead to serious consequences, such as financial fines, legal action, and damage to the laboratory’s reputation [80]. A safe laboratory environment relies heavily on the careful development and strict enforcement of comprehensive safety policies by institutional leadership. These policies should align with regulations set by key authorities, such as the Occupational Safety and Health Administration (OSHA) and the Environmental Protection Agency (EPA), and be adapted to the unique needs of each laboratory. This includes implementing a hierarchical management system based on laboratory classification and internal risk levels, with special attention to high-risk operations. The safety framework must also include procedures for investigating incidents, managing accidents, and addressing staff negligence. It is essential for administrators to model safe behavior and promote a culture in which safety is a shared responsibility. Effective policy development and enforcement are crucial for maintaining regulatory compliance, protecting individuals’ health, and upholding the integrity of research activities [97].
4.4. The Role of Insurance Benefit
There are certain limits, thus laboratories need to balance out the preventative actions they can sustain. The outcomes of prevention investment evaluations allow employees to plead their case to management about the financial importance of making prevention investments. In our case, according to the Kaldor–Hicks [60] efficiency criterion, the prevention investment would be regarded positively since it offers a total of monetary benefits (66.328€). When minor accidents occur, it is easier to assess the effect on the insurance premium since there is more information about past accidents and the extent of the premium’s change at that time. When no accidents occur, insurance premiums are still a requirement to cover against potential infrastructure or equipment damage. The occurrence of coinciding minor or major accidents will have a corresponding impact that a laboratory is obligated to pay [46].
When insurance is employed as a risk management tool in safety-related projects, it is often observed that investment in insurance does not reduce the funding allocated to safety measures. This is primarily because insurance cannot lower the actual losses involving human lives or environmental damage, nor can it reduce the likelihood of such events occurring; it merely provides financial compensation for these losses [98]. Laboratory accidents in universities result from multiple factors, but existing literature highlights insurance benefits as one of the most critical elements influencing safety investments and reflecting broader trends in laboratory risk management. For instance, in response to ongoing laboratory accidents, the Korean government enacted the Act on the Establishment of Safe Laboratory Environment (AESLE) in 2005, implementing a nationwide centralized safety management system for laboratories. The AESLE comprises eight chapters and mandates the creation of safety management organizations, along with requirements for safety education, accident compensation, and insurance, among other provisions [99]. In Germany, the Social Accident Insurance (Deutsche Gesetzliche Unfallversicherung) is one of five mandatory insurances within the national Social Security System. Students are covered by this insurance during their activities at higher-education institutions. The system serves as an umbrella organization for 16 regional Accident Insurance Funds. Any study-related accident involving students that requires medical treatment or results in death must be reported to the appropriate local Accident Insurance Fund. For university students at JGU, the Accident Insurance Fund of Rhineland-Palatinate (Unfallkasse Rheinland-Pfalz) holds this responsibility [100].
4.5. Practical Value of the Findings
Leveraging principles from ISO 31010:2019 [101] and tools like Event Tree Analysis enables the Hephaestus Laboratory to proactively identify potential risks to equipment safety, quality, and ethical norms. This approach facilitates preemptive implementation of controls to mitigate risks and capitalize on opportunities aligned with ethical principles.
Conducting a safety CBA can help managers in formulating efficient safety budgets. This approach enables them to identify measures with superior outcomes compared to others and evaluate various preventive investment options by comparing the overall benefits against the total costs in each alternative scenario [102]. Previous studies have demonstrated that investment criteria can be utilized to determine if a system is profitable using the Net Present Value (NPV) during the economic analysis. Okoye et al. (2016) suggested that the economic feasibility analysis should include two steps, comprising the total cost minimization and the calculation of the Net Present Value [103].
Medina-Herrera et al. point out the need to consider safety, prevention, and financial facets when selecting appropriate solvents in the chemical industry while in the design phase [104]. Performing an economic assessment during the research and design phase allows users to inspect the fundamental safety level of a process and contrast it to their financial potential. By selecting the optimal process route between the available alternatives, just taking into account inherent safety is often inadequate. The economic potential of a route is thus often incorporated in the research and design phase as a supplementary consideration in the decision about the ideal route to further develop during the following design phase [15].
Enhanced management protocols are imperative for instruments and equipment characterized by high voltage. The identification of potential hazards becomes challenging during the superficial troubleshooting of hidden dangers in the experimental process, making professional risk assessments arduous. Strengthening the formation of a proficient technical team and a dedicated safety management team is essential. These teams play a pivotal role in crafting professional safety management technical standards and systems. The authors suggest that, when documenting incidents, more comprehensive economic details should be included, and the categories presented in this research can serve as a template.
A key motivation for assessing potential safety investments lies not only in preventing workplace accidents but also in enabling employees to demonstrate the economic value of safety measures to management. In this context, conducting a cost–benefit or cost-effectiveness analysis of safety measures can support managers in allocating safety budgets more effectively, as some interventions may prove more advantageous than others [27]. Safety and prevention budgets should be distributed in a way that ensures cost efficiency. By performing a cost–benefit analysis, organizations can optimize resource allocation by recommending investment only in those measures whose expected benefits outweigh their costs. The “costs” in such analyses include all expenses related to implementing a risk reduction strategy. On the other hand, the “benefits” are typically defined as the avoided costs—calculated as the difference in potential accident-related expenses before and after implementing the preventive measures [27].
4.6. Benefits and Limitations
A clear advantage of our methodology is its ability to provide insights into potential cost savings from a safety investment in a chemical laboratory. Additionally, promoting a culture of safety should be seen not as a cost, but as a strategic investment. It is a forward-looking commitment that not only reduces risks and operational costs but also protects the long-term success and reputation of the university’s laboratories.
This study focused on a single case investigating type I accidents in laboratories, emphasizing their consequences and prevention. However, accidents with rarer and more severe outcomes were not covered. Additionally, the costs observed are specific to the physicochemical characterization process under study, and different processes, such as toxicity testing, would likely involve different cost structures. Variations in recruitment, training, and labor costs across countries also warrant special consideration. The probability of successful safety measure performance was estimated, but the unstructured nature of the interviews introduces limitations due to the subjective opinions of interviewees and their interpretation by the authors. Moreover, the use of both qualitative and quantitative methods in this study affects the generalizability and reliability of the results. Much of the data used in this research was gathered through expert interviews. However, due to the unstructured nature of these interviews, the findings are inherently limited by the subjective views of participants and the authors’ interpretation of their input.
5. Conclusions and Future Prospects
This paper studied the economic evaluation of the safety training during the physicochemical characterization process at a lab scale. The novelty of this study lies in its objective to provide an economic assessment of the benefits and returns from safety investments—specifically training—in a chemical laboratory, using a framework that integrates qualitative insights to explore and define the context alongside quantitative data derived from a cost–benefit analysis. This investigation demonstrated that both research and interviews from diverse sources focus on consistent qualitative and quantitative parameters. This alignment ensures that the identified accident cost parameters maintain the required objectivity and can be broadly applied in the synthesis process. The assessment is formed based on simplified modeling of the costs and potential benefits stemming from the accident prevention due to a safety investment. This marks the first step in the assessment process; thus, there are certain limitations as presented below. The first limitation stems from the type of accident to be investigated, in this case, type I accidents in laboratories. The consequences of such accidents and how they can be avoided are emphasized, even though there are accidents with rarer and more serious outcomes. Managers should commit to offering safety training in order to address risks and improve safety. The modeling of potential outcomes to assess the financial efficiency of a prevention investment decision could convince managers about the potential benefits both in terms of increased safety and cost reduction. The safety climate is acknowledged as a key predictor of both safe behavior and accidents in laboratory environments. Yet, obtaining data on the economic aspects of safety climate within laboratories poses challenges. This paper emphasizes the essential requirement for an incident database, as information sourced from press reports is only accessible on the internet for a limited time. Collecting incident data involves coding and in-depth analysis to mitigate future occurrences. Despite the presence of codes and standards governing academic institutions, recent incidents indicate that training can play a vital role in reducing laboratory accidents.
A recent study determined that the optimal Safety Investment Ratio (SIR) is 3.8%, representing the investment level that minimizes the overall safety-related expenses, including the costs of accidents [105]. From a safety perspective, the cost–benefit analysis estimated the costs and hypothetical benefits related to financial losses from nanomaterial-associated accidents during the physicochemical characterization process. The findings enhance our understanding of the critical role that safety training plays in accident prevention and provide a theoretical foundation to support managers’ decisions to invest in safety. Safety investment is a crucial component of any research environment, especially in university laboratories. Based on our findings, we recommend that laboratory managers emphasize the importance of the returns on safety training, making such training a mandatory, documented prerequisite for working with hazards. Furthermore, students and faculty should be encouraged to report, analyze, and learn from accidents to identify potential hazards. Overall, universities should establish an administrative framework for comprehensive accident reporting and analysis to minimize future incidents.
- By recognizing the wide range of hazards—such as chemical handling and containment, risks of chemical reactions and explosions, exposure to toxic substances, improper use or failure of laboratory equipment, fire hazards, electrical issues, and ergonomic risks—researchers, laboratory managers, and safety officers can foster a strong safety culture and implement customized risk management strategies.
- In the context of risk assessment for hazardous chemical environments, dynamic risk assessment models offer an innovative framework for evaluating process-related risks. Applying such models in academic laboratories can significantly enhance universities’ process safety management. This proactive approach enables the design of context-specific safety measures and strengthens both risk control and overall safety in chemical laboratories.
- Leadership commitment to safety is widely acknowledged as a key factor in achieving high safety performance. However, persistent accident rates suggest that a deeply rooted safety culture is still lacking in many academic institutions. Safety culture is inherently linked to the broader organizational culture of a university, which evolves through interactions among its members. To effectively reduce laboratory accidents, targeted actions must address common weaknesses in safety management and cultural practices.
A dual approach is recommended:
- Top-down: Strengthen institutional safety culture, establish a multi-tiered safety management framework, and adopt comprehensive risk assessment methods for laboratory operations.
- Bottom-up: Guide individual behaviors through behavior control strategies and enhance regulatory alignment by formalizing safety training programs, standardizing lab inspections, and improving oversight of laboratory personnel.
Author Contributions
Conceptualization, D.A.G. and G.Z.K.; methodology, D.A.G., N.V. and G.Z.K.; software, D.A.G.; validation, N.V., A.C.M. and G.Z.K.; writing—original draft preparation, D.A.G. and G.Z.K.; writing—review and editing, D.A.G., N.V., A.C.M. and G.Z.K.; supervision, G.Z.K. All authors have read and agreed to the published version of the manuscript.
Funding
This research received no external funding.
Data Availability Statement
All data analyzed during this study are included in this published article.
Conflicts of Interest
The authors declare no conflicts of interest.
References
- Dooba, I.M.; Downe, A.G.; Jaafar, J. Laboratory Accidents in Academia: An Insident-Report Safety Knowledge Transfer Model. In Proceedings of the 2011 National Postgraduate Conference, Perak, Malaysia, 19–20 September 2011; IEEE: Perak, Malaysia, 2011; pp. 1–6. [Google Scholar]
- Chen, M.; Wu, Y.; Wang, K.; Guo, H.; Ke, W. An Explosion Accident Analysis of the Laboratory in University. Process Saf. Prog. 2020, 39, e12150. [Google Scholar] [CrossRef]
- Pearce, D.; Atkinson, G.; Mourato, S. Cost-Benefit Analysis and the Environment; Organisation for Economic Co-Operation and Development: Paris, France, 2006; p. 318. [Google Scholar]
- Snell, M. Cost-Benefit Analysis for Engineers and Planners; American Society of Civil Engineers: New York, NY, USA; Publications Sales Dept: London, UK, 1997; ISBN 978-0-7277-2587-5. [Google Scholar]
- Finnveden, G.; Moberg, Å. Environmental Systems Analysis Tools–an Overview. J. Clean. Prod. 2005, 13, 1165–1173. [Google Scholar] [CrossRef]
- Ekvall, T.; Assefa, G.; Björklund, A.; Eriksson, O.; Finnveden, G. What Life-Cycle Assessment Does and Does Not Do in Assessments of Waste Management. Waste Manag. 2007, 27, 989–996. [Google Scholar] [CrossRef]
- Ma, L.; Ma, X.; Zhang, J.; Yang, Q.; Wei, K. A Methodology for Dynamic Assessment of Laboratory Safety by SEM-SD. Int. J. Environ. Res. Public Health 2021, 18, 6545. [Google Scholar] [CrossRef]
- Cho, N.J.; Ji, Y.G. Analysis of Safety Management Condition & Accident Type in Domestic and Foreign Laboratory. J. Ergon. Soc. 2016, 35, 97–109. [Google Scholar] [CrossRef]
- Zhong, S.; Du, J.; Jiang, X. Analysis of Energy Laboratory Safety Management in China Based on the System-Theoretic Accident Model and Processes/System Theoretic Process Analysis STAMP/STPA Model. Sustainability 2023, 15, 11505. [Google Scholar] [CrossRef]
- Zarei, E.; Karimi, A.; Habibi, E.; Barkhordari, A.; Reniers, G. Dynamic Occupational Accidents Modeling Using Dynamic Hybrid Bayesian Confirmatory Factor Analysis: An in-Depth Psychometrics Study. Saf. Sci. 2021, 136, 105146. [Google Scholar] [CrossRef]
- Bai, M.; Liu, Y.; Qi, M.; Roy, N.; Shu, C.-M.; Khan, F.; Zhao, D. Current Status, Challenges, and Future Directions of University Laboratory Safety in China. J. Loss Prev. Process Ind. 2022, 74, 104671. [Google Scholar] [CrossRef]
- Young, J.A. How “Safe” Are the Students in My Lab? Do Teachers Really Care. J. Chem. Educ. 1983, 60, 1067. [Google Scholar] [CrossRef]
- Ayi, H.-R.; Hon, C.-Y. Safety Culture and Safety Compliance in Academic Laboratories: A Canadian Perspective. J. Chem. Health Saf. 2018, 25, 6–12. [Google Scholar] [CrossRef]
- Gopalaswami, N.; Han, Z. Analysis of Laboratory Incident Database. J. Loss Prev. Process Ind. 2020, 64, 104027. [Google Scholar] [CrossRef]
- National Research Council. Safe Science: Promoting a Culture of Safety in Academic Chemical Research; National Academies Press: Washington, DC, USA, 2014; p. 18706. ISBN 978-0-309-30091-9. [Google Scholar]
- Yang, F.; Li, X.; Yuan, S.; Reniers, G. Risk Analysis of Laboratory Fire Accidents in Chinese Universities by Combining Association Rule Learning and Fuzzy Bayesian Networks. Fire 2023, 6, 306. [Google Scholar] [CrossRef]
- Shirali, G.A.; Salehi, V.; Savari, R.; Ahmadiangali, K. Investigating the Effectiveness of Safety Costs on Productivity and Quality Enhancement by Means of a Quantitative Approach. Saf. Sci. 2018, 103, 316–322. [Google Scholar] [CrossRef]
- Grimani, A.; Bergström, G.; Casallas, M.I.R.; Aboagye, E.; Jensen, I.; Lohela-Karlsson, M. Economic Evaluation of Occupational Safety and Health Interventions From the Employer Perspective: A Systematic Review. J. Occup. Environ. Med. 2018, 60, 147–166. [Google Scholar] [CrossRef]
- Ahmad, S.I.; Hashim, H.; Hassim, M.H.; Rashid, R. Inherent Safety and Economic Graphical Rating (InSafE) Method for Inherent Safety and Economic Assessment. Process Saf. Environ. Prot. 2021, 149, 602–609. [Google Scholar] [CrossRef]
- Gupta, J.P.; Hendershot, D.C.; Mannan, M.S. The Real Cost of Process Safety—A Clear Case for Inherent Safety. Process Saf. Environ. Prot. 2003, 81, 406–413. [Google Scholar] [CrossRef]
- Schröder, I.; Huang, D.Y.Q.; Ellis, O.; Gibson, J.H.; Wayne, N.L. Laboratory Safety Attitudes and Practices: A Comparison of Academic, Government, and Industry Researchers. J. Chem. Health Saf. 2016, 23, 12–23. [Google Scholar] [CrossRef]
- Xu, C.; Guo, L.; Wang, K.; Yang, T.; Feng, Y.; Wang, H.; Li, D.; Fu, G. Current Challenges of University Laboratory: Characteristics of Human Factors and Safety Management System Deficiencies Based on Accident Statistics. J. Saf. Res. 2023, 86, 318–335. [Google Scholar] [CrossRef]
- Lestari, F.; Bowolaksono, A.; Yuniautami, S.; Wulandari, T.R.; Andani, S. Evaluation of the Implementation of Occupational Health, Safety, and Environment Management Systems in Higher Education Laboratories. J. Chem. Health Saf. 2019, 26, 14–19. [Google Scholar] [CrossRef]
- Yoon, D. Operational Process for R&D Laboratory Safety. Sage Open 2021, 11, 2158244020988853. [Google Scholar] [CrossRef]
- Tsoy, N.; Steubing, B.; van der Giesen, C.; Guinée, J. Upscaling Methods Used in Ex Ante Life Cycle Assessment of Emerging Technologies: A Review. Int. J. Life Cycle Assess. 2020, 25, 1680–1692. [Google Scholar] [CrossRef]
- Olewski, T.; Snakard, M. Challenges in Applying Process Safety Management at University Laboratories. J. Loss Prev. Process Ind. 2017, 49, 209–214. [Google Scholar] [CrossRef]
- Ménard, A.D.; Trant, J.F. A Review and Critique of Academic Lab Safety Research. Nat. Chem. 2020, 12, 17–25. [Google Scholar] [CrossRef]
- Chen, C.; Reniers, G.; Khakzad, N.; Yang, M. Operational Safety Economics: Foundations, Current Approaches and Paths for Future Research. Saf. Sci. 2021, 141, 105326. [Google Scholar] [CrossRef]
- Chen, C.; Reniers, G.; Khakzad, N. Cost-Benefit Management of Intentional Domino Effects in Chemical Industrial Areas. Process Saf. Environ. Prot. 2020, 134, 392–405. [Google Scholar] [CrossRef]
- Villa, V.; Reniers, G.L.L.; Paltrinieri, N.; Cozzani, V. Development of an Economic Model for Counter Terrorism Measures in the Process-Industry. J. Loss Prev. Process Ind. 2017, 49, 437–460. [Google Scholar] [CrossRef]
- Reniers, G.; Brijs, T. An Overview of Cost-Benefit Models/Tools for Investigating Occupational Accidents. Chem. Eng. Trans. 2014, 36, 43–48. [Google Scholar] [CrossRef]
- ISO 45001:2018; Occupational Health and Safety Management Systems—Requirements with Guidance for Use. International Organization for Standardization: Geneva, Switzerland, 2018. Available online: https://www.iso.org/standard/63787.html (accessed on 5 December 2024).
- Brocal, F.; González-Gaya, C.; Sebastián, M.A.; Reniers, G.; Paltrinieri, N. Emerging Risk Management Versus Traditional Risk: Differences and Challenges in the Context of Occupational Health and Safety. In Proceedings of the 29th European Safety and Reliability Conference (ESREL), Hannover, Germany, 22–26 September 2019; Research Publishing Services: Prague, Czech Republic, 2019; pp. 3895–3902. [Google Scholar]
- Nunhes, T.V.; Campos, T.L.R.; Francisco, F.E.; Oliveira, O.J.D. Contributions of Annex SL to Corporate Sustainability. Front. Sustain. 2021, 2, 745350. [Google Scholar] [CrossRef]
- ISO 31010:2019; Risk Management-Risk Assessment Techniques. 2nd ed. International Organization for Standardization: Geneva, Switzerland, 2019.
- Uliasz-Misiak, B.; Lewandowska-Śmierzchalska, J.; Matuła, R. Selection of Underground Hydrogen Storage Risk Assessment Techniques. Energies 2021, 14, 8049. [Google Scholar] [CrossRef]
- Tziakou, E.; Fragkaki, A.G.; Platis, A.Ν. Identifying Risk Management Challenges in Laboratories. Accredit. Qual. Assur. 2023, 28, 167–179. [Google Scholar] [CrossRef]
- Ab Rahim, M.S.; Reniers, G.; Yang, M.; Bajpai, S. Risk Assessment Methods for Process Safety, Process Security and Resilience in the Chemical Process Industry: A Thorough Literature Review. J. Loss Prev. Process Ind. 2024, 88, 105274. [Google Scholar] [CrossRef]
- Kalantar-Zadeh, K. Characterization Techniques for Nanomaterials. In Nanotechnology-Enabled Sensors; Springer: Boston, MA, USA, 2008; pp. 211–281. ISBN 978-0-387-32473-9. [Google Scholar]
- Rasmussen, K.; Rauscher, H.; Mech, A.; Riego Sintes, J.; Gilliland, D.; González, M.; Kearns, P.; Moss, K.; Visser, M.; Groenewold, M.; et al. Physico-Chemical Properties of Manufactured Nanomaterials-Characterisation and Relevant Methods. An Outlook Based on the OECD Testing Programme. Regul. Toxicol. Pharmacol. 2018, 92, 8–28. [Google Scholar] [CrossRef]
- Graewert, M.A.; Svergun, D.I. Impact and Progress in Small and Wide Angle X-Ray Scattering (SAXS and WAXS). Curr. Opin. Struct. Biol. 2013, 23, 748–754. [Google Scholar] [CrossRef]
- Hill, D.R. Principles of Diagnostic X-Ray Apparatus; Macmillan: London, UK, 1975; ISBN 978-1-349-02452-0. [Google Scholar]
- Szekrényes, D.P.; Hamon, C.; Constantin, D.; Deák, A. Formation of Kinetically Trapped Small Clusters of PEGylated Gold Nanoparticles Revealed by the Combination of Small-Angle X-Ray Scattering and Visible Light Spectroscopy. Soft Matter 2022, 18, 8295–8301. [Google Scholar] [CrossRef]
- European Commission. Directorate-General for Employment, Social Affairs and Inclusion Unit B.3 Socio-Economic Costs of Accidents at Work and Work-Related Ill Health Key Messages and Case Studies 2011; European Commission: Brussels, Belgium, 2011. [Google Scholar]
- Morris, Z.S. The Truth about Interviewing Elites. Politics 2009, 29, 209–217. [Google Scholar] [CrossRef]
- Jick, T.D. Mixing Qualitative and Quantitative Methods: Triangulation in Action. Adm. Sci. Q. 1979, 24, 602. [Google Scholar] [CrossRef]
- Zhu, C.; Tang, S.; Li, Z.; Fang, X. Dynamic Study of Critical Factors of Explosion Accident in Laboratory Based on FTA. Saf. Sci. 2020, 130, 104877. [Google Scholar] [CrossRef]
- Stapelberg, R.F. Handbook of Reliability, Availability, Maintainability and Safety in Engineering Design; Springer: London, UK, 2009; ISBN 978-1-84800-174-9. [Google Scholar]
- Reniers, G.; Brijs, T. Major Accident Management in the Process Industry: An Expert Tool Called CESMA for Intelligent Allocation of Prevention Investments. Process Saf. Environ. Prot. 2014, 92, 779–788. [Google Scholar] [CrossRef]
- Creswell, J.W. Qualitative Inquiry and Research Design: Choosing Among Five Approaches, 3rd ed.; SAGE Publications: Los Angeles, CA, USA, 2013; ISBN 978-1-4129-9531-3. [Google Scholar]
- Reniers, G.L.L.; Van Erp, N. Operational Safety Economics: A Practical Approach Focused on the Chemical and Process Industries; Wiley: Chichester, UK, 2016; ISBN 978-1-118-87112-6. [Google Scholar]
- Harberger, A.C.; Jenkins, G.P. (Eds.) Cost-Benefit Analysis; International Library of Critical Writings in Economics: Northampton, MA, USA; Edward Elgar: Cheltenham, UK, 2002; ISBN 978-1-85898-194-9. [Google Scholar]
- Boardman, A.E.; Greenberg, D.H.; Vining, A.R.; Weimer, D.L. Cost-Benefit Analysis: Concepts and Practice, 2nd ed.; Boardman, A.E., Ed.; Prentice Hall: Upper Saddle River, NJ, USA, 2001; ISBN 978-0-13-087178-7. [Google Scholar]
- Siciliano, G.; Barontini, F.; Islam, D.M.Z.; Zunder, T.H.; Mahler, S.; Grossoni, I. Adapted Cost-Benefit Analysis Methodology for Innovative Railway Services. Eur. Transp. Res. Rev. 2016, 8, 23. [Google Scholar] [CrossRef]
- Manning, M. Cost-Benefit Analysis. In Encyclopedia of Criminology and Criminal Justice; Bruinsma, G., Weisburd, D., Eds.; Springer: New York, NY, USA, 2014; pp. 641–651. ISBN 978-1-4614-5689-6. [Google Scholar]
- Reniers, G.L.L.; Audenaert, A. Chemical Plant Innovative Safety Investments Decision-Support Methodology. J. Saf. Res. 2009, 40, 411–419. [Google Scholar] [CrossRef]
- Kumar, L.; Jindal, A.; Velaga, N.R. Financial Risk Assessment and Modelling of PPP Based Indian Highway Infrastructure Projects. Transp. Policy 2018, 62, 2–11. [Google Scholar] [CrossRef]
- Maravas, A.; Pantouvakis, J.-P. A New Approach to Studying Net Present Value and the Internal Rate of Return of Engineering Projects under Uncertainty with Three-Dimensional Graphs. Adv. Civ. Eng. 2018, 2018, 1–9. [Google Scholar] [CrossRef]
- Reniers, G.; Talarico, L. Principles and Limitations of Cost-Benefit Analysis for Safety Investments. In Handbook of Safety Principles; Moller, N., Ove Hansson, S., Holmberg, J.-E., Rollenhagen, C., Eds.; John Wiley & Sons, Inc.: Hoboken, NJ, USA, 2018; pp. 493–513. ISBN 978-1-119-44307-0. [Google Scholar]
- Weitzman, M.L. Gamma Discounting. Am. Econ. Rev. 2001, 91, 260–271. [Google Scholar] [CrossRef]
- Hicks, J.R. The Foundations of Welfare Economics. Econ. J. 1939, 49, 696. [Google Scholar] [CrossRef]
- Hicks, J.R. The Four Consumer’s Surpluses. Rev. Econ. Stud. 1943, 11, 31. [Google Scholar] [CrossRef]
- Kaldor, N. Welfare Propositions of Economics and Interpersonal Comparisons of Utility. Econ. J. 1939, 49, 549. [Google Scholar] [CrossRef]
- Amy, S. Formality and Informality in Cost-Benefit Analysis. Utah Law Rev. 2015, 2015, 3. [Google Scholar] [CrossRef]
- Thomassen, G.; Van Dael, M.; Van Passel, S.; You, F. How to Assess the Potential of Emerging Green Technologies? Towards a Prospective Environmental and Techno-Economic Assessment Framework. Green Chem. 2019, 21, 4868–4886. [Google Scholar] [CrossRef]
- Kuppens, T.; Rafiaani, P.; Vanreppelen, K.; Yperman, J.; Carleer, R.; Schreurs, S.; Thewys, T.; Van Passel, S. Combining Monte Carlo Simulations and Experimental Design for Incorporating Risk and Uncertainty in Investment Decisions for Cleantech: A Fast Pyrolysis Case Study. Clean Technol. Environ. Policy 2018, 20, 1195–1206. [Google Scholar] [CrossRef]
- Lahdelma, R.; Salminen, P.; Hokkanen, J. Using Multicriteria Methods in Environmental Planning and Management. Environ. Manag. 2000, 26, 595–605. [Google Scholar] [CrossRef]
- Huijbregts, M.A.J. Application of Uncertainty and Variability in LCA. Int. J. Life Cycle Assess. 1998, 3, 273–280. [Google Scholar] [CrossRef]
- Vernimmen, P.; Quiry, P.; Dallocchio, M.; Le Fur, Y.; Salvi, A. (Eds.) Corporate Finance: Theory and Practice, 2nd ed.; Wiley: Chichester, UK, 2009; ISBN 978-0-470-72192-6. [Google Scholar]
- Foglia, A. Stress Testing Credit Risk: A Survey of Authorities’ Approaches. SSRN Electron. J. 2008, 37, 1–24. [Google Scholar] [CrossRef]
- Abrahamsen, E.B.; Selvik, J.T.; Milazzo, M.F.; Langdalen, H.; Dahl, R.E.; Bansal, S.; Abrahamsen, H.B. On the Use of the ‘Return Of Safety Investments’ (ROSI) Measure for Decision-Making in the Chemical Processing Industry. Reliab. Eng. Syst. Saf. 2021, 210, 107537. [Google Scholar] [CrossRef]
- Talarico, L.; Reniers, G. Risk-Informed Decision Making of Safety Investments by Using the Disproportion Factor. Process Saf. Environ. Prot. 2016, 100, 117–130. [Google Scholar] [CrossRef]
- Brewster, D.T.; Bycroft, B.L.; Cooney, J.M.; Cordiner, S.B.; Hunt, M.B.; Jensen, D.J.A.; McGhie, T.K.; Sansom, C.E.; Van Klink, J.W.; Rowan, D.D. Safety and Perceptions of Risk in the Handling of Laboratory Chemicals in a Biological Research Community. ACS Chem. Health Saf. 2023, 30, 63–71. [Google Scholar] [CrossRef]
- Yang, J.; Xuan, S.; Hu, Y.; Liu, X.; Bian, M.; Chen, L.; Lv, S.; Wang, P.; Li, R.; Zhang, J.; et al. The Framework of Safety Management on University Laboratory. J. Loss Prev. Process Ind. 2022, 80, 104871. [Google Scholar] [CrossRef]
- Kuzmina, O.; Hartrick, E.; Marchant, A.; Edwards, E.; Brandt, J.R.; Hoyle, S. Chemical Management: Storage and Inventory in Research Laboratories. ACS Chem. Health Saf. 2022, 29, 62–71. [Google Scholar] [CrossRef]
- Chen, C.; Reniers, G. Economic Approaches for Making Prevention and Safety Investment Decisions in the Process Industry. In Methods in Chemical Process Safety; Elsevier: Amsterdam, The Netherlands, 2020; Volume 4, pp. 355–378. ISBN 978-0-12-821824-2. [Google Scholar]
- Poole, R.W., Jr. Toward Risk-Based Aviation Security Policy; OECD/ITF Joint Transport Research Centre Discussion Papers; OECD: Paris, France, 2008; Volume 23. [Google Scholar]
- Eslami Baladeh, A.; Cheraghi, M.; Khakzad, N. A Multi-Objective Model to Optimal Selection of Safety Measures in Oil and Gas Facilities. Process Saf. Environ. Prot. 2019, 125, 71–82. [Google Scholar] [CrossRef]
- Roy, S.; Gupta, A. Safety Investment Optimization in Process Industry: A Risk-Based Approach. J. Loss Prev. Process Ind. 2020, 63, 104022. [Google Scholar] [CrossRef]
- Abedsoltan, H.; Shiflett, M.B. Mitigation of Potential Risks in Chemical Laboratories: A Focused Review. ACS Chem. Health Saf. 2024, 31, 104–120. [Google Scholar] [CrossRef]
- Febrianto, A.; Suef, M.; Hakim, M.S.; Yayat, K.D.; Hardiatama, I. Operational Efficiency and Sustainable Asset Management of Heavy Equipment in Industry: A Data-Driven Framework. Results Eng. 2025, 27, 106476. [Google Scholar] [CrossRef]
- Cadieux, K.E.C.; Zhou, J.H.-W.; Gates, B.D. Signage to Indicate the Presence of Engineered Nanomaterials in the Workplace: Lessons from a Trial Study That Led to Implementation in a Worksite. ACS Chem. Health Saf. 2024, 31, 77–84. [Google Scholar] [CrossRef]
- European Parliament and the Council of the European Union (EP and CEU) 2006. Regulation (EC) No. 1907/2006 of the European Parliament and of the Council of 18 December 2006 Concerning the Registration, Evaluation, Authorization and Restriction of Chemicals (REACH), Establishing a European Chemicals Agency, Amending Directive 999/45/EC and Repealing Council Regulation (EEC) No. 793/93 and Commission. Available online: https://echa.europa.eu/home (accessed on 1 August 2025).
- Khoshnava, S.M.; Rostami, R.; Zin, R.M.; Mishra, A.R.; Rani, P.; Mardani, A.; Alrasheedi, M. Assessing the Impact of Construction Industry Stakeholders on Workers’ Unsafe Behaviours Using Extended Decision Making Approach. Autom. Constr. 2020, 118, 103162. [Google Scholar] [CrossRef]
- Ramkalawon Veerapen Chetty, D.; Boojhawon, R.; Bhagwant, S.; Levy, L. Factors Affecting the Occupational Safety and Health of Small and Medium Enterprises in the Construction Sector of Mauritius. Soc. Sci. Humanit. Open 2024, 10, 100964. [Google Scholar] [CrossRef]
- Bocca, B.; Battistini, B.; Leso, V.; Fontana, L.; Caimi, S.; Fedele, M.; Iavicoli, I. Occupational Exposure to Metal Engineered Nanoparticles: A Human Biomonitoring Pilot Study Involving Italian Nanomaterial Workers. Toxics 2023, 11, 120. [Google Scholar] [CrossRef]
- Varianou-Mikellidou, C.; Boustras, G.; Dimopoulos, C.; Wybo, J.-L.; Guldenmund, F.W.; Nicolaidou, O.; Anyfantis, I. Occupational Health and Safety Management in the Context of an Ageing Workforce. Saf. Sci. 2019, 116, 231–244. [Google Scholar] [CrossRef]
- Takala, J.; Hämäläinen, P.; Saarela, K.L.; Yun, L.Y.; Manickam, K.; Jin, T.W.; Heng, P.; Tjong, C.; Kheng, L.G.; Lim, S.; et al. Global Estimates of the Burden of Injury and Illness at Work in 2012. J. Occup. Environ. Hyg. 2014, 11, 326–337. [Google Scholar] [CrossRef]
- Oksel, C.; Hunt, N.; Wilkins, T.; Wang, X.Z. Risk Management of Nanomaterials Guidelines for the Safe Manufacture and Use of Nanomaterials/Sustainable Nanotechnologies Project; European Commission: Brussels, Belgium, 2017; p. 44. [Google Scholar]
- Gkika, D.A.; Vordos, N.; Magafas, L.; Mitropoulos, A.C.; Kyzas, G.Z. Risk Return Profile of Nanomaterials. J. Mol. Struct. 2021, 1228, 129740. [Google Scholar] [CrossRef]
- Groso, A.; Petri-Fink, A.; Rothen-Rutishauser, B.; Hofmann, H.; Meyer, T. Engineered Nanomaterials: Toward Effective Safety Management in Research Laboratories. J. Nanobiotechnology 2016, 14, 21. [Google Scholar] [CrossRef] [PubMed]
- Gkika, D.A.; Magafas, L.; Cool, P.; Braet, J. Balancing Nanotoxicity and Returns in Health Applications: The Prisoner’s Dilemma. Toxicology 2018, 393, 83–89. [Google Scholar] [CrossRef]
- Buitrago, E.; Novello, A.M.; Fink, A.; Riediker, M.; Rothen-Rutishauser, B.; Meyer, T. NanoSafe III: A User Friendly Safety Management System for Nanomaterials in Laboratories and Small Facilities. Nanomaterials 2021, 11, 2768. [Google Scholar] [CrossRef]
- Persson, L.; Karlsson-Vinkhuyzen, S.; Lai, A.; Persson, Å.; Fick, S. The Globally Harmonized System of Classification and Labelling of Chemicals—Explaining the Legal Implementation Gap. Sustainability 2017, 9, 2176. [Google Scholar] [CrossRef]
- Zahiri, B.; Suresh, N.C.; De Jong, J. Resilient Hazardous-Materials Network Design under Uncertainty and Perishability. Comput. Ind. Eng. 2020, 143, 106401. [Google Scholar] [CrossRef]
- WHO Guidelines on Protecting Workers from Potential Risks of Manufactured Nanomaterials. Available online: https://www.who.int/publications/i/item/9789241550048 (accessed on 4 December 2024).
- Wang, W.; Su, Y.; Cao, H.; Li, D. Enhancing Chemical Laboratory Safety with Hazards Risks Mitigation and Strategic Actions. Laboratories 2025, 2, 5. [Google Scholar] [CrossRef]
- Abrahamsen, E.B.; Asche, F. The Insurance Market’s Influence on Investments in Safety Measures. Saf. Sci. 2010, 48, 1279–1285. [Google Scholar] [CrossRef]
- Kim, J.G.; Jo, H.J.; Roh, Y.H. Analysis of Accidents in Chemistry/Chemical Engineering Laboratories in Korea. Process Saf. Prog. 2024, 43, 160–169. [Google Scholar] [CrossRef]
- Dietz, P.; Reichel, J.L.; Werner, A.M.; Letzel, S. Study-Related Work and Commuting Accidents among Students at the University of Mainz from 12/2012 to 12/2018: Identification of Potential Risk Groups and Implications for Prevention. Int. J. Environ. Res. Public Health 2020, 17, 3676. [Google Scholar] [CrossRef]
- IEC 31010:2019; Risk Management—Risk Assessment Techniques. ISO: Geneva, Switzerland, 2019. Available online: https://www.iso.org/standard/72140.html (accessed on 31 May 2024).
- Gavious, A.; Mizrahi, S.; Shani, Y.; Minchuk, Y. The Costs of Industrial Accidents for the Organization: Developing Methods and Tools for Evaluation and Cost–Benefit Analysis of Investment in Safety. J. Loss Prev. Process Ind. 2009, 22, 434–438. [Google Scholar] [CrossRef]
- Okoye, C.O.; Solyalı, O.; Taylan, O. A New Economic Feasibility Approach for Solar Chimney Power Plant Design. Energy Convers. Manag. 2016, 126, 1013–1027. [Google Scholar] [CrossRef]
- Medina-Herrera, N.; Jiménez-Gutiérrez, A.; Mannan, M.S. Development of Inherently Safer Distillation Systems. J. Loss Prev. Process Ind. 2014, 29, 225–239. [Google Scholar] [CrossRef]
- Bachar, R.; Urlainis, A.; Wang, K.-C.; Shohet, I.M. Optimal Allocation of Safety Resources in Small and Medium Construction Enterprises. Saf. Sci. 2025, 181, 106680. [Google Scholar] [CrossRef]
Disclaimer/Publisher’s Note: The statements, opinions and data contained in all publications are solely those of the individual author(s) and contributor(s) and not of MDPI and/or the editor(s). MDPI and/or the editor(s) disclaim responsibility for any injury to people or property resulting from any ideas, methods, instructions or products referred to in the content. |
© 2025 by the authors. Licensee MDPI, Basel, Switzerland. This article is an open access article distributed under the terms and conditions of the Creative Commons Attribution (CC BY) license (https://creativecommons.org/licenses/by/4.0/).