Article

Uncertainty and Global Sensitivity Analysis of a Membrane Biogas Upgrading Process Using the COCO Simulator

by
José M. Gozálvez-Zafrilla
* and
Asunción Santafé-Moros
Institute for Industrial Radiophysical and Environmental Safety (ISIRYM), Universitat Politècnica de Valencia, 46022 Valencia, Spain
*
Author to whom correspondence should be addressed.
ChemEngineering 2025, 9(5), 94; https://doi.org/10.3390/chemengineering9050094
Submission received: 22 July 2025 / Revised: 20 August 2025 / Accepted: 25 August 2025 / Published: 1 September 2025

Abstract

Process designs based on deterministic simulations without considering parameter uncertainty or variability have a high probability of failing to meet specifications. In this work, uncertainty and global sensitivity analyses were applied to a biogas upgrading membrane process implemented in the COCO simulator (CAPE-OPEN to CAPE-OPEN), considering both controlled and non-controlled scenarios. A user-defined model code was developed to simulate gas separation membrane stages, and a preliminary study of membrane parameter uncertainty was performed. In addition, a unit generating combinations of uncertainty factors was developed to interact with the simulator’s parametric tool. Global sensitivity analyses were carried out using the Morris method and Sobol’ indices obtained by Polynomial Chaos Expansion, allowing for the ranking and quantification of the influence of feed variability and membrane parameter uncertainty on product streams and process utilities. Results showed that when feed variability was ±10%, its effect exceeded the uncertainty of the membrane parameters. Uncertainty analysis using the Monte Carlo propagation method provided lower and upper tolerance limits for the main responses. Relative gaps between tolerance limits and mean product flows were 8–9% at a feed variability of 5% and 14–18% at a feed variability of 10%, while relative tolerance gaps resulting from composition were smaller (0.4–1.2%).

Graphical Abstract

1. Introduction

1.1. Uncertainty and Global Sensitivity Analysis

In chemical engineering, modeling and simulation allow for studying process performance. Process simulators are helpful for process design because they can rapidly assess different process configurations and operating parameters.
It should be noted that process simulators provide a deterministic solution. However, in real processes, some parameters of the process units are not known with precision. Similarly, the feed characteristics and the influencing environment are subjected to variations. The uncertainty of these factors, in turn, introduces uncertainty in the process response, leading to a mismatch with the simulator results. Because numerical predictions are often the basis for engineering decisions, uncertainty quantification is a subject of concern [1]. Uncertainty analysis allows for quantifying the impact of the variability of factors on process outcomes, enabling the determination of potential limits for the process response. This allows for the robustness and confidence of the simulation results to be assessed. Many process simulators allow for parametric sensitivity studies where one or several parameters can be modified to study their effect on critical process outcomes. However, an additional step can be taken by applying global sensitivity analysis to identify how the uncertainty in the output of a model can be apportioned to different sources of uncertainty in the model input [2]. Thus, this technique can determine which of the uncertain input factors are more critical in determining the uncertainty in the outputs of interest.
Previous studies have used uncertainty and sensitivity analysis in chemical process engineering in different ways. Some examples are the integration of process reliability into early process design [3], the identification of key parameters and variables relevant to the model uncertainty [4], robust optimization [5], and modeling choice [6].

1.2. CAPE-OPEN Process Simulators

Process simulators combine physical properties databases, thermodynamic models, unit operation models, and numerical solvers with the capability of developing flowsheets in which model units are connected to form a process. Computer-Aided Process Engineering (CAPE) applies computer-based tools to support process engineering. As the best modeling options may come from different sources, many researchers point out the advantages of using CAPE-OPEN standards for their integration. These standards facilitate the implementation of new unit operations in different coding software. This can be crucial for specific unit operations such as membrane stages. The simulator chosen for this study, the COCO simulator, offers excellent flexibility for this purpose. This simulator presents the advantages of being a free-of-charge CAPE-OPEN compliant steady-state simulation environment that demonstrates strong reliability in performing material and energy balances, with results closely aligned with those obtained from commercial process simulators [7]. The software allows interaction with user unit operations through add-ons created by the COCO developer [8]. These units can be implemented in Excel, MATLAB, or free numerical software like Scilab and Python.
Recent examples of the use of the COCO simulator to develop and analyze chemical processes include techno-economic analysis of fuel processes [9], optimization-based process synthesis [10], membrane separations [11], biorefinery processes [12], and biomass pyrolysis [13].

1.3. Scope of This Work

This work aims to demonstrate the applicability of global uncertainty and sensitivity analysis using the COCO simulator. For this purpose, a biogas upgrading process was chosen. The increasing interest in biomethane as a substitute for natural gas has led to the development of biogas upgrading techniques. Among these technologies, gas permeation based on membranes stands out. In recent years, the development efforts regarding these processes have focused on the design and analysis of stage configurations with the aim of energetic and economic optimization [14,15,16,17]. Some studies highlight the impact of sensitivity analysis on biogas upgrading [18] and the usefulness of uncertainty quantification for enhancing the reliability of such processes [19]. Other studies address local sensitivity through parameter variation [20,21,22], where the procedures applied were mainly aimed at optimization. In contrast, in our work, global sensitivity analysis was applied to evaluate the uncertainty and sensitivity of the responses of a previously optimized system.
This work is structured using the following steps: (i) Presenting a case definition based on an optimized CO2/CH4 separation process from the existing literature. (ii) Developing the deterministic model of the process in the COCO simulator, adding a user unit to model gas membrane stages. (iii) Identifying and characterizing the uncertainty factors through a bibliographic study. (iv) Preparing the process model to accept uncertainty inputs and generating model results for specified input combinations. (v) Analyzing the subsequent uncertainty and global sensitivity, as well as their posterior interpretation.

2. Materials and Methods

2.1. Case Study

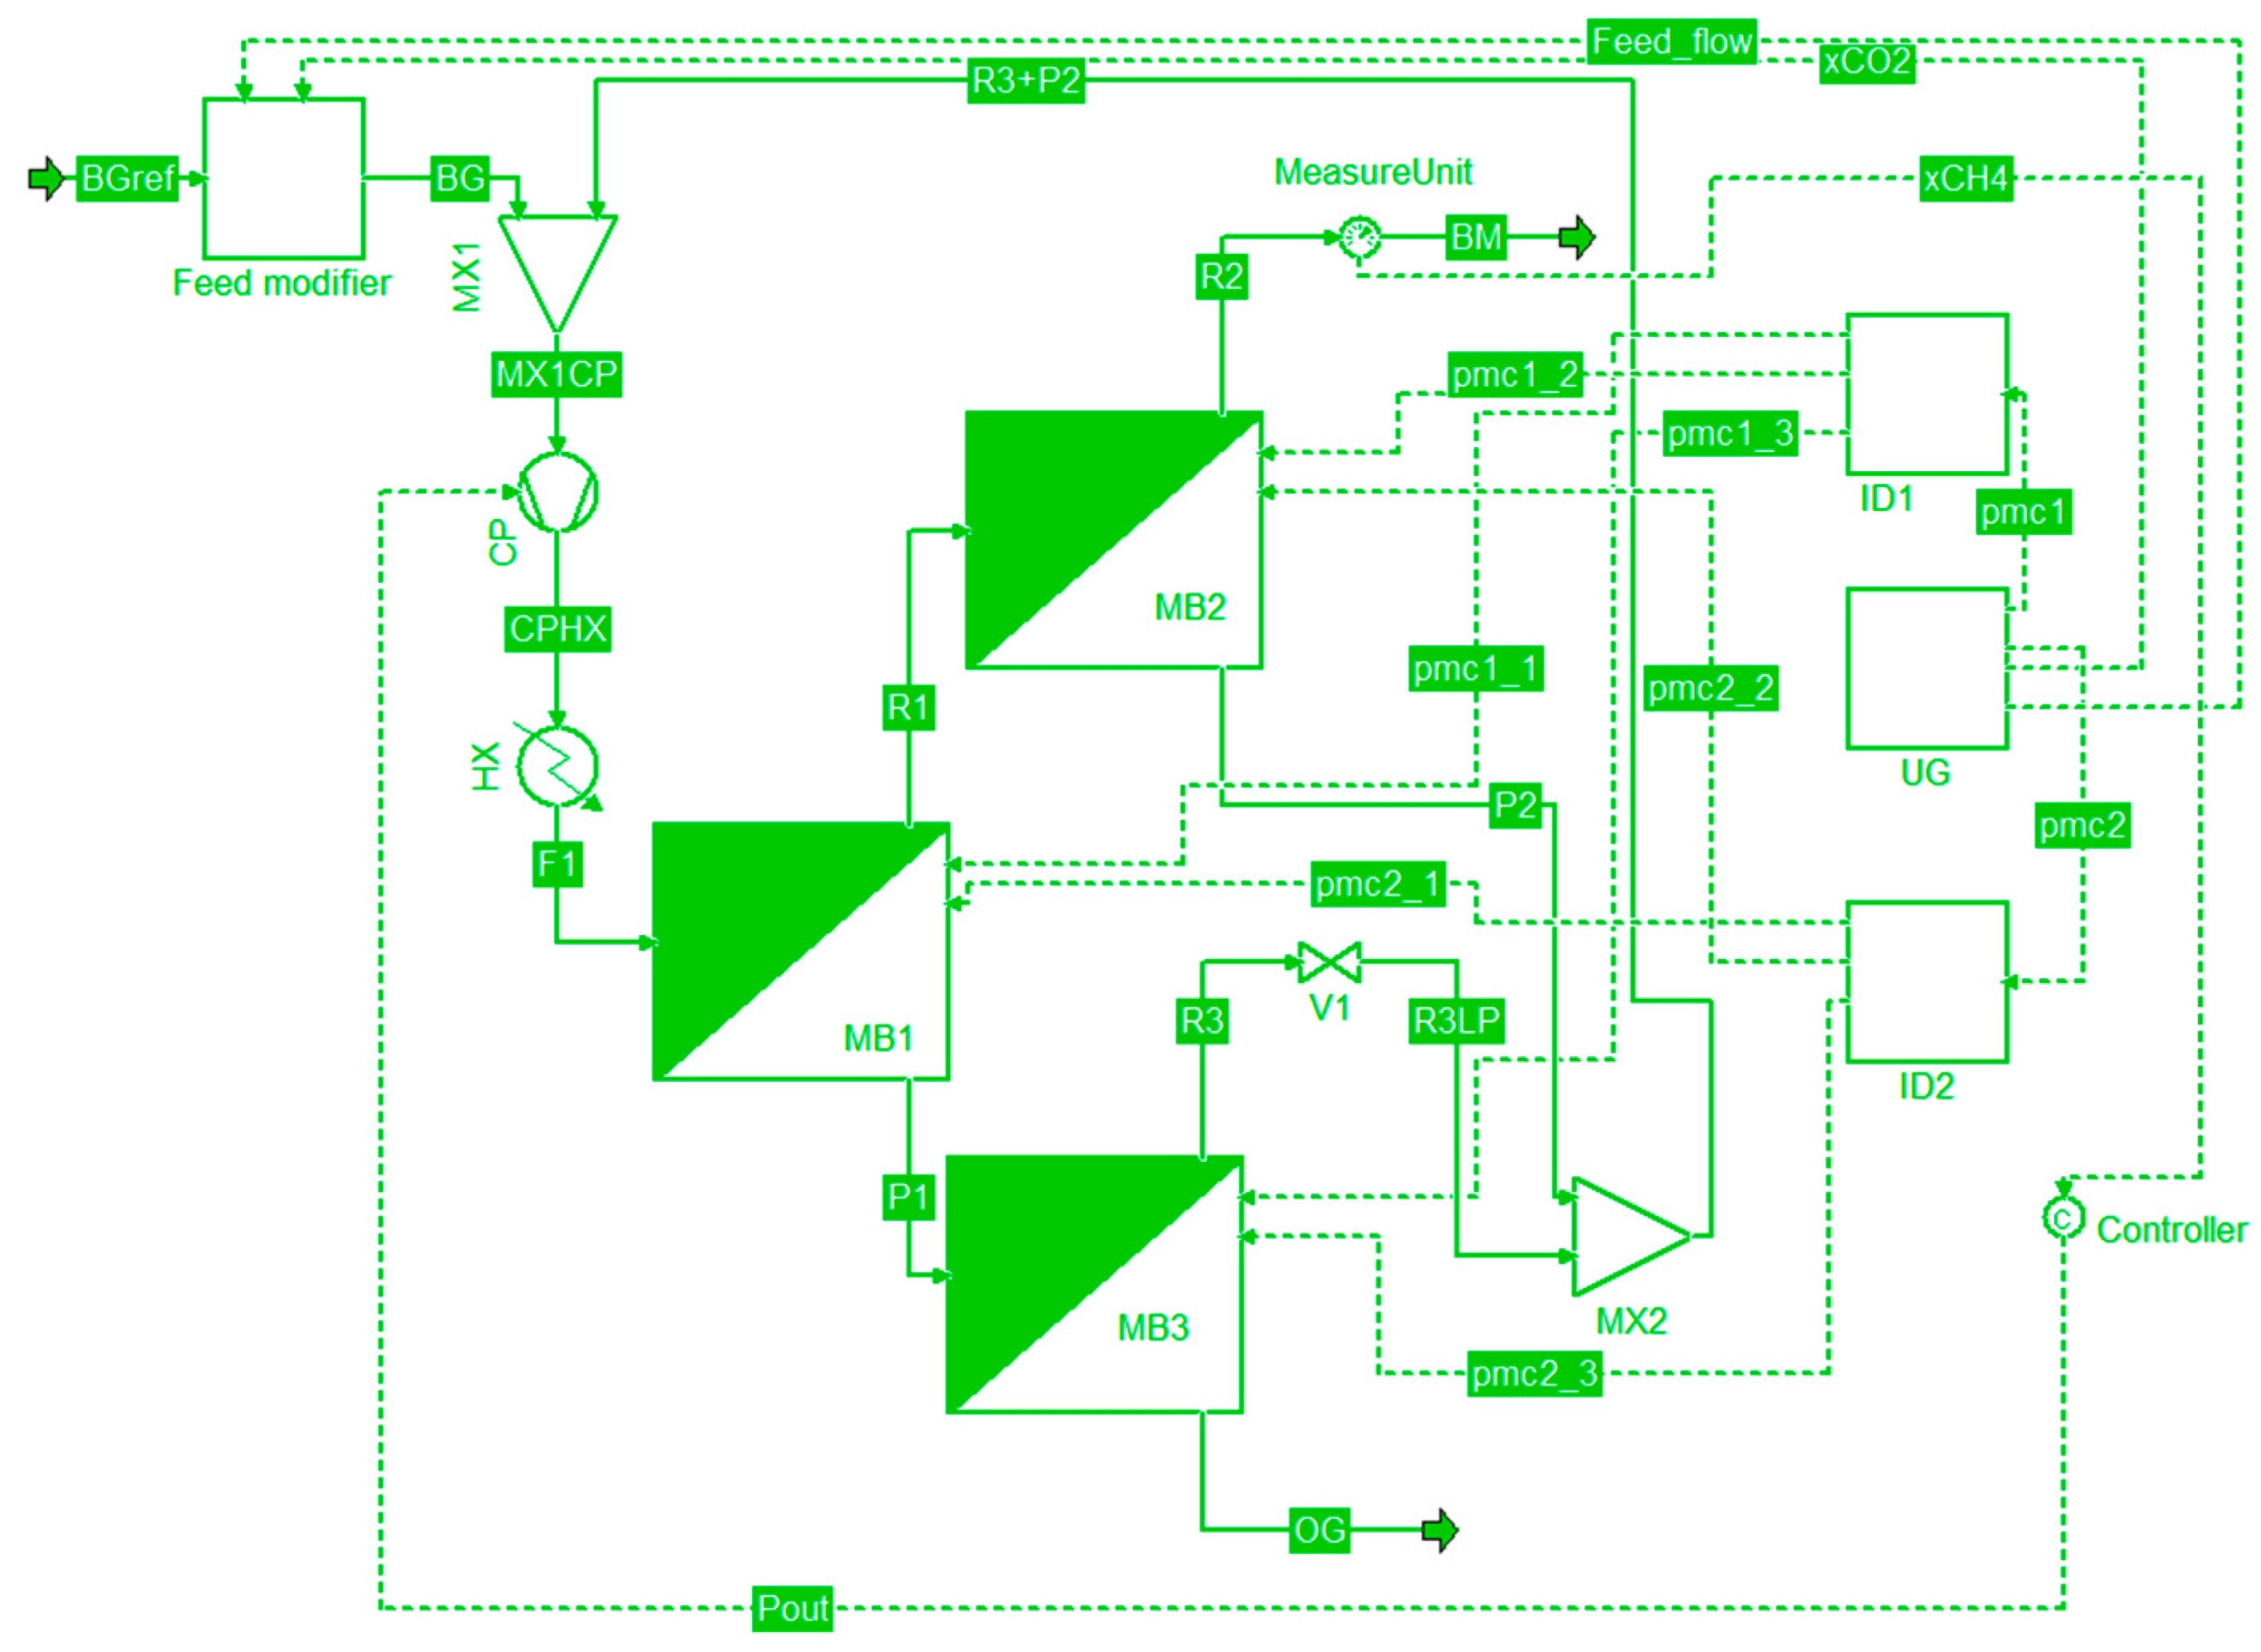
To demonstrate the application of uncertainty calculations using the COCO simulator to a biogas-upgrading process, we defined a case study based on the process configuration developed by Ungerank et al. [23]. This process was intended to obtain high gas purities using a three-membrane stage configuration, with recirculation provided by a single compressor. Figure 1 shows the process flowsheet implemented in the simulator. In the process, two membrane stages are placed in series; the permeate of the first stage is sent to the third stage, and the permeate stream of the third stage, after decompression, is mixed with the permeate of the second stage to form a stream that is recirculated for mixture with the process feed. Structural optimization for this process was performed in reference [24] for a biogas feed composed of 40% CO2 and 60% CH4, upgraded using a typical polyimide membrane with a CO2 permeance of 60 GPU. From this reference, we took the optimal stage areas and pressures for the permeate stream from stage 1 feeding stage 3 (Table 1).
For this study, we considered two operating scenarios for the same process configuration: (i) with active control of the compressor pressure to achieve a constant CH4 mole fraction of 0.96 in the biomethane product, and (ii) without pressure control. The mole fraction set point of the first scenario was chosen to be very close to the output obtained for the second scenario at the reference values. These scenarios were compared regarding their sensitivity to input uncertainties and process variability. The setpoint of composition for the scenario with regulation was chosen to be close to that obtained for the reference parameters in the unregulated system.

2.2. Deterministic Simulation of the Process in COCO

The deterministic simulation of the case study was performed before the uncertainty analysis, considering the parameters of Table 1 as deterministic. The process model was developed using the COCO simulator (version 3.9.0.1). The thermodynamic model for the whole process was based on the Peng–Robinson equation of state, which is commonly used in modeling membrane gas separation, and which handles the non-ideal behavior of CO2 reasonably well [25].
Figure 1 shows the flow diagram of the case study implemented in the CAPE-OPEN flowsheet environment (COFE) of the COCO simulator. The feed process (BG) is separated into an upgraded biomethane stream (BM) and an off-gas stream (OG), rich in carbon dioxide. The stage membranes (units MB1, MB2, and MB3) used the reference parameter values from Table 1. The compressor (CP), placed after feed mixing and recirculation, was assigned an isentropic efficiency of 72%. An aftercooler (HX) was set to reduce the temperature of the feed of the membrane stage MB1 to 40 °C. The output pressure of the valve after the retentate of MB1 was set at the same pressure as that of the permeate of MB2 (1 bar).
The process simulator included some required predefined units: a compressor, a heat exchanger, a valve, and mixer units. However, it does not include a membrane gas separation stage. The code for this unit operation was implemented in MATLAB 24.1.0 and connected to the add-on “MATLAB unit operation”, developed by Amsterchem (Almería, Spain) [4] to define a user unit of a membrane gas separation stage able to communicate with the COCO environment. The equations used to create this user unit can be found in Appendix A. This subroutine was included as an additional user MATLAB unit operation file. The MATLAB unit operation also required an interface to receive the default stage parameters (stage area, component permeances, and permeate pressure). Material ports were also added for the input and output streams of each stage. Additional ports for information were also included. These ports were a key component for the uncertainty analysis, as they allowed for modifying the default parameters of the unit according to the information sent from an uncertainty generation unit.
Note that Figure 1 includes the control of the compressor output pressure to fix the methane product composition using the information streams xCH4 y Pout (not active in the unregulated scenario).

2.3. Application of Uncertainty and Sensitivity Methodology

Uncertainty and sensitivity analyses require characterizing the uncertainty of the most essential uncontrollable factors in the process. Appropriate ranges of variation must be determined, and probability density distribution functions must be proposed, with statistical parameters to be fitted. The uncertainty distributions of the factors were used to perform a global sensitivity analysis using the Morris method to rank the importance of the factors. The uncertainty analysis was also applied to determine the uncertainty expected for the product flow and composition, as well as the compression energy requirements.

2.3.1. Characterization of the Uncertainty Sources

Feed variability can be significant in terms of flow and composition. When periodical measurements are available, an empirical distribution can be obtained for the flow rate, but typically, global sensitivity methods use log-normal, normal (truncated to zero), or uniform distributions. The choice between these options depends on the approximate knowledge of the empirical distribution. However, for an exploratory sensitivity study, a uniform distribution can be appropriate when a range can be defined, if we want to avoid introducing unsupported assumptions. As we are interested in studying the effect of variability, we will use uncertainty ranges of flow at two levels of variation, ±5% and ±10%, with respect to the reference value of the study. In the real system, the magnitude of the fluctuations will depend on the size of the gas holder tank placed prior to the membrane upgrading system.
Regarding the variability of composition, some general ranges can be found in the literature. Guerrero et al. found that in biogas obtained from the anaerobic digestion of biomass, the methane range can be 35–85%, and the carbon dioxide range 10–65%, with the rest of the components being much less significant [26]. The type and mixture of the feedstocks, operating conditions, and temporal fluctuations cause the observed variability [27,28]. Our reference feed values fall inside the mentioned ranges. However, to assume the wide ranges shown as uncertainty ranges in the plant design may not be realistic, as a plant is fed with a restricted class of organic sources. In our case, only the uncertainty range for CO2 molar fraction was used as a factor, as the analysis did not consider minor biogas components. Consequently, the CH4 molar fraction is entirely dependent. As in the flow analysis, for the CO2 molar fraction, a uniform distribution will be used at two levels of variation, ±5% and ±10%, with respect to the reference value of the study, which falls inside the bounds previously recommended.
Membrane performance is another great source of uncertainty in many processes. The permeability and selectivity of membranes for gas separation can be affected by compaction of the polymeric membrane due to pressure [29,30]. For example, CO2 permeability can be reduced by 10% to 20% with respect to its nominal value. Moreover, variations in the performance of different batches of membrane fibers have been observed [31]. The same membrane design can vary significantly depending on the manufacturing scale or production batch. However, it must also be considered that in a membrane stage, there is more than one membrane module; this means that the uncertainty in the performance of the stage is smaller than that of a single module. The permeability of CO2 and CH4 generally increases with temperature, showing an Arrhenius behavior [32]. Permeability increases because the diffusion through the polymer increases as the temperature rises, and it dominates over the possible solubility decrease. However, for CH4, this effect is more critical than for CO2, resulting in a decline in CO2/CH4 selectivity. For example, for polyimide membrane samples, an increase in the operating temperature from 35 °C to 45 °C increased CO2 permeabilities between 7–12%, but CO2/CH4 selectivity was reduced by 9–21% [33]. The temperature of the stream exiting the cooling subsystem of the compressor will exhibit low variability, as a well-instrumented system can control it between ±1 °C. Therefore, the temperature variability of the membranes will be caused by the environment surrounding the membrane stages, and the magnitude of the variation will depend on the system’s insulation. Considering the ranges exposed for variability of CO2 permeability, either due to manufacturing or affected by temperature, for this permeability, we will use a uniform distribution with a variation of ±10% with respect to the reference value of the study. Membrane permeability and selectivity are not independent variables, as there is a trade-off between them. Robeson found an upper limit with a potential relationship between the permeability of CO2 and the CO2/CH4 selectivity [34]. The fitting of this limit (Equation (1)) is a superior bound that relates both properties to the same material. We will use this expression to relate selectivity ( S C O 2 / C H 4 ) and permeability to CO2 ( p m b C O 2 ) using the study’s reference values, assuming a variability of ±5% with respect to the calculated selectivity value.
S C O 2 / C H 4 = S C O 2 / C H 4 , r e f · p m b C O 2 p m b C O 2 , r e f 0.379
Based on this discussion, the uncertainty factors and their associated uncertainties used in the uncertainty and sensitivity study are summarized in Table 2. For the feed, the variability of the flow and composition will be studied jointly through two levels of feed variability (FV = ±5% and FV = ±10%).

2.3.2. Response Variables Studied

The effects of the uncertainty on the flow and composition of the biomethane product stream (BM) and off-gas (OG), as well as on the energy demand and the heat duty of the compressor, were studied. Table 3 shows the response variables considered.

2.3.3. User Module for Uncertainties

Using the COCO simulator, it is possible to perform a local sensitivity analysis in which one or more variables of the process (stream variables or unit parameters) can be modified to study the effect on product streams or the energy requirements of the process units. However, global sensitivity analysis requires performing calculations for combinations of variables following probability distributions. To address this issue, we created a MATLAB unit that transmits the combinations of factors with uncertainty to the simulator for calculation (unit UG of Figure 2). This unit uses the deterministic values of the problem as parameters when a case variable displays a flag value equal to 0. A parametric study modifies the flag value from 1 to the number of executions required. When the flag value is 1, the values of all the factor combinations are loaded into the computer’s random-access memory from a comma-delimited file previously prepared in MATLAB using its statistical functions. The values for the subsequent factor combinations are sent through information streams to the process units. A MATLAB user unit was incorporated for the inlet stream to modify its flow and composition around the inlet stream reference values. Another MATLAB user unit was created to distribute the uncertain permselective parameters to the three process stages (information dividers ID1 and ID2).

2.3.4. Morris’ Analysis of Global Sensitivity

Morris’ global sensitivity analysis was applied to the two scenarios of the case study. This method can be used as a screening method to determine the relative importance of the factors by computing elementary effects from distinct perturbations.
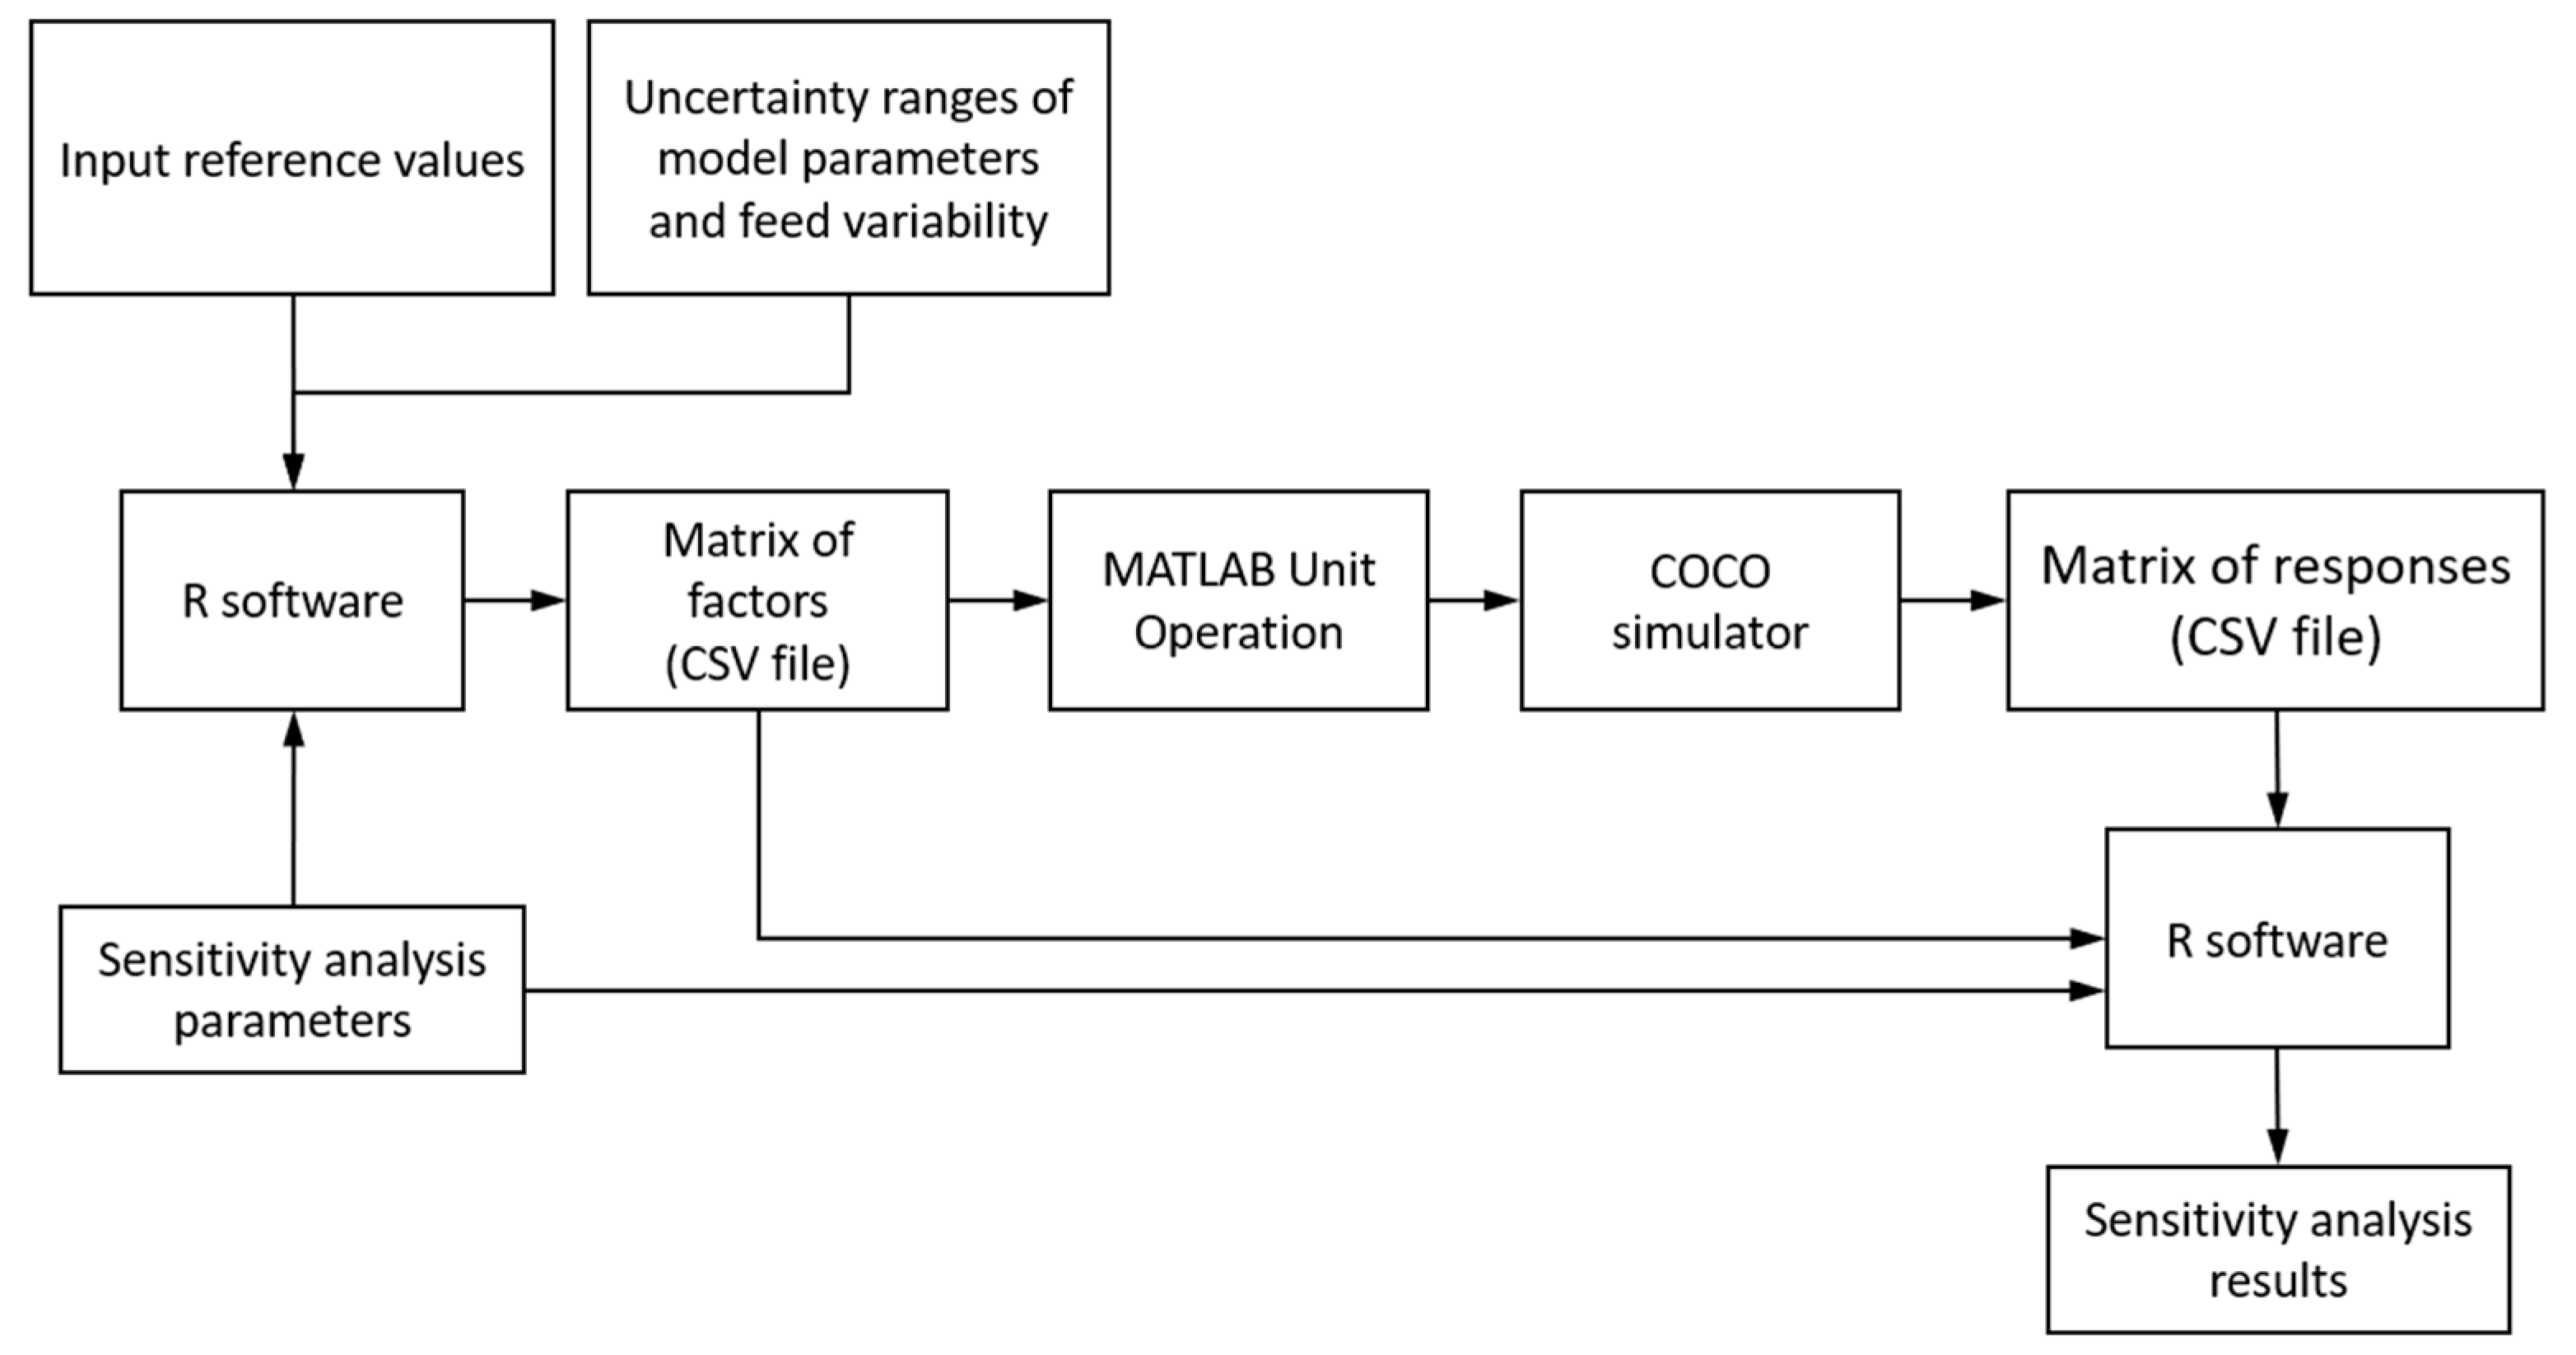
Figure 3 shows the workflow diagram used to perform the analysis. The information on reference values and uncertainty ranges was processed by the subroutine “morris” of the package sensitivity (version 1.30.1) [35] of R to generate a design matrix with the combinations of factors to be calculated. The COFE flowsheet of the process, including the MATLAB unit operations for uncertainty generation and distribution, permits COCO to perform a parametric study. The results of this parametric study were manually exported to a comma-delimited file. The file was processed with the design matrix, again calling the subroutine “morris” in R 4.5.1 software to obtain the sensitivity analysis results.
The design was of type OAT (one-at-a-time) with r = 30 trajectories to obtain a relatively dense sampling. The number of evaluations for the k = 4 uncertainty factors was N = (r + 1) × k = 150, which was considered an acceptable computing cost. Using a grid jump of less than or equal to half of the number of levels is recommended, so we started with a typical number of four levels with a grid jump of two. Still, after analysis of the design matrix, these values were increased to avoid repeated combinations.
It is important to note that the method was applied to normalized responses obtained by dividing each response by its reference value. The reference values of the responses were the deterministic values obtained for the reference values of the factors. This allows for better comparison of relative sensitivity across responses, as sensitivity results are interpreted in terms of percent change of the response.

2.3.5. Determination of Sobol’ Indices

To quantify the contribution of each factor to the response, a sparse Polynomial Chaos Expansion (PCE) with Least Angle Regression (LARS) was built using UQLab 2.1.0 software [36]. This approach enables efficient computation of Sobol’ indices and supports the use of tabular input–output data by building a metamodel. It is the method implemented by default in the PCE toolbox of the software [37]. The workflow was similar to that shown in Figure 3, except that UQLab was used instead of R. A Sobol’ sequence of size N was generated to form the matrix of factors to be processed in the COCO simulator. The maximum total polynomial degree was set to four, based on prior evidence of low nonlinearity from the Morris screening. With four factors and a typical hyperbolic truncation q = 0.75, the candidate basis contains p = 35 coefficients; therefore, following the oversampling rule N = 3·p [38], an initial sample of N = 105 was considered. Subsequently, the matrices of factors and responses were analyzed in UQLab to compute the Sobol’ indices.

2.3.6. Uncertainty Analysis for Determination of Tolerance Limits

In addition to determining the importance of the uncertainty factors, assessing their effects on the probability distribution of the response variables is interesting. This information can be used to obtain tolerance values that capture a certain probability content. Specifically, we are interested in symmetric tolerance limits (two-sided limits) to cover a probability content of 95%, which is the usual standard when no safety issues are involved.
The Monte Carlo propagation method was used to estimate the probability distribution of the outputs. A design matrix was generated in MATLAB by combining factors with random values that follow a uniform distribution within the ranges of Table 2. These data were arranged in a comma-delimited file and processed similarly to the workflow shown in Figure 3 but using MATLAB 24.1.0 as the analysis tool.
The number of computer evaluations to achieve a specific confidence level can be obtained using Wilks formula, which also depends on the rank used. For rank 1, the tolerance limits are placed in the first and last values of the ordered vector of N results. For rank k, the lower tolerance limit is defined by the value in the k-position, and the upper tolerance limit is the value in the Nk + 1 position. According to Porter [39], the use of rank 1 is usually acceptable when the tolerance limits are not close to safety limits. He indicates that a higher rank statistic corresponds to more centrally located order statistics, which reduces sensitivity to outliers, but implies more evaluations. However, the improvement obtained by increasing the rank from 1 to 2 is greater than that obtained by increasing the rank from 2 to 3. As a compromise between the number of evaluations and more stable limits to evaluate the symmetry of the resulting response distribution, we considered the use of rank 2 with a confidence level of 99%. This required performing 198 simulator evaluations (68 more than for rank 1 and 61 less than for rank 3).

3. Results

3.1. Deterministic Simulation Results

Table 4 shows the results obtained using the COCO simulator for the process configuration and the reference values in Table 1. Comparing the values of the flows of biomethane and off-gas for the non-controlled scenario with those obtained by Scholz [24], we observed differences of 0.12% and −0.16% for the same configuration and reference parameters, respectively. These minor differences are probably a consequence of the most elaborate model of the mentioned work in terms of the internal structure of the stage. However, compared with the variability posteriorly observed in the uncertainty study, the differences are small enough to validate the process model for capturing the uncertainty characteristics of the process.

3.2. Sensitivity Analysis

3.2.1. Morris Sensitivity Analysis

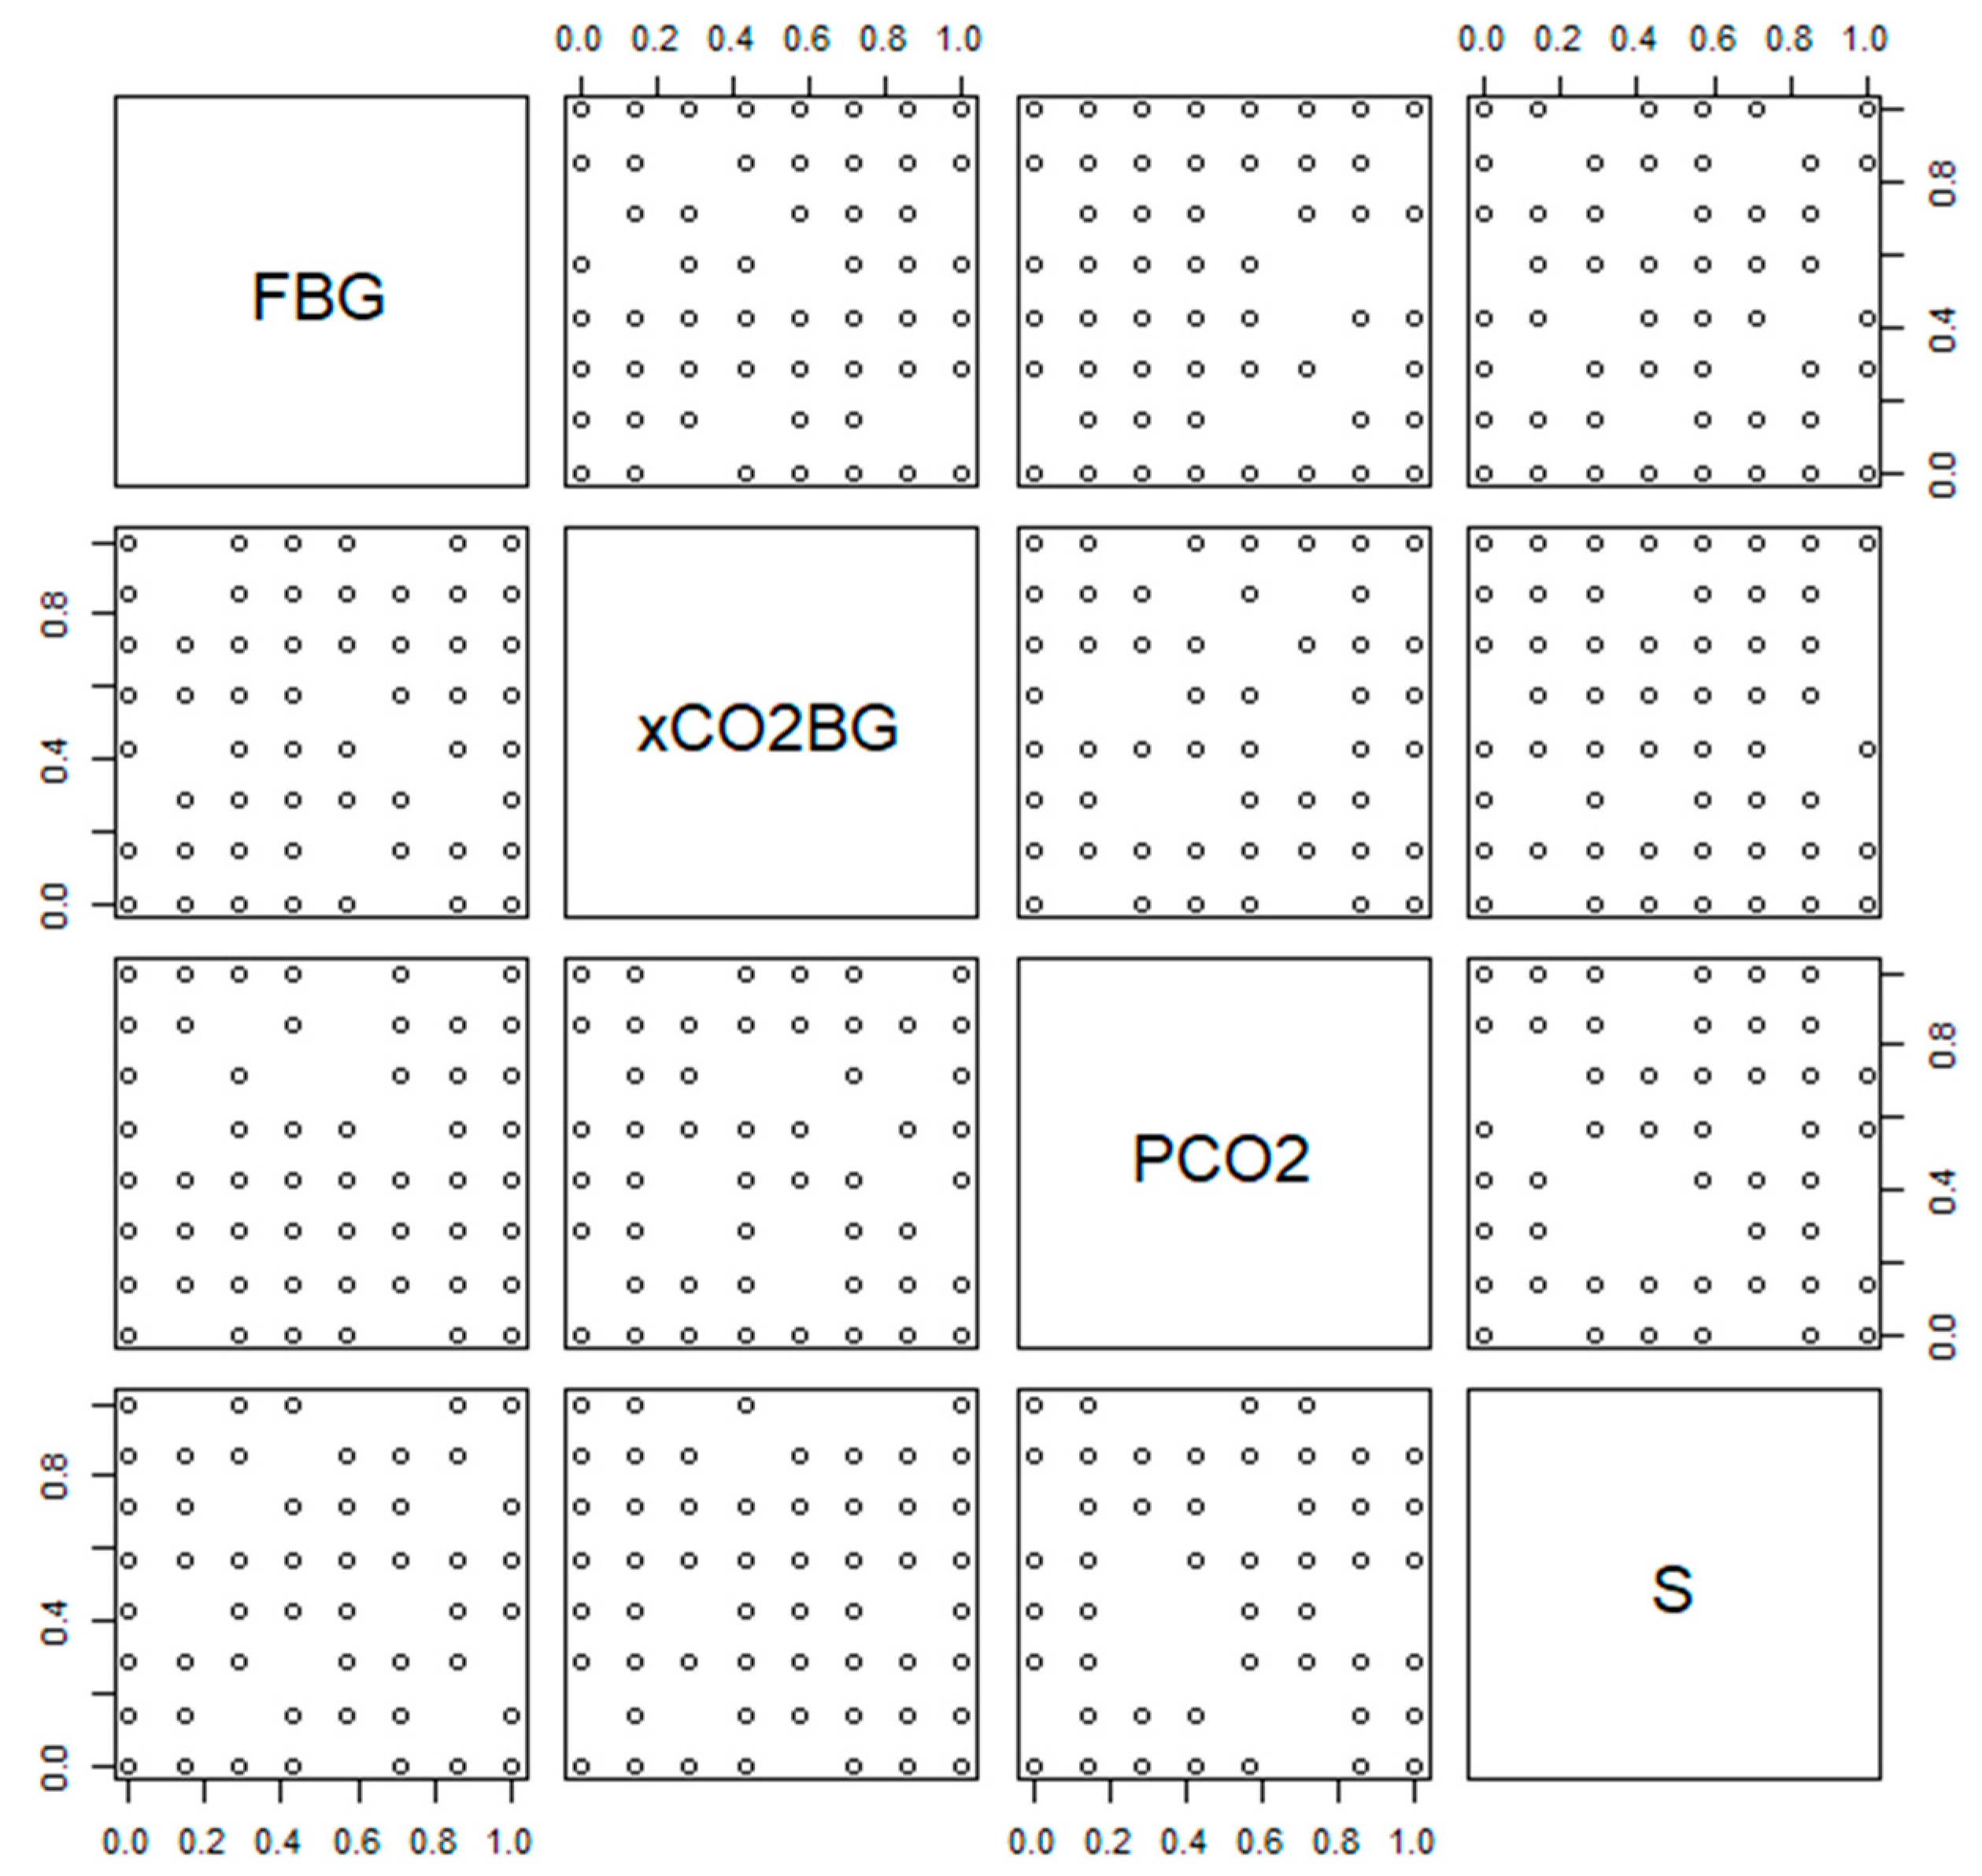
Using four levels with a grid jump of two yielded a design matrix that contained repeated factor combinations, which is undesirable for deterministic computer experiments because it yields redundant evaluations. With eight levels and a grid jump of four, an experimental plan with no repetitions was obtained (Figure 4). On an Intel Core i9 (3.50 GHz) processor, computing the 150 design points in the simulator required 5.91 min for the non-controlled scenario and 75.3 min for the controlled scenario.
To assess the stability of the Morris results, the analysis was repeated for the non-controlled scenario at the highest feed variability using 16 levels and a grid jump of 8. No significant differences were observed, supporting the choice of the number of levels. Full tabular results are provided in Supplementary Tables S1 and S2; below, we discuss the results in graphical form.
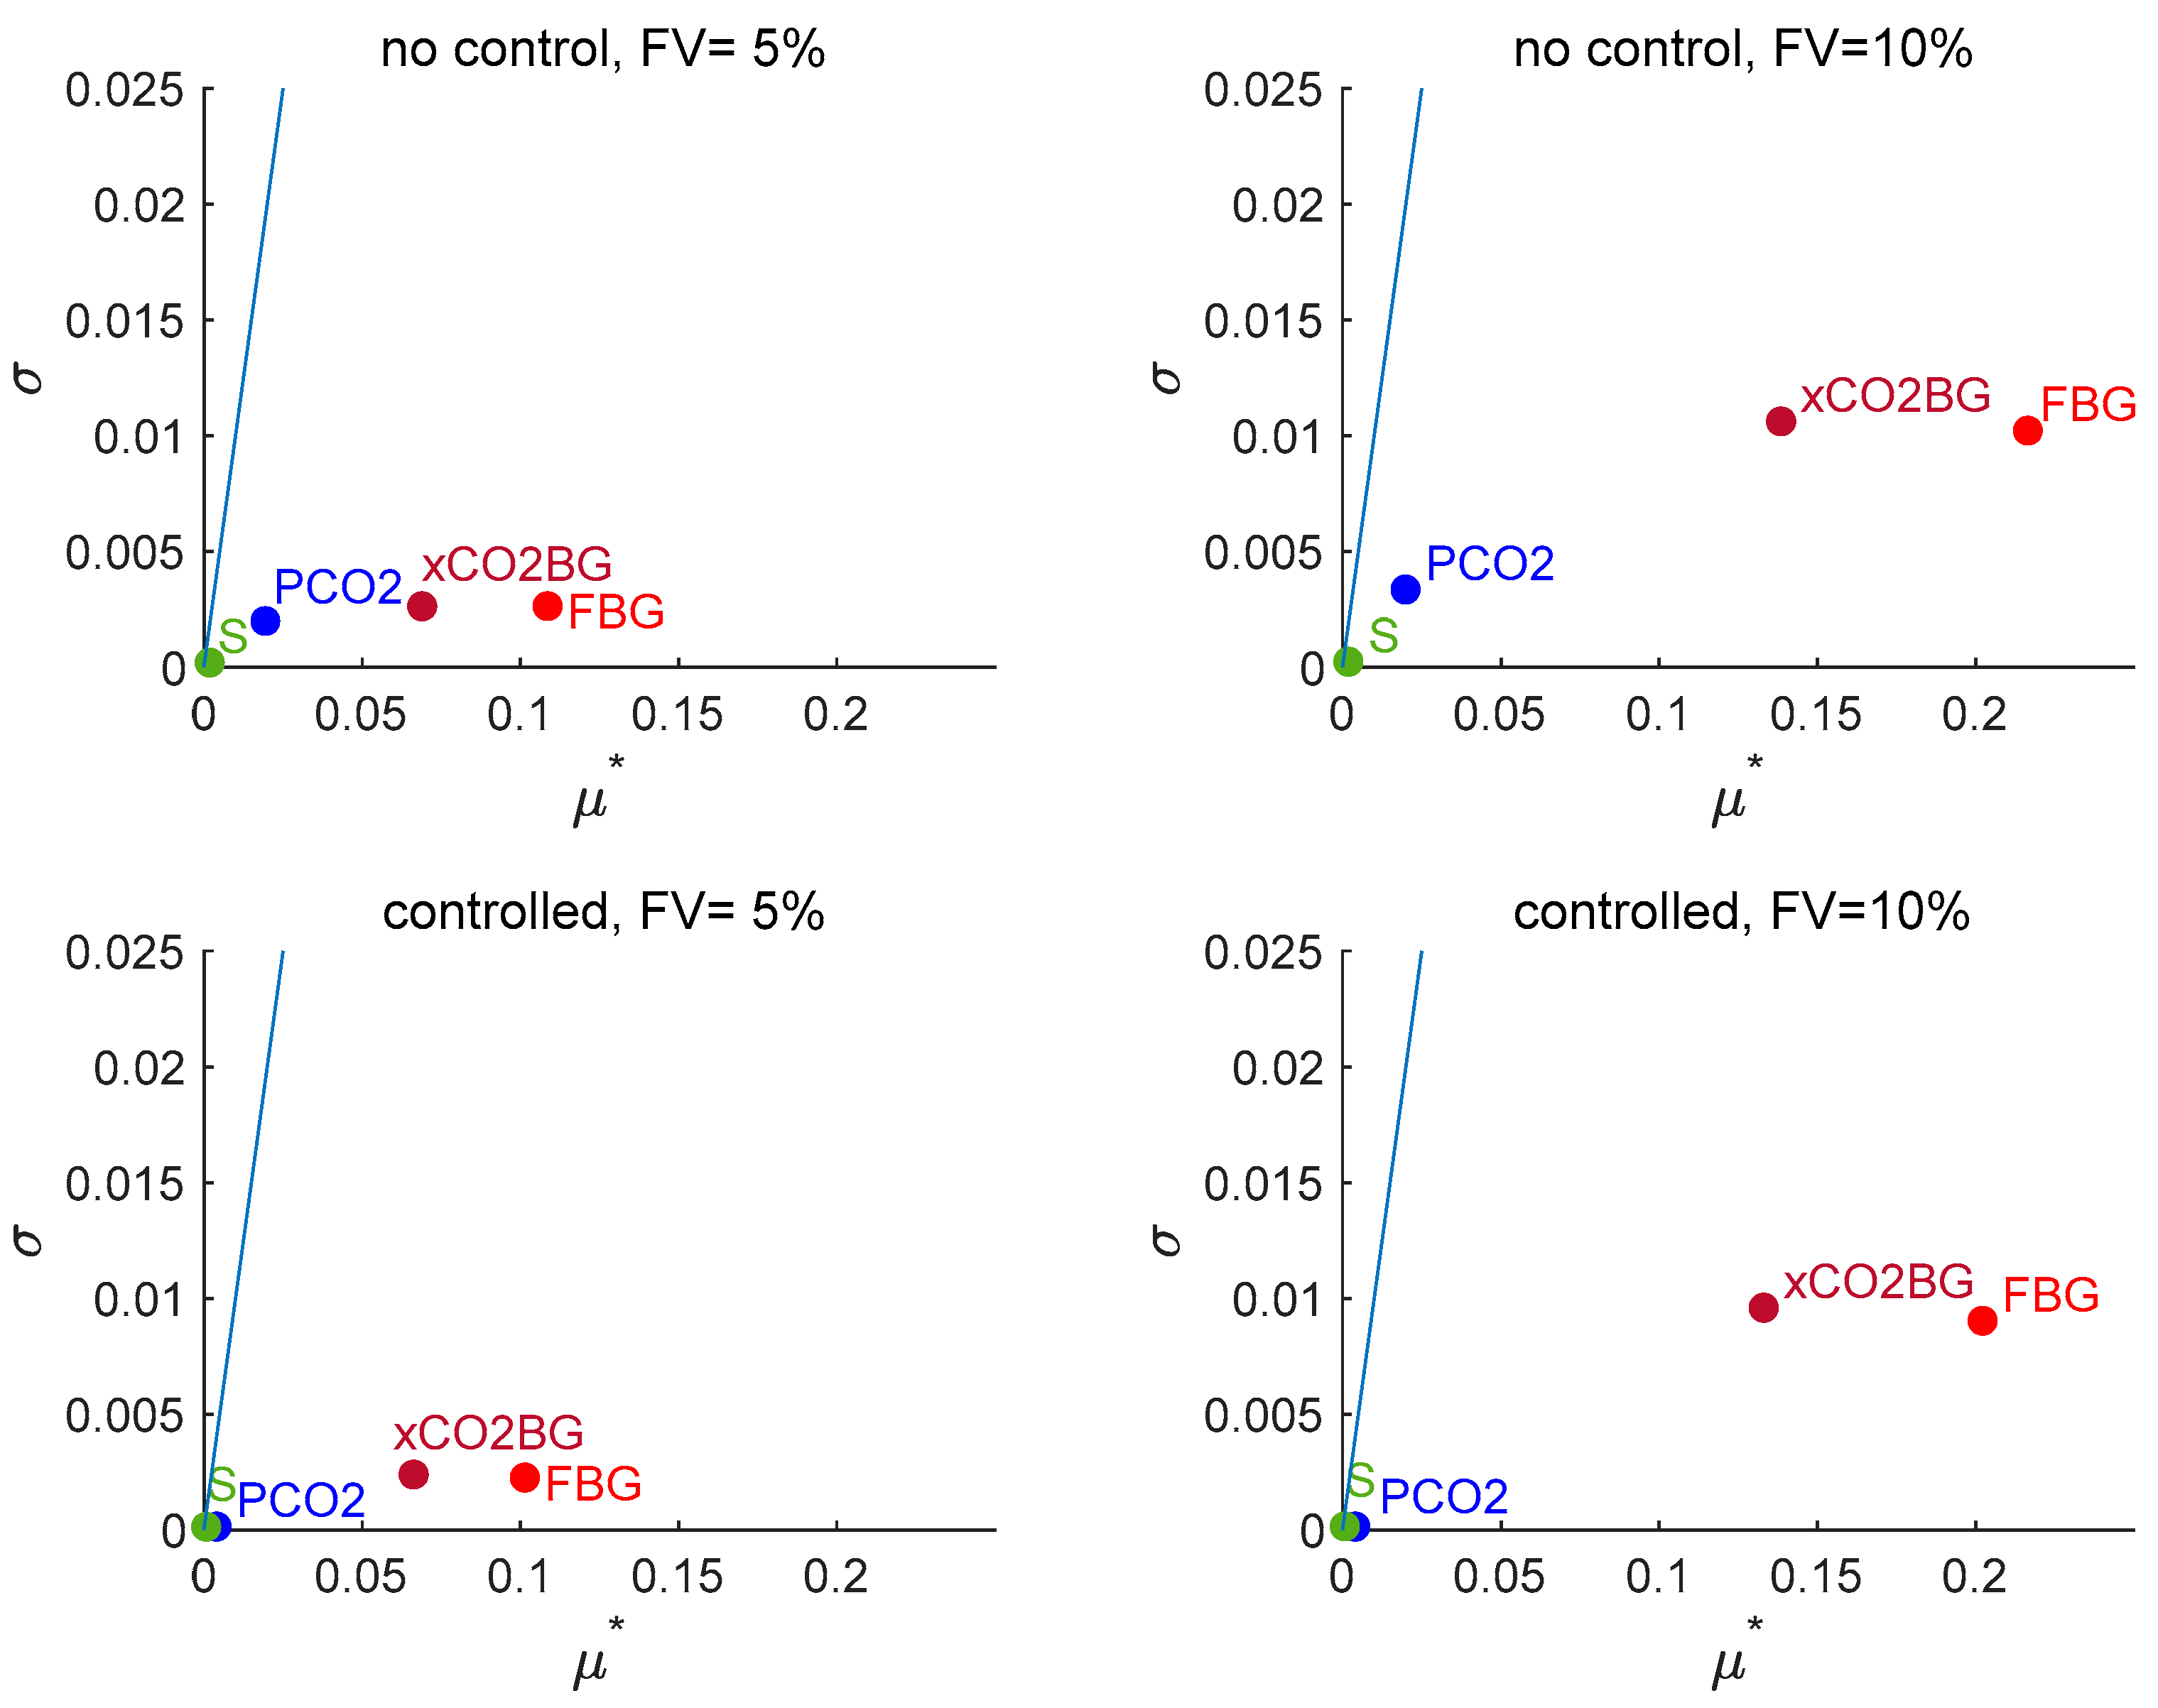
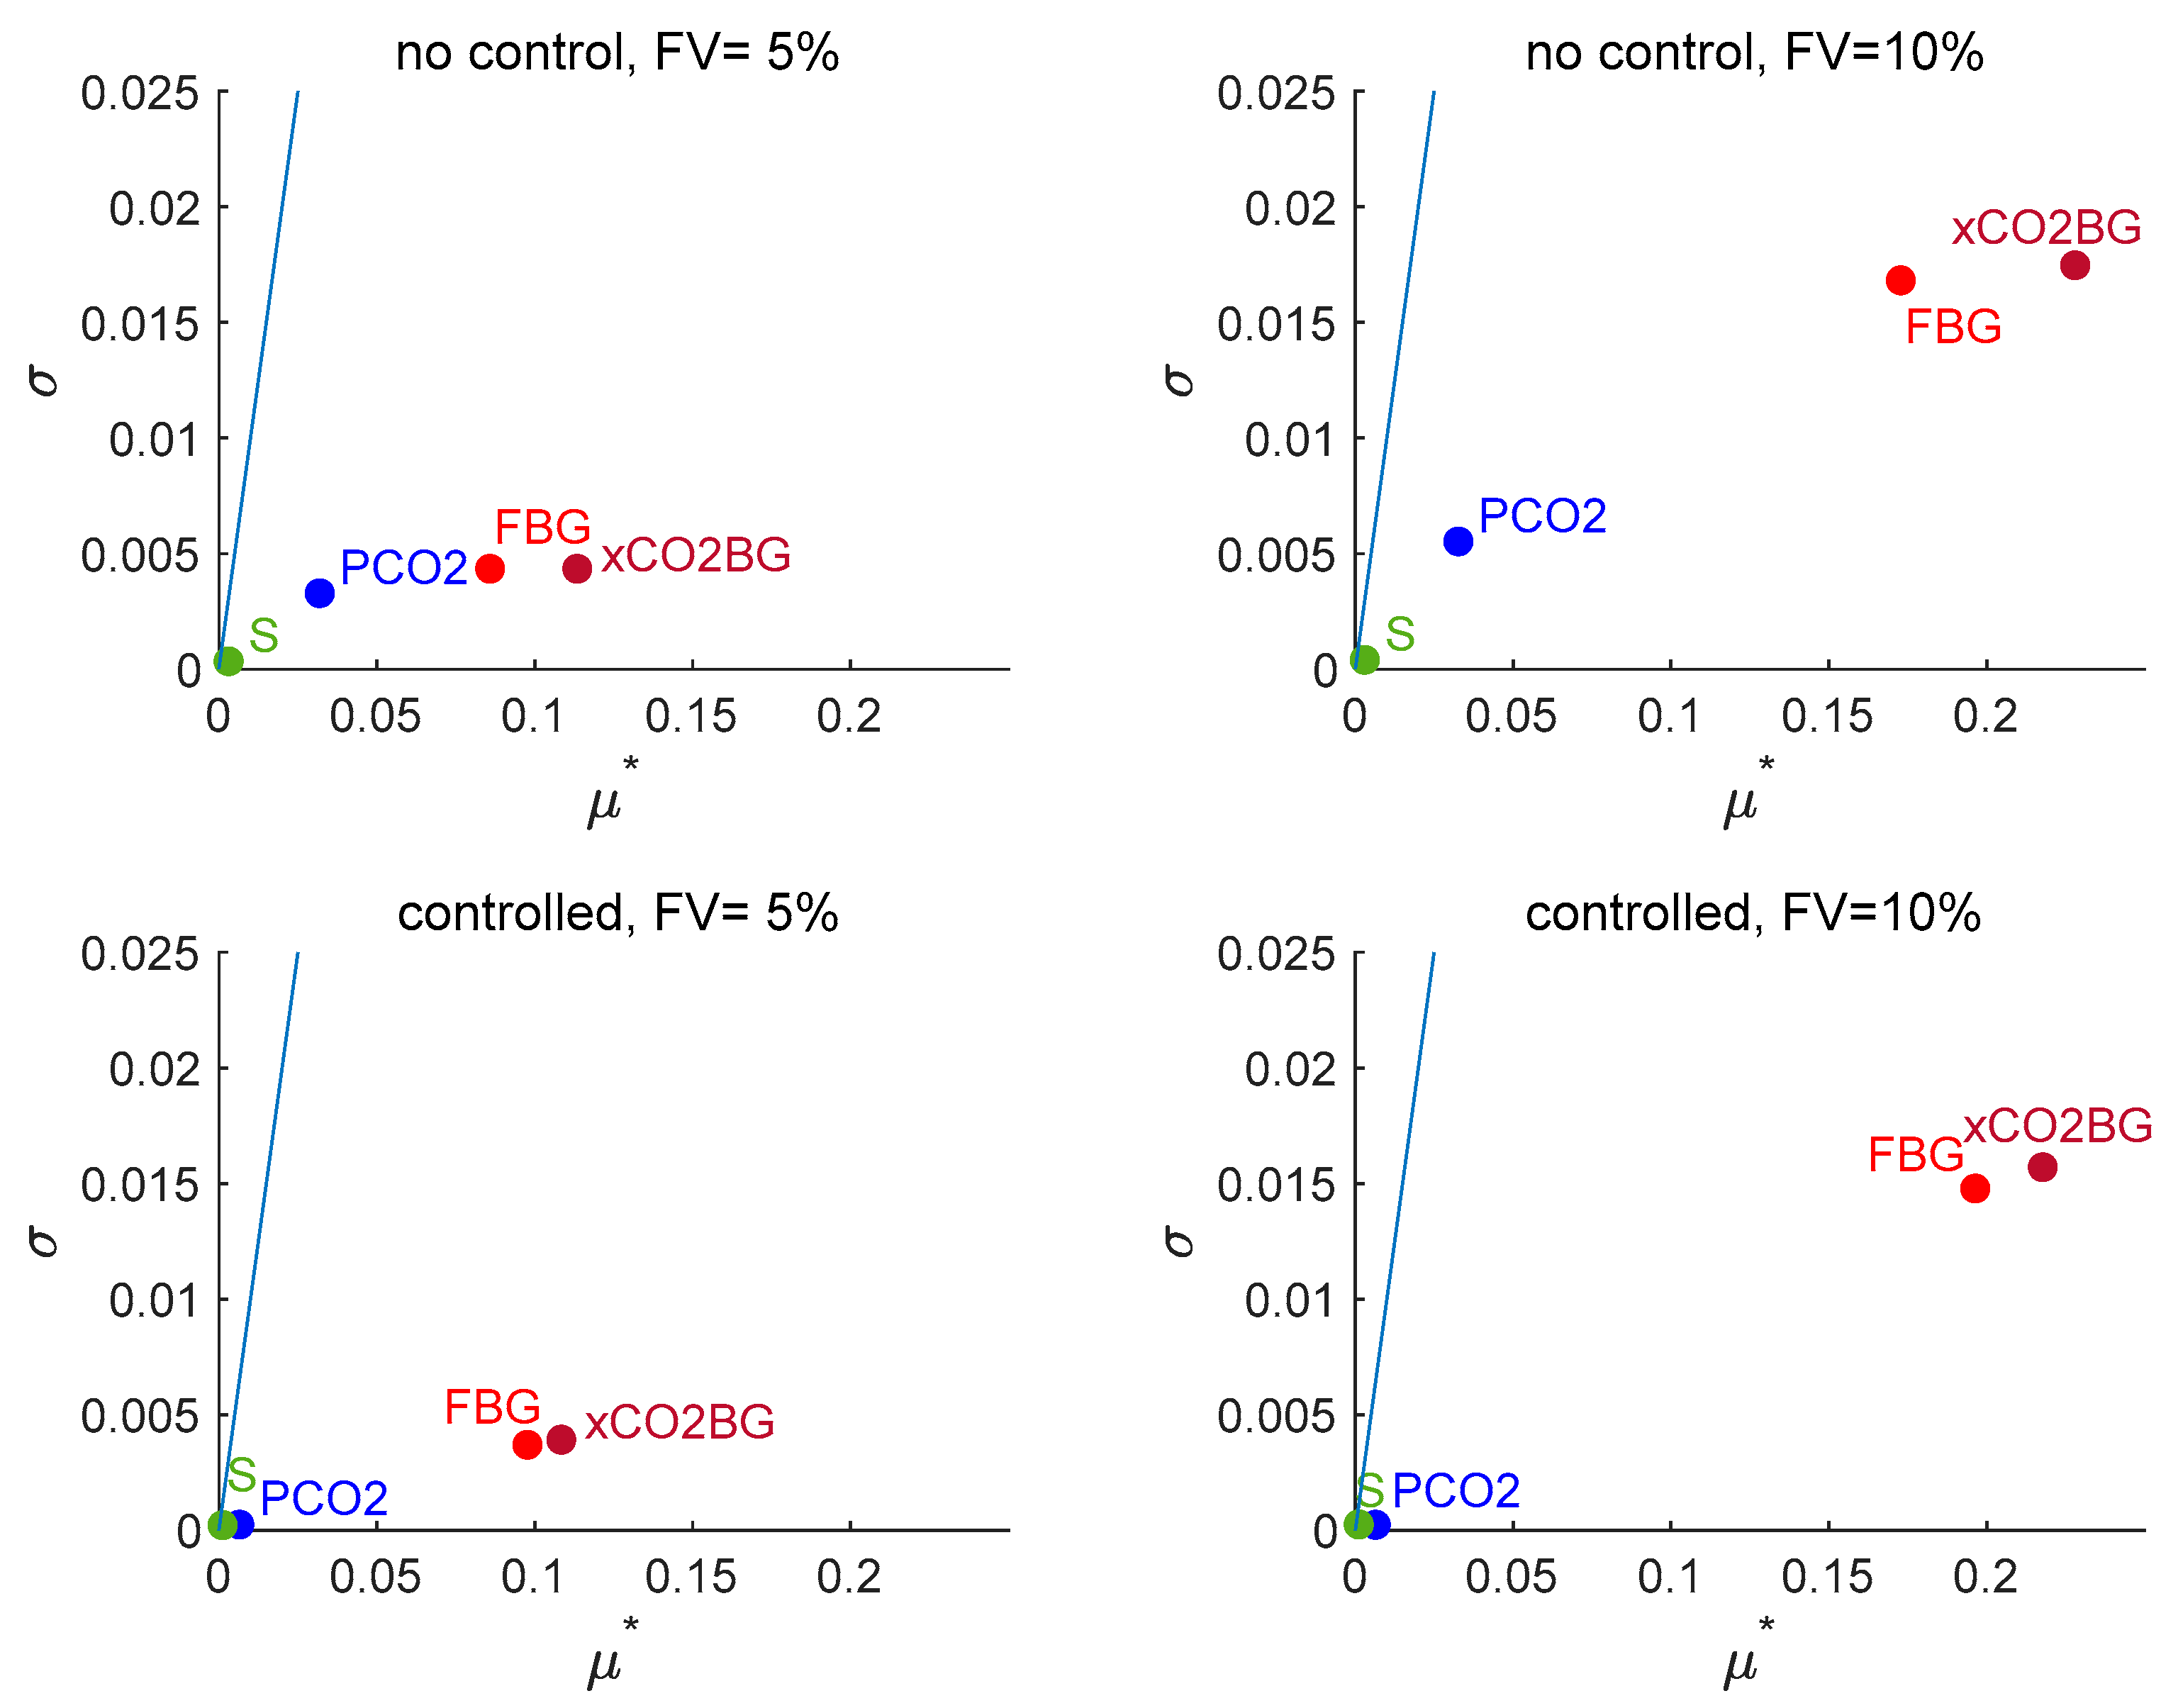
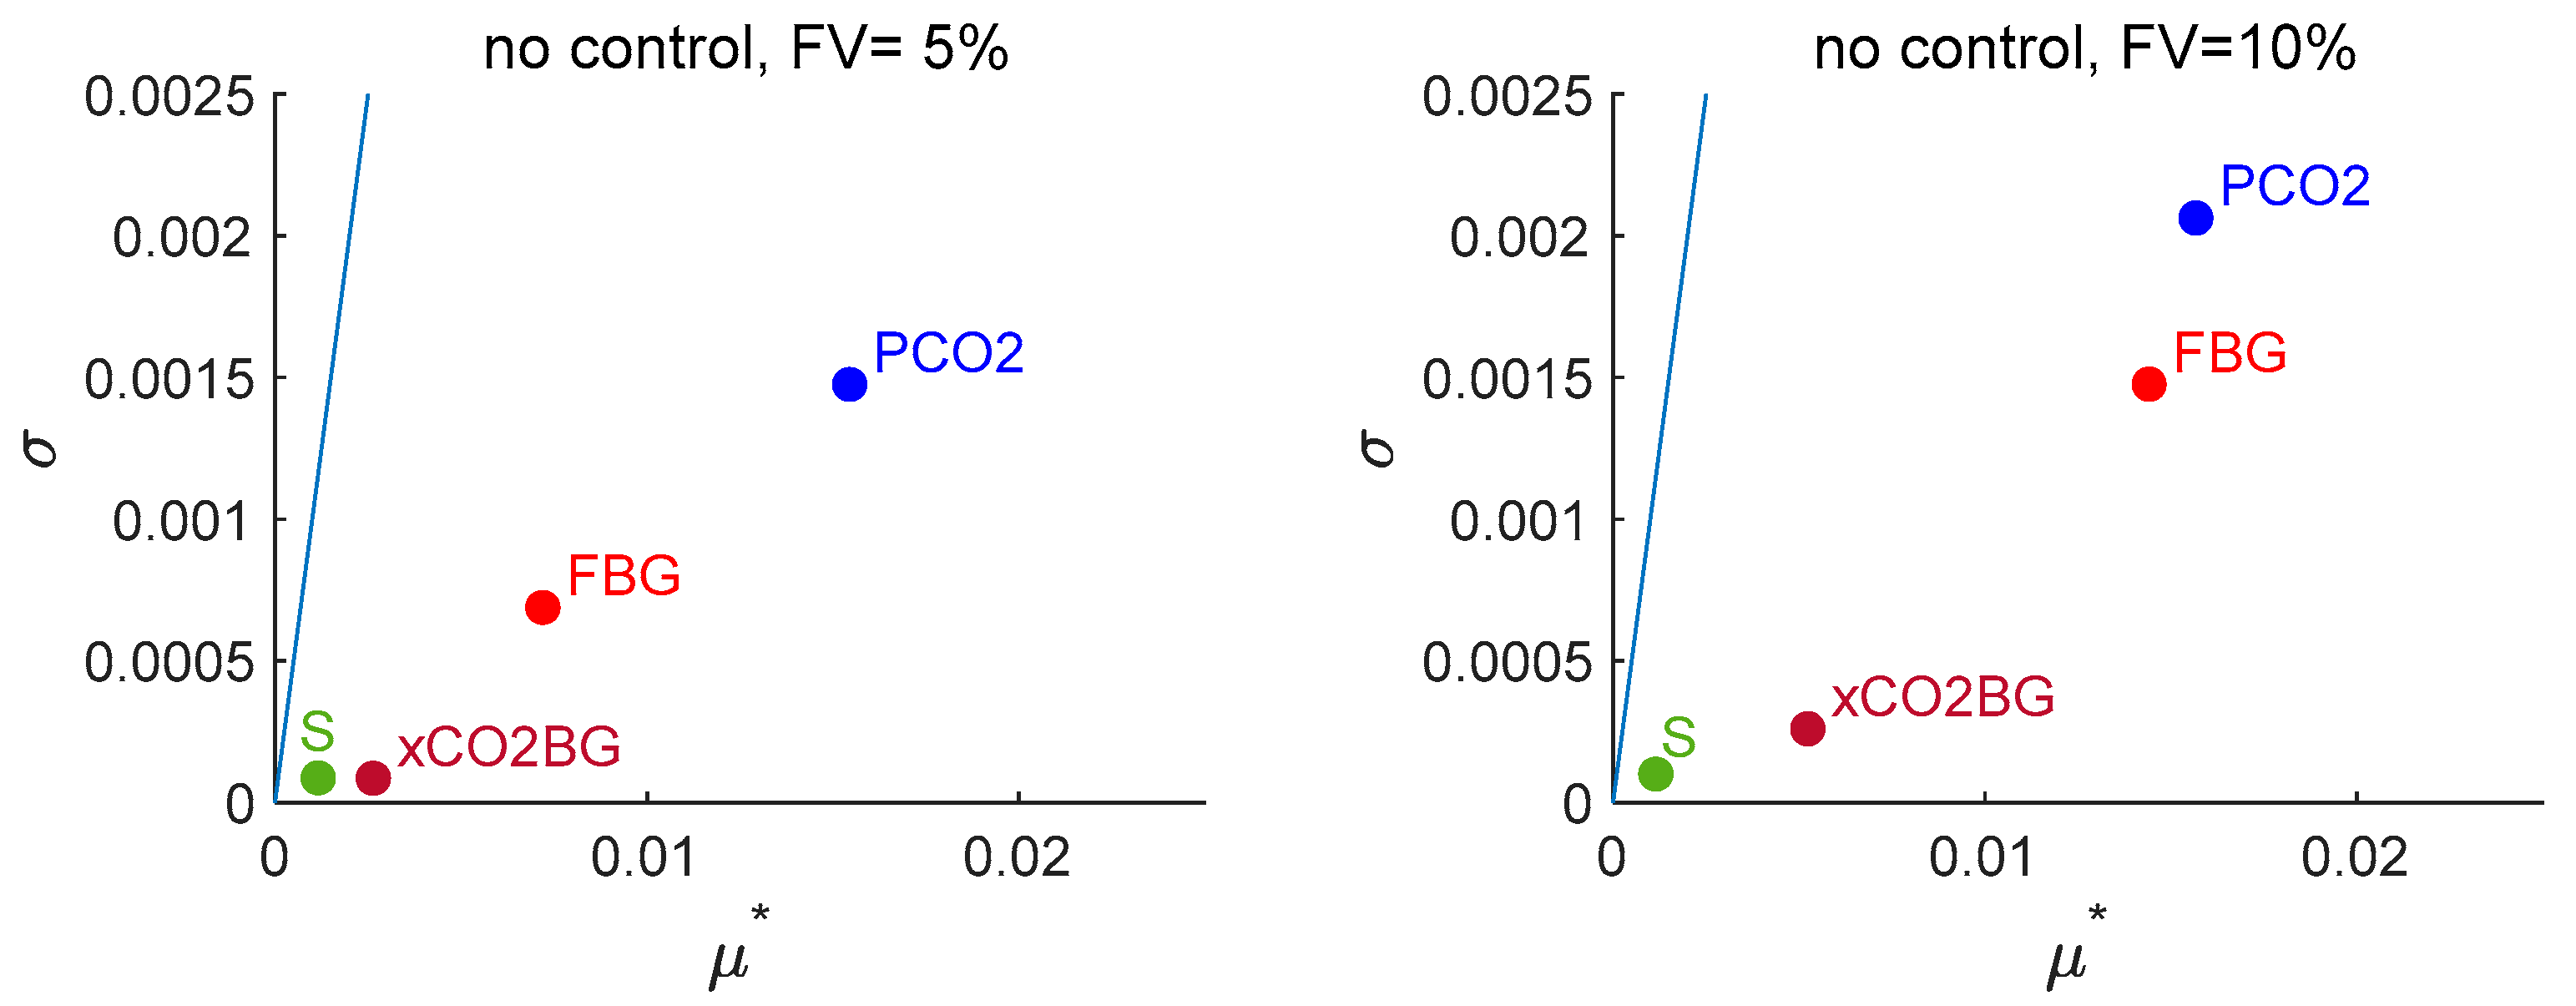
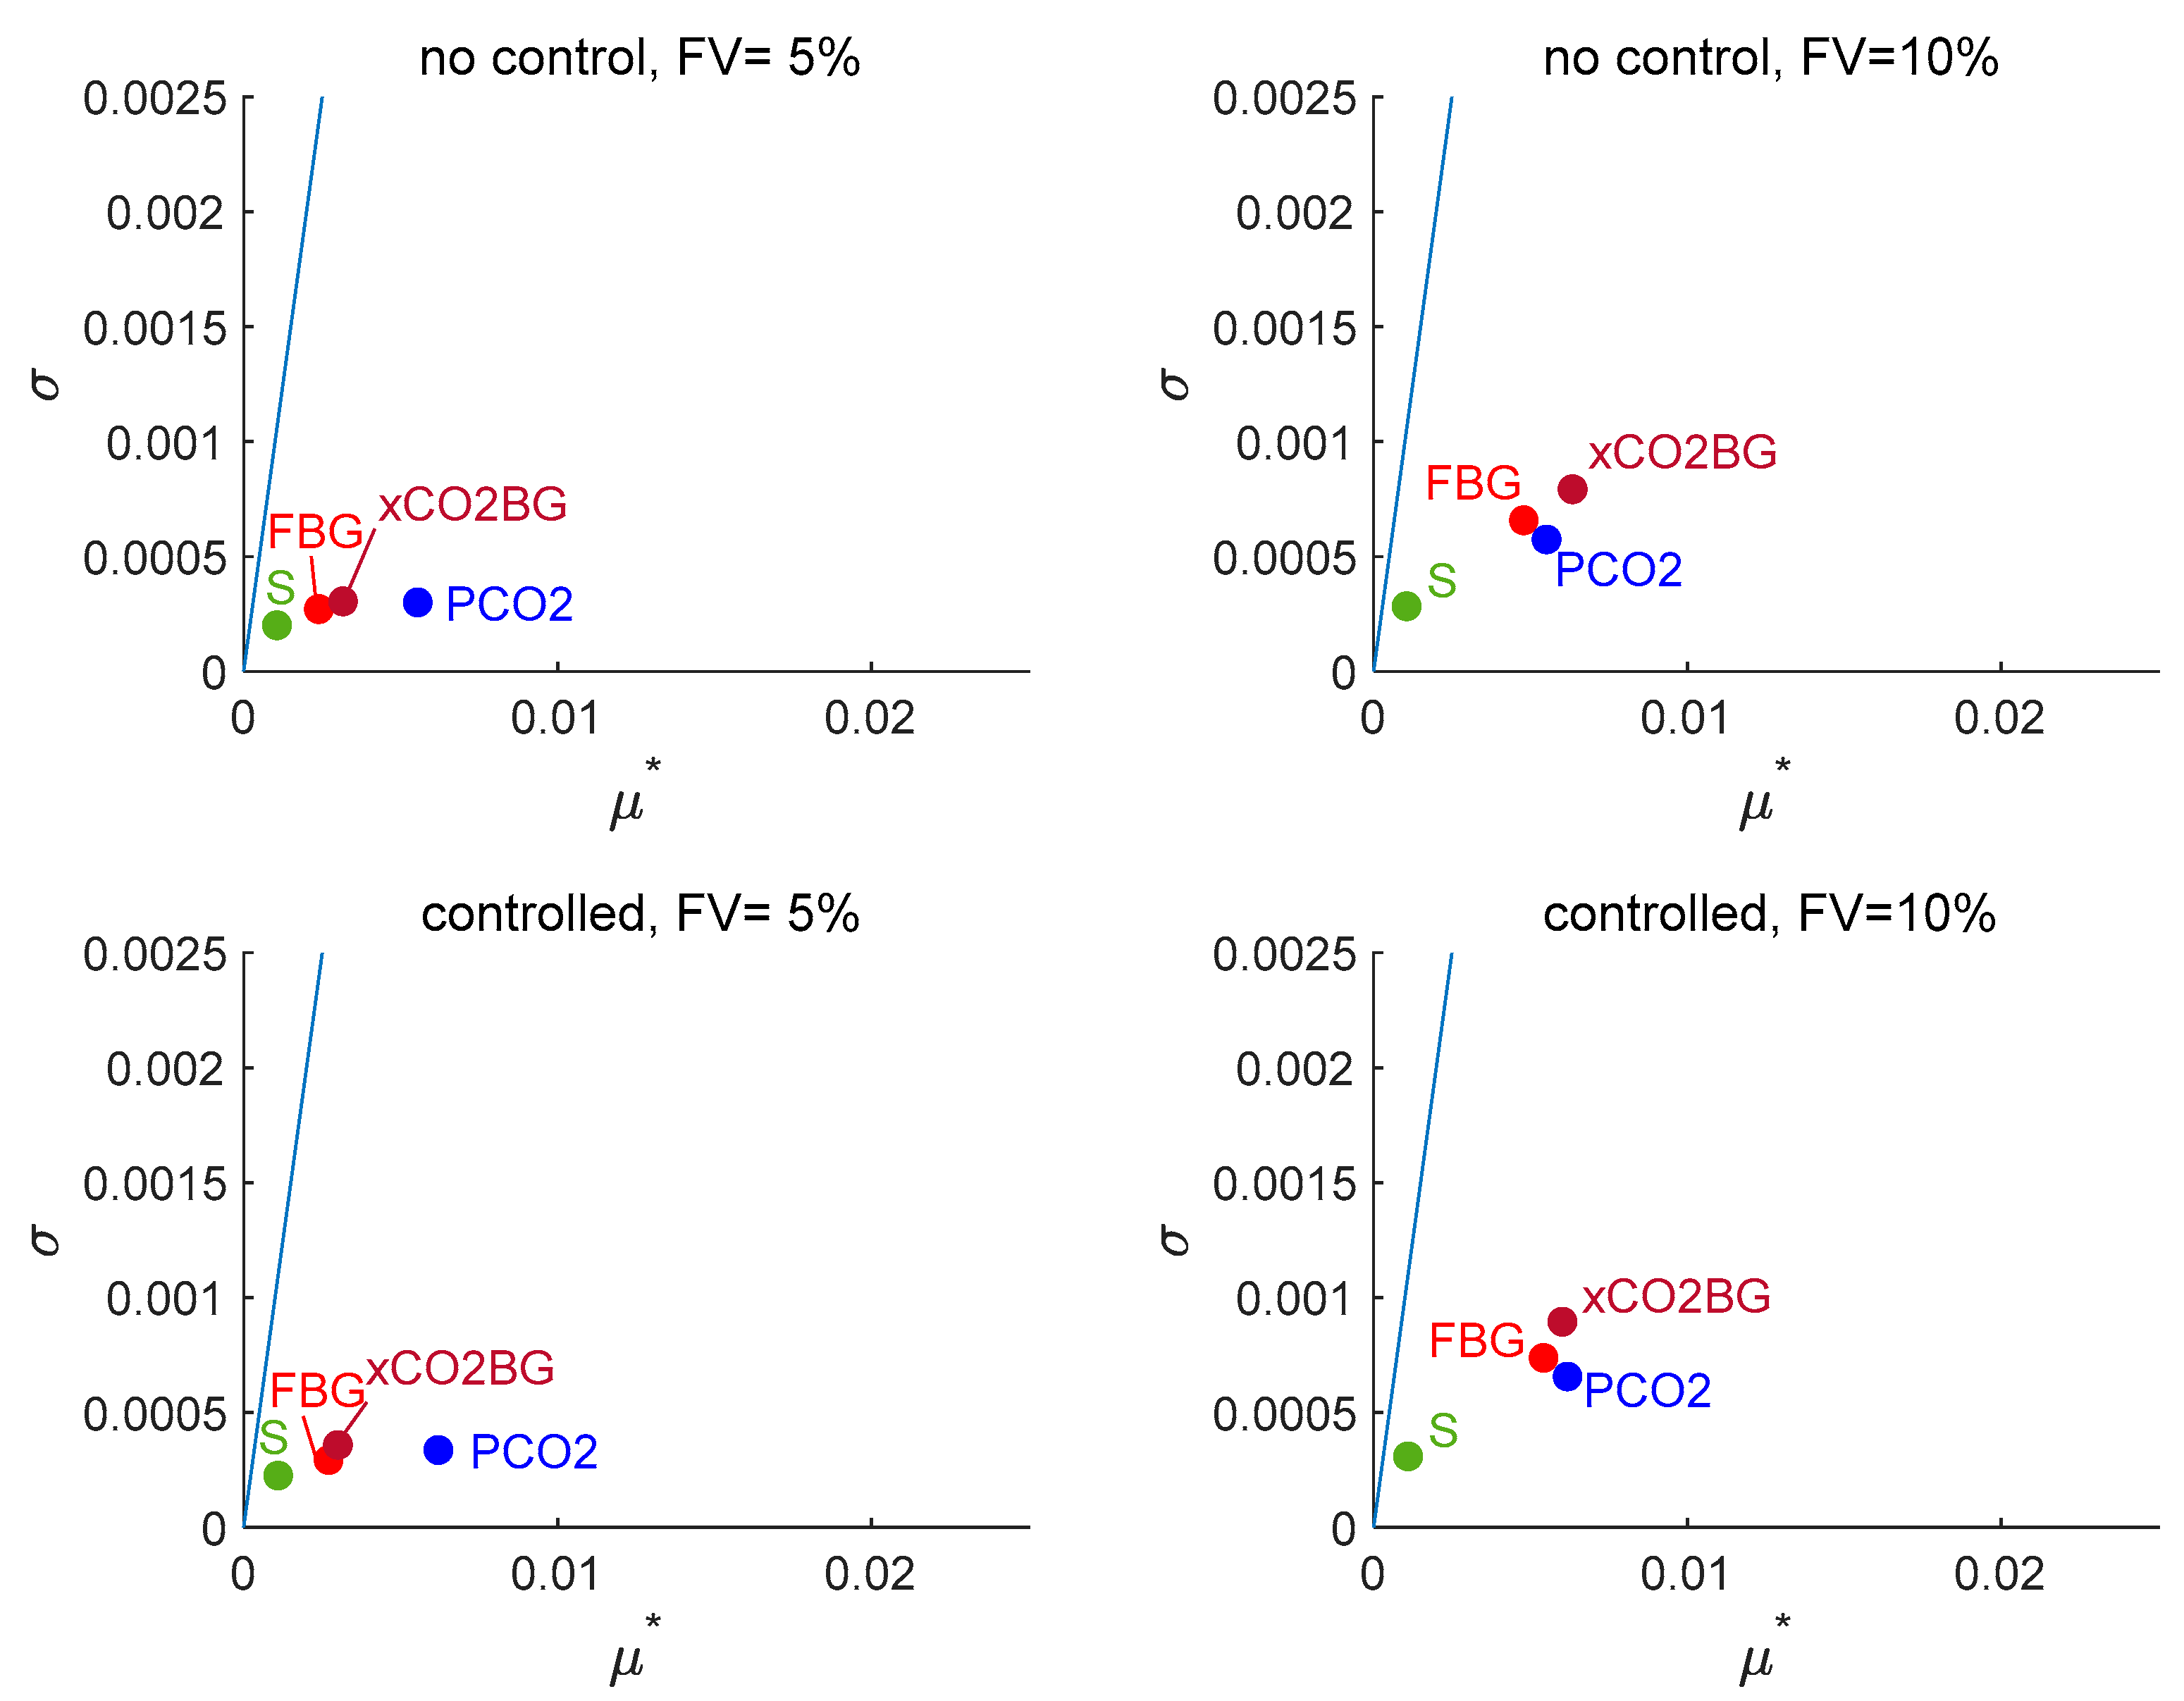
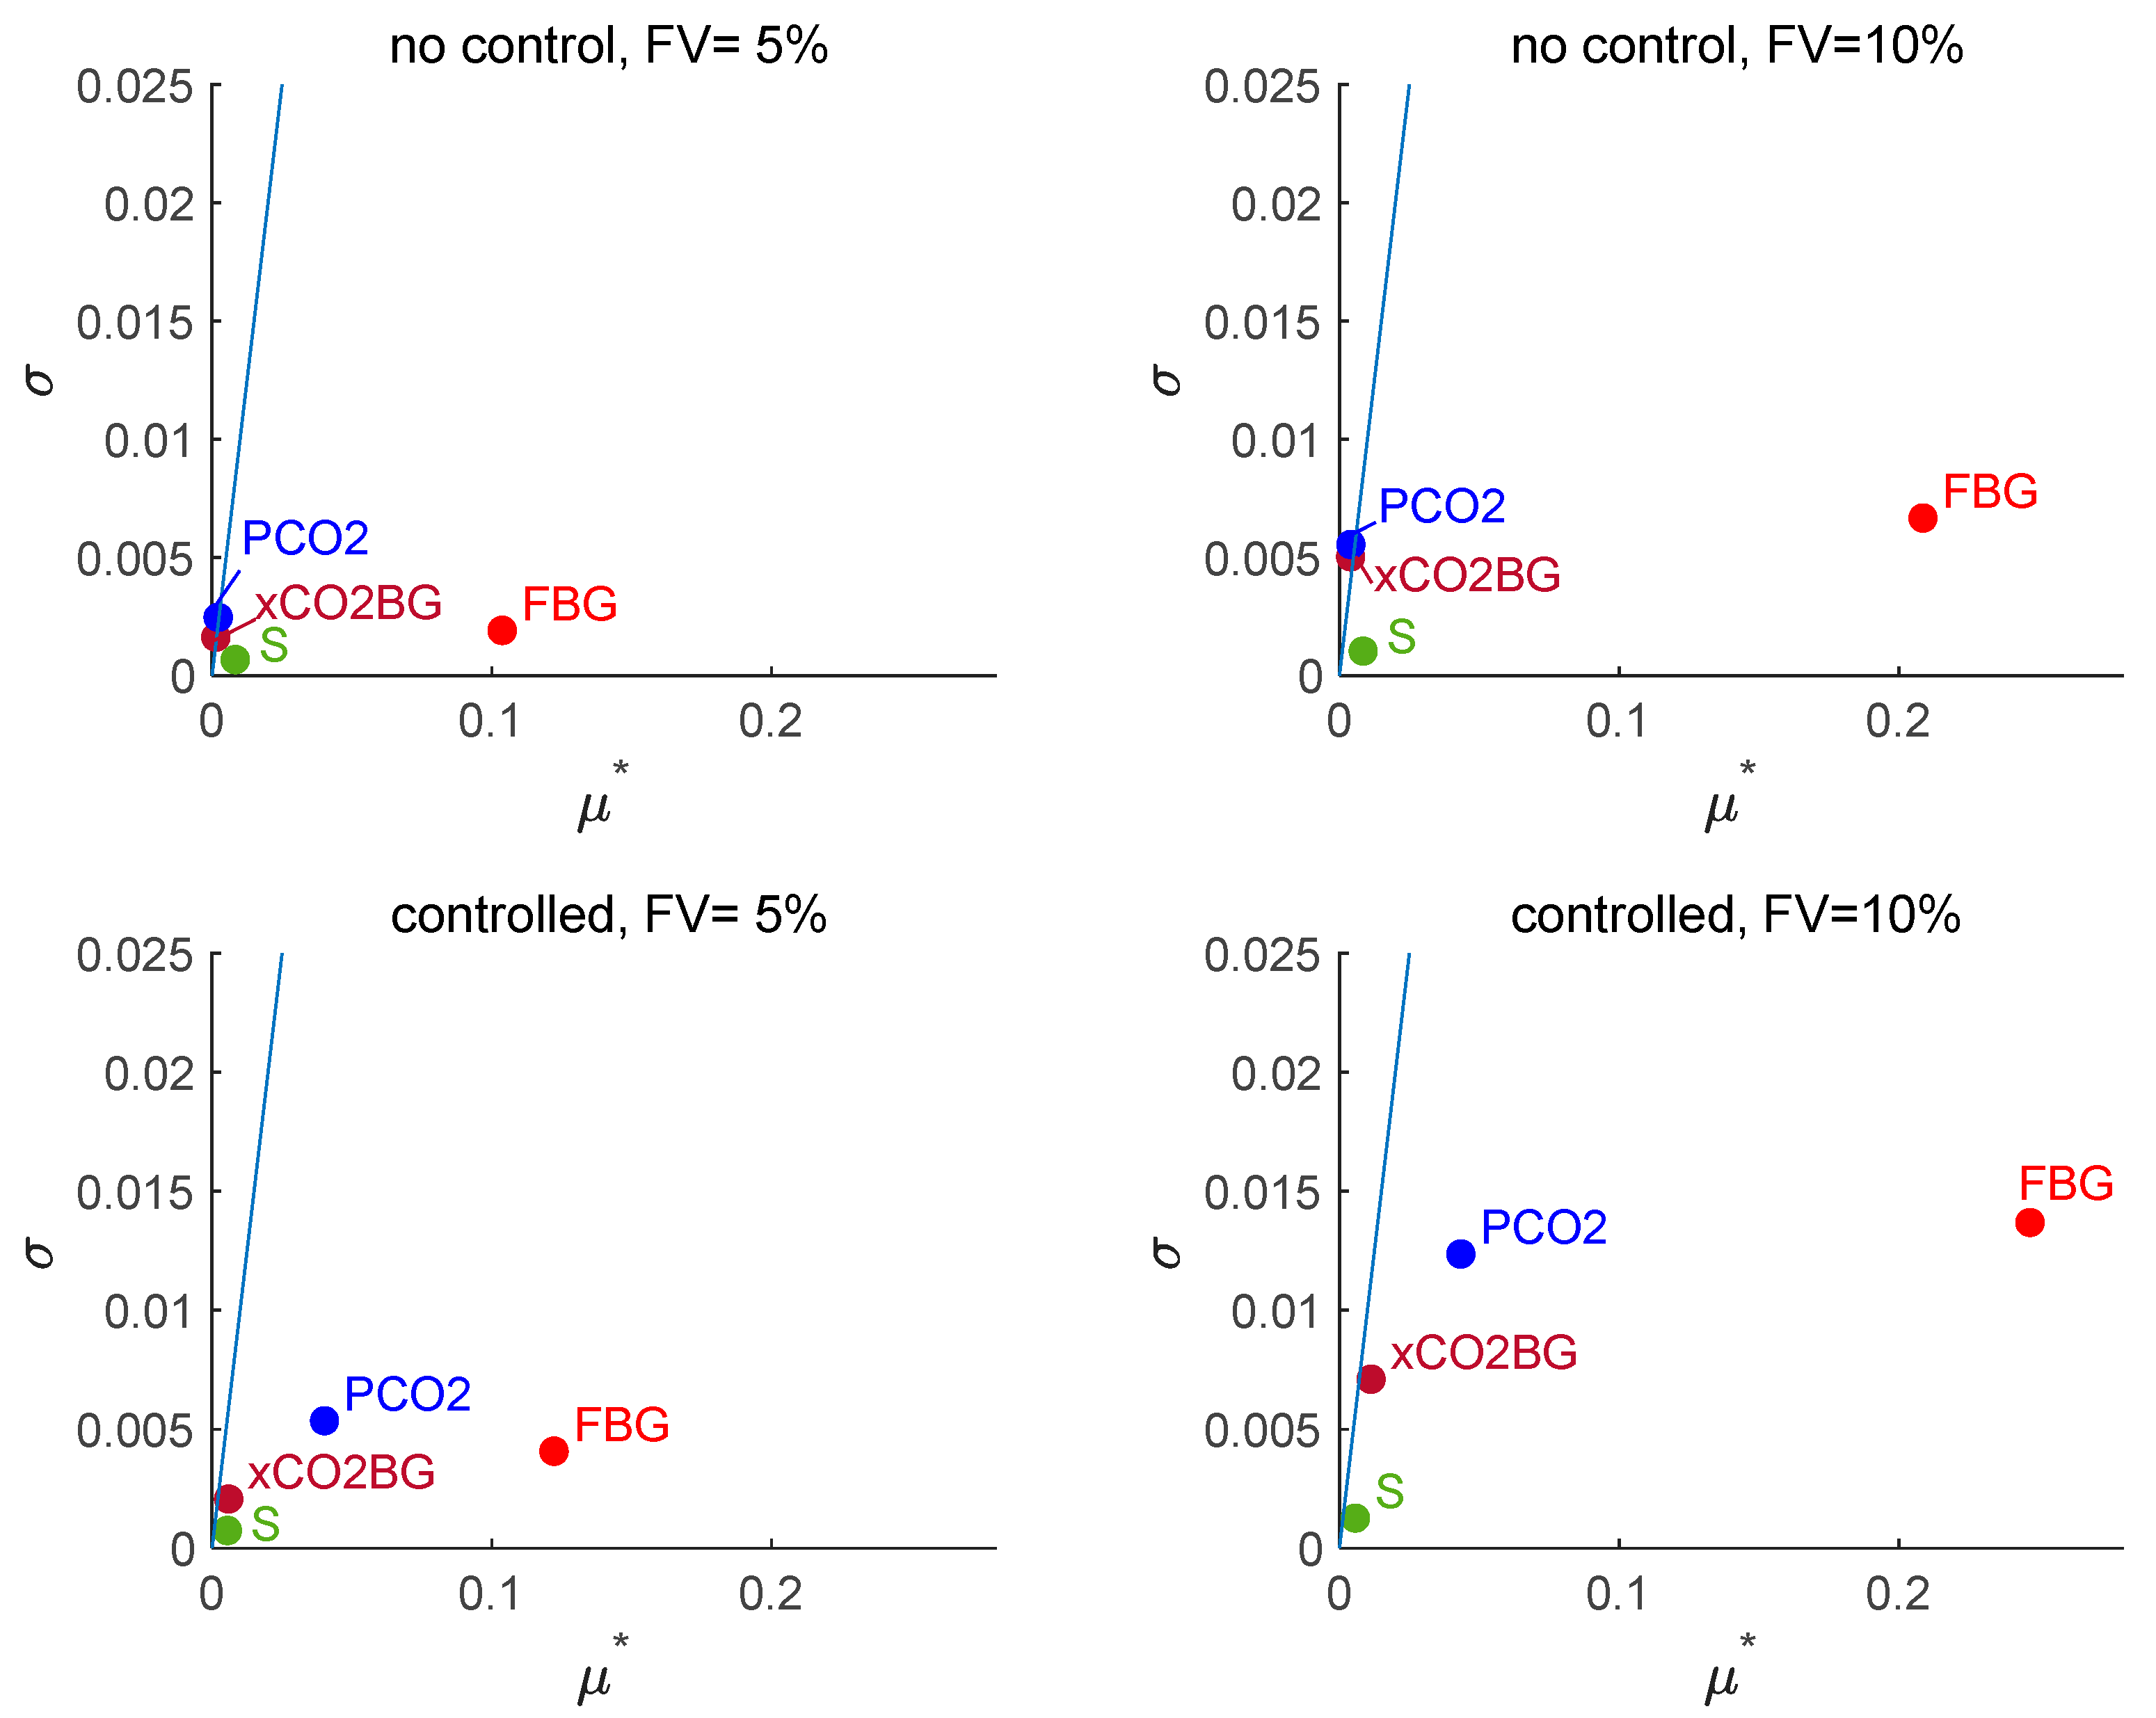
The Morris sensitivity analysis provides three main indices: the mean of elementary effects (μ), the mean of the absolute values of the elementary effects (μ*), and the standard deviation of the elementary effects (σ). The μ* index is usually used over μ, as it avoids the cancellation between positive and negative effects and indicates, on average, how much the input changes the output. The σ index measures the nonlinearity, i.e., the interaction between effects; low σ values indicate that the effect is linear or additive; high σ values indicate interaction and nonlinearity. Parameters with low values of μ* and σ are unimportant. A diagonal (σ = μ*) is also included in the figures to determine whether the effects tend to be predominantly linear (σ << μ*) or nonlinear (σ >> μ*).
Figure 5 shows the analysis for the response of the biomethane product flow (FBM). Consider the non-controlled scenario at a feed variability FV = ±5. The effects of the membrane parameter uncertainty (given by factors PCO2 and S) are negligible because of their low μ* and σ values. The flow of biogas FBG is the dominant factor, which is strong and imposes a linear effect; the biogas composition xCO2BG is lower, but not negligible. Comparing this situation with that obtained at FV = ±10%, we can see that μ* has almost doubled and that σ has increased notably, which suggests non-linear effects and interaction with other variables. The situation is similar to that in the controlled scenario.
Figure 6 shows the analysis for the response of the off-gas product flow (FOG). Thanks to the normalization of this variable, we observed similar index values. The result of the analysis is very similar to that obtained for the evaluation performed for the FBM variable, except that now the effect of the CO2 fraction in the feed becomes somewhat more important than the biogas flow.
Figure 7 shows the analysis for the response of the methane fraction in the biomethane product (xCH4BM) for a non-controlled scenario. This response was not analyzed in the controlled scenario because it was set to a fixed value. We can see that for low feed variability (FV = ±5), the membrane parameter uncertainty predominates over the feed variability, as the permeance factor (PCO2) has the highest μ* value; however, the variability of the selectivity with respect to the value expected for each permeance is not significant. Nevertheless, for FV = ±10, the effect of the flow of biogas becomes practically as important as that of the membrane permeance. The smaller μ* values currently observed in the analysis of the composition response compared to those observed for the flow responses do not imply less significant effects. Note that now they represent relative composition variations with respect to a composition fraction value close to unity.
Figure 8 shows the analysis for the response of the CO2 fraction in the off-gas stream (xCO2OG). The results for the non-controlled and controlled scenarios are very similar. As in the case of the xCH4BM response, at FV = ±5%, the effect of the CO2 membrane permeance is the most important. Similarly, at the higher feed variability of FV = ±10%, feed variability becomes as important as membrane permeance uncertainty.
Figure 9 shows the analysis for the EDC response. In all situations, the uncertainty of biogas flow is the most critical factor (higher μ*), doubling when the feed variability is doubled. For the controlled system, the non-linear effects are higher (higher σ).
An additional study was performed on the ratio of the mechanical power to the flow of processed biogas (EDC/FBG). In Figure 10, we can see that, compared with the EDC analysis, a large part of the effect of the variability due to FBG has been cancelled, and the μ* values are smaller. Thus, we can observe different behaviors for the non-controlled and the controlled scenarios. In the non-controlled scenario, the effects of all factors are similar; however, for the controlled scenario, the impact of the permeance of CO2 is higher than the effect of FBG at FV = ±5% but it takes on a comparable value at FV = ±10%.
Morris analysis results for the thermal load removed in the compressor (HDX and HDX/FBG) were virtually identical to those for the mechanical power (Supplementary Materials, Figures S1 and S2). This is logical, since both variables depend almost exclusively on the flow through the compression system.

3.2.2. Sobol’ Indices for Each Factor Across the System Responses

Sobol’ indices decompose the output variance into contributions from each input (first-order) and from each input plus all its interactions, assuming independent factors [2]. They are useful for quantifying the importance of each factor in response to uncertainty.
Table 5 shows the first-order (Si) and total (ST) Sobol’ indices for each factor across the different responses. The first-order index measures the main additive effect of a factor on the response, ignoring interactions. The total index also includes all the interactions in which the factor participates. These indices satisfy 0 ≤ Si ≤ ST ≤ 1, and the gap ST − Si indicates the importance of the contribution of the factor through interaction with other variables.
Across all the analyses, the modified leave-one-out error (LOO) was smaller than 0.05, which was considered acceptable; therefore, no increase in the sample size was required.
In general, the Sobol’ results are consistent with the trends previously obtained using the Morris method. For the product flows (FBM and FOG), the sum of the total index of the flow of biogas (FBG) and the total index of the composition (xCO2BG) is close to unity across all feed-variability levels and scenarios analyzed. The relative importance of the factors is in agreement with the ranking given by the Morris μ*-values. For the product composition responses, the Sobol’ indices reflect the great importance of the membrane permeance factor (PCO2). In the non-controlled scenario, the total Sobol’ index accounts for 79.7% of the variance of the xCH4BM response at FV = 5%, decreasing to 50.1% at FV = 10%. For the xCO2OG response, the values are 64.9% and 32.7%, respectively. In the controlled scenario, xCH4BM shows no uncertainty (controlled variable), while xCO2OG displays total Sobol’ index values of 68.6% and 36.8% at FV = 5% and FV = 10%, respectively. The shift observed in the total Sobol’ indices of PCO2 in the xCO2OG response clearly illustrates how controlling a variable at a point in the process can increase the importance of a factor to a response at a different point in the process.
For the EDC and HDX responses, the total Sobol’ indices for the biogas flow (FBG) exceed 0.89 in all cases, clearly indicating that this is the predominant factor.
Across all the cases studied, the small differences between the first-order and total indices indicate weak factor interactions, corroborating the low non-linearity observed in the prior Morris analysis.

3.3. Determination of Tolerance Limits of the Responses

Table 6 shows the uncertainty analysis results to obtain the lower tolerance limit (LTL) and the upper tolerance limit (UTL) values for a 95% probability content and a 99% confidence level, respectively. The approximate form of each distribution can be represented, but for the sake of conciseness, two coefficients, the relative lower-bound gap (RLG) and the relative upper-bound gap (RUG), were created as the relative gaps between the lower and upper tolerance limits and the mean value. The coefficient of variation (CV), defined as the ratio of the standard deviation to the mean, was also included.
The mean values obtained for all variables did not differ significantly from those obtained for the reference factors (Table 4). The coefficients RLG and RUG displayed similar values for most responses, implying high symmetry for most distributions. For these responses, we can see that the CV is approximately half that of the relative gap values because, for a normal distribution, twice the CV is approximately 95% of the probability content. The highest difference in RLG and RUG was found for the xCH4BM response under the non-controlled scenario, with RLG representing 59% of the total tolerance gap. This can be explained by the fact that the values of this variable are near an upper physical bound, and the left tail of the distribution predominates. The values of the relative tolerance gaps were much higher for the flows (FBM and FOG) and for the utility variables related to them through the recirculated flow (EDC and HDX). For these responses, doubling the feed variability approximately doubles the gap value. The tolerance gap and CV were smaller for the composition-related variables (xCH4BM and xCO2OG), and the impact of doubling the feed variability on the tolerance gap was smaller.
The controlled and non-controlled scenarios yielded similar results for many variables, but differences were observed in some specific responses. The tolerance interval was null for the controlled variable xCH4BM, as it is a system property, but this fact did not substantially increase the tolerance gap for the xCO2OG response. However, the tolerance gaps for the EDC/FBG and HDX/FBG ratios are much higher for the controlled scenario because of the necessary regulation effort of the pressure to achieve the set point of methane composition in the biomethane product.

4. Discussion

This paper shows the feasibility of conducting a sensitivity and uncertainty analysis of processes by combining free tools such as the COCO simulator and R. However, it is still necessary to model some specific units using programming software like MATLAB or other free software. This analysis can be largely automated using parameterization and reading from input–output files.
Table 7 presents a comparison with recent studies that applied Morris analysis in chemical engineering. All these works highlight the usefulness of Morris analysis as a screening method to rank the importance of the factors. In this way, factors with low influence on the uncertainty of a response can be potentially fixed without affecting the prediction.
However, Morris analysis has limitations, as it does not provide variance-based quantitative indices. Other global sensitivity methods, like the Sobol’ index or eFAST, are more robust and can be used in a second phase on a subset of the influential variables to obtain quantitative sensitivity indices and evaluate interactions. Given the low nonlinearity indicated by the Morris analysis, the PCE method with LARS was able to obtain Sobol’ sensitivity indices with a small number of model evaluations. Based on the low μ*-value obtained in all cases studied for the selectivity-related parameter S, this parameter could, in principle, have been discarded in the quantitative analysis. However, since the PCE method requires relatively few evaluations when the number of factors is small, all four uncertainty factors were retained for comparison with the Morris analysis. The resulting Sobol’ indices were consistent with the trends identified in the Morris analysis, thus supporting the correctness of the results obtained by both methods.
In our case, we have seen that the effects of feed variability are most influential in the uncertainty of product flows and power and heat demand responses. However, for product composition, the uncertainty of membrane permeance can be most influential when feed variability is under ±10% (total Sobol’ indices greater than 0.64). The important effect observed regarding the flow and composition variability of the feed agrees with what has been determined in other studies using parameter variation in a biogas processing plant [21].
The uncertainty analysis yielded lower and upper tolerance limits to cover a probability content of 95%. A study about the life cycle assessment of biomethane production recommends its use to test the robustness of the results [40]. According to reference [41], simplified models are likely to overpredict performance when compared to experimental results; therefore, the uncertainty quantification can help quantify the estimates of uncertain designs. One crucial observation must be considered when applying the uncertainty analysis procedure to a process. For simplicity, in the case study, we have considered that the variability of feed flow rates is independent of the composition variability, which may not be the case in some real-life situations. As Porter [26] discussed, when there is a correlation between variables, the joint distribution should be propagated, since otherwise, the uncertainty is overpredicted.
In our case, the product stream flows showed high variability. As can be seen in Table 6, for feed variability FV = 5%, the total uncertainty relative gap (RLG+RUG) for product streams was around 16–18%, while for FV = 10%, it was 29–35%. For the compressor at FV = 5%, the total relative gaps for energy demand EDC and heat duty HDX were 10–14%, and for FV = 10%, it was around 20–25%, with the higher values corresponding to the controlled-system scenario. For the composition of the product stream, smaller, but still significant relative gaps were obtained. This explicit uncertainty quantification can be used in design choices, e.g., sizing upstream gas-holding tanks or the safe nominal rate of the compressor. Even modifications of the process, like modifying membrane areas or system pressures, may be necessary when tolerance limits are close to undesirable values.
For the case study, different uncertainty and sensitivity characteristics were obtained when comparing the controlled and non-controlled scenarios of the same system. Similar shifts are expected for changes in configuration or the relative size of the different process units. Additionally, note that this study was conducted without considering a seasonal variation of feed variability. As a result, the uncertainty ranges obtained provide conservative estimates for process design.
This encourages us to focus future studies on understanding how the process configuration, control strategies, and seasonality influence the uncertainty of the outputs.
Table 7. Comparison of this study with others in which the Morris analysis has recently been used in the context of chemical engineering.
ReferenceApplication DomainKNMain Outcomes
This workBiogas upgrading (membrane separation, COCO simulator)4150Relative impact of feed and membrane parameter uncertainties studied on product streams and process utilities
Bhati et al. [42]Perovskite
manufacturing
12-Material factors contribute the most to the cost of all manufacturing capacities
Sangregorio-Soto et al. [43]Continuous microalgae culture9-Practical use of combining Morris assessment and Sobol’ index using several dynamic models to study the biomass response
Kuncheekanna et al. [44]CO2 capture
by absorption
(testing of sensitivity methods)
81000Sobol’ indices share ranking capabilities similar to those of the Borgonovo and Morris methods
Barahmand et al. [45]Anaerobic digestion (ADM1-like bioprocess model)48 -Impact of biological parameters uncertainties on methane yield
Öner et al. [46]Pharmaceutical
crystallization
10140Morris analysis identified the most influential parameter in process performance
Sepúlveda et al. [47]Mineral processing
(process improvement)
12-Global sensitivity analysis is useful to study separation circuits; Morris method is recommended because of its low computation requirements
Mery et al. [48]Water treatment
life cycle assessment (LCA)
18-Morris assessment and LCA are helpful in engineering design choices
Ruano et al. [49] Wastewater treatment plant
(fuzzy control)
171000Improved method to determine the optimal number of repetitions of the Morris method

5. Conclusions

This work demonstrates that combining free tools such as COCO, R, and UQLab allows for a feasible framework for conducting uncertainty and sensitivity analyses of chemical processes, while additional modeling with MATLAB or alternative free software may still be necessary. Morris analysis proved to be a valuable screening method for ranking factor importance, but it is advisable to complement it with a quantitative assessment using the most relevant factors. The use of sparse Polynomial Chaos Expansion with LARS provided Sobol’ indices that were consistent with Morris analysis results and confirmed the total predominance of feed variability. The study confirmed that feed variability has the greatest influence on the uncertainty of product flows and energy demand, whereas product composition is more affected by membrane permeance variability, especially when feed fluctuations are limited. These insights and tolerance limits derived from the uncertainty analysis can be directly applied to process design.
Overall, quantifying uncertainty provides valuable guidelines for design and operation. Future work should be directed at exploring the effects of the process configuration and seasonality, looking to ensure robustness against variability.

Supplementary Materials

The following supporting information can be downloaded at: https://www.mdpi.com/article/10.3390/chemengineering9050094/s1, Table S1: Morris analysis by factor for each response under the controlled (C) and non-controlled (NC) scenarios (30 trajectories, 8 levels, and grid jump = 4). Table S2: Morris analysis by factor for each response for the non-controlled (NC) scenario at FV = 10% (30 trajectories, 8 levels, and grid jump = 4); Figure S1: Morris results for the heat duty demand of the heat exchanger of the compressor system (HDX) for the non-controlled and controlled scenarios at two levels of feed variability (FV); Figure S2: Morris results of the ratio of the heat duty demand of the heat exchanger to biogas flow (HDX/FBG) for the non-controlled and controlled scenarios at two levels of feed variability (FV).

Author Contributions

Conceptualization, J.M.G.-Z.; methodology, J.M.G.-Z. and A.S.-M.; software, J.M.G.-Z.; validation, J.M.G.-Z. and A.S.-M.; formal analysis, J.M.G.-Z. and A.S.-M.; investigation, J.M.G.-Z.; resources, J.M.G.-Z. and A.S.-M.; data curation, J.M.G.-Z. and A.S.-M.; writing—original draft preparation, J.M.G.-Z. and A.S.-M.; writing—review and editing, J.M.G.-Z. and A.S.-M.; visualization, J.M.G.-Z.; supervision, J.M.G.-Z. All authors have read and agreed to the published version of the manuscript.

Funding

This research received no external funding.

Data Availability Statement

The original data simulated in the study are openly available in Zenodo at https://zenodo.org/records/16084094 (accessed on 20 August 2025).

Acknowledgments

The authors gratefully acknowledge AmsterCHEM for providing access to the COCO simulator 3.9.0.7. The authors also acknowledge the R Core Team for developing R 4.5.1. and the developers of the sensitivity R package 1.30.1. In addition, we acknowledge the developers of UQLab 2.1. and its Polynomial Chaos Expansion package. While preparing this manuscript, the authors used Grammarly 1.2.176 to assist in proofreading and improving the manuscript’s clarity. The authors have reviewed and edited the output and take full responsibility for the content of this publication.

Conflicts of Interest

The authors declare no conflicts of interest.

Abbreviations

The following abbreviations are used in this manuscript:
CAPEComputer Assisted Process Engineering
COCOCAPE-OPEN to CAPE-OPEN Compliant Steady-State Simulator Environment
COFECAPE-OPEN Flowsheet Environment
FVFeed Variability
LTLLower Tolerance Limit
RLGRelative Lower-Bound Gap
Sc.Scenario
RUGRelative Upper-Bound Gap
UTLUpper Tolerance Limit

Appendix A

This appendix shows the equations and solution procedure for the user unit used to model the membrane stages of the process.
Figure A1 represents a differential membrane element. According to it, the balance equation of a component i in the feed chamber is given by Equation (A1):
F i = F i + d F i + J i d A
where Fi is the flow of component i in the feed chamber, and Ji is the permeate flux.
Figure A1. Component flows in a differential element of the gas separation membrane.
Chemengineering 09 00094 g0a1
The permeate flux depends on the permeance of the component in the membrane, pmci, and the difference in partial pressure between the feed and permeate chambers (Equation (A2)):
J i = p m c i · P · y i P p · y p i
The molar fraction in the feed of each component is related to the flows circulating in the feed chamber (Equation (A3)). The permeate fraction of the component crossing the element of area is obtained from considering all permeate flows and neglecting mixing effects in the chamber (Equation (A4)).
y i = F i k F k
y p i = J i k J k
Equations (A3) and (A4), considered for all components, constitute equations that permit solving feed and permeate fractions. Using Equation (A2), the component fluxes can be expressed as a function of the flows circulating along the feed chamber. Therefore, from Equation (A1) and the knowledge of the permeate fluxes, the resulting set of ordinary differential equations (Equation (A5)) can be integrated along the whole area of the module using the input feed composition (Fi,0) as a contour condition (Equation (A6)).
d F i d A = J i F
F i 0 = F i , 0
In addition to the CH4/CO2 separation considered in this work, the membrane model was also validated for flue gas separation (CO2/N2) using a single-step process with a permeate vacuum [50]. The predicted permeate concentration showed a relative error of only 0.7% compared to the reported composition.

References

  1. Soize, C. Uncertainty Quantification, 1st ed.; Springer: Cham, Switzerland, 2017; Volume 23. [Google Scholar] [CrossRef]
  2. Saltelli, A.; Tarantola, S.; Campolongo, F.; Ratto, M. Global Sensitivity Analysis for Importance Assessment. In Sensitivity Analysis in Practice; Wiley: Hoboken, NJ, USA, 2004; pp. 31–61. [Google Scholar] [CrossRef]
  3. Al-Douri, A.; Kazantzi, V.; Currie-Gregg, N.; El-Halwagi, M.M. Integrating Uncertainty Quantification in Reliability, Availability, and Maintainability (RAM) Analysis in the Conceptual and Preliminary Stages of Chemical Process Design. Chem. Eng. Res. Des. 2021, 167, 281–291. [Google Scholar] [CrossRef]
  4. Barahmand, Z.; Samarakoon, G. Sensitivity Analysis and Anaerobic Digestion Modeling: A Scoping Review. Fermentation 2022, 8, 624. [Google Scholar] [CrossRef]
  5. Li, Q.; Wan, H.; Zhao, Z.; Liu, F. Robust Batch-to-Batch Optimization with Global Sensitivity Analysis for Microbial Fermentation Processes under Model-Plant Mismatch. Chem. Eng. Sci. 2025, 301, 120658. [Google Scholar] [CrossRef]
  6. Yliruka, M.; Moret, S.; Shah, N. Detail or Uncertainty? Applying Global Sensitivity Analysis to Strike a Balance in Energy System Models. Comput. Chem. Eng. 2023, 177, 108287. [Google Scholar] [CrossRef]
  7. Oyegoke, T. COCO, a Process Simulator: Methane Oxidation Simulation & Its Agreement with Commercial Simulator’s Predictions. Chem. Prod. Process Model. 2023, 18, 995–1004. [Google Scholar] [CrossRef]
  8. Amsterchem COCO. Cape Open to Cape Open Simulation Environment. Available online: https://www.amsterchem.com/coco.html (accessed on 1 May 2025).
  9. Andreasen, A.; van Baten, J. Techno-Economic Analysis and Optimization of Gray and Green Methanol Synthesis Using Flowsheet Automation and Surrogate Modeling. Energy Fuels 2025, 39, 3359–3374. [Google Scholar] [CrossRef]
  10. Krone, D.; Esche, E.; Skiborowski, M.; Repke, J.U. Optimization-Based Process Synthesis by Phenomena-Based Building Blocks and an MINLP Framework Featuring Structural Screening. Comput. Chem. Eng. 2025, 194, 108955. [Google Scholar] [CrossRef]
  11. Alqaheem, Y.; Alobaid, M. Development of a Membrane Process in CAPE-OPEN to CAPE-OPEN (COCO) Simulator for Carbon Dioxide Separation. Results Eng. 2024, 22, 102239. [Google Scholar] [CrossRef]
  12. Bisotti, F.; Gilardi, M.; Berglihn, O.T.; Tschentscher, R.; Hansen, L.D.; Horn, S.J.; Várnai, A.; Wittgens, B. From Laboratory Scale to Innovative Spruce-Based Biorefinery. Note I: Conceptual Process Design and Simulation. Comput. Aided Chem. Eng. 2024, 53, 2449–2454. [Google Scholar] [CrossRef]
  13. Tangsathitkulchai, C.; Punsuwan, N.; Weerachanchai, P. Simulation of Batch Slow Pyrolysis of Biomass Materials Using the Process-Flow-Diagram COCO Simulator. Processes 2019, 7, 775. [Google Scholar] [CrossRef]
  14. Iarikov, D.D.; Ted Oyama, S. Review of CO2/CH4 Separation Membranes. Membr. Sci. Technol. 2011, 14, 91–115. [Google Scholar] [CrossRef]
  15. Tomczak, W.; Gryta, M.; Daniluk, M.; Żak, S. Biogas Upgrading Using a Single-Membrane System: A Review. Membranes 2024, 14, 80. [Google Scholar] [CrossRef]
  16. Janusz-Cygan, A.; Jaschik, J.; Tańczyk, M. Upgrading Biogas from Small Agricultural Sources into Biomethane by Membrane Separation. Membranes 2021, 11, 938. [Google Scholar] [CrossRef]
  17. Vrbová, V.; Ciahotný, K. Upgrading Biogas to Biomethane Using Membrane Separation. Energy Fuels 2017, 31, 9393–9401. [Google Scholar] [CrossRef]
  18. Kim, S.J.; Song, Y.; Binns, M.; Yeo, J.G.; Kim, J.K. Process-Integrated Optimization and Techno-Economic Analysis of Membrane System for Biogas Upgrading: Effect of Membrane Performance from an Economic Perspective. J. Membr. Sci. 2025, 713, 123286. [Google Scholar] [CrossRef]
  19. Azadi Tabar, M.; Maghsoudi, H.; Denayer, J.F.M. Hybrid Membrane-Vacuum Pressure Swing Adsorption: Low-Cost Technology for Simultaneous Biomethane and Carbon Dioxide Production from Biogas. Bioresour. Technol. 2025, 422, 132241. [Google Scholar] [CrossRef] [PubMed]
  20. Abejón, R.; Casado-Coterillo, C.; Garea, A. Techno-Economic Optimization of Multistage Membrane Processes with Innovative Hollow Fiber Modules for the Production of High-Purity CO2 and CH4 from Different Sources. Ind. Eng. Chem. Res. 2022, 61, 8149–8165. [Google Scholar] [CrossRef] [PubMed]
  21. Deng, L.; Hägg, M.B. Techno-Economic Evaluation of Biogas Upgrading Process Using CO2 Facilitated Transport Membrane. Int. J. Greenh. Gas Control 2010, 4, 638–646. [Google Scholar] [CrossRef]
  22. Zito, P.F.; Brunetti, A.; Barbieri, G. Multi-Step Membrane Process for Biogas Upgrading. J. Membr. Sci. 2022, 652, 120454. [Google Scholar] [CrossRef]
  23. Ungerank, M.; Baumgarten, G.; Priske, M.; Roegl, H. Process for Separation of Gases 2012. Patent WO 2012/00727, 5 January 2012. [Google Scholar]
  24. Scholz, M. Membrane Based Biogas Upgrading Processes. Ph.D. Thesis, Rheinisch-Westfälische Technische Hochschule Aachen University, Aachen, Germany, 2013. [Google Scholar]
  25. Böttcher, N.; Taron, J.; Kolditz, O.; Liedl, R.; Park, C.-H. Comparison of Equations of State for Carbon Dioxide for Numerical Simulations. In Proceedings of the ModelCARE2011, Leipzig, Germany, 18–22 September 2011; IAHS Press: Oxfordshire, UK, 2011; Volume 355. [Google Scholar]
  26. Guerrero Piña, J.C.; Alpízar, D.; Murillo, P.; Carpio-Chaves, M.; Pereira-Reyes, R.; Vega-Baudrit, J.; Villarreal, C. Advances in Mixed-Matrix Membranes for Biorefining of Biogas from Anaerobic Digestion. Front. Chem. 2024, 12, 1393696. [Google Scholar] [CrossRef]
  27. Weiland, P. Biogas Production: Current State and Perspectives. Appl. Microbiol. Biotechnol. 2010, 85, 849–860. [Google Scholar] [CrossRef]
  28. Petersson, A.; Wellinger, A. Biogas Upgrading Technologies-Developments and Innovations. Technical Report in IEA Bioenergy Task 37-Energy from Biogas and Landfill. Available online: https://task37.ieabioenergy.com/technical-reports/ (accessed on 20 August 2025).
  29. Li, Y.; Chen, D.; He, X. Preparation and Characterization of Polyvinylalcohol/Polysulfone Composite Membranes for Enhanced CO2/N2 Separation. Polymers 2023, 15, 124. [Google Scholar] [CrossRef] [PubMed]
  30. Kadirkhan, F.; Sean, G.P.; Ismail, A.F.; Wan Mustapa, W.N.F.; Halim, M.H.M.; Kian, S.W.; Yean, Y.S. CO2 Plasticization Resistance Membrane for Natural Gas Sweetening Process: Defining Optimum Operating Conditions for Stable Operation. Polymers 2022, 14, 4537. [Google Scholar] [CrossRef]
  31. Haider, S.; Lie, J.A.; Lindbråthen, A.; Hägg, M.B. Pilot–Scale Production of Carbon Hollow Fiber Membranes from Regenerated Cellulose Precursor-Part II: Carbonization Procedure. Membranes 2018, 8, 97. [Google Scholar] [CrossRef]
  32. Adewole, J.K.; Ahmad, A.L.; Ismail, S.; Leo, C.P. Current Challenges in Membrane Separation of CO2 from Natural Gas: A Review. Int. J. Greenh. Gas Control 2013, 17, 46–65. [Google Scholar] [CrossRef]
  33. Ansaloni, L.; Minelli, M.; Baschetti, M.G.; Sarti, G.C. Effects of Thermal Treatment and Physical Aging on the Gas Transport Properties in Matrimid®. Oil Gas Sci. Technol.-Rev. IFP Energ. Nouv. 2015, 70, 367–379. [Google Scholar] [CrossRef]
  34. Robeson, L.M. The Upper Bound Revisited. J. Membr. Sci. 2008, 320, 390–400. [Google Scholar] [CrossRef]
  35. Iooss, B.; Da Veiga, S.; Janon, A.; Pujol, G. Sensitivity: Global Sensitivity Analysis of Model Outputs and Importance Measures, R Package Version 1.30.1; R Foundation for Statistical Computing; R Core Team: Vienna, Austria, 2024. [Google Scholar] [CrossRef]
  36. Marelli, S.; Sudret, B. UQLab: A Framework for Uncertainty Quantification in MATLAB. In Proceedings of the 2nd International Conference on Vulnerability and Risk Analysis and Management (ICVRAM 2014), Liverpool, UK, 13–16 July 2014; pp. 2554–2563. [Google Scholar] [CrossRef]
  37. Marelli, S.; Sudret, B. UQLab User Manual—Polynomial Chaos Expansions; Report UQLab-V2.1-104, Chair of Risk, Safety and Uncertainty Quantification; ETH Zurich: Zurich, Switzerland, 2024; Available online: https://www.uqlab.com/pce-user-manual (accessed on 20 August 2025).
  38. Zhang, B.Y.; Ni, Y.Q. A Novel Sparse Polynomial Chaos Expansion Technique with High Adaptiveness for Surrogate Modelling. Appl. Math. Model. 2023, 121, 562–585. [Google Scholar] [CrossRef]
  39. Porter, N.W. Wilks’ Formula Applied to Computational Tools: A Practical Discussion and Verification. Ann. Nucl. Energy 2019, 133, 129–137. [Google Scholar] [CrossRef]
  40. Bhati, N.; Dyson, P.J.; Nazeeruddin, M.K.; Maréchal, F. Techno-Economic Analysis Framework for Perovskite Solar Module Production at Various Manufacturing Capacities. Renew. Energy 2026, 256, 123752. [Google Scholar] [CrossRef]
  41. Sangregorio-Soto, V.; Garzón-Castro, C.L.; Mazzanti, G. Input Significance Ranking of Microalgae Continuous Culture Models. J. Chem. Technol. Biotechnol. 2023, 98, 1608–1619. [Google Scholar] [CrossRef]
  42. Kuncheekanna, V.N.; Jakobsen, J.P. Exploring Global Uncertainty Quantification and Sensitivity Analysis Methodologies: CO2 Capture Absorber Model with MEA Solvent as a Test Case. Chem. Eng. Res. Des. 2023, 200, 107–133. [Google Scholar] [CrossRef]
  43. Barahmand, Z. Comprehensive Local Sensitivity Analysis of the ADM1-Based Anaerobic Digestion Process. In The WIT Transactions on Ecology and the Environment; WIT Press: Southampton, UK, 2022; Volume 258, pp. 235–246. [Google Scholar] [CrossRef]
  44. Öner, M.; Stocks, S.M.; Sin, G. Comprehensive Sensitivity Analysis and Process Risk Assessment of Large Scale Pharmaceutical Crystallization Processes. Comput. Chem. Eng. 2020, 135, 106746. [Google Scholar] [CrossRef]
  45. Sepúlveda, F.D.; Cisternas, L.A.; Gálvez, E.D. The Use of Global Sensitivity Analysis for Improving Processes: Applications to Mineral Processing. Comput. Chem. Eng. 2014, 66, 221–232. [Google Scholar] [CrossRef]
  46. Mery, Y.; Tiruta-Barna, L.; Benetto, E.; Baudin, I. An Integrated “Process Modelling-Life Cycle Assessment” Tool for the Assessment and Design of Water Treatment Processes. Int. J. Life Cycle Assess. 2013, 18, 1062–1070. [Google Scholar] [CrossRef]
  47. Ruano, M.V.; Ribes, J.; Seco, A.; Ferrer, J. An Improved Sampling Strategy Based on Trajectory Design for Application of the Morris Method to Systems with Many Input Factors. Environ. Model. Softw. 2012, 37, 103–109. [Google Scholar] [CrossRef]
  48. Florio, C.; Fiorentino, G.; Corcelli, F.; Ulgiati, S.; Dumontet, S.; Güsewell, J.; Eltrop, L. A Life Cycle Assessment of Biomethane Production from Waste Feedstock through Different Upgrading Technologies. Energies 2019, 12, 718. [Google Scholar] [CrossRef]
  49. Da Conceicao, M.; Nemetz, L.; Rivero, J.; Hornbostel, K.; Lipscomb, G. Gas Separation Membrane Module Modeling: A Comprehensive Review. Membranes 2023, 13, 639. [Google Scholar] [CrossRef]
  50. Merkel, T.C.; Lin, H.; Wei, X.; Baker, R. Power Plant Post-Combustion Carbon Dioxide Capture: An Opportunity for Membranes. J. Membr. Sci. 2010, 359, 126–139. [Google Scholar] [CrossRef]
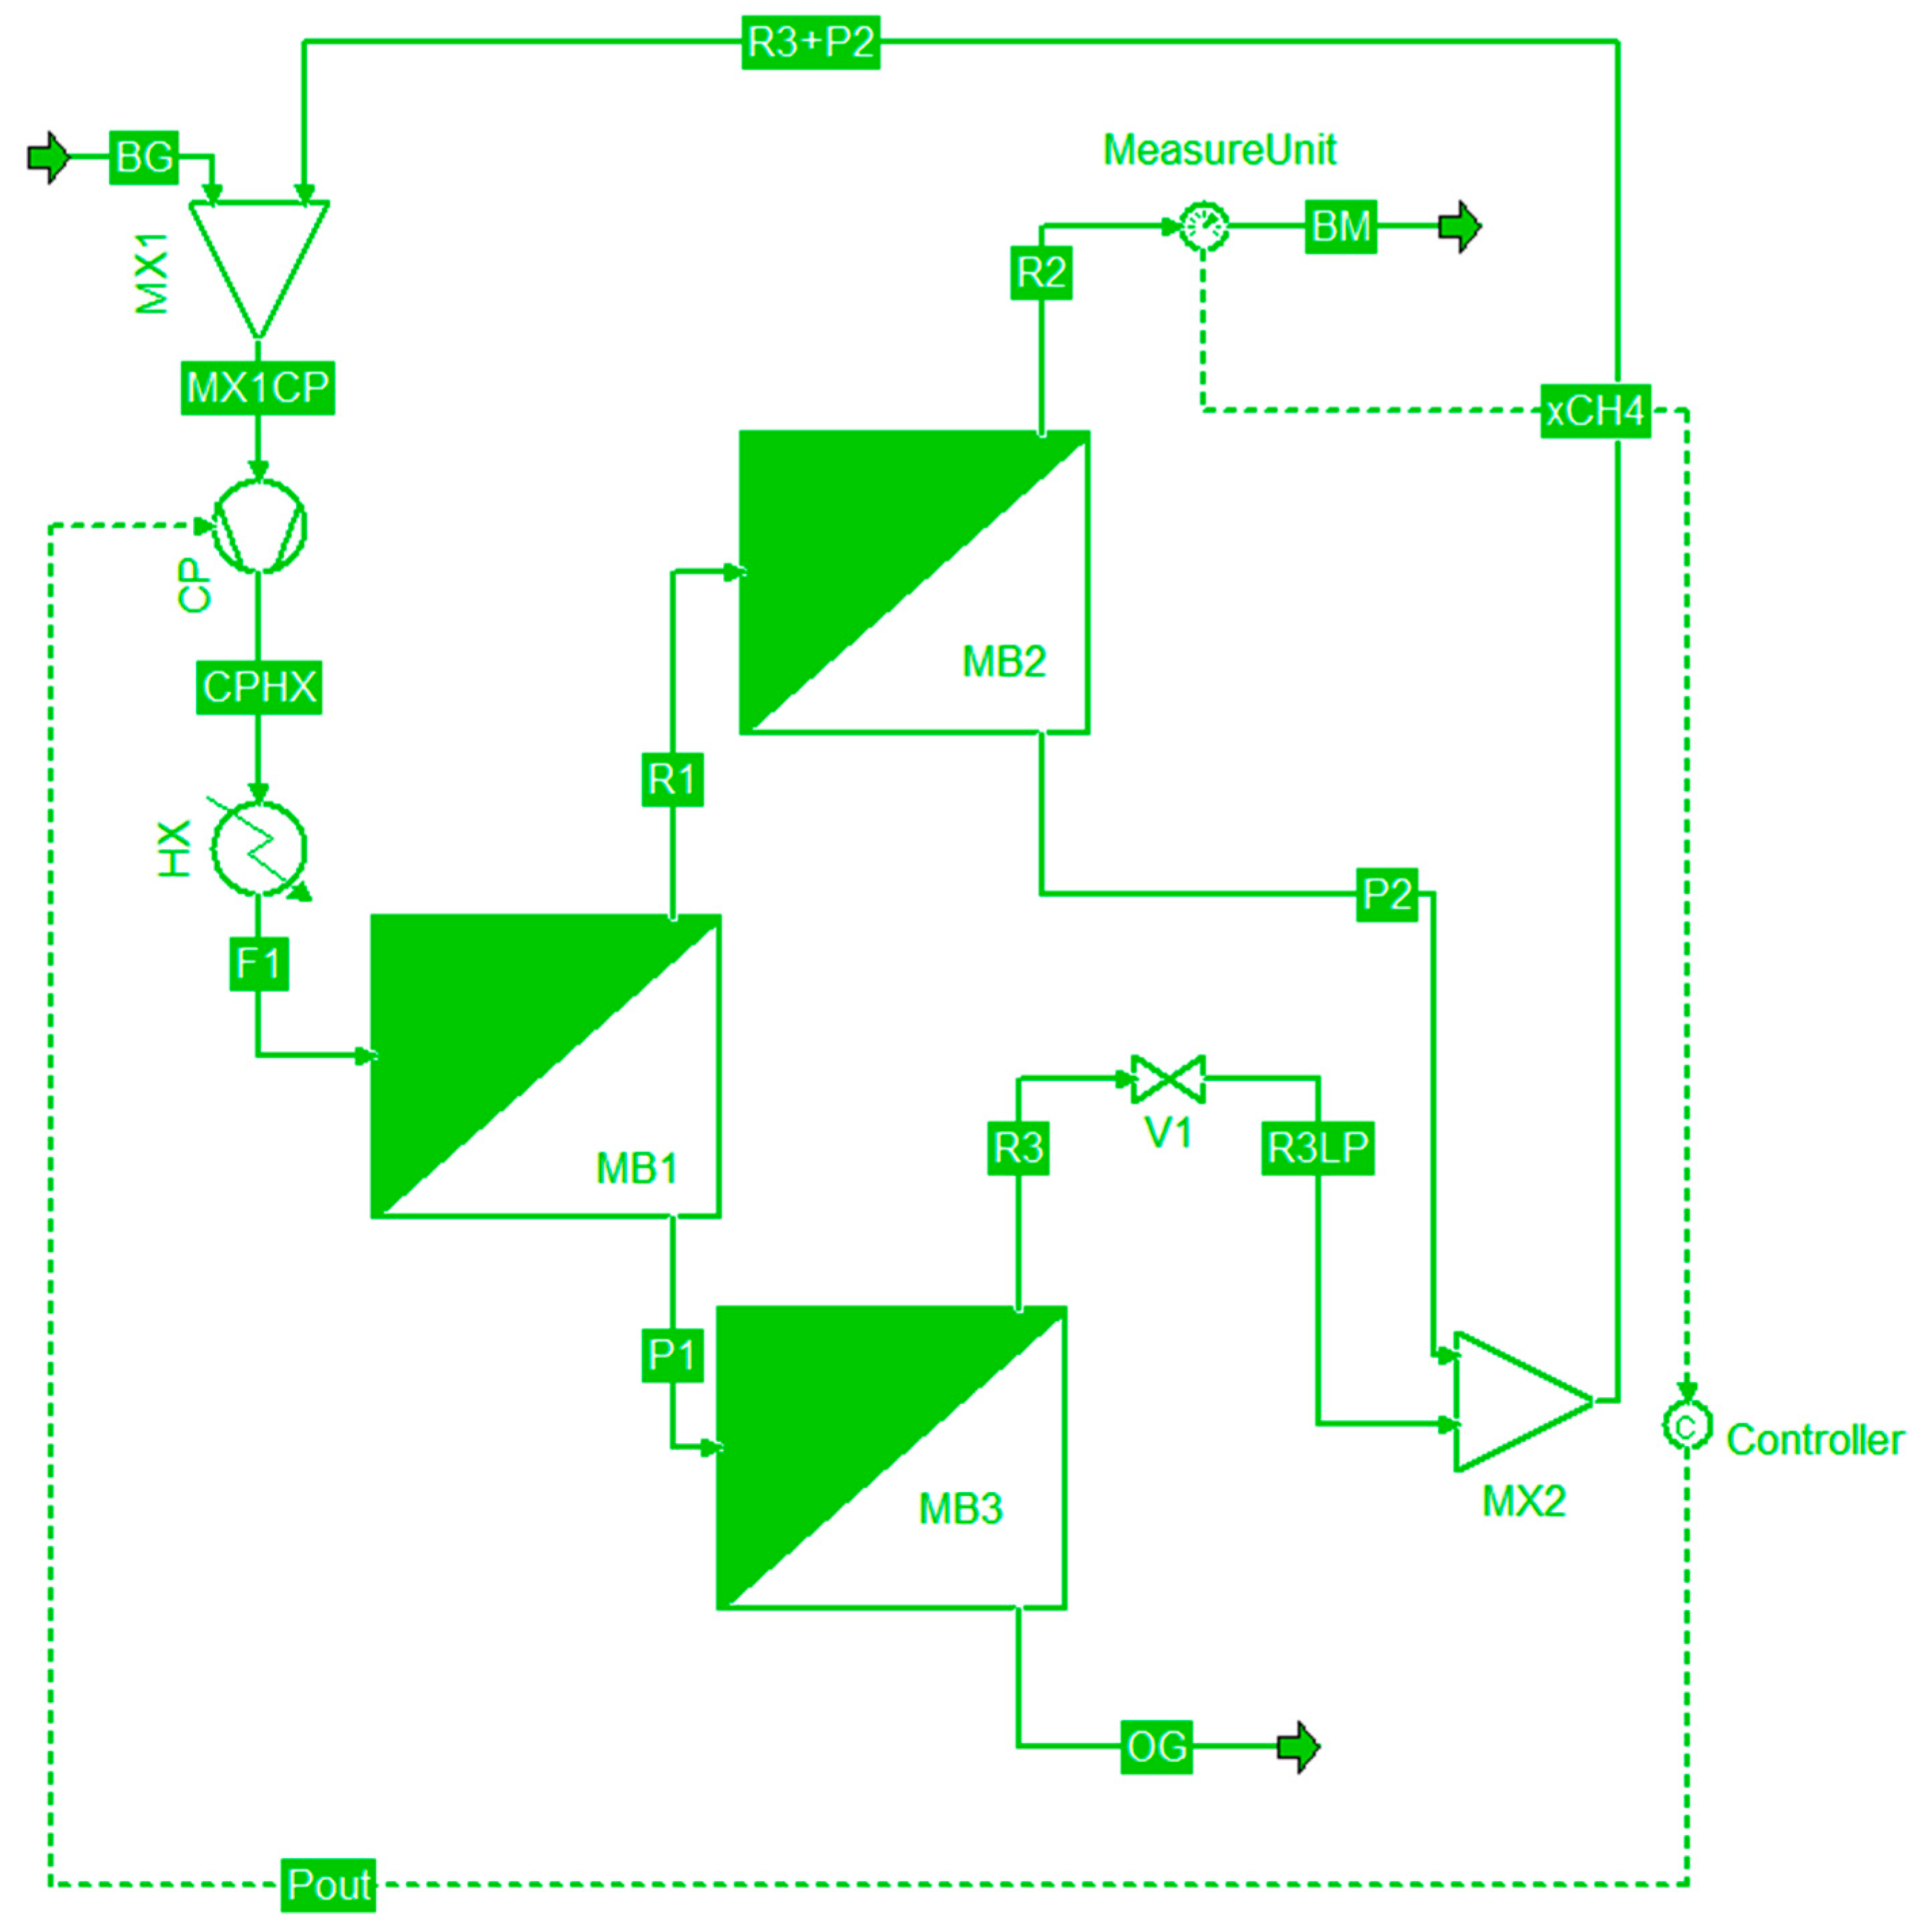
Figure 1. Flowsheet of the process created in the CAPE-OPEN Flowsheet Environment (COFE) of the COCO simulator.
Chemengineering 09 00094 g001
Figure 2. COFE flowsheet including information streams for parameter perturbation.
Chemengineering 09 00094 g002
Figure 3. Workflow diagram for sensitivity analysis using COCO simulator, MATLAB, and R environment.
Chemengineering 09 00094 g003
Figure 4. Morris design with optimized trajectories obtained in R. The small circles denote the sampled design points (combinations of factor levels normalized between 0 and 1).
Chemengineering 09 00094 g004
Figure 5. Morris results of the normalized flow of the biomethane product (FBM) for the non-controlled and controlled scenarios at two levels of feed variability (FV).
Chemengineering 09 00094 g005
Figure 6. Morris results of the normalized flow of the off-gas stream (FOG) for the non-controlled and controlled scenarios at two levels of feed variability (FV).
Chemengineering 09 00094 g006
Figure 7. Morris results of CH4 composition of the biomethane product (xCH4BM) for the non-controlled scenario at two feed variability (FV) levels.
Chemengineering 09 00094 g007
Figure 8. Morris results of the CO2 composition of the off-gas (xCO2OG) stream for the non-controlled and controlled scenarios at two levels of feed variability (FV).
Chemengineering 09 00094 g008
Figure 9. Morris results of the energy demand of the compressor (EDC) for the non-controlled and controlled scenarios at two levels of feed variability (FV).
Chemengineering 09 00094 g009
Figure 10. Morris analysis results for the ratio of the energy demand of the compressor to biogas flow (EDC/FBG) for the non-controlled and controlled scenarios at two feed variability (FV) levels.
Chemengineering 09 00094 g010
Table 1. References values for case study [24].
Parameter DescriptionNominal Value
Feed flow6692 mol/h
Mole fraction of CH4 in the feed0.6
Mole fraction of CO2 in the feed0.4
CO2/CH4 selectivity60
CO2 permeance60 GPU
Retentate pressure (stage 2)16.0 bar
Permeate pressure (stage 1)3.3 bar
Permeate pressure (stages 2 and 3)1.0 bar
Area stage 1167 m2
Area stage 2164 m2
Area stage 3254 m2
Table 2. Uncertainty factors considered in this study.
ParameterDescriptionReference ValueVariation
FBGFlow of biogas6692 mol/h±5%, ±10% of reference
xCO2BGCO2 molar fraction of biogas 40%±5%, ±10%
PCO2CO2 membrane permeance60 GPU±10%
SCO2/CO4 selectivityEquation (1) applied to 60±5%
Table 3. Response variables studied.
Response VariableDefinition
FBMMolar flow of the upgraded biomethane (retentate of unit MB2)
xCH4BMCH4 fraction of the upgraded biomethane
FOGMolar flow of the off-gas stream (permeate of unit MB3)
xCO2GCO2 fraction of the off-gas stream
EDCEnergy demand of compressor CP
HDXHeat duty of heat exchanger HX
Table 4. Response values for the two operating scenarios and the reference values of the case study.
ResponseNon-Controlled ScenarioControlled Scenario
FBM4163 mol/h4154 mol/h
FOG2529 mol/h2538 mol/h
xCH4BM0.95790.9600
xCO4OG0.98900.9891
EDC29.95 kW30.12 kW
HDX−29.78 kW−29.97 kW
EDC/FBG16.11 kJ/mol16.21 kJ/mol
HDX/FBG−16.02 kJ/mol−16.12 kJ/mol
Table 5. Sobol’ indices by factor for each response under the controlled (C) and non-controlled (NC) scenarios. Si-5 and Si-10 denote the first-order Sobol’ indices at feed variabilities of FV = 5% and FV = 10%, respectively. ST-5 and ST-10 denote total Sobol’ indices at feed variabilities of FV = 5% and FV = 10%, respectively.
ResponseFactorSobol’ Indices (Scenario NC) Sobol’ Indices (Scenario C)
Si-5ST-5Si-10ST-10Si-5ST-5Si-10ST-10
FBMFBG0.7000.7000.7110.7120.7030.7030.7030.704
xCO2BG0.2780.2790.2820.2840.2960.2960.2960.297
PCO20.0210.0210.0050.0060.0010.0010.0000.000
S0.0000.0000.0000.0000.0000.0000.0000.000
FOGFBG0.3480.3480.3590.3620.4460.4470.4460.448
xCO2BG0.6050.6060.6260.6280.5510.5520.5510.553
PCO20.0460.0460.0120.0120.0020.0020.0010.001
S0.0000.0000.0000.0000.0000.0000.0000.000
xCH4BMFBG0.1750.1760.4370.440
xCO2BG0.0240.0240.0590.059
PCO20.7950.7970.4980.501
S0.0050.0050.0030.003
xCO2OGFBG0.1200.1210.2410.2430.1300.1310.2770.280
xCO2BG0.2080.2090.4200.4220.1610.1620.3430.346
PCO20.6470.6490.3230.3270.6860.6880.3640.368
S0.0230.0230.0110.0120.0210.0210.0110.012
EDCFBG0.9930.9940.9980.9980.9020.9030.9700.971
xCO2BG0.0000.0000.0000.0000.0020.0030.0020.002
PCO20.0000.0000.0000.0000.0930.0930.0260.027
S0.0060.0060.0020.0020.0020.0020.0000.000
HDXFBG0.9930.9930.9980.9980.8910.8910.9670.968
xCO2BG0.0000.0000.0000.0010.0020.0020.0020.002
PCO20.0000.0010.0000.0000.1050.1060.0300.031
S0.0060.0060.0020.0020.0020.0020.0000.000
Table 6. Properties of the probability distribution of the response variables for the controlled (C) and non-controlled (NC) scenarios at two levels of feed variability (FV). LTL and UTL, respectively, are the lower and upper tolerance limits of the interval that covers 95% probability content.
ResponseUnitsSc.FVMeanLTLUTLRLG 1RUG 2CV 3
FBMmol/hNC±5%4161382945027.98%8.19%3.75%
NC±10%41593510481215.61%15.70%7.45%
C±5%4151383744387.57%6.93%3.50%
C±10%41483532473114.86%14.06%7.01%
FOGmol/hNC±5%2525230527538.72%9.03%4.20%
NC±10%25212116297416.05%17.98%8.25%
C±5%2535232527618.30%8.91%4.21%
C±10%25322119299116.28%18.14%8.41%
xCH4BMNC±5%0.9580.9470.9661.17%0.84%0.45%
NC±10%0.9580.9430.9681.58%1.11%0.59%
xCO2OGNC±5%0.9890.9850.9930.41%0.41%0.19%
NC±10%0.9890.9820.9940.64%0.58%0.27%
C±5%0.9890.9850.9930.45%0.44%0.20%
C±10%0.9890.9820.9950.67%0.60%0.29%
EDCkWNC±5%29.9428.3931.475.19%5.12%3.04%
NC±10%29.9226.9132.9710.09%10.16%6.08%
C±5%30.1228.1532.456.54%7.72%3.70%
C±10%30.1126.6334.2711.57%13.80%7.22%
HDXkWNC±5%29.7728.2231.305.21%5.14%3.05%
NC±10%29.7626.7432.8010.13%10.24%6.10%
C±5%29.9727.9532.356.72%7.94%3.77%
C±10%29.9626.4234.1811.82%14.09%7.33%
EDC/FBGkJ/molNC±5%16.1216.0316.210.56%0.53%0.27%
NC±10%16.1316.0016.260.78%0.85%0.35%
C±5%16.2215.8416.692.33%2.89%1.23%
C±10%16.2215.6516.883.49%4.06%1.70%
HDX/FBGkJ/molNC±5%16.0315.9416.120.55%0.57%0.28%
NC±10%16.0415.9116.190.76%0.96%0.37%
C±5%16.1315.7316.632.49%3.10%1.32%
C±10%16.1315.5416.833.70%4.33%1.82%
1 Relative lower-bound gap = (mean − LTL)/mean. 2 Relative upper-bound gap = (UTL − mean)/mean. 3 Coefficient of variation = standard deviation/mean.
Disclaimer/Publisher’s Note: The statements, opinions and data contained in all publications are solely those of the individual author(s) and contributor(s) and not of MDPI and/or the editor(s). MDPI and/or the editor(s) disclaim responsibility for any injury to people or property resulting from any ideas, methods, instructions or products referred to in the content.